
Global stock market strength flashes an important signal

Key points
- The percentage of major country equity indexes with a rising 200-day moving average is a useful gauge of global stock market strength
- This indicator recently crossed a significant threshold
- The history of this indicator suggests the potential for favorable market performance in the year ahead
A simple measure of global stock market strength
The All Country % Rising 200 Day indicator shows the percentage of major country equity indexes (currently numbering more than 20) that have a rising 200-day moving average. In the simplest terms possible, a rising 200-day moving average is used as the definition of an uptrend, and a declining 200-day moving average is used as the definition of a downtrend.
The chart below displays the indicator on the bottom, with the MSCI All-World Index on the top.
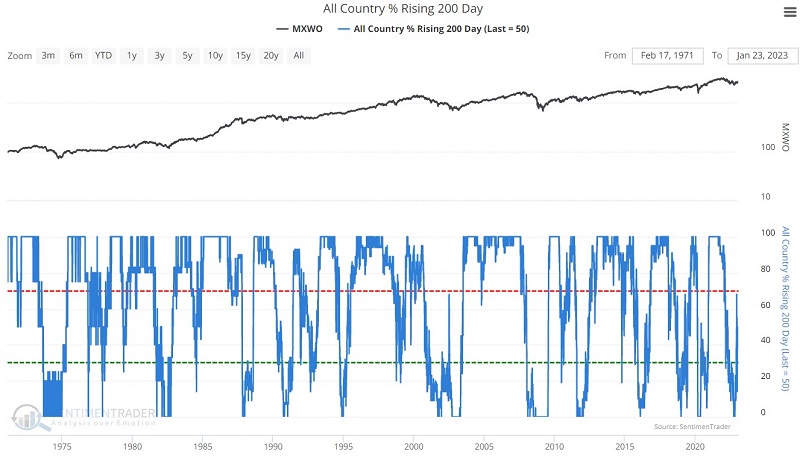
The indicator ranges from 0 to 100. If the 200-day MA for all country indexes is declining, the indicator reads 0. If the 200-day MA for all country indexes is rising, the indicator reads 100.
Now let's look at one possible way to use this indicator to identify potentially good buying opportunities.
A rising trend off of a low
It is no surprise that the indicator rises as global stock prices rise and falls as global stock prices decline. Some traders will try to use this indicator as a trend-following tool, while others will attempt some overbought/oversold approach. The method detailed below is slightly different and purposely limited in scope. The sole purpose of the technique described below is to use the All Country % Rising 200-Day indicator as bullish confirmation of a potential new bull market.
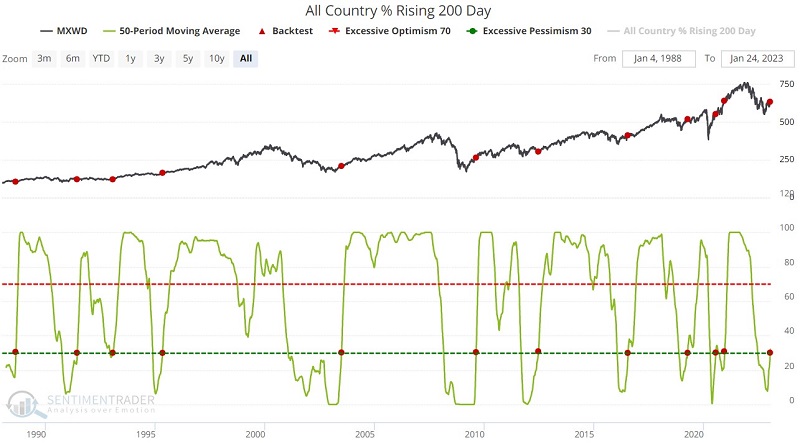
The technique we will use involves identifying those times when the 50-day moving average of the indicator value itself crosses above 30. In other words, we first need the 50-day average to drop below 30 (which will typically occur during a meaningful market decline). Rather than attempting to pick a bottom, we will wait for the market to tell us when the worst is (or perhaps more accurately, may be) over by rising above 30. Note that there is nothing magic about 30 as a parameter value, and traders are free to test other cutoff values and moving average lengths.
A look at historical performance
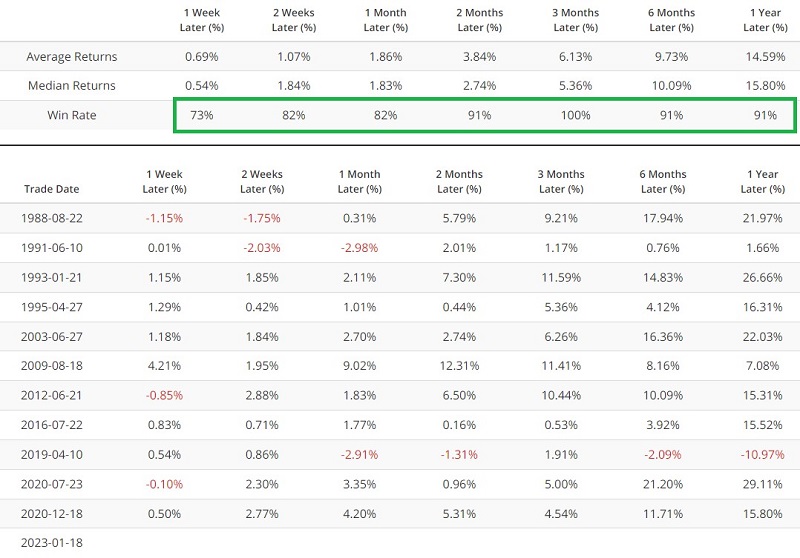
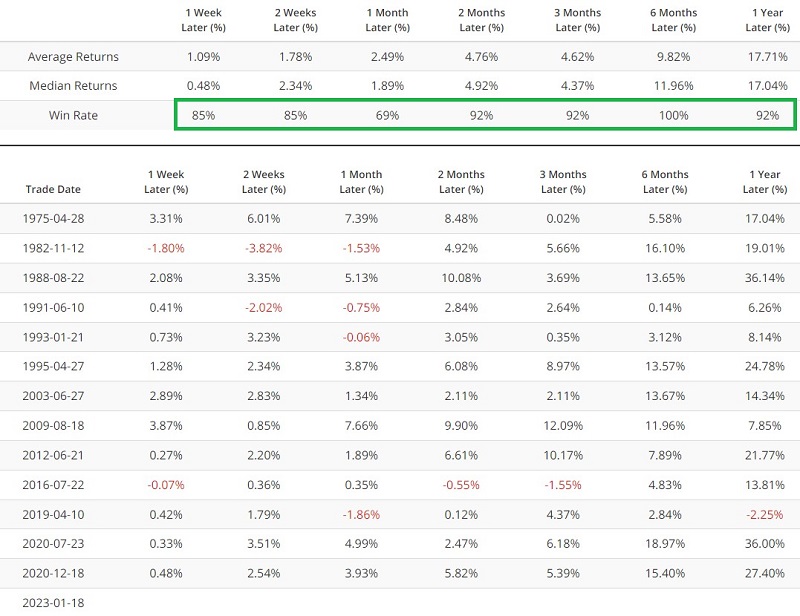
The chart and table below display the signals and results using the MSCI ACWI Index (MXWD), which includes both developed and emerging markets starting in January 1988.
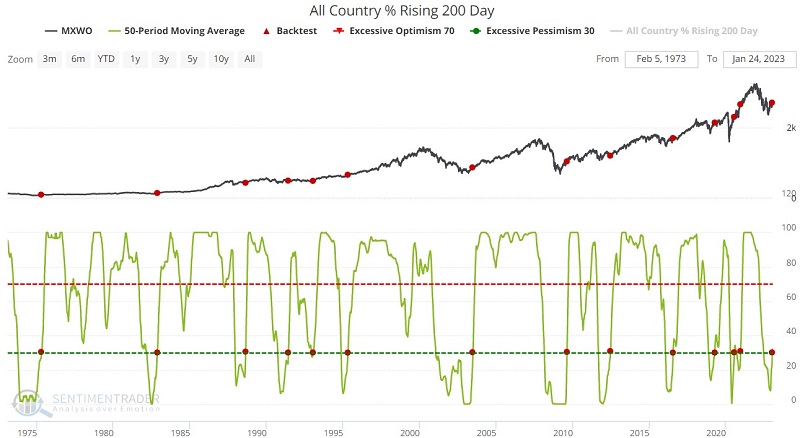
Now let's look only at developed markets using the MSCI World Index (MXWO). This database goes back to 1973.
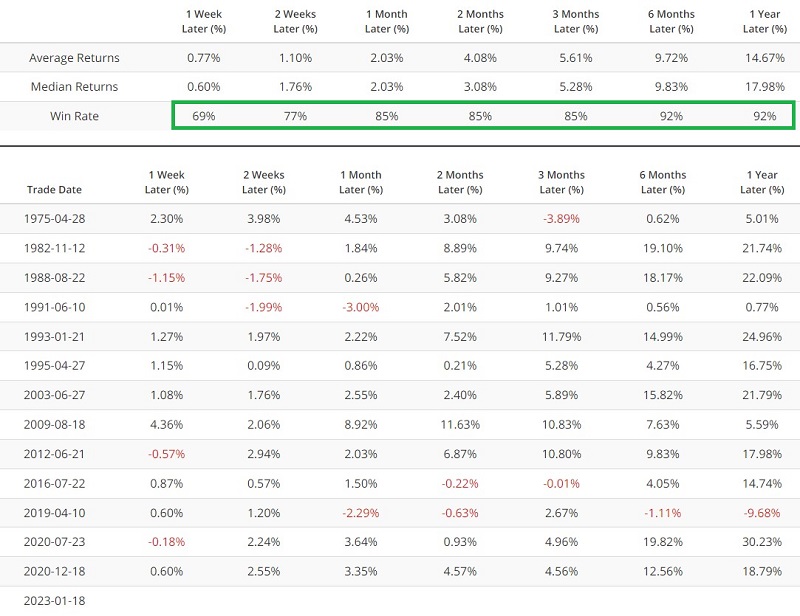
Finally, let's look only at US stock market results using the S&P 500 Index, starting in 1973.

The latest action
As seen in the tests above, a new potentially bullish confirmation signal occurred on 2023-01-18. If history proves an accurate guide, then stocks should be expected to perform well over the next twelve months.
What the research tells us…
Not every indicator is meant to be used as a standalone trading system - consistently generating market-beating buy and sell signals. Some indicators are best used to convey specific information. The All Country % Rising 200 Day indicator may have uses beyond what was covered here. But if nothing else, it has shown a propensity to be quite helpful in identifying periods when the worst of a bear market is over and when the odds may be swinging back to the bullish side of the argument.
NOTE: For another similar indication, see this Public article regarding an indicator I have highlighted several times previously on Twitter.