
Nasdaq breadth indicator flashes an important signal

Key points
- Our NASDAQ Hi/Lo Ratio Indicator just crossed a critical threshold
- In theory, the signal suggests that the worst is over for stocks
- Previous signals have typically been followed by powerful price action
An indicator that measures weakness - and reversals
The NASDAQ High/Low Ratio is extremely simple. Each day we divide the number of NASDAQ stocks making new 52-week highs by the number of NASDAQ stocks making new 52-week lows. We take a 100-day moving average of the daily readings to smooth out the results.
The chart below displays the Nasdaq 100 Index at the top and the NASDAQ High/Low Ratio 100-day moving average at the bottom.
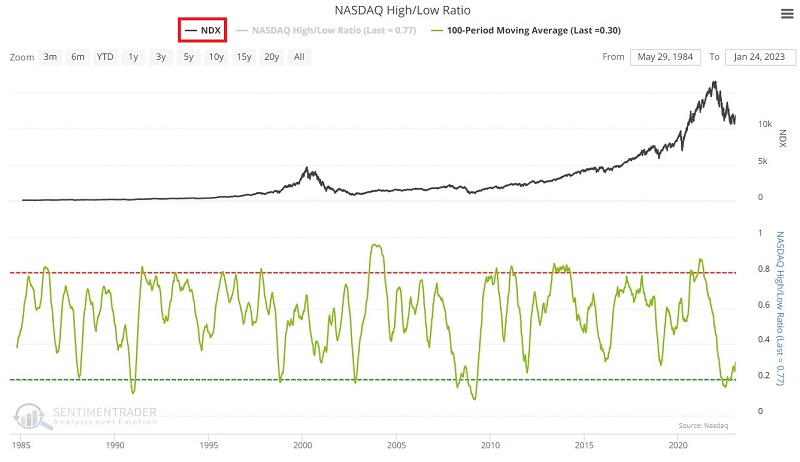
Indicator action is pretty straightforward. As the market declines or experiences weakness, the indicator declines and vice versa. Some traders may attempt to use this indicator in a trend-following manner. Others may try some overbought/oversold approach.
The method detailed below is slightly different and purposely limited in scope. The sole purpose of the technique described below is to use the NASDAQ High/Low Ratio indicator to confirm a potential new bull market.
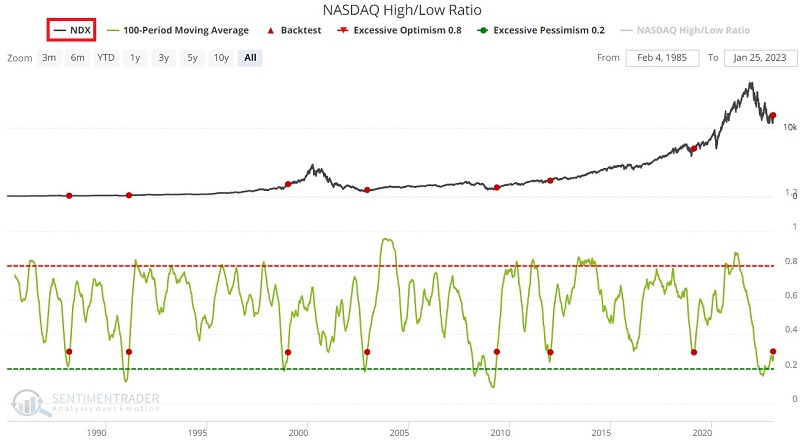
The technique we will use involves identifying when the 100-day moving average of the indicator value itself crosses over 0.29. In other words, we first need the 10-day average to drop below 0.29 (which will typically occur during a meaningful market decline). Rather than attempting to pick a bottom, we will simply wait for the market to tell us when the worst is (or perhaps more accurately, may be) over by rising above the 0.29 level. Note that there is nothing magic about 0.29 as a parameter value, and Sentimentrader subscribers are free to test other cutoff values and moving average lengths.
A look at historical performance
The chart and table below display the signals and results using the Nasdaq 100 Index starting in 1988.
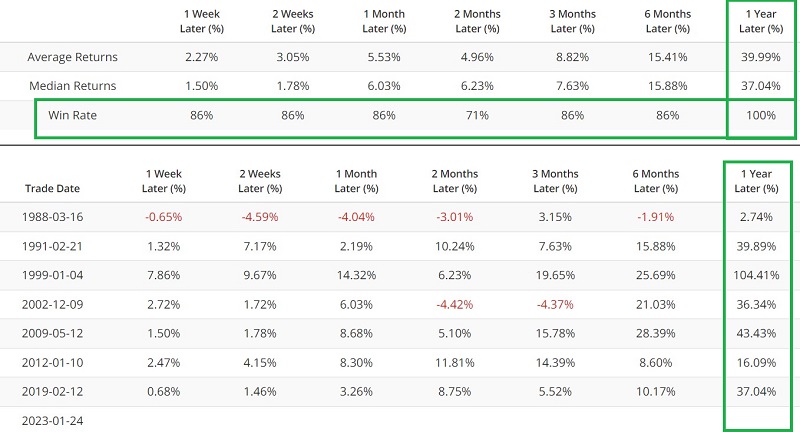
The table below displays the performance of the Nasdaq Composite Index (COMPQ), the S&P 500 Index (SPX), and the Nasdaq 100 Index (NDX) following previous signals.
How bad does it get?
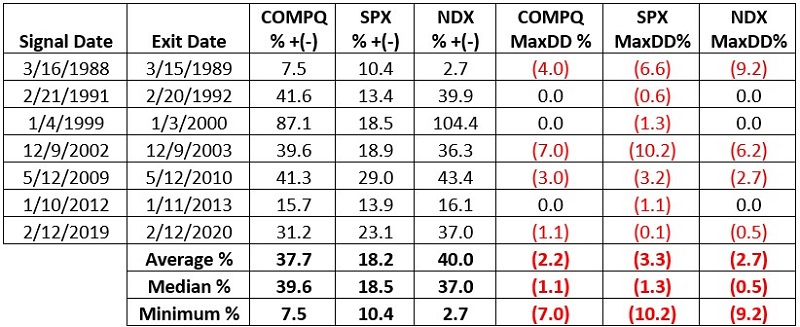
Signals that show gains are all well and good. But in real-world trading, the real question is not "how much did it make" but rather "how bad did it get?" In other words, how much of a drawdown did a trader have to ride out to generate a given return? The three right-hand columns in the table above display the maximum percentage drawdown for each index during the twelve months following each signal.
The worst drawdown suffered was a -10.2% for the S&P 500 Index following the 12/9/2002 signal. The Nasdaq 100 Index experienced a -9.2% drawdown following the 3/16/1988 signal. Note that on three occasions, the Nasdaq 100 Index and the Nasdaq Composite Index moved higher from the day of the signal and experienced no drawdown.
The latest action
A new potentially bullish confirmation signal occurred on 1/24/2023. If history proves an accurate guide, then stocks should be expected to perform well over the next twelve months.
What the research tells us…
Not every indicator is meant to be used as a standalone trading system - consistently generating market-beating buy and sell signals. Some indicators are best used to convey specific information. The NASDAQ High/Low Ratio indicator may have uses beyond what was covered here. But if nothing else, it has shown a propensity to be quite valuable in identifying periods when the worst of a bear market is over and when the odds may be swinging back to the bullish side of the argument.