
Energy investors are showing the opposite of panic

Key points:
- A composite of a handful of breadth metrics for the Energy sector is showing the opposite of panic
- The indicators have been low for weeks and are among the most extreme 5% of readings in 30 years
- Similar cycles from moderate panic to the opposite have mostly preceded gains for the sector
Breadth measures for Energy stocks are in "reverse panic" mode
Energy stocks have been on a tear the last couple of weeks and briefly enjoyed a push to new highs on Tuesday before an afternoon reversal. Still, breadth within the sector has been excellent. For the first time since November, more than 95% of the stocks are above their 200-day moving averages, and between 95% and 100% of them have been above their 50-day averages every day since late July.
Multiple times over the years, we've looked at a Panic Breadth composite that looks at selling pressure within sectors or indexes. It combines a handful of measures that look at the breadth of devastation among individual stocks.
We can do the same calculation and just reverse the implication for a sector that's been doing well. This "reverse panic breadth" composite has been hanging at a very low level for energy stocks for weeks. The 30-day average of this measure has dropped below 5.75%, in the bottom 5% of readings over the past 30 years.

A total return version of a stock or index includes dividends in the calculation, so it tends to show consistently positive returns across most time frames. Even so, when the reverse panic breadth calculation was this low for Energy stocks, the S&P 500 Energy Total Return index showed an annualized return of -11.8%. When it was above 33%, which it was in June, the sector's annualized return was an impressive +29.0%.
Cycles in "reverse panic" have usually preceded more gains
The table below takes a signal-based approach, looking at other times when the reverse panic breadth cycled from above 33% to below 5.75%, no matter how long it took to complete that cycle. Even though this is a total return index, short-term returns were poor over the next one to two weeks. There was really only one signal, at the end of 2010, when it took off and just kept climbing for months.
Even with some short-term weakness, the index still showed a gain every time but once over the next six months, and the sole loss was small.

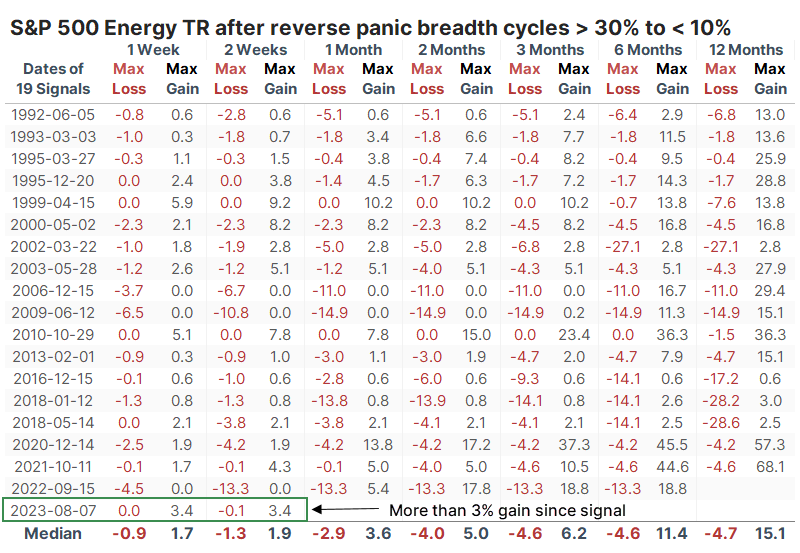
We can generate a larger sample size if we relax the parameters slightly. We add 11 signals if we reduce the upper extreme to 30% and the lower to 10%. The table below shows the maximum gains and losses across time frames after these signals.
Note that the current signal was first triggered on August 7. Since then, the Energy Total Return index rallied more than 3% within the first two weeks. That's one of the best initial reactions to these signals since 1990.
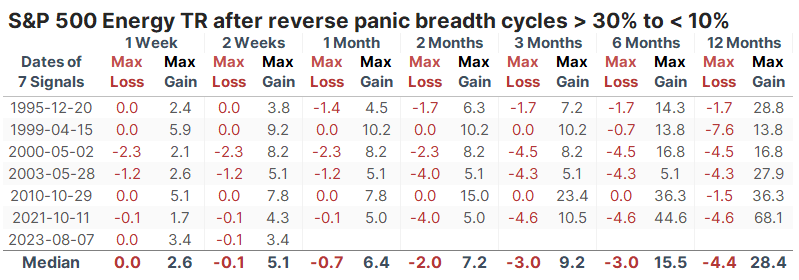
The table below filters the signals to only show those that had the best reactions; the sector had to rally at least 3% at some point within the first two weeks. That's the only filter.
It made a difference in the long-term returns and risk versus reward. It was rare to see the sector show any losses even months later, and it enjoyed double-digit gains a year later every time but once.

The table of maximum gains and losses for these signals shows very little of the latter up to six months later. None showed a loss of more than -5%, while all showed a gain of more than +5% at some point. Granted, they all had a head start due to the first couple of weeks, but it's instructive to see that none of them suffered immediate, large, and/or sustained declines for months afterward.
What the research tells us...
Trends in Energy stocks have been improving for a while. Dean noted a couple of weeks ago how long-term trends within the sector had improved substantially, which also had bullish implications. The improvement is evident across a handful of other measures, and it has been sustained enough that a moving average of them is among the most extreme readings in more than 30 years. While that has historically preceded weak short-term returns as investors take a breath from all the buying activity, it has had positive implications for the months ahead.