
A bullish reversal in long-term uptrends for energy stocks

Key points:
- The percentage of S&P 500 Energy stocks above their 200-day average cycled from < 15% to > 90%
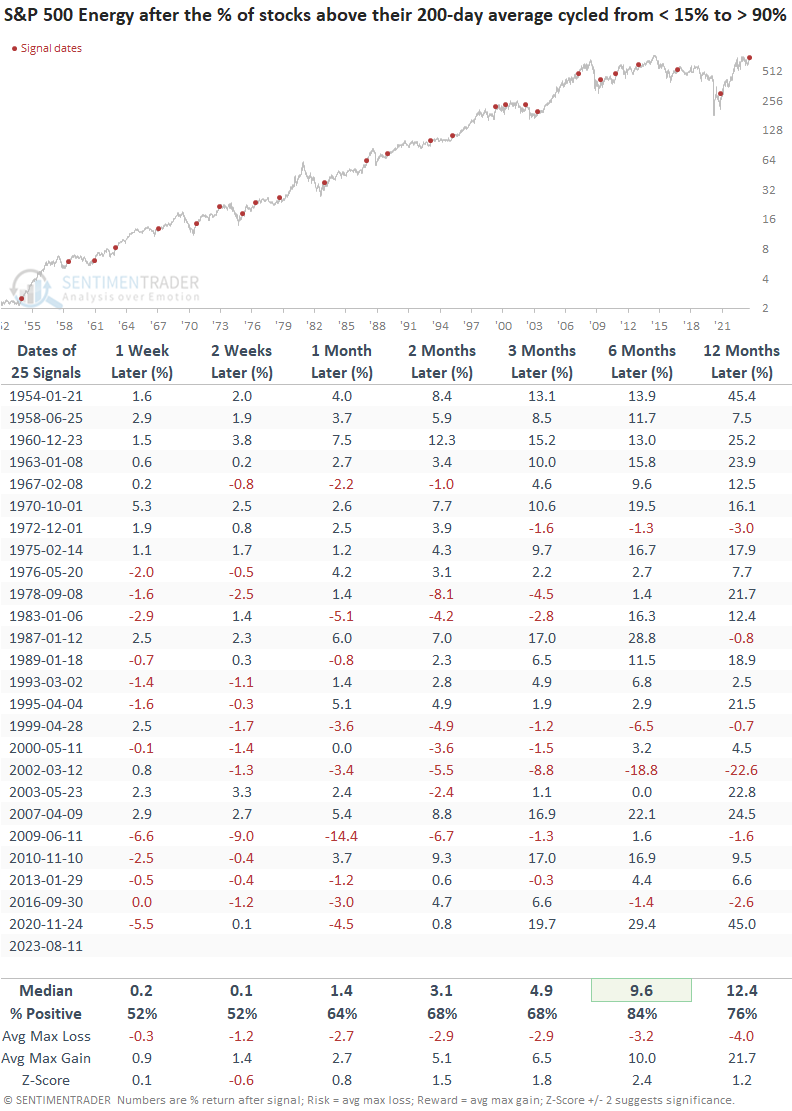
- Similar reversals in long-term price trends led to an 84% win rate over the subsequent six months
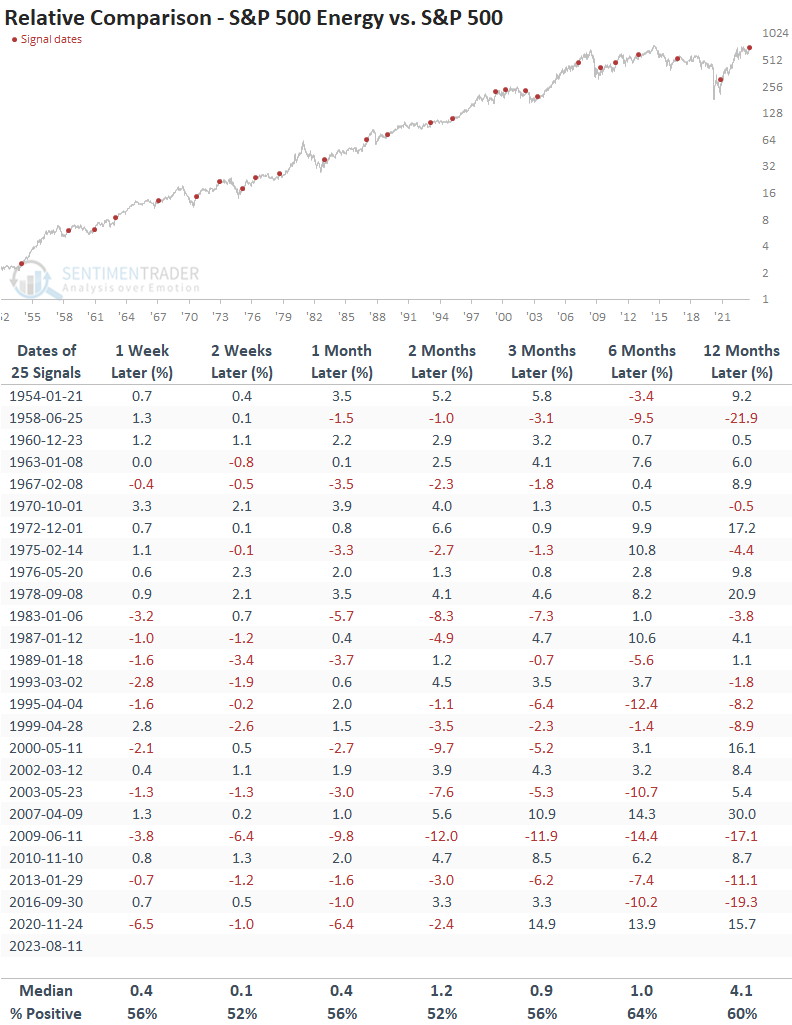
- From a relative comparison perspective, the energy sector tended to outperform the broad market
Energy stocks transition to long-term uptrends
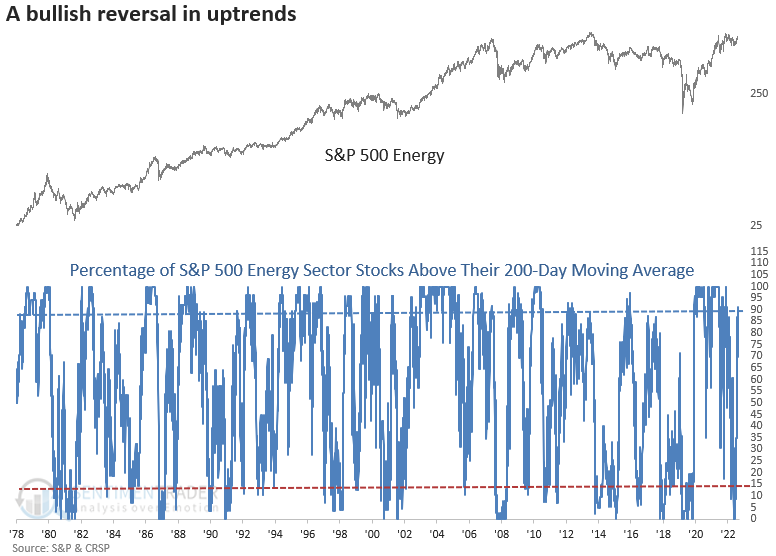
With crude oil rallying for six consecutive weeks, energy stocks responded accordingly. Until now, the energy sector has experienced an improvement in relative performance and market breadth measures from mostly short to medium-term duration indicators. My colleague, Jay Kaeppel, highlighted a few of these breadth-based measures yesterday.
The percentage of S&P 500 Energy sector stocks above their 200-day moving average cycled from less than 15% to greater than 90% for the 26th time since 1954 and the second time since the energy bull market began in 2020.
The weight of the evidence is starting to tilt in favor of the energy sector. A bearish-to-bullish long-term trend change in crude oil would bolster the case.
Similar reversals in stock uptrends preceded positive returns
When the percentage of energy sector stocks above their 200-day average cycles from less than 15% to greater than 90%, the S&P 500 energy sector rallies over the next six months 84% of the time. However, in the short run, some weakness could develop, with 14 out of the most recent 17 precedents registering a decline at some point within the first two weeks.
Over the next three months, the signal experienced only one max loss more significant than -10%. A year later, the max gain exceeded the max loss in 20 out of 25 cases.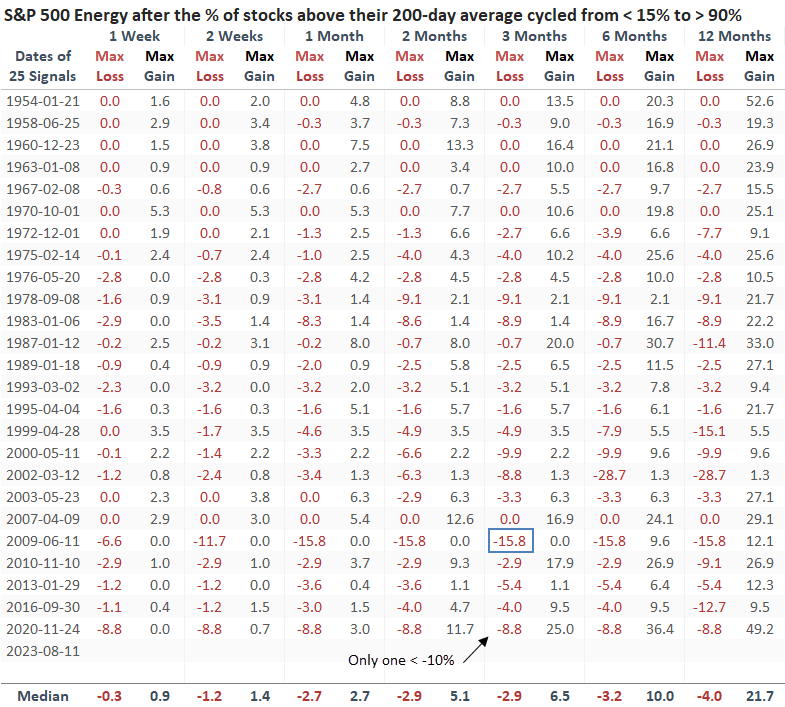
Suppose I can compare the S&P 500 energy sector returns to the S&P 500. In that case, energy outperforms the world's most benchmarked index across all time frames, although it wasn't overwhelming. Regarding consistency, energy held the upper hand, achieving 52% to 64% win rates.
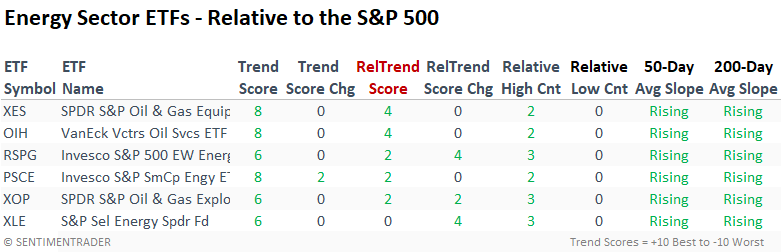
Absolute and relative trends
Energy sector ETF price trends have improved since late June, with trend scores for a composite model ranging from 6 to 8. However, from a comparative point of view, none of the ETFs have more than 40% of their relative ratio trend conditions in a bullish status.
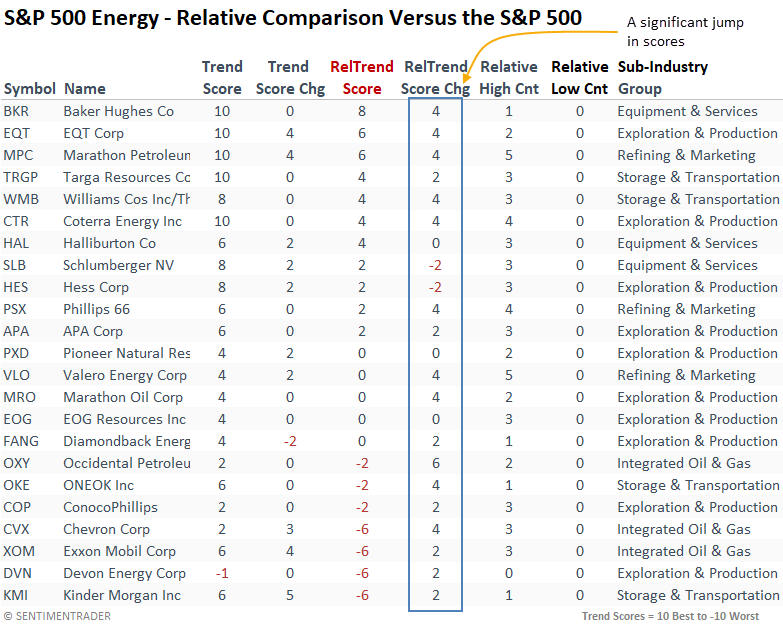
S&P 1500 Energy sector stocks by market capitalization
Over the previous week, many S&P 500 energy sector stocks witnessed a noticeable upswing in their relative trend scores. Particularly noteworthy, Marathon and Valero distinguished themselves by notching five consecutive one-month relative highs versus the S&P 500 in just one week.
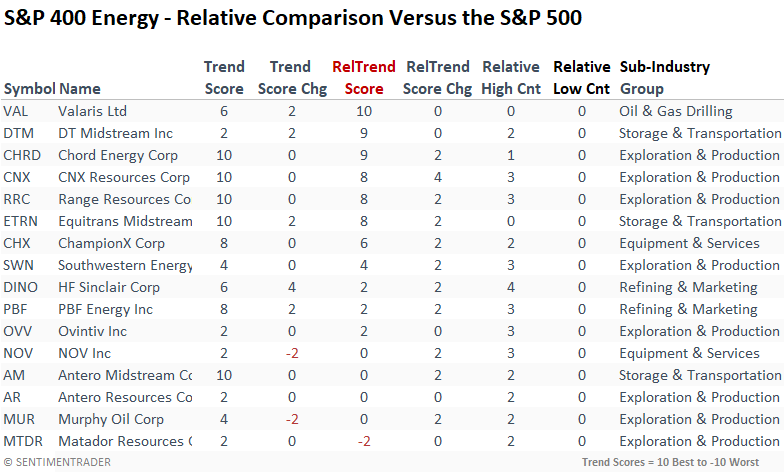
Stocks belonging to the S&P 400 Energy sector consistently exhibit higher rankings when compared to S&P 500 energy stocks, boasting an average relative trend score of four, in contrast to the S&P 500 energy companies' average score of less than one.
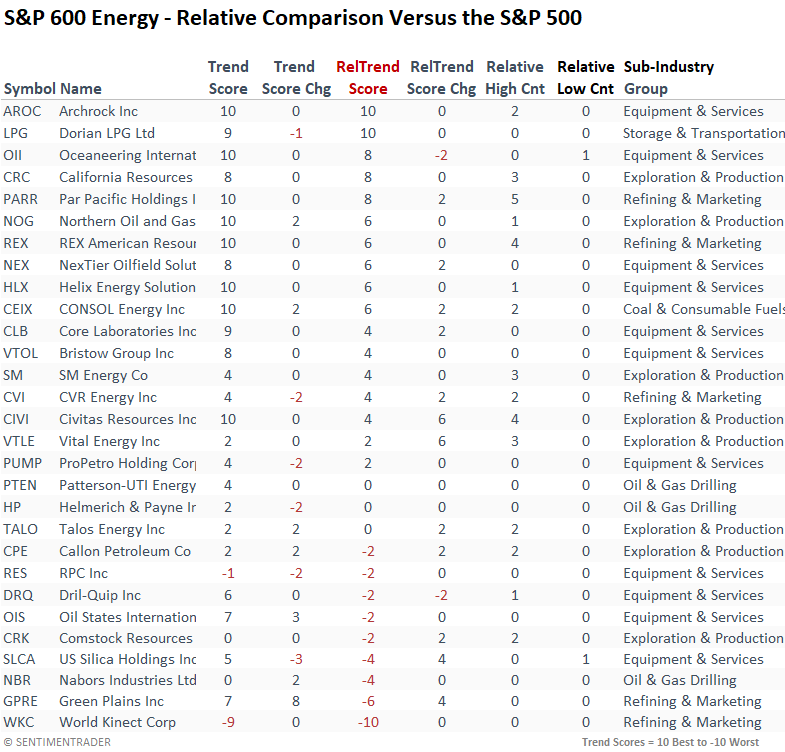
Stocks within the small-cap S&P 600 energy sector showed improvement in relative trend scores and an abundance of relative highs over the last week. Small-cap stocks boast an average trend score of two. So, it is better than large-cap but less than mid-cap.
What the research tells us...
With many energy stocks transitioning to long-term uptrends, the case for a potential resumption of the energy stock bull market that began in 2020 is gaining steam. A long-term trend change in crude oil would go a long way toward adding additional evidence to bolster the case. When the percentage of energy sector stocks above their 200-day moving average cycles from less than 15% to greater than 90%, the sector tends to pause for a few weeks. With the overall market in a consolidation/correction, keep an eye on the relative strength of energy stocks. It could be a pivotal clue if they hold up better than the broad market.