Headlines
|
|
Tech's back to back gains unlikely to repeat:
For one of the few times since 1926, a single sector (technology) has managed to not only be the best-performing out of all sectors, but with massive gains as well on consecutive years. The few other times that's happened, the sectors had a hard time holding gains in the following year(s).
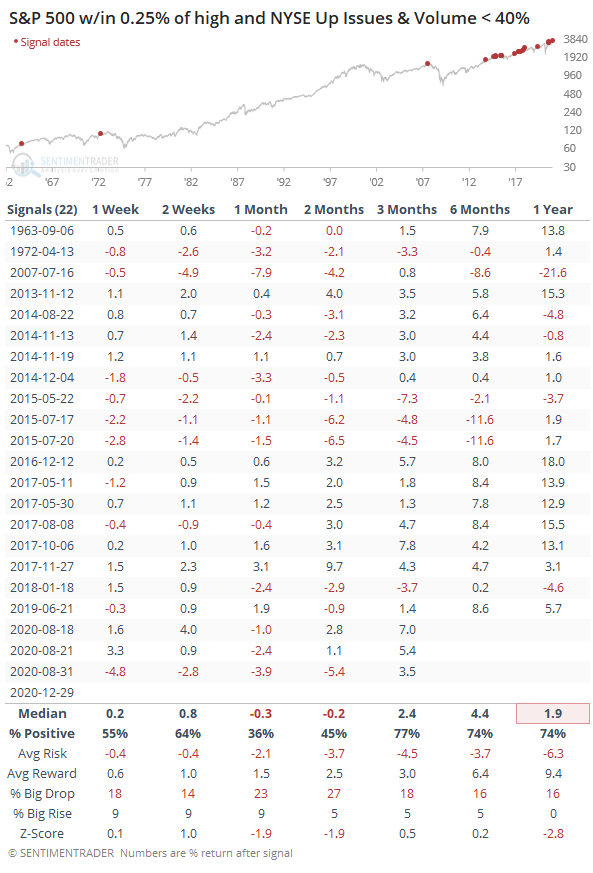
Year-end oddities: In January and February, we saw a big cluster of odd readings, mostly involving breadth. While the big indexes were hitting new highs, there was significant weakness under the surface, which preceded the pandemic-induced crash. Oddities surfaced again in mid-August, preceding a quick run-up then two months of chop and decline. Since then, internal participation has been pristine...until the last couple of weeks. Increasingly, we're seeing odd readings once again. Thanks in large part to weakness in small-cap stocks, breadth was horrible on Tuesday, with Up Issues and Up Volume both under 40%. That's rare for a day the S&P 500 was so close to a high, and not a great sign for the next 1-2 months.
Bottom Line:
- The market environment is pristine, but with near-historic optimism, gains tend to be muted, with a high probability of being reversed at some point over the ensuing weeks.
|
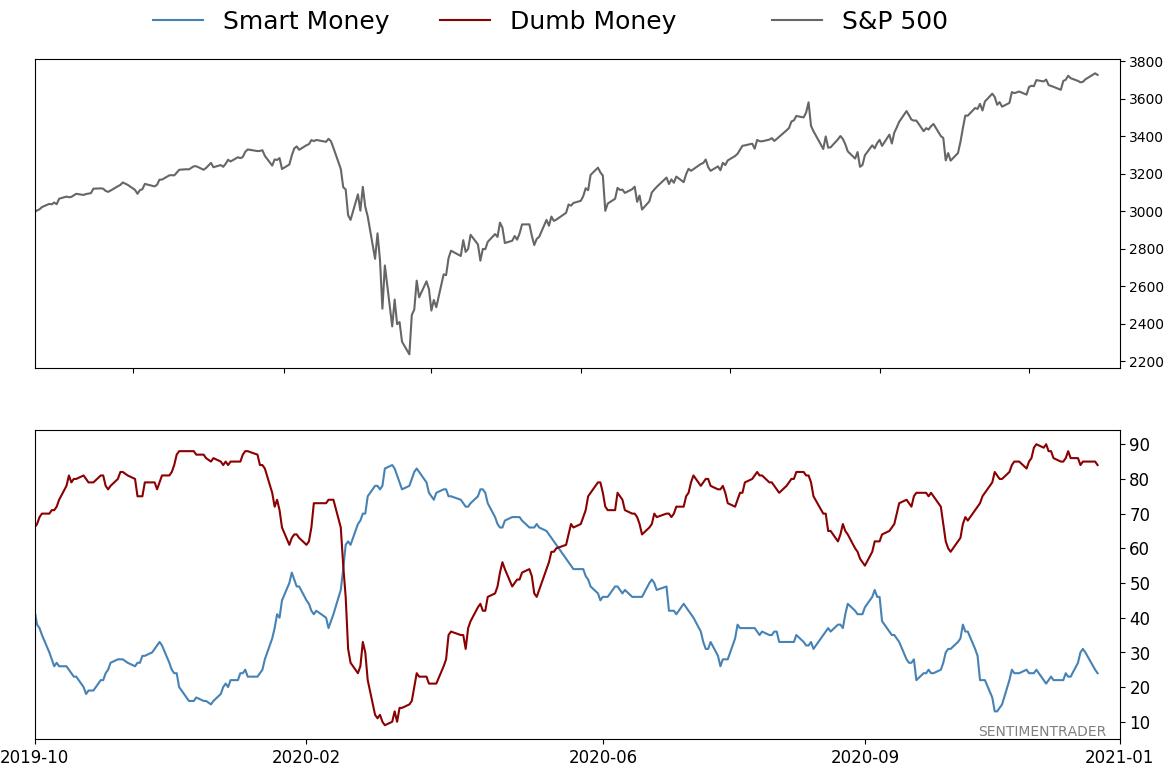
Smart / Dumb Money Confidence
|
Smart Money Confidence: 24%
Dumb Money Confidence: 84%
|
|
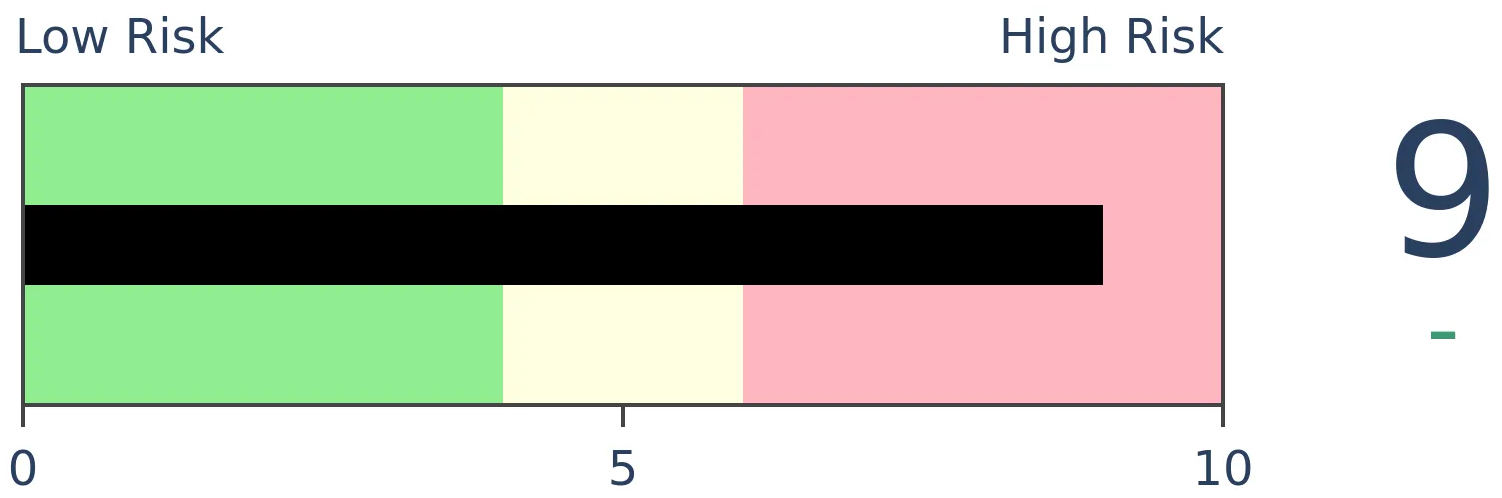
Risk Levels
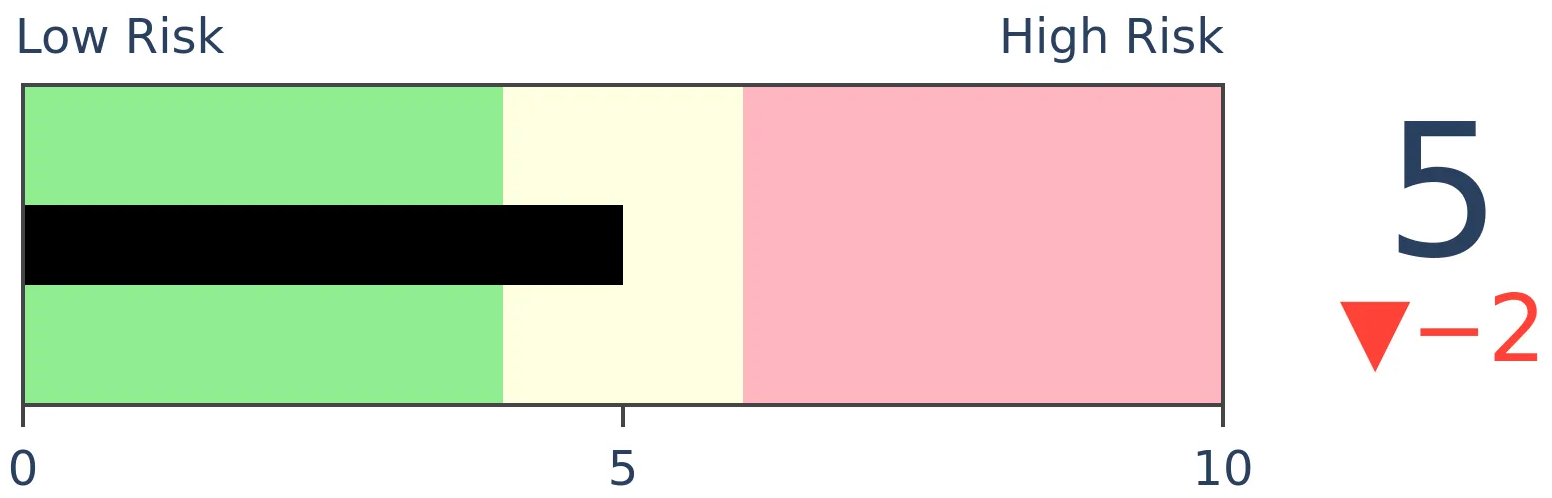
Stocks Short-Term
|
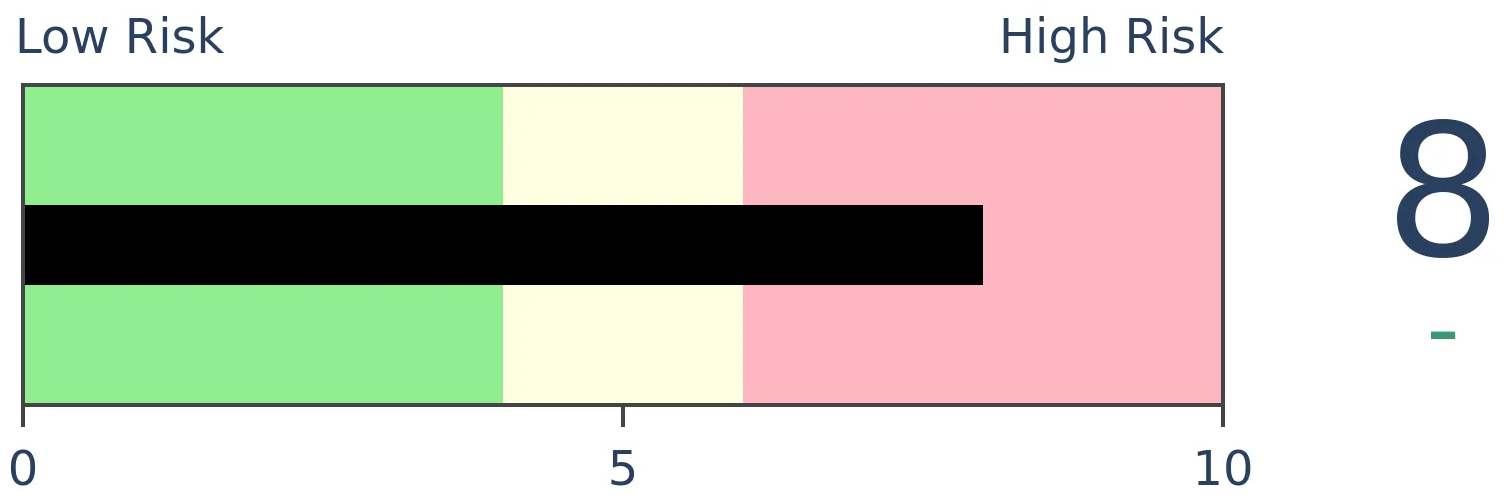
Stocks Medium-Term
|
|
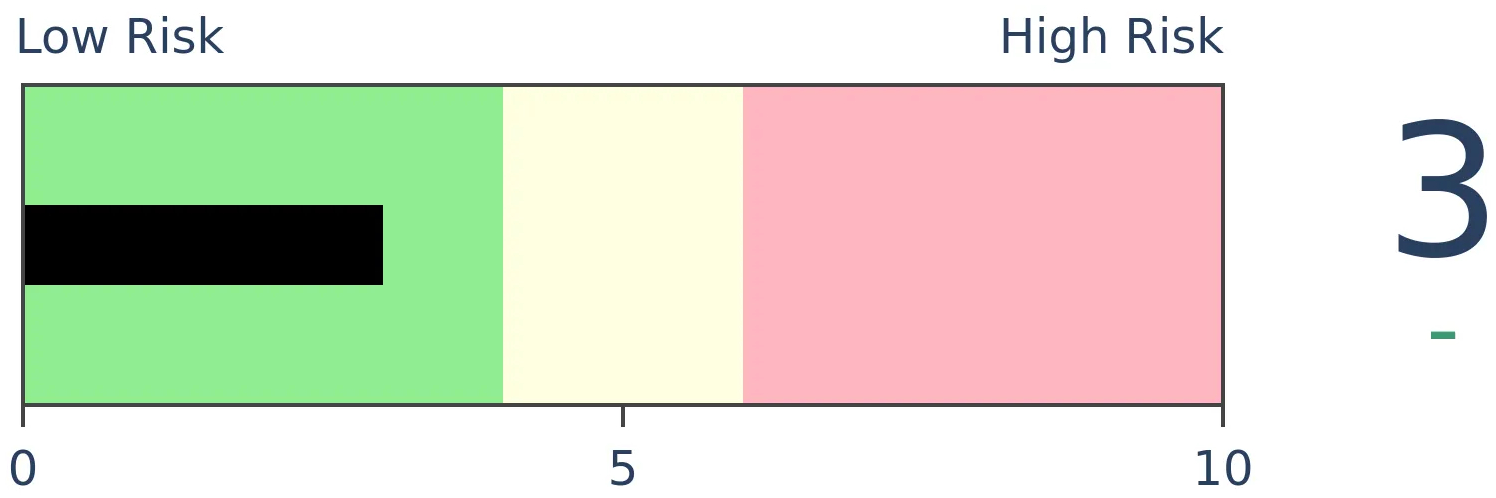
Bonds
|
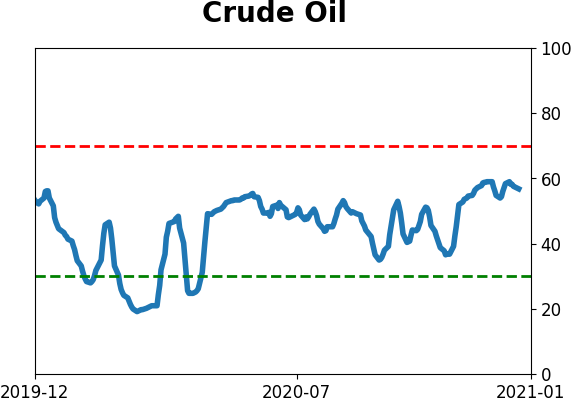
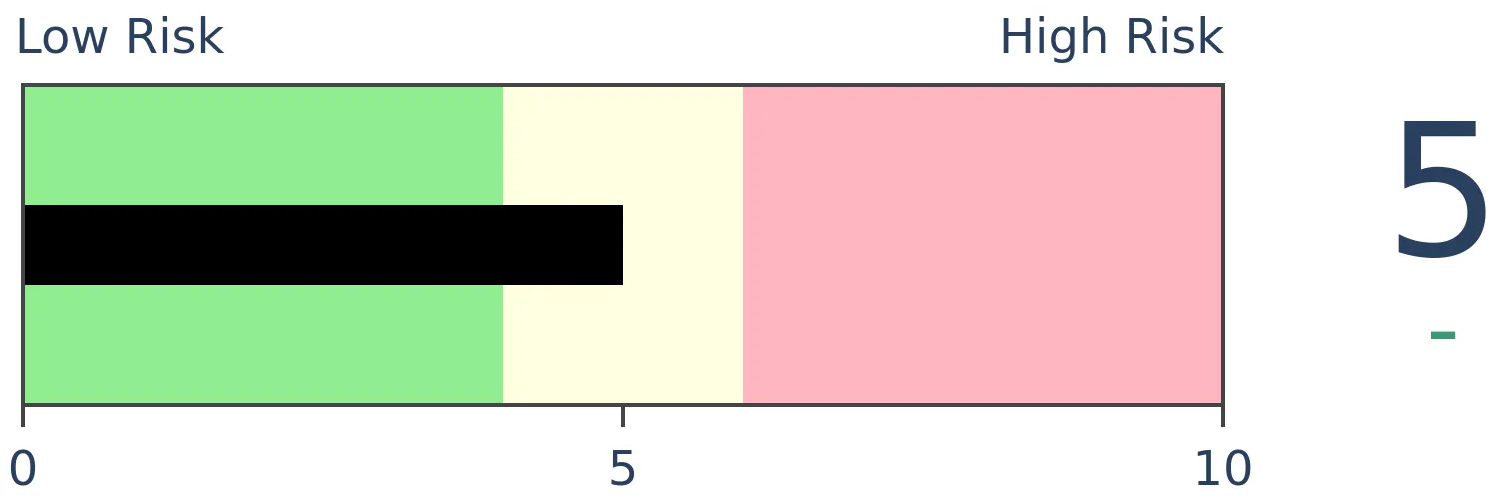
Crude Oil

|
|
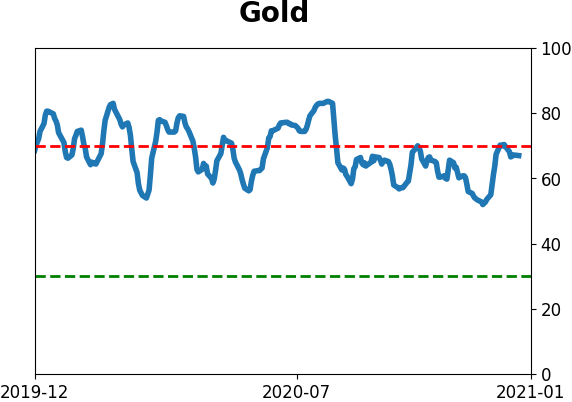
Gold
|
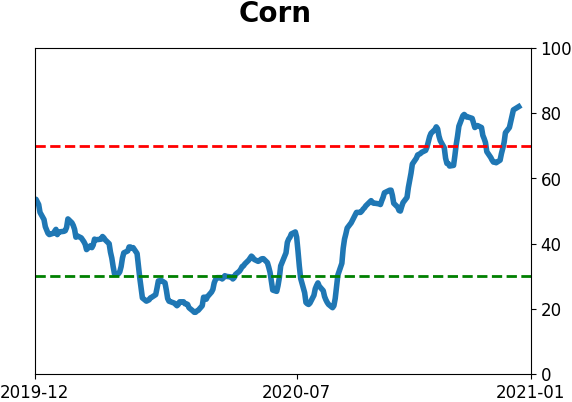
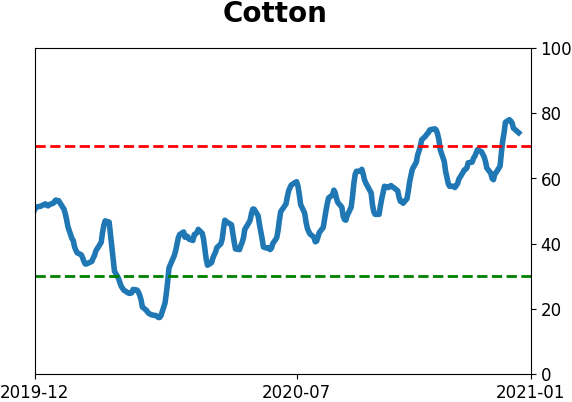
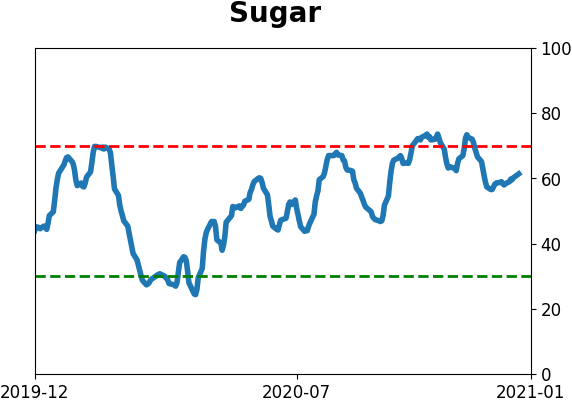
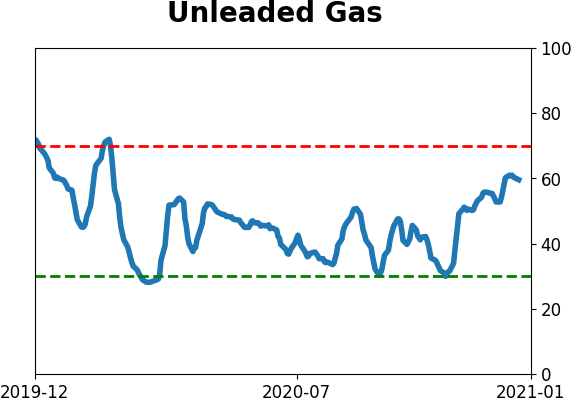
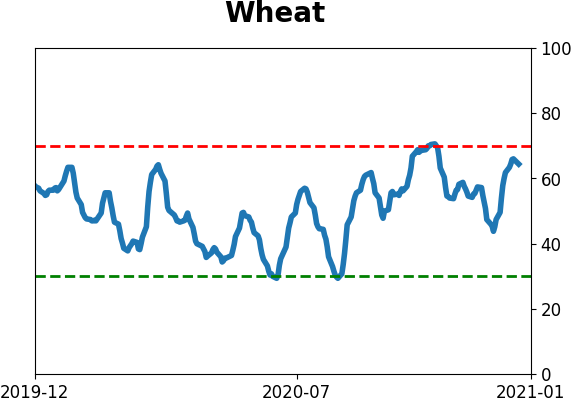
Agriculture
|
|
Research
BOTTOM LINE
For one of the few times since 1926, a single sector (technology) has managed to not only be the best-performing out of all sectors, but with massive gains as well on consecutive years. The few other times that's happened, the sectors had a hard time holding gains in the following year(s).
FORECAST / TIMEFRAME
None
|
In September, we saw that energy was not only the most-hated sector in 2020, it was the most-hated of any sector of all time.
The flip side is that when there's a sector that does very poorly, there's usually another that does very well. This year, of course, that's the technology sector. It was the best sector last year, too.
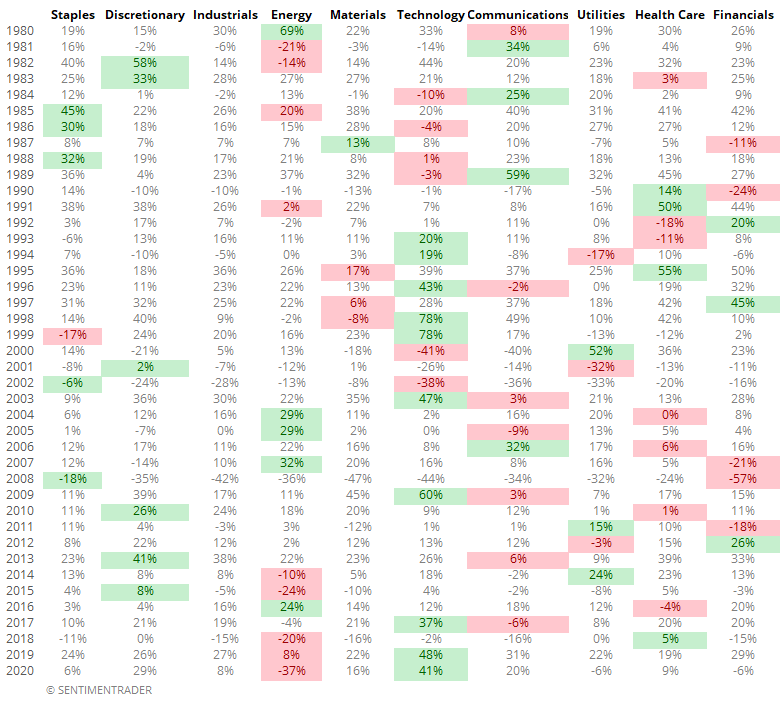
Below, we can see each sector's yearly returns since 1980. The top sector for that year is highlighted in green; the worst in red. The numbers aren't that important, with the biggest takeaway being just how random the colors are. There isn't a lot of continuity - the best sector one year usually isn't the best the next year. It's a little more common for the worst sector to repeat, but even that is fairly rare.
Looking at it visually, the chart below shows the yearly return of the best sector only each year since 1926. The highlighted ones show the sectors that managed to not only be the best sector out of the 10 major ones that year but also have a gain of at least 30% for the year. The only sectors that managed to do this were Energy (twice), Discretionary (twice), and Tech (twice).
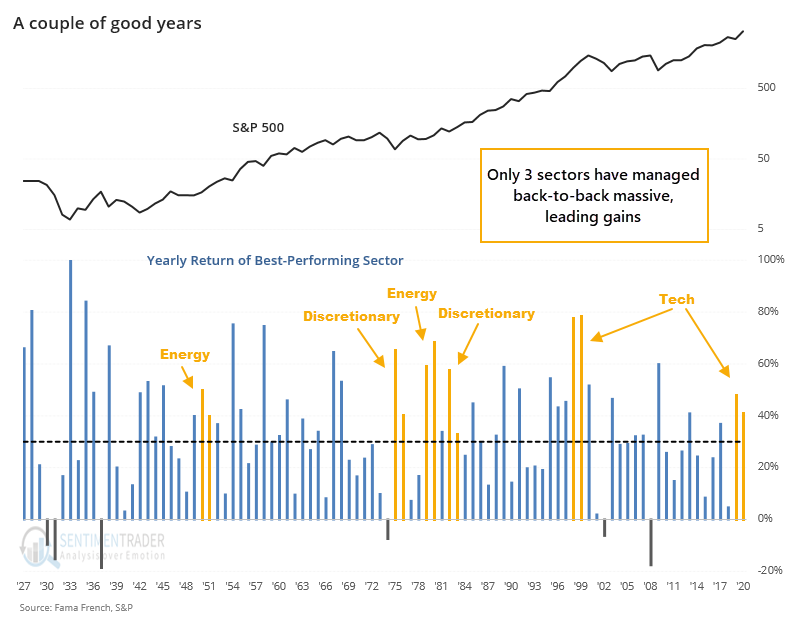
There were only three times a sector managed to be the best sector and have a gain of at least 40% both years. Those were Discretionary stocks in 1975-76, Energy in 1979-80, and Tech in 1998-99. We can see below that after Discretionary's big couple of years, the next year the sector returned -9%. After Energy's run, it returned -21% the next year. And when the tech bubble burst, it's next-year return was a wrenching -41%.
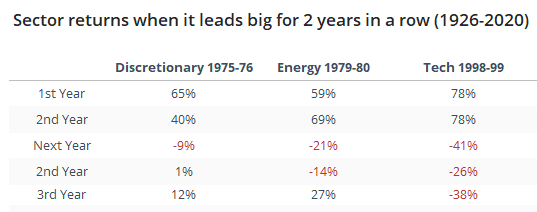
Below, we can see the next year's average performance over the next year when it's the best-performing sector on consecutive years, depending on how much of a gain it enjoyed both years.
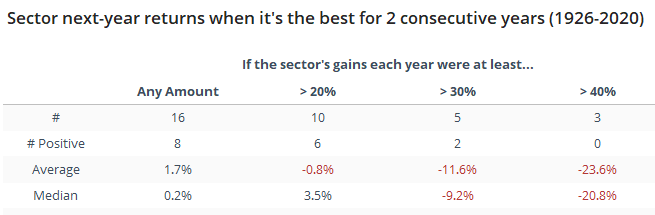
There were 16 times a sector was the best-performing one on consecutive years. The next year, that sector was positive 8 times, but with a median return of only +0.2%. If it had gained at least 20% both years, then it was positive the next year 6 out 10 times, but again with a very low average return.
The biggest warnings, albeit with tiny sample sizes, were when the sector was not only the best-performing one in back-to-back years, but also enjoyed very large gains both years. In those cases, it was rare to see a positive return, and the overall averages were heavily negative.
If we ignore the idea that a sector has to be the best-performing one and instead just look at any sector which enjoyed back-to-back years with at least 40% gains, then we can see how unusual it was for that sector to show a positive return the next year.
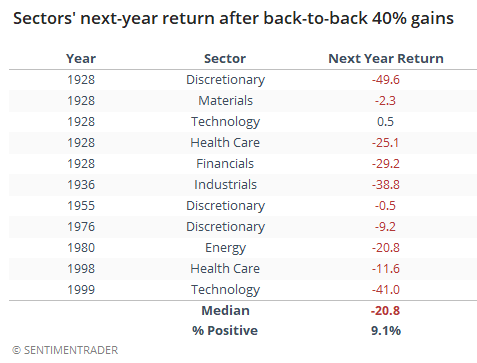
Out of the 11 times a sector enjoyed a run like this, only once did that sector manage a positive return the following year...and that was a 0.5% gain. The others showed mostly moderate to large losses.
This should be a worry for those who are trying to extrapolate tech's massive wins in 2019 and 2020 into gains for 2021.
Active Studies
| Time Frame | Bullish | Bearish | | Short-Term | 0 | 0 | | Medium-Term | 2 | 1 | | Long-Term | 14 | 2 |
|
Indicators at Extremes
Portfolio
| Position | Description | Weight % | Added / Reduced | Date | | Stocks | 10.4% VWO, 9.1% XLE, 8.5% RSP, 6.6% PSCE | 34.5 | Reduced 6.7% | 2020-12-14 | | Bonds | 10% BND, 10% SCHP, 10% ANGL | 28.4 | Reduced 0.1% | 2020-10-02 | | Commodities | GCC | 2.4 | Reduced 2.1%
| 2020-09-04 | | Precious Metals | GDX | 8.9 | Added 4.8% | 2020-12-01 | | Special Situations | | 0.0 | Reduced 5% | 2020-10-02 | | Cash | | 25.8 | | |
|
Updates (Changes made today are underlined)
Quite a few of the studies that have been triggering for stocks have showed a poor risk/reward skew over a short- to medium-term time frame, even though many of them have also been quite positive over medium- to long-term time frames. We're in a very favorable seasonal window, so it would be somewhat odd to see a substantial pullback in the next few weeks. Leave it to 2020 to do just that, I suppose, but the calendar is a point in bulls' favor. Even so, record-high-and-declining sentiment, coupled with early signs of a reversal were enough that I reduced my S&P 500 position a bit. I fully expect that the energy funds will suffer some losses in the coming weeks, but as I noted when buying them, they're intended as long-term positions and almost by definition they're going to be volatile. RETURN YTD: 7.1% 2019: 12.6%, 2018: 0.6%, 2017: 3.8%, 2016: 17.1%, 2015: 9.2%, 2014: 14.5%, 2013: 2.2%, 2012: 10.8%, 2011: 16.5%, 2010: 15.3%, 2009: 23.9%, 2008: 16.2%, 2007: 7.8%
|
|
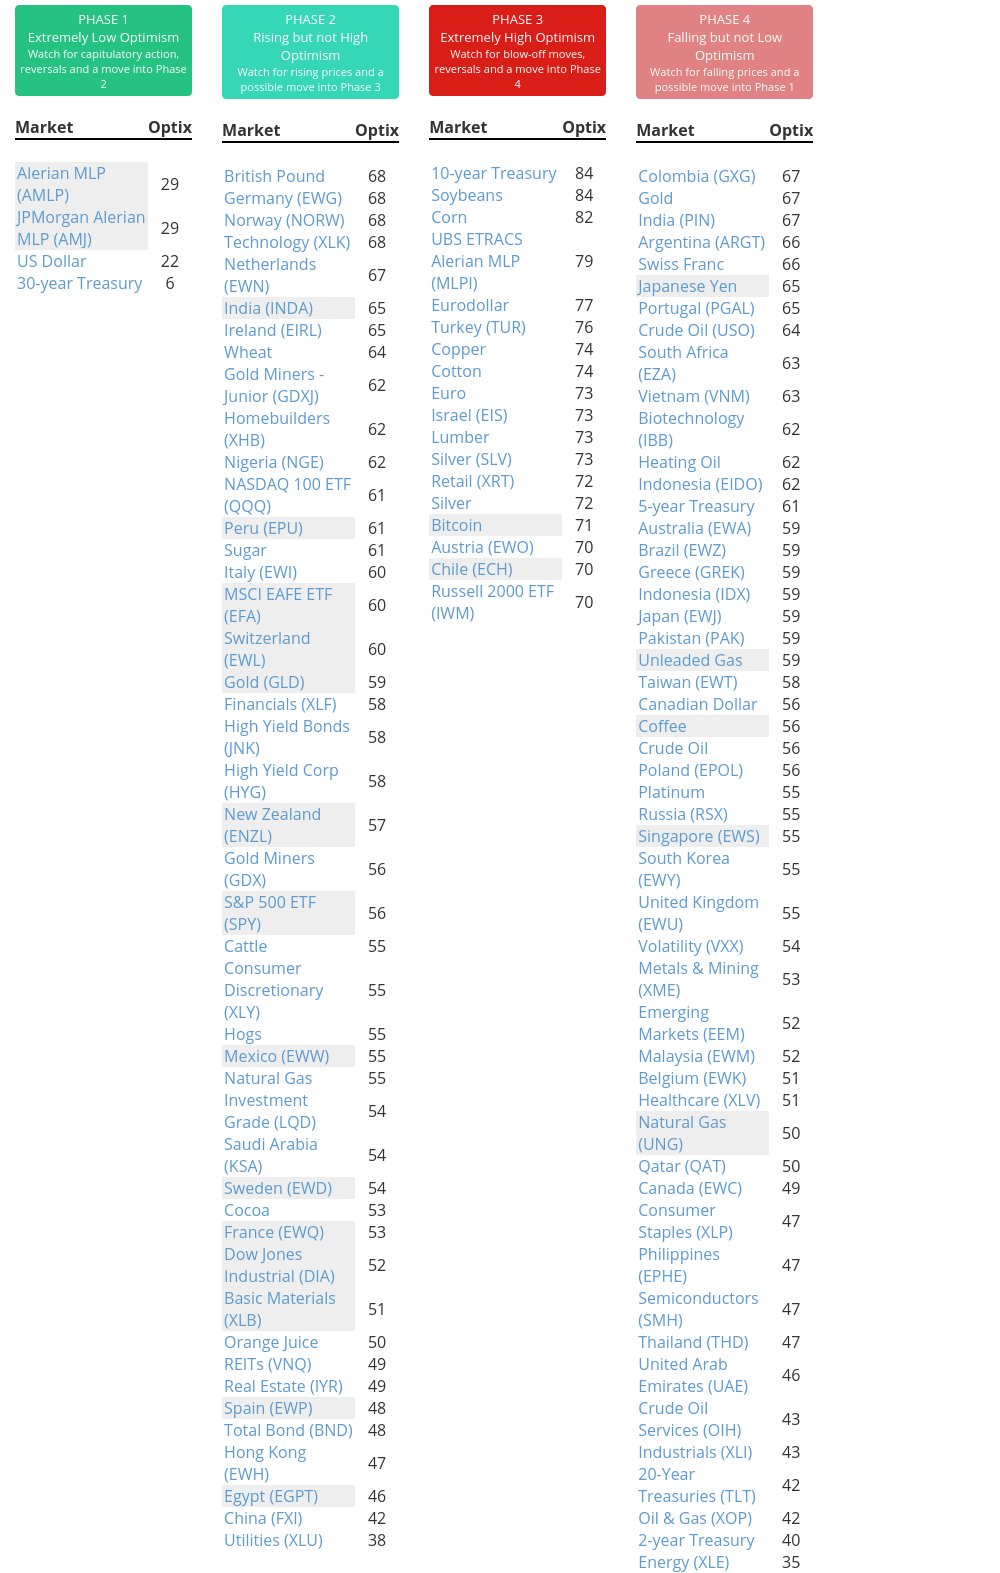
Phase Table
Ranks
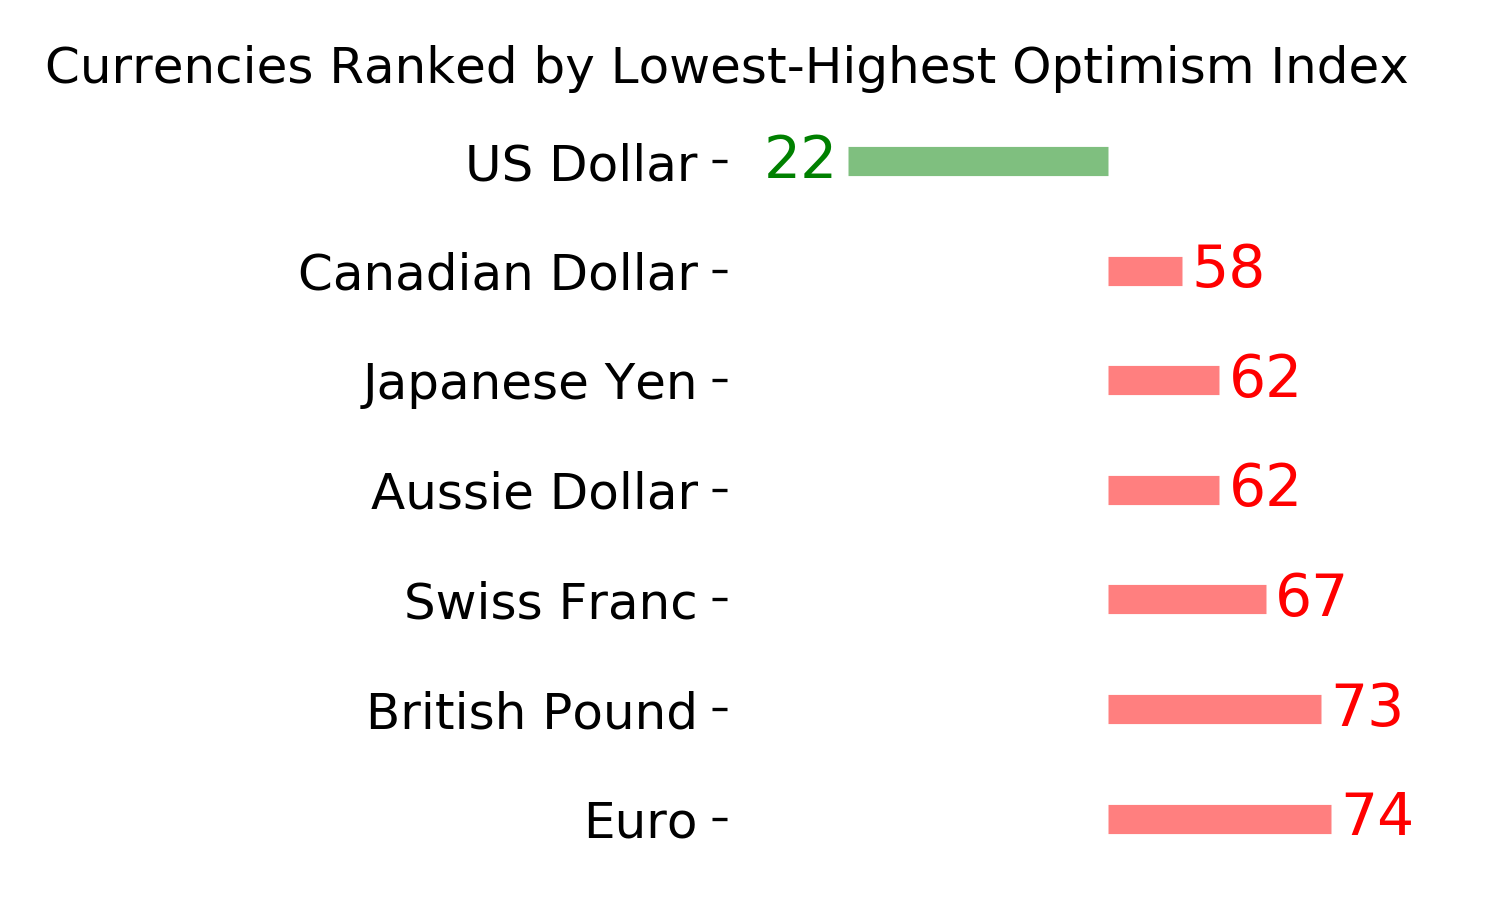
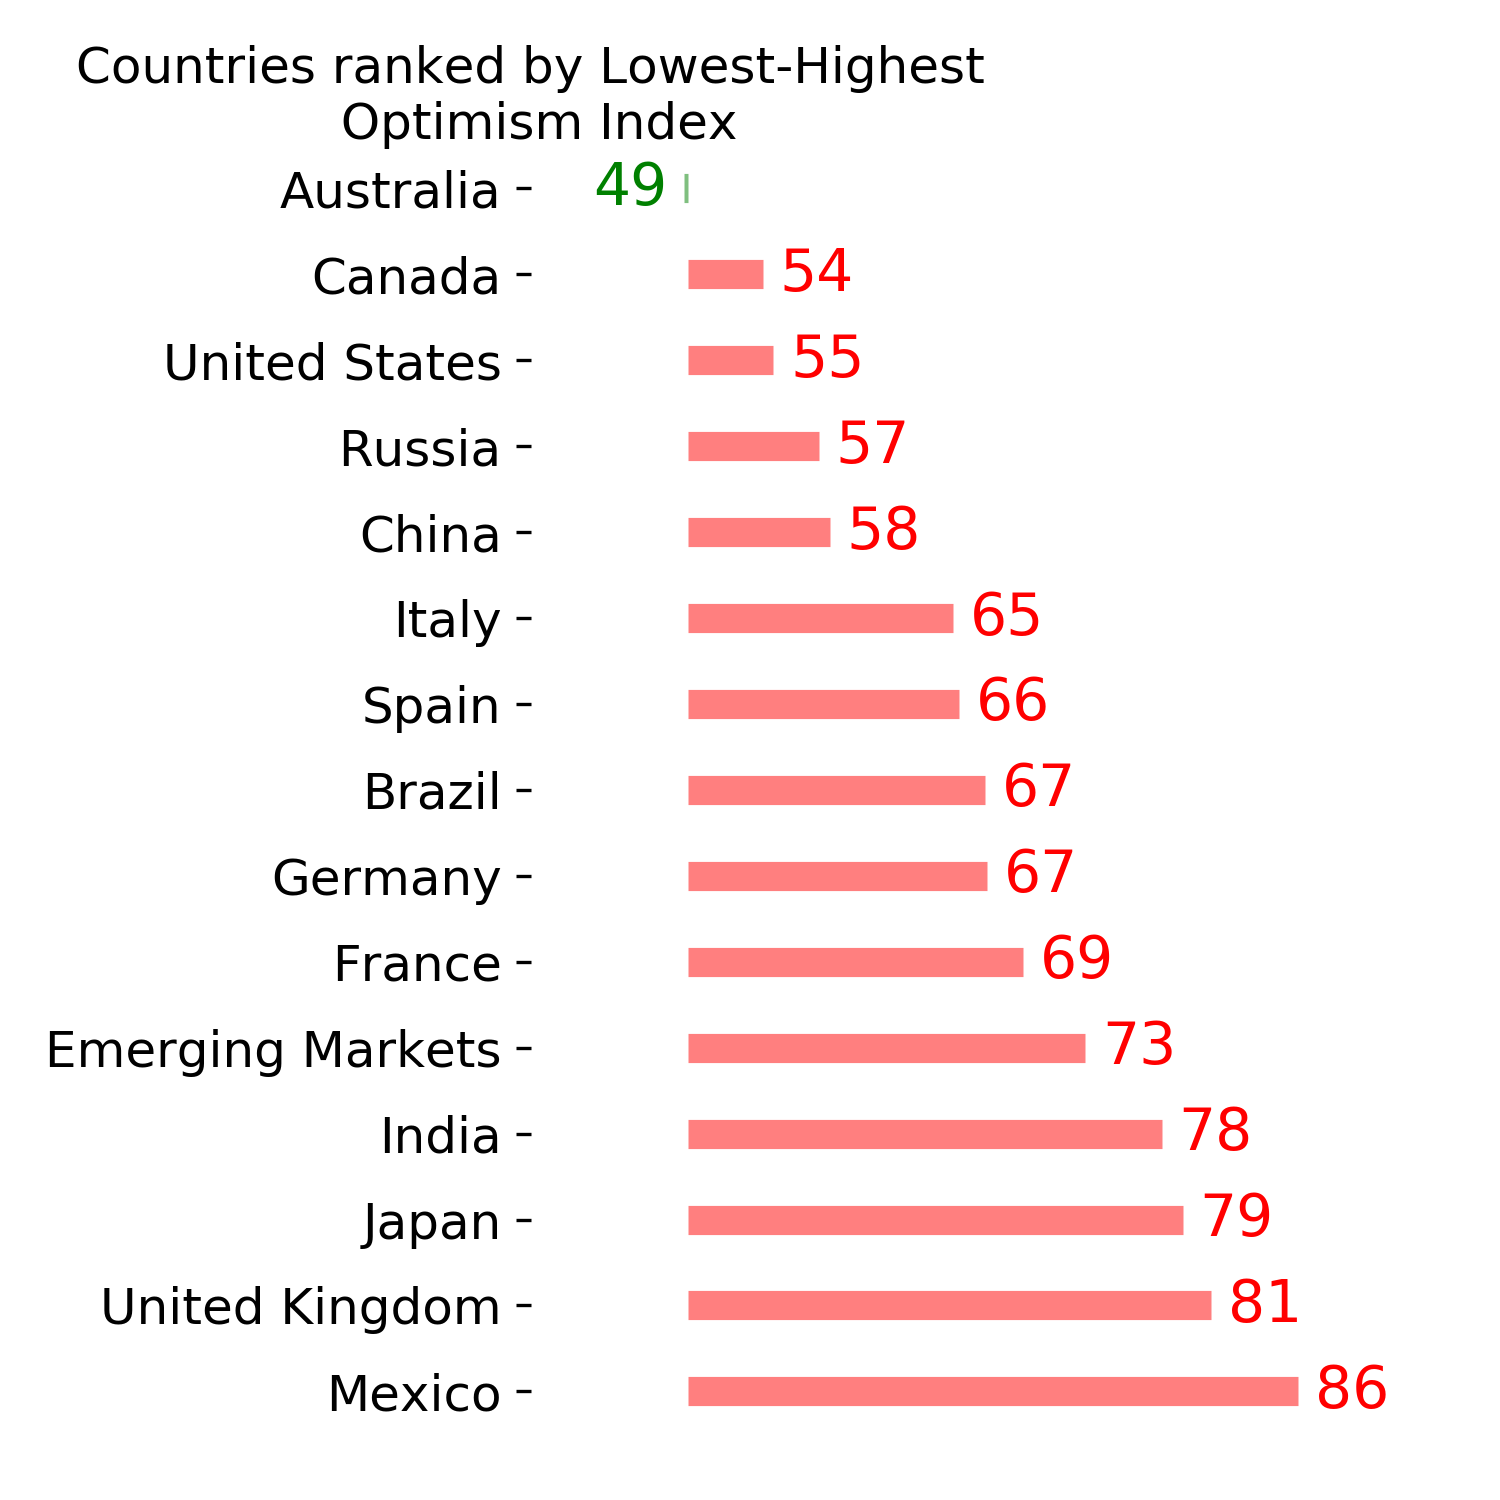
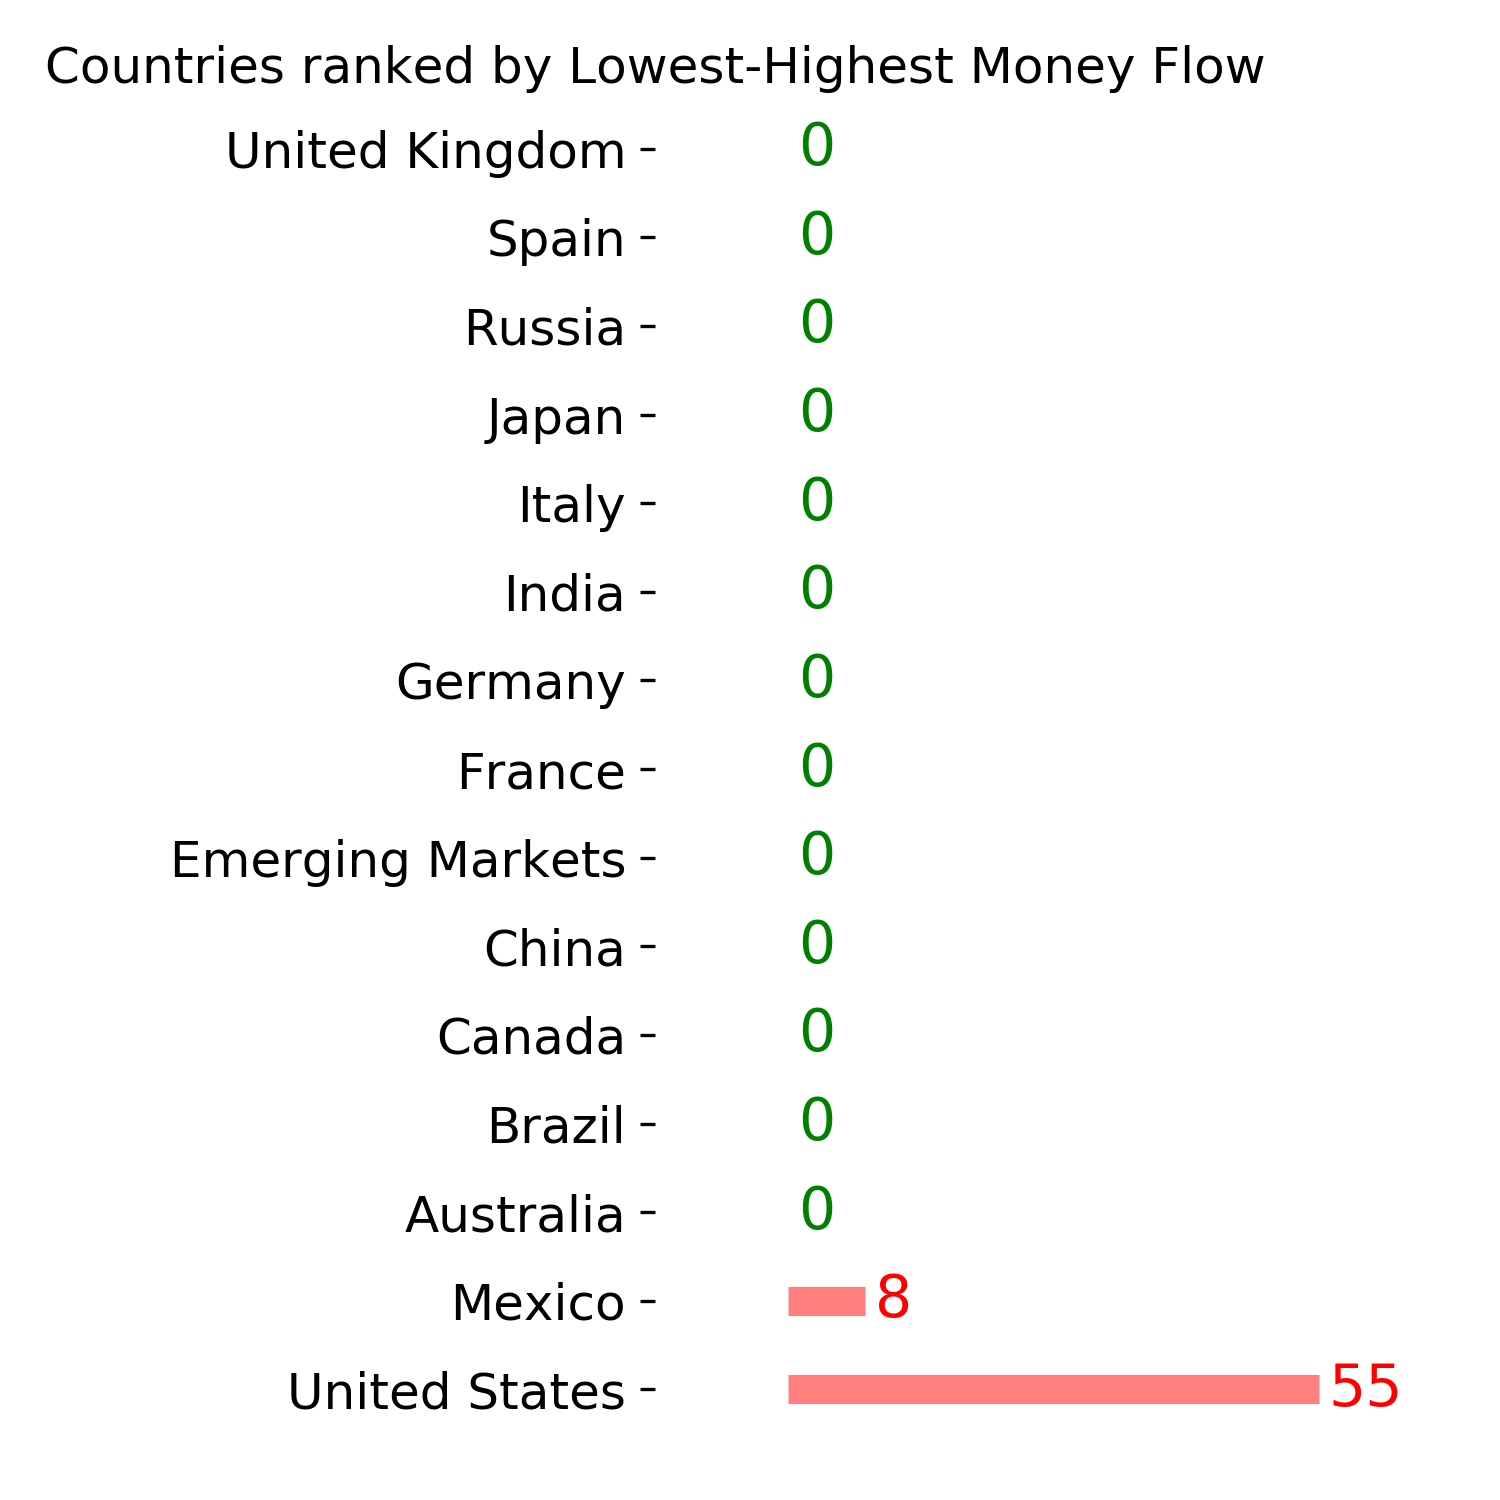
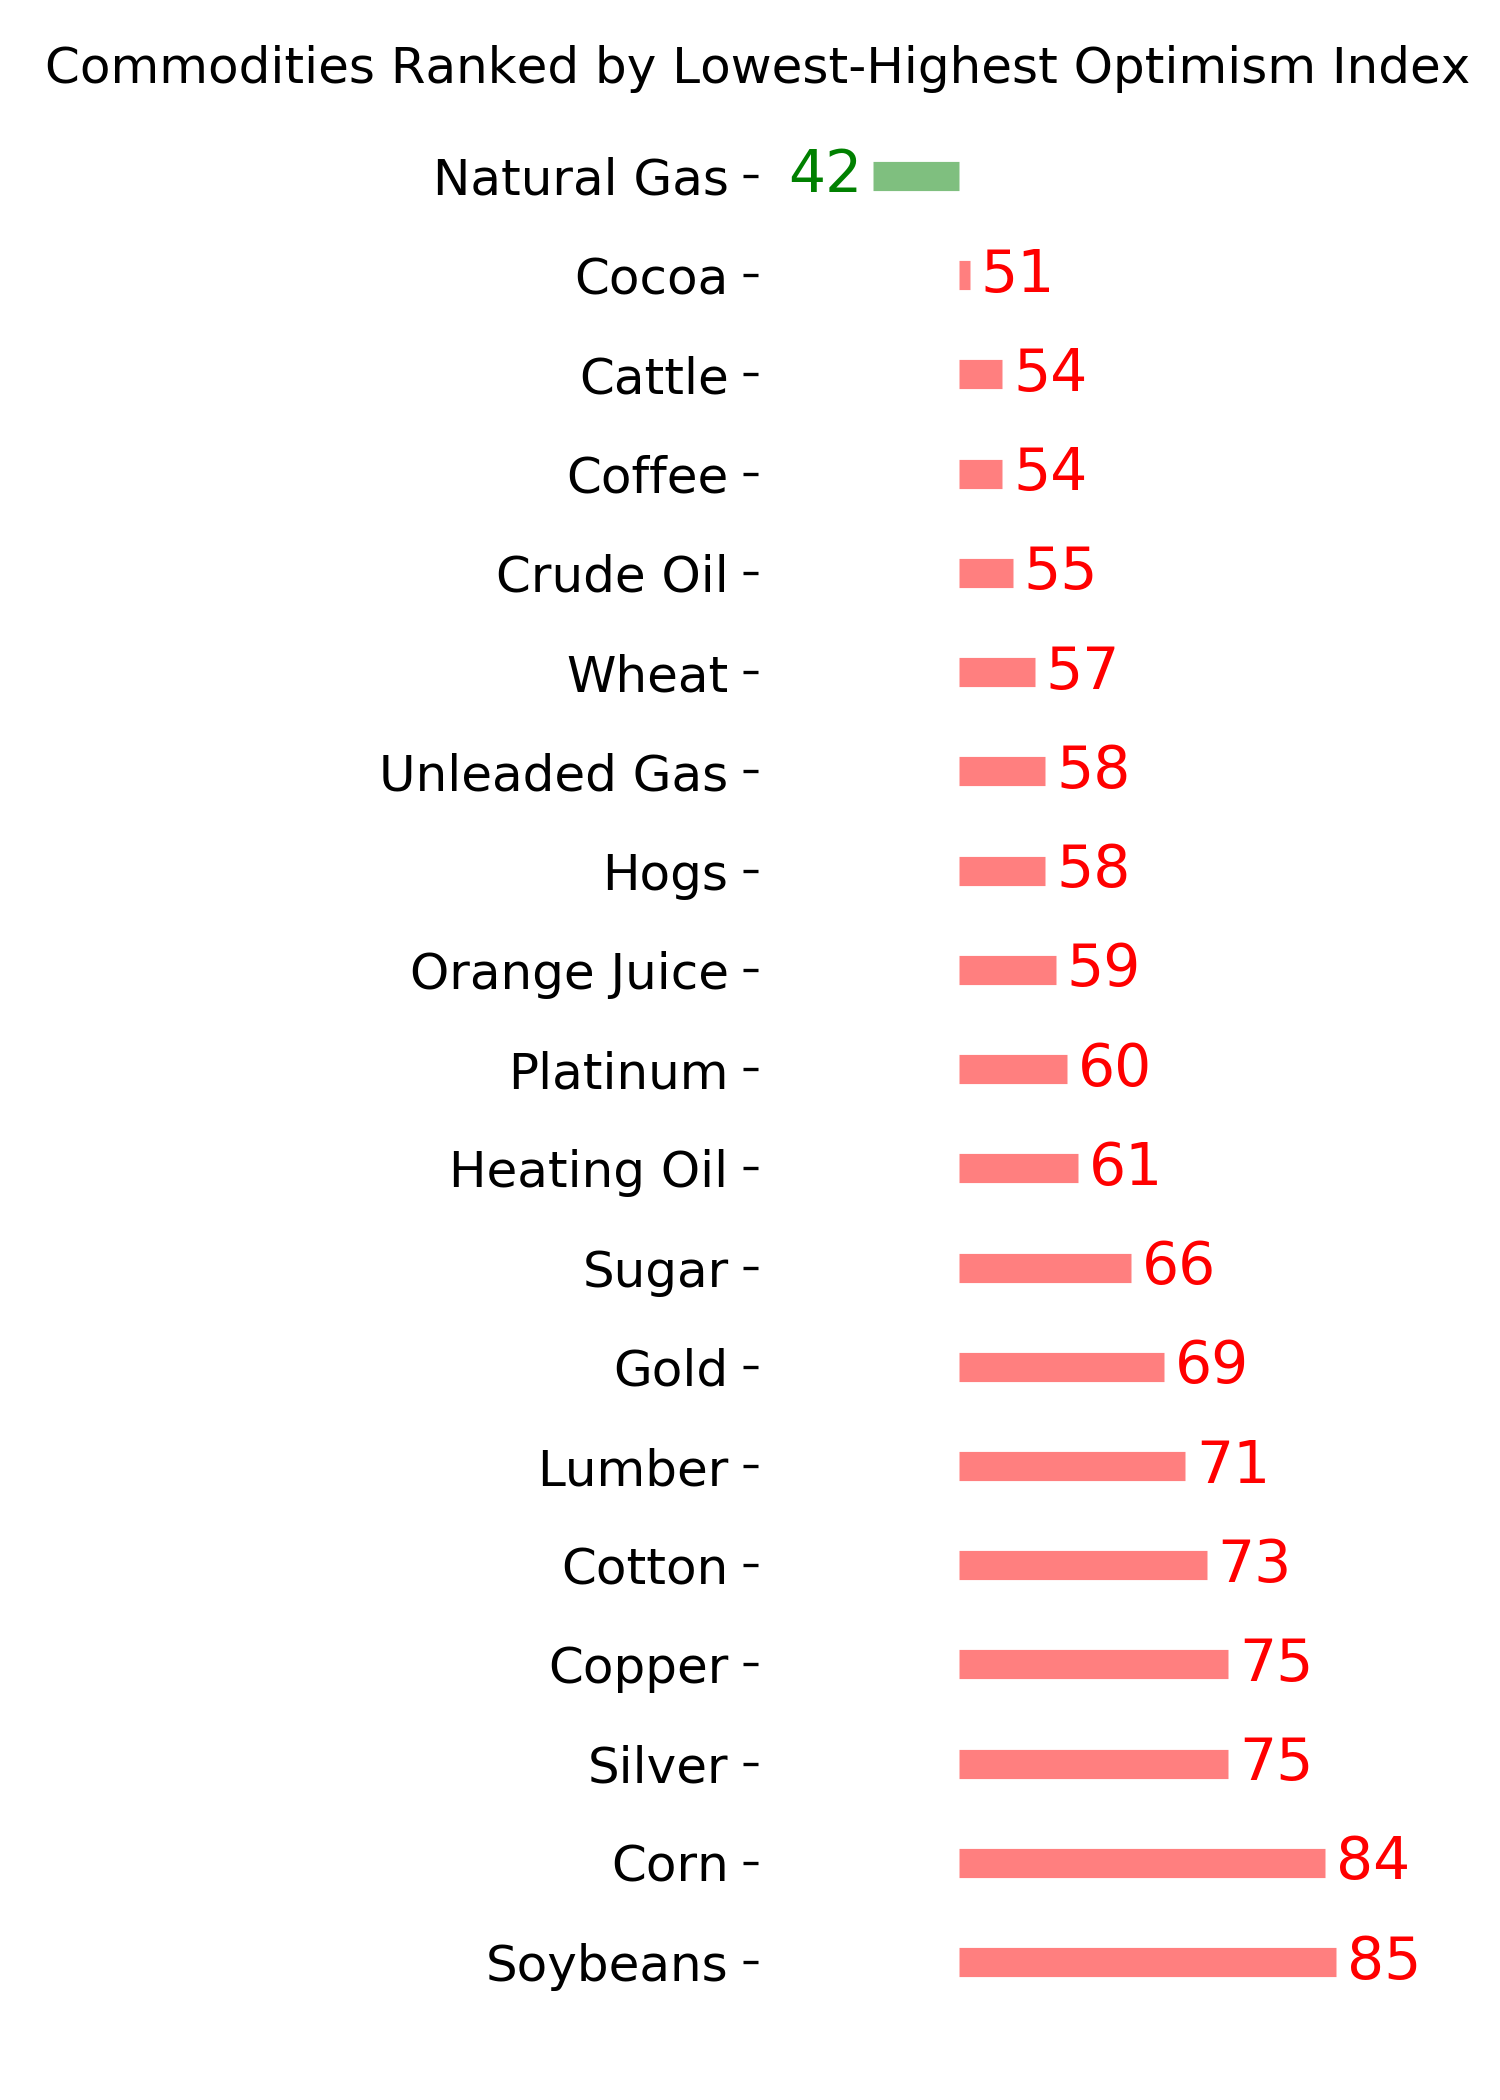
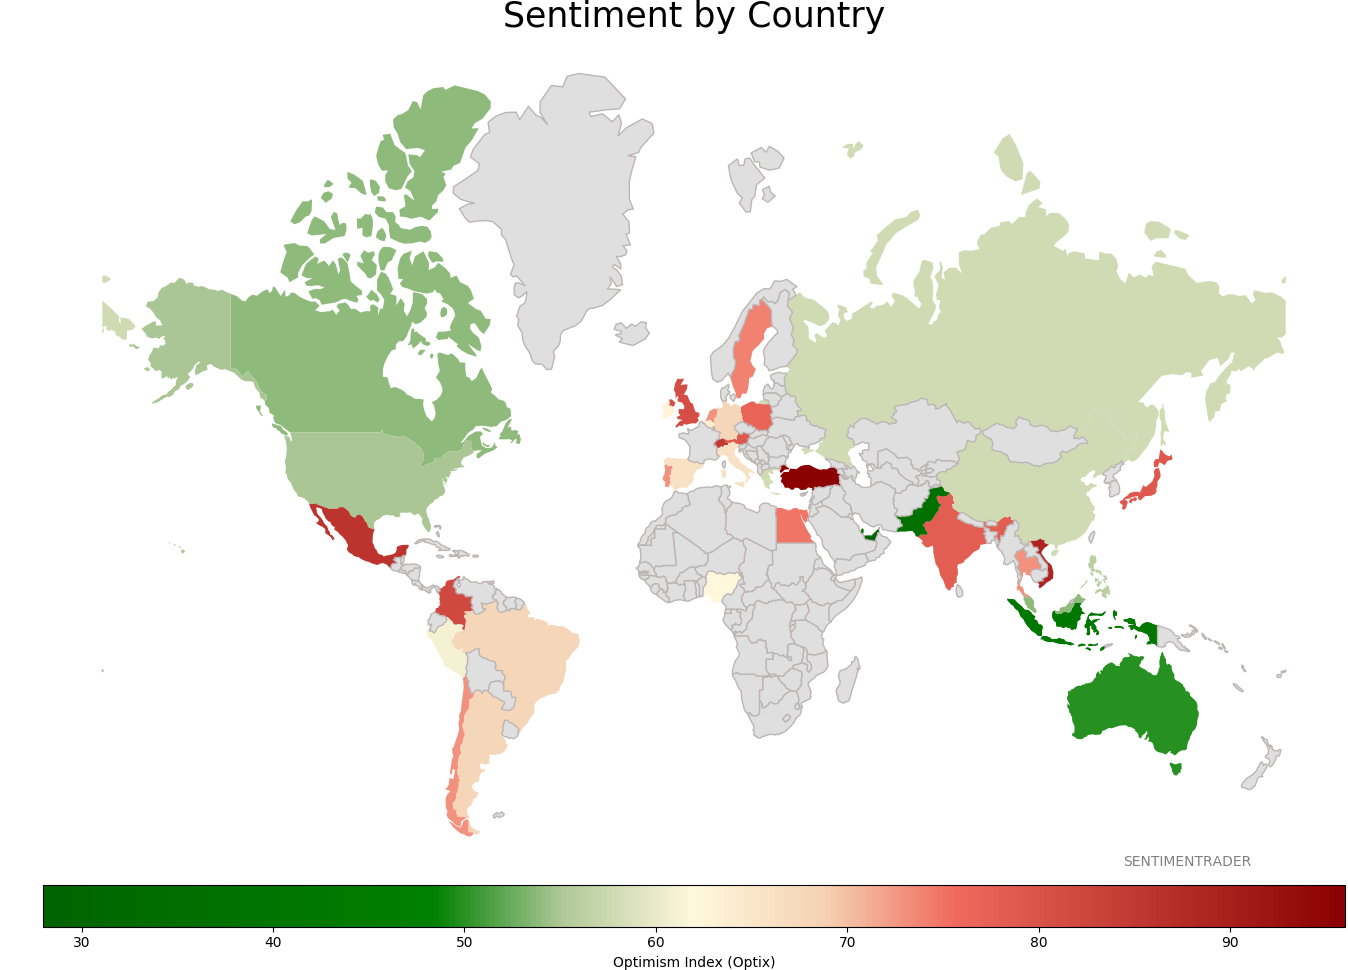
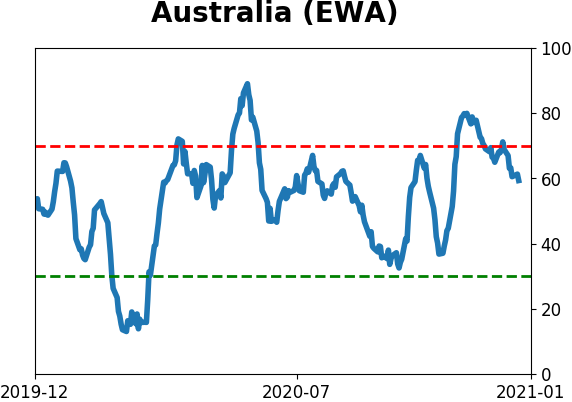
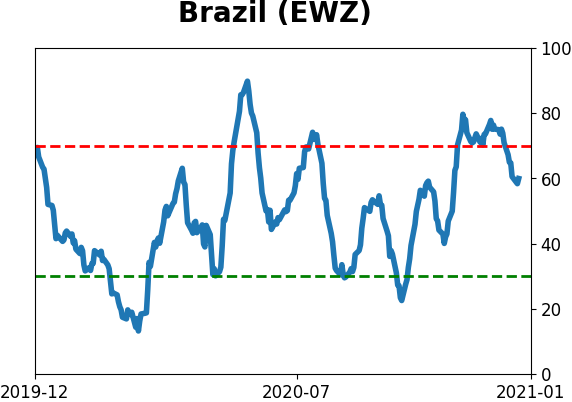
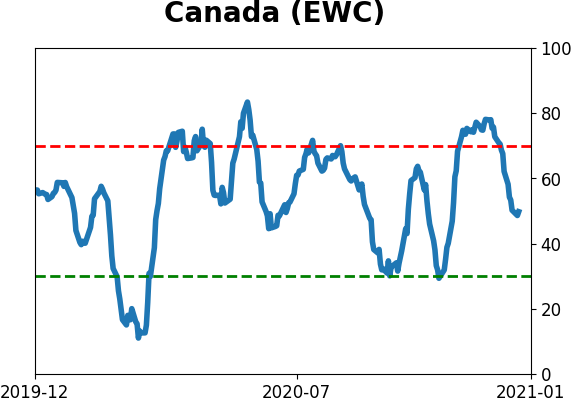
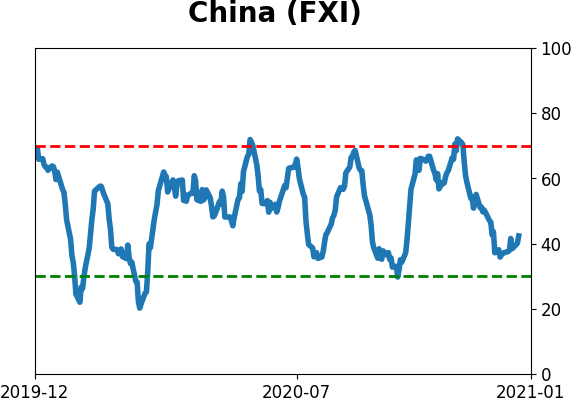
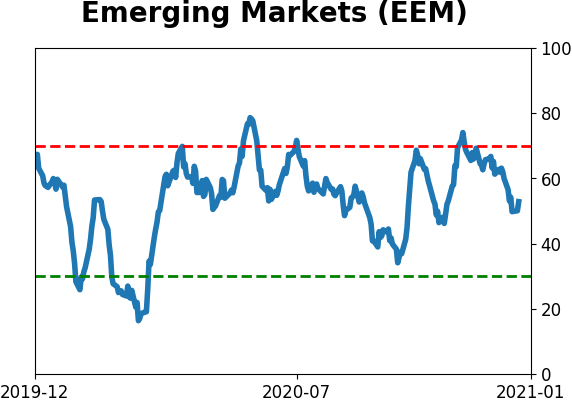
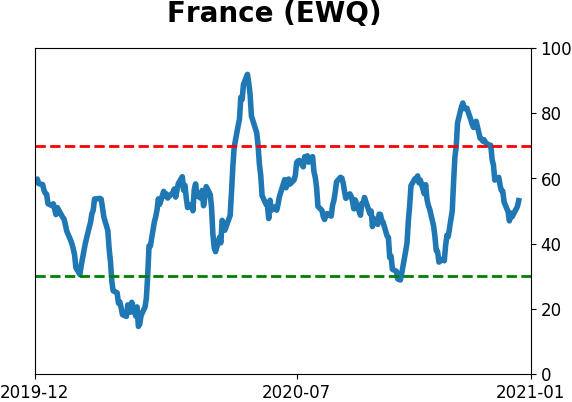
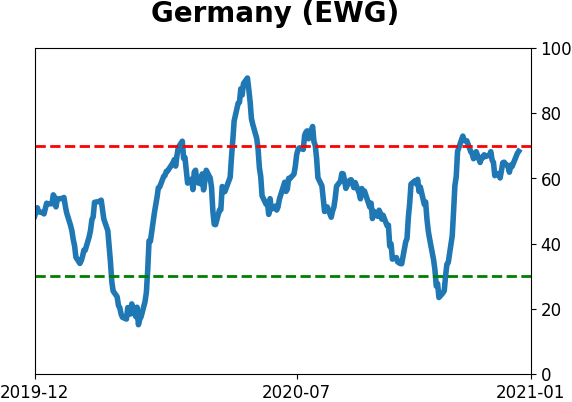
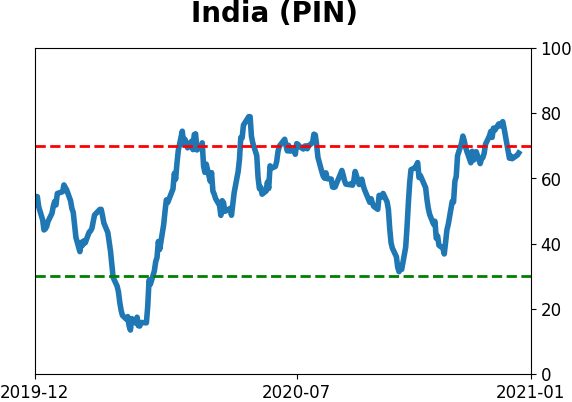
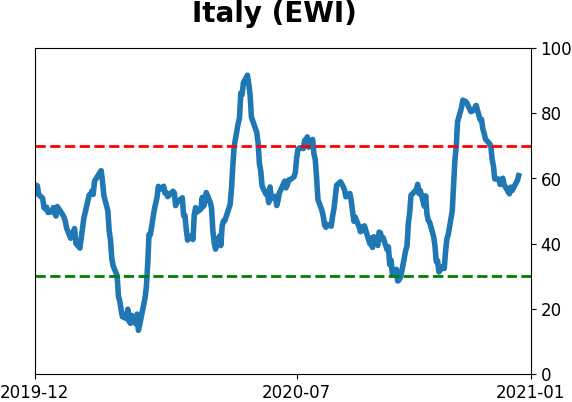
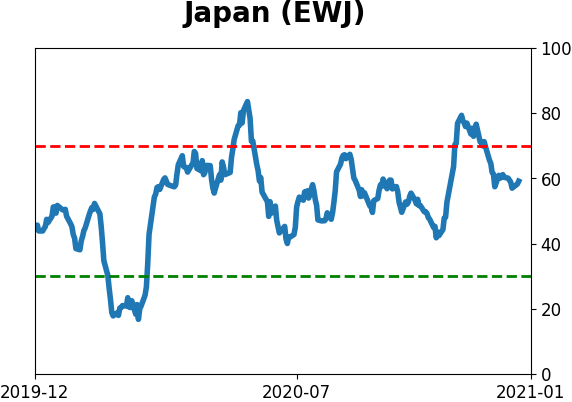
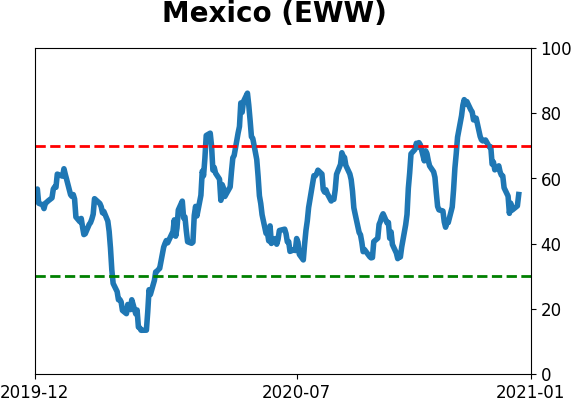
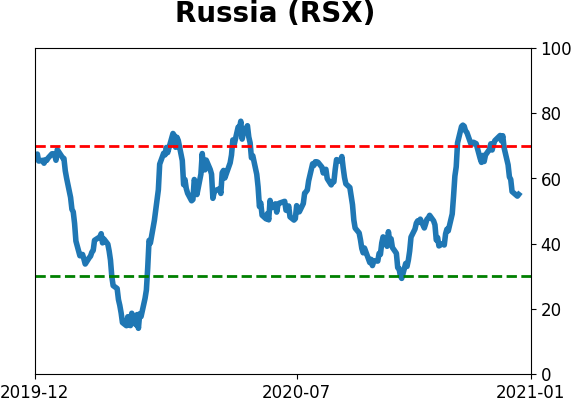
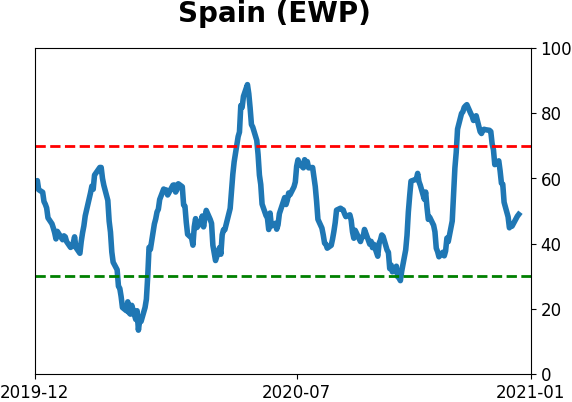
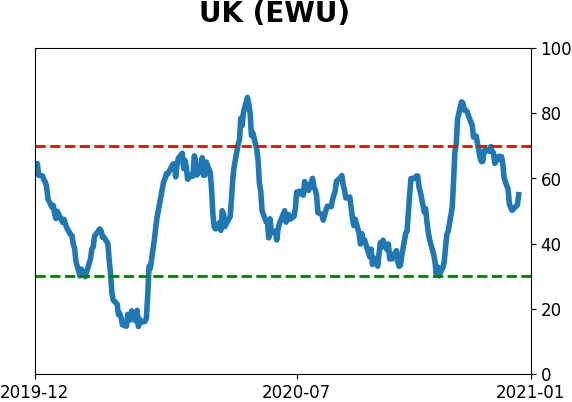
Sentiment Around The World
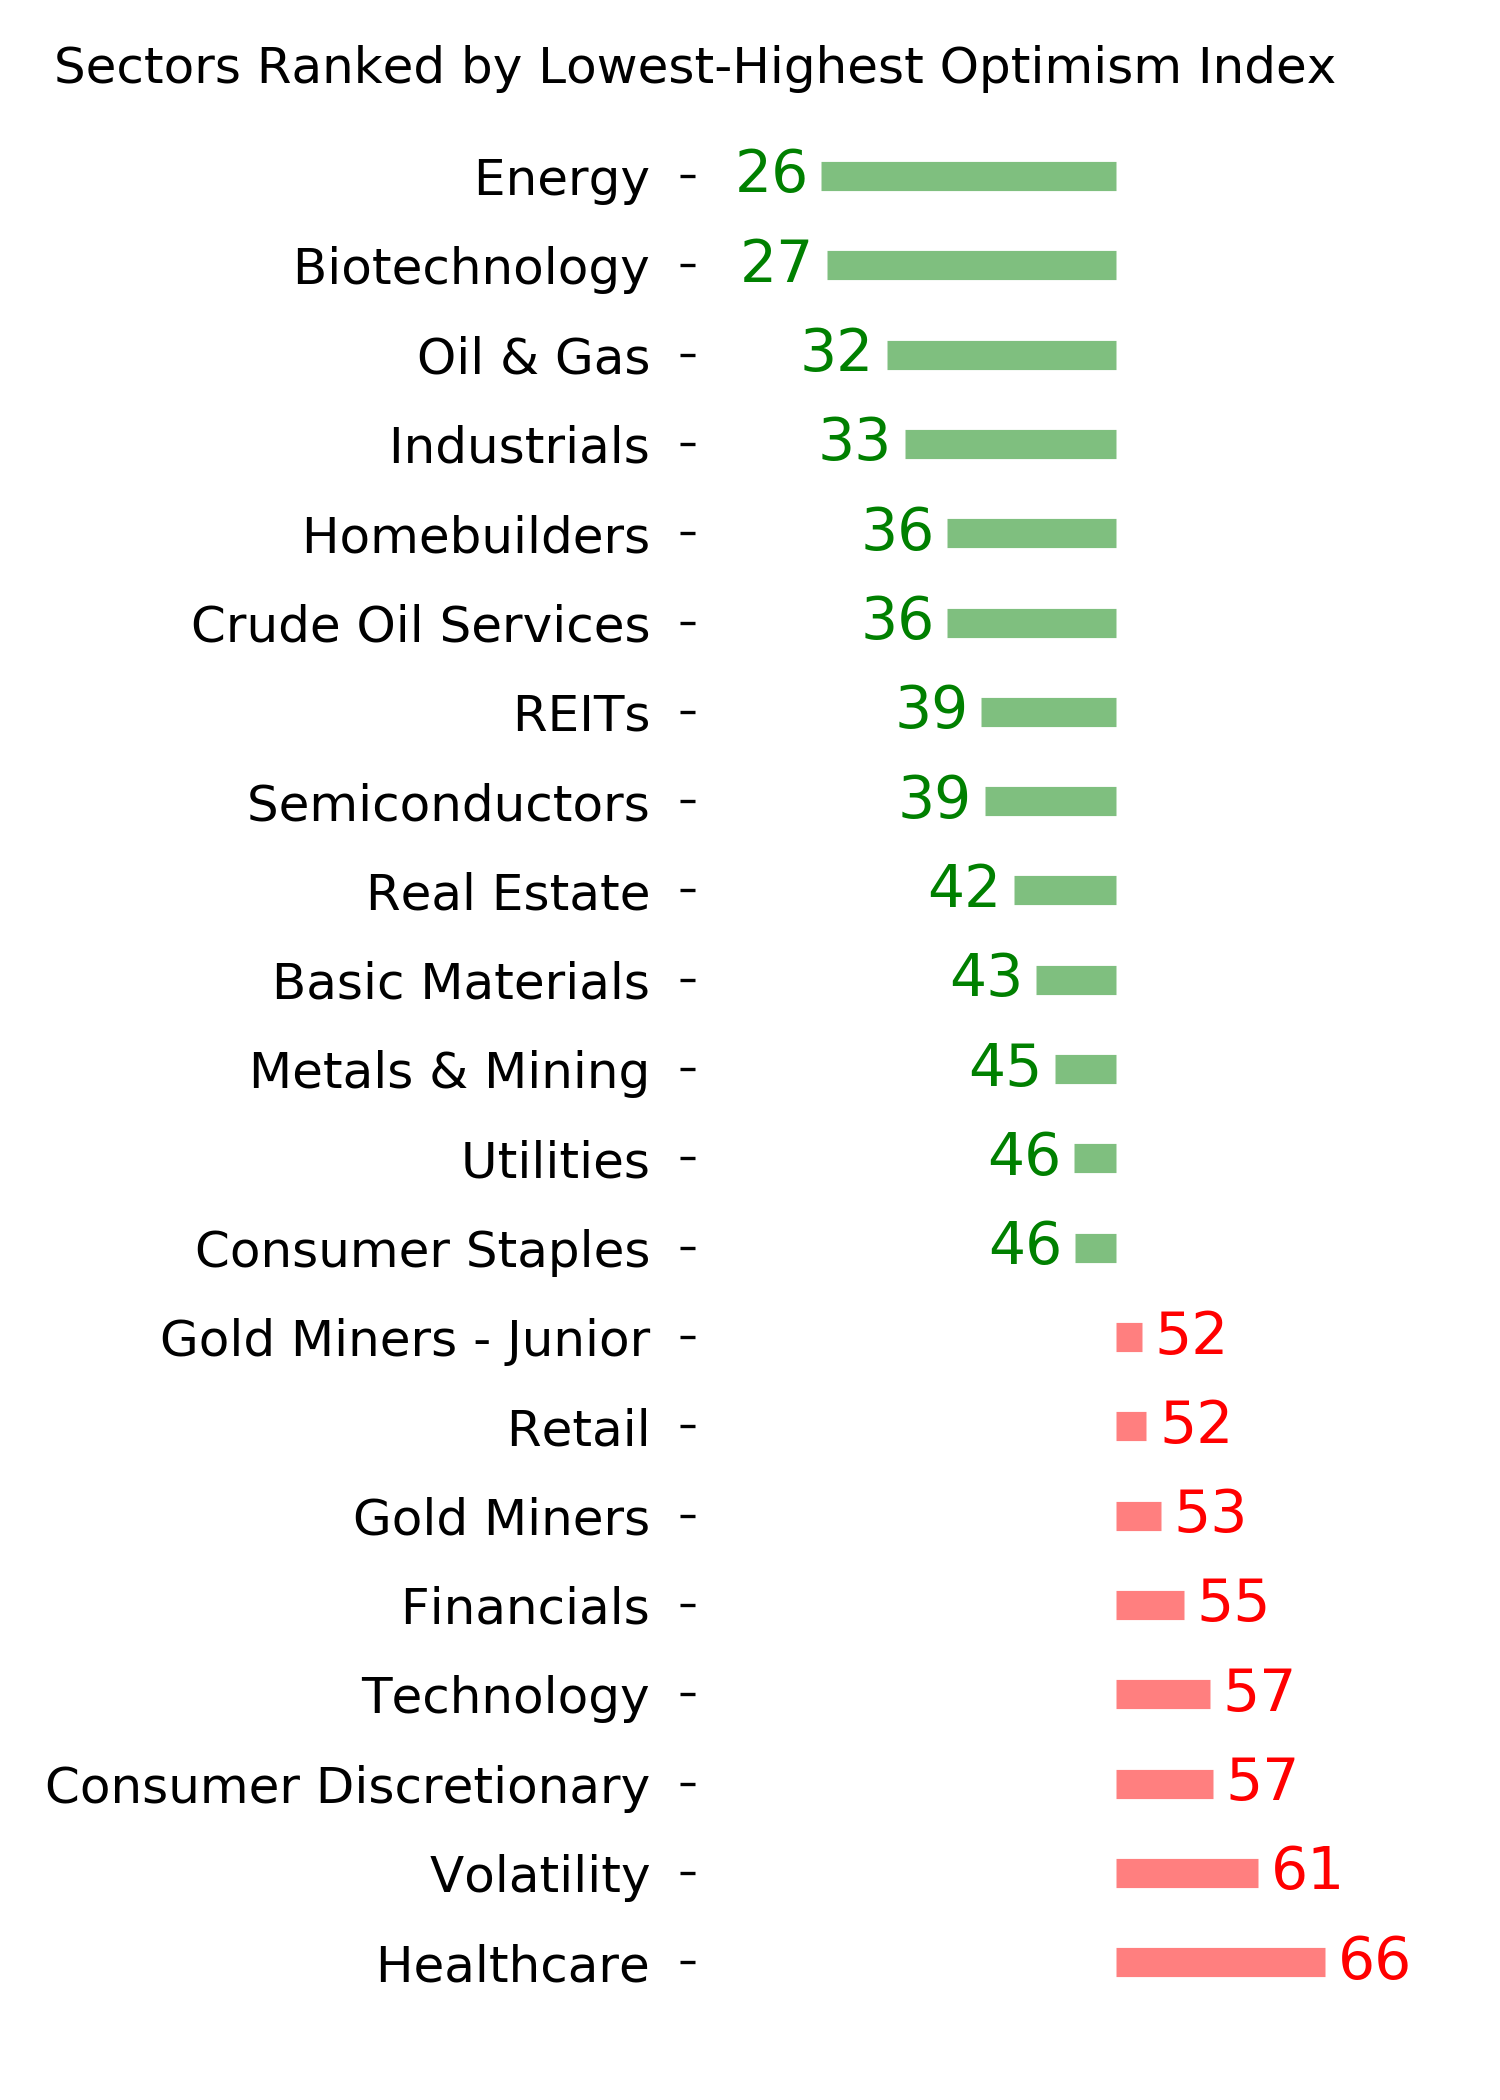
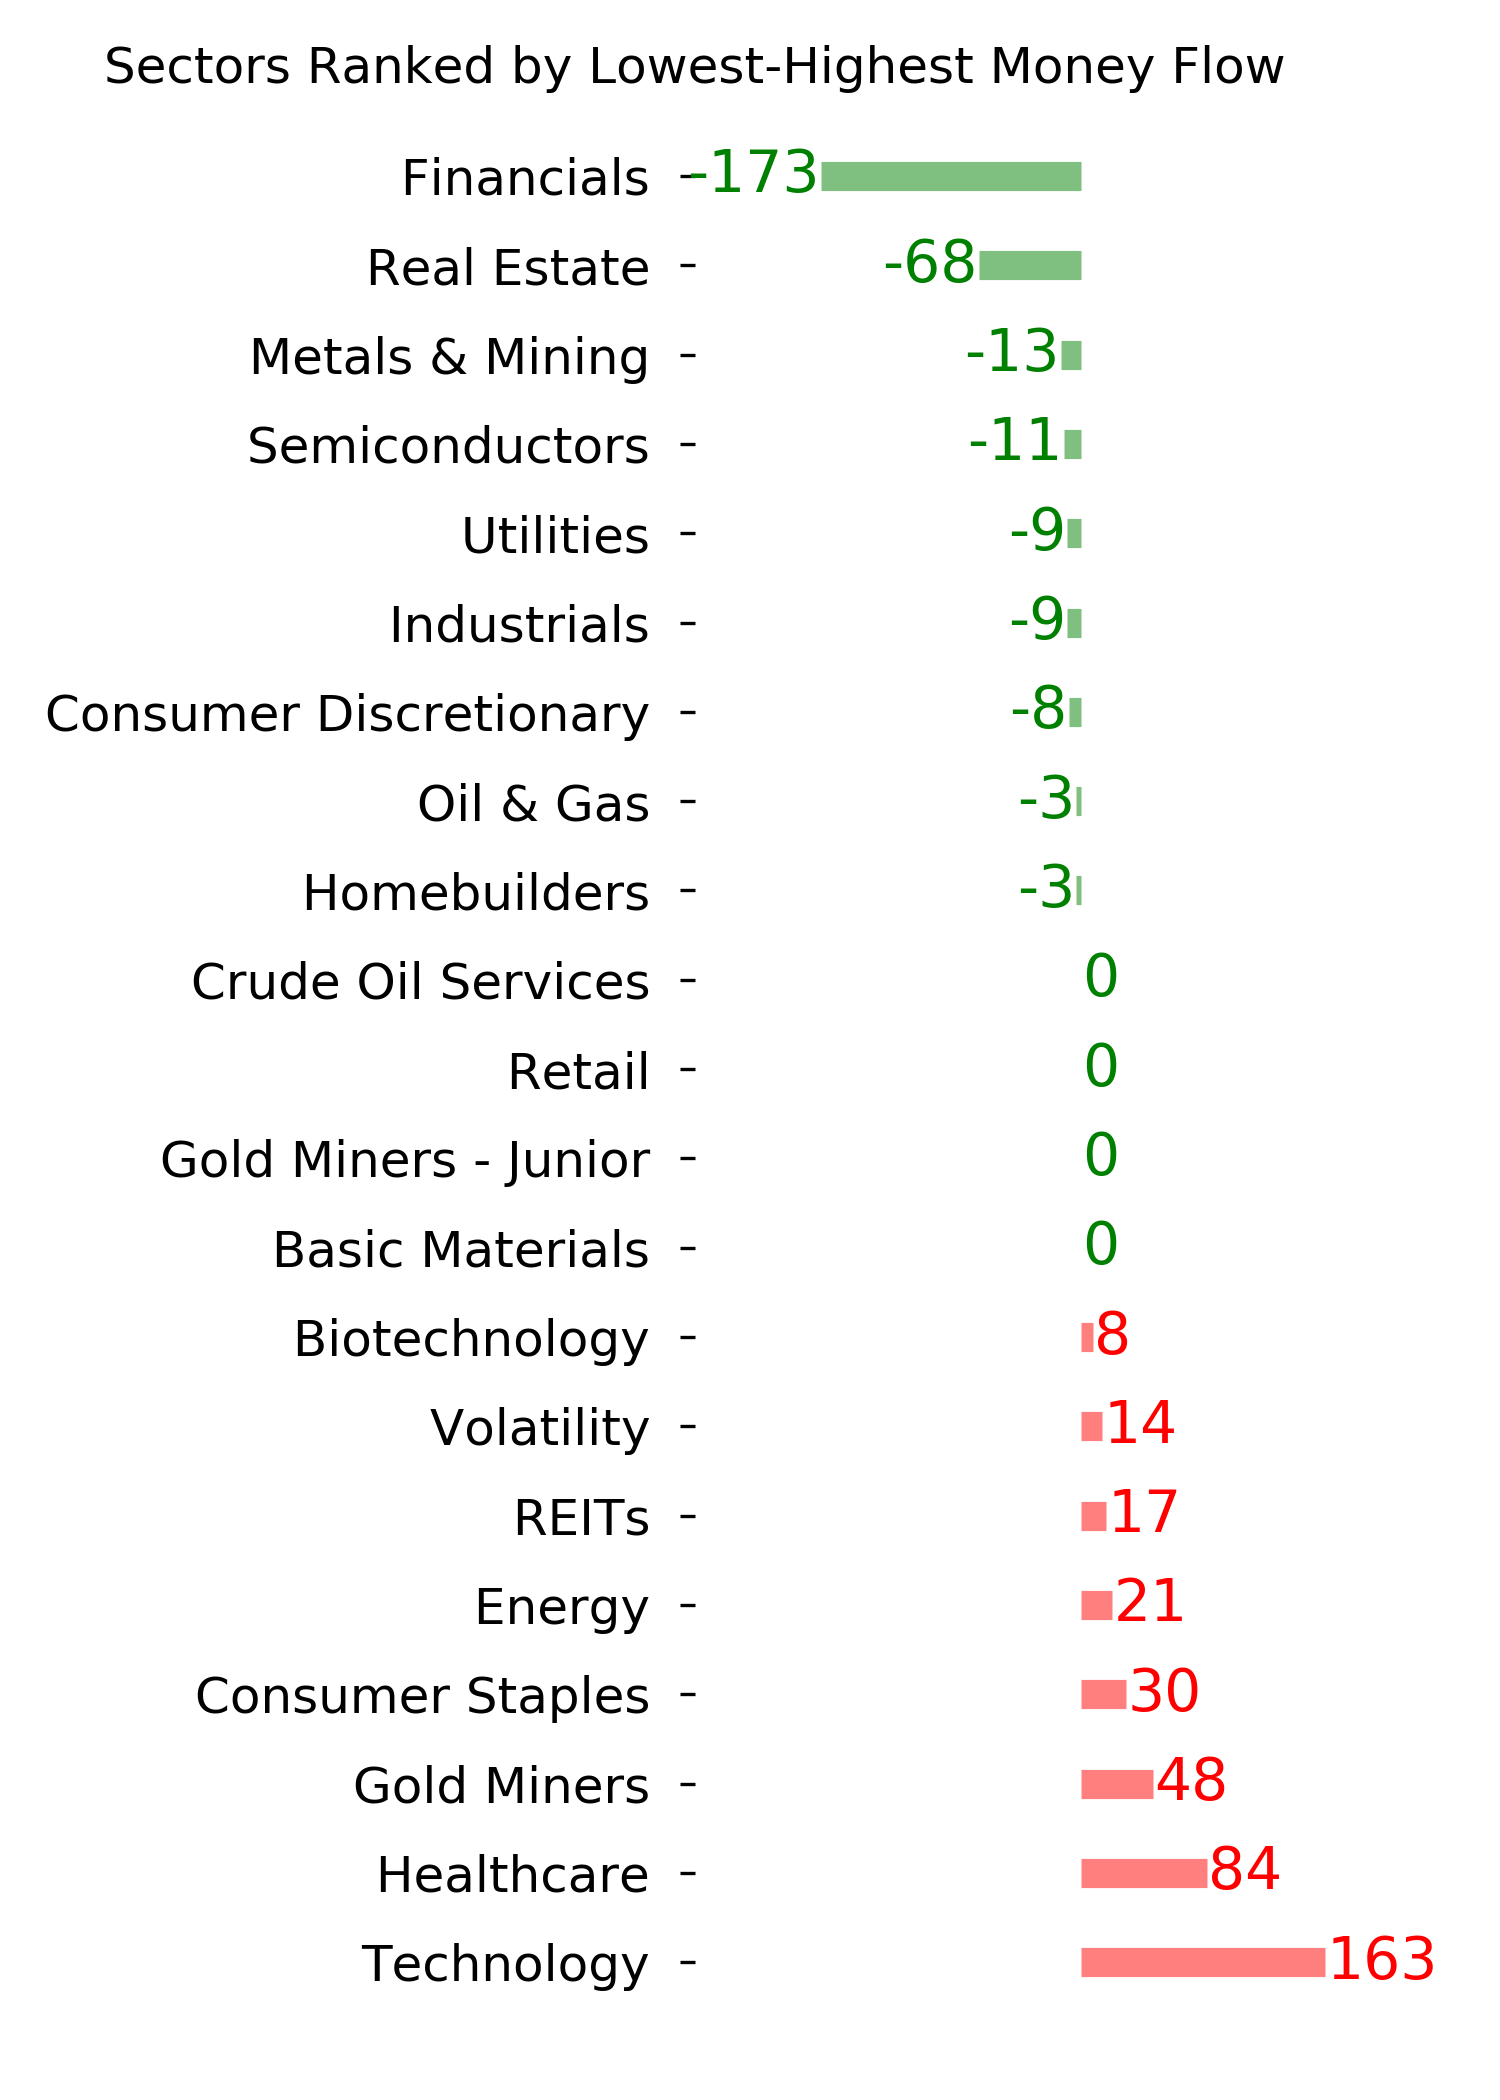
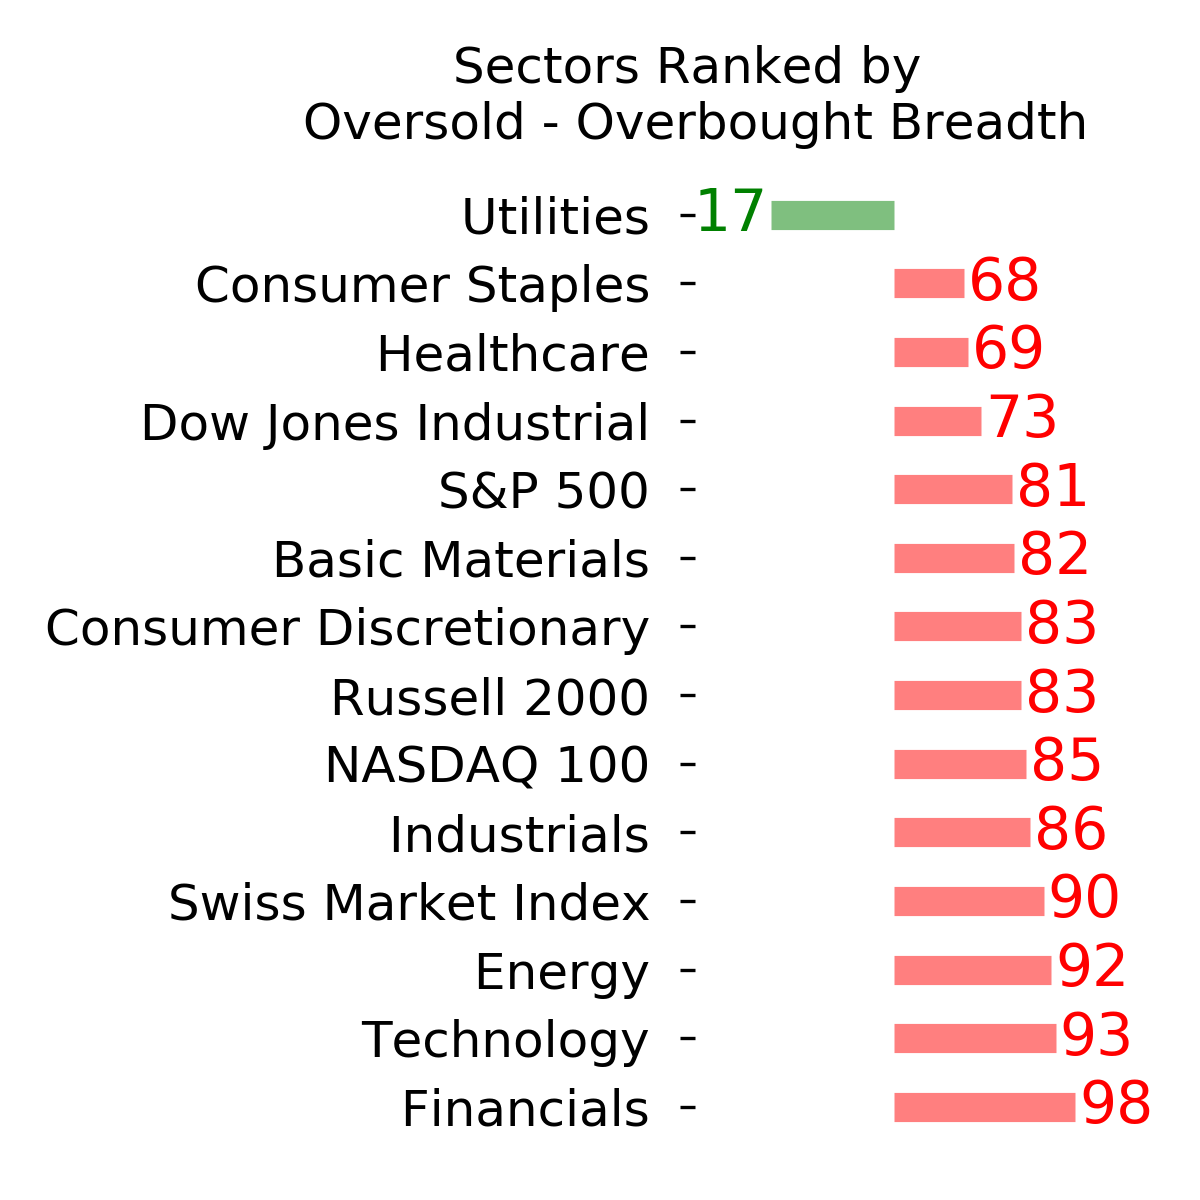
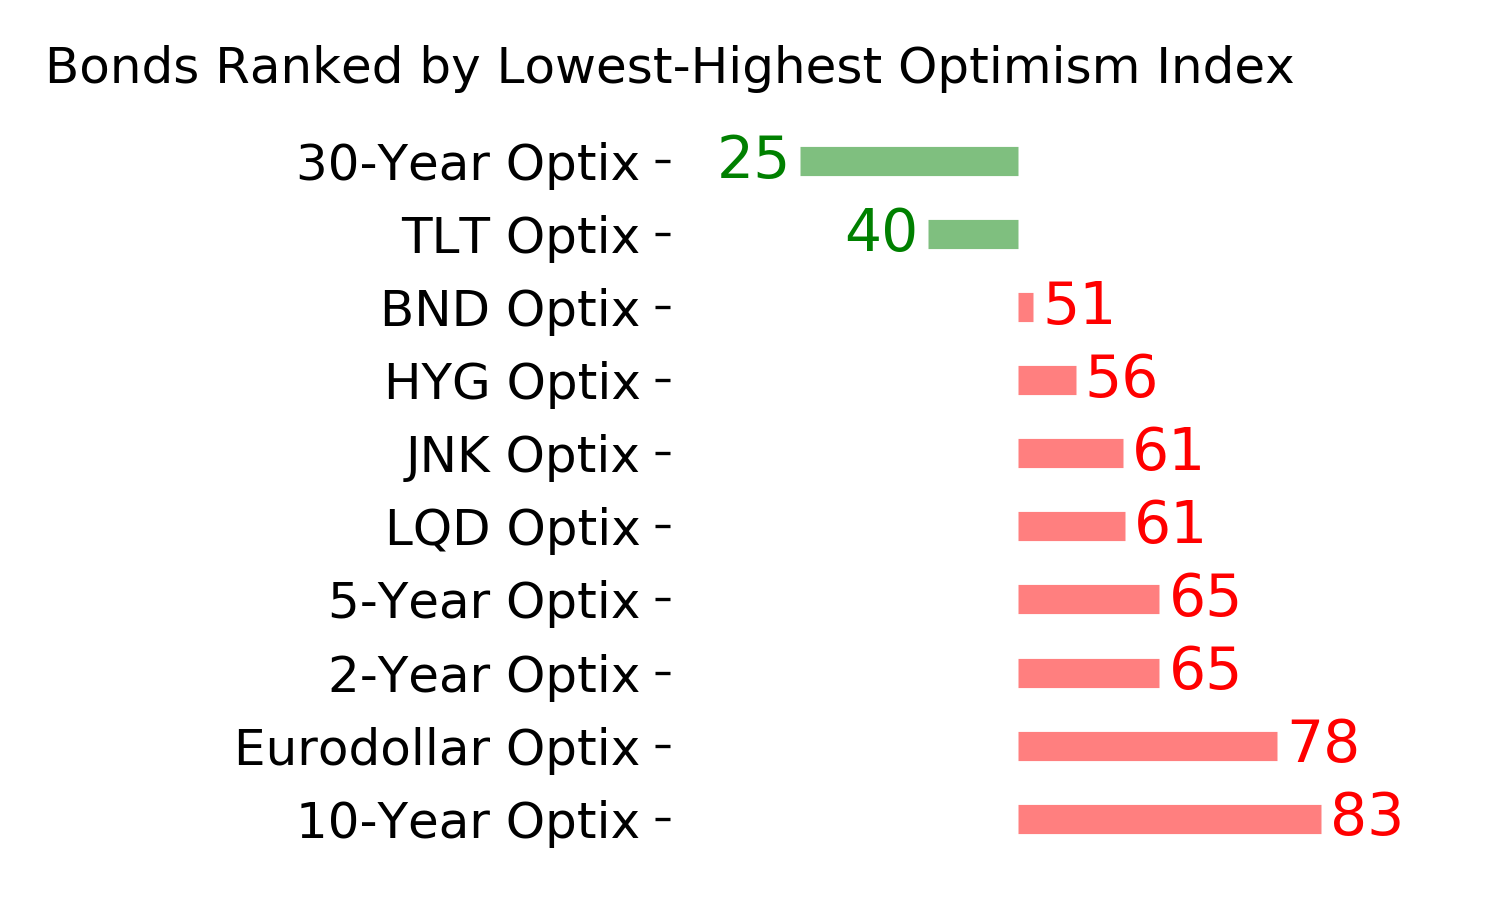
Optimism Index Thumbnails
|
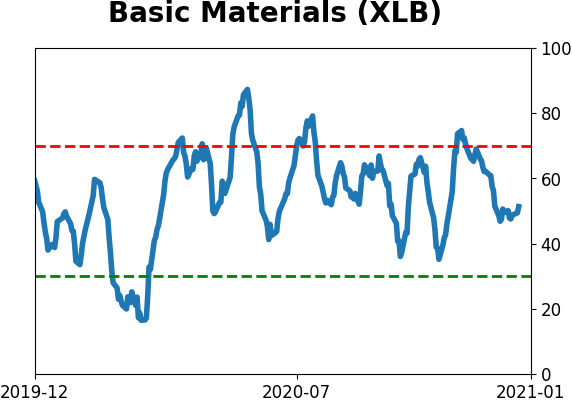
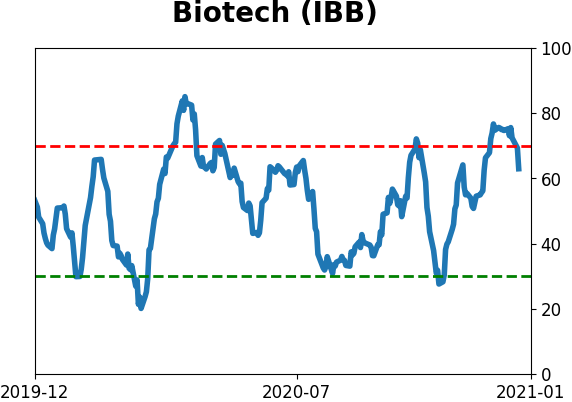
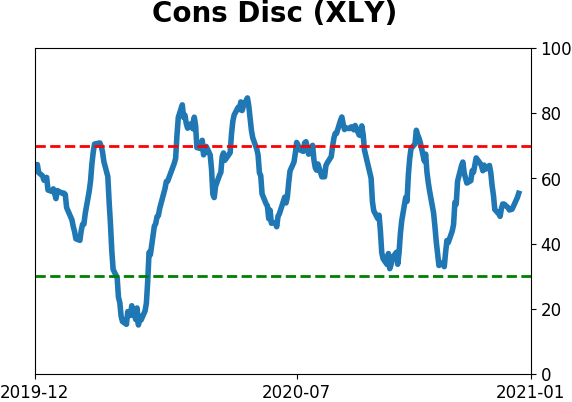
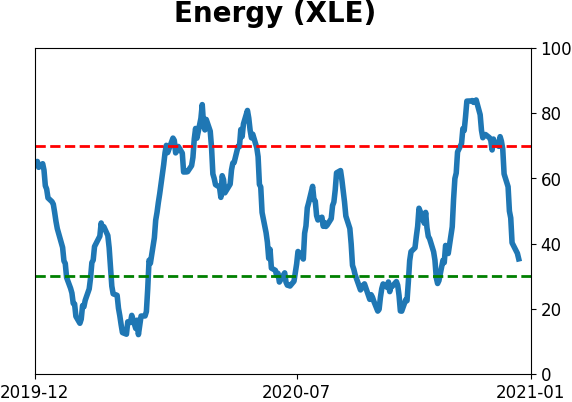
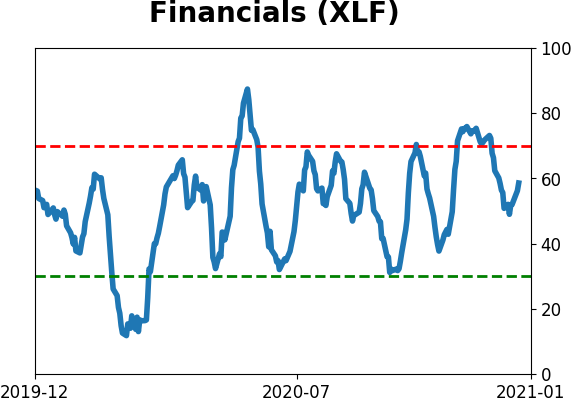
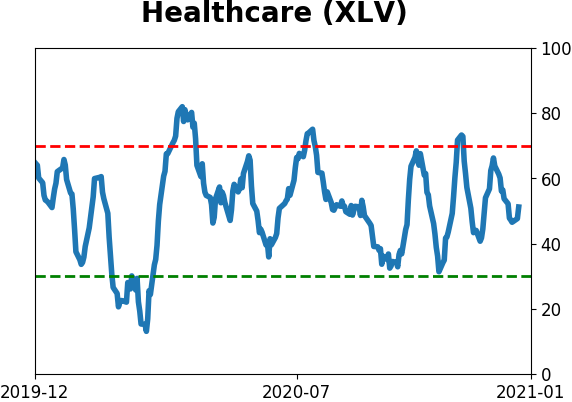
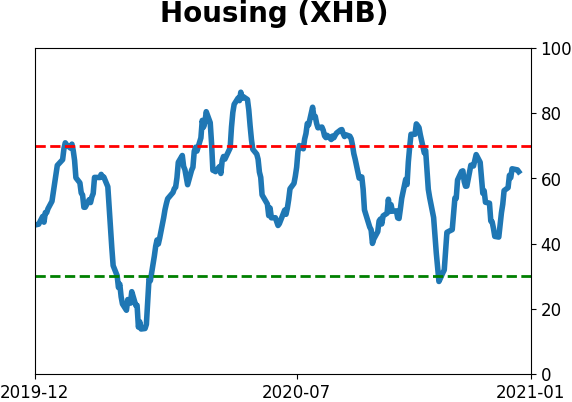
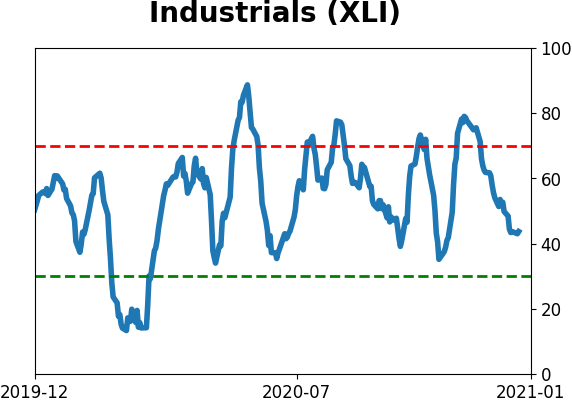
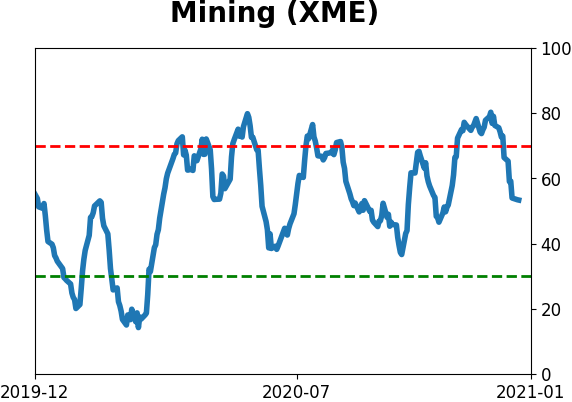
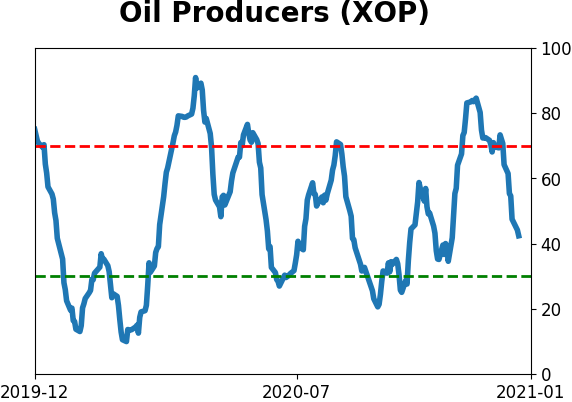
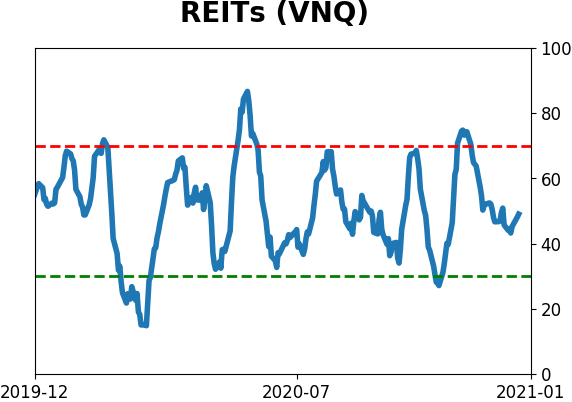
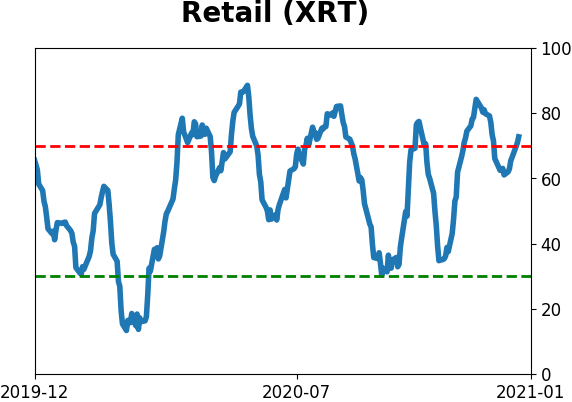
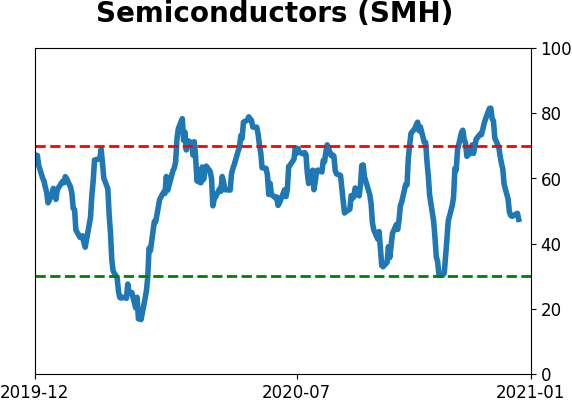
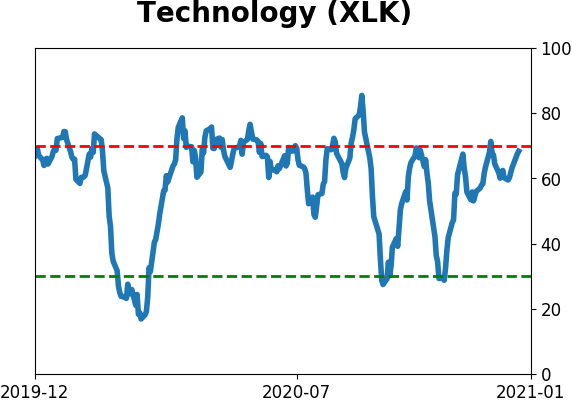
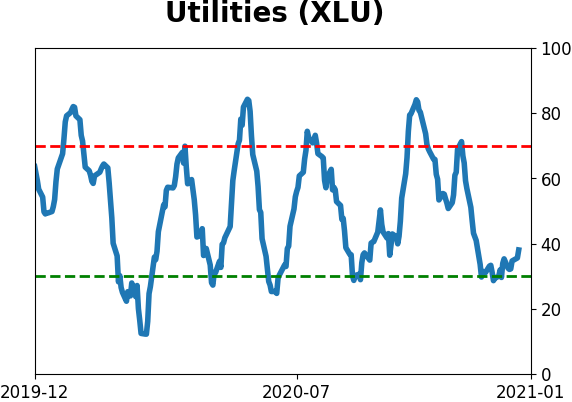
Sector ETF's - 10-Day Moving Average
|
|
|
Country ETF's - 10-Day Moving Average
|
|
|
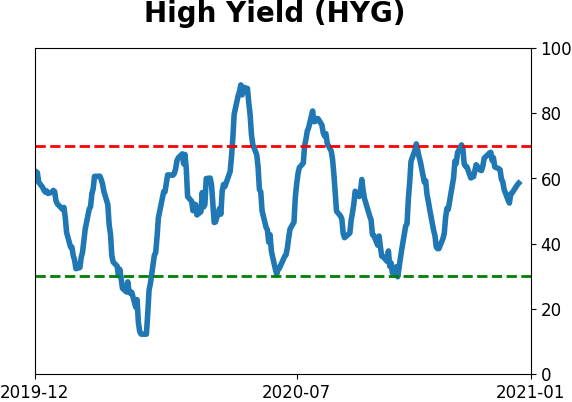
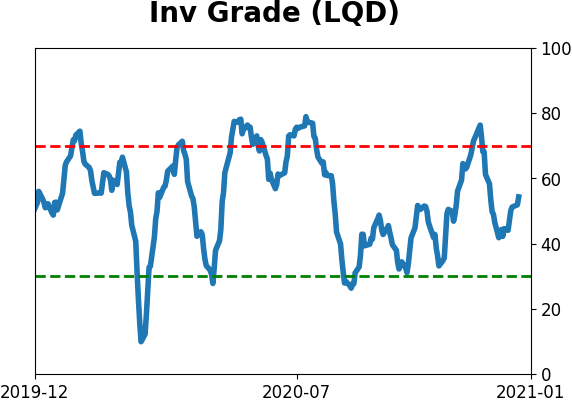
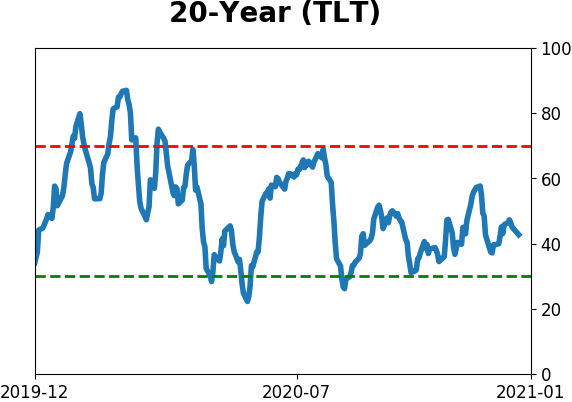
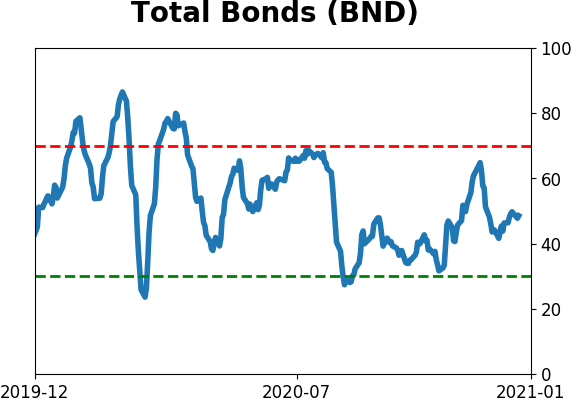
Bond ETF's - 10-Day Moving Average
|
|
|
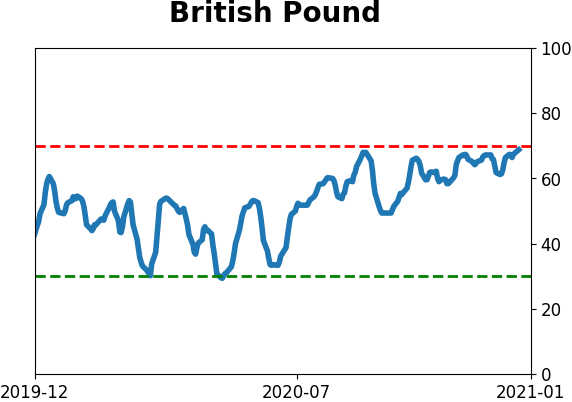
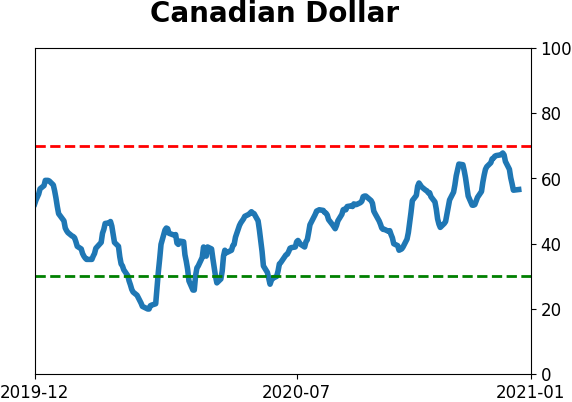
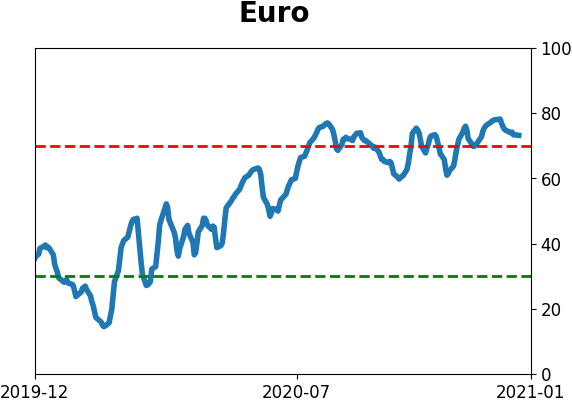
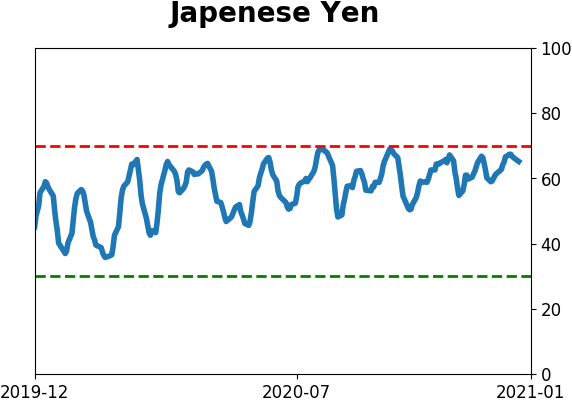
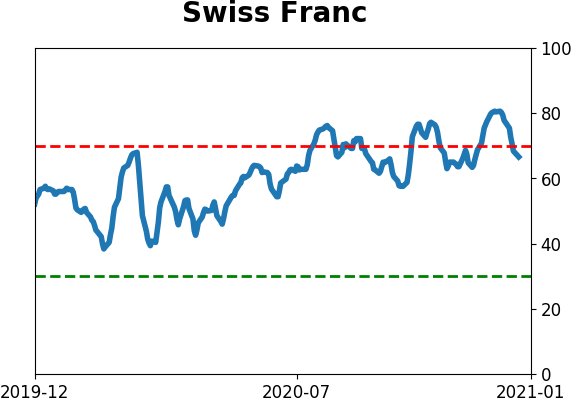
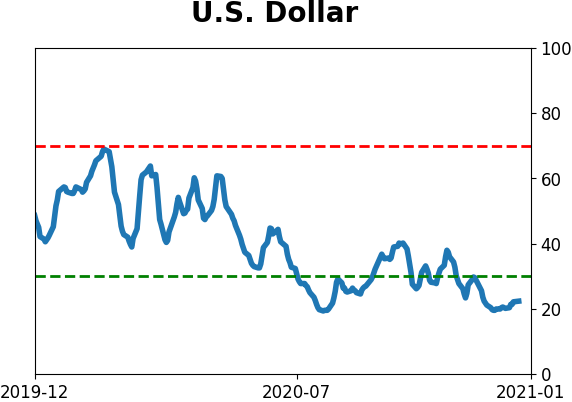
Currency ETF's - 5-Day Moving Average
|
|
|
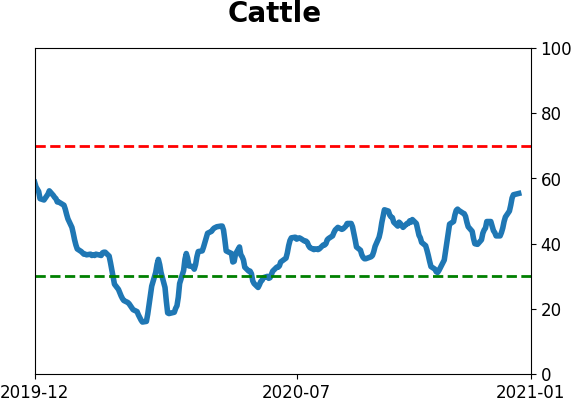
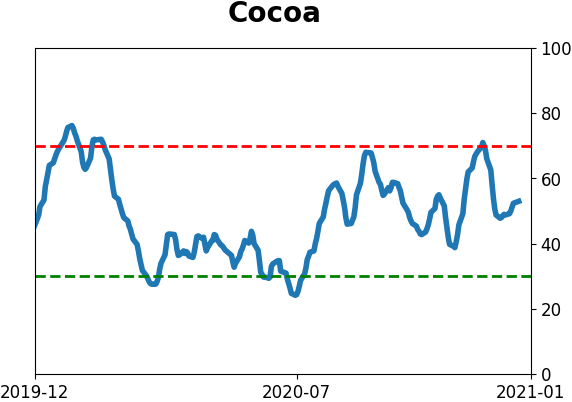
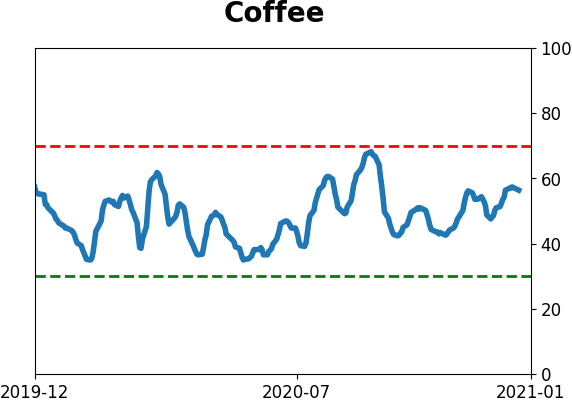
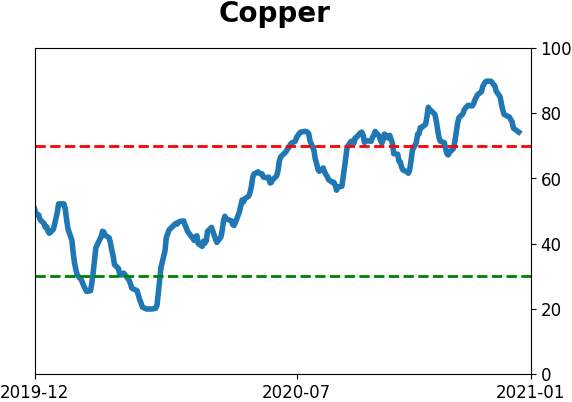
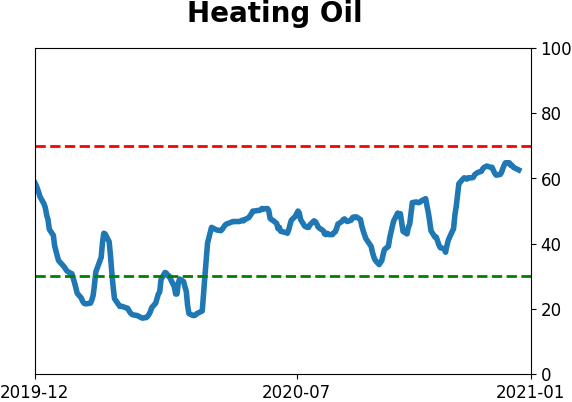
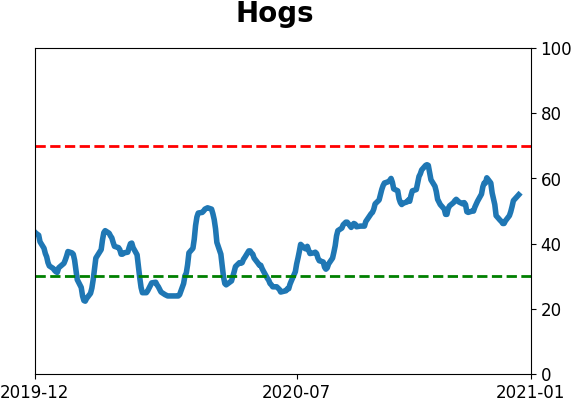
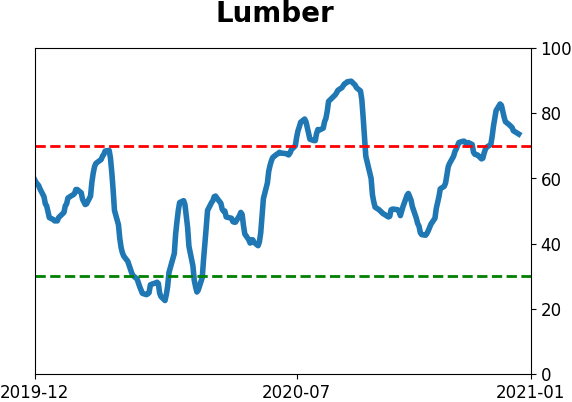
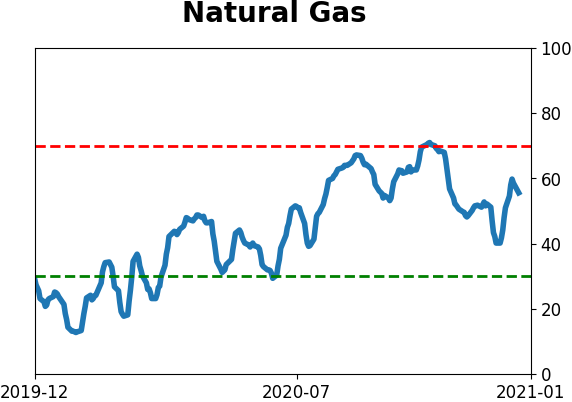
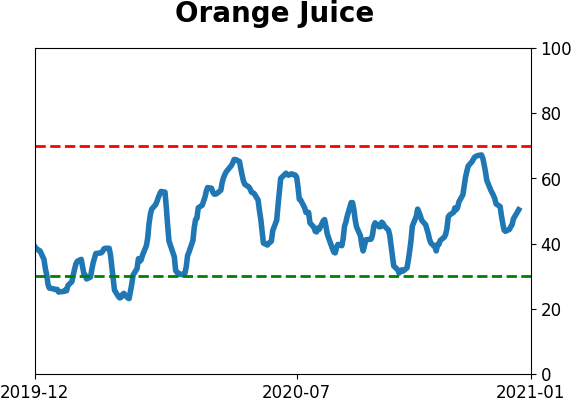
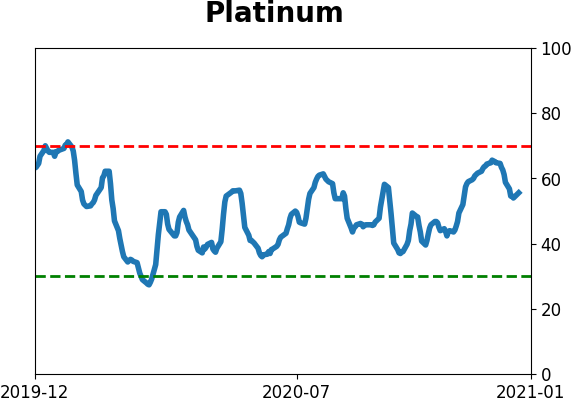
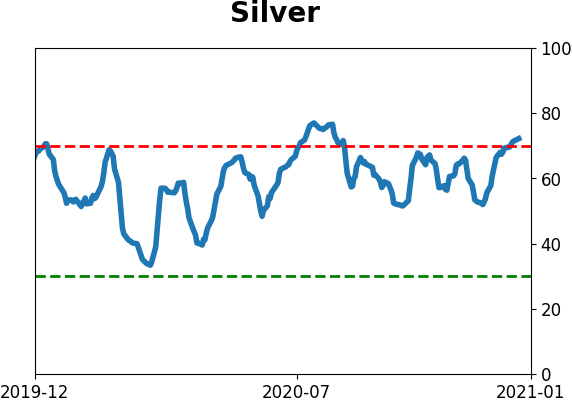
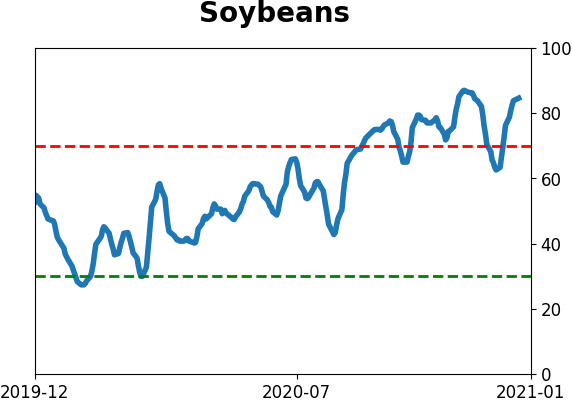
Commodity ETF's - 5-Day Moving Average
|
|