Data &
Technology
Research
Reports
Report Solutions
Reports Library
Actionable
Strategies
Free
Resources
Simple Backtest Calculator
Simple Seasonality Calculator
The Kelly Criterion Calculator
Sentiment Geo Map
Public Research Reports
Free Webinar
Pricing
Company
About
Meet Our Team
In the News
Testimonials
Client Success Stories
Contact
Log inLoginSign up
< BACK TO ALL REPORTS

Tech's streak is historic, beating every other sector by more than 5% this year

Jason Goepfert
2020-06-24
The Nasdaq is up 19 out of 22 days, among the best streaks ever. Through 120 trading days of 2020, the tech sector is beating every other major sector by more than 5%. Not too many years since 1928 have seen tech stocks beat everything else by this much. It is especially extreme against industrial and financial stocks, both of which showed a tendency to reassert themselves in the months ahead.

We just finished 120 trading sessions of 2020, and one pattern is clear. It's no surprise - tech rules the kingdom.

The Nasdaq Composite rallied 19 out of 22 days heading into Wednesday. That's a tie for the best streak in almost 25 years.

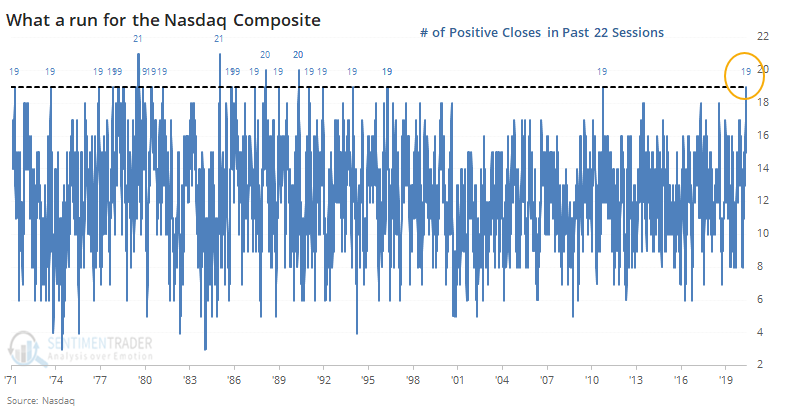
It also notched an all-time high for good measure. It hasn't enjoyed this kind of a run since the 1990s.

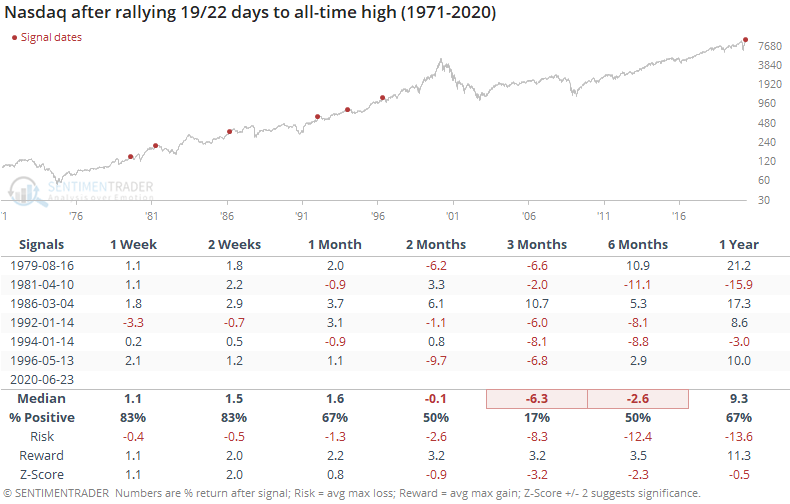
The only time the tech-heavy index managed to escape unscathed (for a while) from this kind of buying spurt was in March 1986. All the others showed lower prices over the next three months.

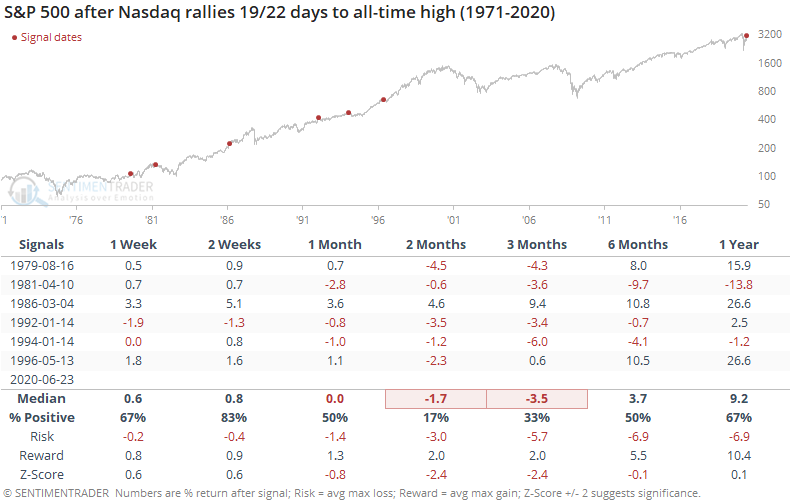
It was also negative for the S&P 500, with the losses occurring quicker than they did for the Nasdaq (a reflection of momentum persistency).

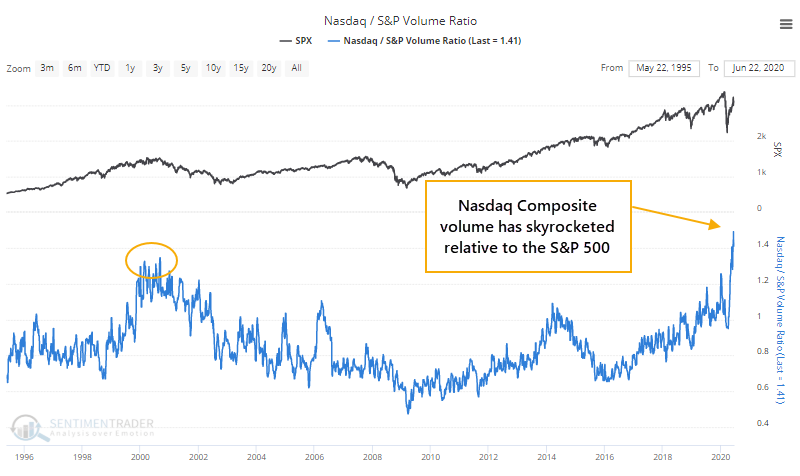
As Troy noted earlier, volume has been jumping in Nasdaq stocks relative to other parts of the market. The version we show on the site compares a 10-day average of Nasdaq Composite volume to S&P 500 volume. It just curled down from an all-time high.

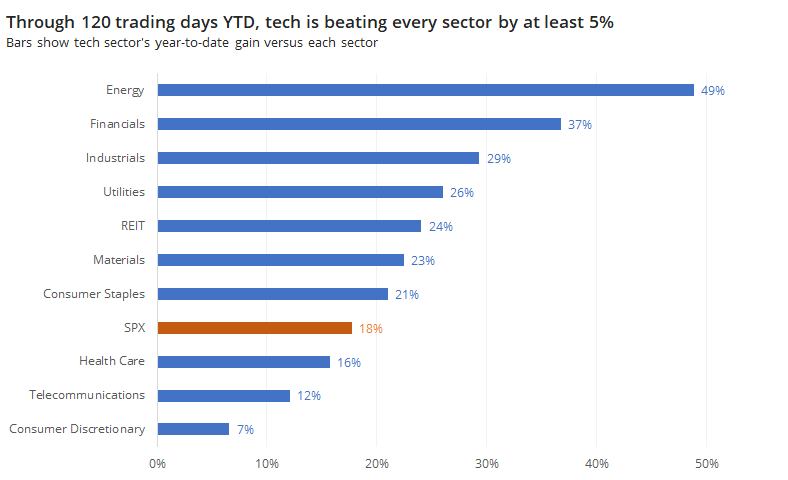
Year-to-date, the technology sector is beating every major sector by more than 5%. Its lead over energy is a whopping 49%, while the sector closest on its heels is consumer discretionary, and even that is lagging by 7%.

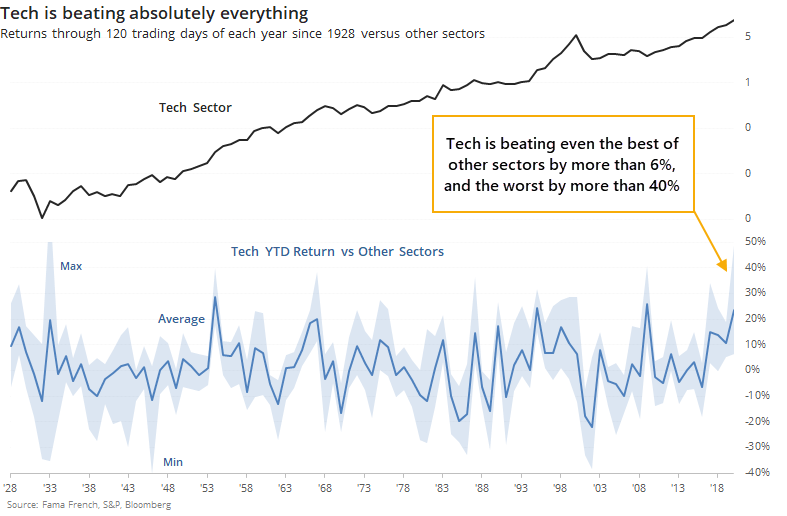
Going back to 1928, there haven't been too many years when tech has been such a winner.

The table below shows returns in the tech sector after every year since 1928 when the sector was beating all other sectors by at least 5% through 120 trading days of a year.

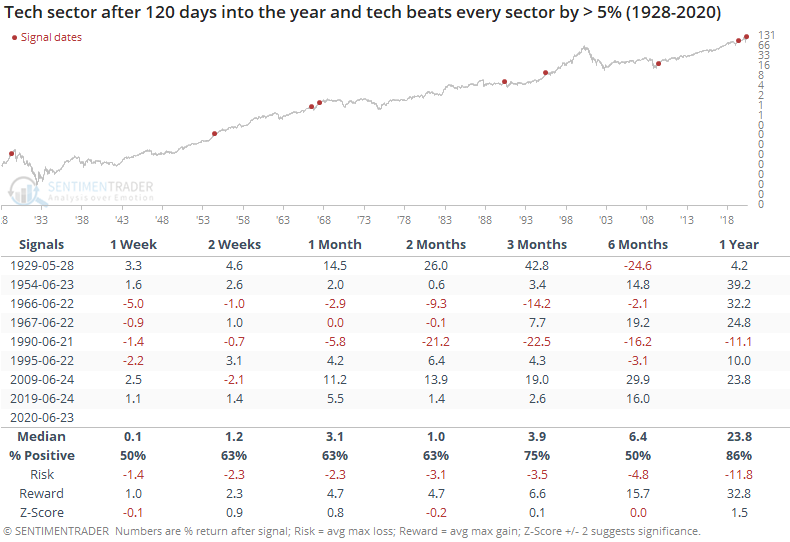
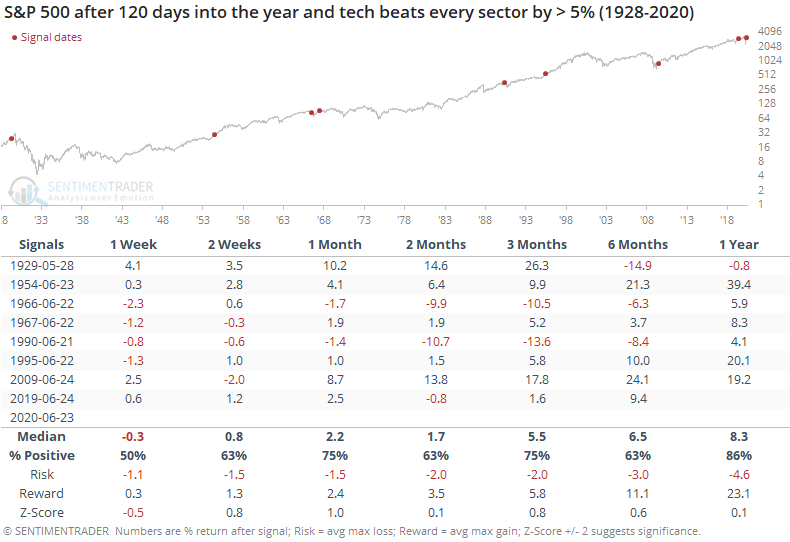
Returns weren't bad, but not great, either. Tech's returns were about in line with random across most time frames. For the S&P, it was about the same, but a bit more positive. 

Among sectors, this year's tech outperformance is especially notable against industrials, financials, and energy stocks. Tech's outperformance this year ranks as the most extreme, or nearly so, versus each of those sectors.

We already saw that its weight in the S&P is approaching 30-year extremes versus industrials and financials, and it's just as extreme when going back much further.

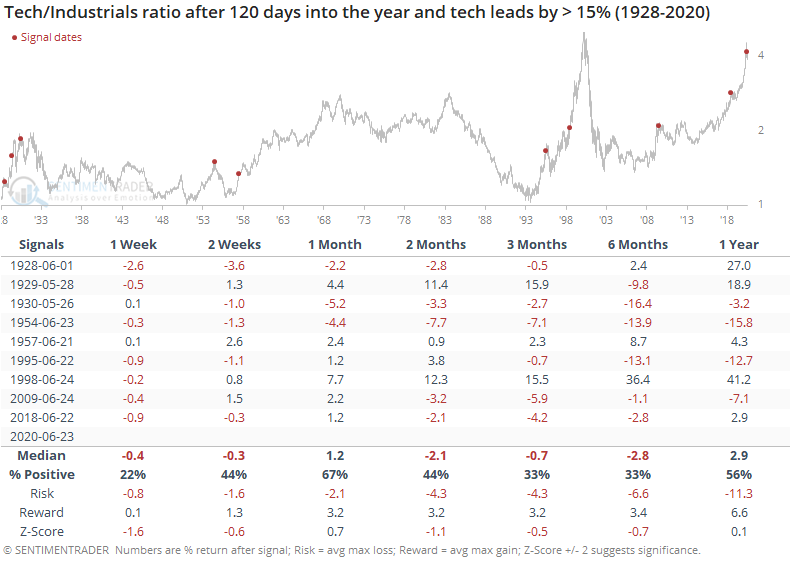
Tech is beating industrial stocks by more than 29% so far this year. Only 2009 saw a greater spread between the two, and that just barely. Other times tech beat this sector by more than 15% through the approximate half-way point of the year, it tended to relatively struggle over the next 3-6 months.

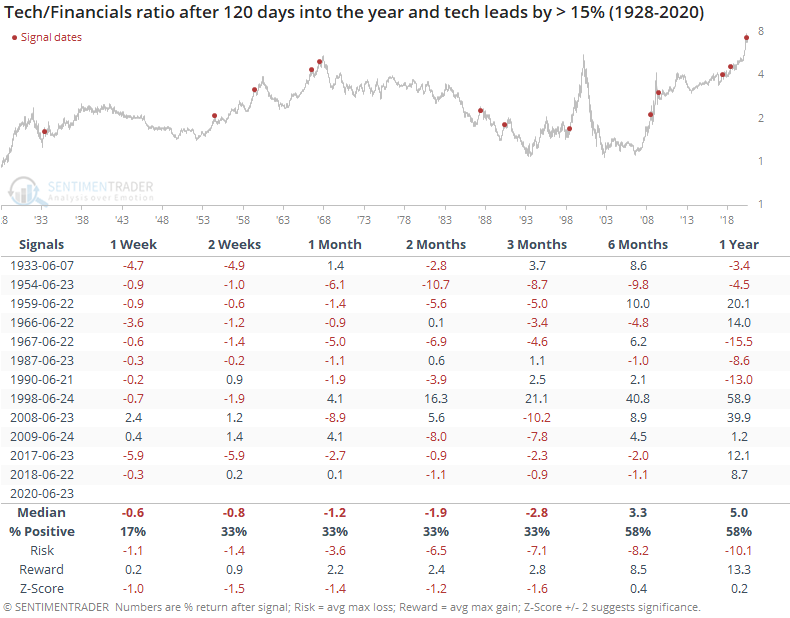
Tech is beating the financial sector by more than 36%, the most ever. The next most extreme outperformance through 120 days was 29% in 2009. Other times it was beating financial stocks by more than 15%, tech had a strong tendency to give back some relative performance.

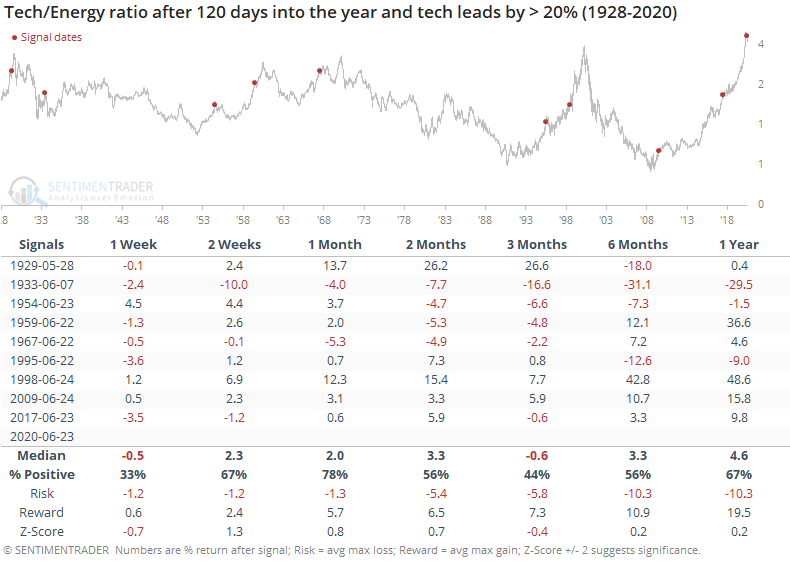
It's beating energy by more than 48%, also the most ever. The next most extreme was 34% in 2017. Those stocks had less of a tendency to rebound against tech, though.

Maybe there is a signal in the fact that only the first half of 2009 saw technology stocks lead other sectors by this much, in particular industrials and financials. Even then, and supported by lesser extremes, tech stocks started to become exhausted versus the other sectors.

It's a suggestion that while excuses could be made why 2020 is different, historically tech stocks have started to give back some relative performance against more meat-and-potatoes sectors after leading by this much through this part of the year.

Sorry, you don't have access to this report

Upgrade your subscription plan to get access
Go to Dasboard
DATA &
TECHnologies
IndicatorEdge
‍
BackTestEdge
‍
Other Tools
‍
DataEdge API
RESEARCH
reports
Research Solution
‍
Reports Library
‍
actionable
Strategies
Trading Strategies
‍
Smart Stock Scanner
‍
FREE
RESOUrCES
Simple Backtest
Calculator
Simple Seasonality
Calculator
The Kelly Criterion
Calculator
Sentiment Geo Map
‍
Public Research Reports
‍
Free Webinar
COMPANY
‍
About
‍
Meet our Team
‍
In the News
‍
Testimonials
‍
Client Success Stories
Pricing
Bundle pricing
‍
Announcements
‍
FAQ
© 2024 Sundial Capital Research Inc. All rights reserved.
Setsail Marketing
TermsPrivacyAffiliate Program
Risk Disclosure: Futures and forex trading contains substantial risk and is not for every investor. An investor could potentially lose all or more than the initial investment. Risk capital is money that can be lost without jeopardizing ones’ financial security or life style. Only risk capital should be used for trading and only those with sufficient risk capital should consider trading. Past performance is not necessarily indicative of future results.

Hypothetical Performance Disclosure: Hypothetical performance results have many inherent limitations, some of which are described below. No representation is being made that any account will or is likely to achieve profits or losses similar to those shown; in fact, there are frequently sharp differences between hypothetical performance results and the actual results subsequently achieved by any particular trading program. One of the limitations of hypothetical performance results is that they are generally prepared with the benefit of hindsight. In addition, hypothetical trading does not involve financial risk, and no hypothetical trading record can completely account for the impact of financial risk of actual trading. for example, the ability to withstand losses or to adhere to a particular trading program in spite of trading losses are material points which can also adversely affect actual trading results. There are numerous other factors related to the markets in general or to the implementation of any specific trading program which cannot be fully accounted for in the preparation of hypothetical performance results and all which can adversely affect trading results.

Testimonial Disclosure: Testimonials appearing on this website may not be representative of other clients or customers and is not a guarantee of future performance or success.