Headlines
|
|
Weekly Wrap for Dec 24 - Oversold Nasdaq stocks, positive analogs, biotech pessimism is easing:
This week, we saw some signs of deep selling pressure among stocks traded on the Nasdaq. That occurred even while there was a surge in Consumer Staples. This year has a handful of close analogs, most of which led to more gains in the new year. Biotech pessimism is finally easing.
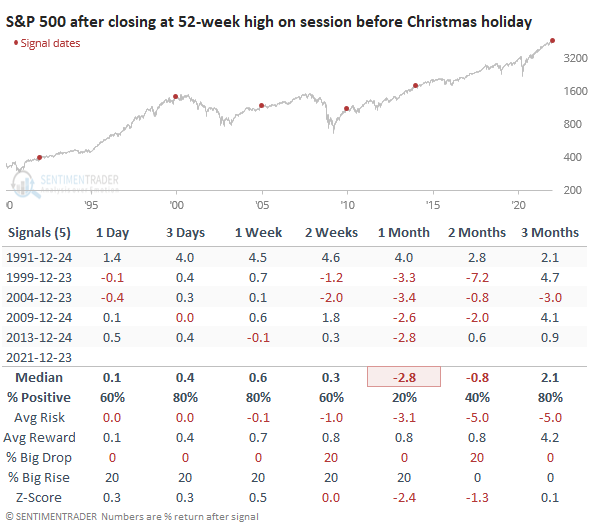
A Merry Christmas for index investors: Today marked only the 6th time in the S&P 500's history that it closed at a 52-week high on the session before the Christmas holiday. Investors were usually rewarded even further heading into the new year, but the rest of January was a struggle 4 out of 5 times. A very Merry Christmas to those celebrating!
Bottom Line:
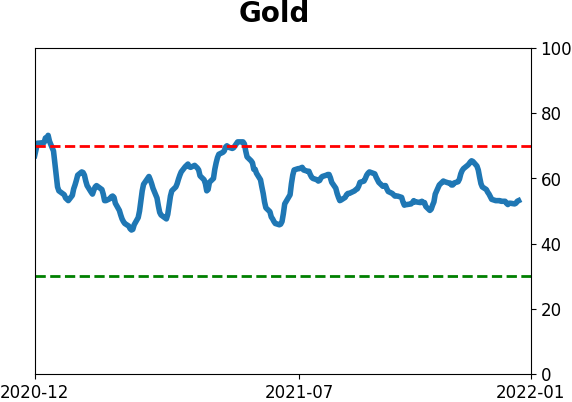
STOCKS: Hold Sentiment hit a pessimistic extreme by early December and then buyers showed enough interest to trigger a thrust in breadth. Those are reliable precursors to higher prices. There is a lot of disagreement among sectors, though, with negative divergences in tech but impressive participation in sectors like consumer staples. We should work higher but it's a bifurcated market. BONDS: Hold Despite mostly steady prices, investors turned pessimistic on bonds to a nearly decade-high degree by late November. Sentiment has recovered since then, which has been a mostly positive sign over the past 20 years, but not necessarily prior to then. GOLD: Hold
Gold and miners were rejected after trying to recover above their 200-day averages in May. Some oversold extremes in breadth measures among miners triggered in late September, and they rebounded strongly then gave those gains back. Still not much of an apparent edge here.
|
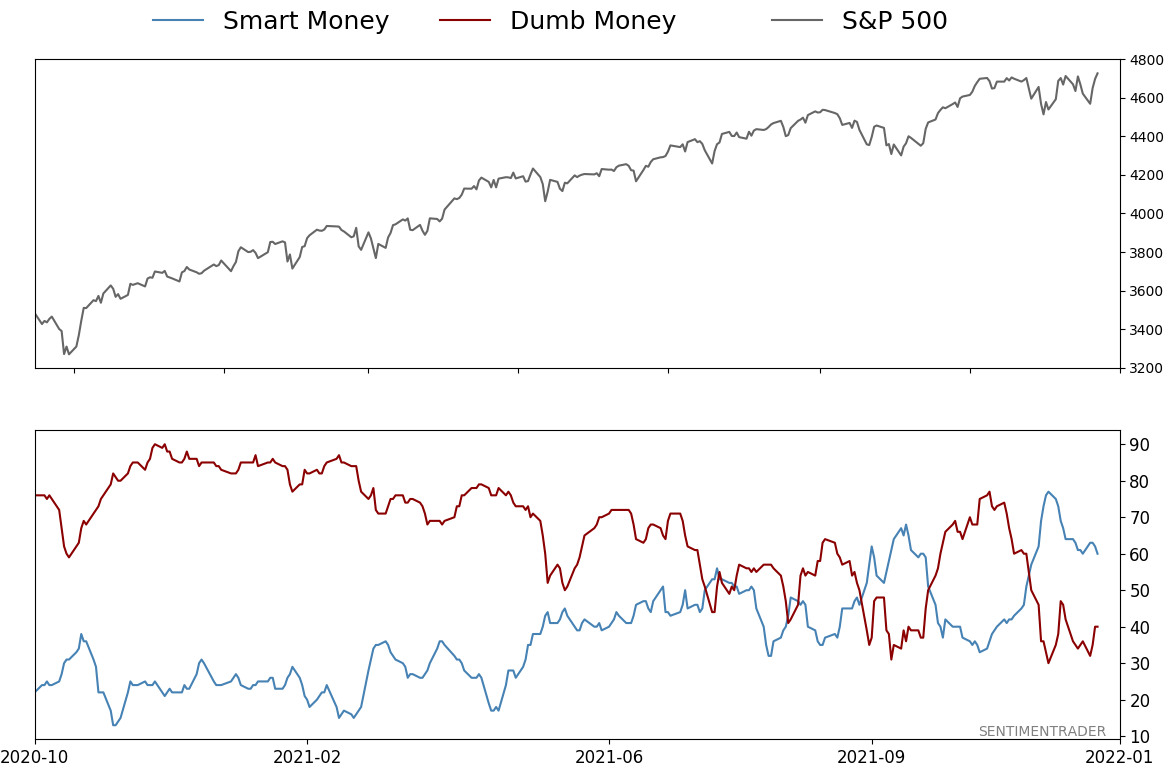
Smart / Dumb Money Confidence
|
Smart Money Confidence: 60%
Dumb Money Confidence: 40%
|
|
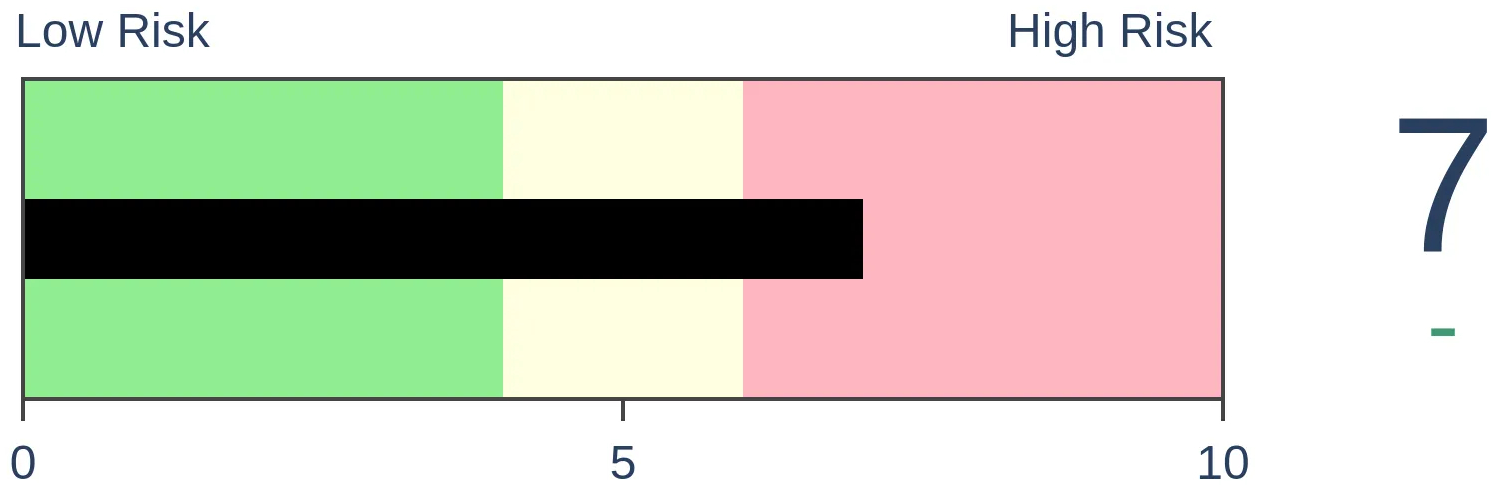
Risk Levels
Stocks Short-Term
|
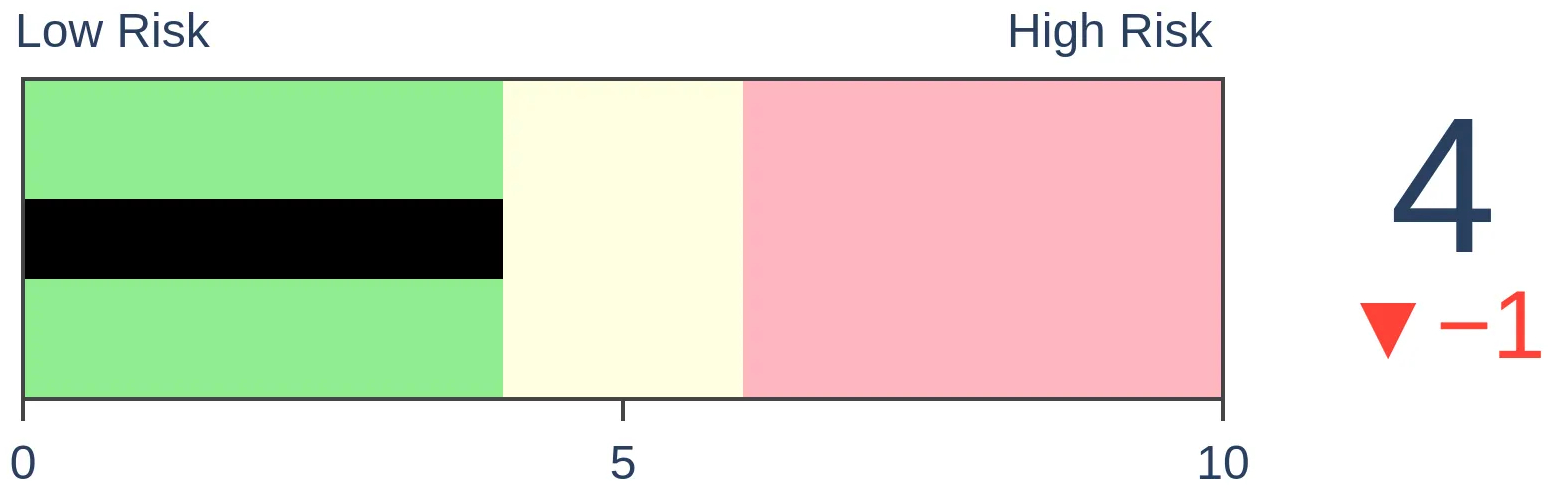
Stocks Medium-Term

|
|
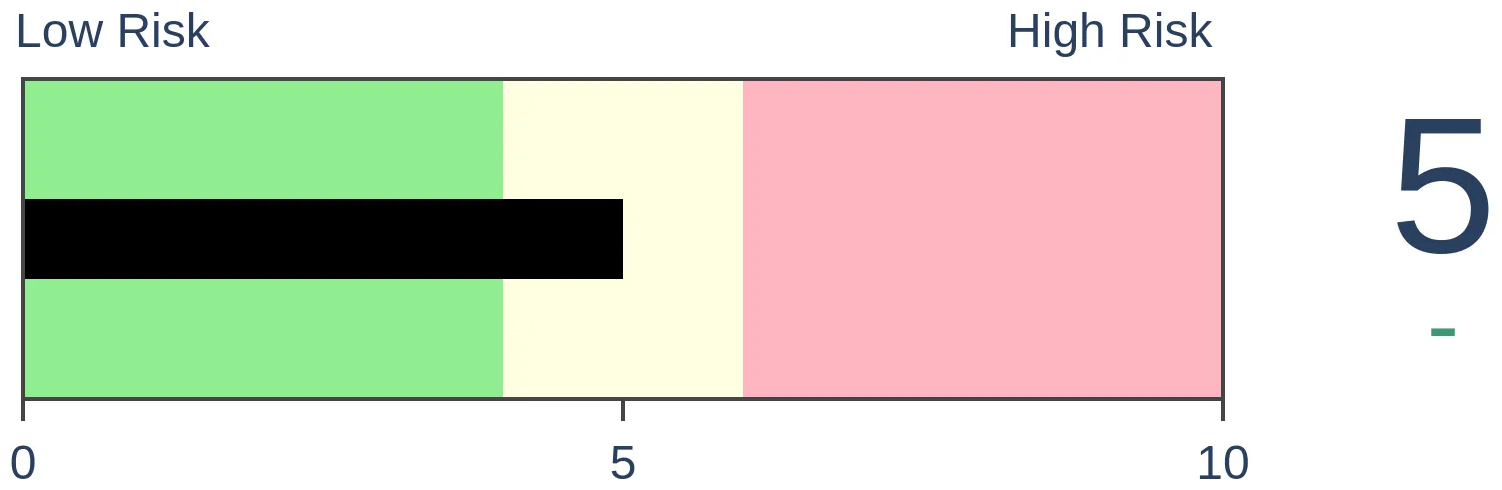
Bonds
|
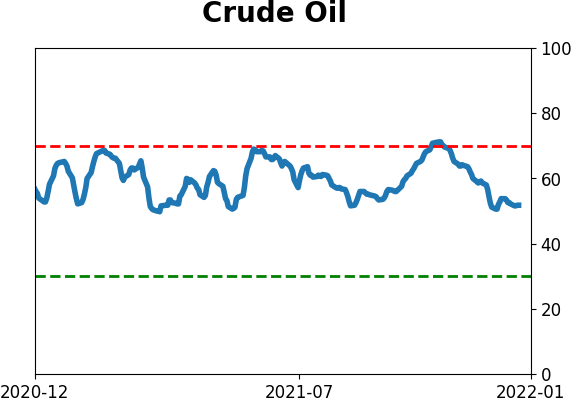
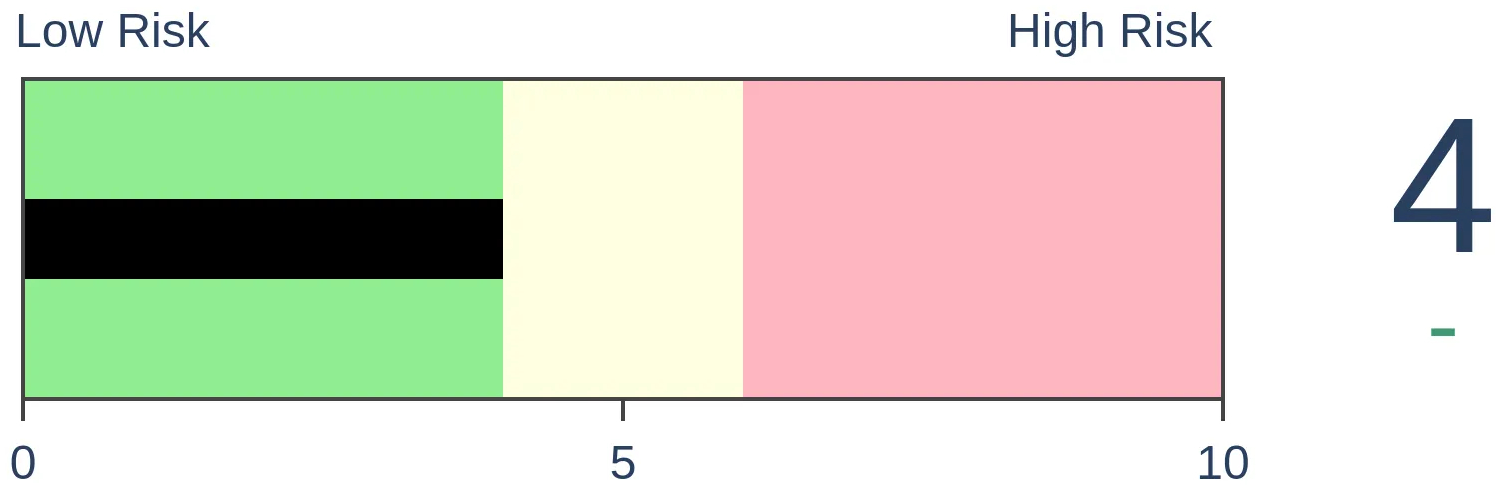
Crude Oil

|
|
Gold
|
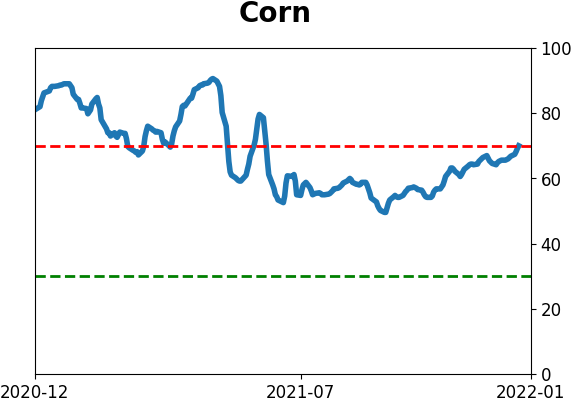
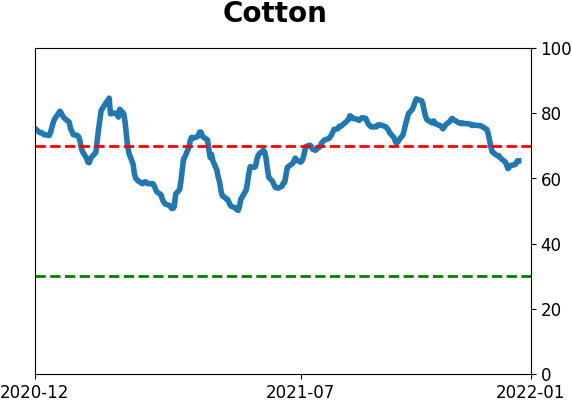
Agriculture
|
|
Research
By Jason Goepfert
BOTTOM LINE
This week, we saw some signs of deep selling pressure among stocks traded on the Nasdaq. That occurred even while there was a surge in Consumer Staples. This year has a handful of close analogs, most of which led to more gains in the new year. Biotech pessimism is finally easing.
FORECAST / TIMEFRAME
None
|
Key points:
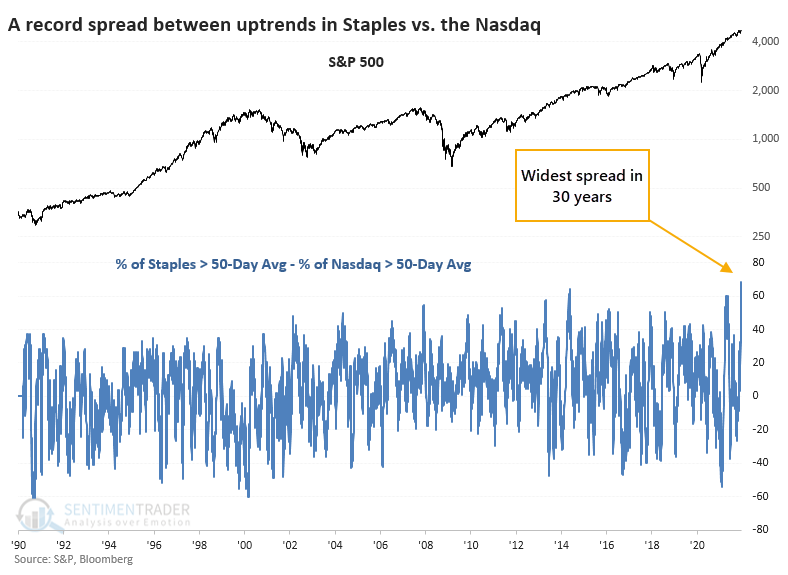
- There is a record spread in medium-term uptrends in Consumer Staples vs. the Nasdaq
- On the Nasdaq, the percentage of 52-week lows reached an extreme earlier this week
- This year has a very high correlation to 1995, and similar years preceded more gains
- A simple switching strategy between the S&P 500 and Emerging Markets continues to favor the former
- Biotech pessimism is finally easing
Tech's participation problem
We've already seen that internal trends have been powerful in defensive sectors like Consumer Staples but curiously weak in higher-beta areas like the Nasdaq 100. It's even more fragile in the broader measures that look at the entire Nasdaq exchange.
The percentage of Staples stocks trading above their 50-day moving averages reached 90% last week, while fewer than 25% of stocks on the Nasdaq managed to hold their medium-term trends.
That's the widest spread in trends between the two groups in at least 30 years.
It wasn't very successful if we took this as a warning sign for the broader market. While the S&P's shorter-term returns were nothing special, its performance was well above random over the next 3-12 months. Over the next year, it showed a positive return 12 out of 13 times. But that loser in 2000 was a major one as it effectively marked the peak of the bubble.
While it's tempting to conclude that this kind of behavior signals a change in fortunes between the two groups, it didn't work out that way most of the time. Staples showed a consistent tendency to underperform the Nasdaq Composite in the months ahead.
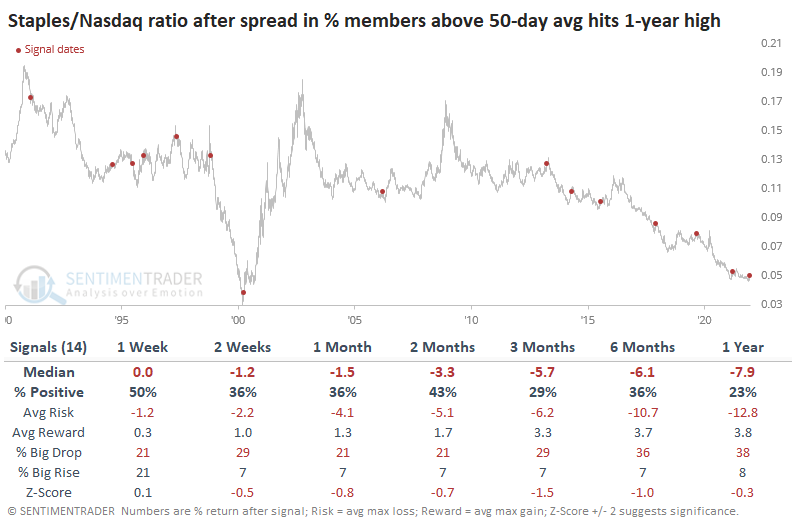
There were three significant exceptions to this. In 2000, Staples continued to outperform the Nasdaq across every time frame. Same for 2015. In 2006, Staples took a quick relative dive, then rebounded strongly.
There is a historic spread between stocks enjoying medium-term uptrends in Consumer Staples versus those traded on the Nasdaq exchange. This shows a temporary bout of risk-off behavior among investors, but historically it's been rare to see this persist for much longer. It has not consistently indicated that a major change in trend has occurred, but if Staples continue to outperform in the weeks ahead, that probability will increase.
3 stumbles following a FOMC decision
Dean noted that after a significant FOMC decision day stock surge, the hawkish pivot by the fed settled in, and traders sold stocks, with the S&P 500 suffering 3 consecutive negative days of 0.75% or more.
This signal has triggered 22 other times over the past 31 years. After the others, future returns and win rates were solid across all time frames. The 3-12 month periods show excellent risk-reward profiles. And, the 6-12 month windows are riding a 13 signal winning streak.
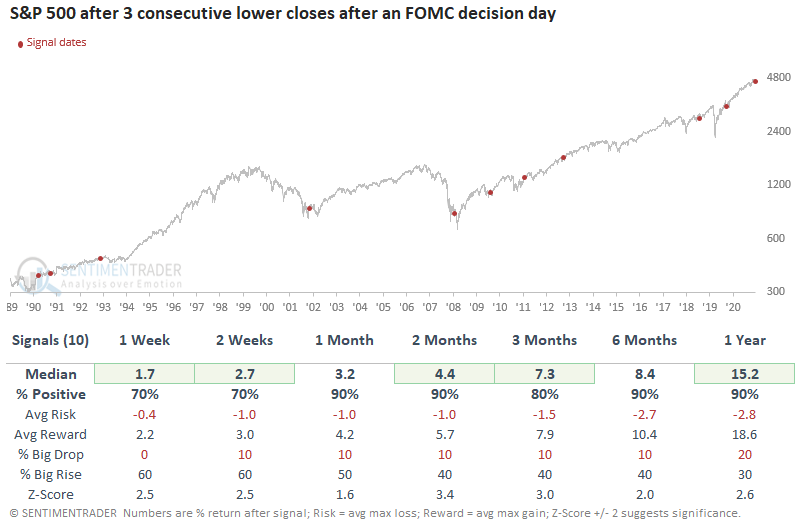
With the S&P 500 down 0.87%, 1.03%, and 1.14% respectively on Thursday, Friday, and Monday, let's isolate historical instances when the S&P 500 closes down 0.5% or more for three consecutive days post a decision day. This signal triggered 5 other times over the past 22 years. After the others, future returns and win rates were excellent across all time frames.
Context is always essential when assessing historical patterns. So, let's evaluate the outlook for the 3 consecutive down days after an FOMC decision day signal when Federal Reserve policy is easy or tight. If the Fed funds interest rate count is greater than 0, the policy is considered tight. Conversely, if the count is below 0, the policy is deemed to be easy. As it stands now, Fed policy remains easy even though the Fed has signaled that they would like to move to a less friendly stance.
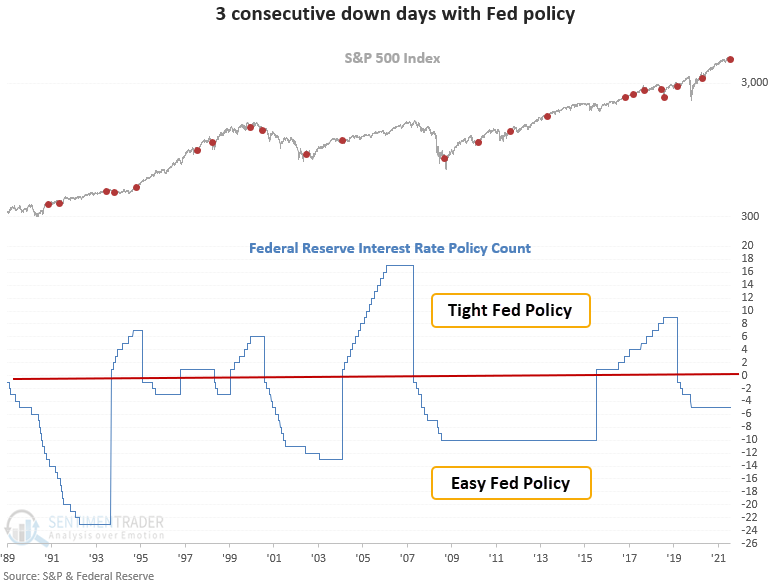
This signal triggered 10 other times over the past 31 years. After the others, future returns and win rates were excellent across all time frames, with several significant z-scores-Fed policy matters.
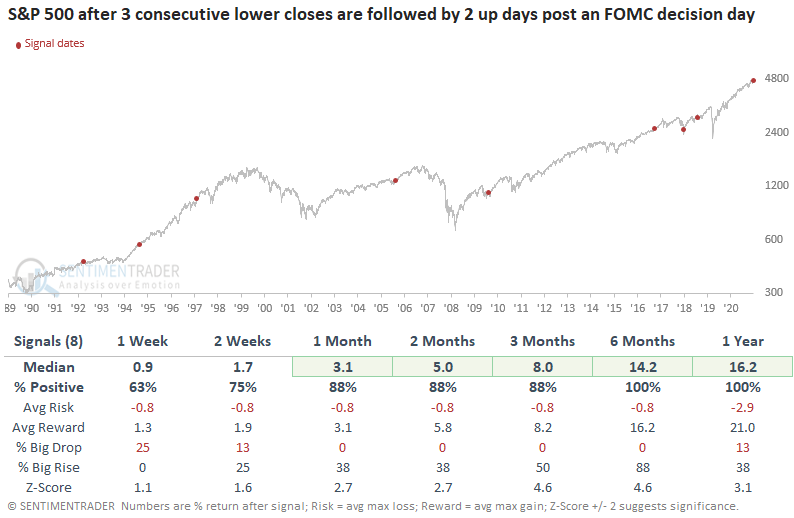
Dean subsequently assessed the outlook for the S&P 500 when the index closes down for 3 consecutive days post an FOMC decision day and then rallies on successive days.
This signal triggered 8 other times over the past 29 years. After the others, future returns and win rates were solid across all time frames. The 1-12 month periods show excellent risk-reward profiles. And, 6-12 months later, the S&P 500 shows a 100% win rate.
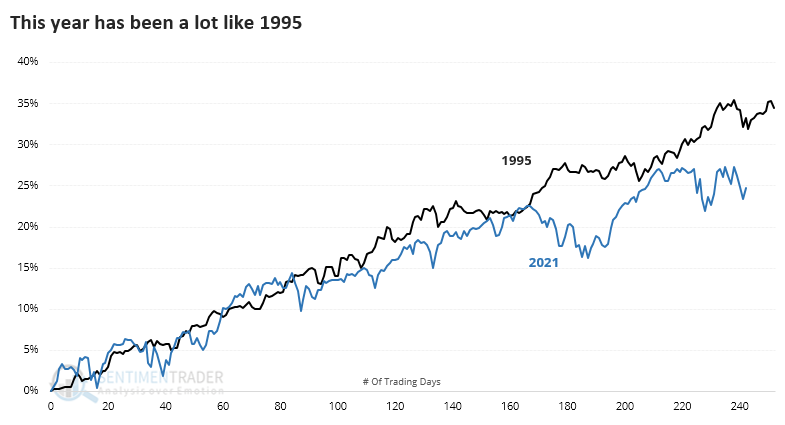
Just like 1995...
This year has been a lot like 1995. It has been more like that year than any other, at least in terms of performance. In August, we looked at some of the records being set this year during one of the most persistent and consistent rallies of all time. The one year that was consistent with pretty much all of the momentum studies we've looked at this year is 1995.
That year rallied strongly in September while this year stumbled. Otherwise, they followed each other closely, even including some December weakness.
We're most concerned about what these high correlations might mean going forward. Based on those precedents, the answer is positive, at least in the couple of weeks heading into and immediately after the New Year. Over the next 2 weeks, the S&P rallied 15 out of 18 times, and 2 of those saw the losses erased soon after.
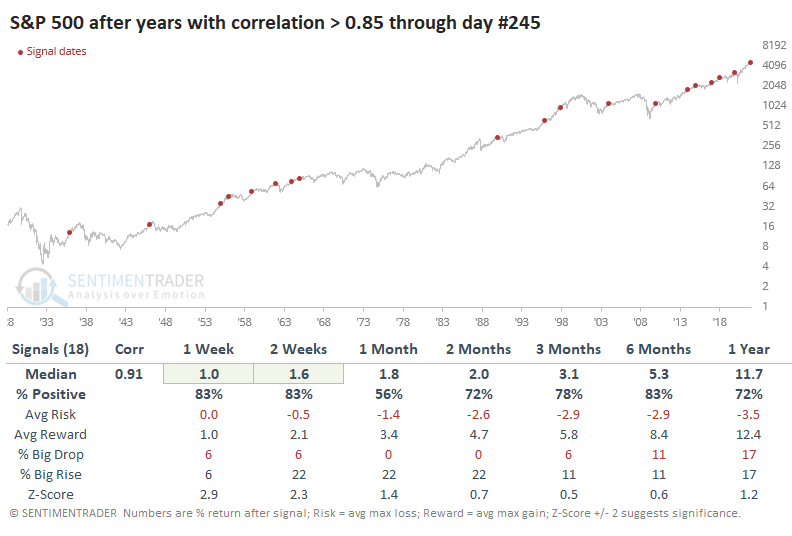
The Risk/Reward Table shows that risk, meaning the maximum drawdown at any point up to that time frame, was limited. Over the next 3 months, only 3 of the signals showed a loss of more than 5% at any point (though 2020 was a doozy).
New lows on the Nasdaq reach an extreme
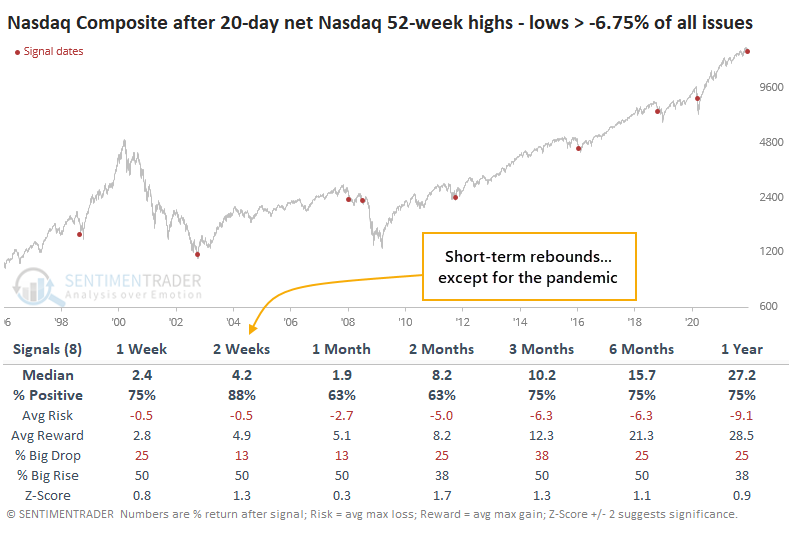
Among stocks traded on the Nasdaq exchange, there has been significant damage. More than 8% of stocks traded there recently plunged to 52-week lows, while fewer than 1% have scored 52-week highs.
Over the past 20 days, the spread between new highs and new lows has dropped to -7% of all issues. Fewer than 3% of days have recorded a lower reading than what we see now.
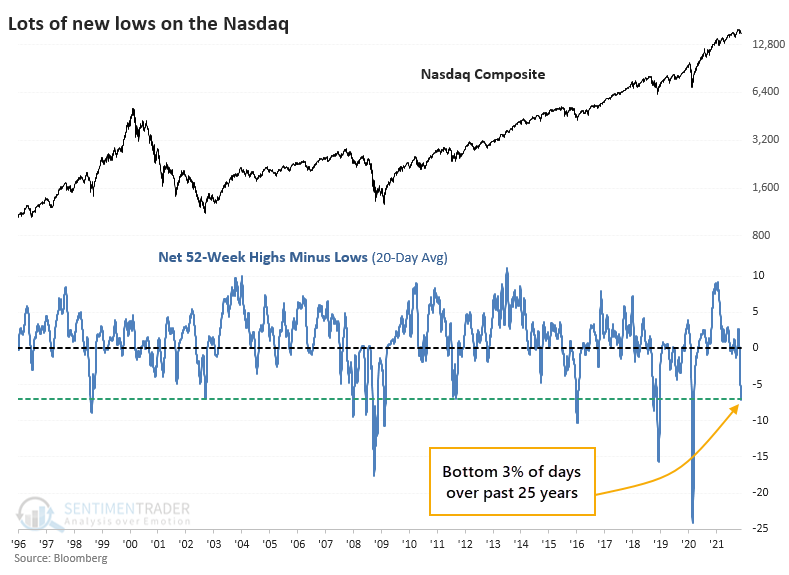
By the time the net percentage of stocks at highs minus lows exceeded 6.75% of all issues on the Nasdaq, most of the selling tended to be absorbed. However, this was not a low-risk buy signal as it preceded massive losses (after a quick rebound) during the Great Financial Crisis, and it was painfully early in 2018 and 2020. Even so, 7 out of the 8 signals showed a gain over the next couple of weeks.
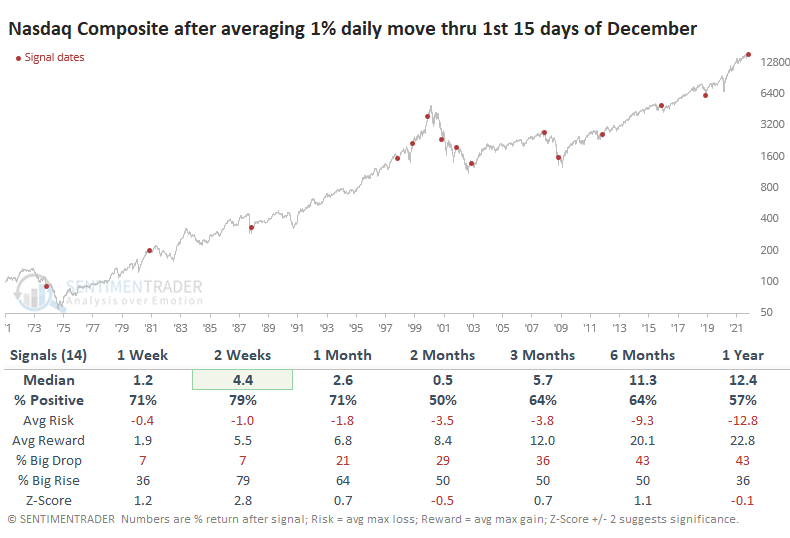
Investors holding stocks on the Nasdaq have suffered one of the most volatile Decembers ever. Through the first 15 days of the month, the Composite has swung an average of more than 1.3% per day, the 8th most-volatile December in the index's history.
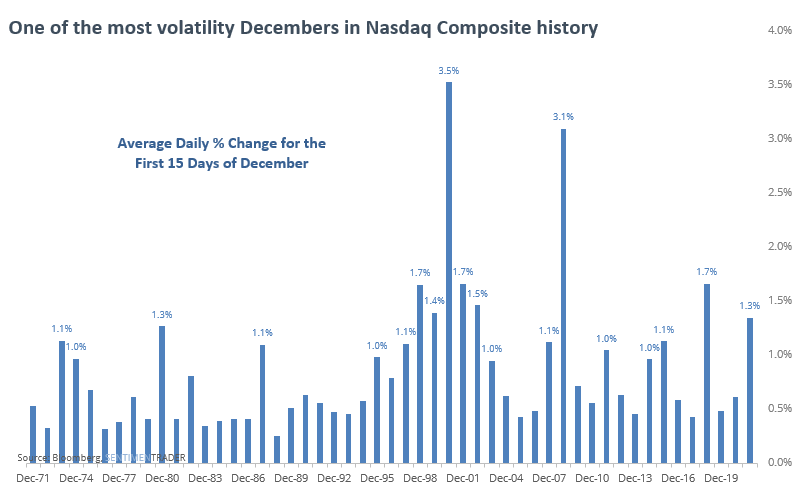
After other Decembers that swung an average of 1% or more through the first 15 days, the next couple of weeks tended to be strong.
Don't give up on Santa just yet
Jay showed that it's still too early to give up on the positive seasonal bias in stocks.
For our test, we will sort of mash these two together and look at the results for holding the S&P 500 Index for nine trading days, comprised of the last seven trading days of the calendar year and the first two days of the following year. The 2021-2022 period involves buying an S&P 500 Index fund at the close on 12/21 and selling at the close on 1/5/2022.
The chart below displays the growth of $1 invested in the S&P 500 Index each year ONLY during the nine days identified above, starting in December 1928.
When we look at returns for the individual years, we can see that losses were rare, and large losses were almost unheard of.
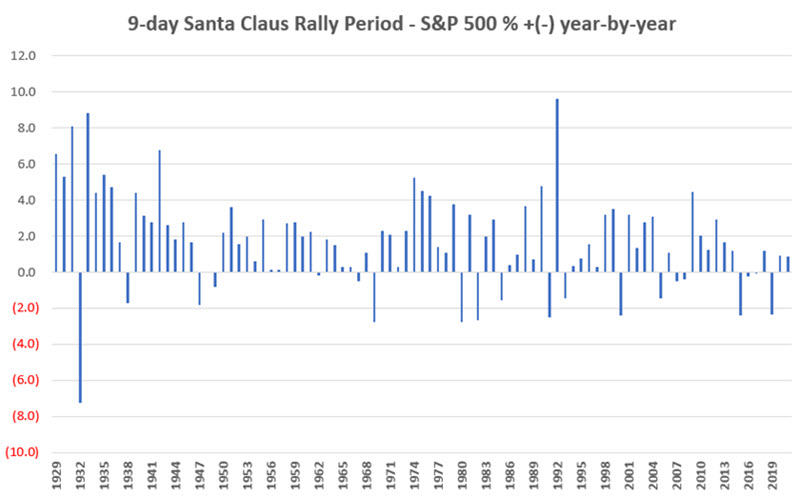
Over the past 92 years, 72 of them showed a gain, with a median gain well above the median loss.
Too early to switch into Emerging Markets
Jay looked at a trend-following method for switching between emerging markets and the S&P 500.
For testing purposes, we will use actual index data weekly. We will use the MSCI Emerging Markets Index (EM) and the S&P 500 Index (SPX). Please note that the ETFs used in the charts above are designed to track these specific indexes. So, a trader without access to index data can use EEM and SPY as a proxy.
The chart below displays the fluctuations in the relationship between EM and SPX since the late 1980s.
The chart below adds the 39-week exponential moving average to designate the overall trend as rising objectively (favoring EM) or falling (favoring SPX). The chart below shows the difference between the ratio and its moving average.
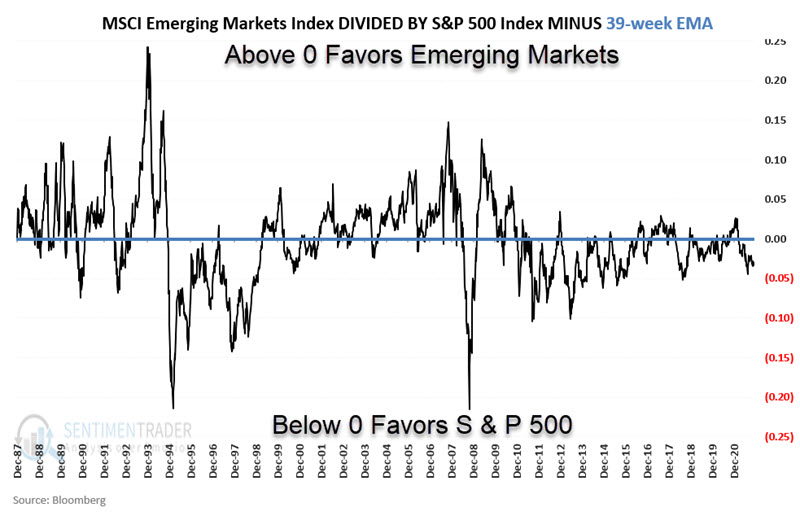
For the next test, we will:
- Hold EM if the relative strength line is above its 39-week EMA
- Hold SPX if the relative strength line is below its 39-week EMA
We will refer to this as the "Switching" strategy.
As a baseline, we will also split money evenly between the two indexes and rebalance to a 50/50 split each year's first Friday. We will refer to this as the "Buy/Hold/Rebalance" strategy.
The chart below displays the growth of $1 invested using the Switching strategy versus $1 in the Buy/Hold/Rebalance strategy.
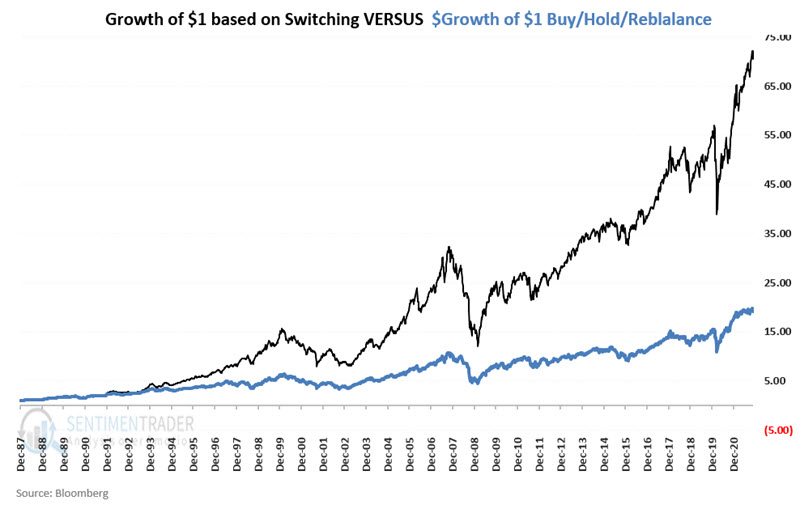
$1 in the Switching strategy grew to $70.91, while $1 in the Buy/Hold/Rebalance strategy grew to $19.08. The Switching strategy outperformed the Buy/Hold/Rebalance strategy by a factor of 3.7-to-1.
Biotech pessimism is easing
We have been watching the biotech sector closely of late. Earlier in December Jay wrote about a potential setup in the works. That setup has now triggered.
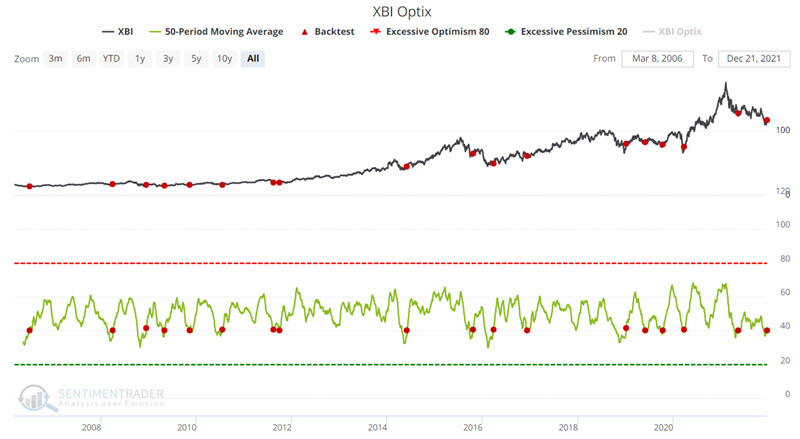
The setup we will use is when the 50-day average for the Optimism Index (Optix) on XBI crosses above 40% for the first time in a month.
The signals generated by the rule above appear in the chart below. A new signal occurred after the close on Tuesday 12/21 (denoted by the red dot at the far right of the chart below).
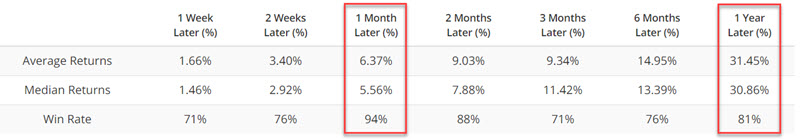
The summary of results for previous signals appears below. Over the next month, XBI rose 94% of the time, with a median return of +5.6%. Over the next year, it gained a median of 30.9%.
Jay also looked at a couple of ways to take advantage of this potential setup, using shares of XBI versus a call option. There are tradeoffs to each vehicle, it matters more how much risk a trader is willing to take.
About the Weekly Wrap...
The goal of the Weekly Wrap is to summarize our recent research. Some of it includes premium content (underlined links), but we're highlighting the key focus of the research for all. Sometimes there is a lot to digest, with this summary meant to highlight the highest conviction ideas we discussed. Tags will show any symbols and time frames related to the research.
Active Studies
| Time Frame | Bullish | Bearish | | Short-Term | 2 | 3 | | Medium-Term | 14 | 2 | | Long-Term | 16 | 8 |
|
Indicators at Extremes
Portfolio
| Position | Description | Weight % | Added / Reduced | Date | | Stocks | RSP | 10.7 | Added 6.4% | 2021-10-01 | | Bonds | 32.7% BND, 7.1% SCHP | 39.8 | Added 8.3% | 2021-10-26 | | Commodities | GCC | 2.4 | Reduced 2.1%
| 2020-09-04 | | Precious Metals | GDX | 4.6 | Reduced 4.2% | 2021-05-19 | | Special Situations | 9.8% KWEB, 4.7% XLE, 2.9% PSCE | 17.3 | Added 9.78% | 2021-10-01 | | Cash | | 24.1 | | |
|
Updates (Changes made today are underlined)
No surprise for 2021, but we're seeing conflicting messages in some of what has developed lately. There was a jump in pessimism heading into December, which has been relieved to some degree. The subsequent breadth thrust has extremely positive implications for forward returns, especially longer-term. The negatives are mostly sector-related, especially the negative divergences among Nasdaq 100 stocks. Consumer Staples have seen an impressive surge, and Biotech may be oversold, but otherwise there are a whole lot of crosscurrents and seemingly not much edge. Bond sentiment is trying to recover from a recent bout of pessimism, and gold stocks are doing their thing which is not much at all. They've been flat for six months. Chinese tech stocks were doing exactly what they're supposed to do, then did *not* by plunging to new lows. This is troubling on a shorter-term time frame, but this was never meant for a trade, rather a multi-year investment. Recent behavior is troubling and I will not be adding any exposure as long as that's the case. RETURN YTD: 7.9% 2020: 8.1%, 2019: 12.6%, 2018: 0.6%, 2017: 3.8%, 2016: 17.1%, 2015: 9.2%, 2014: 14.5%, 2013: 2.2%, 2012: 10.8%, 2011: 16.5%, 2010: 15.3%, 2009: 23.9%, 2008: 16.2%, 2007: 7.8%
|
|
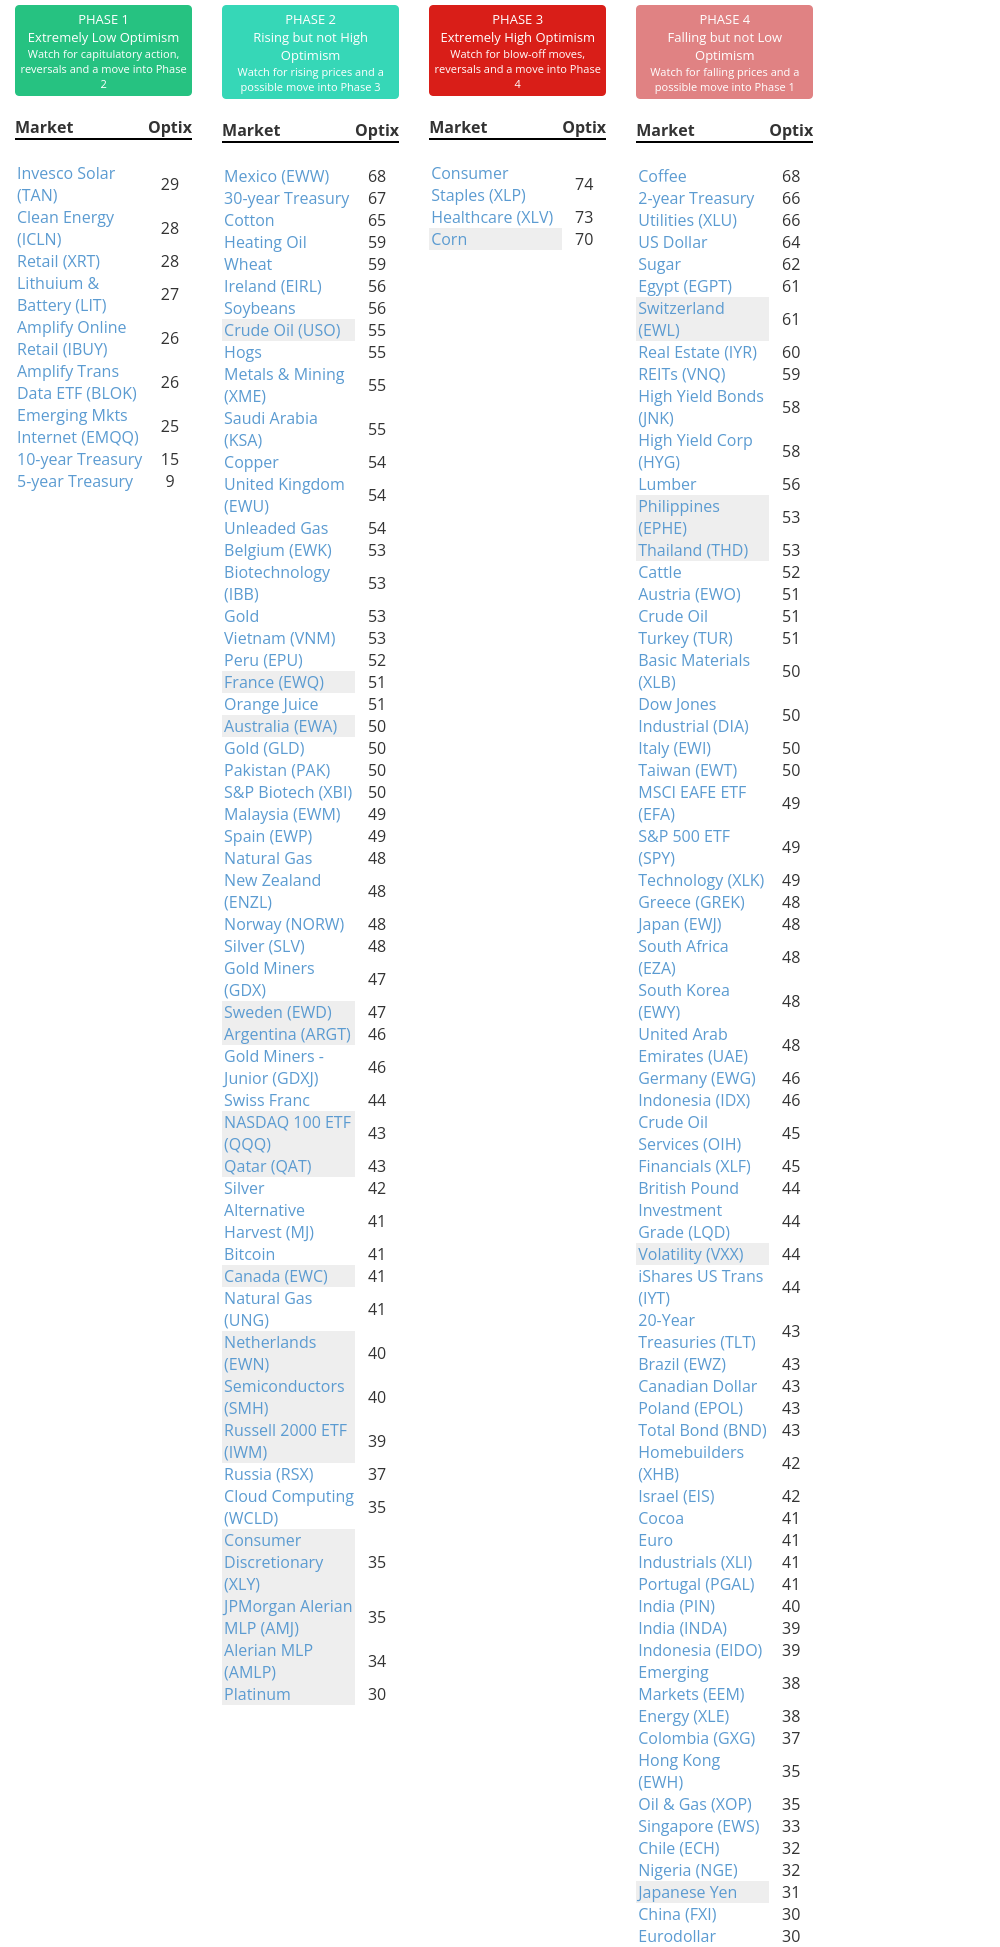
Phase Table
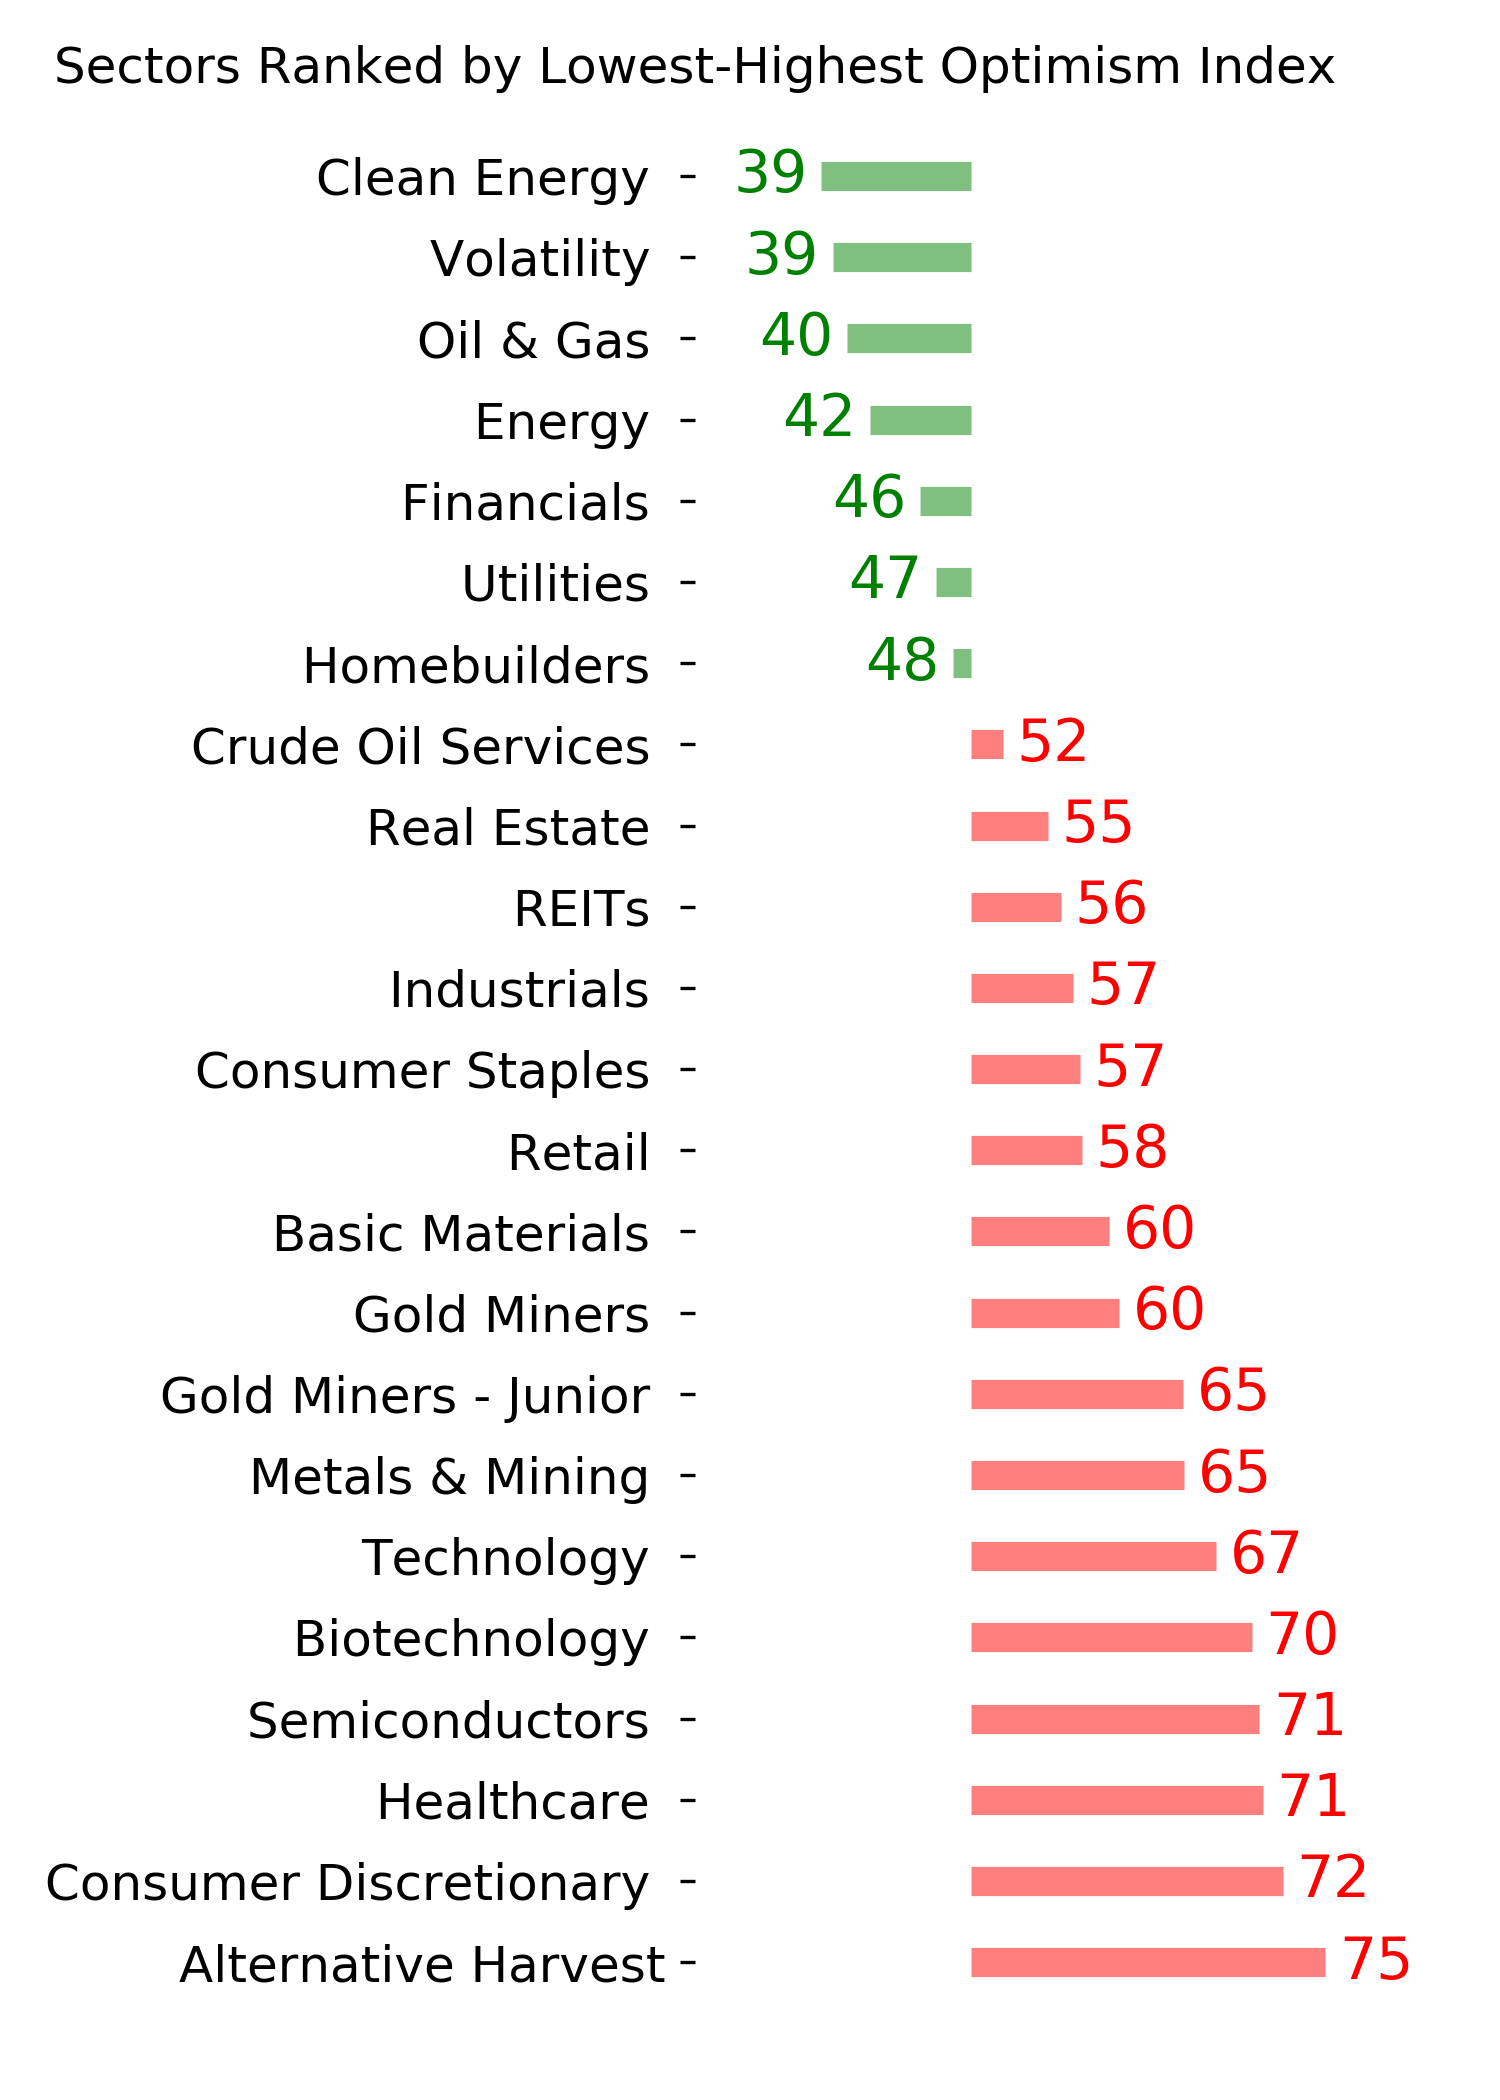
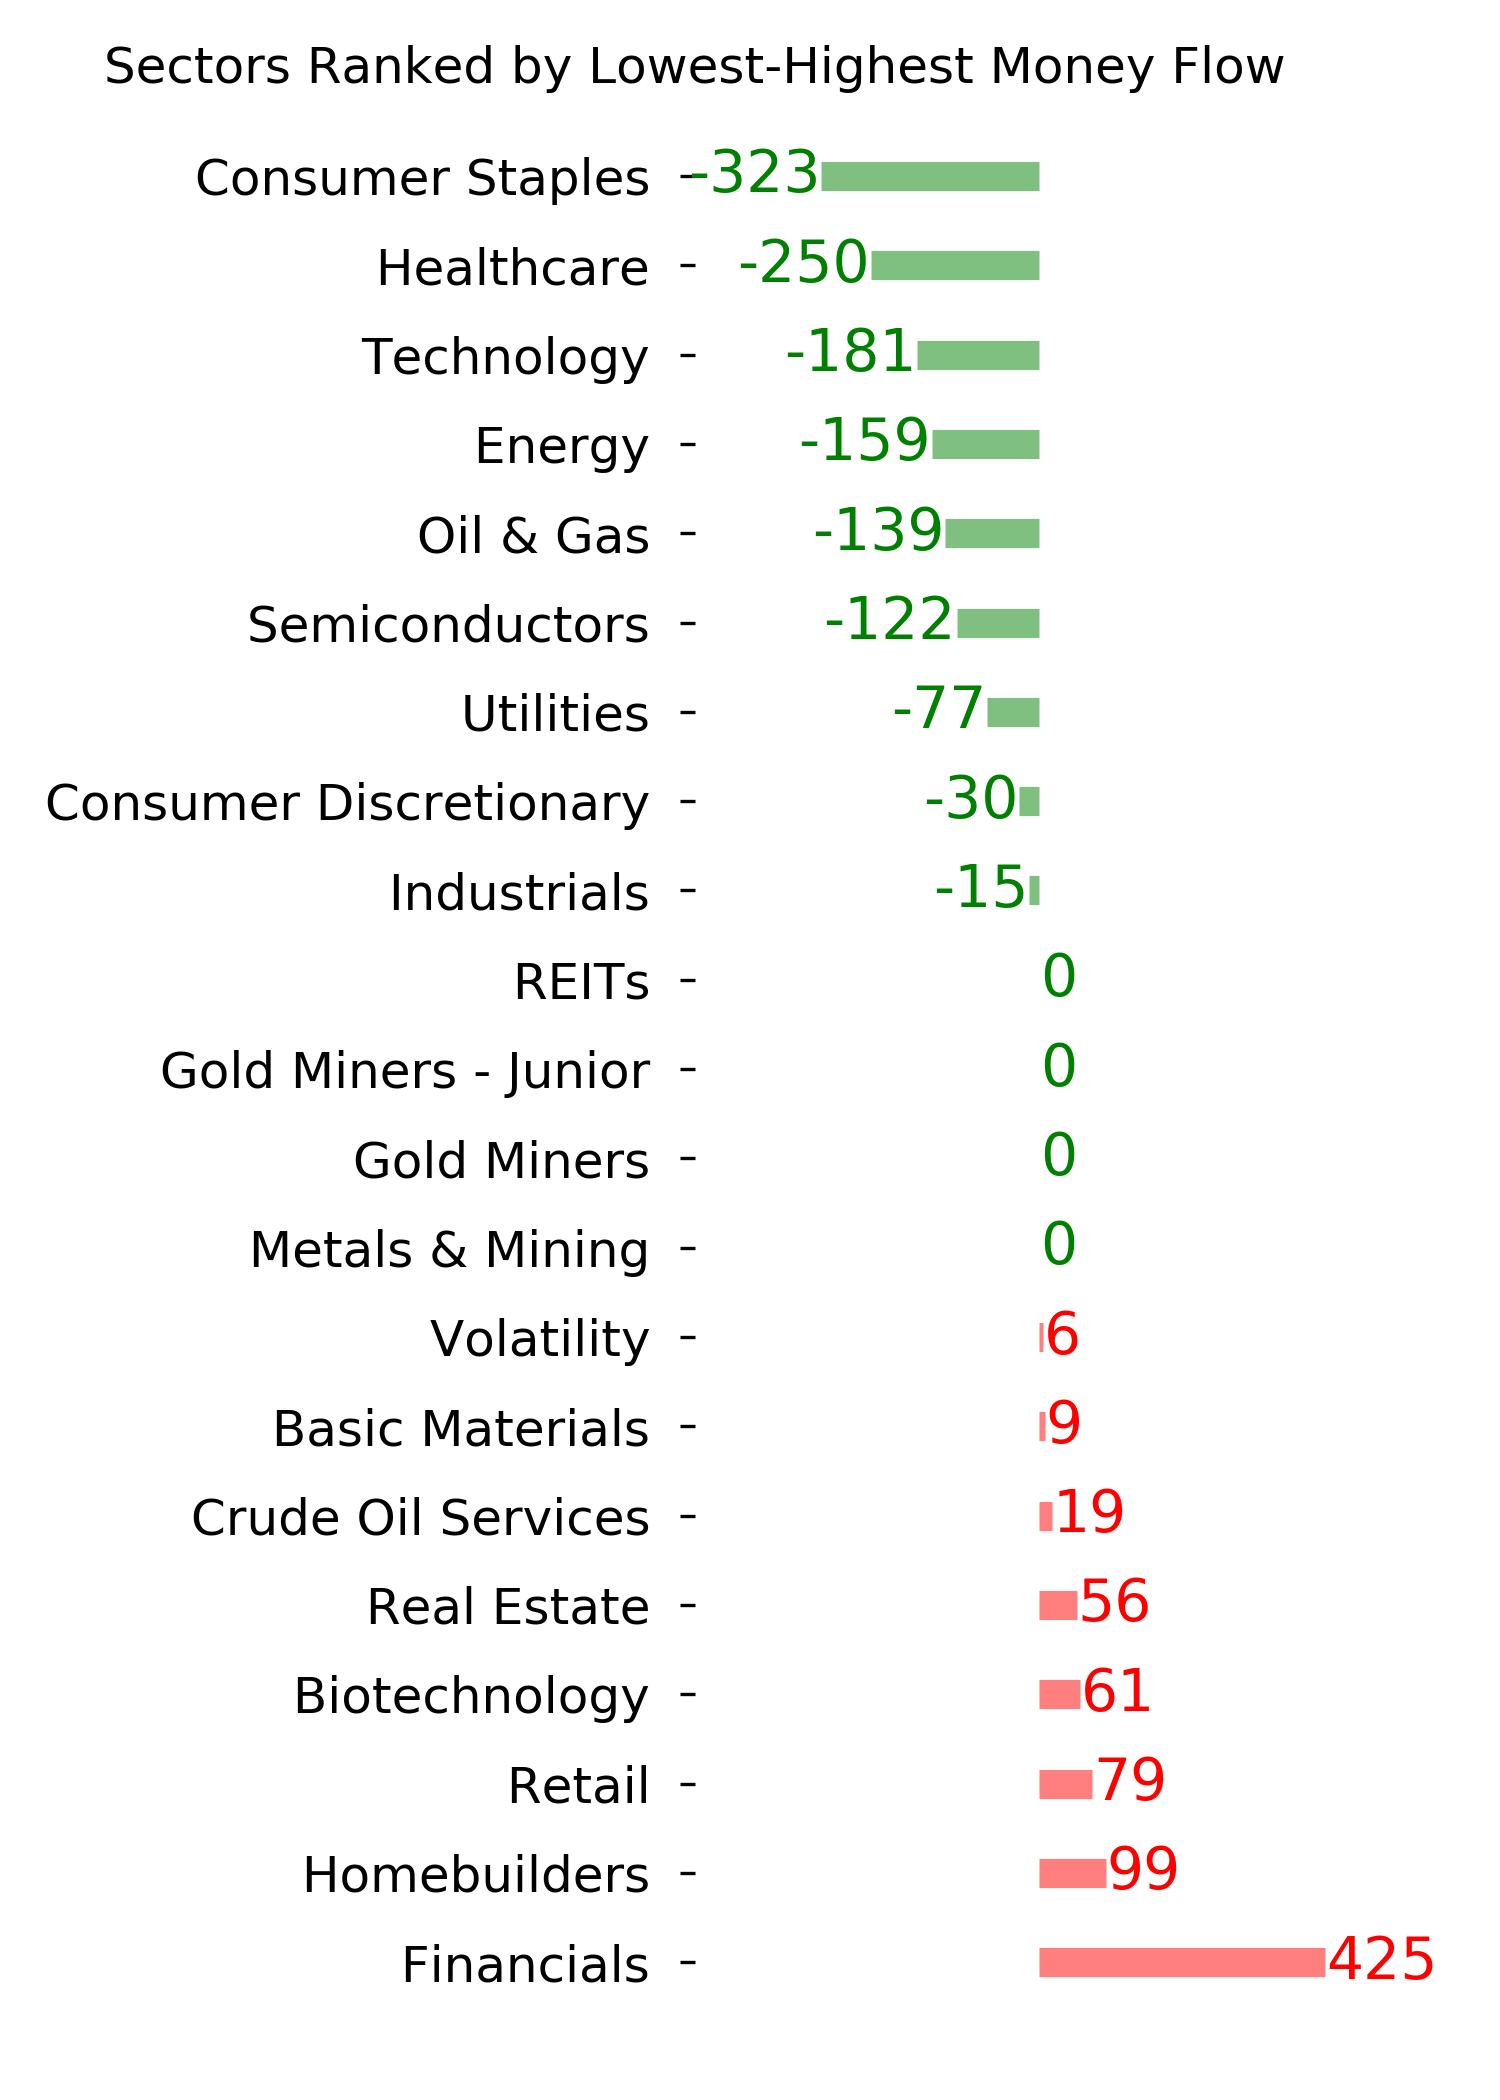
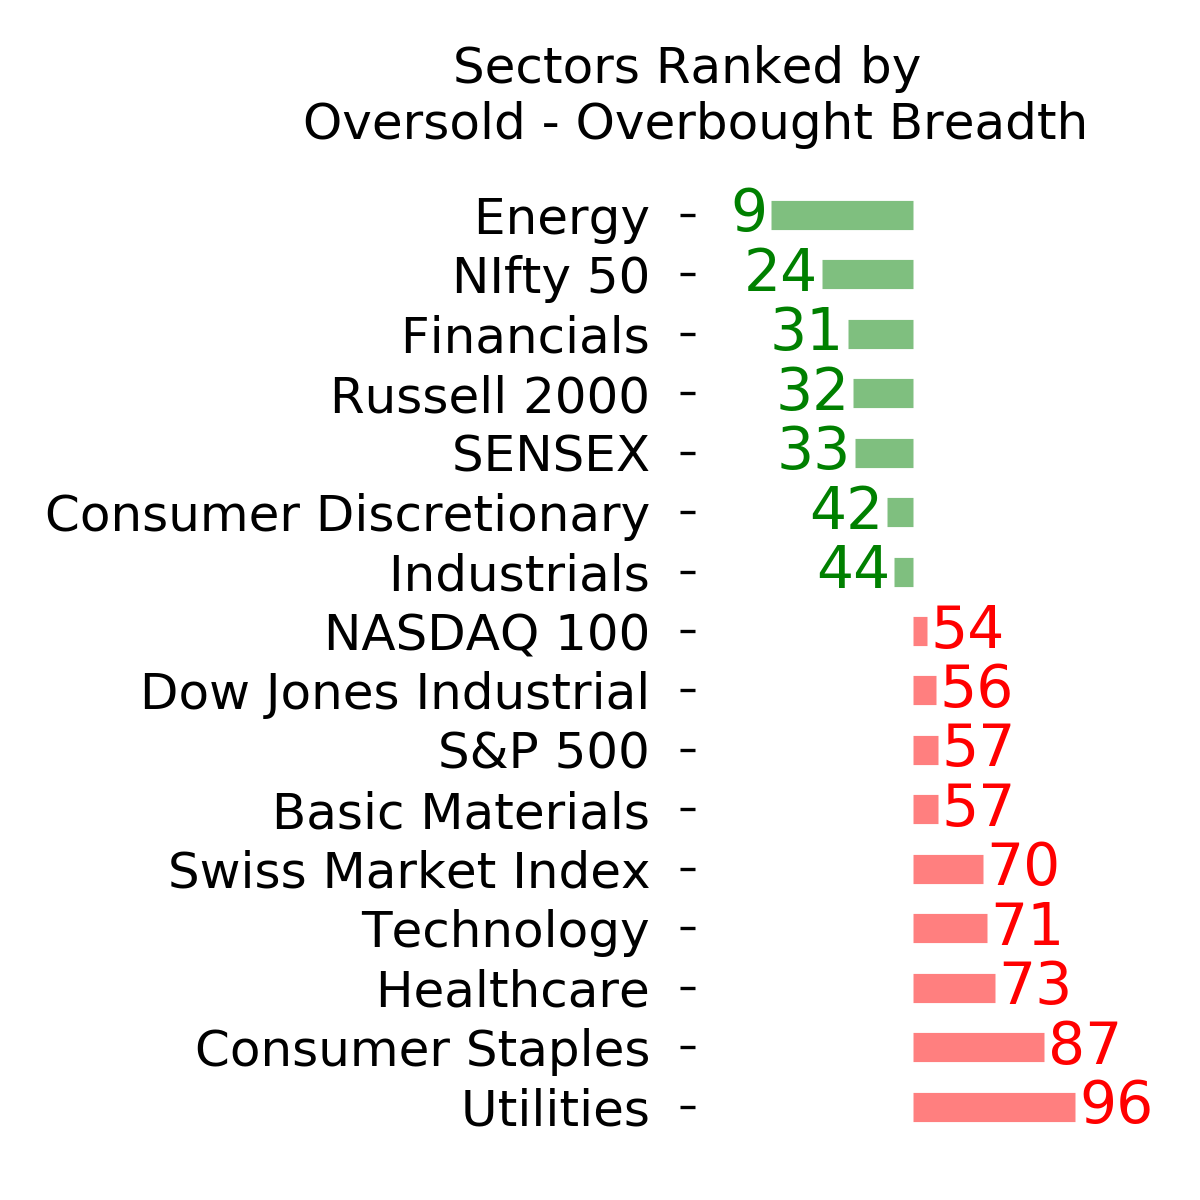
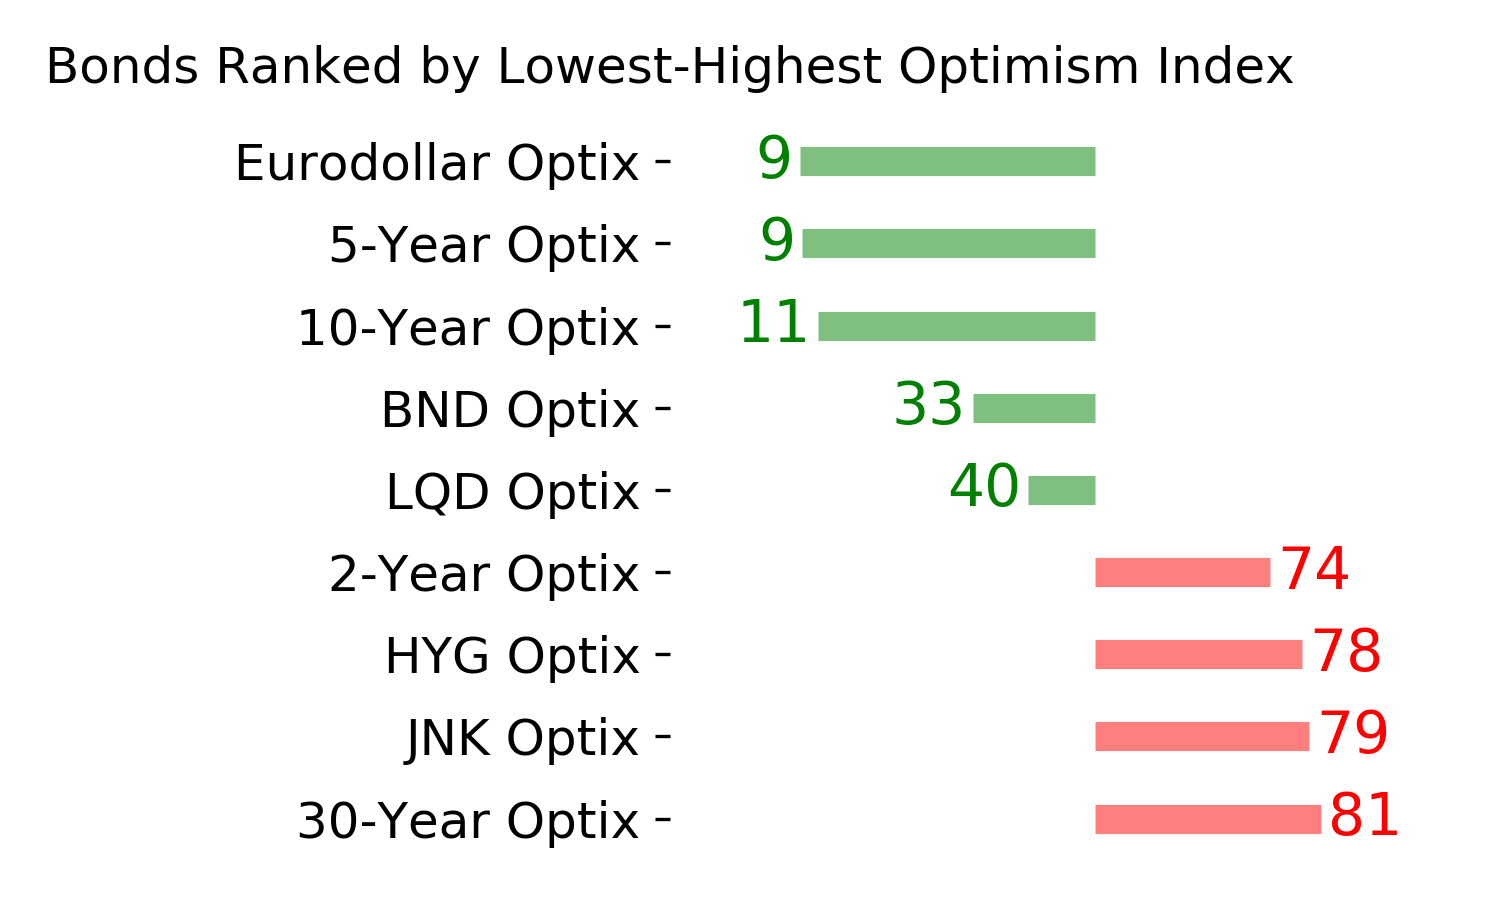
Ranks
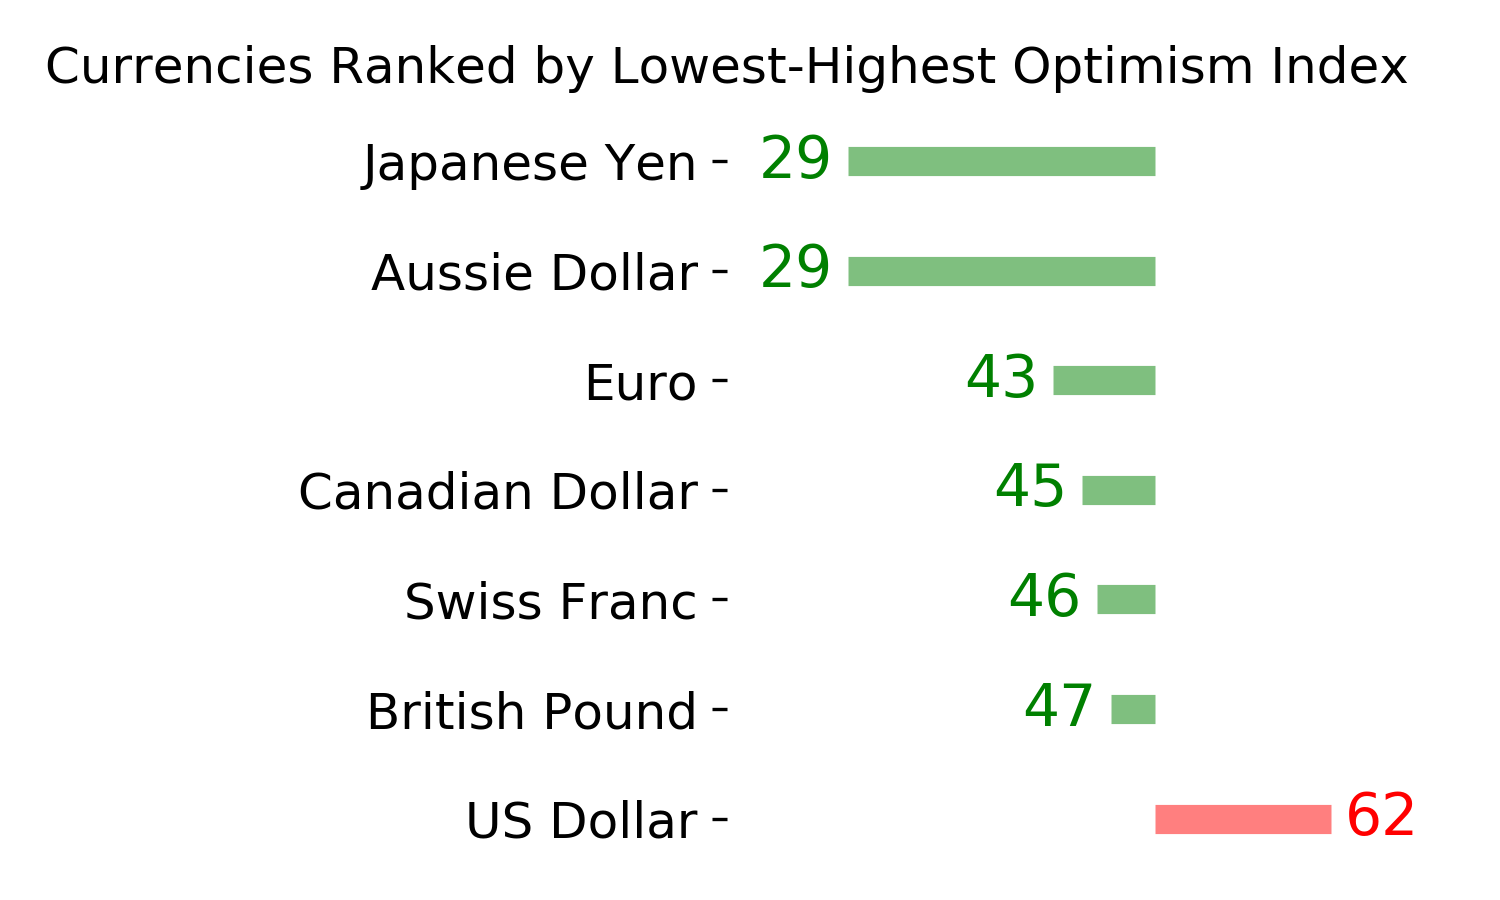
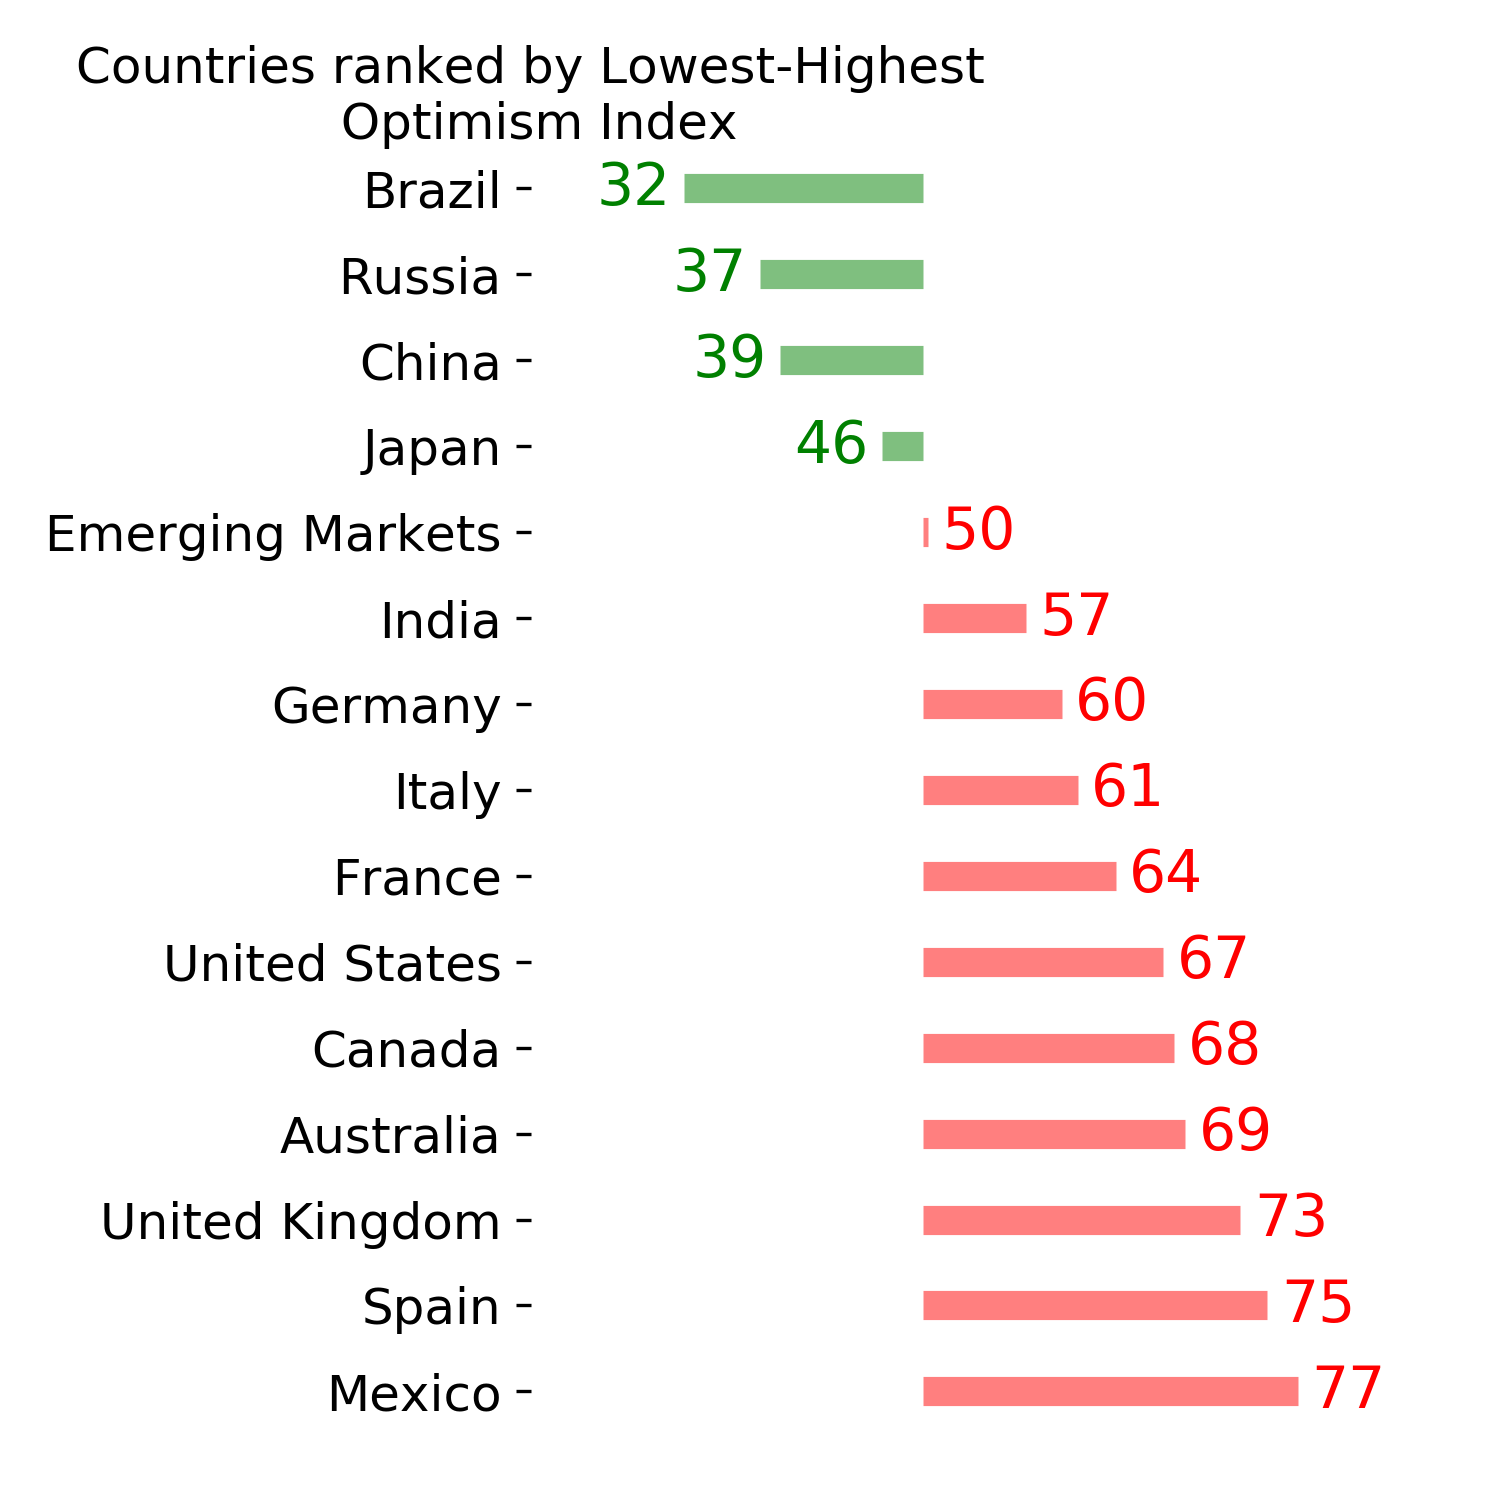
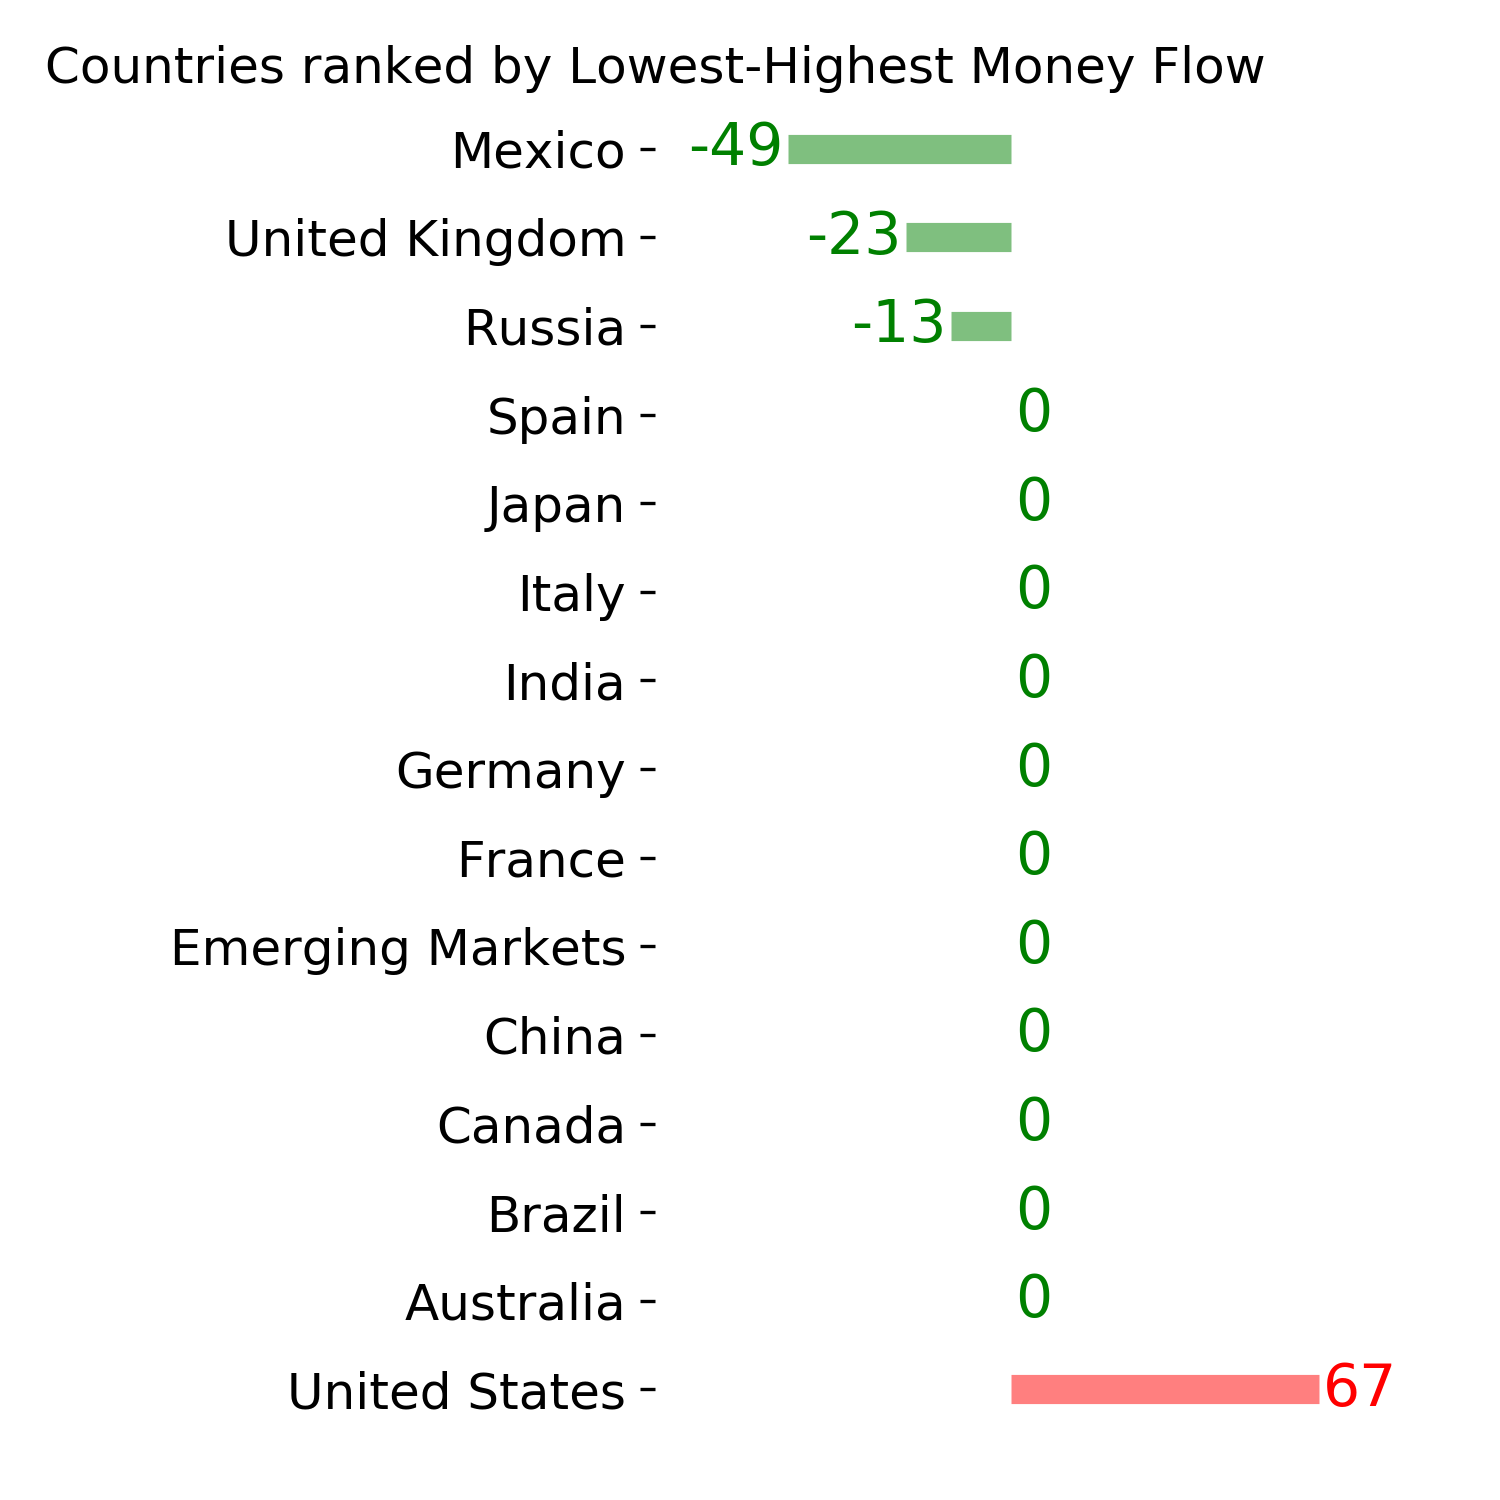
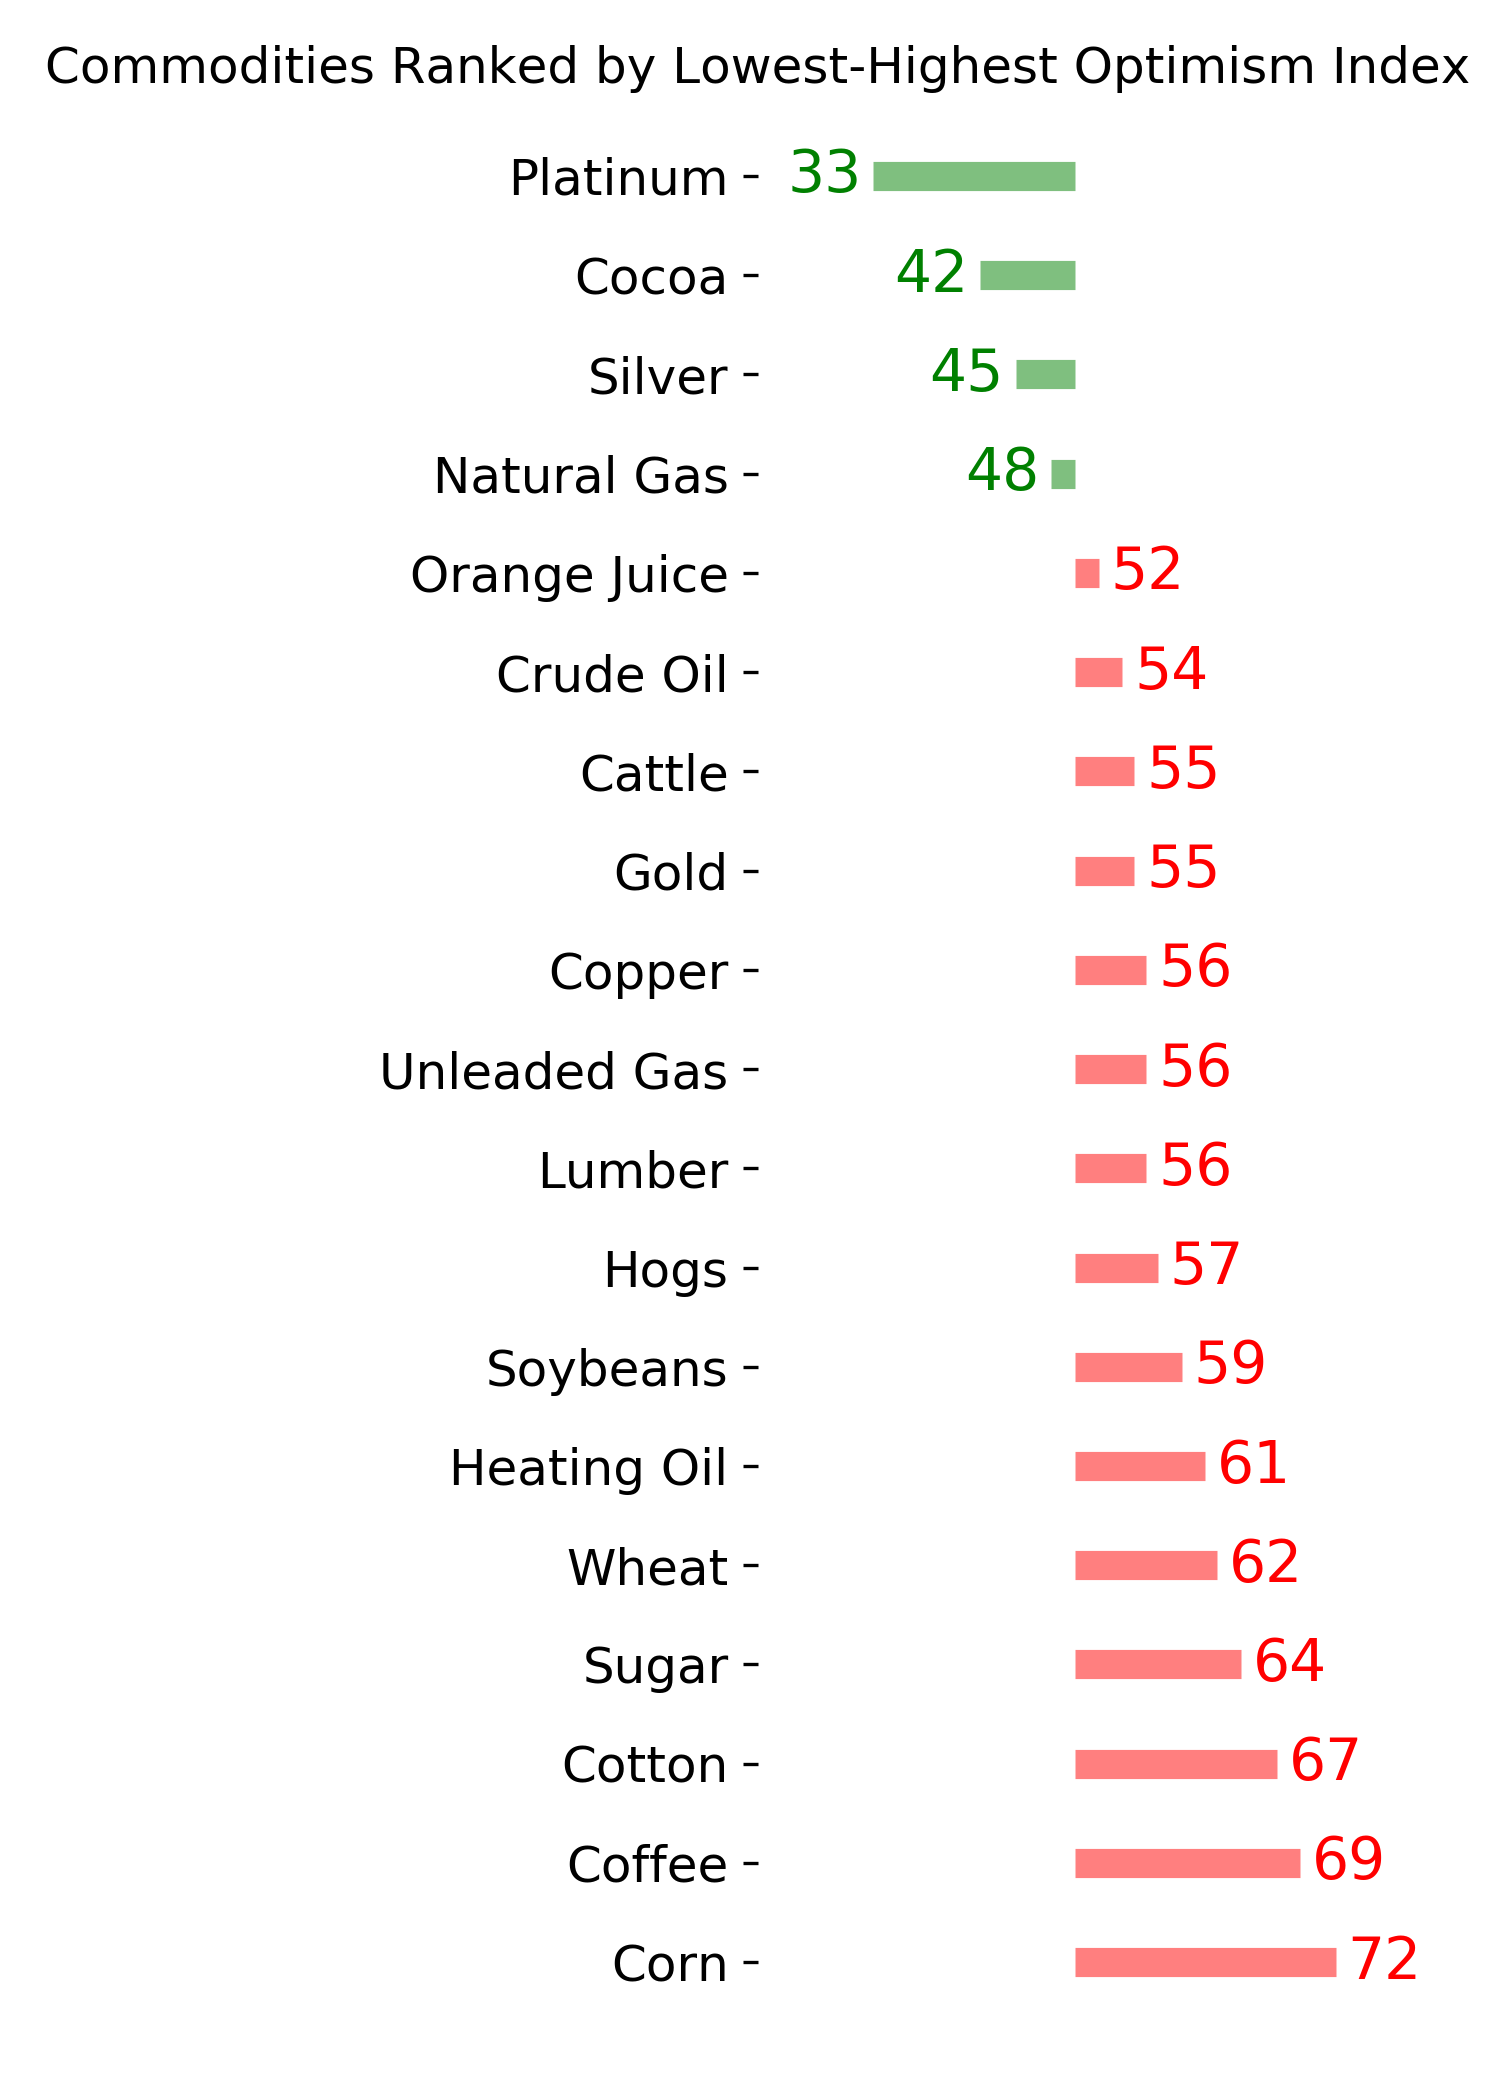
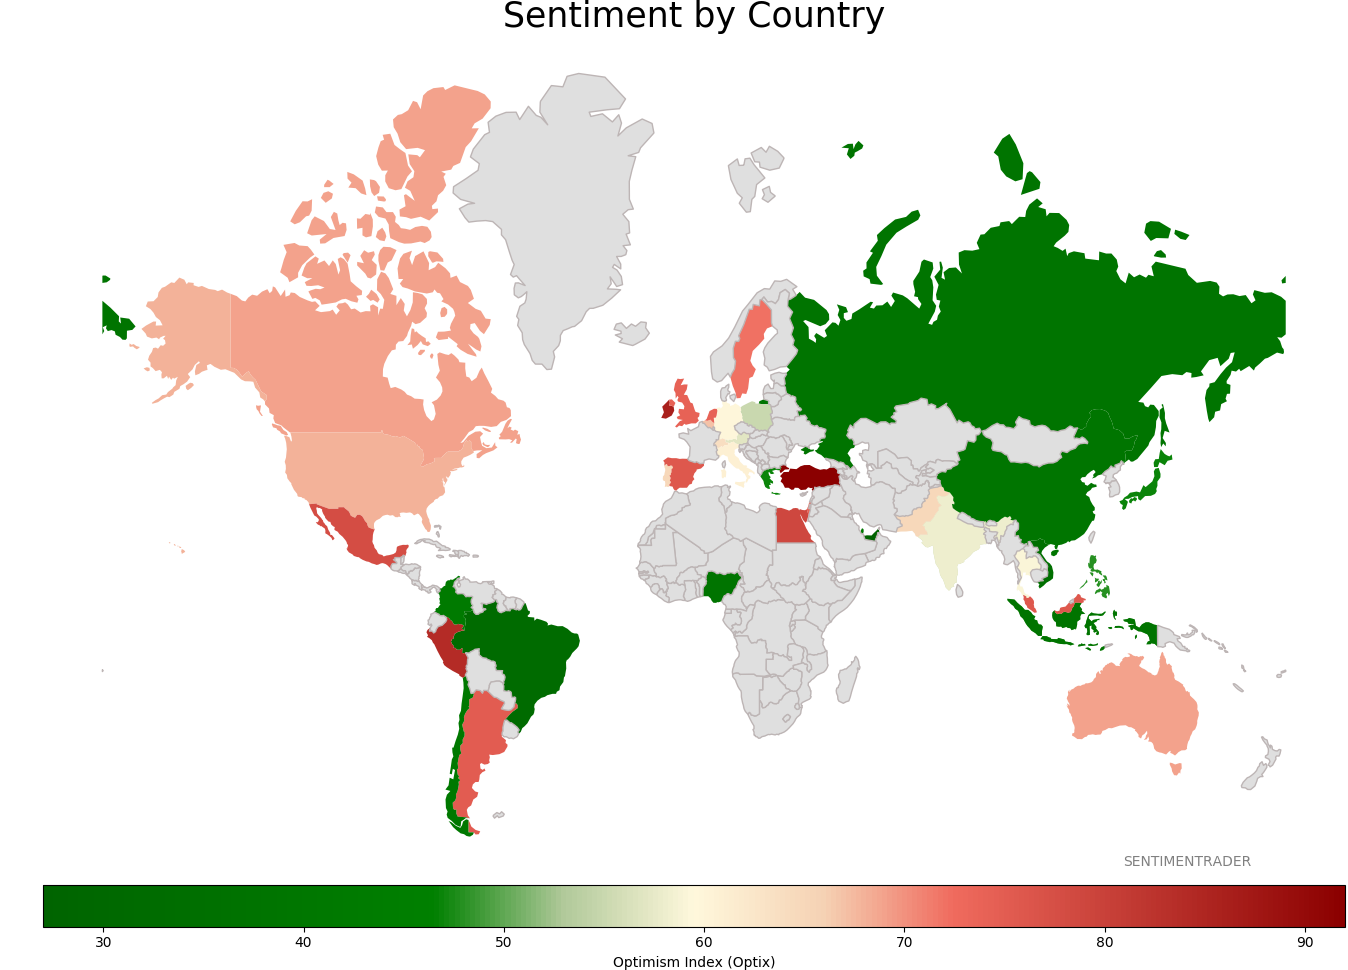
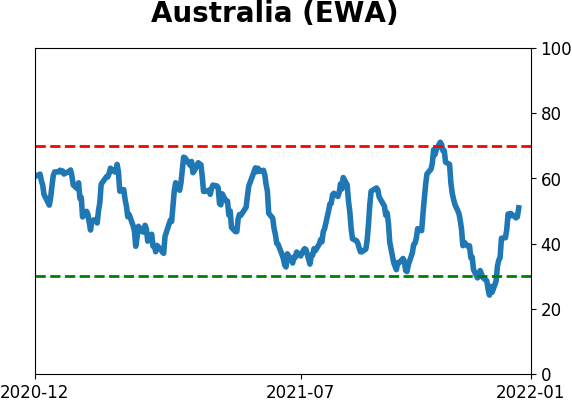
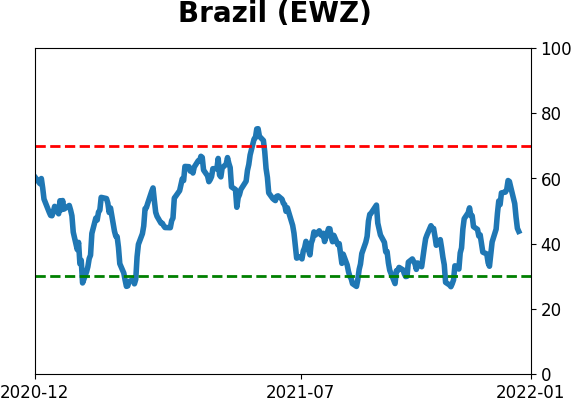
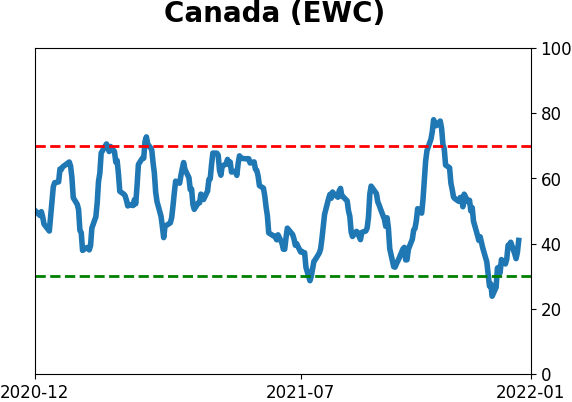
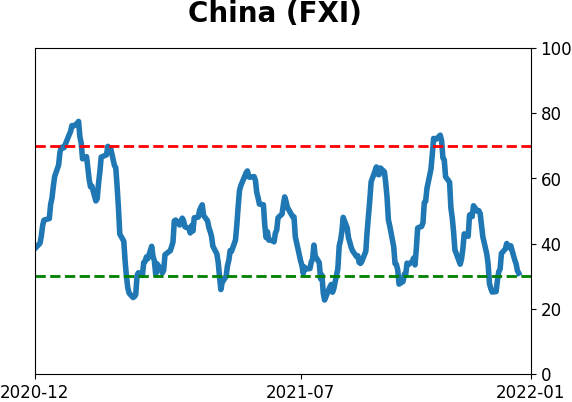
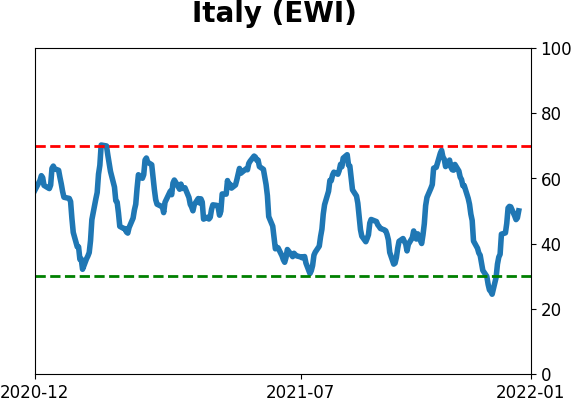
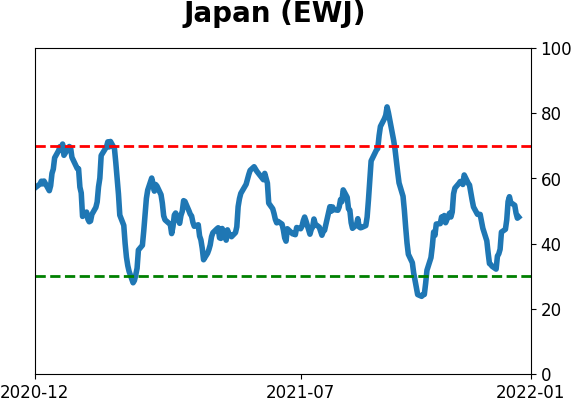
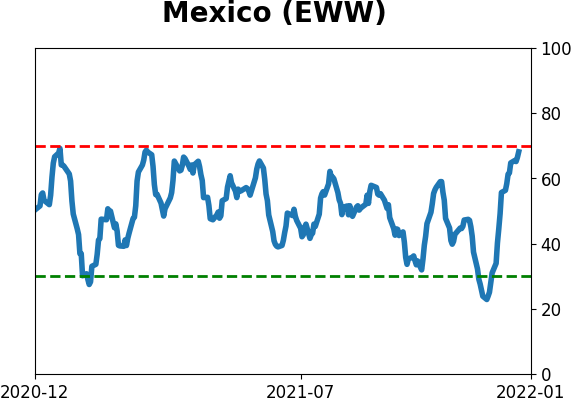
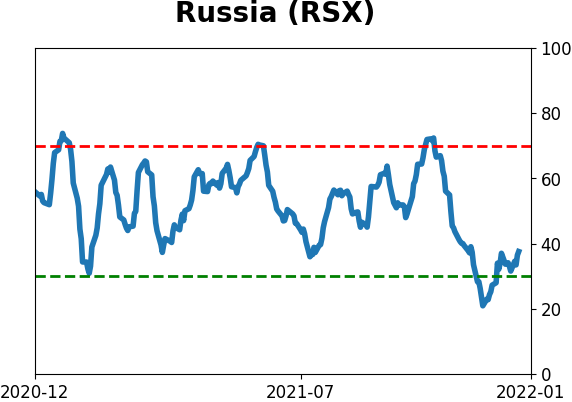
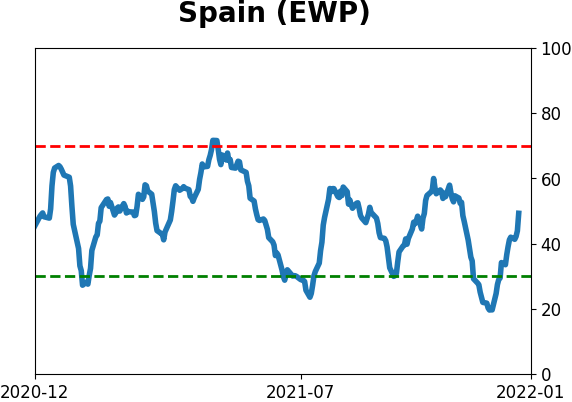
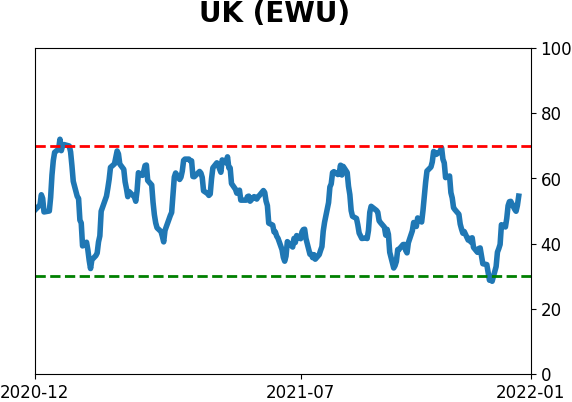
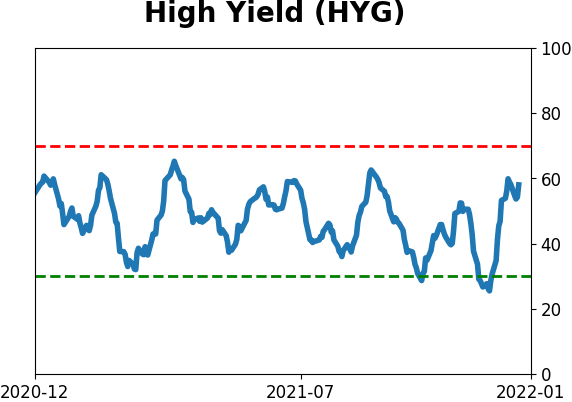
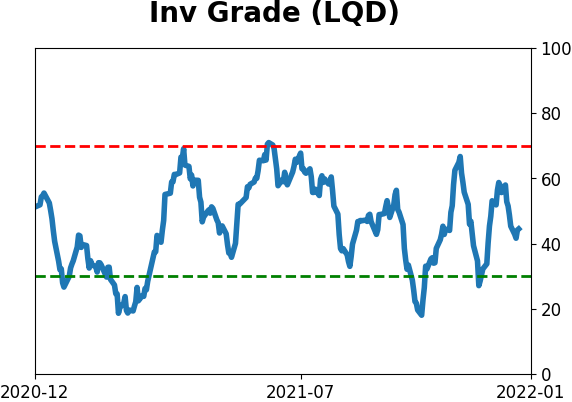
Sentiment Around The World
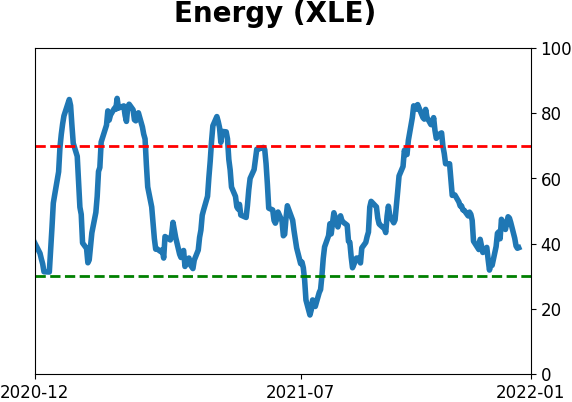
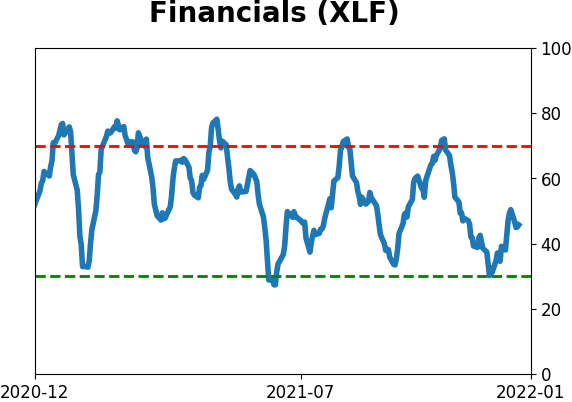
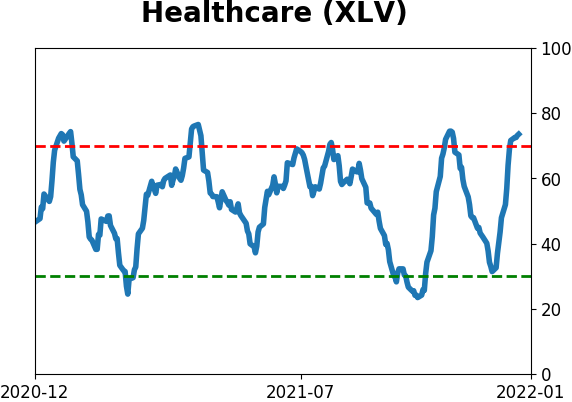
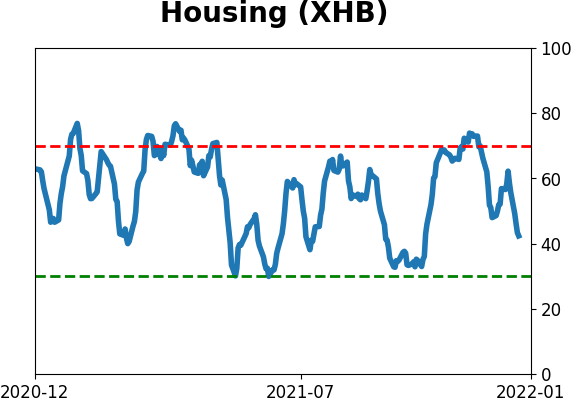
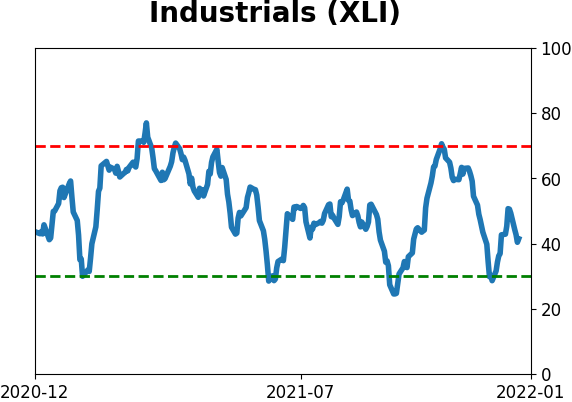
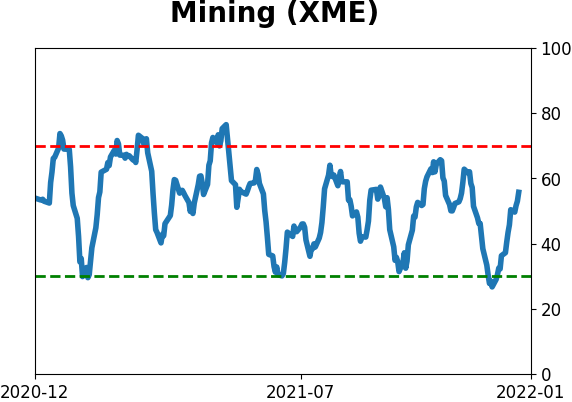
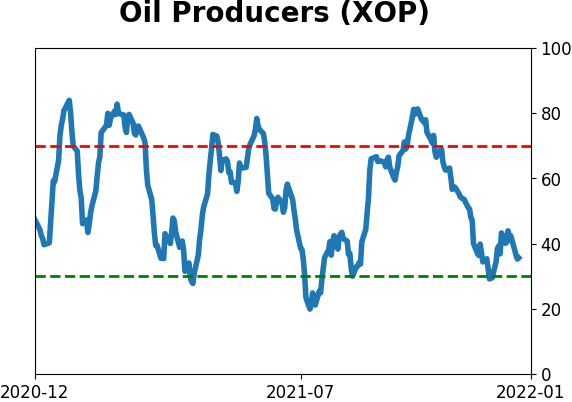
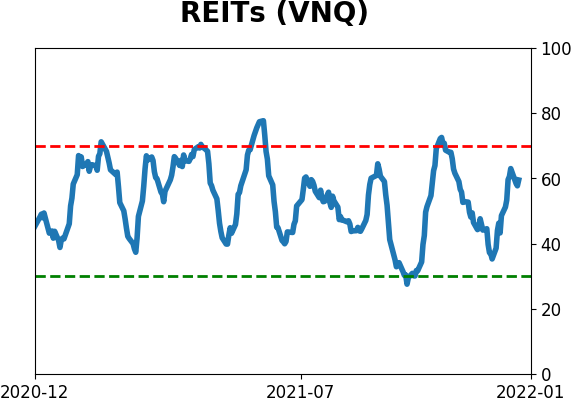
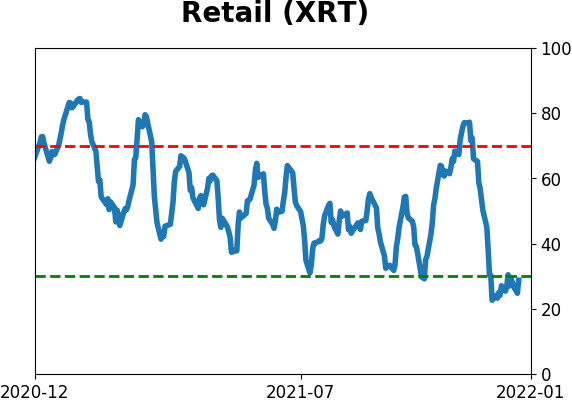
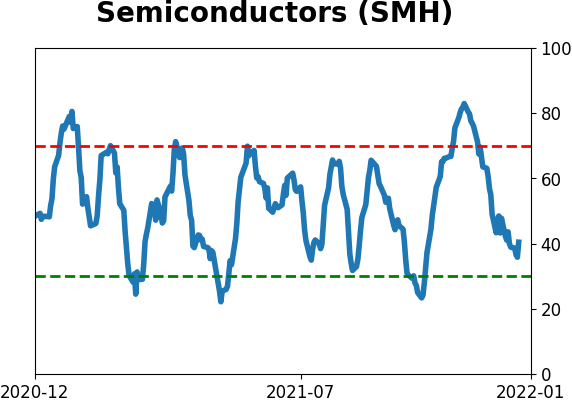
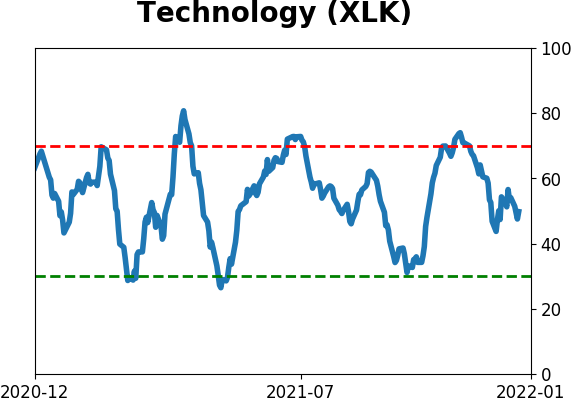
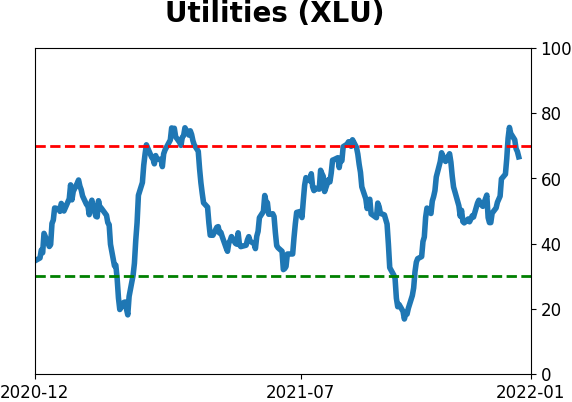
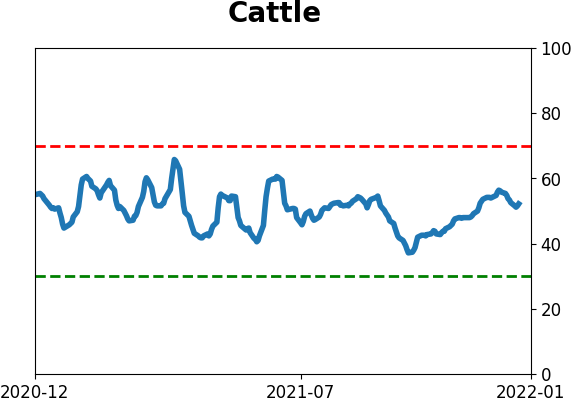
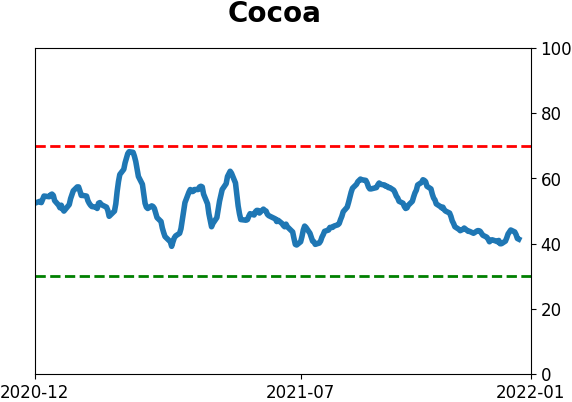
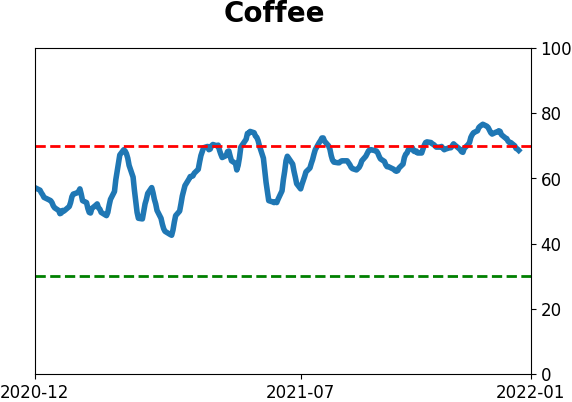
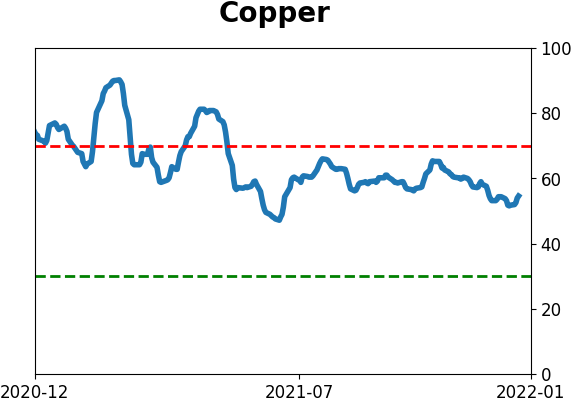
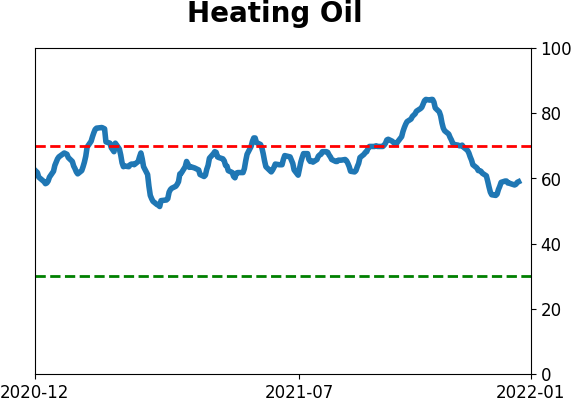
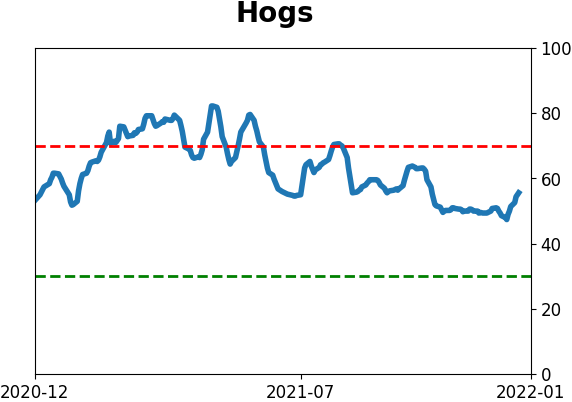
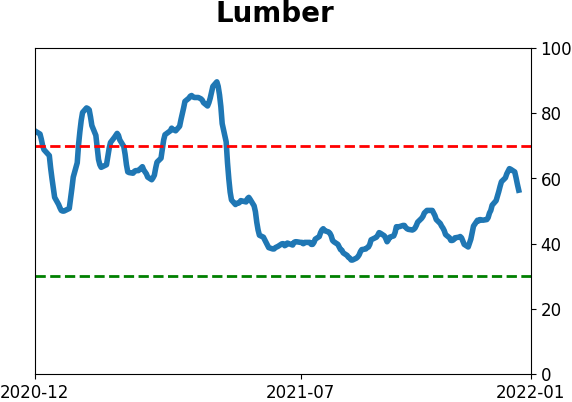
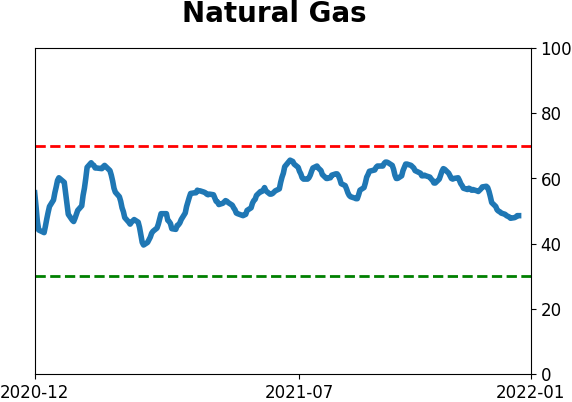
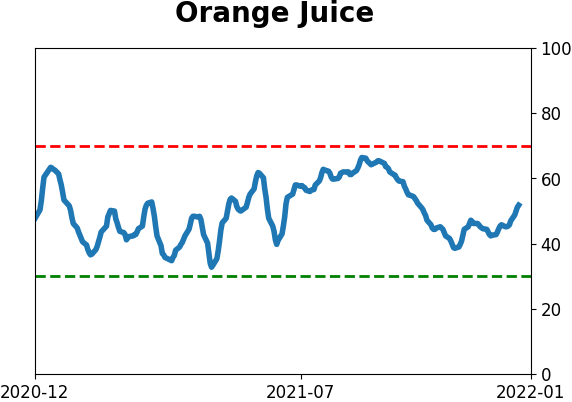
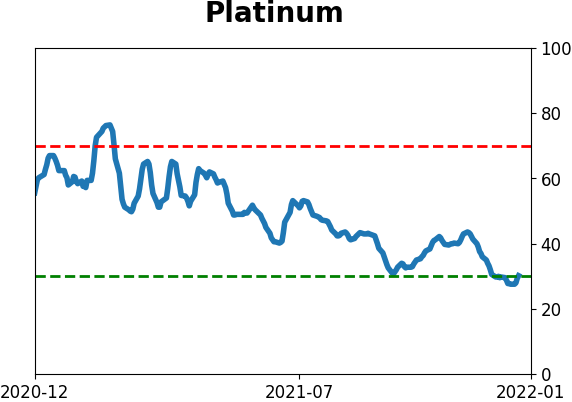
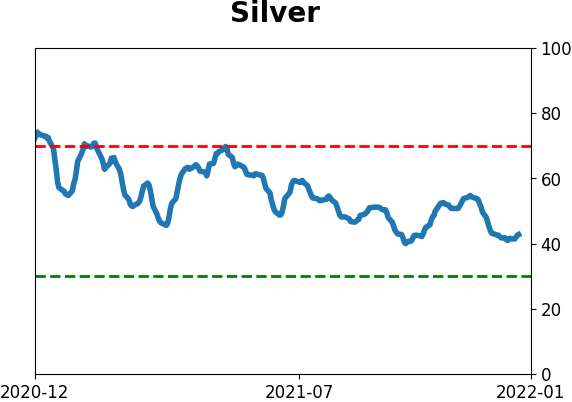
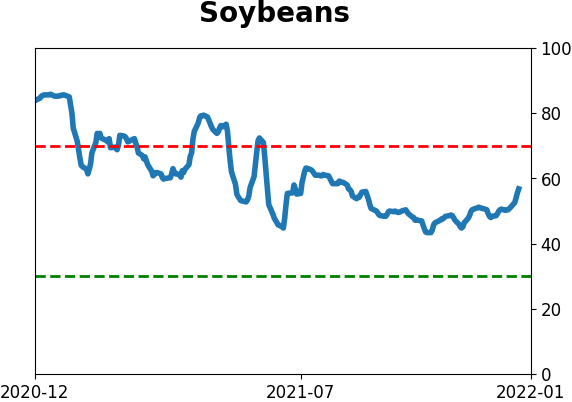
Optimism Index Thumbnails
|
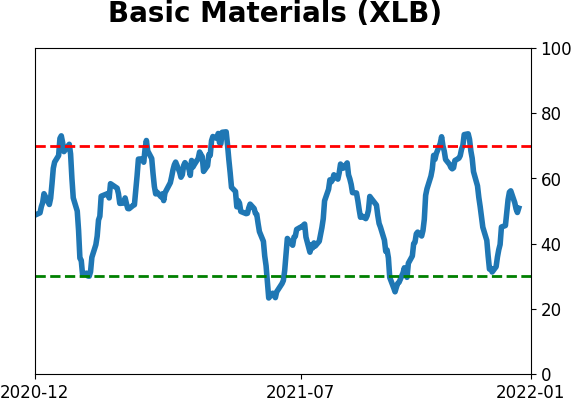
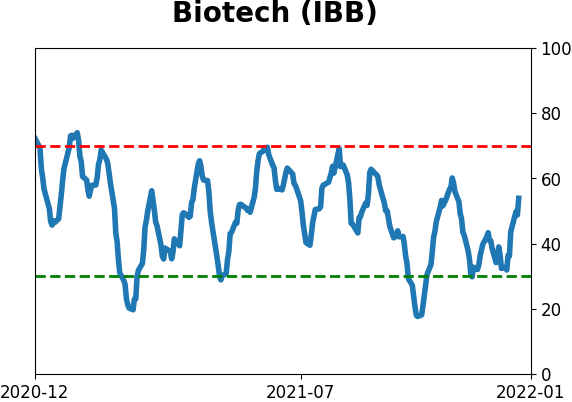
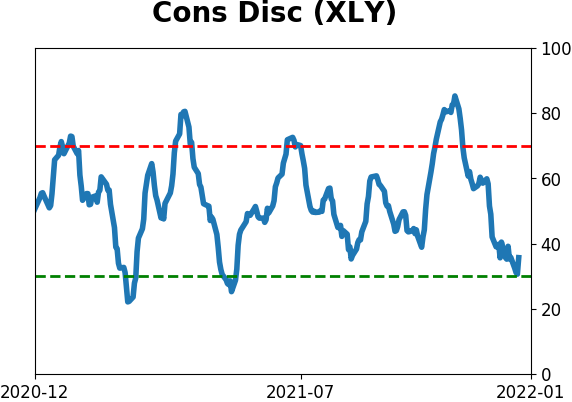
Sector ETF's - 10-Day Moving Average
|
|
|
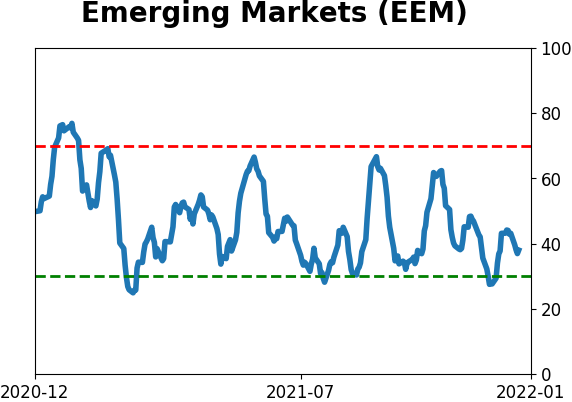
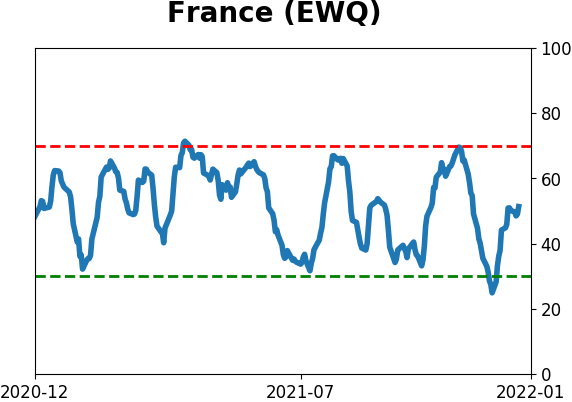
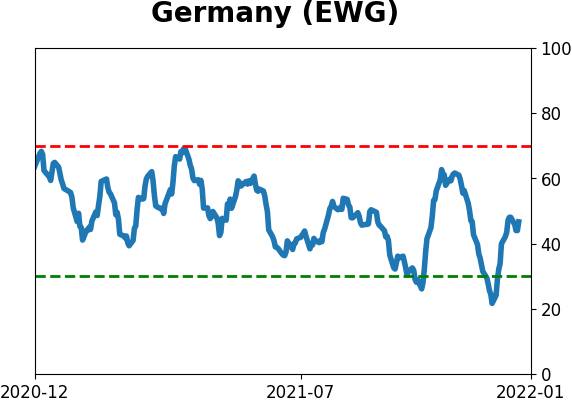
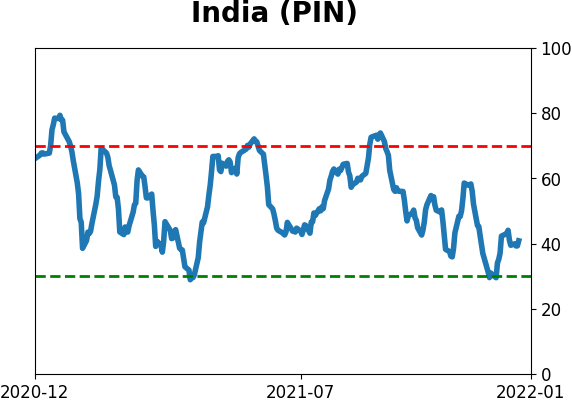
Country ETF's - 10-Day Moving Average
|
|
|
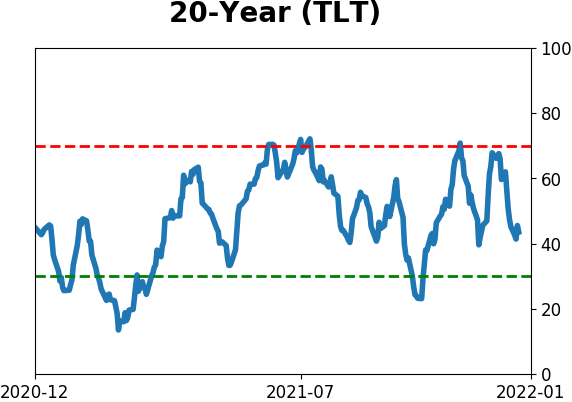
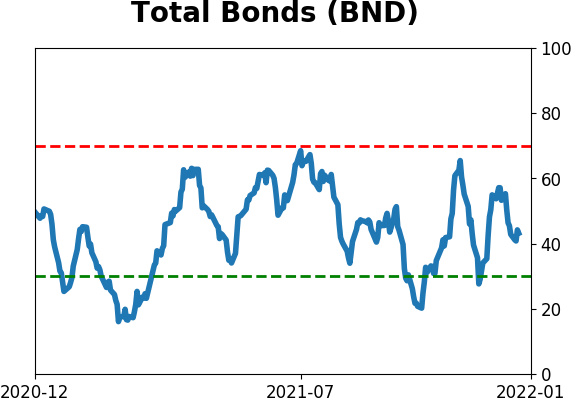
Bond ETF's - 10-Day Moving Average
|
|
|
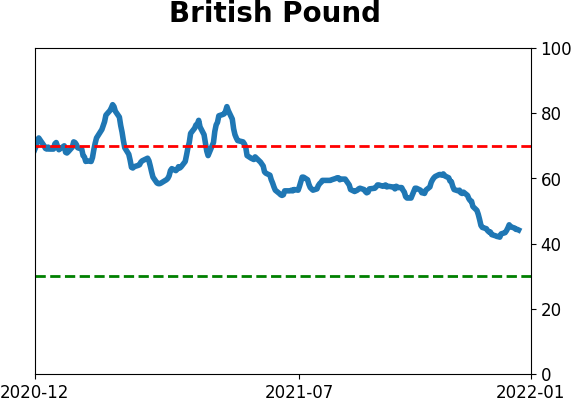
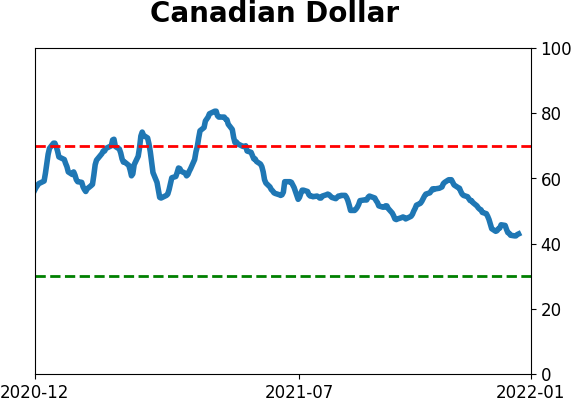
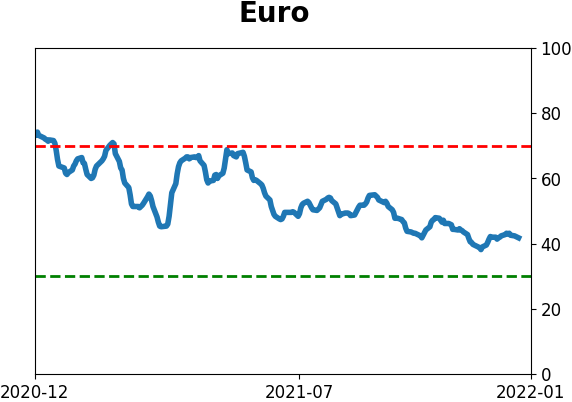
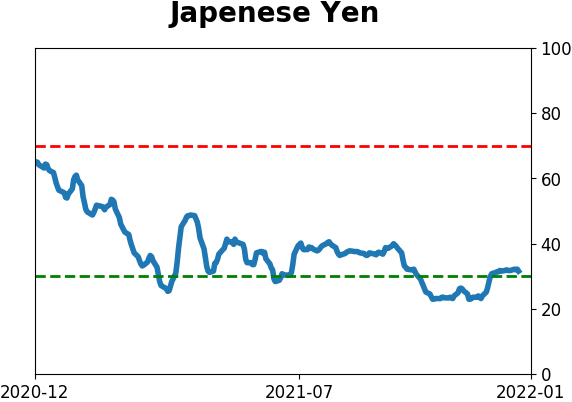
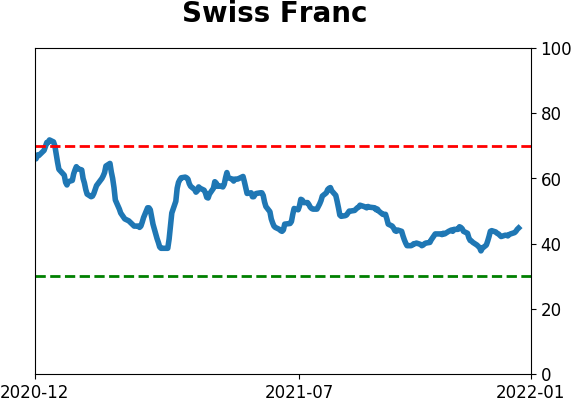
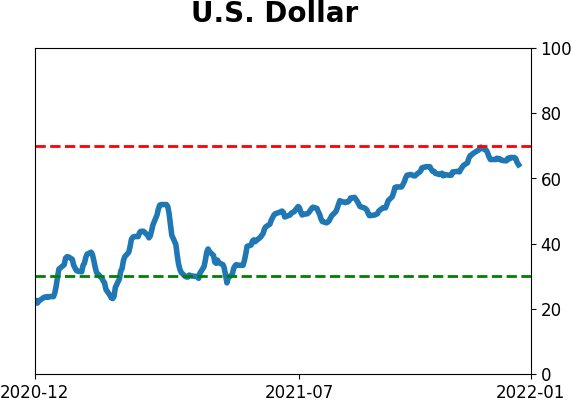
Currency ETF's - 5-Day Moving Average
|
|
|
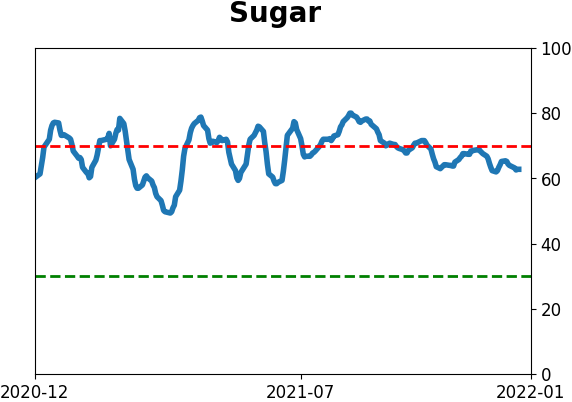
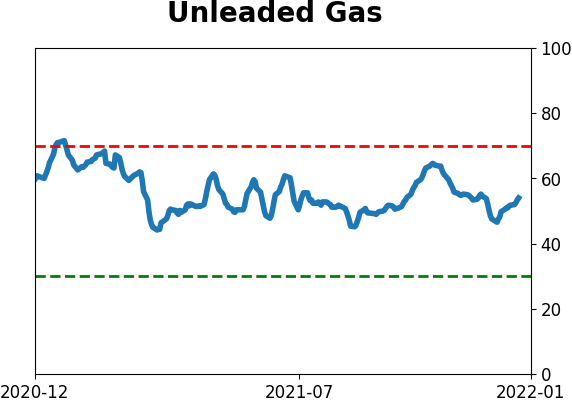
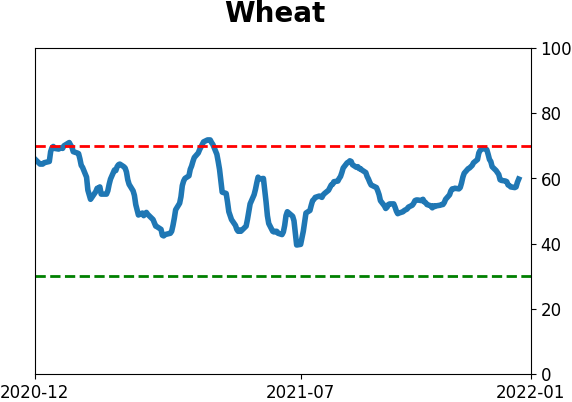
Commodity ETF's - 5-Day Moving Average
|
|