Headlines
|
|
Energy sector on cusp of becoming golden:
For the first time in 2 years, the energy sector is on the cusp of seeing its 50-day moving average cross above the 200-day average. This would end one of the longest downtrends since 1926, and the ends of other prolonged downtrends had a tendency to see rising prices over the longer-term.
NOTE: We won't be publishing a report on Thursday or Friday. For those who observe, we wish you a very Merry Christmas. For those who don't, please have a safe, relaxed, and joyous break from the little blinking lights. We will have an announcement next week regarding additions to the service that we're confident will make 2021 our best year yet!
Small but mighty: In the world of small sample sizes, small-cap stocks stand alone. Their move over the past 2 months has been historic. The Russell 2000 closed at a new high with a week left in the year, which it's only done twice before. Both saw minor gains over the next few days, then losses during the next month. If it continues that pattern, then it will record its 8th consecutive week with a 1% or larger gain, which has been matched only once before, in early December 1992. That, too, saw minor short-term gains then modest losses over the next couple of weeks. The IWM fund saw a narrow range-day while closing at a multi-year high on Wednesday, which has a much larger sample size. But out of the 71 times this triggered, it saw gains over the next few days 64% of the time, but only 42% of the time, with a -0.5% median return, during the next 2 weeks. The overall suggestion is there is still a holiday-infused tailwind but it turns into a headwind as we start the New Year.
Bottom Line:
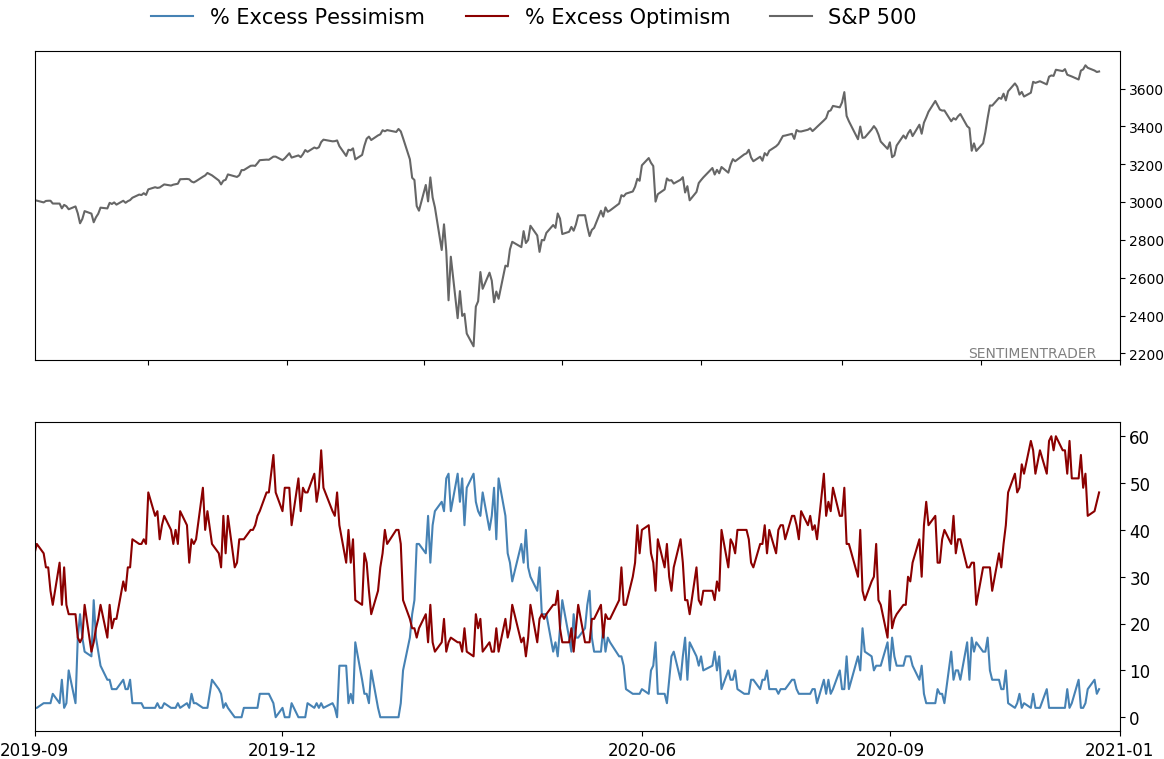
- The market environment is pristine, but with near-historic optimism, gains tend to be muted, with a high probability of being reversed at some point over the ensuing weeks.
|
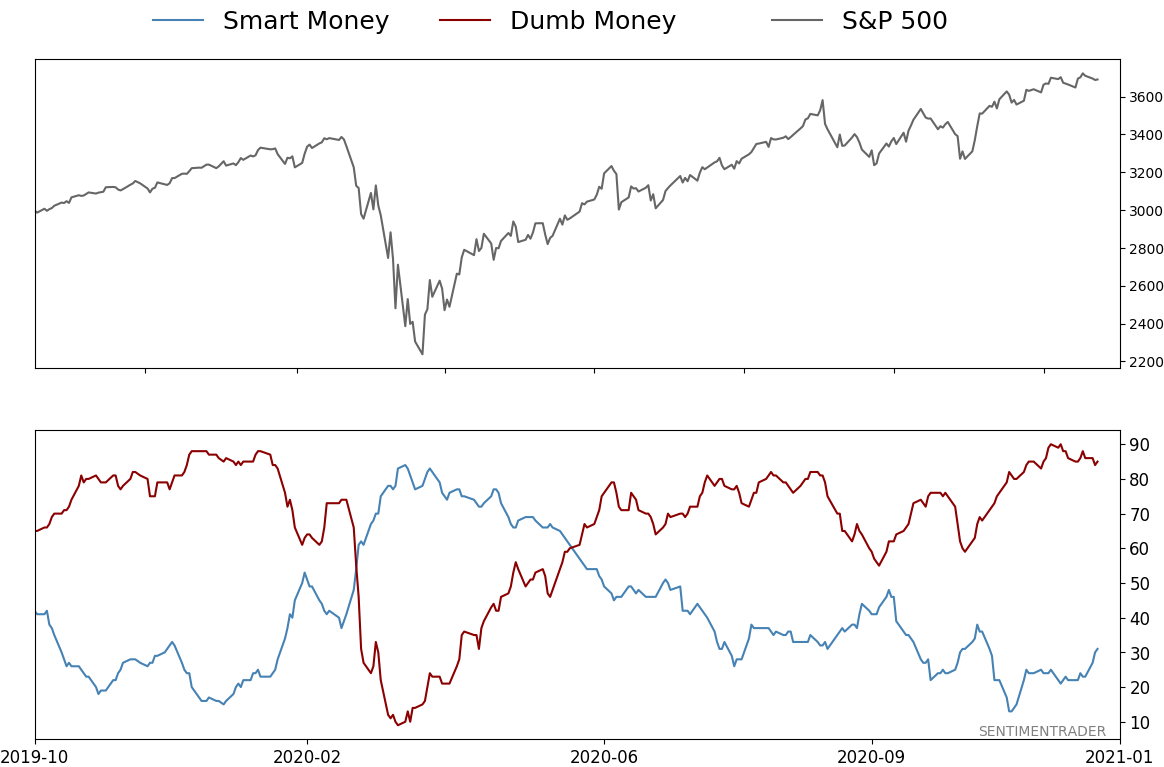
Smart / Dumb Money Confidence
|
Smart Money Confidence: 31%
Dumb Money Confidence: 85%
|
|
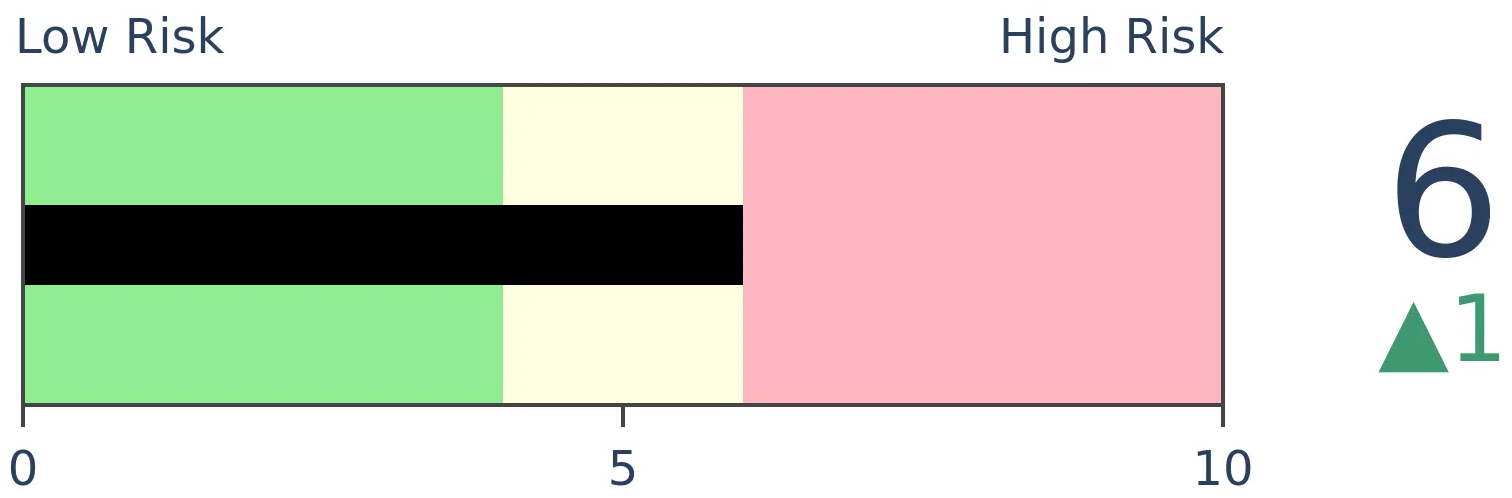
Risk Levels
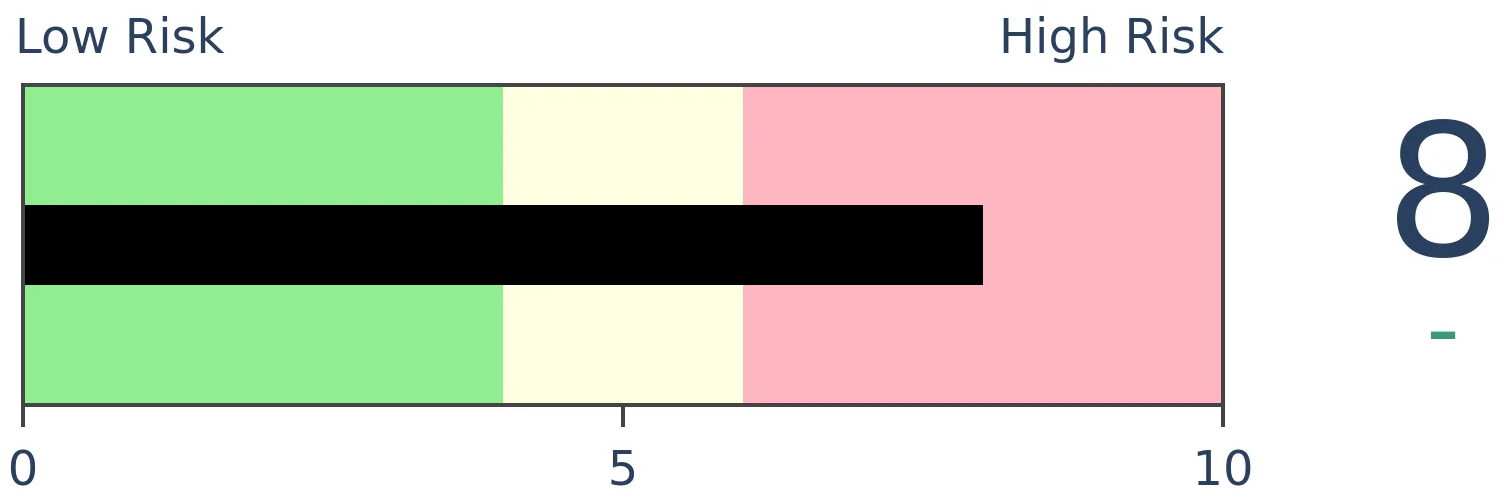
Stocks Short-Term
|
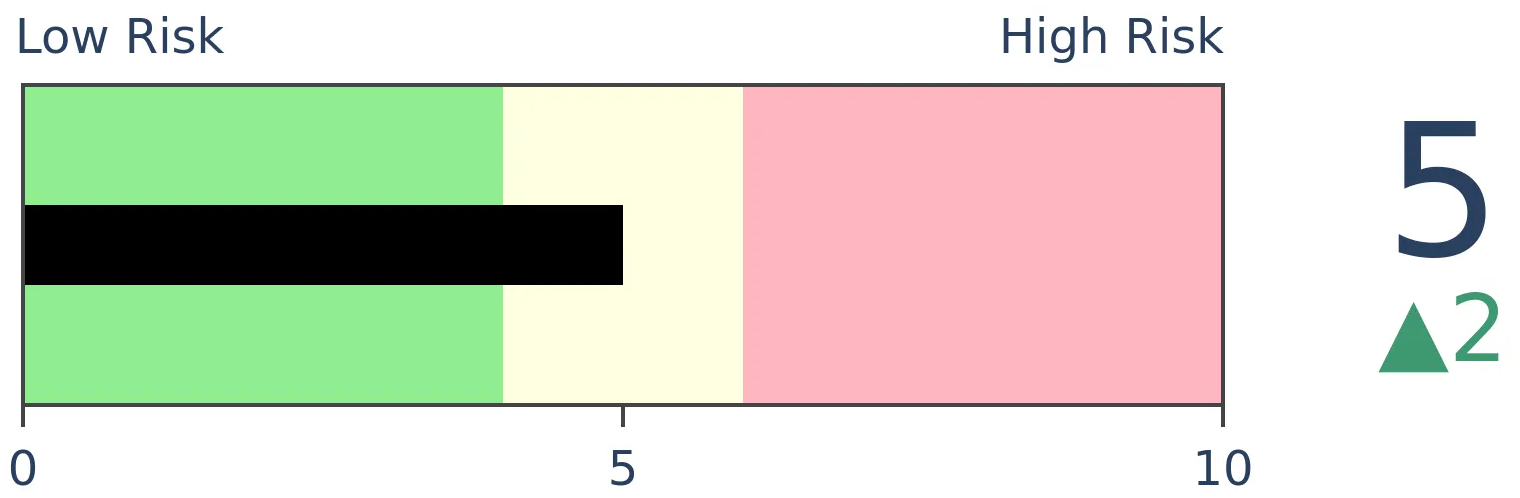
Stocks Medium-Term
|
|
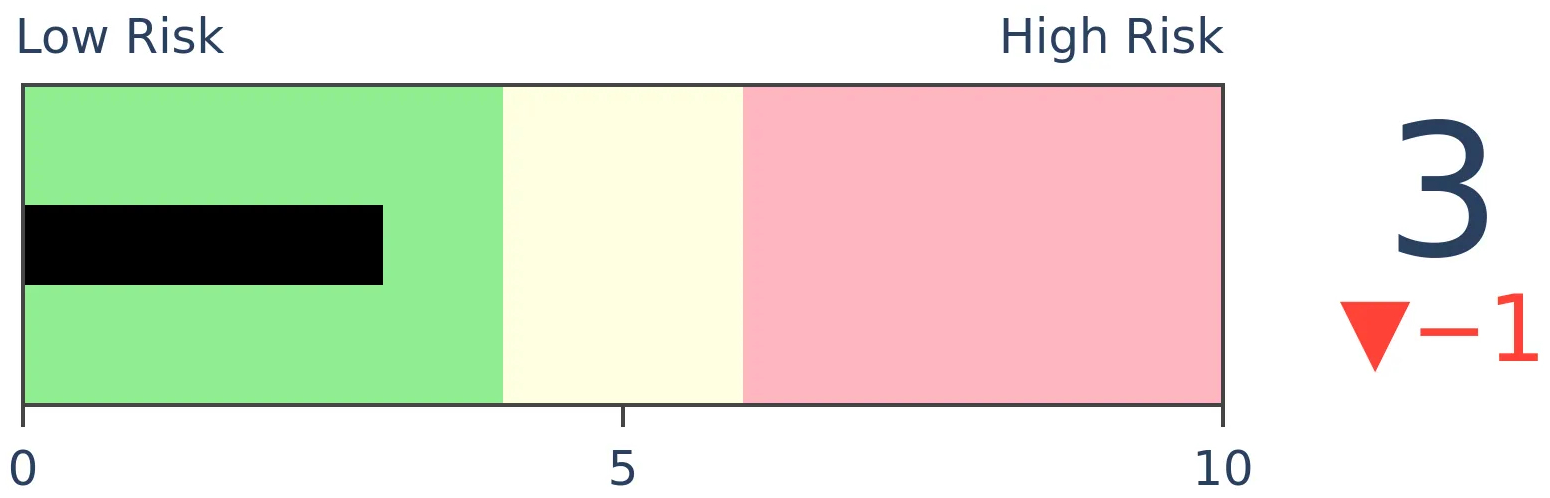
Bonds
|
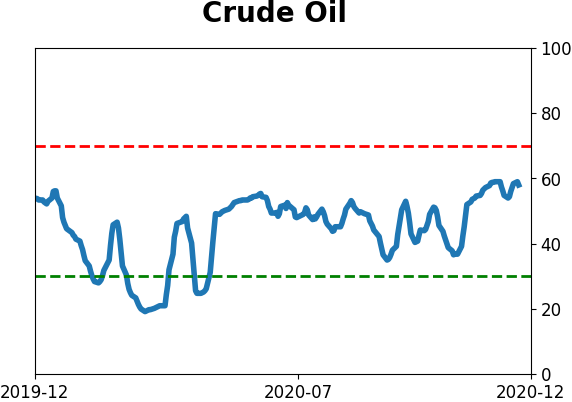
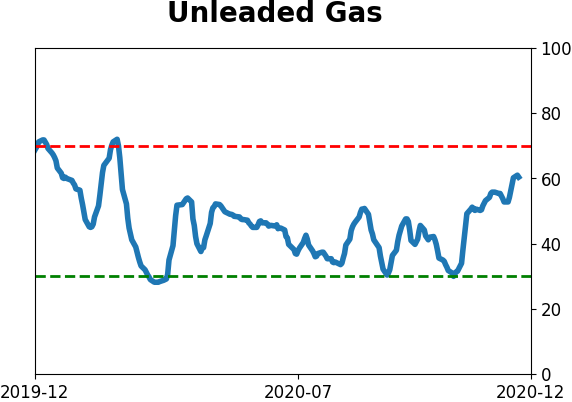
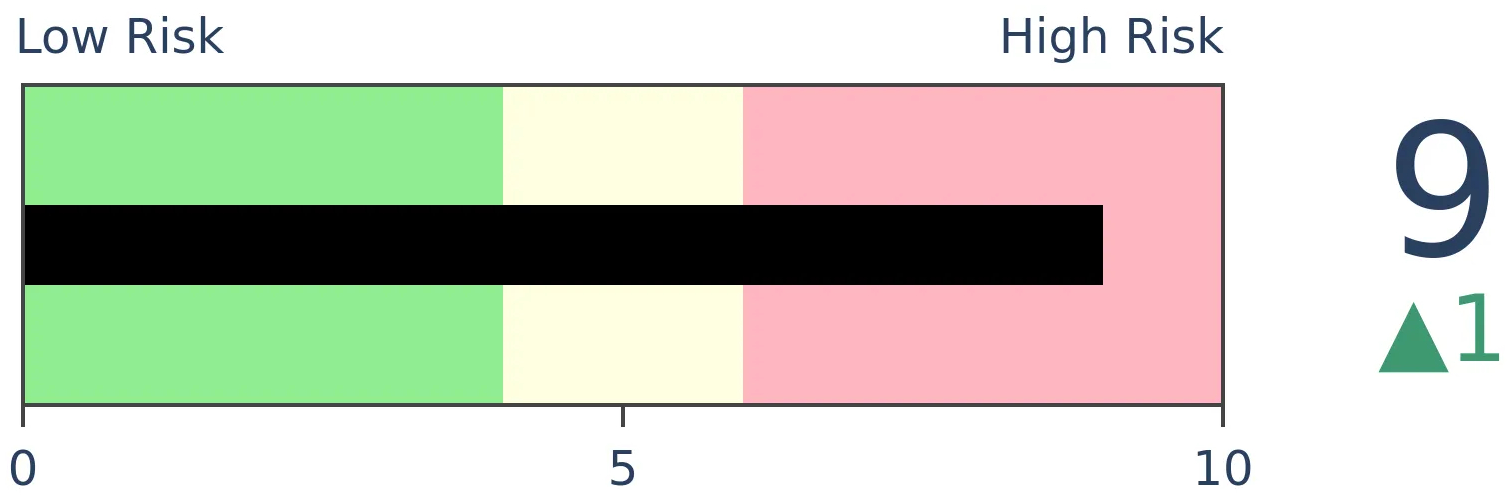
Crude Oil
|
|
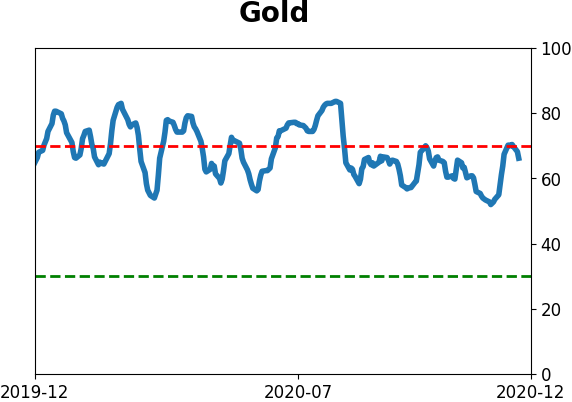
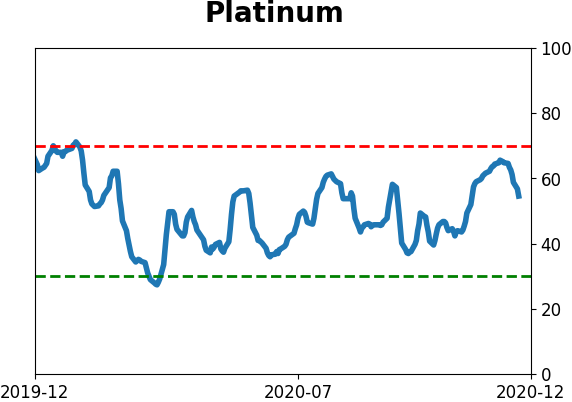
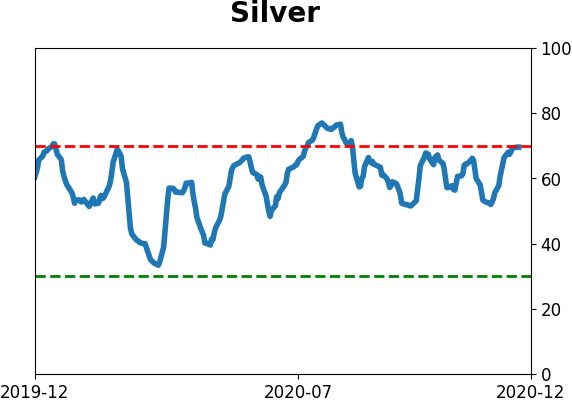
Gold
|
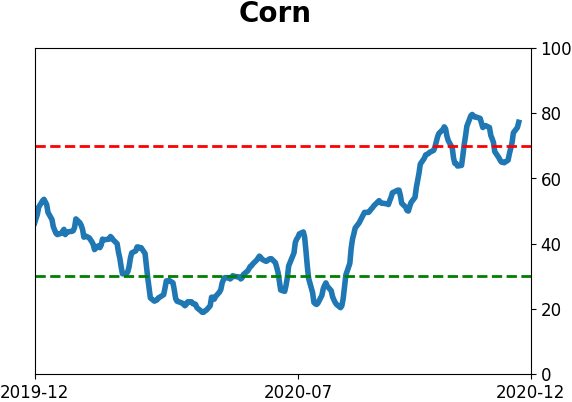
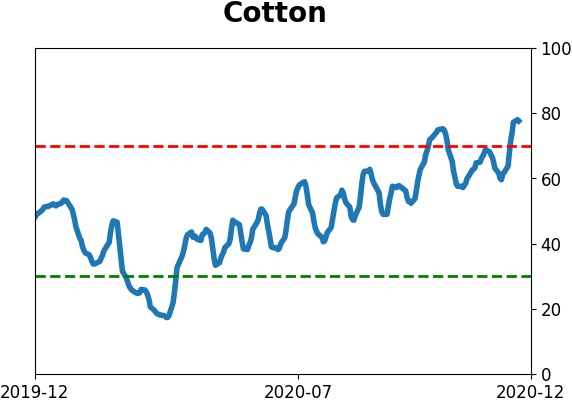
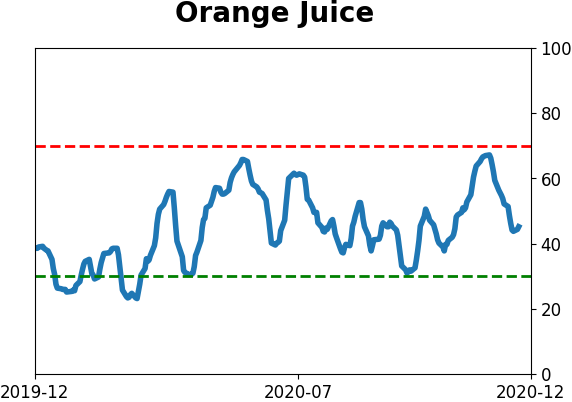
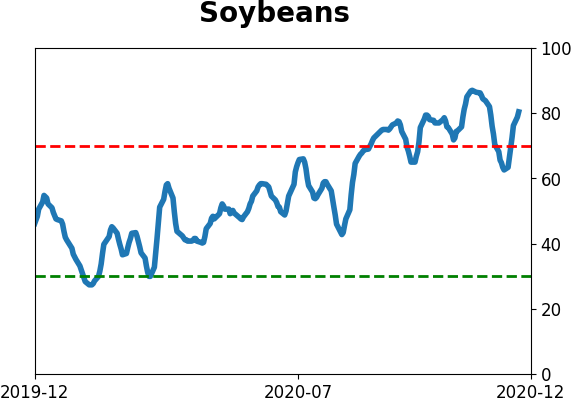
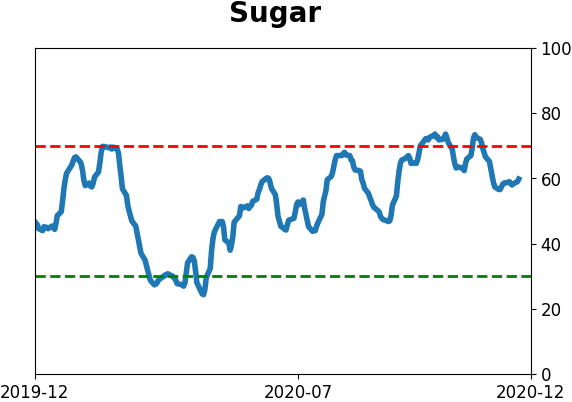
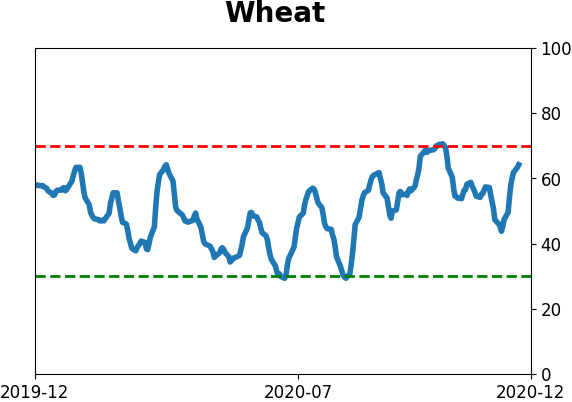
Agriculture
|
|
Research
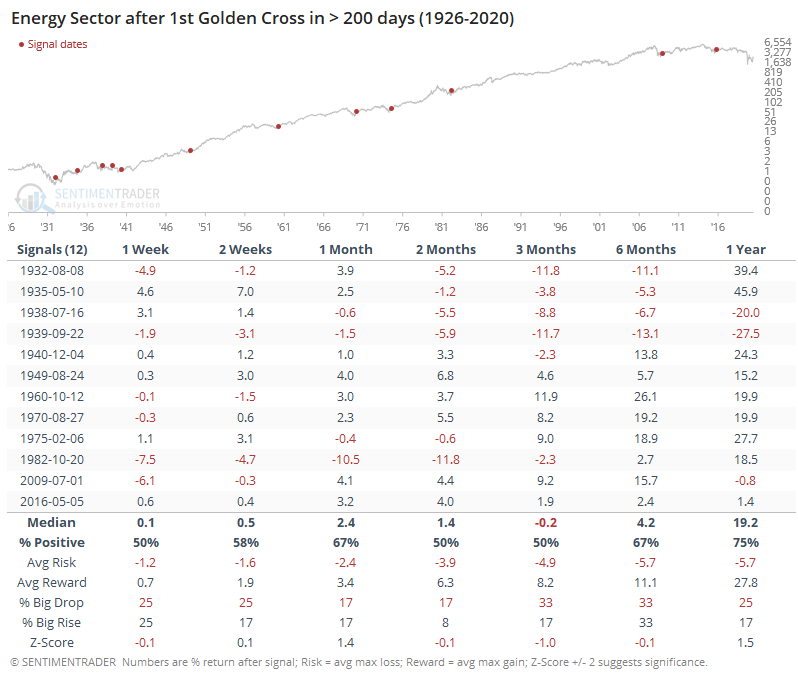
BOTTOM LINE
For the first time in 2 years, the energy sector is on the cusp of seeing its 50-day moving average cross above the 200-day average. This would end one of the longest downtrends since 1926, and the ends of other prolonged downtrends had a tendency to see rising prices over the longer-term.
FORECAST / TIMEFRAME
None
|
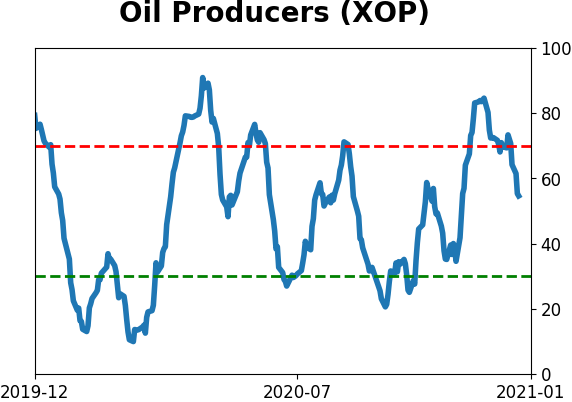
Earlier this fall, we saw that the energy sector had become the most-hated of all time and firms were cutting workers and dividends, before there were finally some signs of an uptick.
Many of these stocks staged a furious rally then spent recent weeks digesting those gains. Even so, it's been enough of a change in trend that the S&P 500 Energy Sector's 50-day moving average is oh-so-close to crossing above the 200-day average. It would be the first time in more than 2 years.
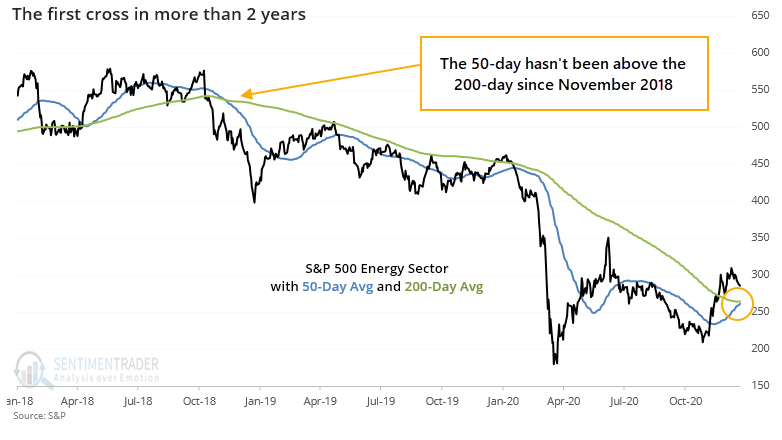
When this finally does cross, it will end the 2nd-longest streak of being in a downtrend since 1926.
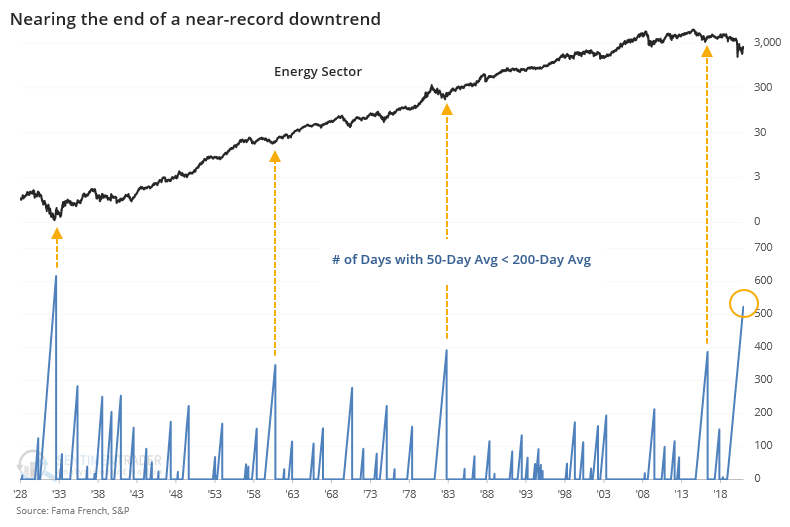
When we look at long-term returns after the ends of such long streaks, there were further gains every time during the next 1-2 years. It was volatile, but the sector enjoyed an average gain of more than 42% at its best point during the next 2 years.
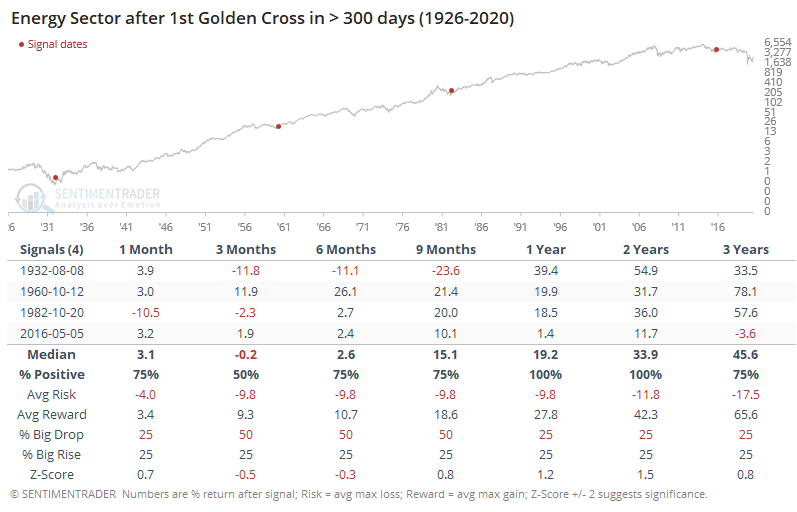
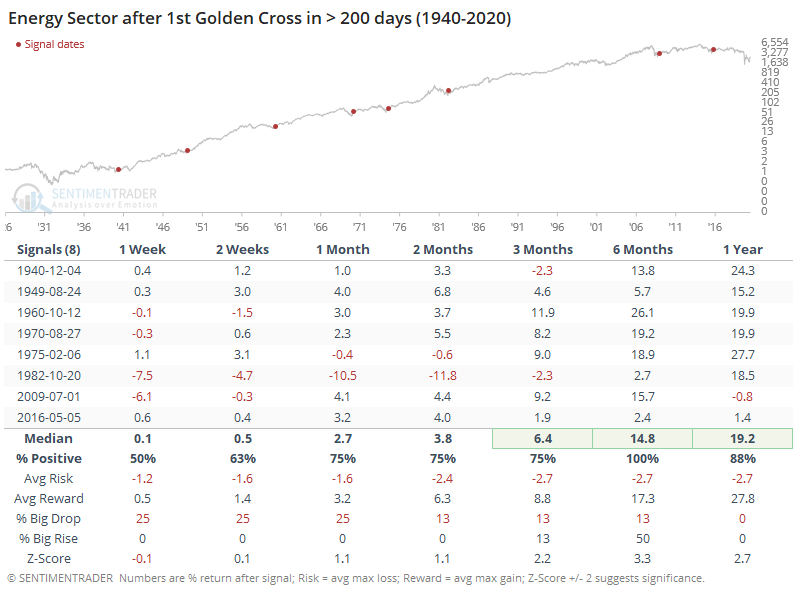
If we look at the ends of less protracted downtrends, then returns were still quite good. These are looking at shorter time frames.
Most of the losses occurred in the 1930s, so if we cheat a bit and start at 1940, then returns improved significantly, with no losses over the next 6 months and including an impressive risk/reward ratio. Over the next year, the sector averaged a nearly 28% gain at its best point, versus not even -3% downside at its worst point.
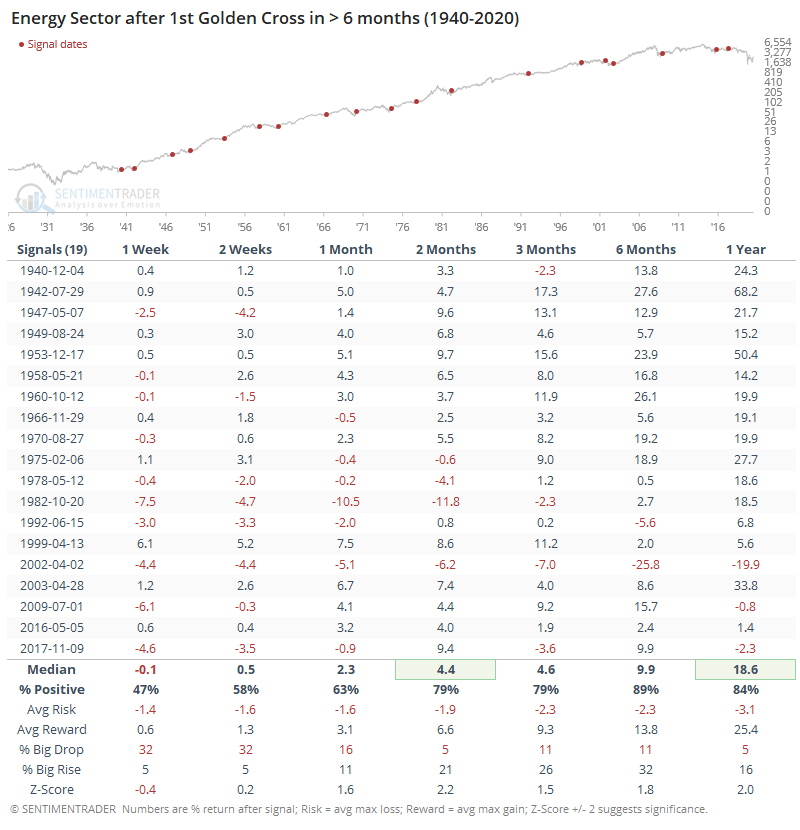
If we relax the parameters even more, with the first moving average cross in 6 months or more, then we can still see a positive bias (since 1940).
It's hard to buy an asset that's hated, especially to a historic degree. There's no telling when conditions are going to morph from horrible to less-horrible. The news flow won't help, because it's almost always the worst at the point of maximum pessimism, and there is great skepticism when the asset finally shows signs of life. We're seeing that now in energy, as well.
The conditions were ripe for a turn this fall, and now some trend measures are starting to suggest that perhaps it's sustainable. This should allow more trend-followers to hop on board and those who missed the initial surge to finally see their opportunity.
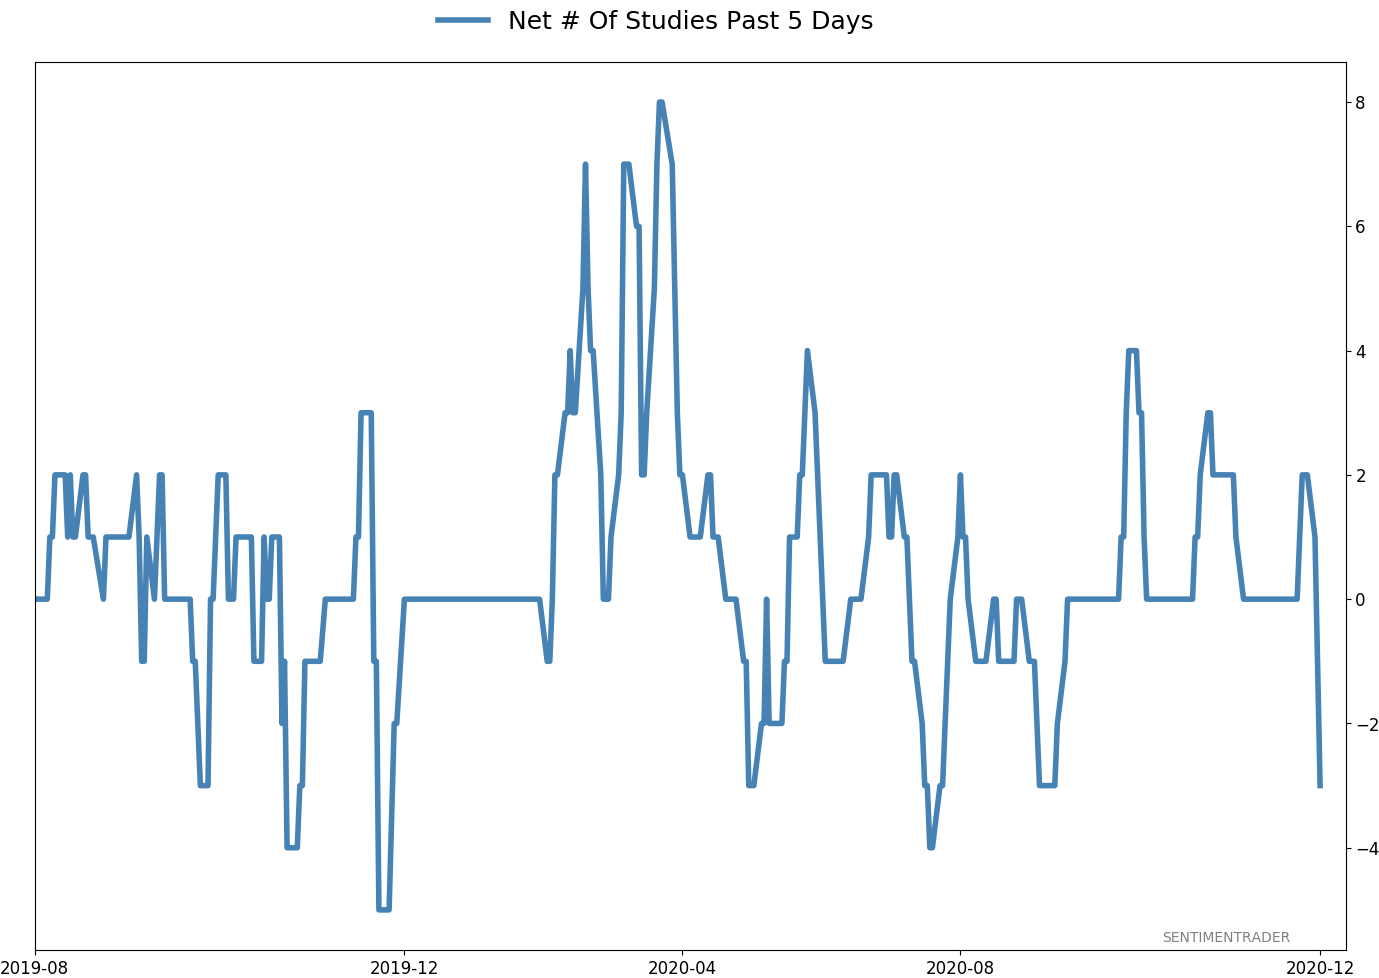
Active Studies
| Time Frame | Bullish | Bearish | | Short-Term | 0 | 0 | | Medium-Term | 4 | 1 | | Long-Term | 47 | 3 |
|
Indicators at Extremes
Portfolio
| Position | Description | Weight % | Added / Reduced | Date | | Stocks | 10.4% VWO, 9.1% XLE, 8.5% RSP, 6.6% PSCE | 34.5 | Reduced 6.7% | 2020-12-14 | | Bonds | 10% BND, 10% SCHP, 10% ANGL | 28.4 | Reduced 0.1% | 2020-10-02 | | Commodities | GCC | 2.4 | Reduced 2.1%
| 2020-09-04 | | Precious Metals | GDX | 8.9 | Added 4.8% | 2020-12-01 | | Special Situations | | 0.0 | Reduced 5% | 2020-10-02 | | Cash | | 25.8 | | |
|
Updates (Changes made today are underlined)
Quite a few of the studies that have been triggering for stocks have showed a poor risk/reward skew over a short- to medium-term time frame, even though many of them have also been quite positive over medium- to long-term time frames. We're in a very favorable seasonal window, so it would be somewhat odd to see a substantial pullback in the next few weeks. Leave it to 2020 to do just that, I suppose, but the calendar is a point in bulls' favor. Even so, record-high-and-declining sentiment, coupled with early signs of a reversal were enough that I reduced my S&P 500 position a bit. I fully expect that the energy funds will suffer some losses in the coming weeks, but as I noted when buying them, they're intended as long-term positions and almost by definition they're going to be volatile. RETURN YTD: 7.7% 2019: 12.6%, 2018: 0.6%, 2017: 3.8%, 2016: 17.1%, 2015: 9.2%, 2014: 14.5%, 2013: 2.2%, 2012: 10.8%, 2011: 16.5%, 2010: 15.3%, 2009: 23.9%, 2008: 16.2%, 2007: 7.8%
|
|
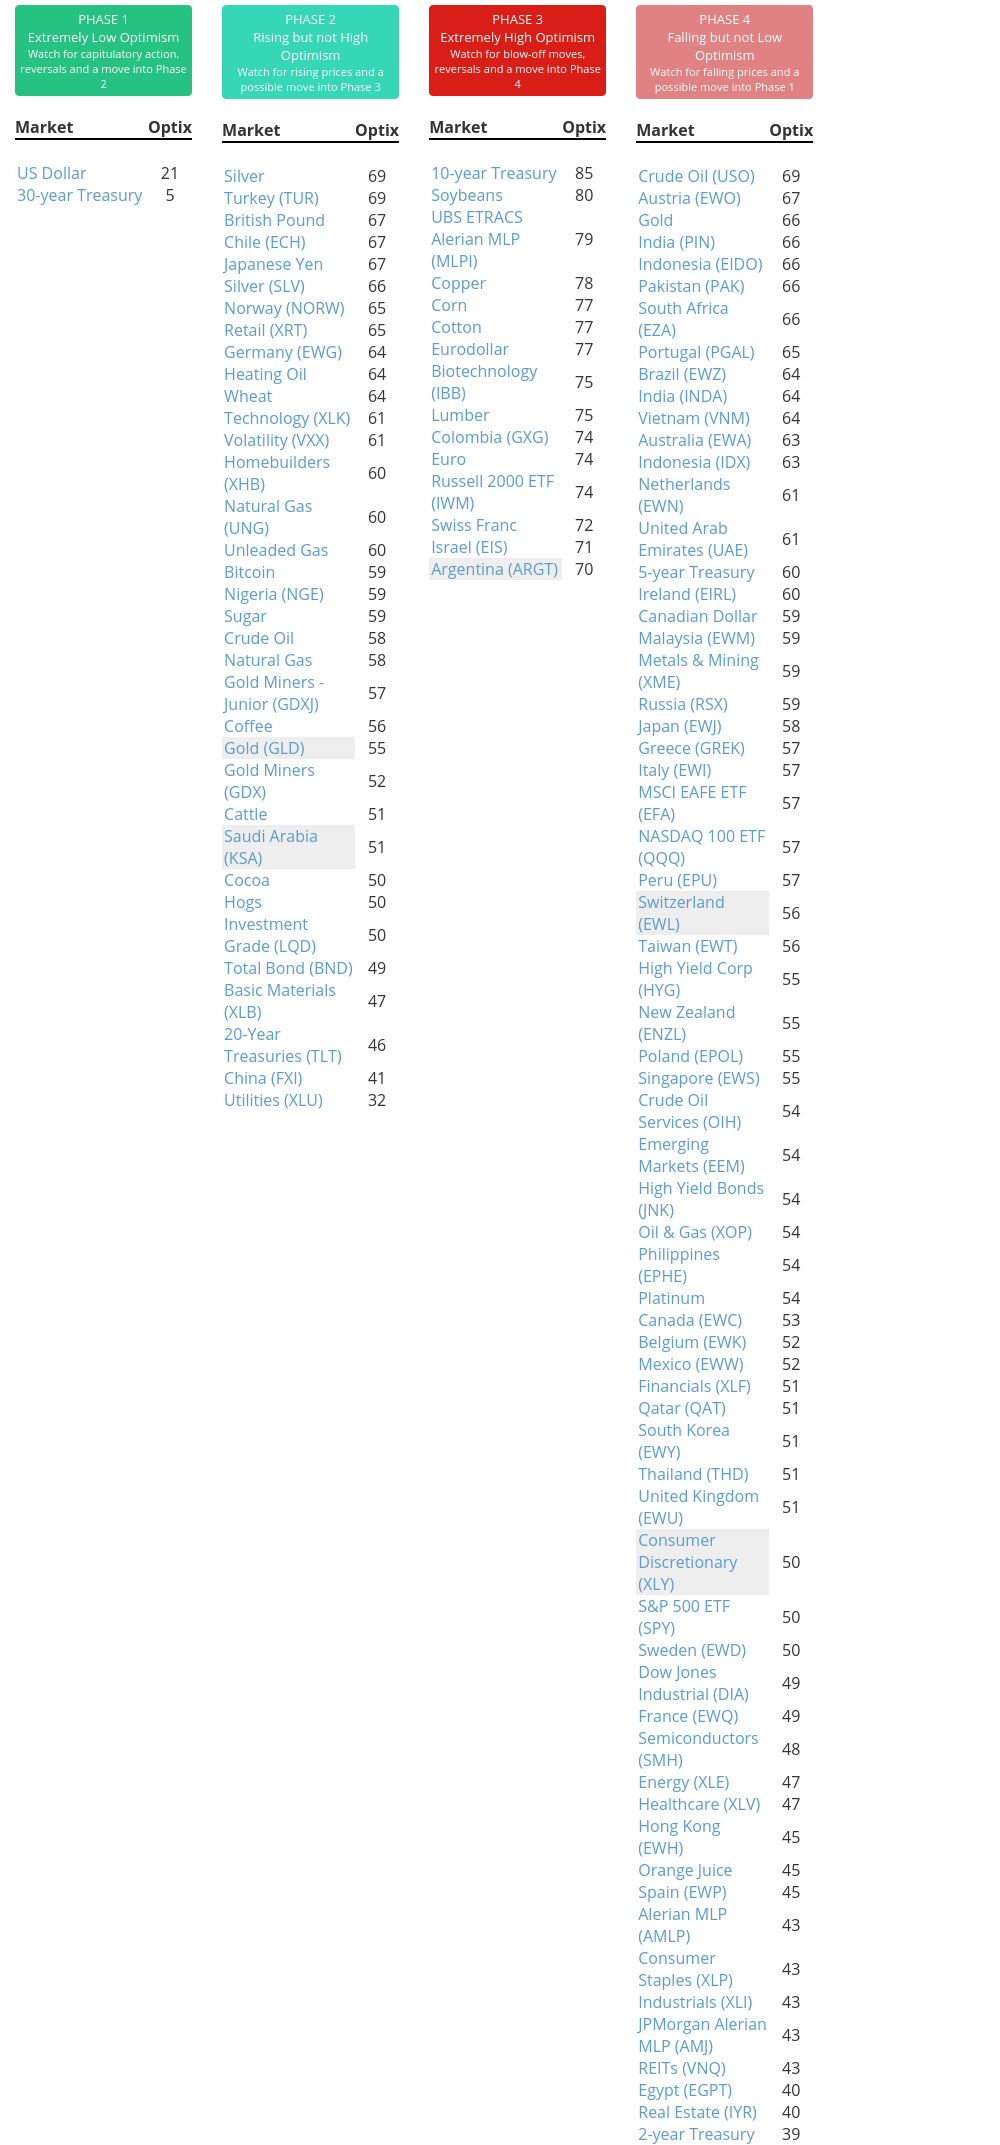
Phase Table
Ranks
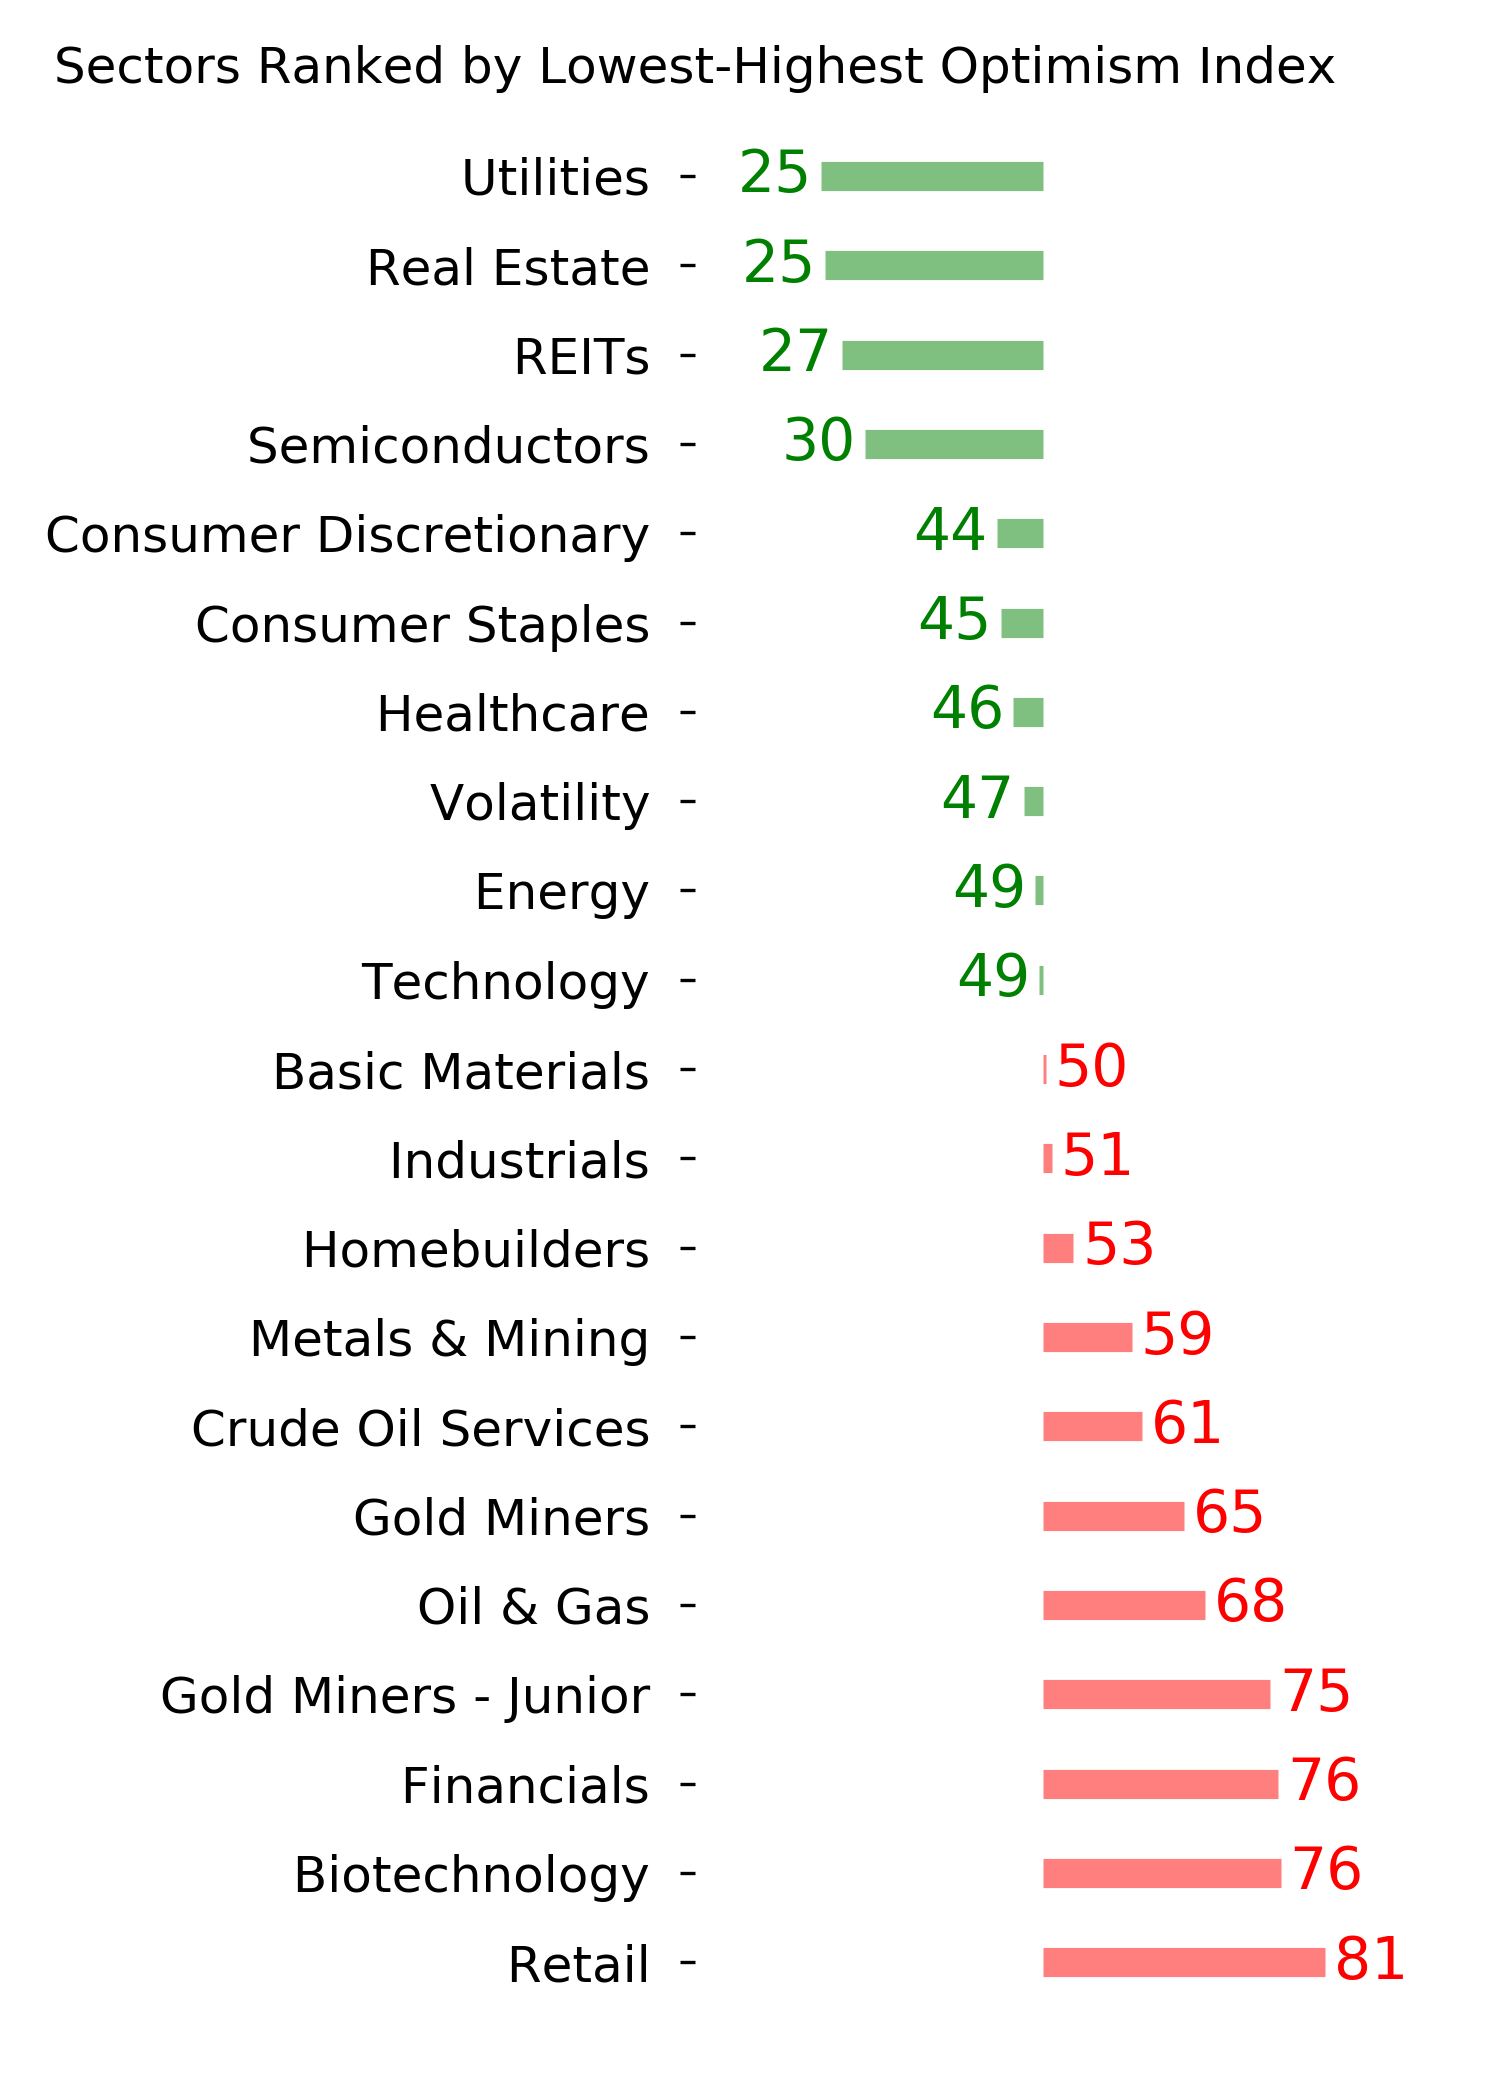
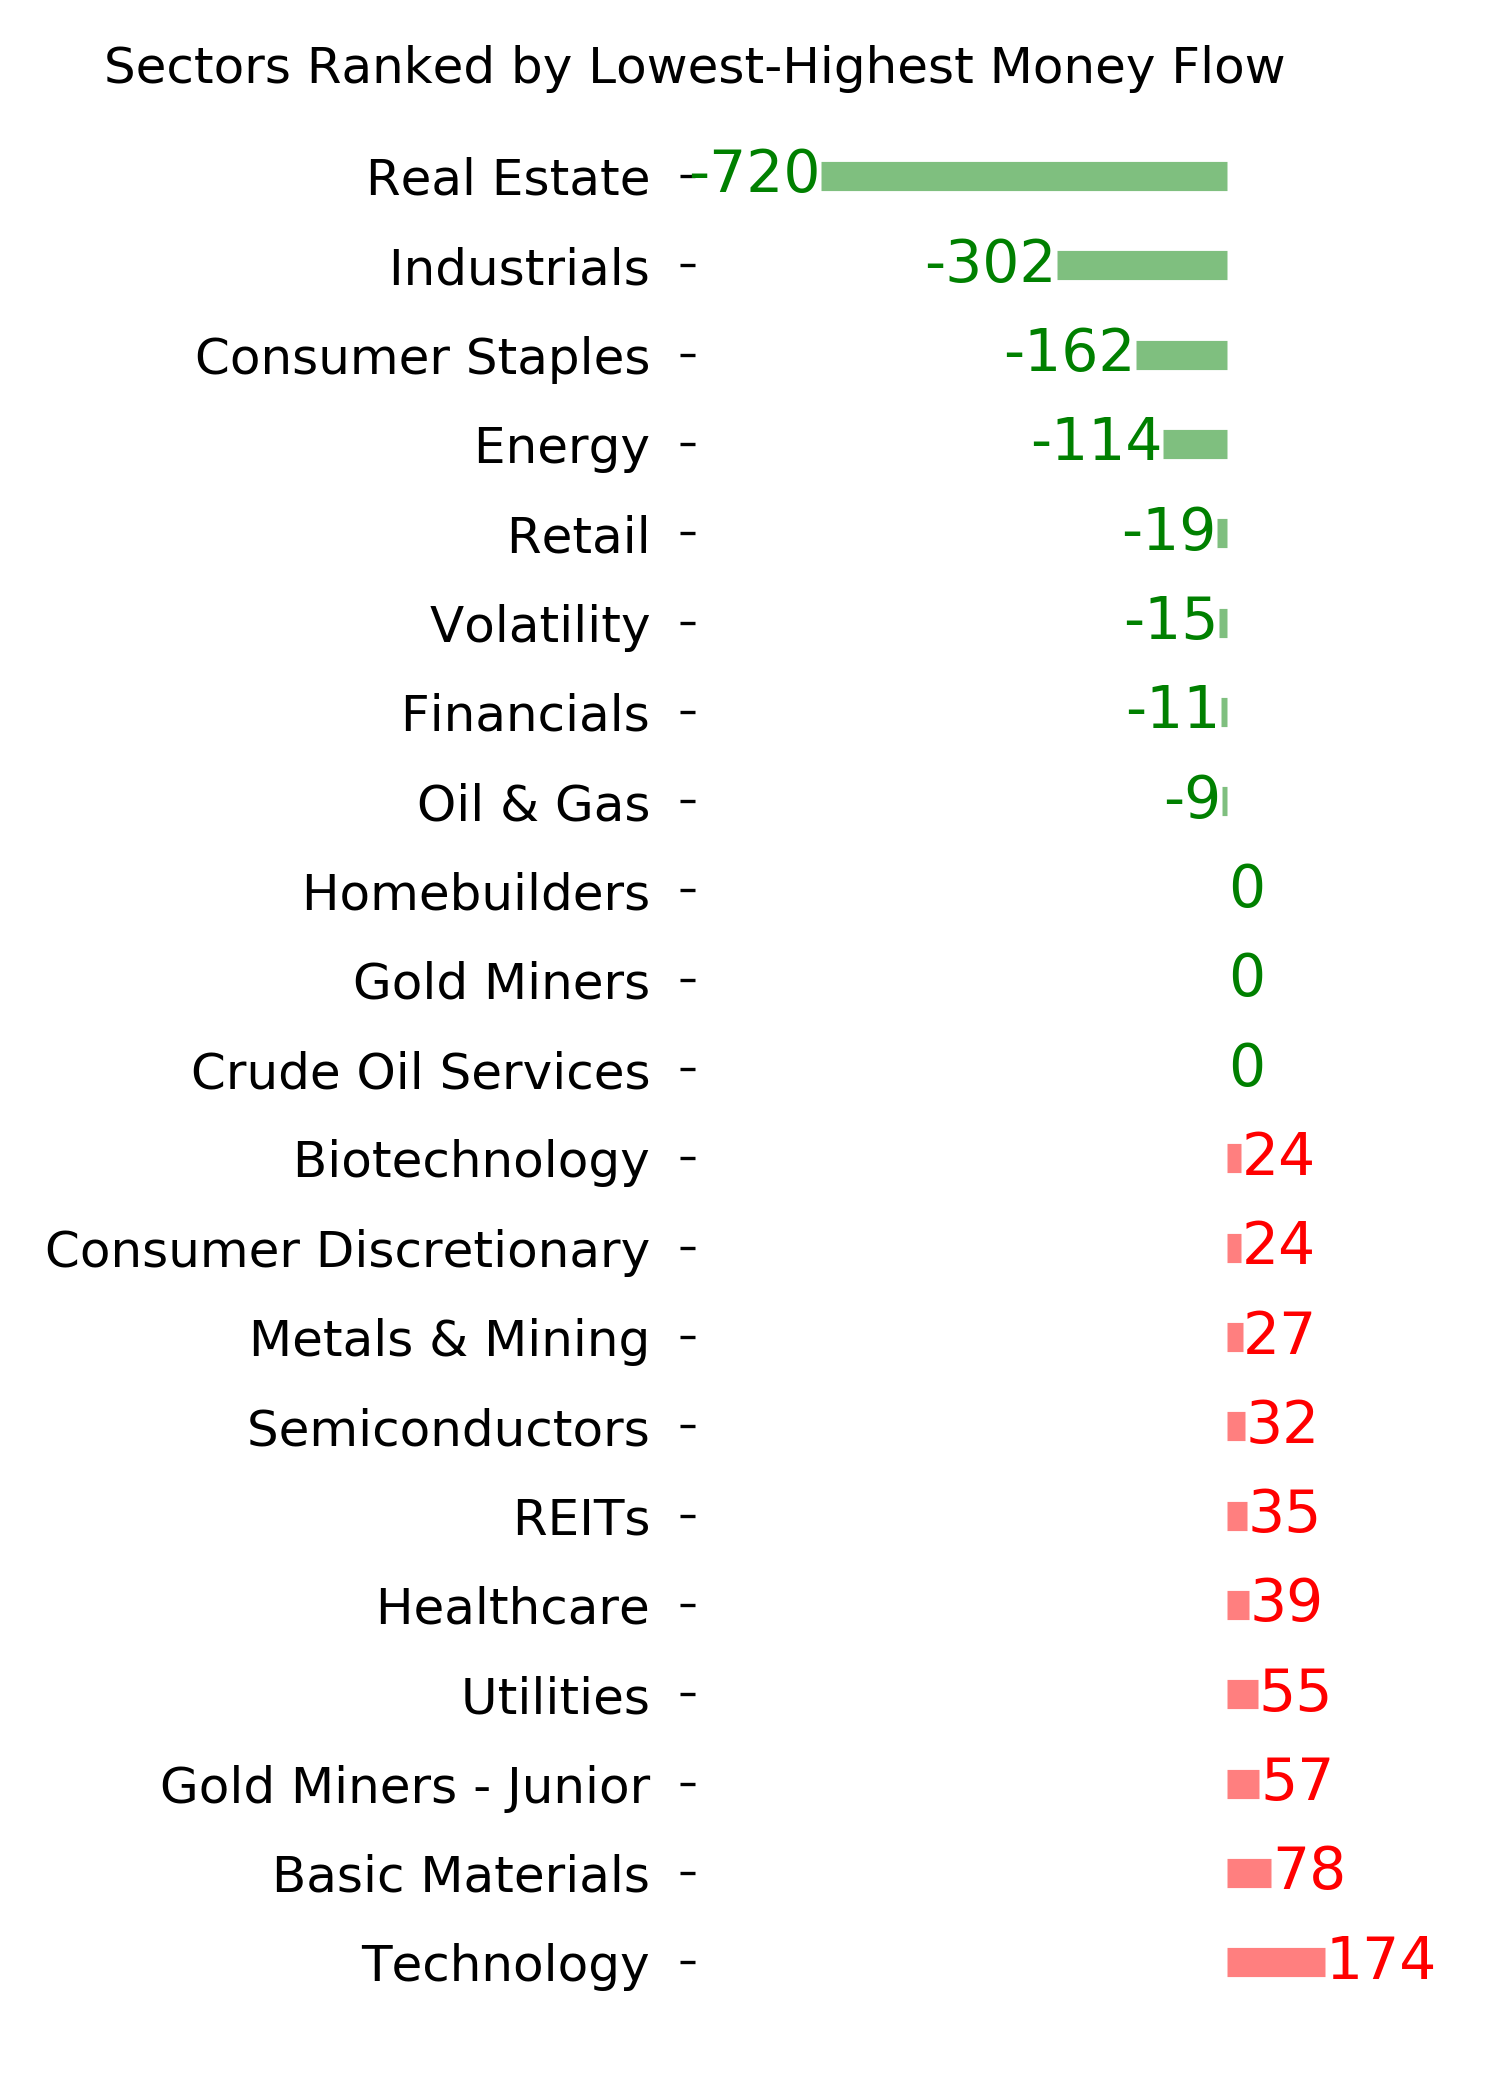
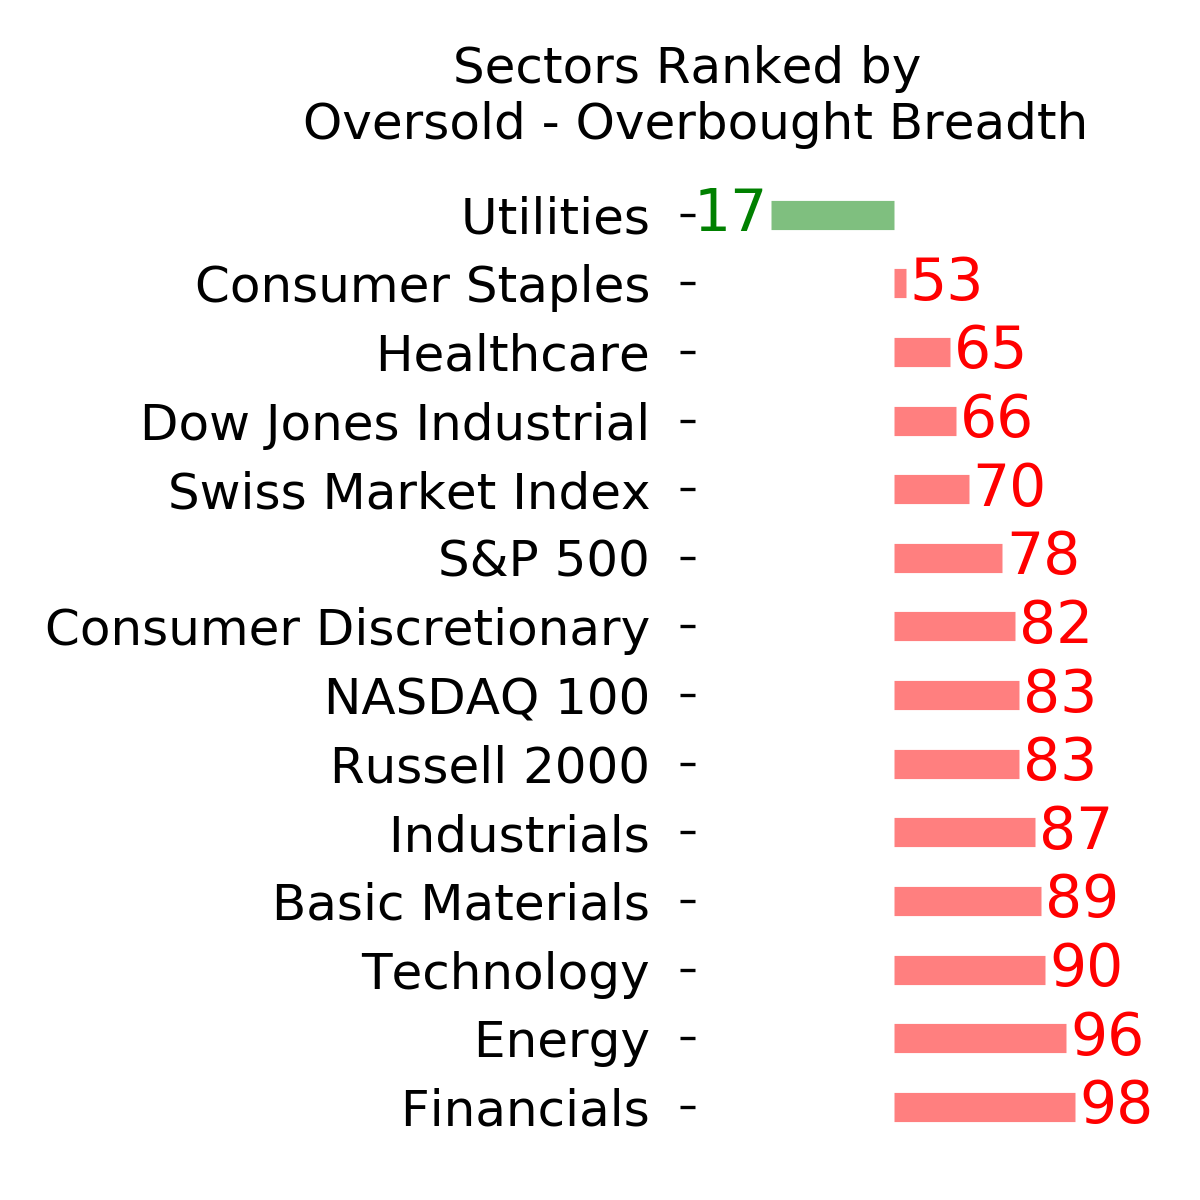
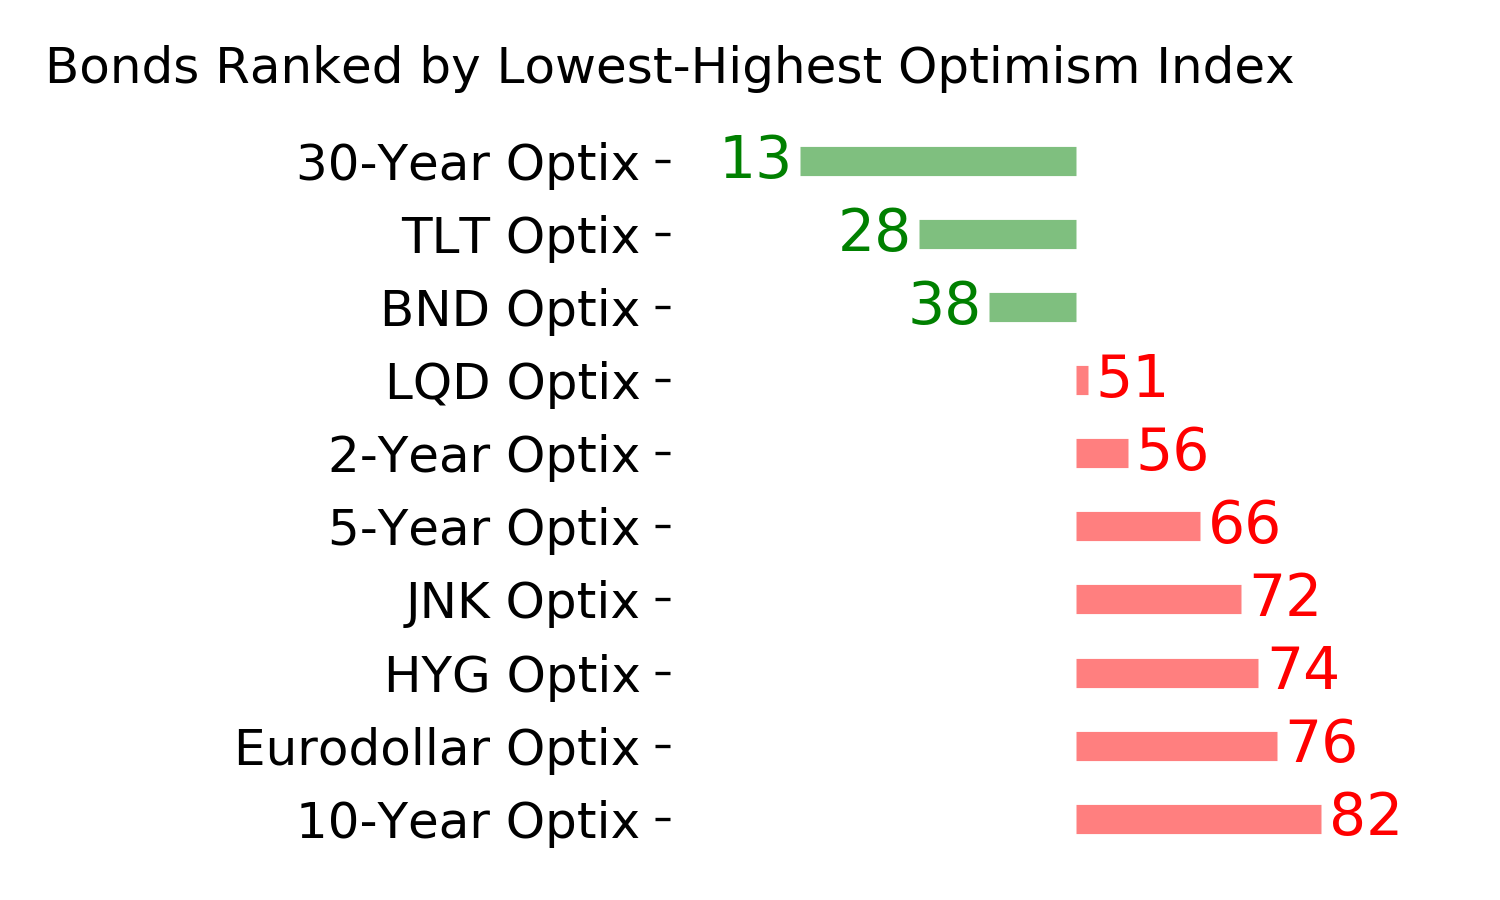
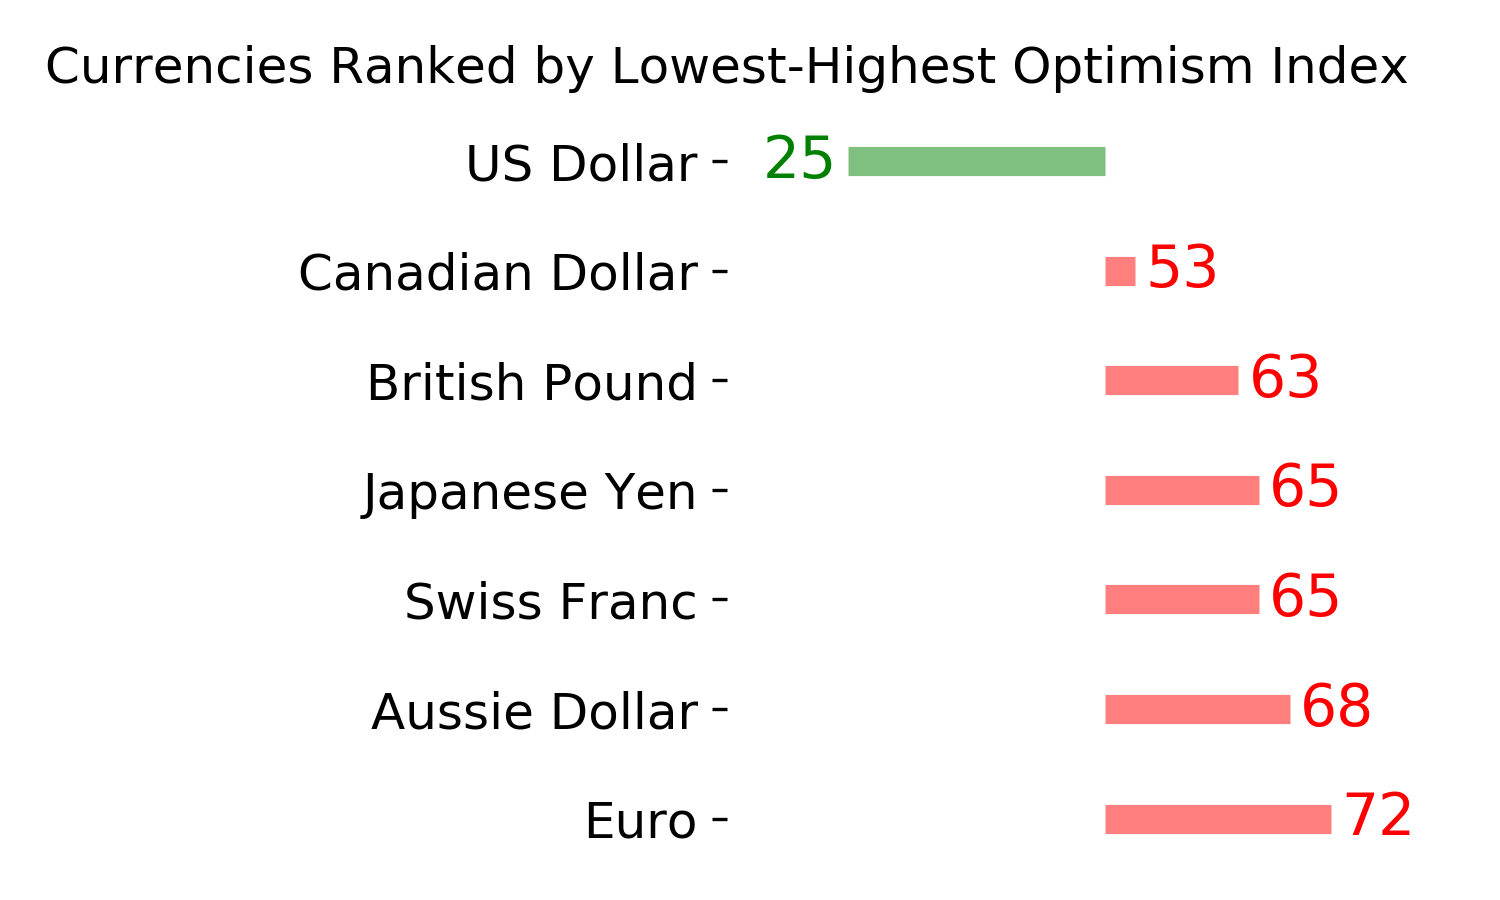
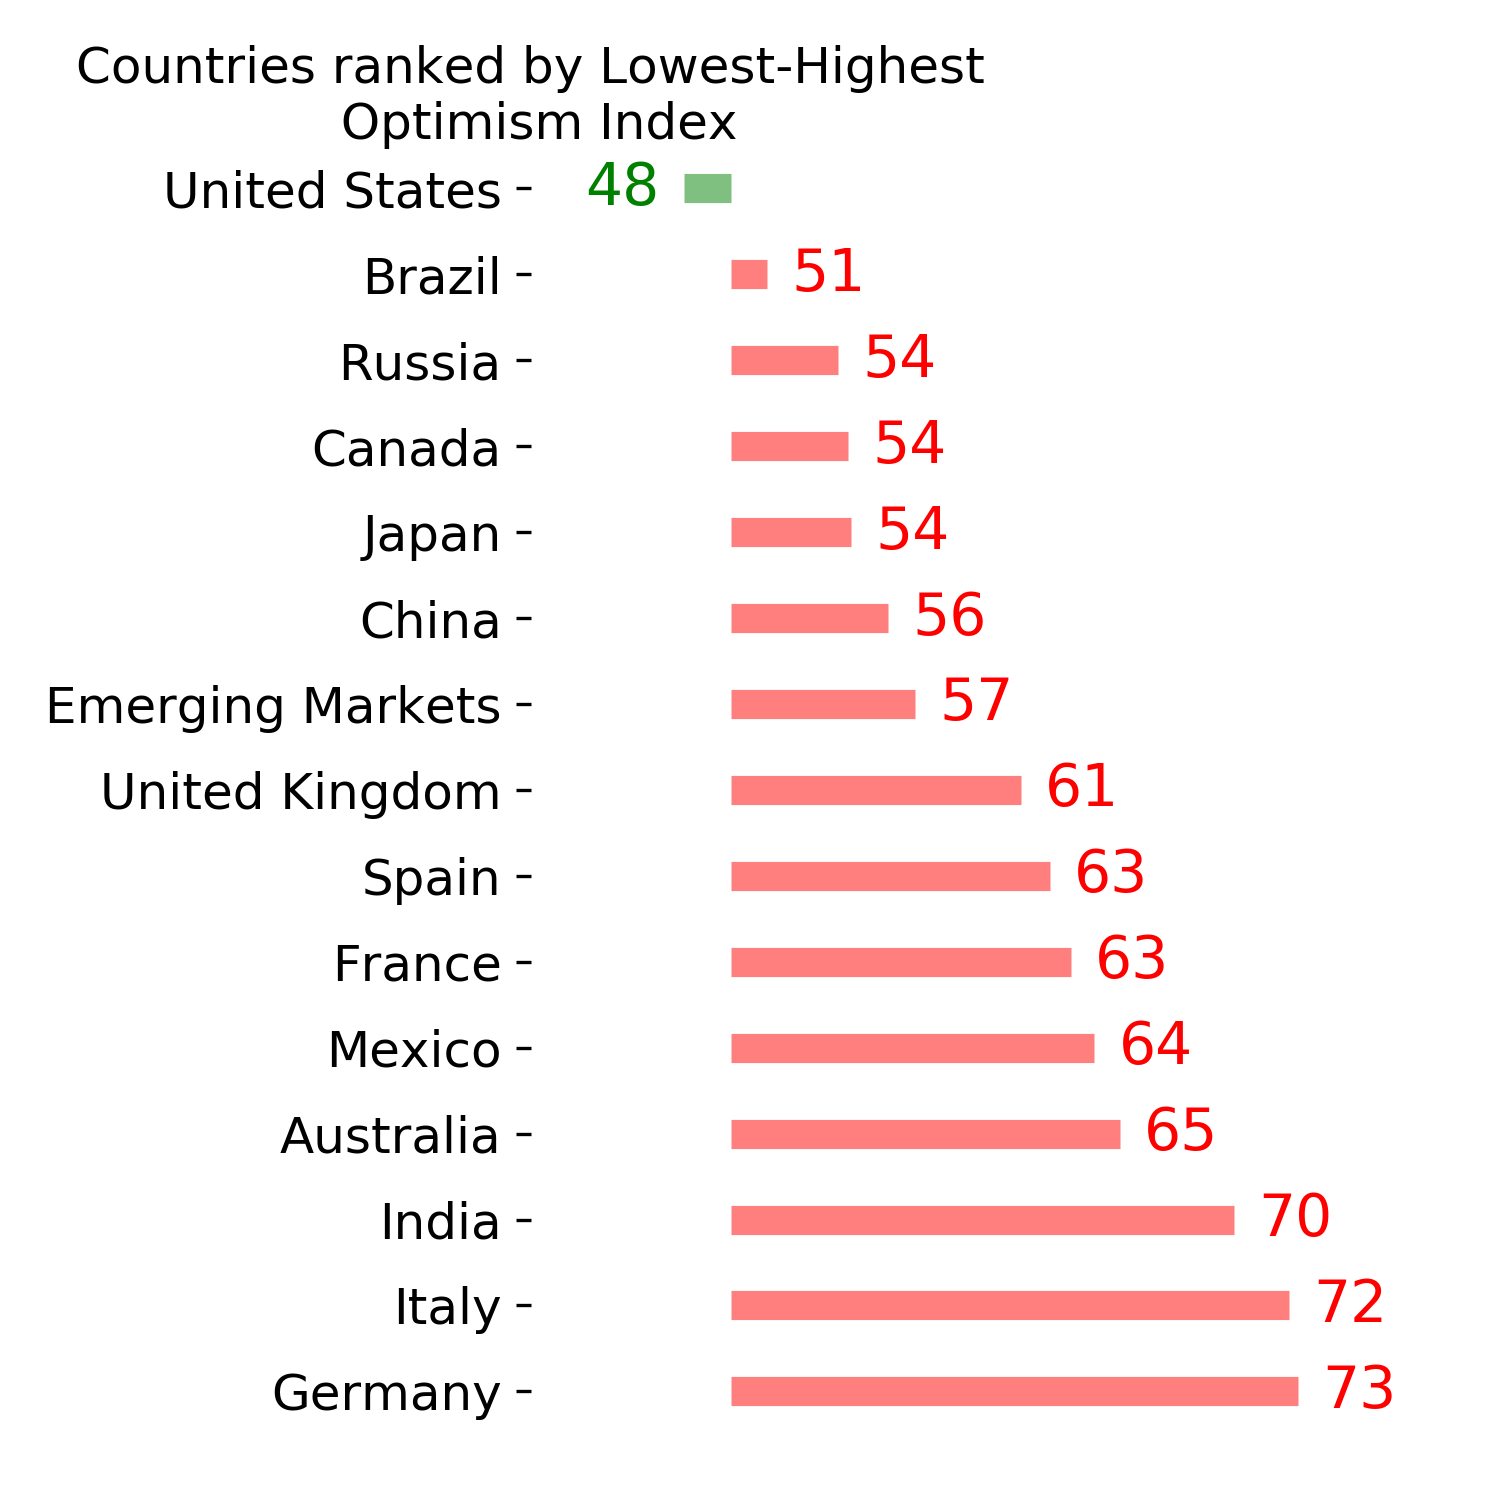
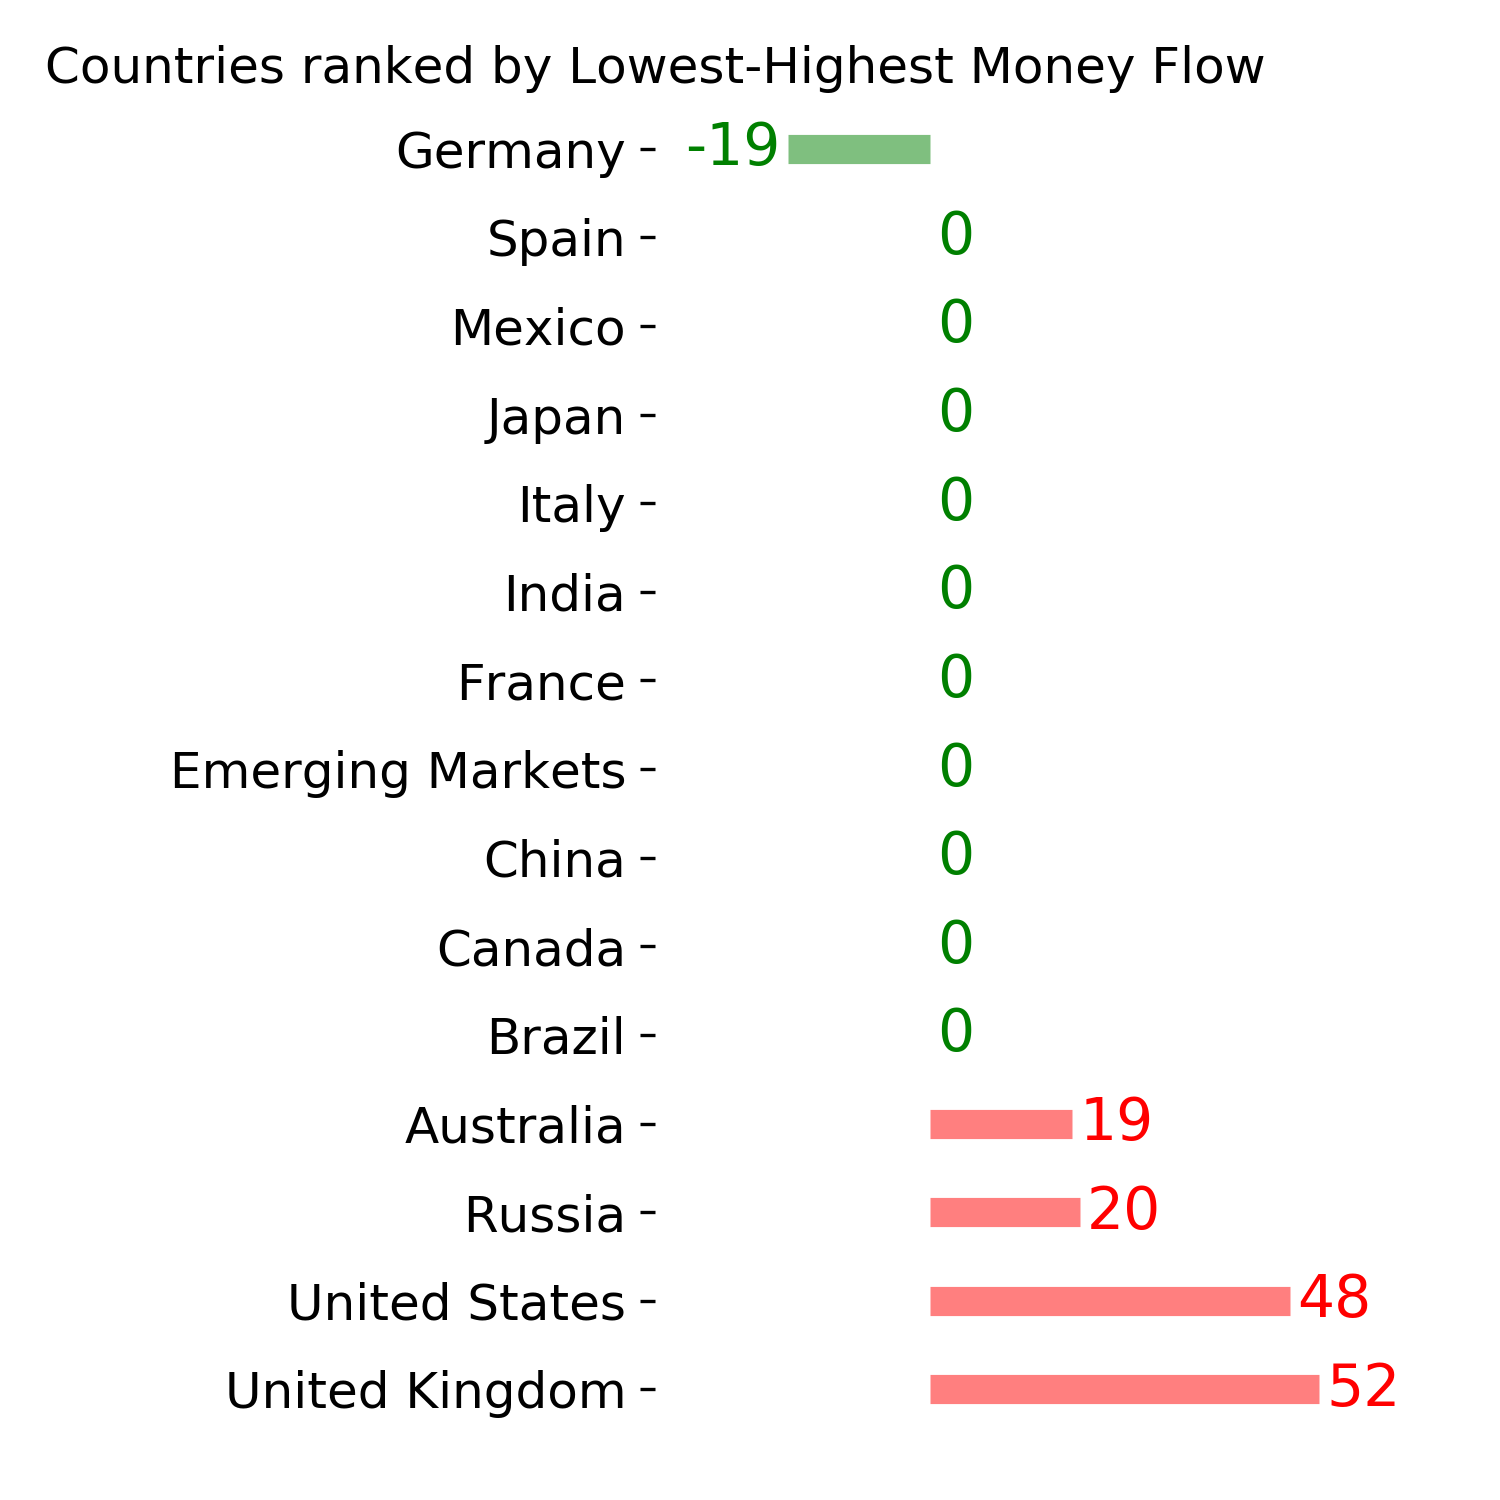
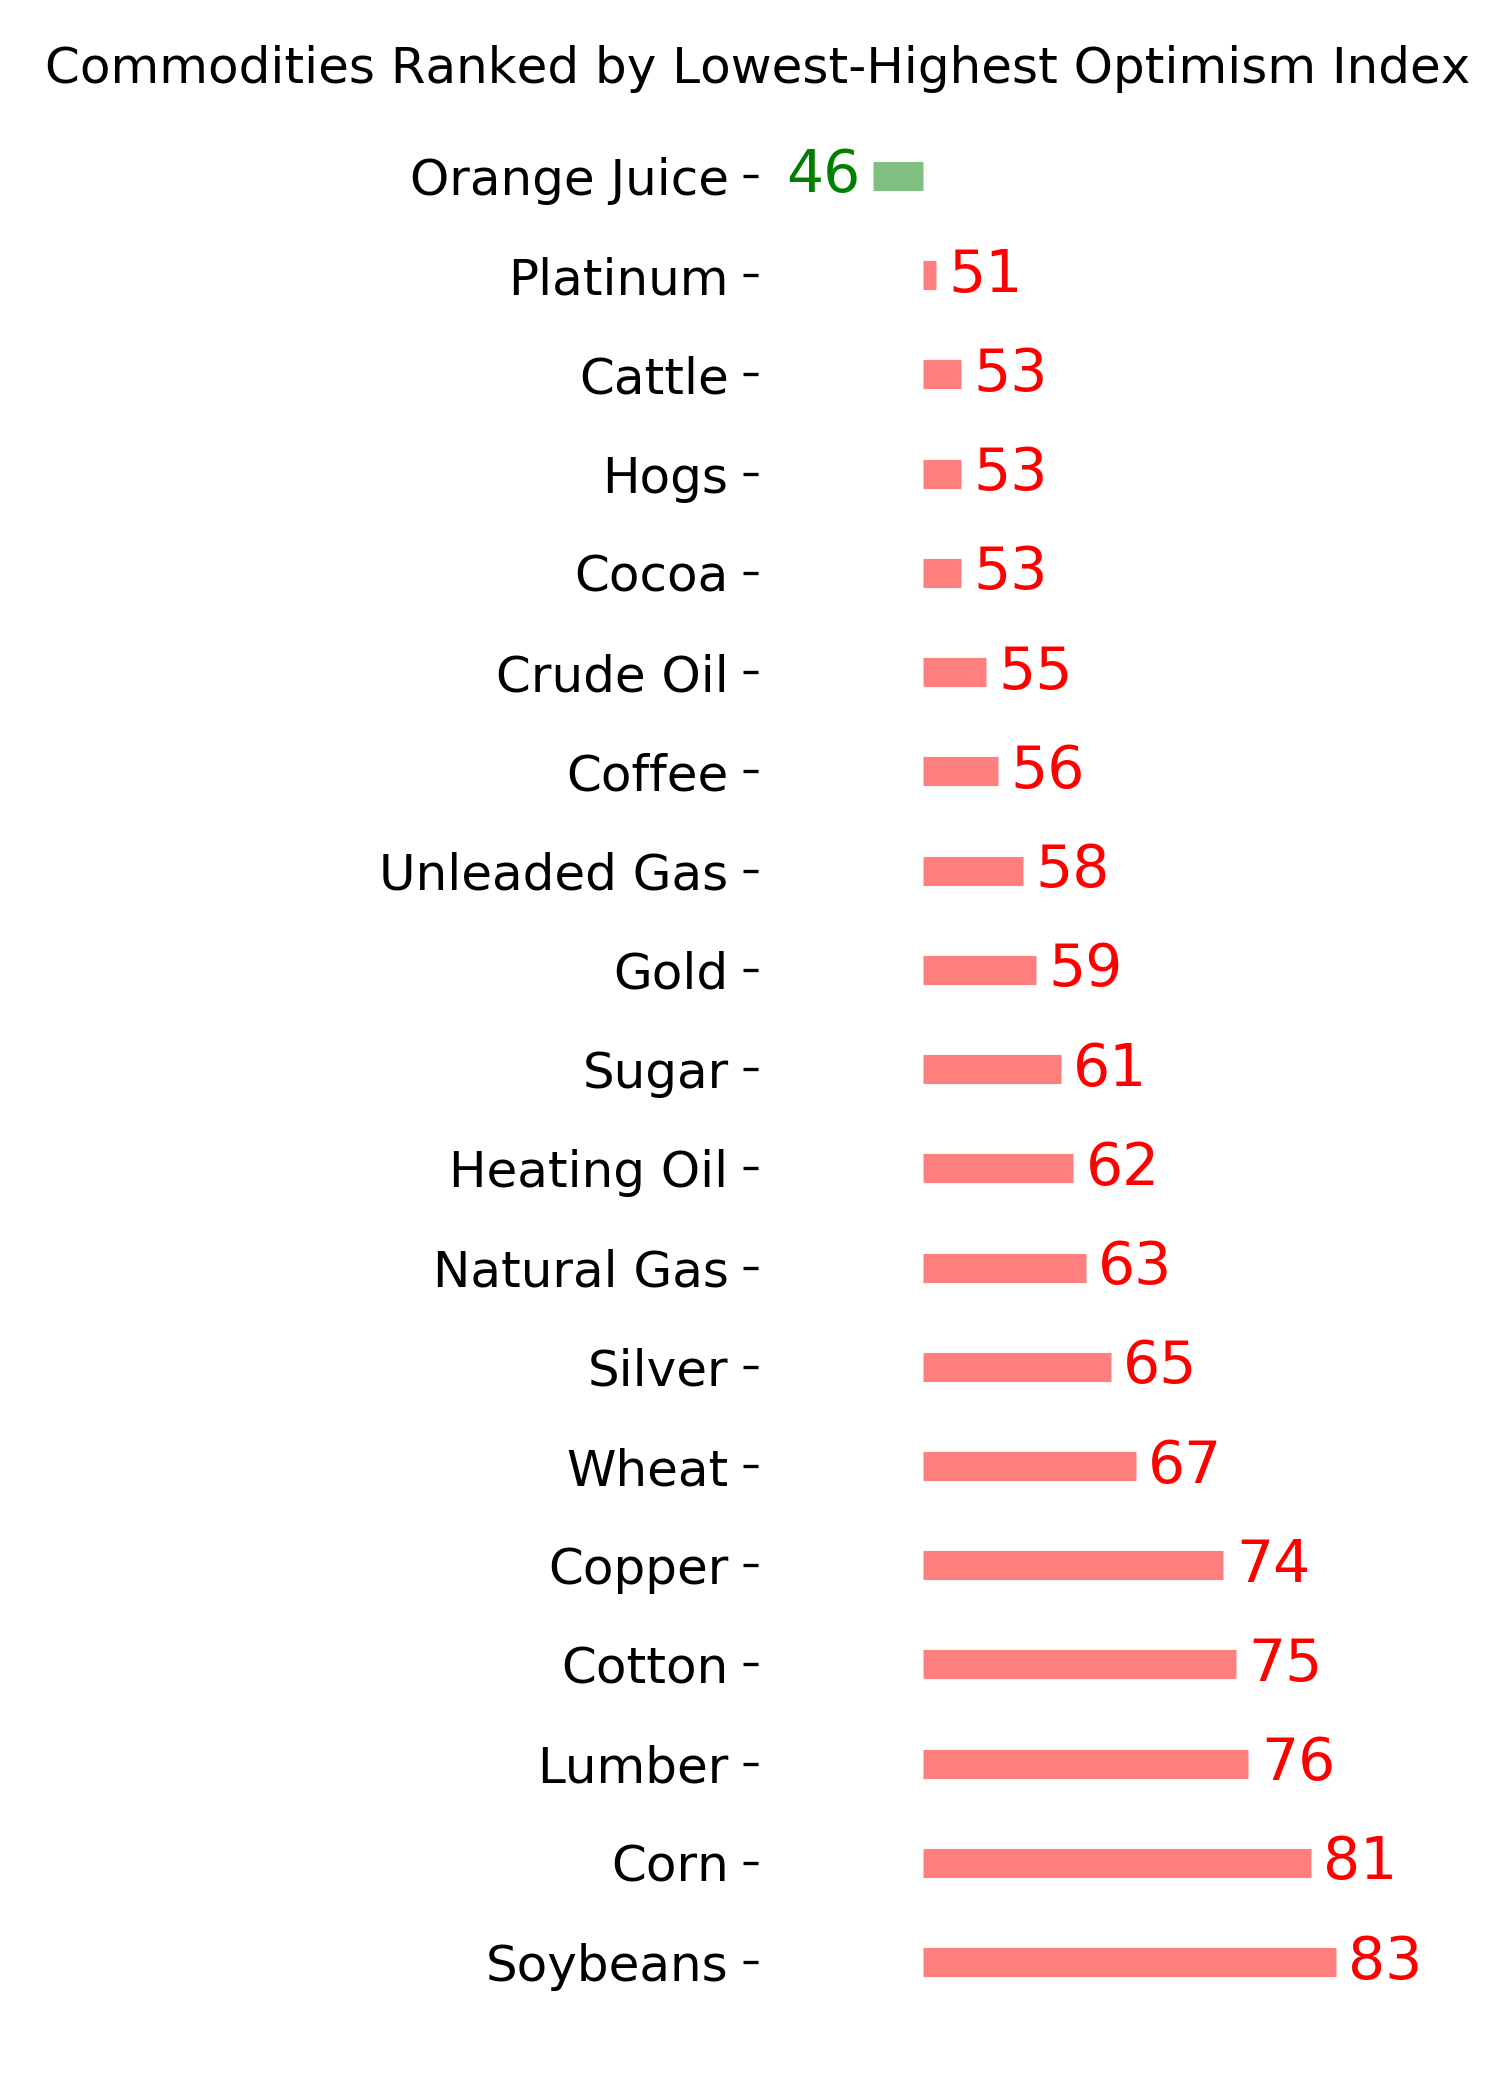
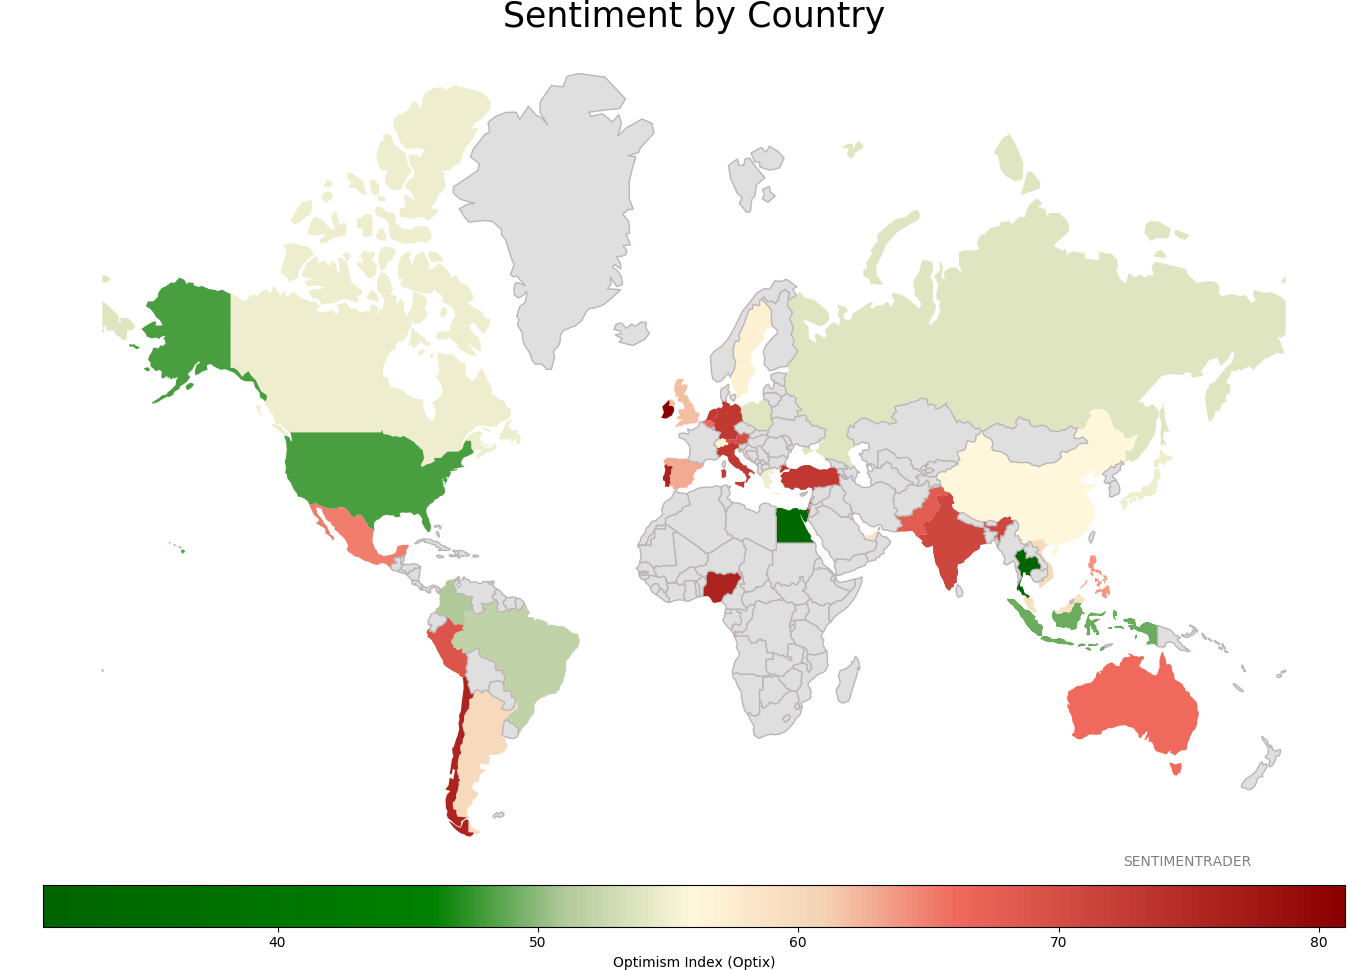
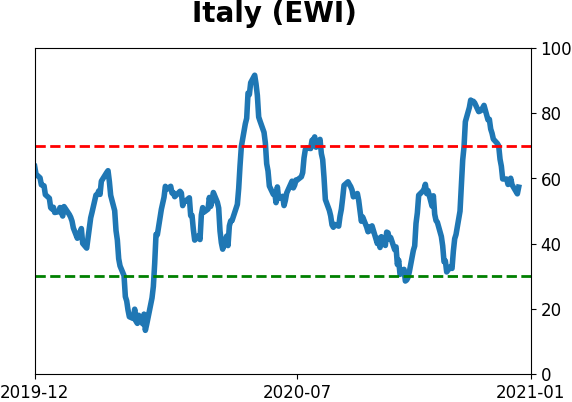
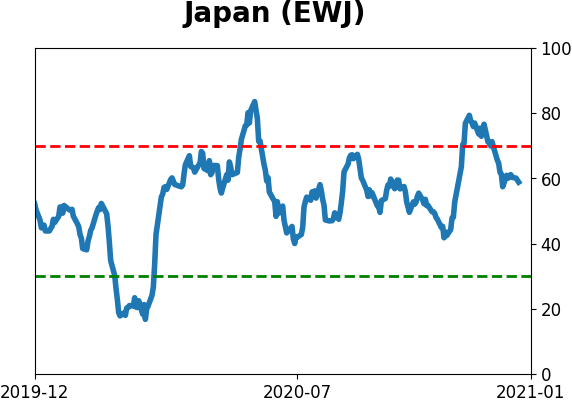
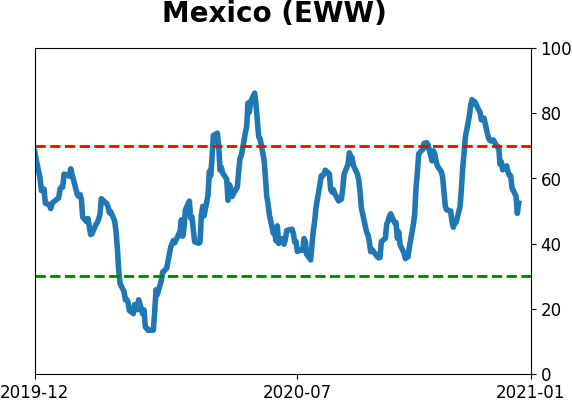
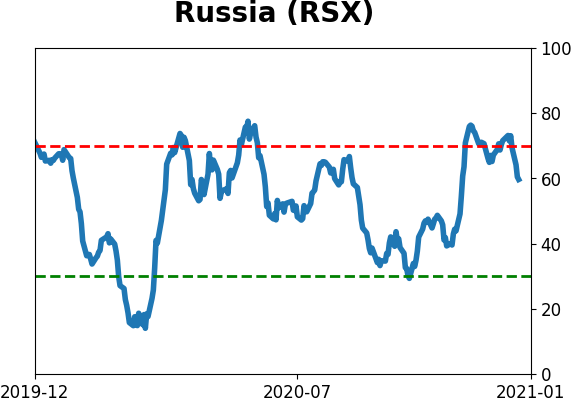
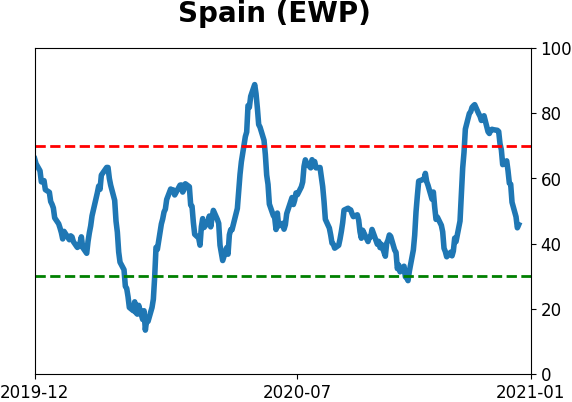
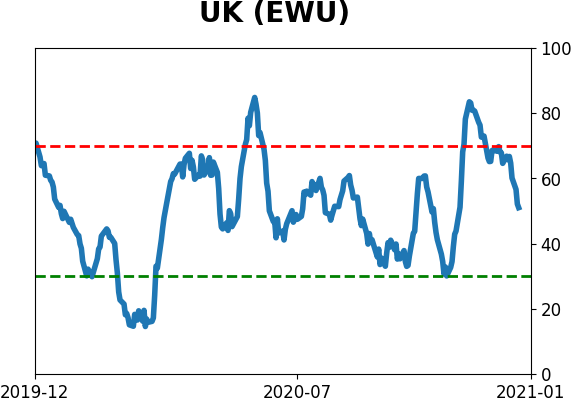
Sentiment Around The World
Optimism Index Thumbnails
|
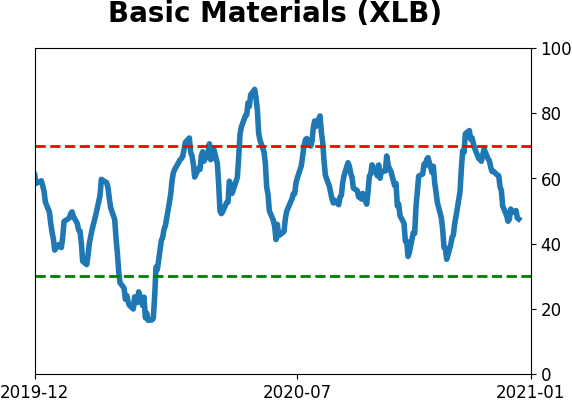
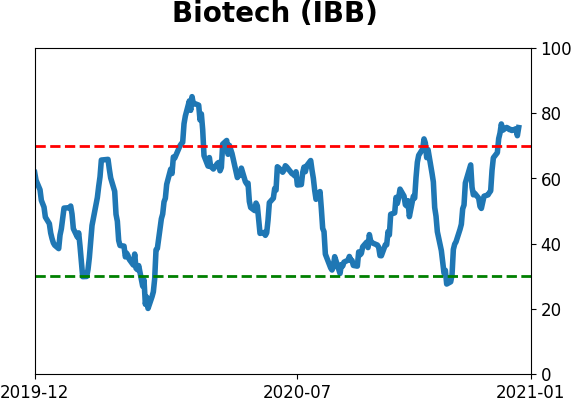
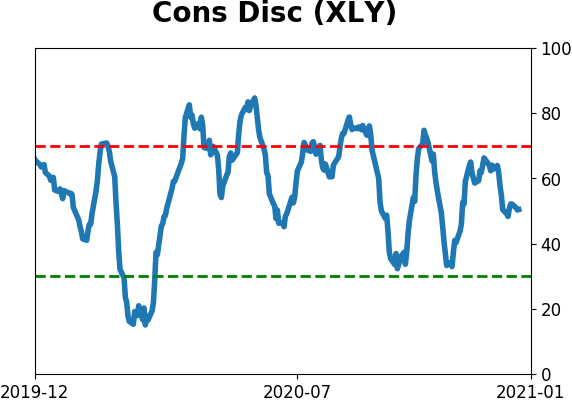
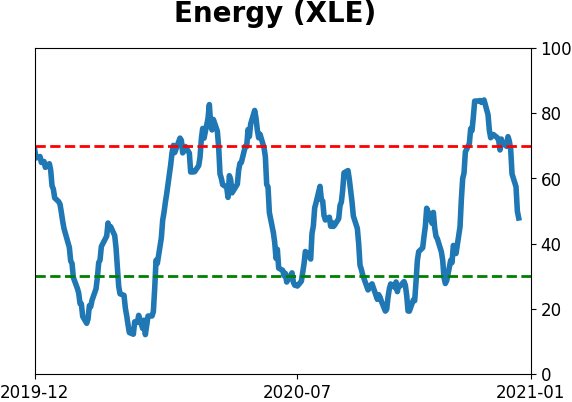
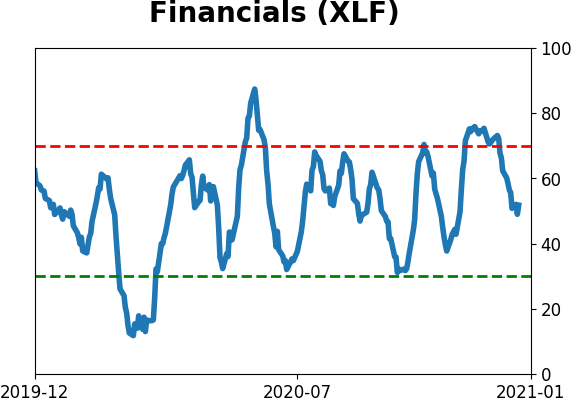
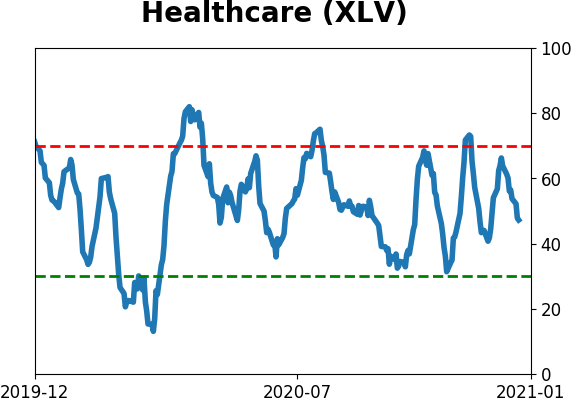
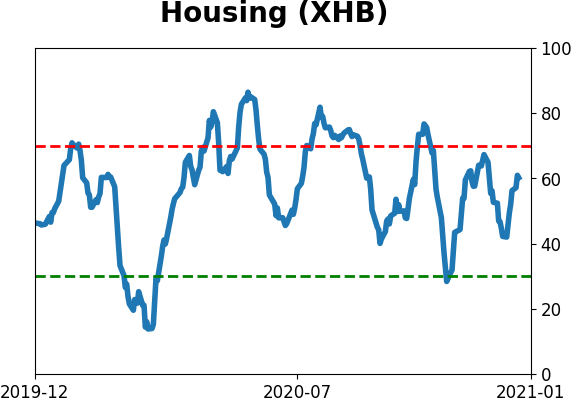
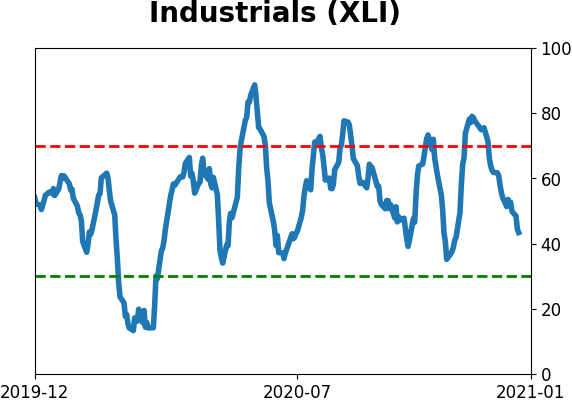
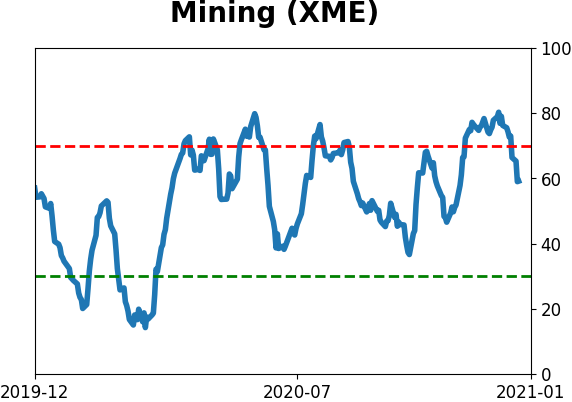
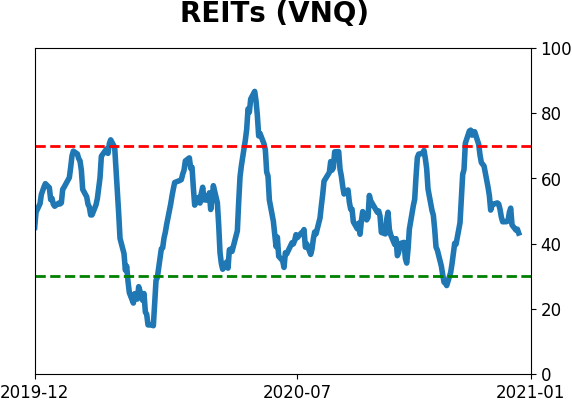
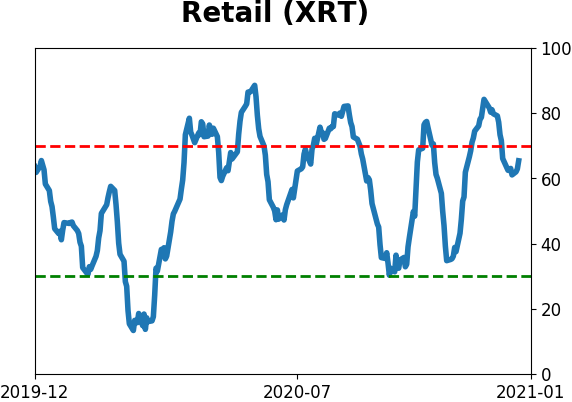
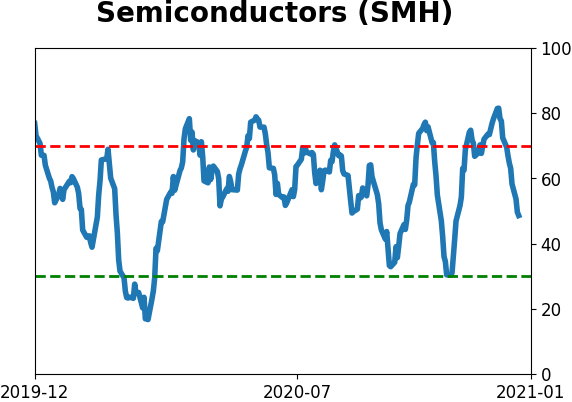
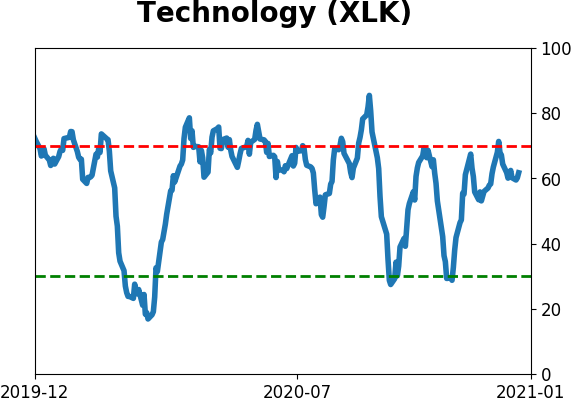
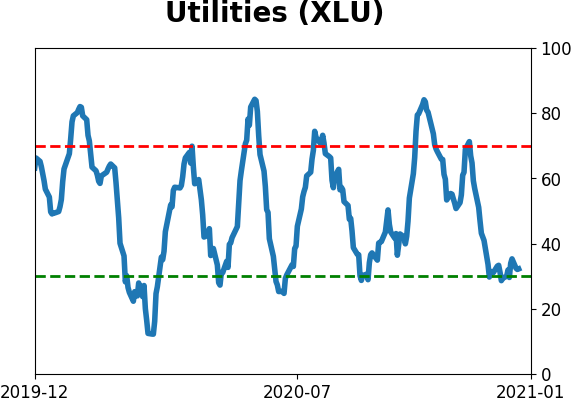
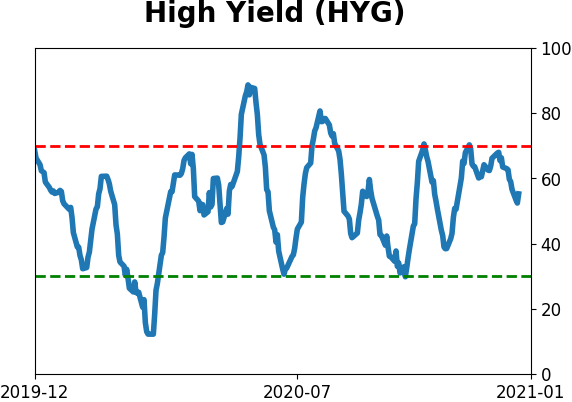
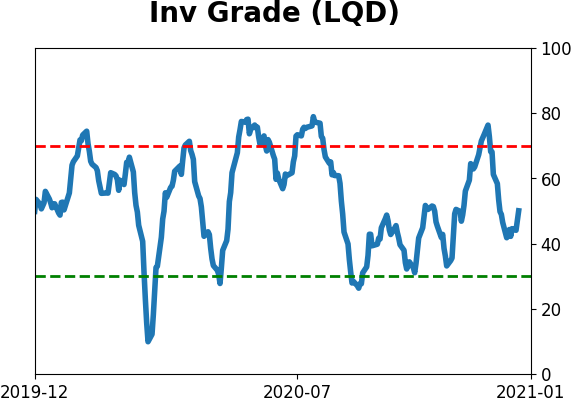
Sector ETF's - 10-Day Moving Average
|
|
|
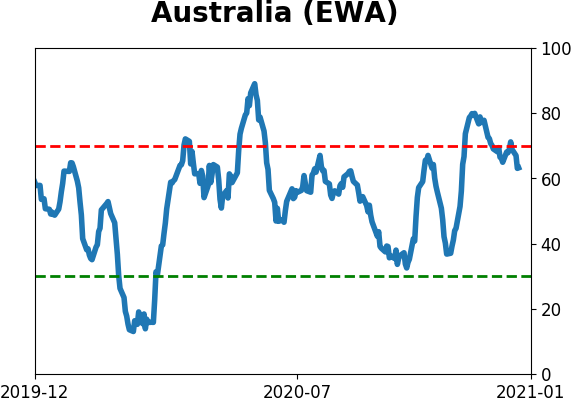
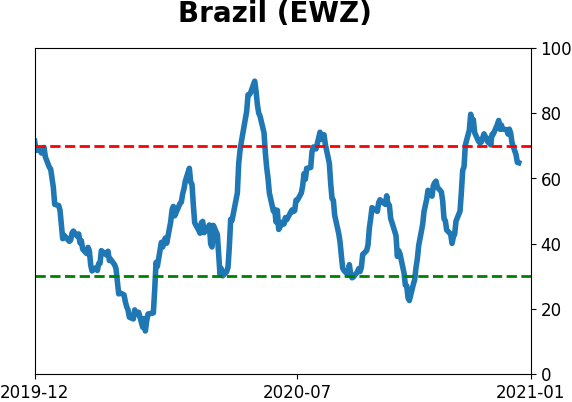
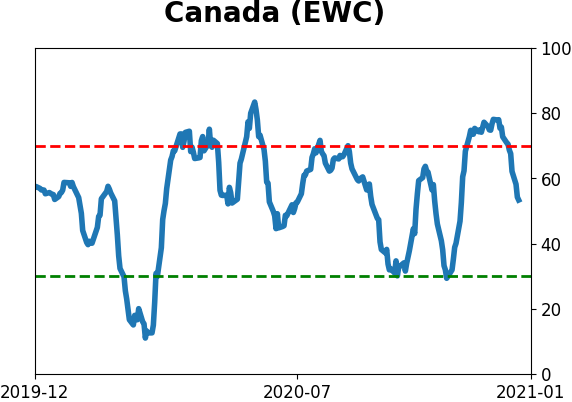
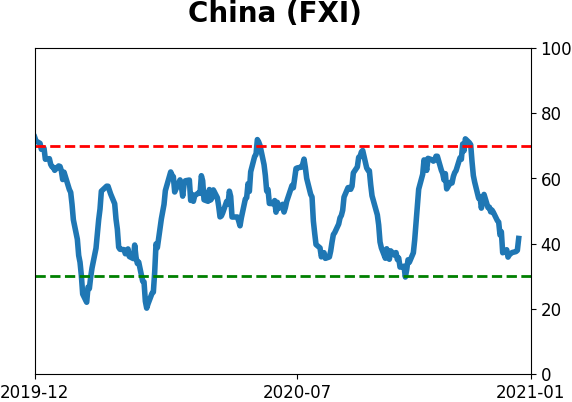
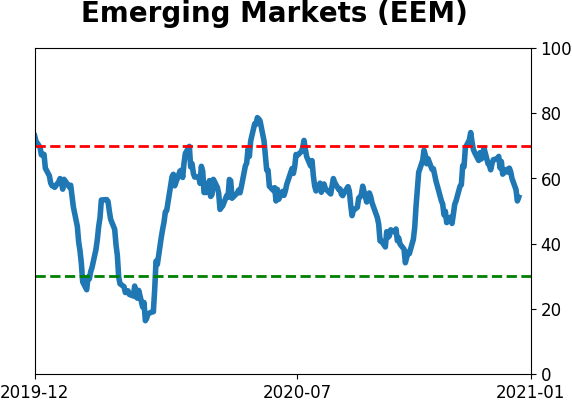
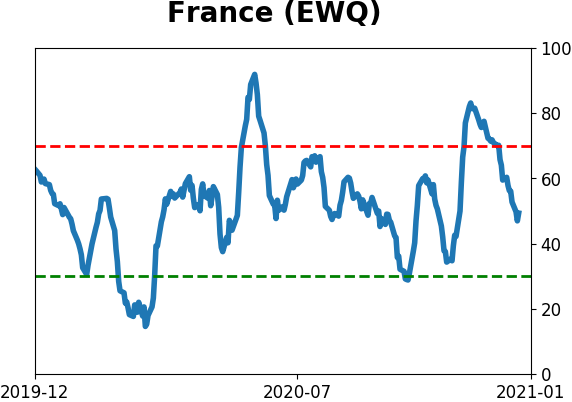
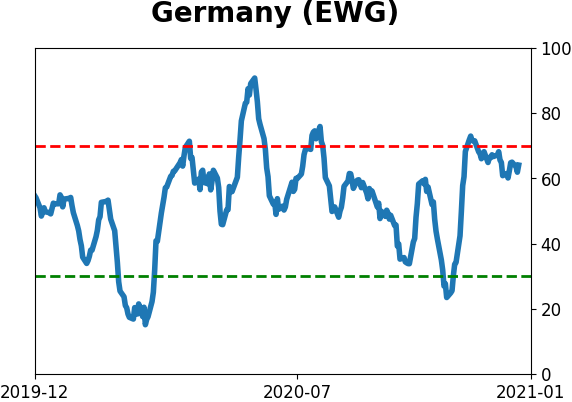
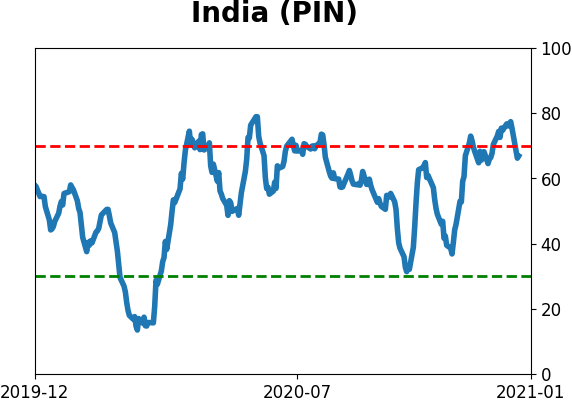
Country ETF's - 10-Day Moving Average
|
|
|
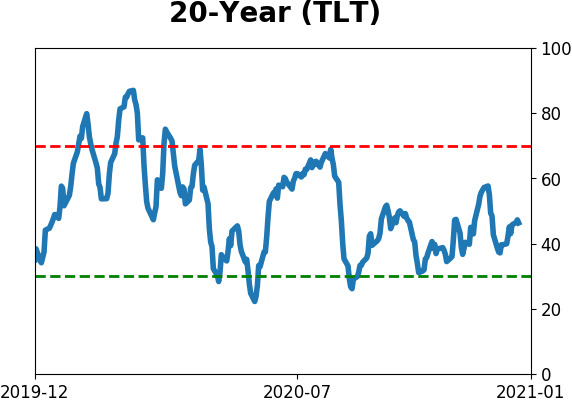
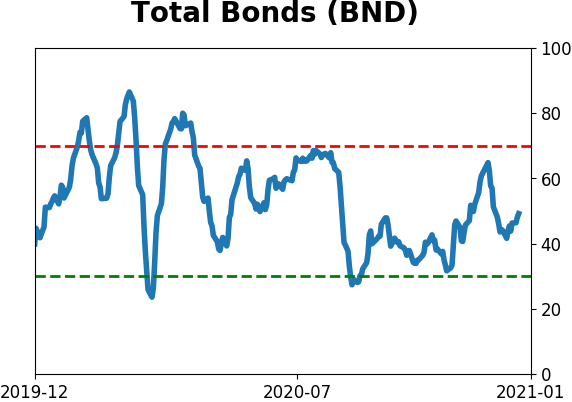
Bond ETF's - 10-Day Moving Average
|
|
|
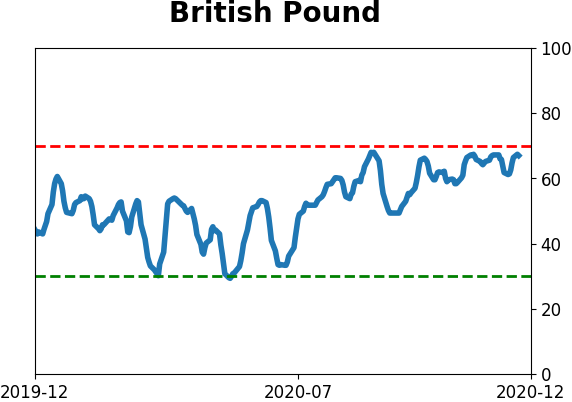
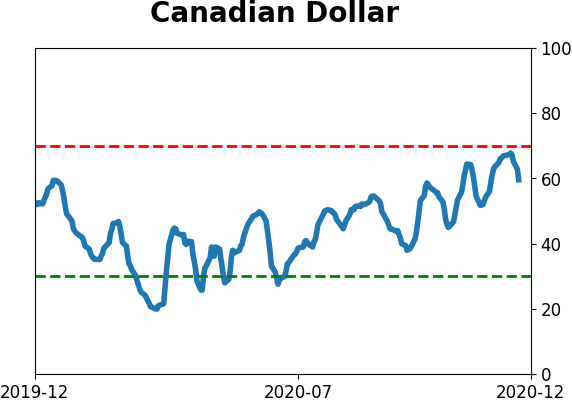
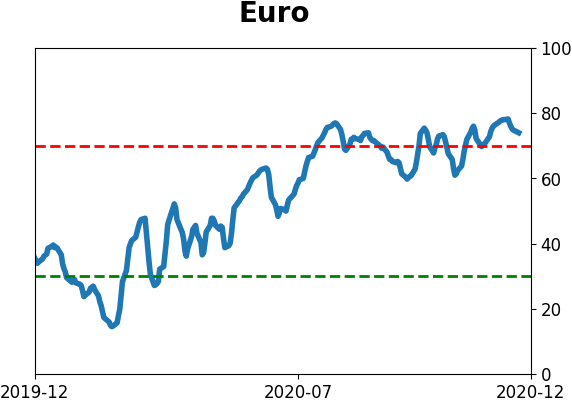
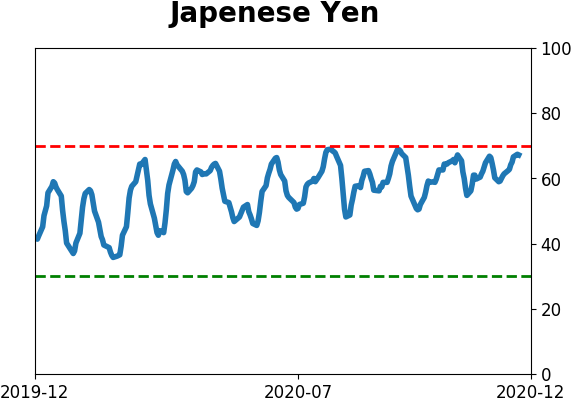
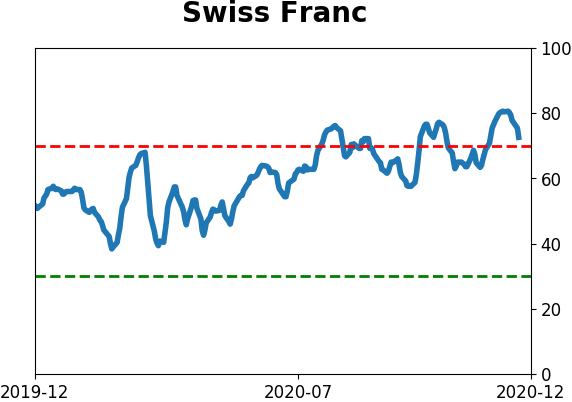
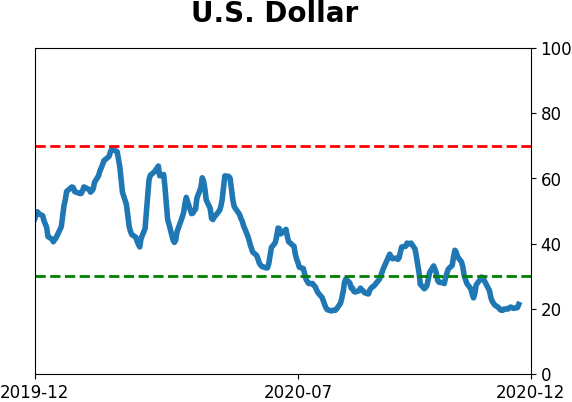
Currency ETF's - 5-Day Moving Average
|
|
|
Commodity ETF's - 5-Day Moving Average
|
|