Headlines
|
|
A new record in severely overvalued companies:
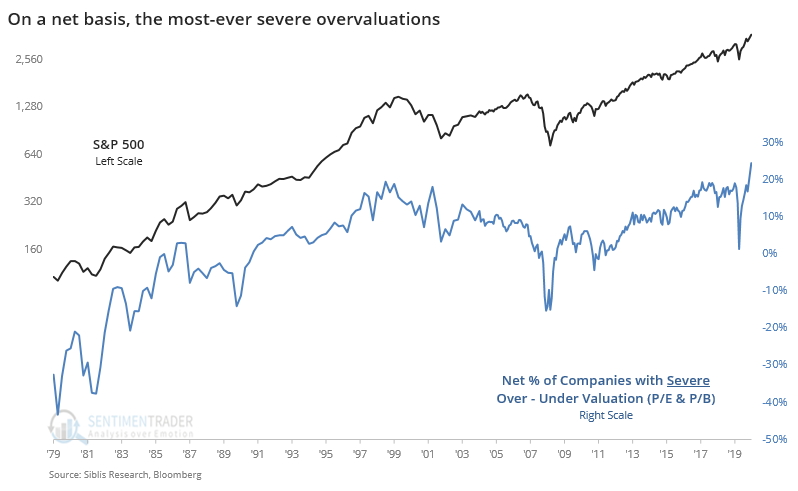
The rise in sentiment has coincided with a spike in valuations of S&P 500 companies. Nearly 40% of stocks are now severely overvalued, the most in more than 40 years. Net of undervalued companies, we've never seen extremes like this, and high values have preceded weak returns.
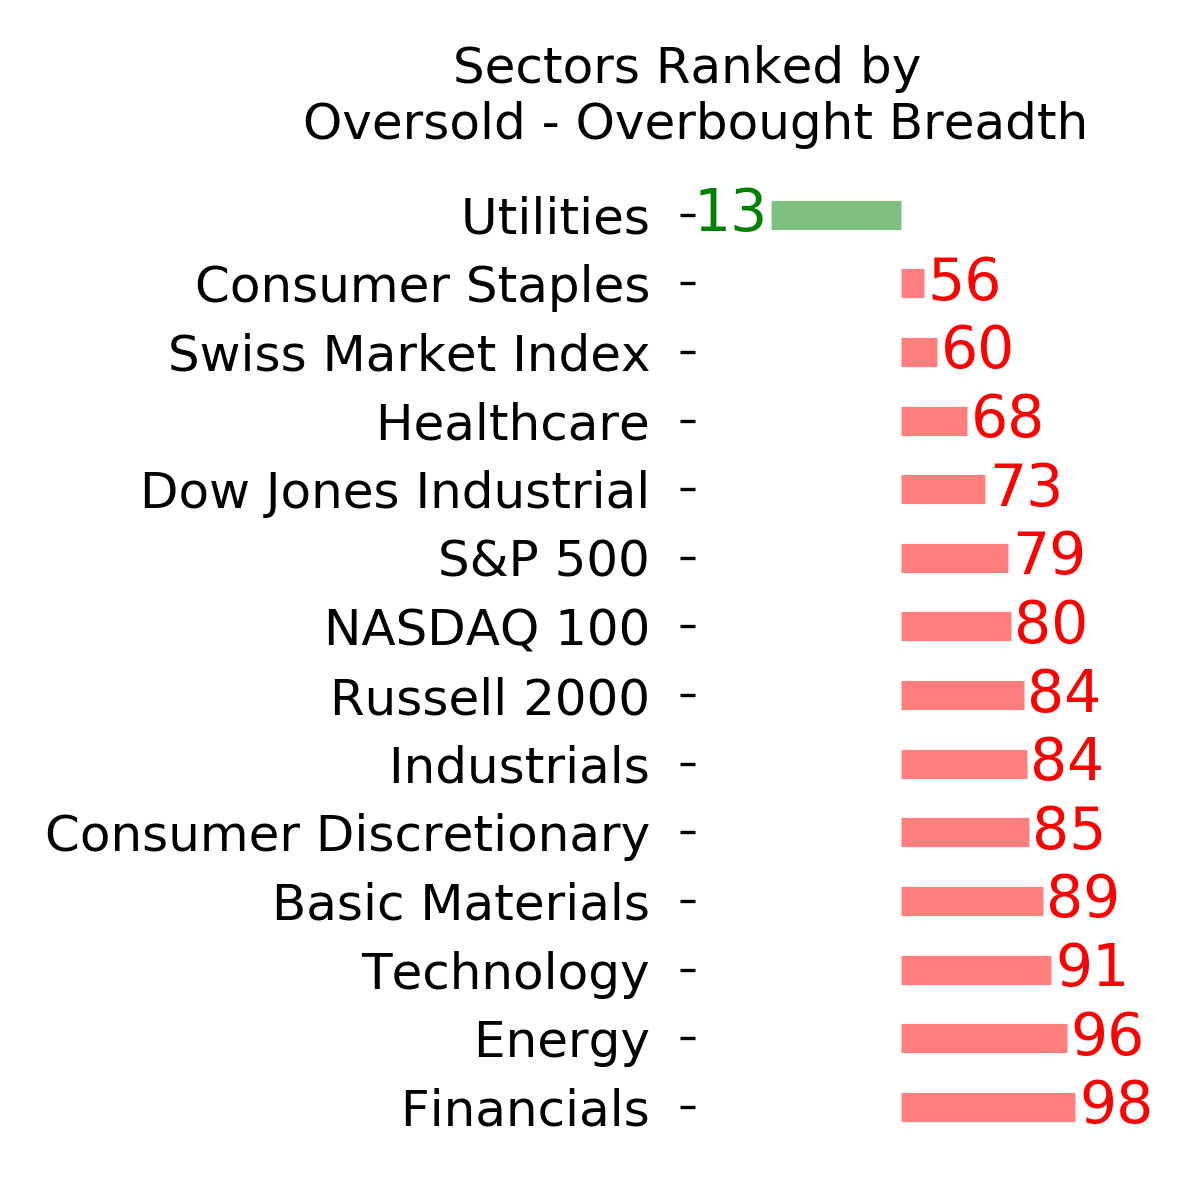
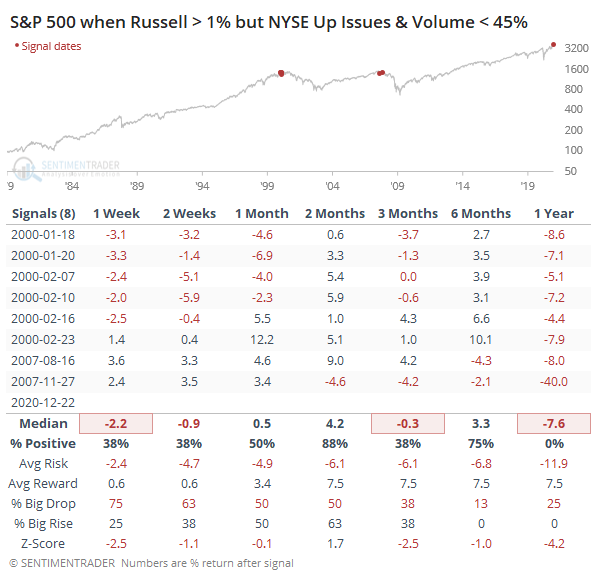
Another odd one: From March through June, then again in October through November, breadth was pristine. We were seeing exceptionally broad participation, with positive thrusts on a historic scale. That all bodes well for future returns, and still does. What we don't like is "odd" and we're starting to see a little of that now. Small-cap stocks drive a large part of the breadth figures on the NYSE, so when an index like the Russell 2000 does well, breadth figures are good. Today was a major exception. The Russell was up around 1%, and yet NYSE Up Issues and Up Volume were well below 50%. Since 1979, the only times this has triggered when stocks were anywhere near a high was in 2000 and 2007. We wouldn't put a lot of weight on this yet, but if we start to see clusters of oddities like this, it will quickly raise a yellow flag.
Bottom Line:
- The market environment is pristine, but with near-historic optimism, gains tend to be muted, with a high probability of being reversed at some point over the ensuing weeks.
|
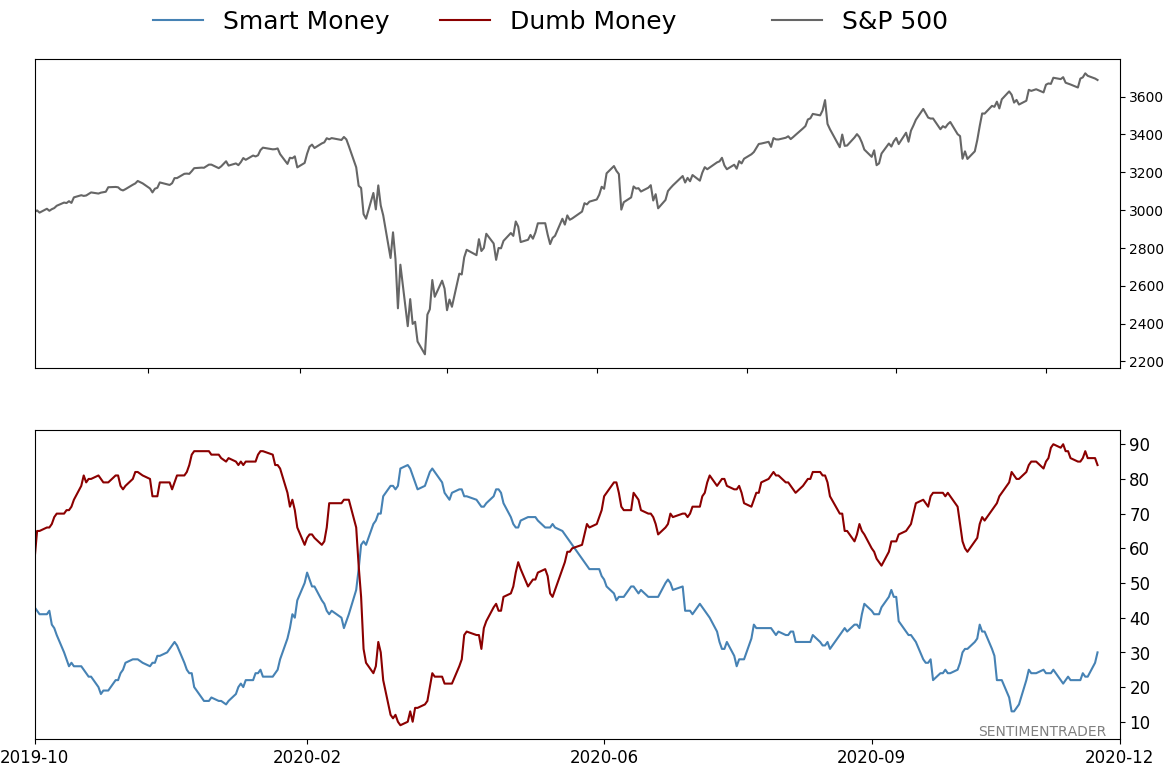
Smart / Dumb Money Confidence
|
Smart Money Confidence: 30%
Dumb Money Confidence: 84%
|
|
Risk Levels
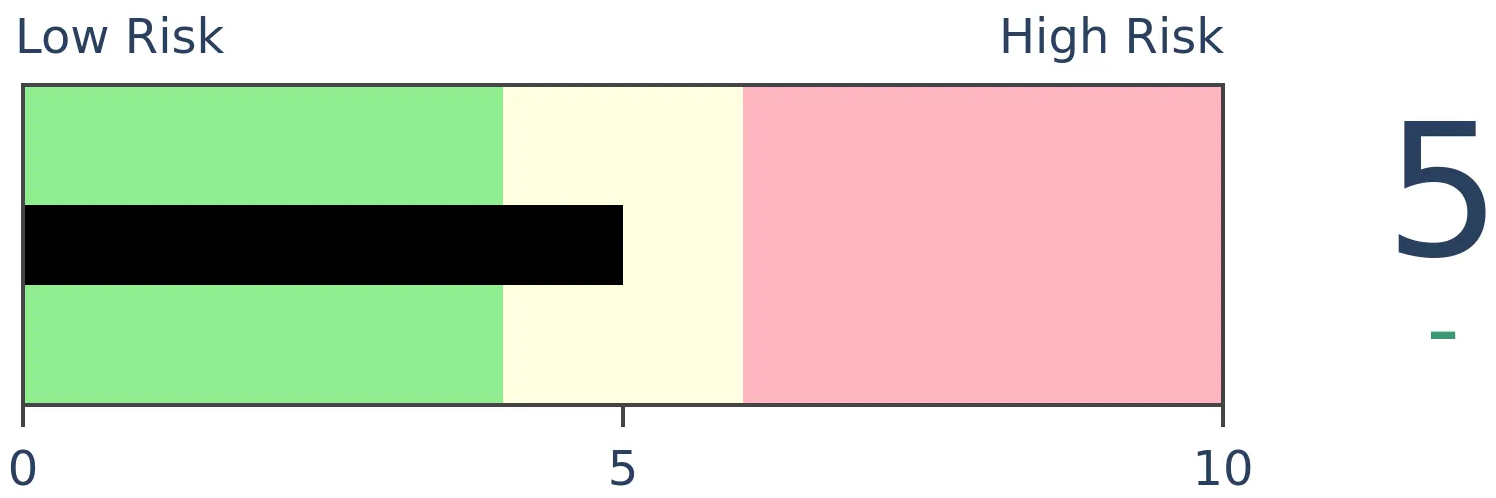
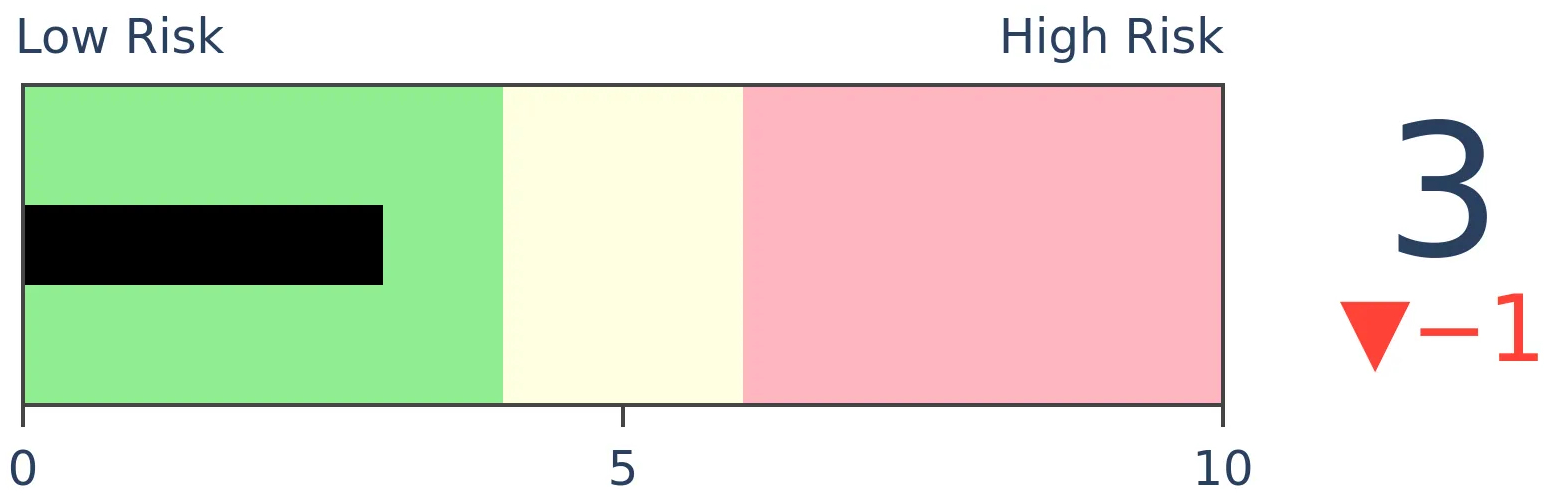
Stocks Short-Term
|
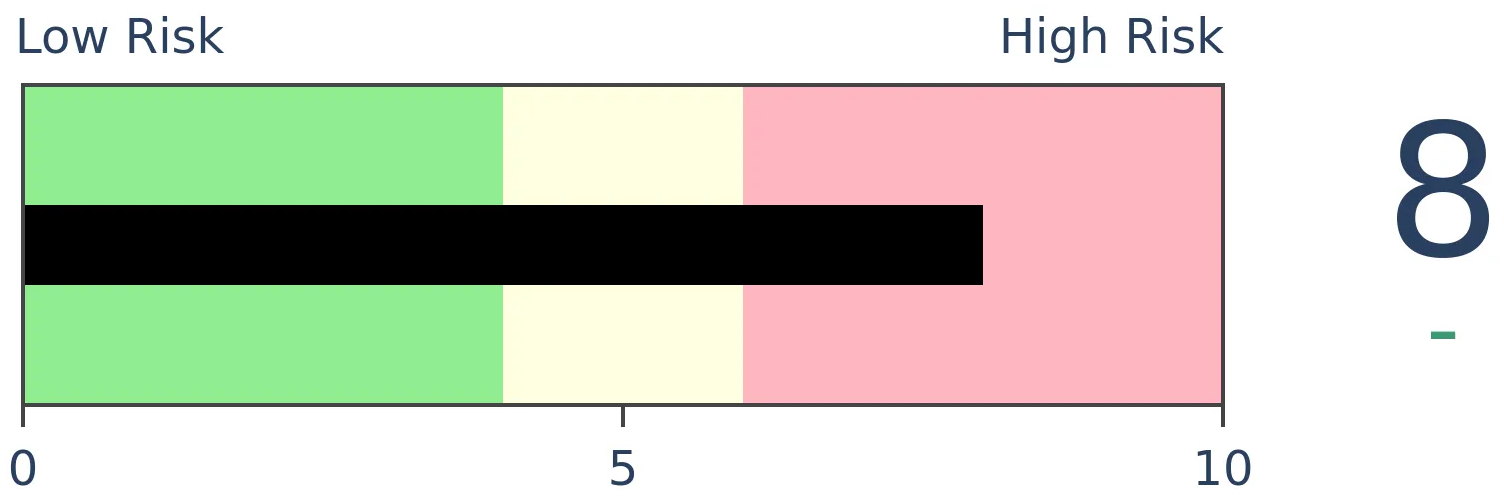
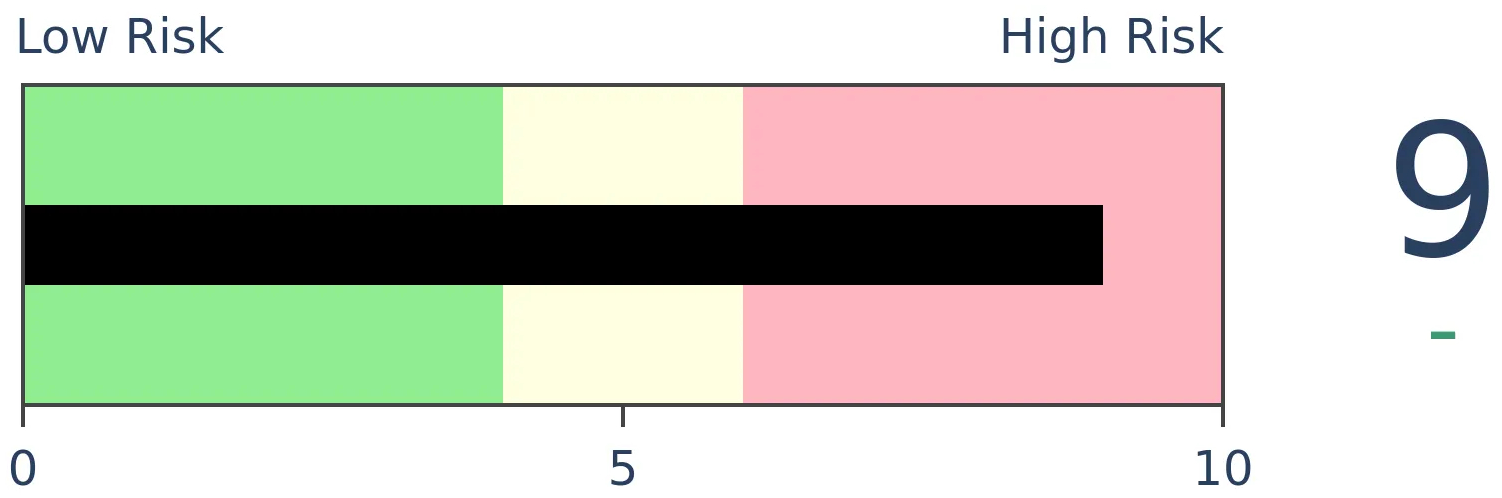
Stocks Medium-Term
|
|
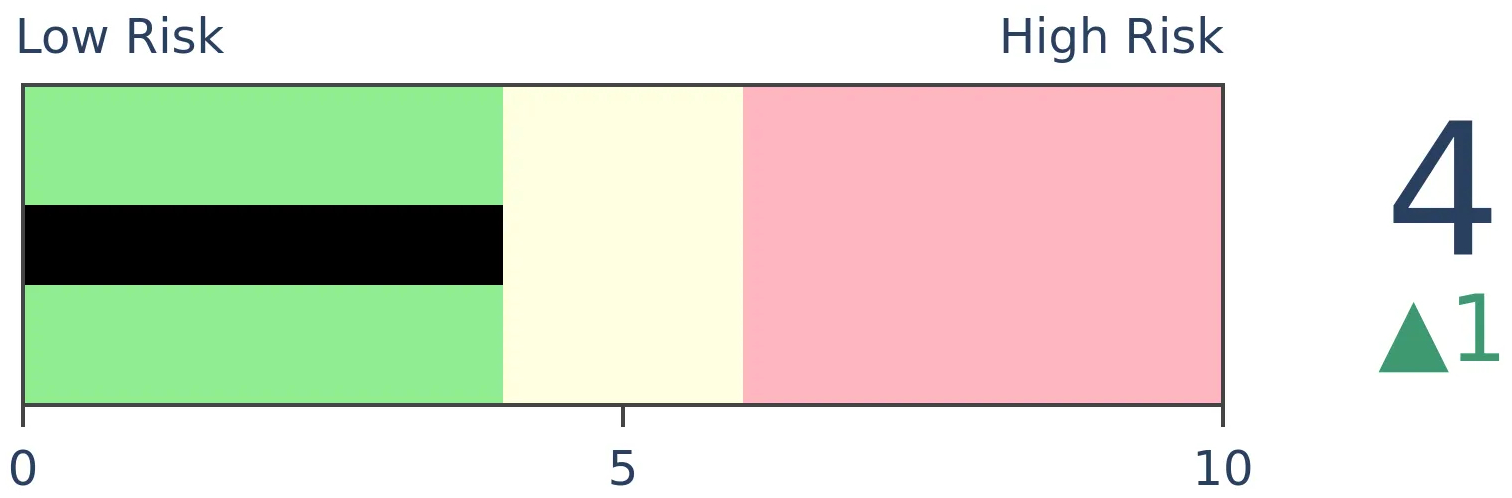
Bonds
|
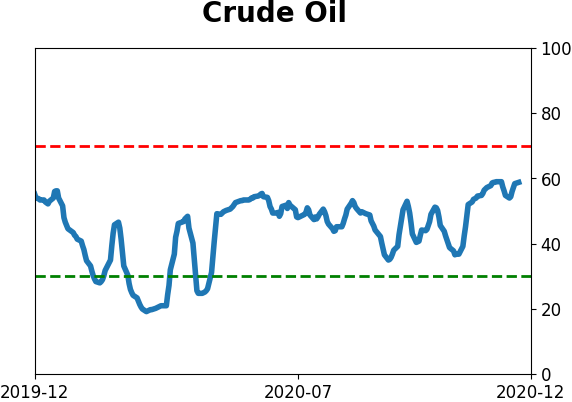
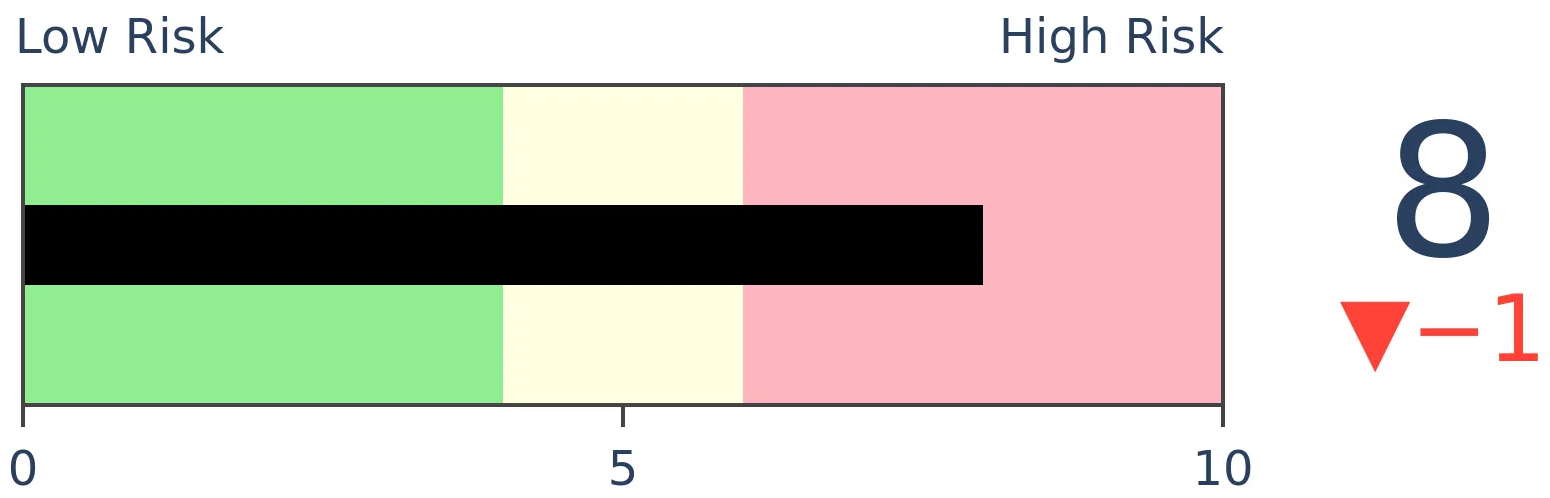
Crude Oil
|
|
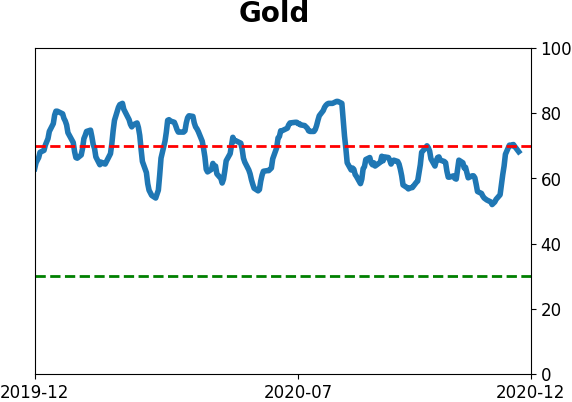
Gold
|
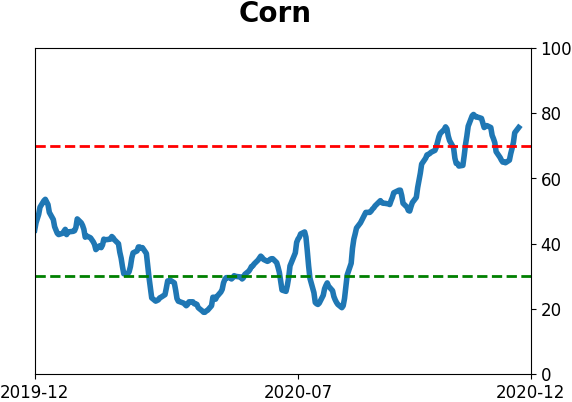
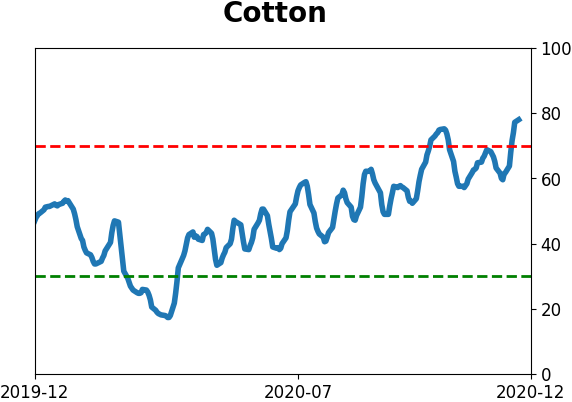
Agriculture
|
|
Research
BOTTOM LINE
The rise in sentiment has coincided with a spike in valuations of S&P 500 companies. Nearly 40% of stocks are now severely overvalued, the most in more than 40 years. Net of undervalued companies, we've never seen extremes like this, and high values have preceded weak returns.
FORECAST / TIMEFRAME
SPY -- Down, Long-Term
|
Sentiment and valuation go hand-in-hand. One impacts the other and creates a self-reinforcing loop until something happens to break the cycle.
With some measures showing extreme or even record levels of optimism, it's not a big surprise that most measures of valuation are showing the same. About the only ones that don't are using the prevailing level of interest rates as a buffer, which may or may not be valid depending on one's worldview.
There can be little doubt that regardless of rates or future prospects, investors are willing to pay a high amount for current earnings. Over the past 40 years, there have never been more mild, moderate, or severely overvalued companies within the S&P 500.
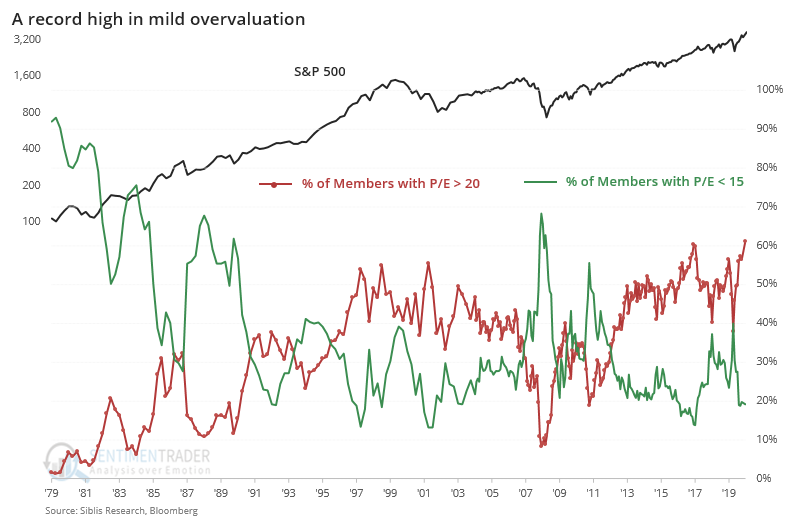
Based on the latest data, we just surpassed the prior peak from 2017 with more than 60% of companies sporting at least a mild overvaluation, defined subjectively as having a price/earnings ratio above 20. This is using component stocks at the time they were in the index, not current members except for the last reading, so there is no survivorship bias in the data.
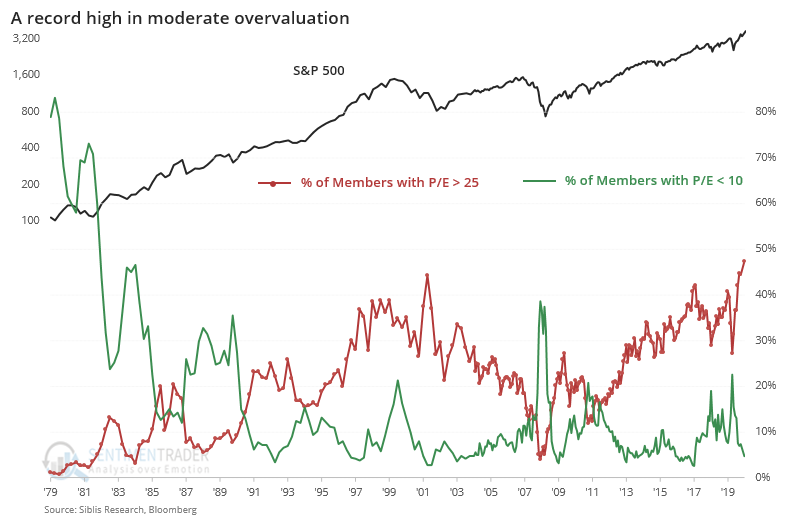
It's even starker when we look at the next step, moderate overvaluations, with a P/E ratio above 25.
When we focus on severe valuations, with a P/E above 30, there has never been anything like what we're seeing now. Nearly 40% of companies are currently sporting a valuation that high, and that's excluding the many companies that currently have negative earnings.
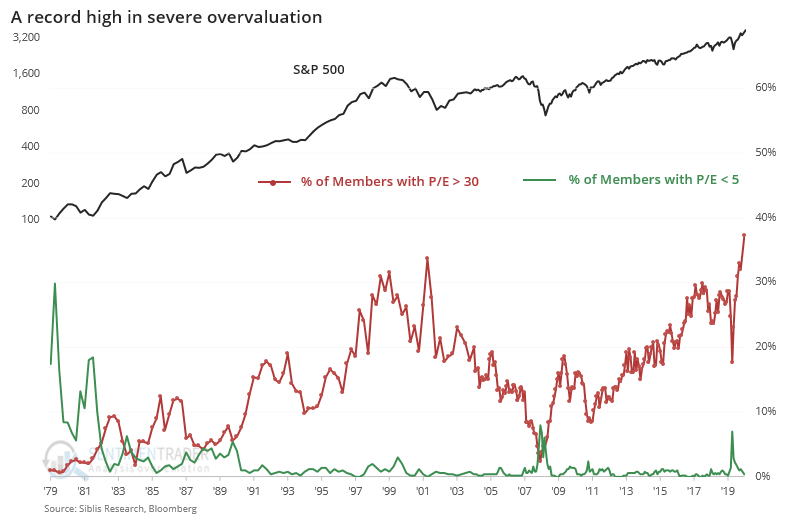
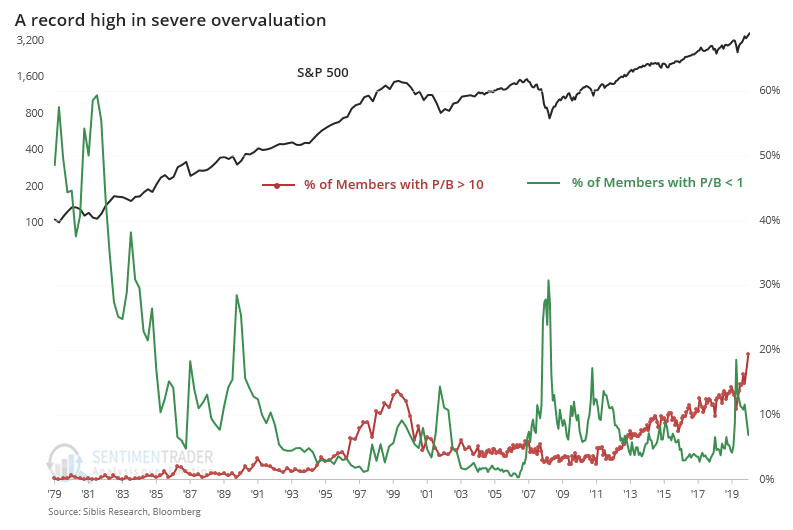
It's not just earnings. The same goes for using price/book value, with 20% of stocks having a ratio above 10, well above the prior peak in 2000.
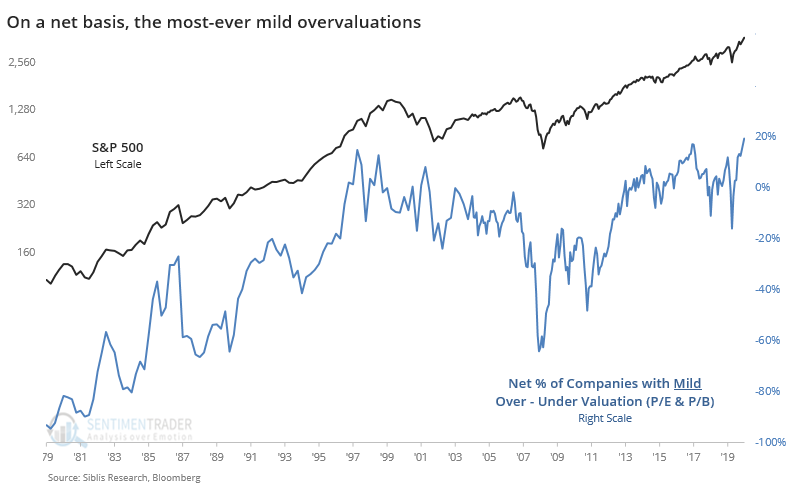
It's easier to see relative extremes when we use a spread instead. The chart below shows the percentage of companies in the S&P that had a mild overvaluation minus the percentage with a mild undervaluation, combining both price/earnings and price/book values. It just hit a record high.
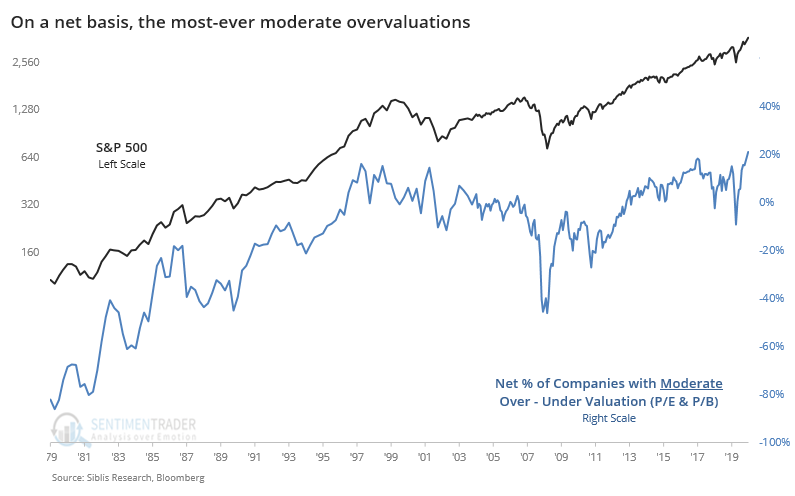
It's the same when we look at the net percentage of moderate valuations.
And the net percentage of severe valuations has likewise spiked after almost reverting to neutral territory earlier this year.
The late 1970s through early '80s was dominated by a period of severe undervaluation, so if we start our time frame in 1985, then we can more clearly see the recent extremes. The surge in 2020 is remarkable.
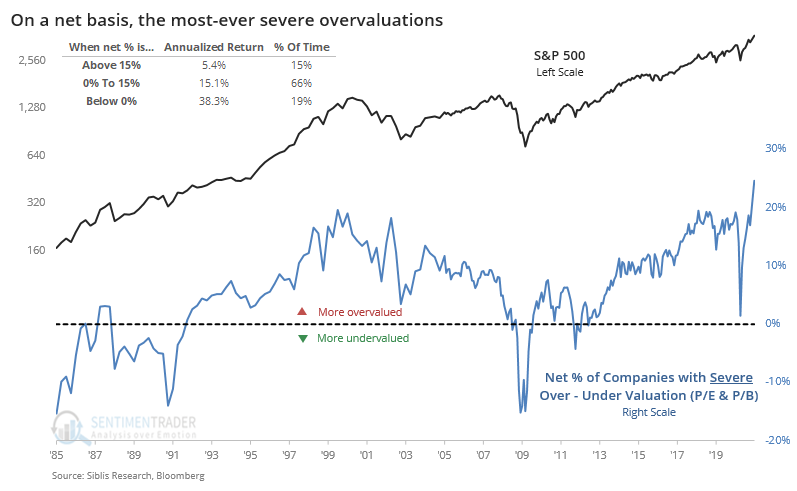
The chart shows a big difference in annualized returns depending on how many stocks were over- versus under-valued, with weaker returns when there are more overvalued companies. That should surprise exactly nobody.
Investors are currently pricing in a major rebound in economic activity and earnings potential in 2021, which Wall Street is already anticipating. A big rebound in earnings will alleviate some of these extremes, but it's unlikely to be enough to push most of these severely overvalued companies even to moderate or mild overvaluation. This is a major concern.
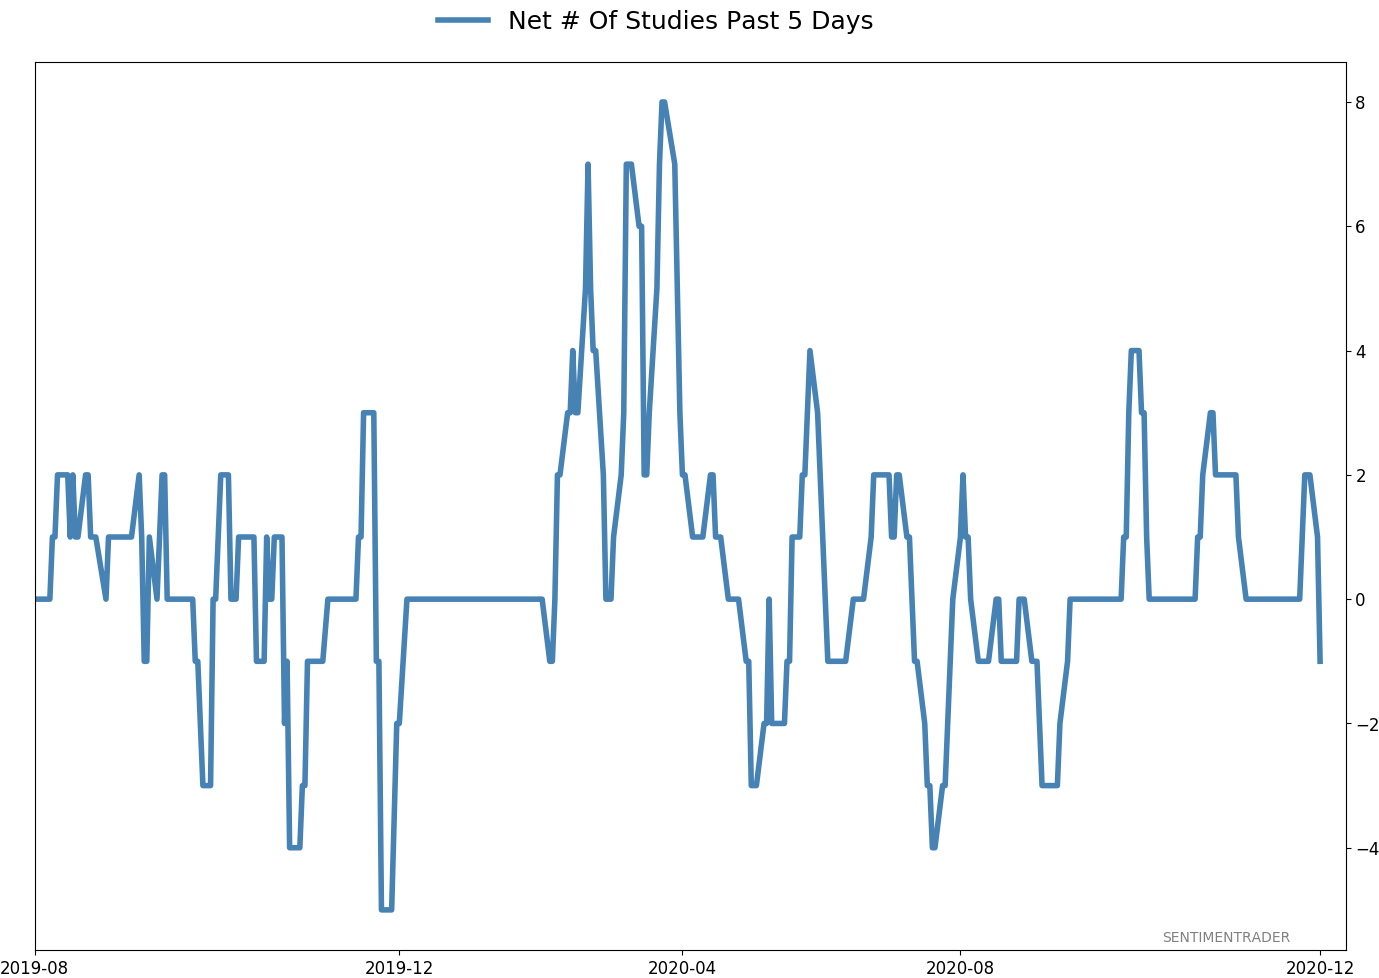
Active Studies
| Time Frame | Bullish | Bearish | | Short-Term | 0 | 0 | | Medium-Term | 4 | 1 | | Long-Term | 47 | 3 |
|
Indicators at Extremes
Portfolio
| Position | Description | Weight % | Added / Reduced | Date | | Stocks | 10.4% VWO, 9.1% XLE, 8.5% RSP, 6.6% PSCE | 34.5 | Reduced 6.7% | 2020-12-14 | | Bonds | 10% BND, 10% SCHP, 10% ANGL | 28.4 | Reduced 0.1% | 2020-10-02 | | Commodities | GCC | 2.4 | Reduced 2.1%
| 2020-09-04 | | Precious Metals | GDX | 8.9 | Added 4.8% | 2020-12-01 | | Special Situations | | 0.0 | Reduced 5% | 2020-10-02 | | Cash | | 25.8 | | |
|
Updates (Changes made today are underlined)
Quite a few of the studies that have been triggering for stocks have showed a poor risk/reward skew over a short- to medium-term time frame, even though many of them have also been quite positive over medium- to long-term time frames. We're in a very favorable seasonal window, so it would be somewhat odd to see a substantial pullback in the next few weeks. Leave it to 2020 to do just that, I suppose, but the calendar is a point in bulls' favor. Even so, record-high-and-declining sentiment, coupled with early signs of a reversal were enough that I reduced my S&P 500 position a bit. I fully expect that the energy funds will suffer some losses in the coming weeks, but as I noted when buying them, they're intended as long-term positions and almost by definition they're going to be volatile. RETURN YTD: 6.8% 2019: 12.6%, 2018: 0.6%, 2017: 3.8%, 2016: 17.1%, 2015: 9.2%, 2014: 14.5%, 2013: 2.2%, 2012: 10.8%, 2011: 16.5%, 2010: 15.3%, 2009: 23.9%, 2008: 16.2%, 2007: 7.8%
|
|
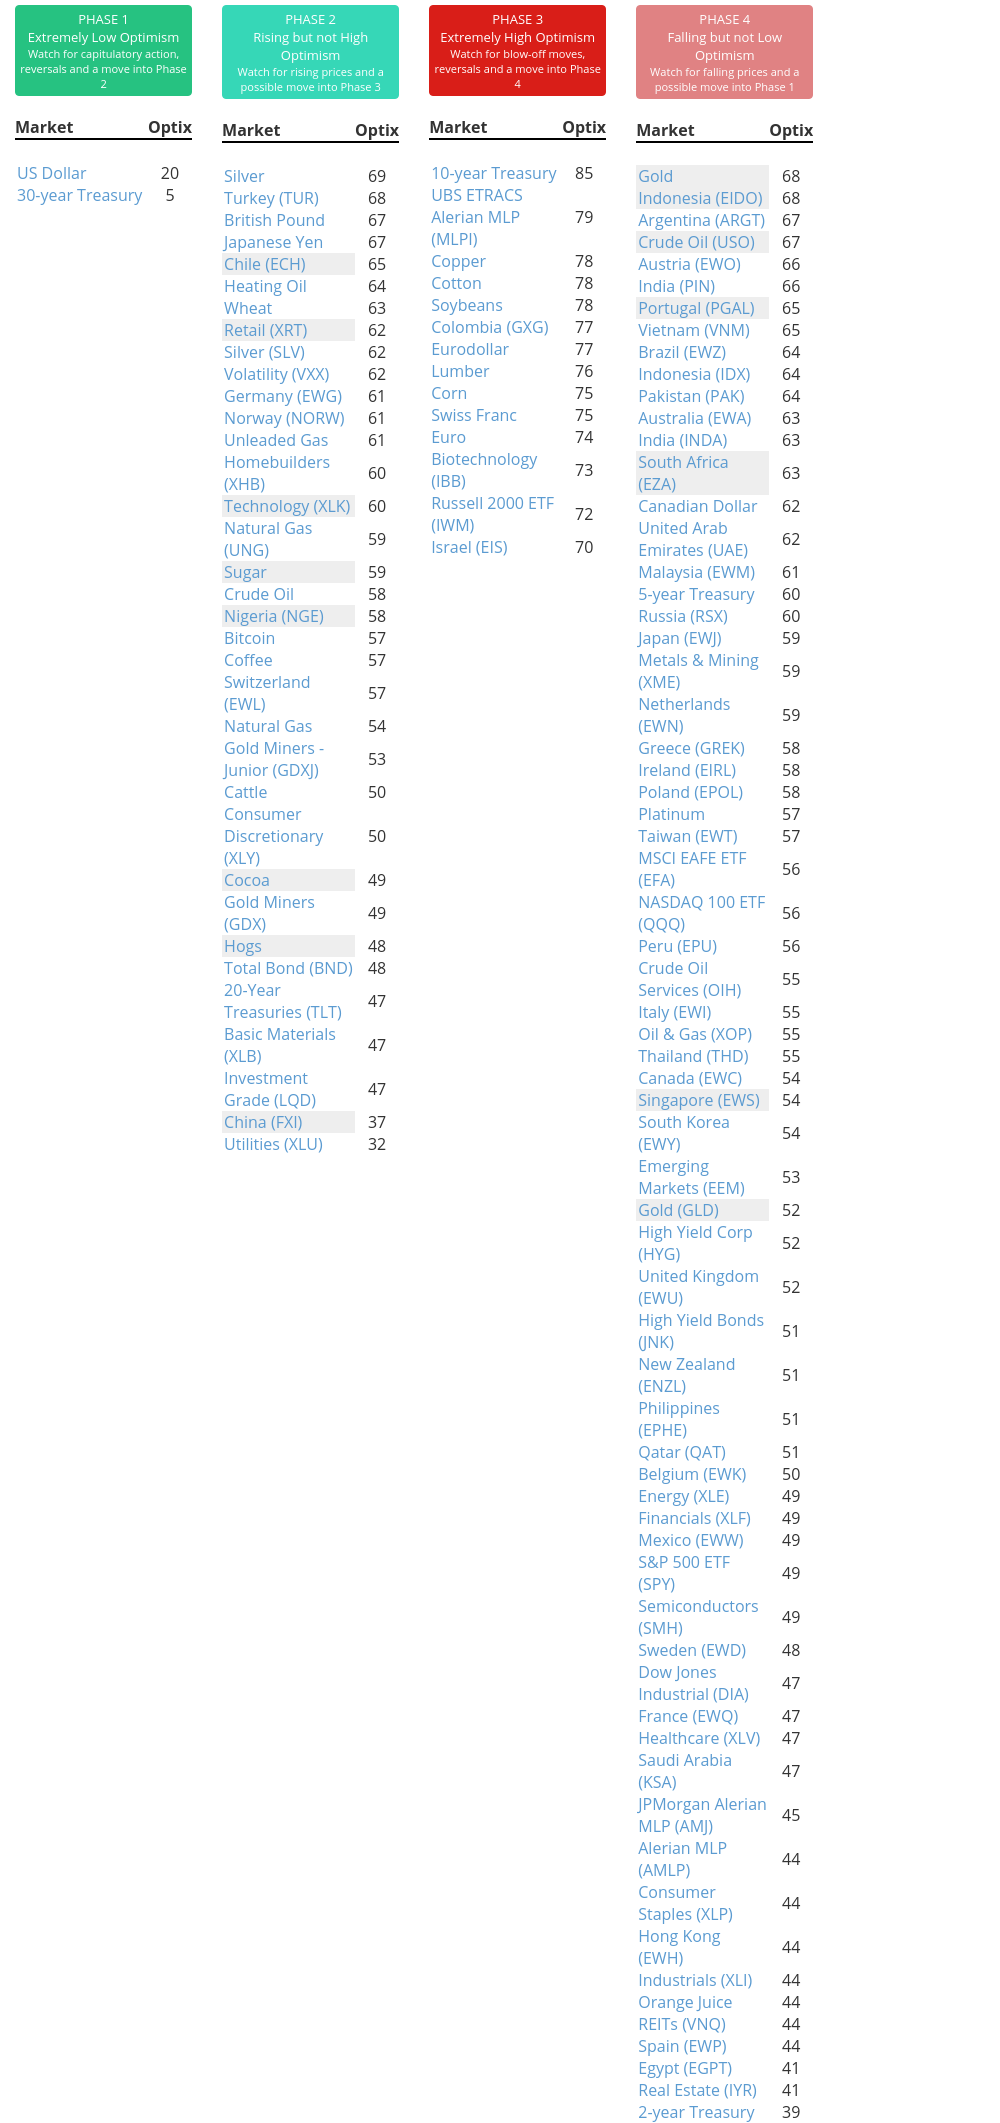
Phase Table
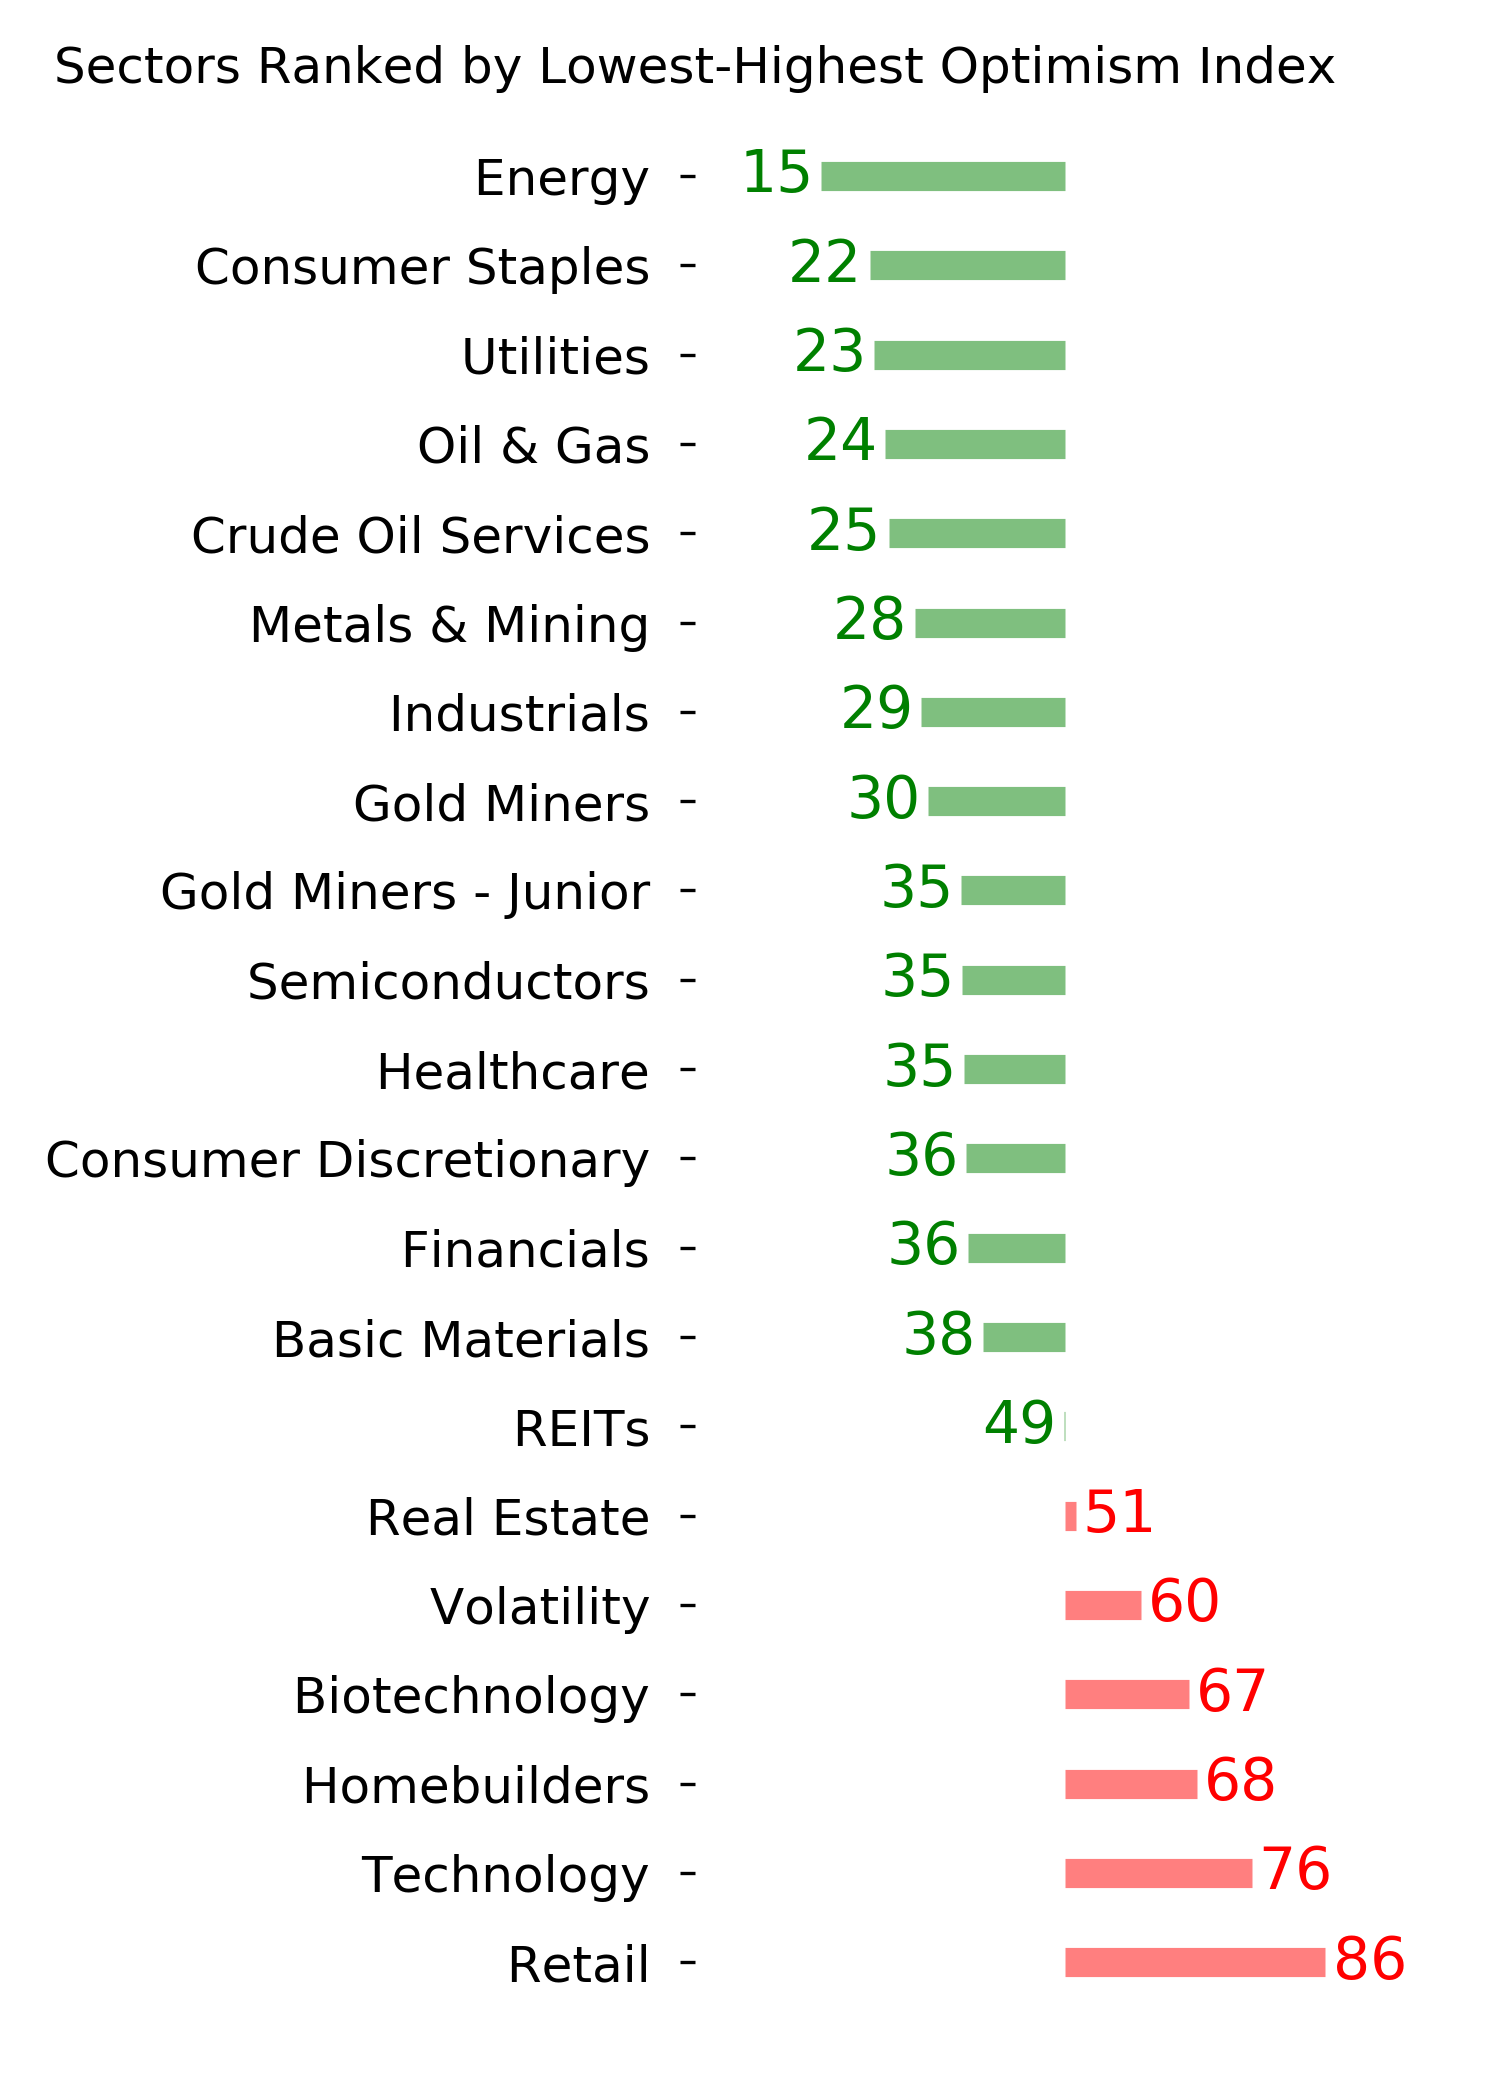
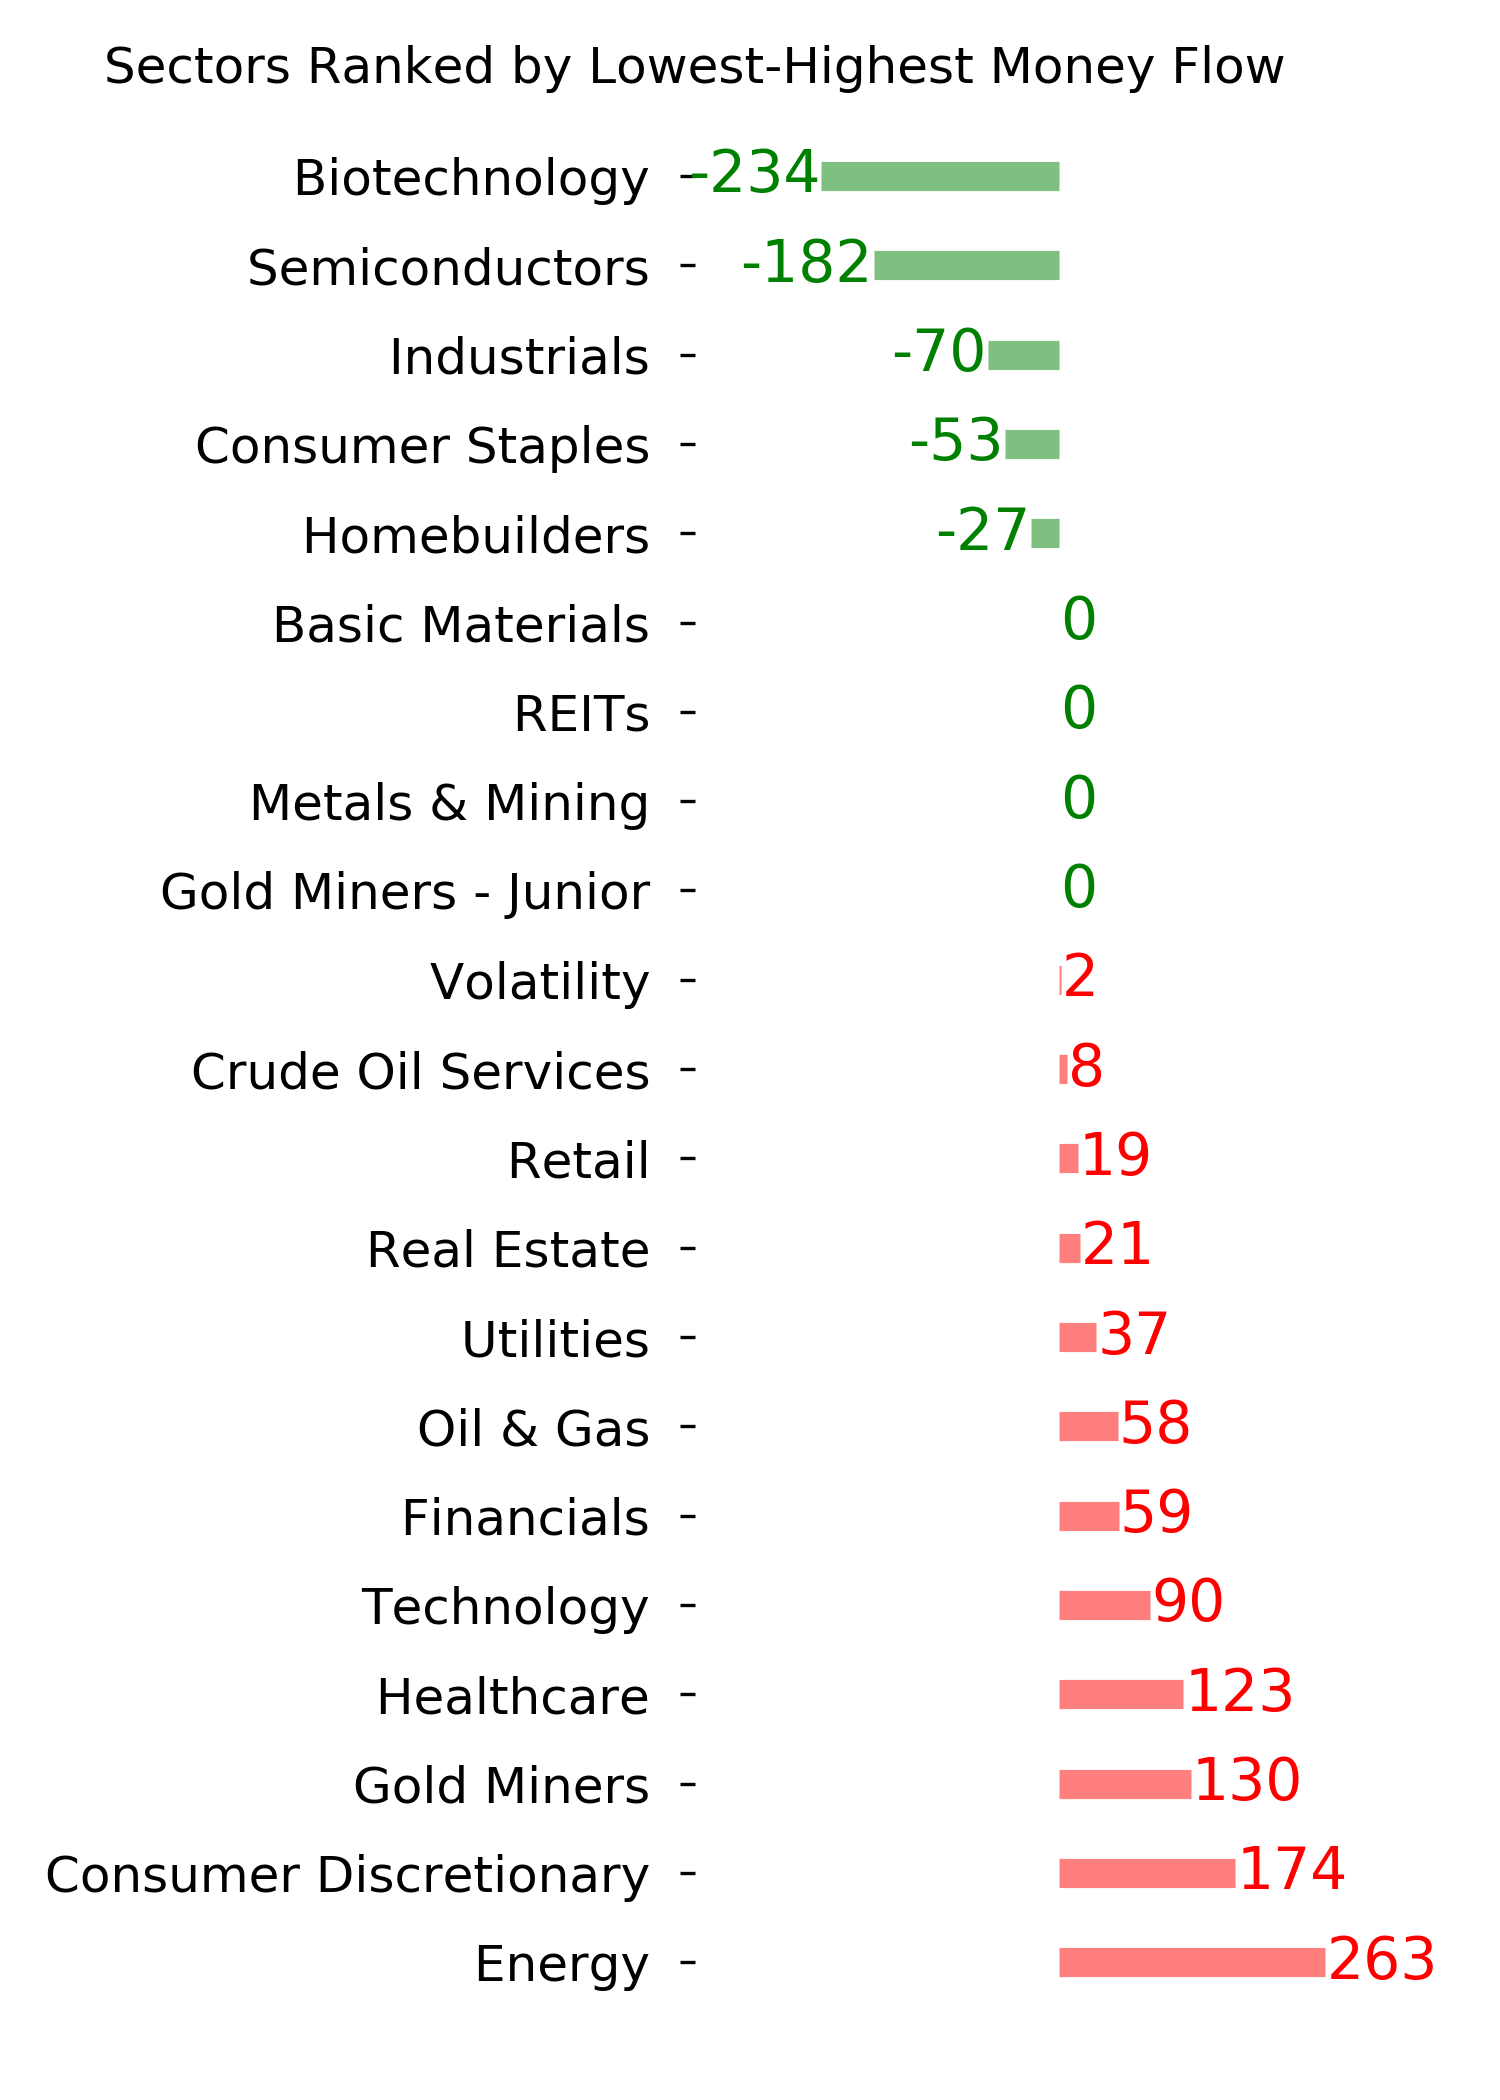
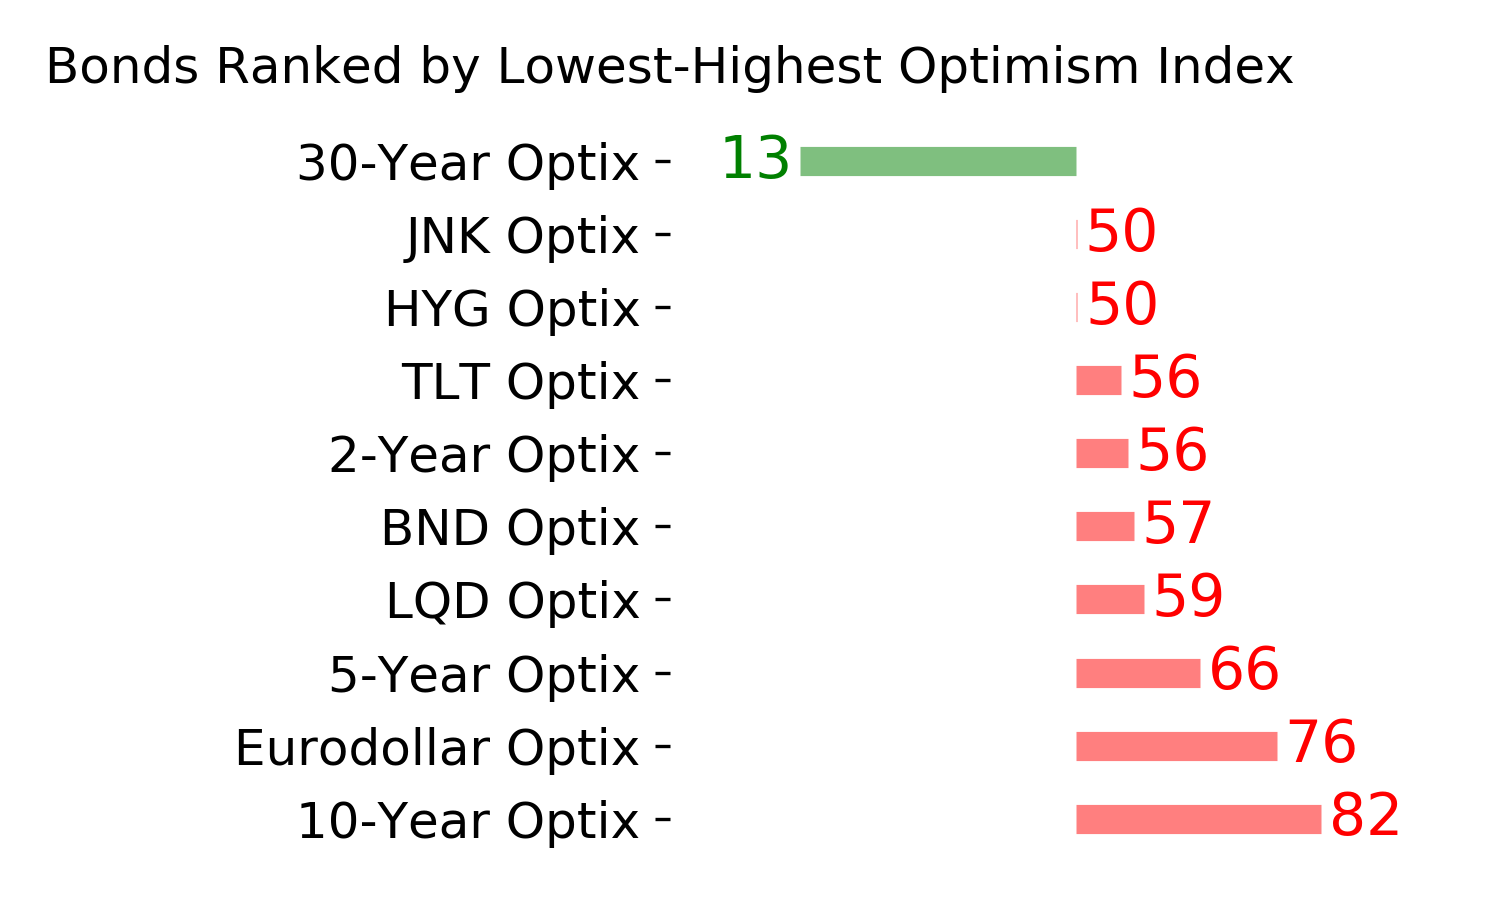
Ranks
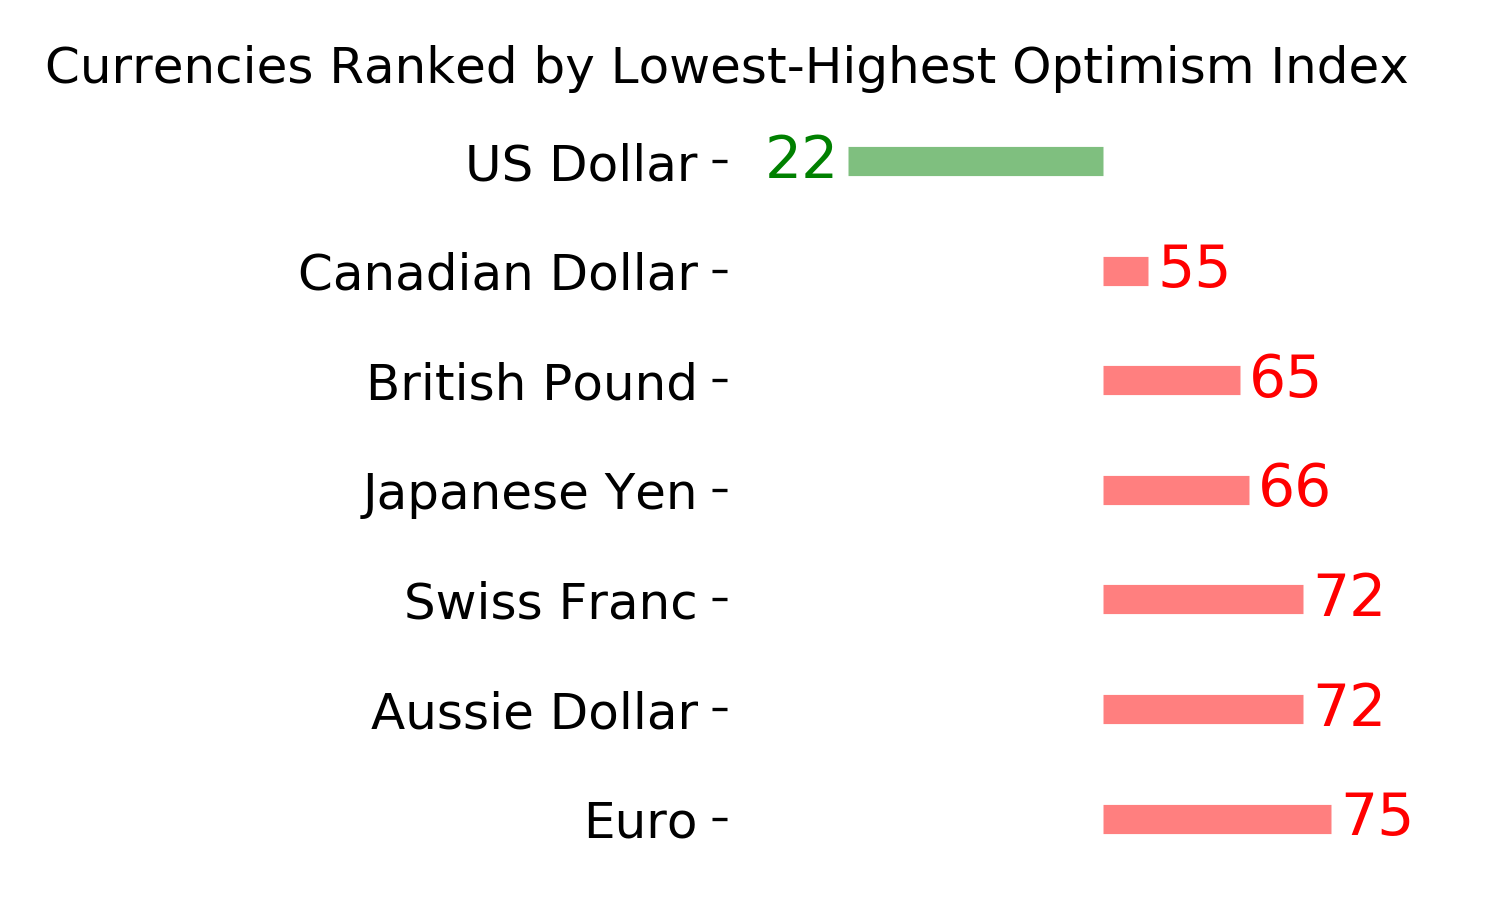
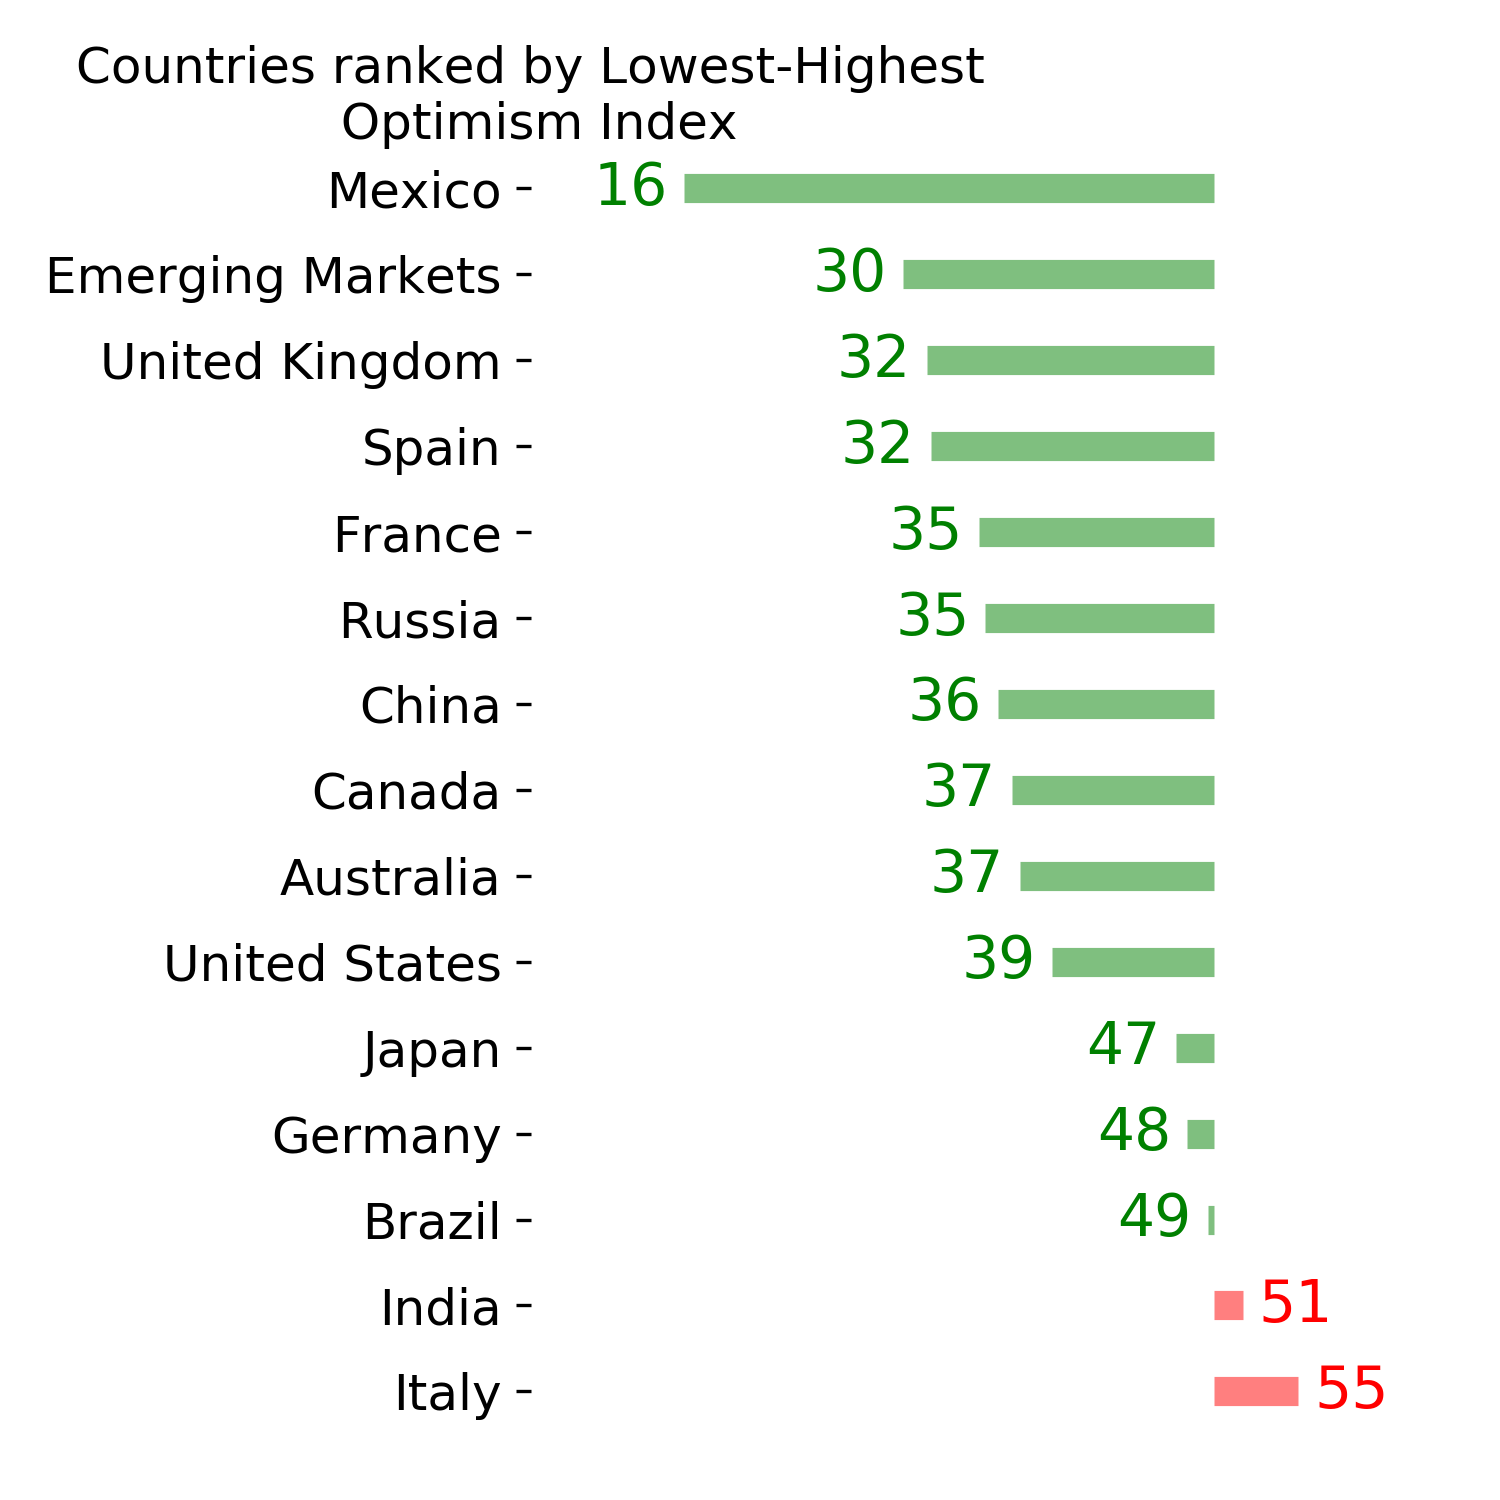
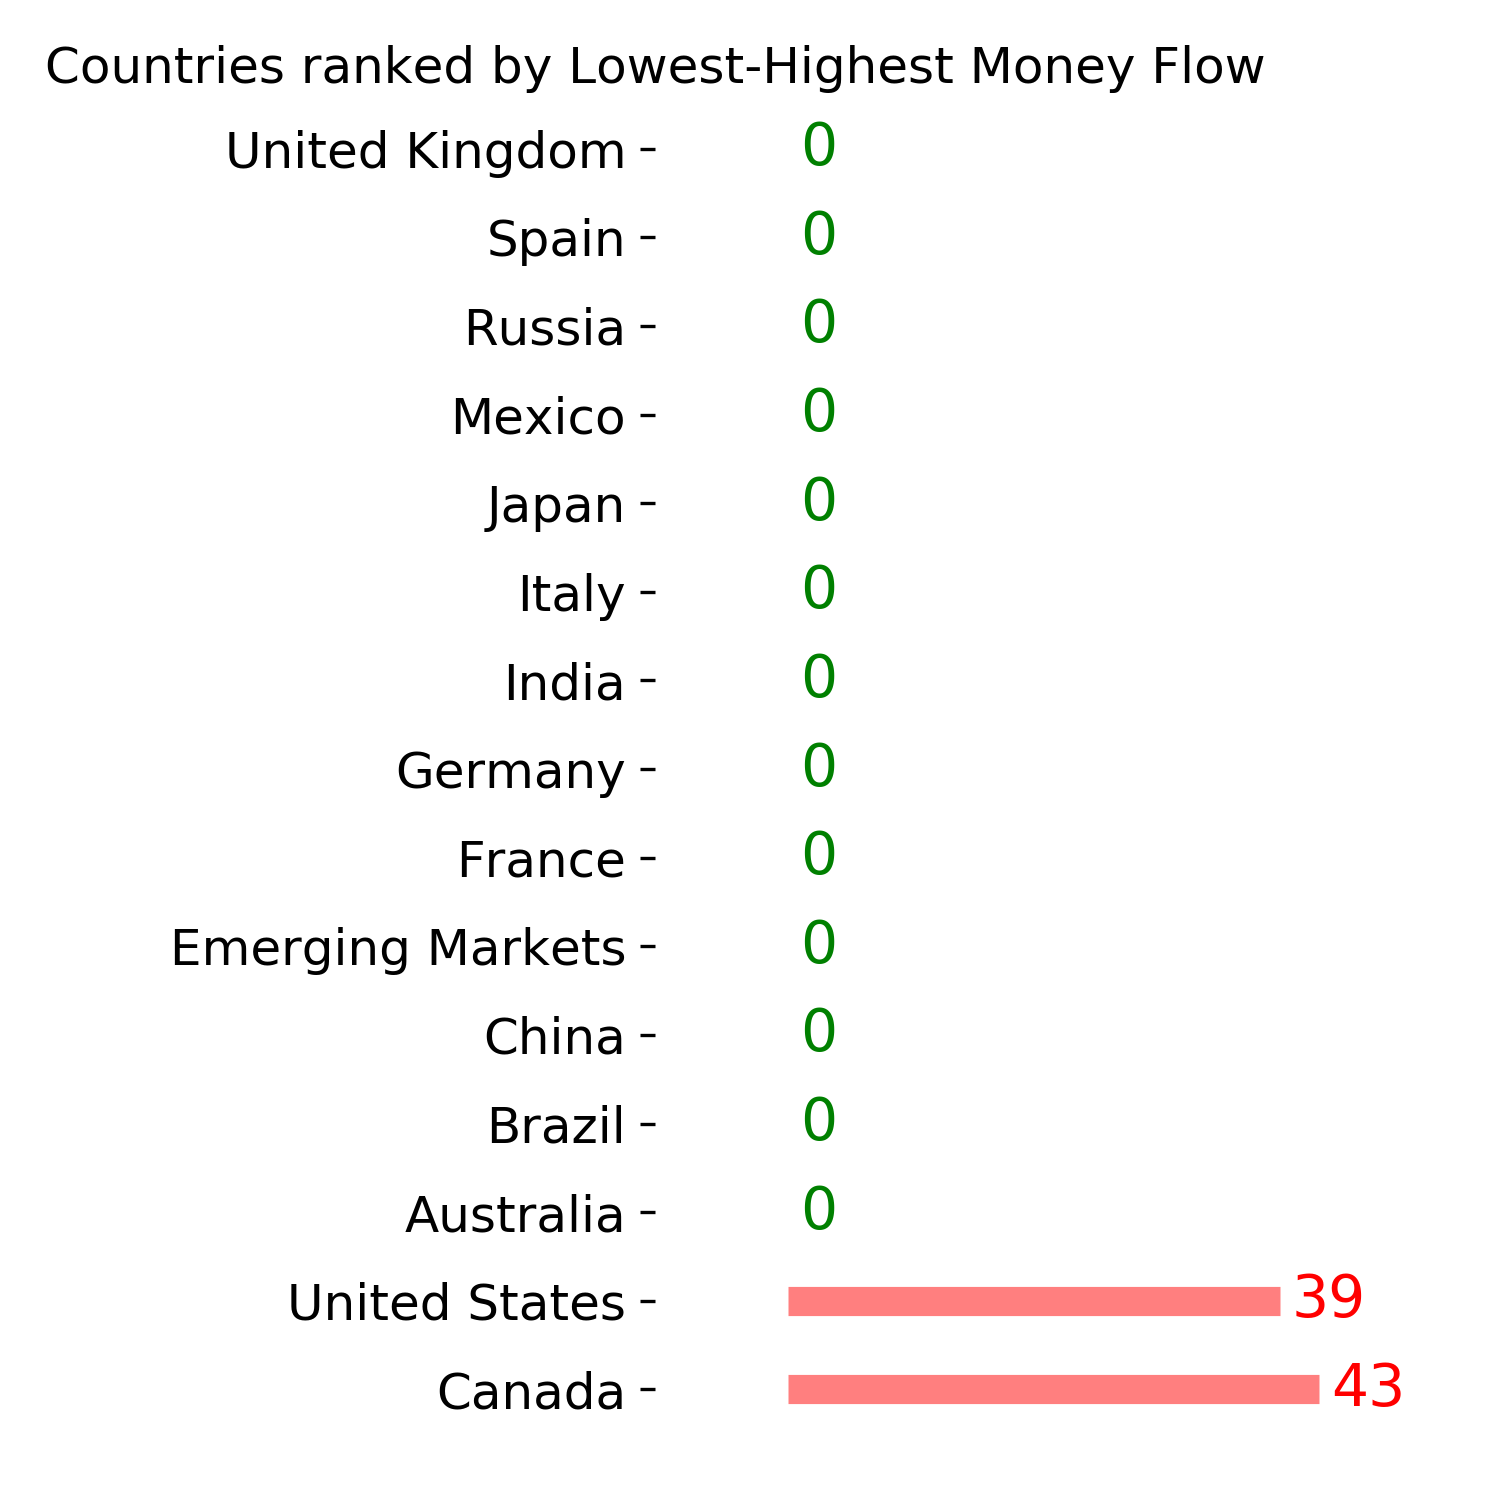
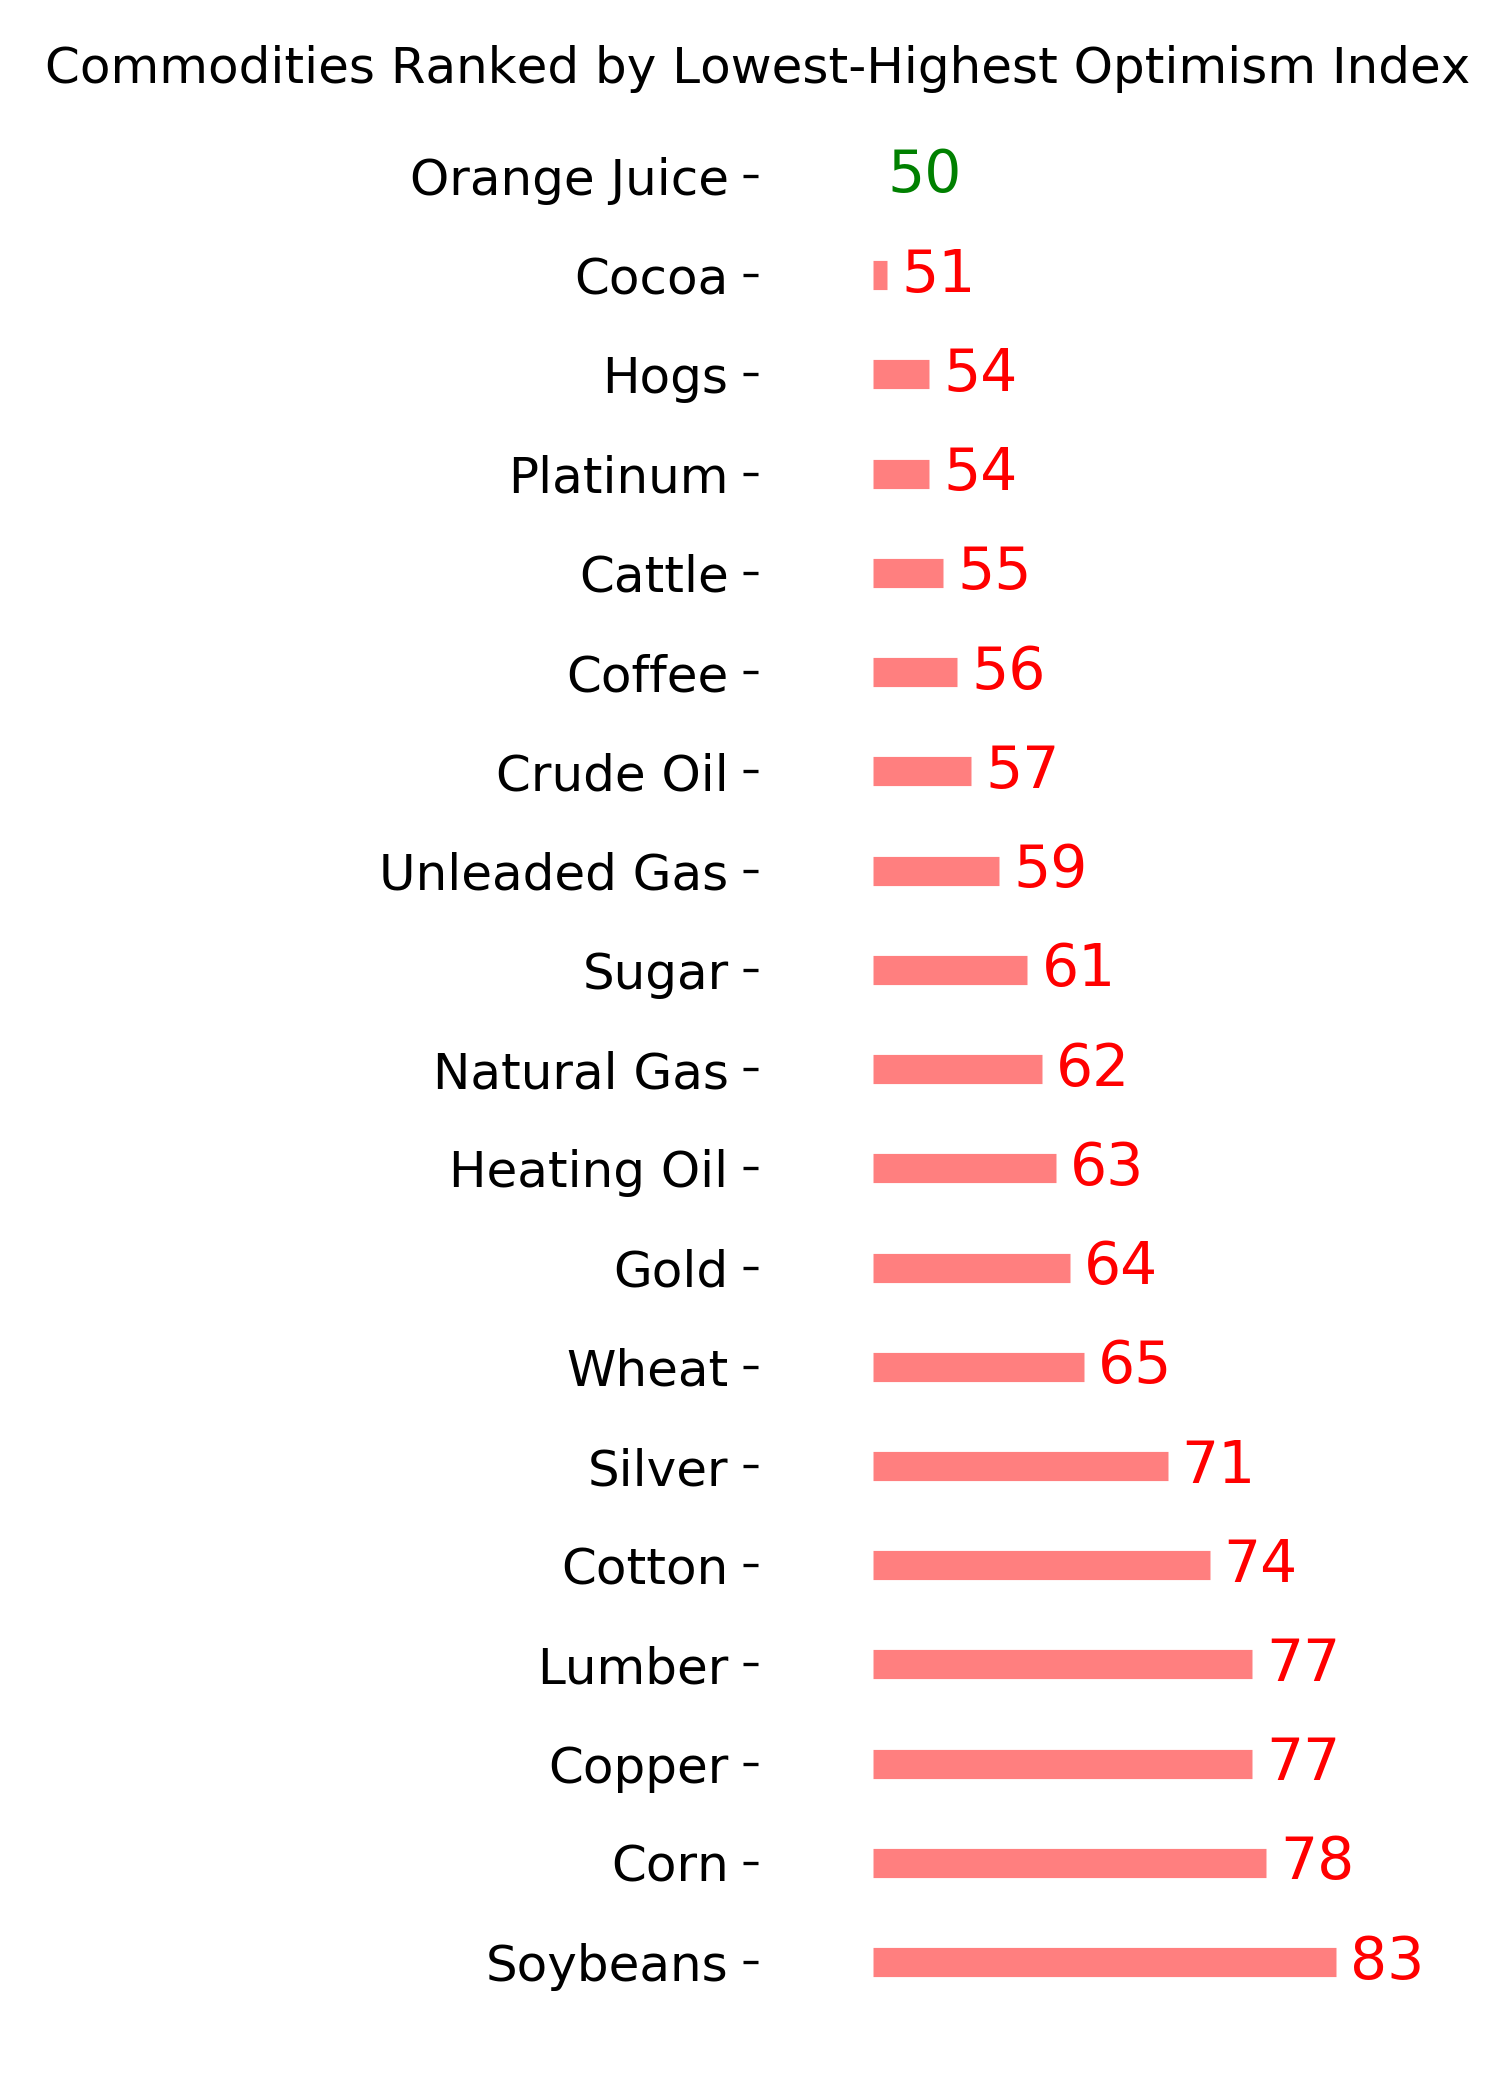
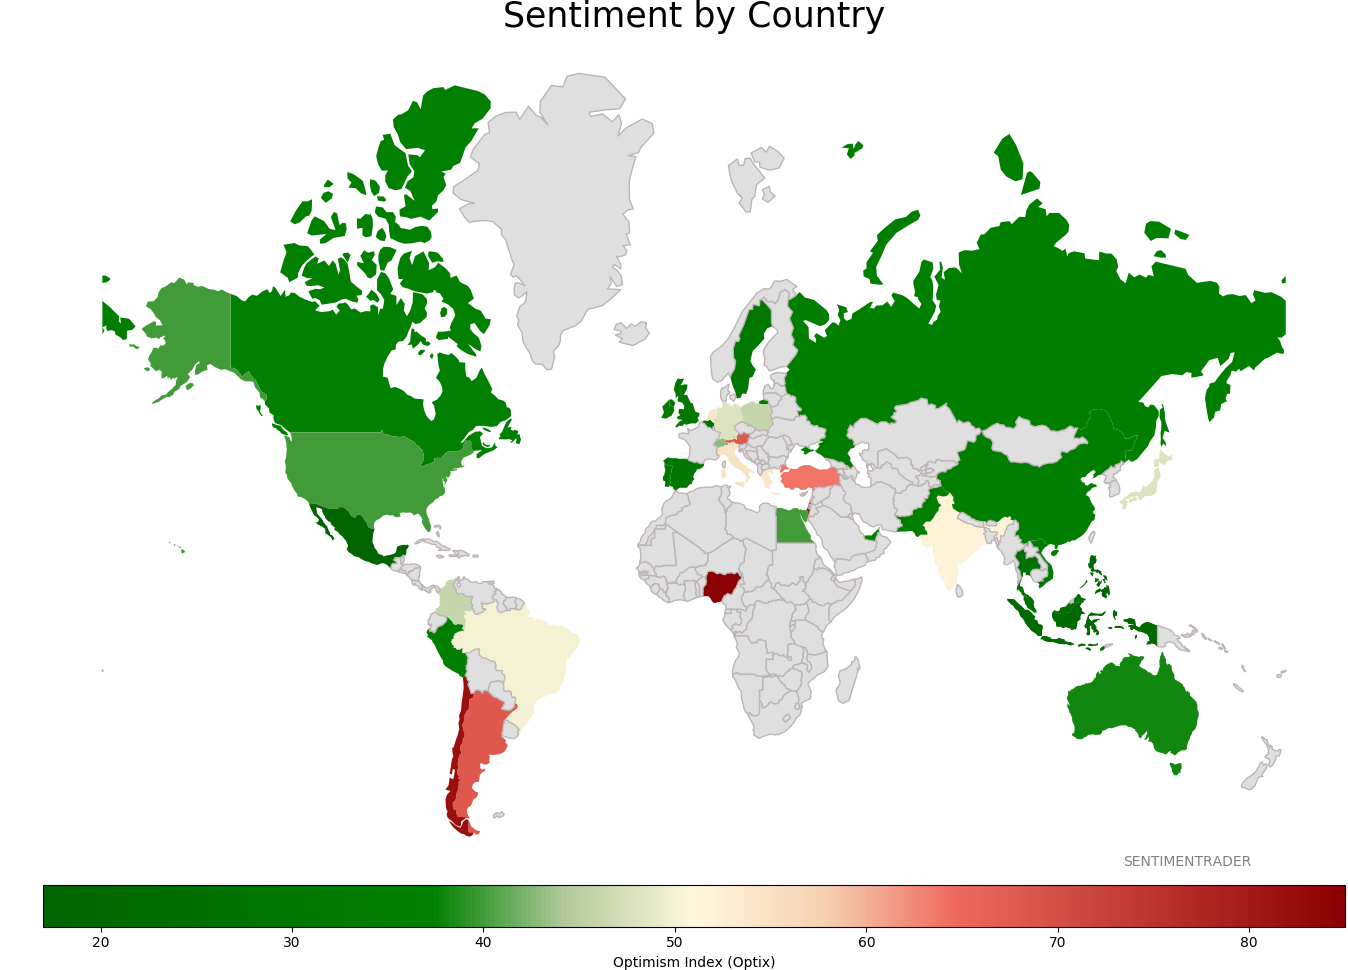
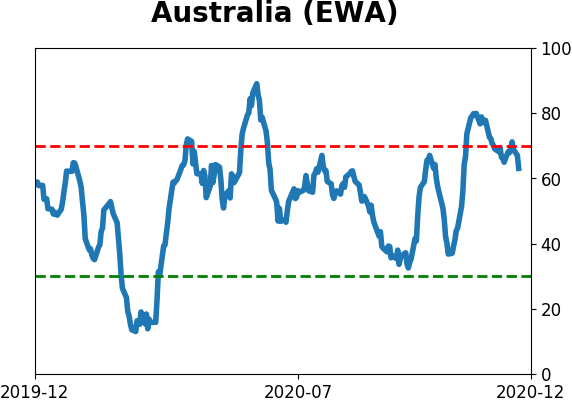
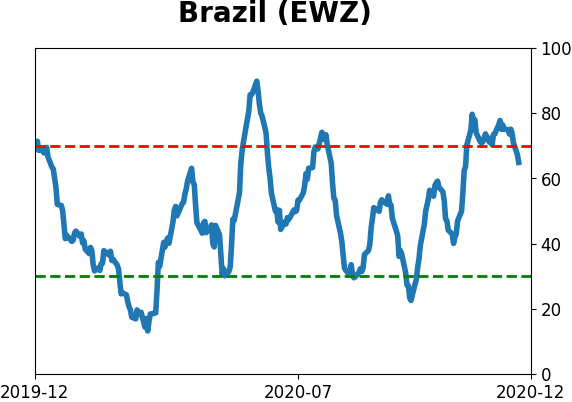
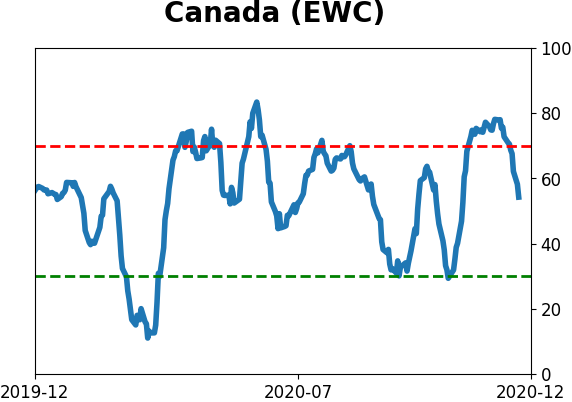
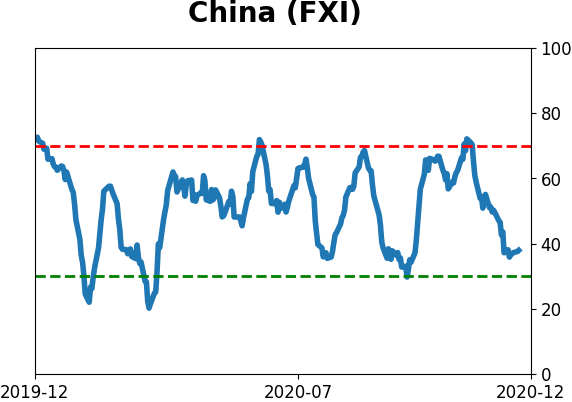
Sentiment Around The World
Optimism Index Thumbnails
|
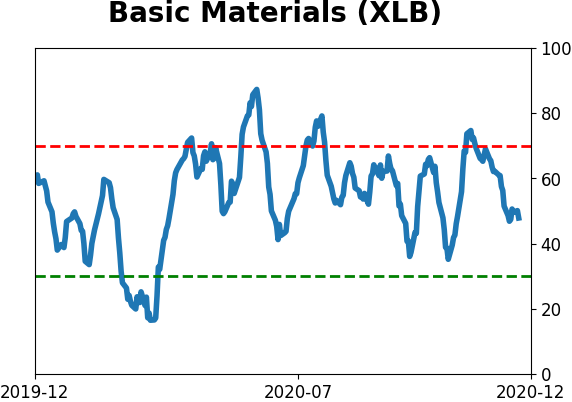
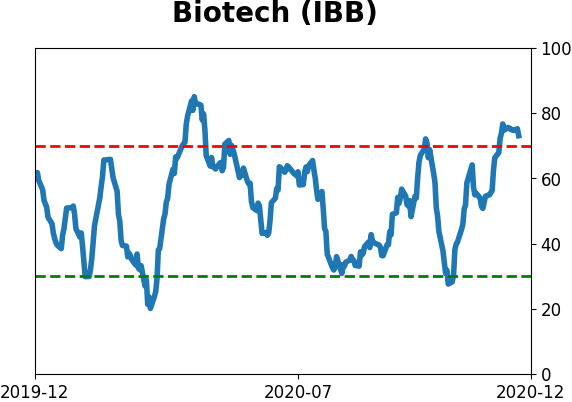
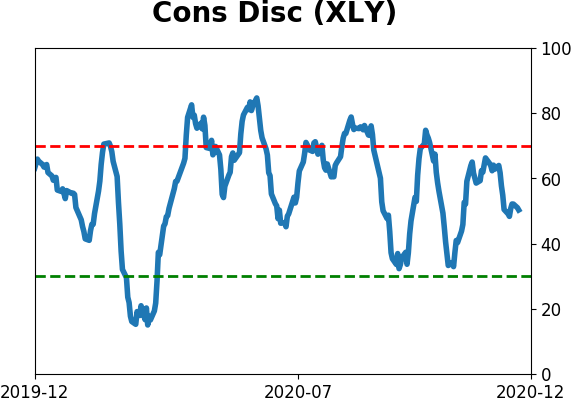
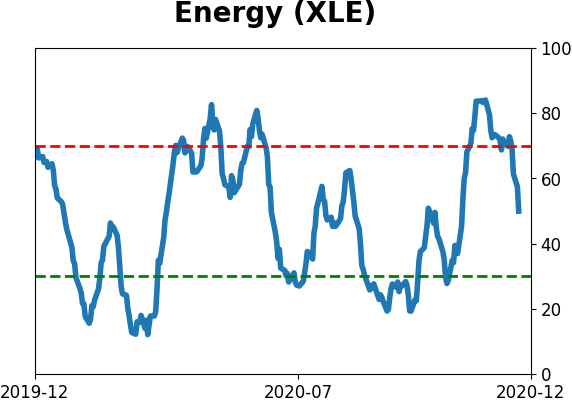
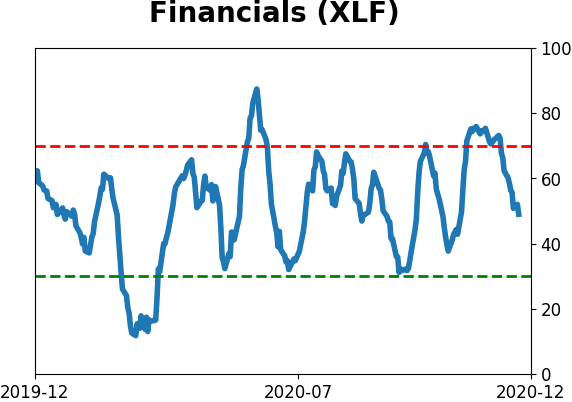
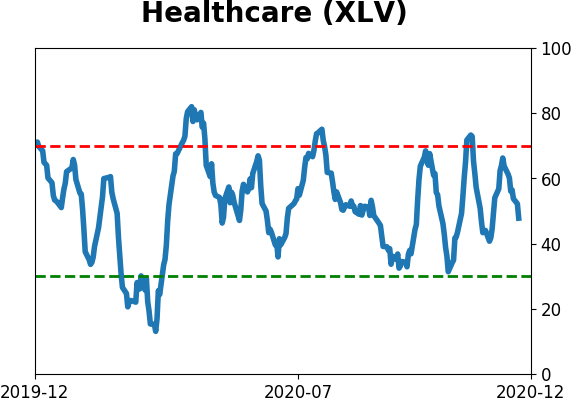
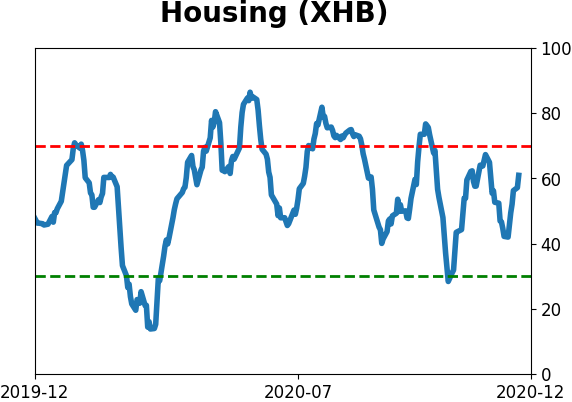
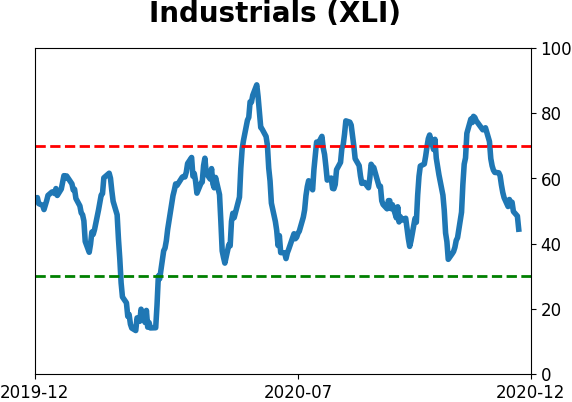
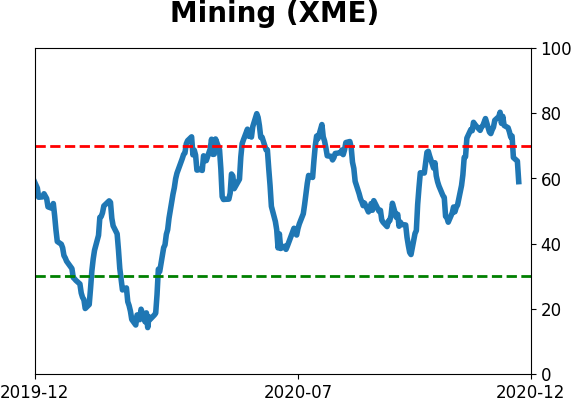
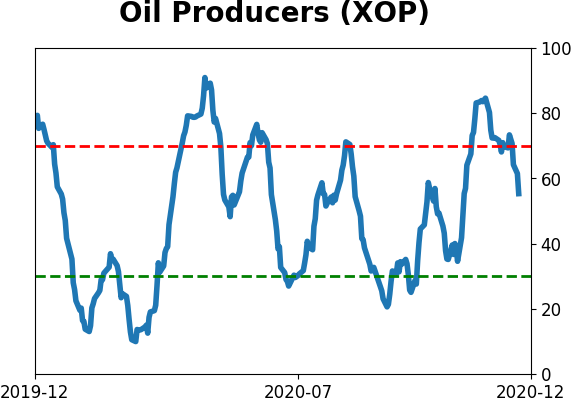
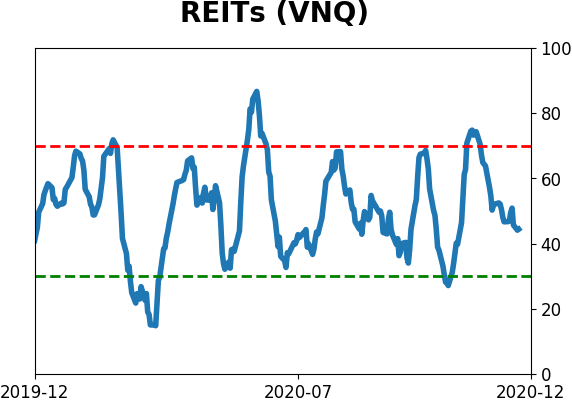
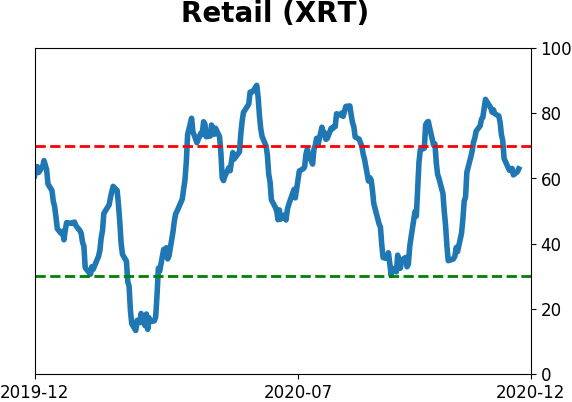
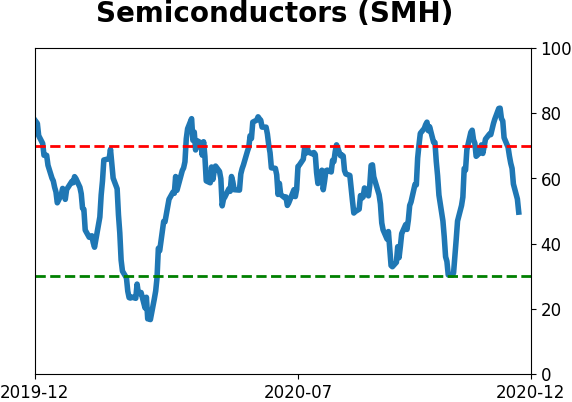
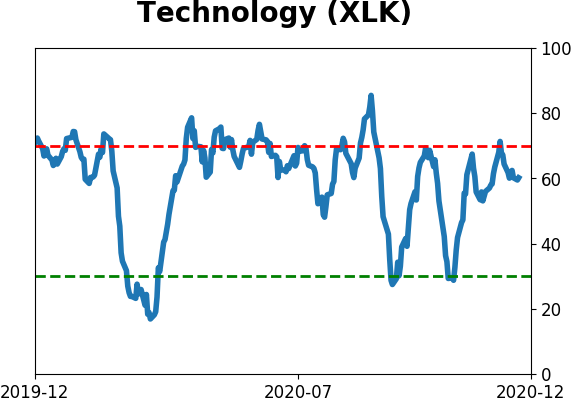
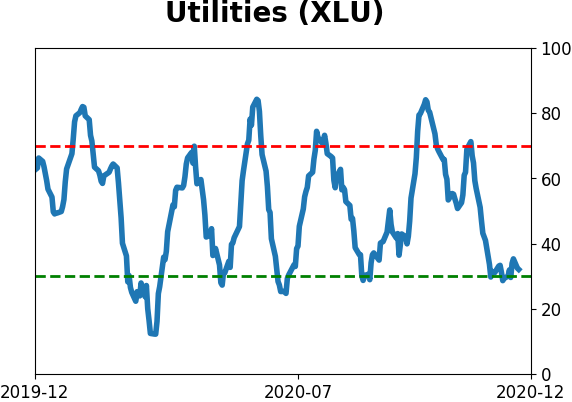
Sector ETF's - 10-Day Moving Average
|
|
|
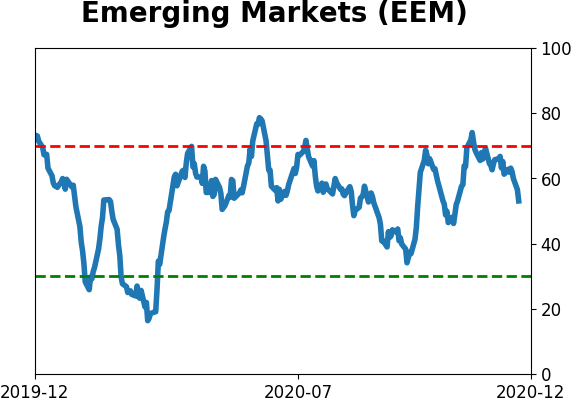
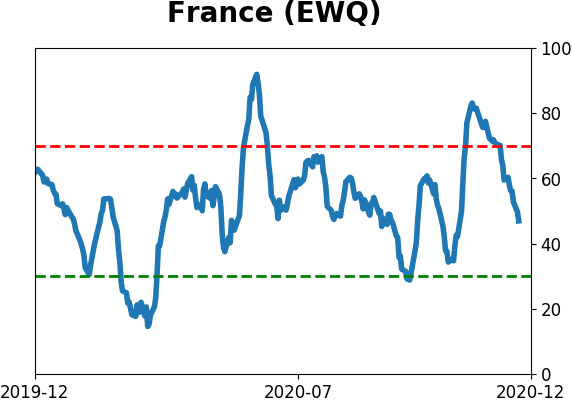
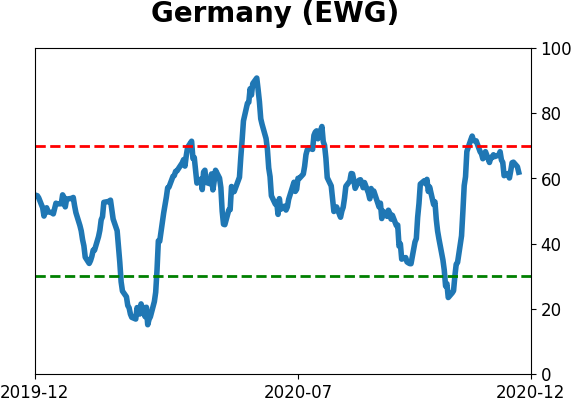
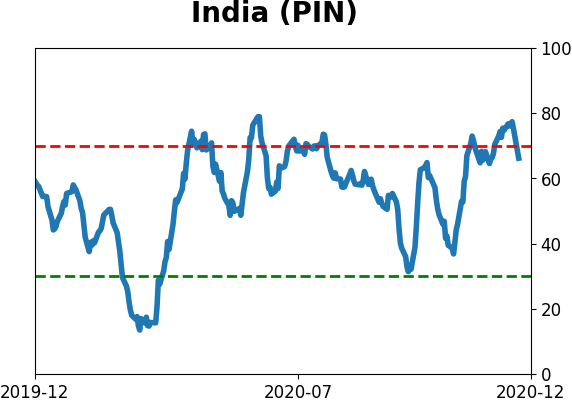
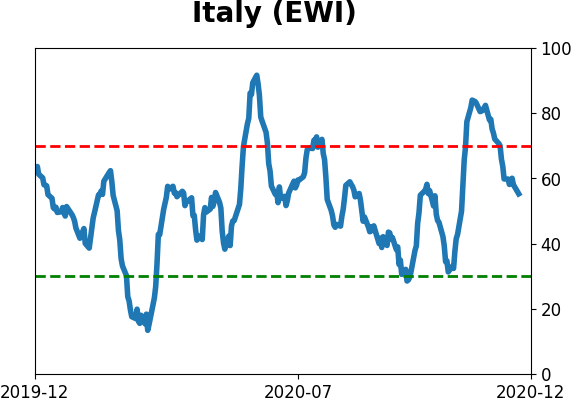
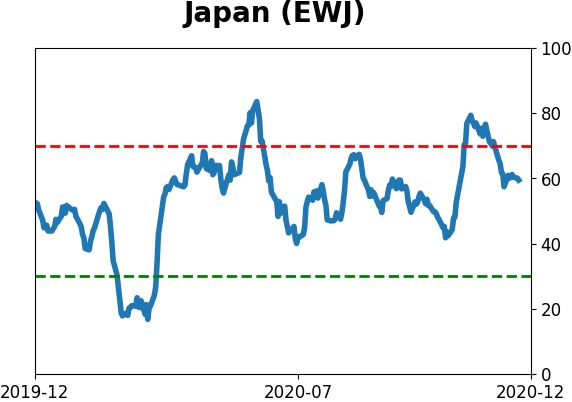
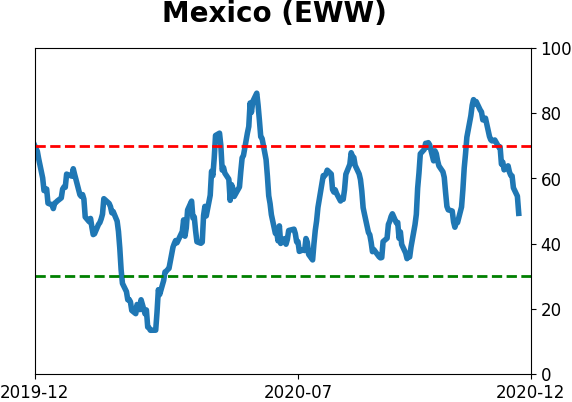
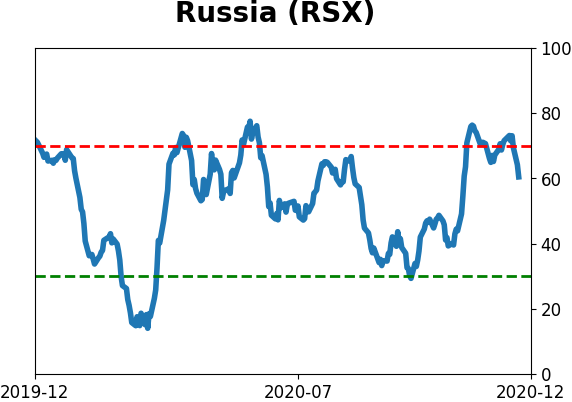
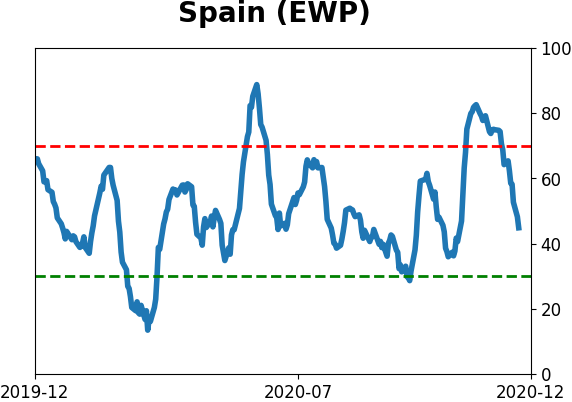
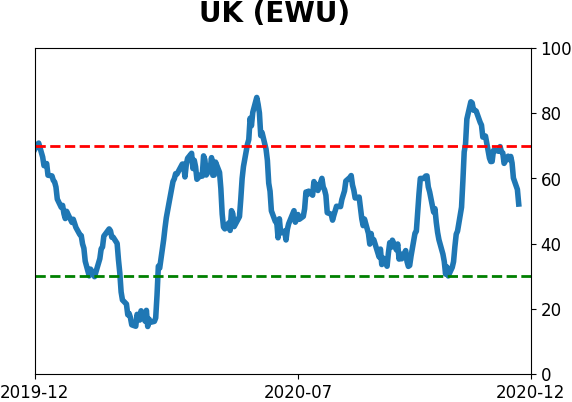
Country ETF's - 10-Day Moving Average
|
|
|
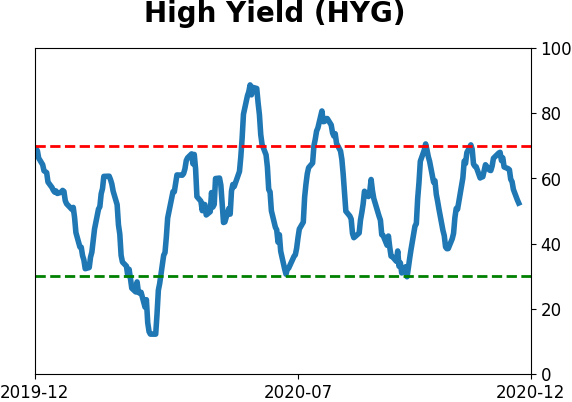
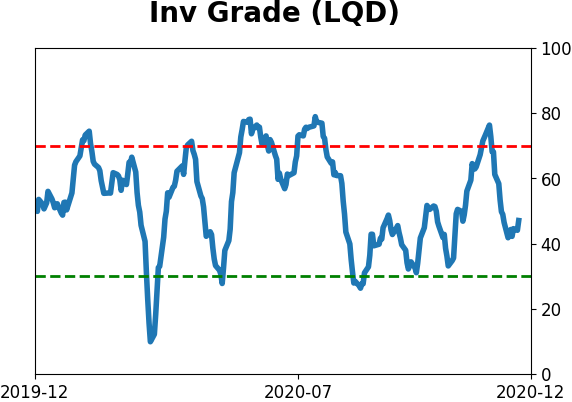
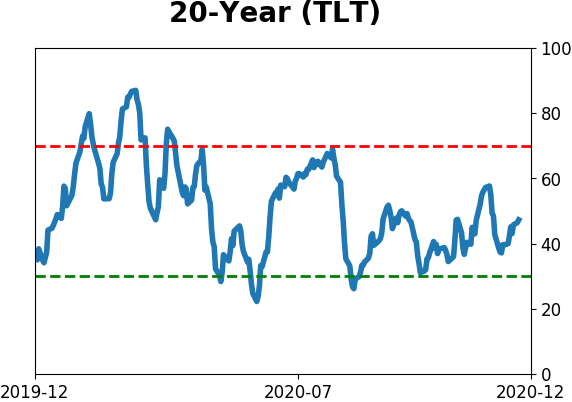
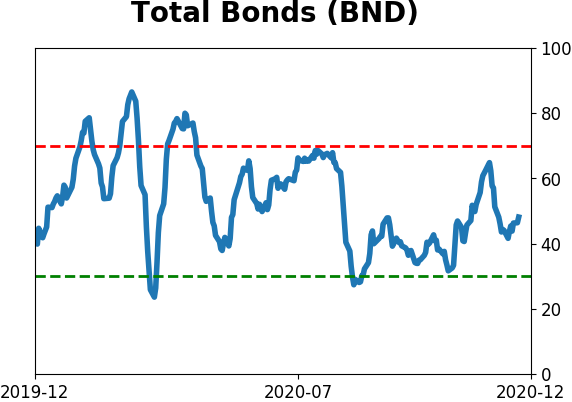
Bond ETF's - 10-Day Moving Average
|
|
|
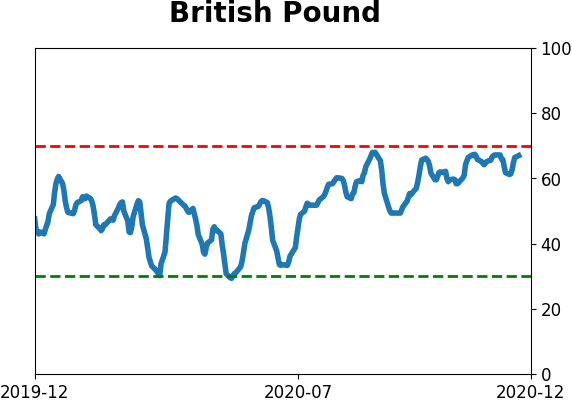
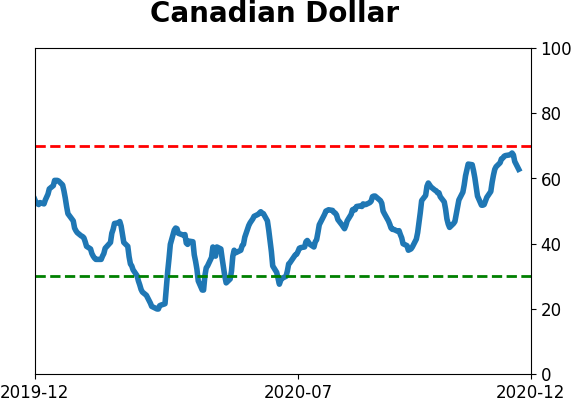
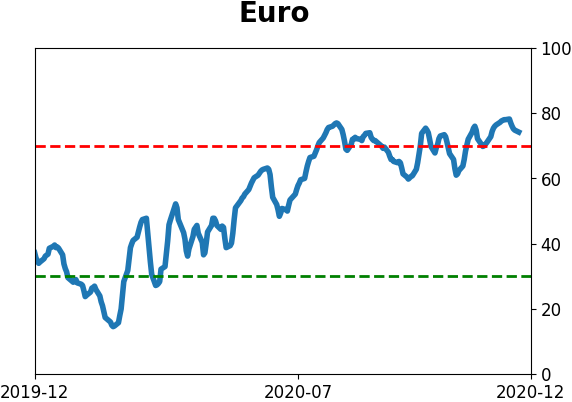
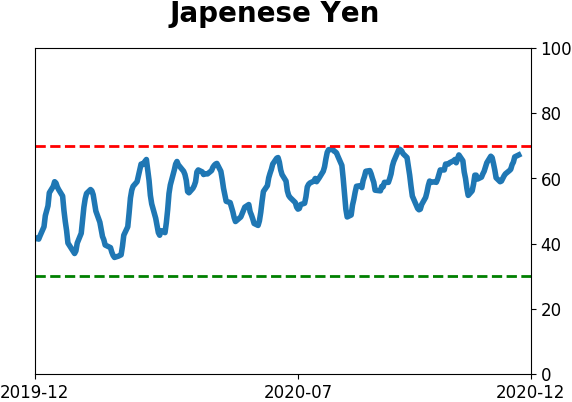
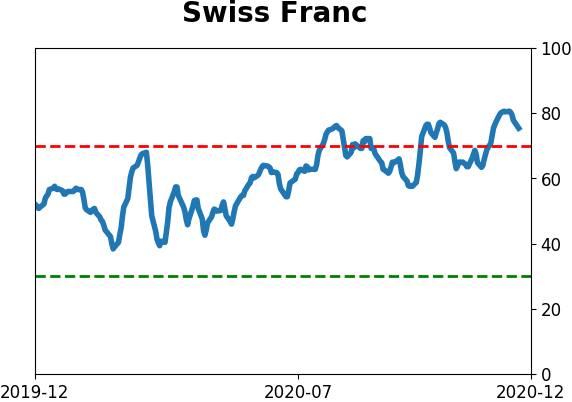
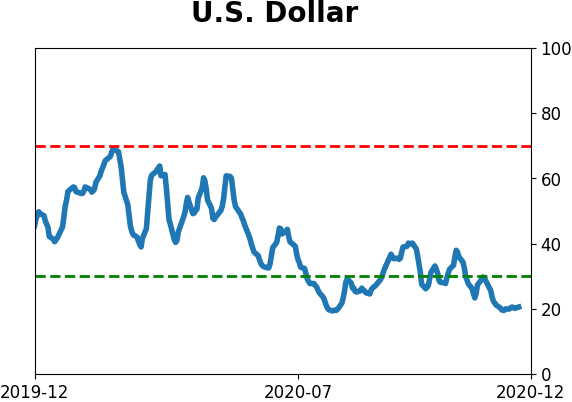
Currency ETF's - 5-Day Moving Average
|
|
|
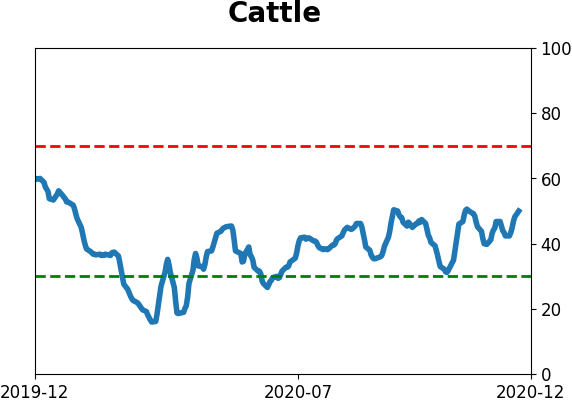
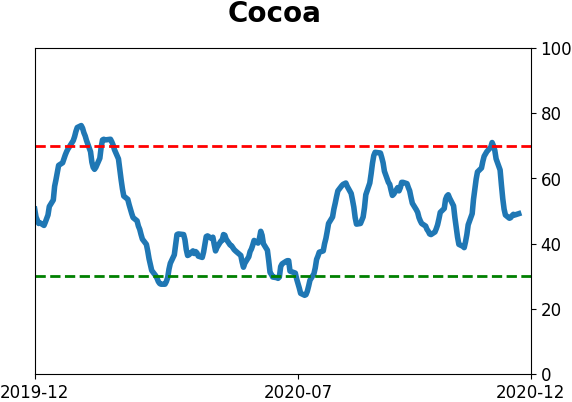
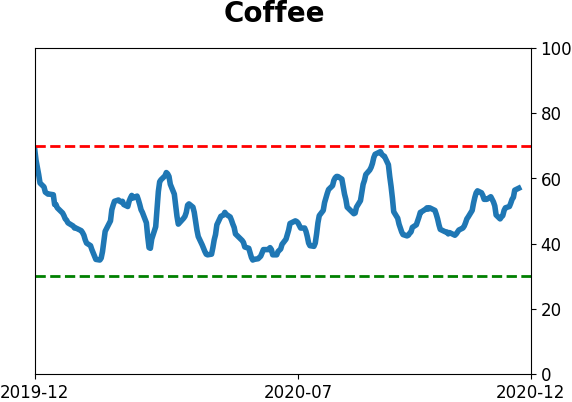
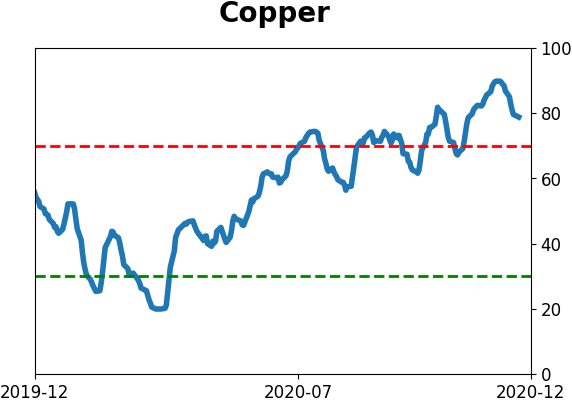
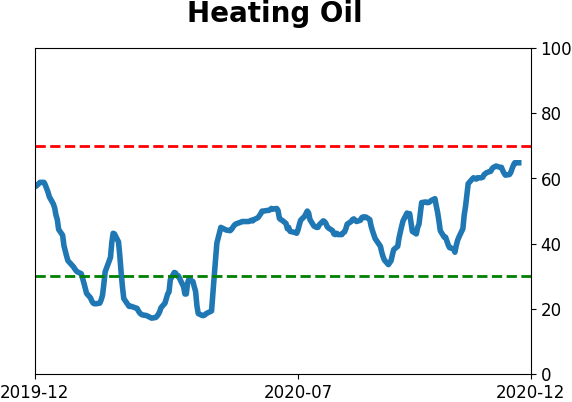
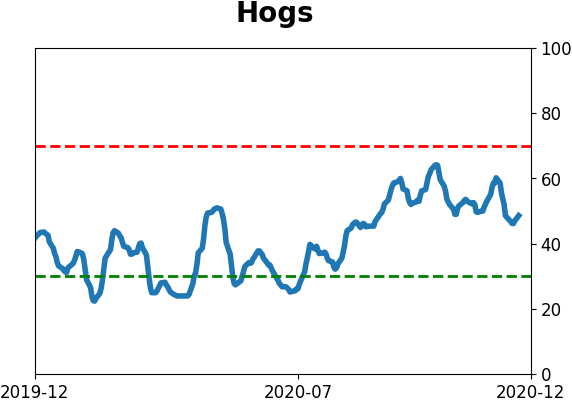
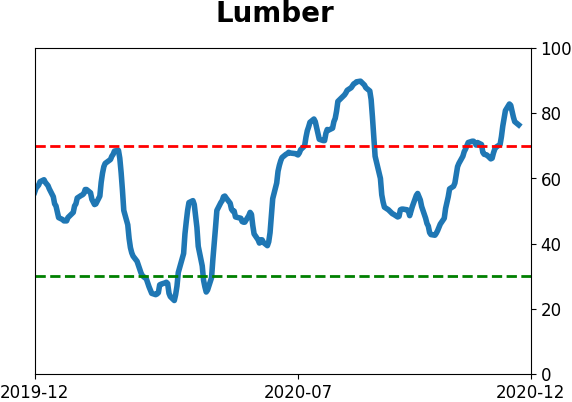
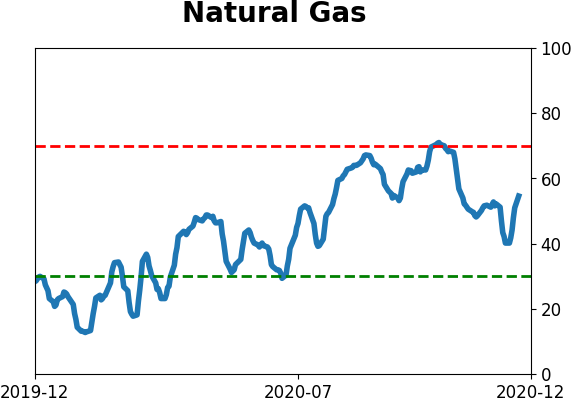
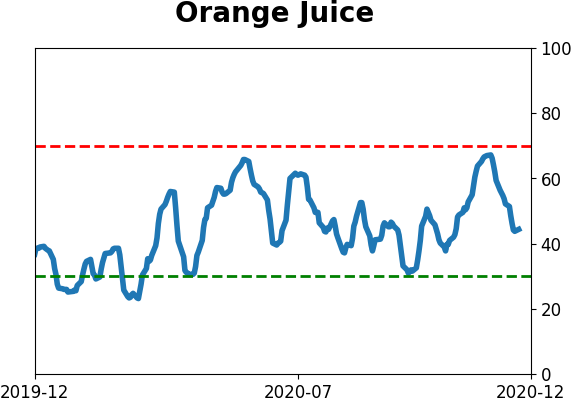
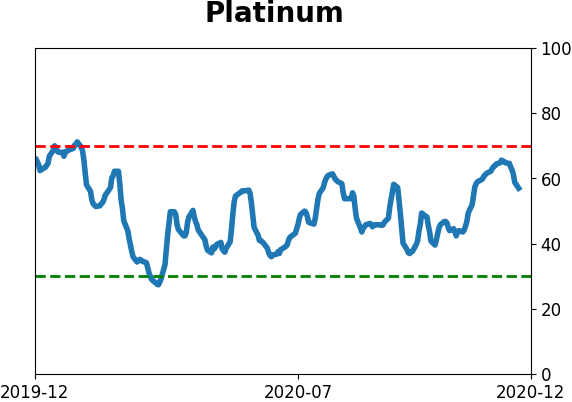
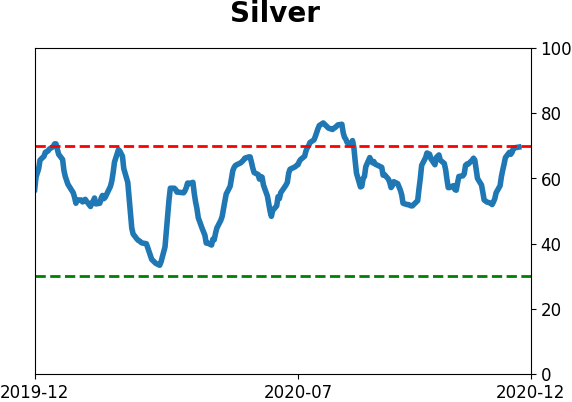
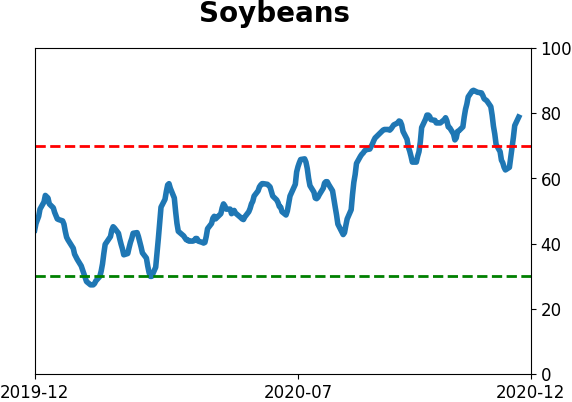
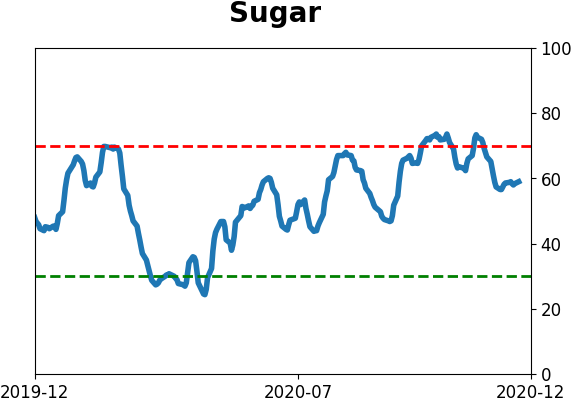
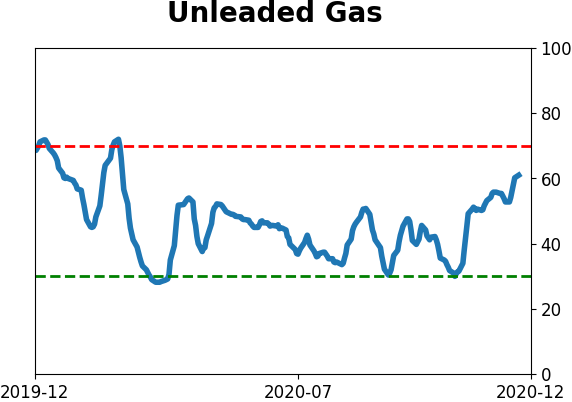
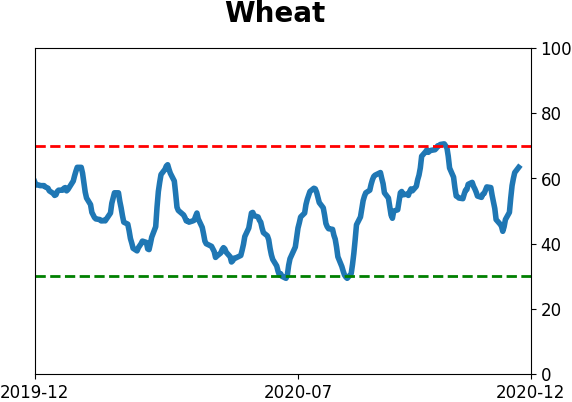
Commodity ETF's - 5-Day Moving Average
|
|