Headlines
|
|
New lows overwhelm the Nasdaq during a historically volatile December:
With more selling pressure this week, an average of 7% more stocks on the Nasdaq have fallen to 52-week lows than risen to 52-week highs. That's among the worst readings in 25 years. This is also one of the most volatile Decembers in the history of the Nasdaq Composite. Similar conditions usually preceded a rebound.
Bottom Line:
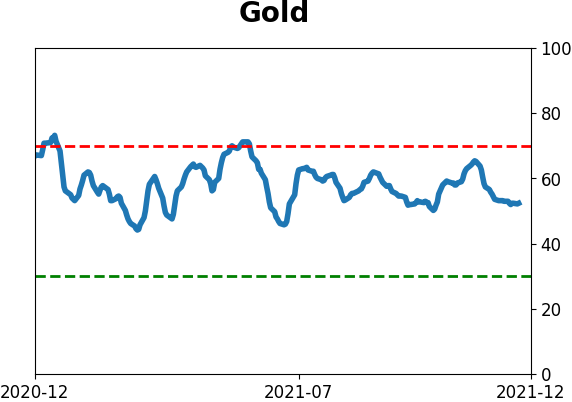
STOCKS: Hold Sentiment hit a pessimistic extreme by early December and then buyers showed enough interest to trigger a thrust in breadth. Those are reliable precursors to higher prices. There is a lot of disagreement among sectors, though, with negative divergences in tech but impressive participation in sectors like consumer staples. We should work higher but it's a bifurcated market. BONDS: Hold Despite mostly steady prices, investors turned pessimistic on bonds to a nearly decade-high degree by late November. Sentiment has recovered since then, which has been a mostly positive sign over the past 20 years, but not necessarily prior to then. GOLD: Hold
Gold and miners were rejected after trying to recover above their 200-day averages in May. Some oversold extremes in breadth measures among miners triggered in late September, and they rebounded strongly then gave those gains back. Still not much of an apparent edge here.
|
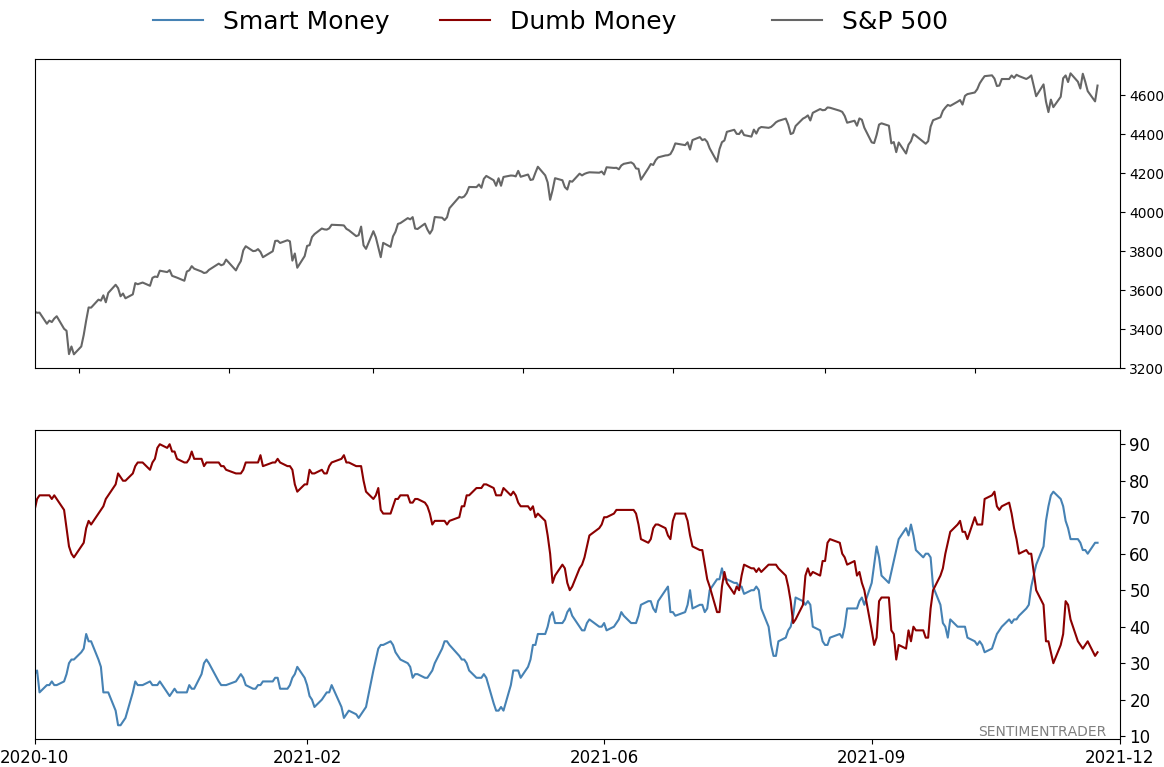
Smart / Dumb Money Confidence
|
Smart Money Confidence: 63%
Dumb Money Confidence: 33%
|
|
Risk Levels
Stocks Short-Term
|
Stocks Medium-Term
|
|
Bonds

|
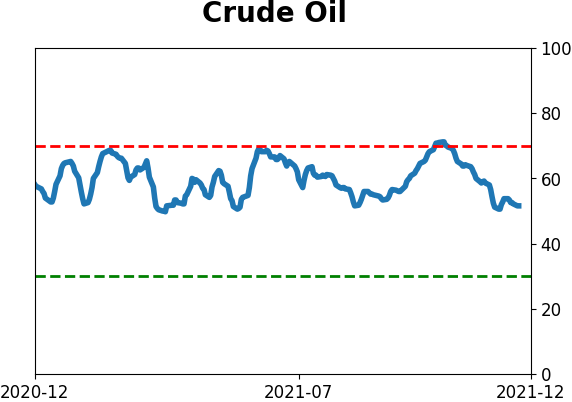
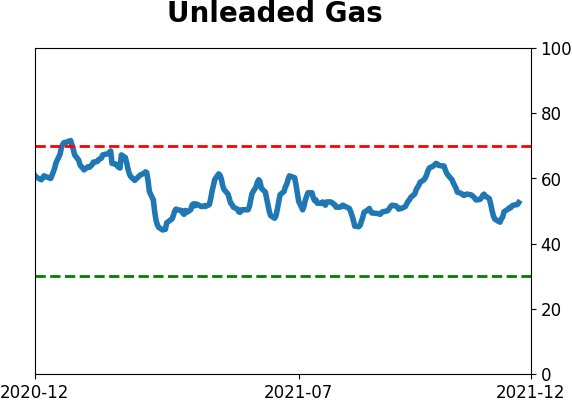
Crude Oil
|
|
Gold
|
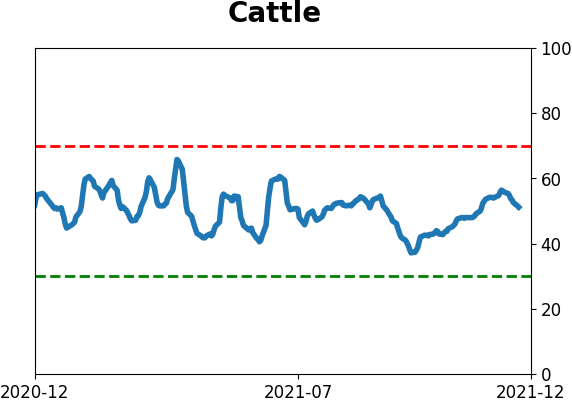
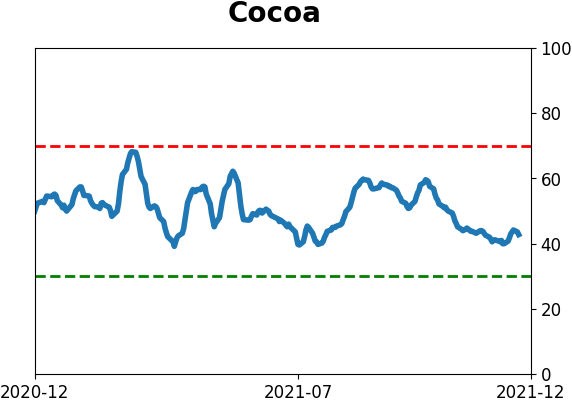
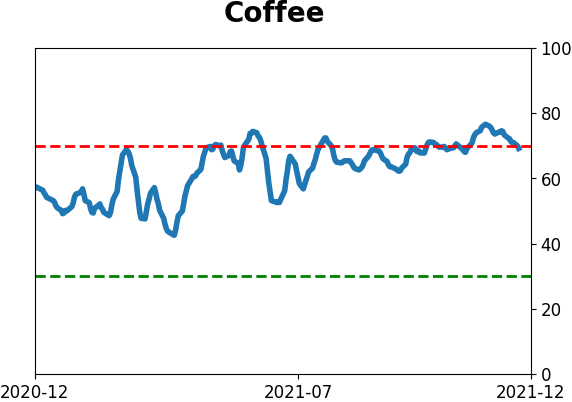
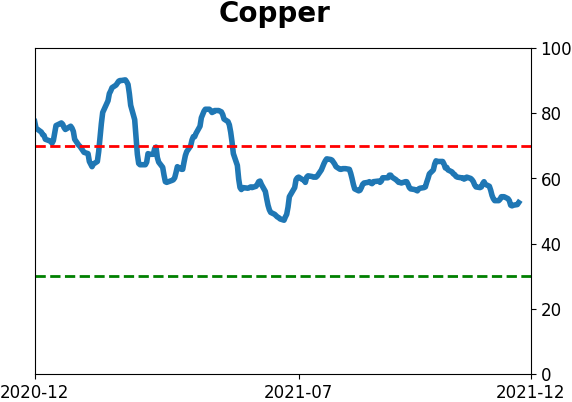
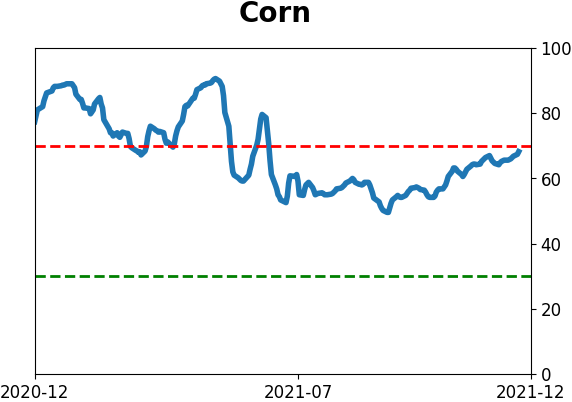
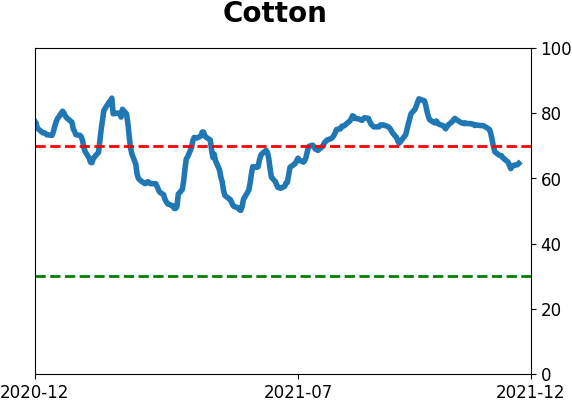
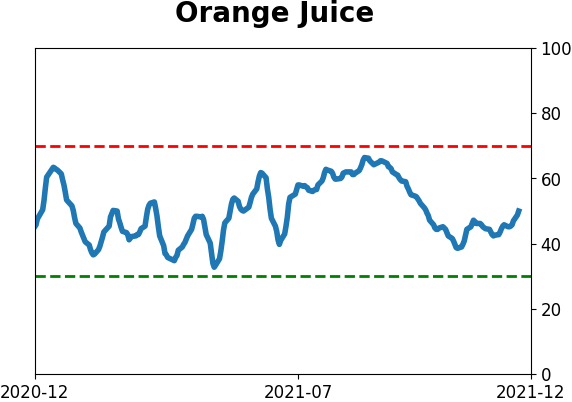
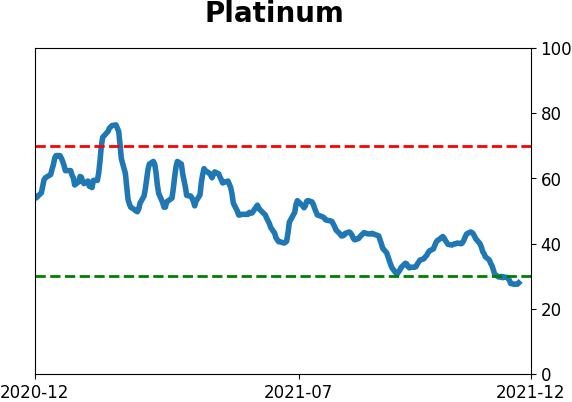
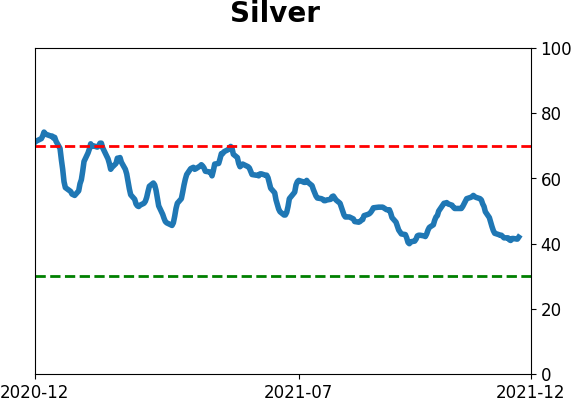
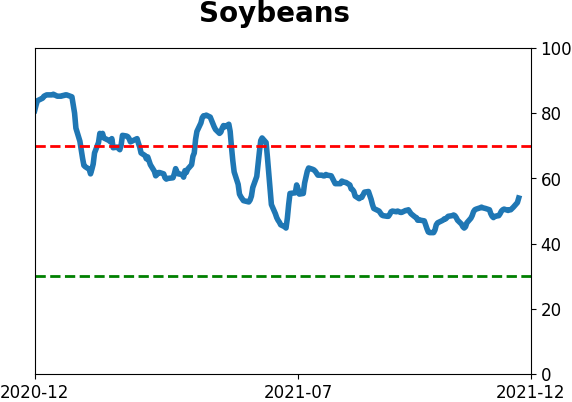
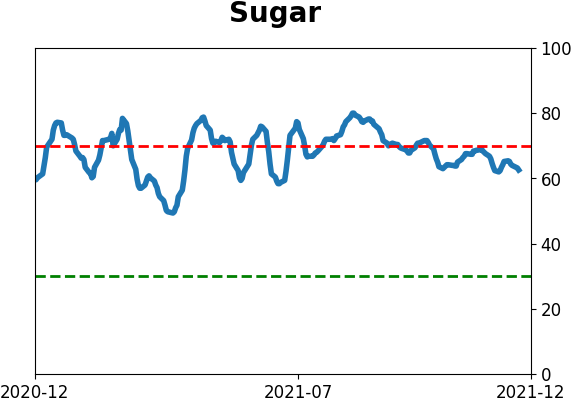
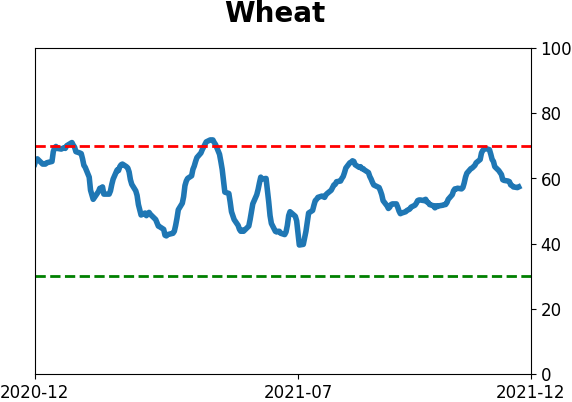
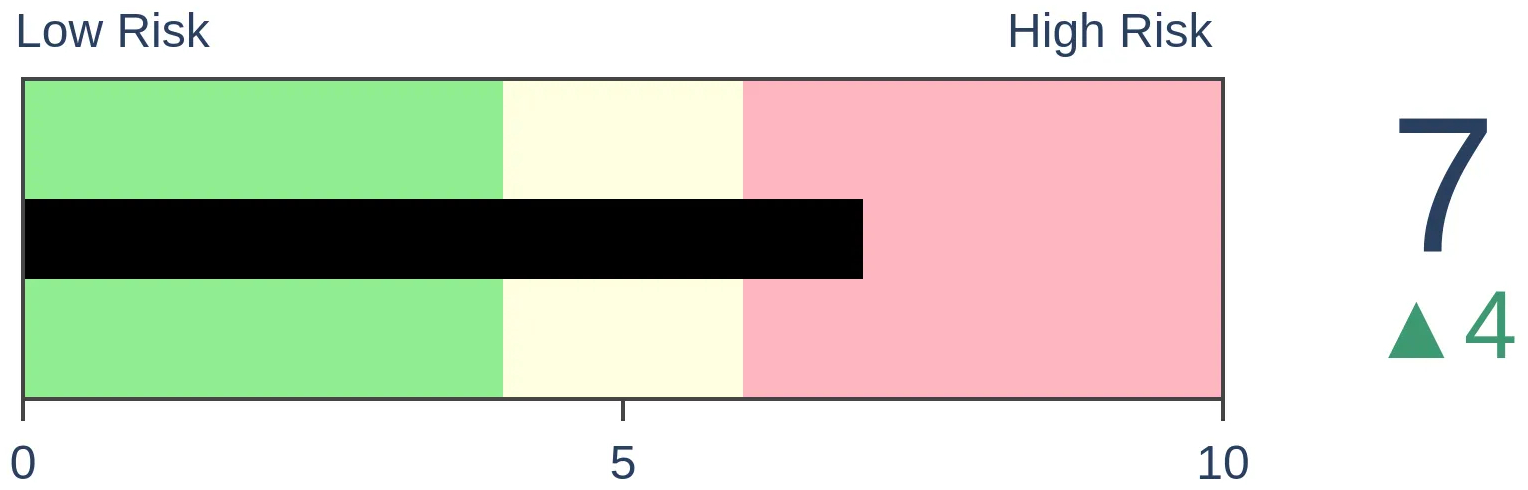
Agriculture

|
|
Research
By Jason Goepfert
BOTTOM LINE
With more selling pressure this week, an average of 7% more stocks on the Nasdaq have fallen to 52-week lows than risen to 52-week highs. That's among the worst readings in 25 years. This is also one of the most volatile Decembers in the history of the Nasdaq Composite. Similar conditions usually preceded a rebound.
FORECAST / TIMEFRAME
None
|
Key points:
- There has been a surge in 52-week lows, and a shortage of 52-week highs, on the Nasdaq
- This is one of the most volatile Decembers in history for the Nasdaq Composite
- Those conditions have tended to precede at least short-term rebounds
A surge in new lows that approaches the worst in 25 years
We saw yesterday that there is a historic spread between stocks in medium-term uptrends in Consumer Staples versus those traded on the Nasdaq exchange.
Among the latter, there has been significant damage. More than 8% of stocks traded on that exchange recently plunged to 52-week lows, while fewer than 1% have scored 52-week highs.
Over the past 20 days, the spread between new highs and new lows has dropped to -7% of all issues. Fewer than 3% of days have recorded a lower reading than what we see now.
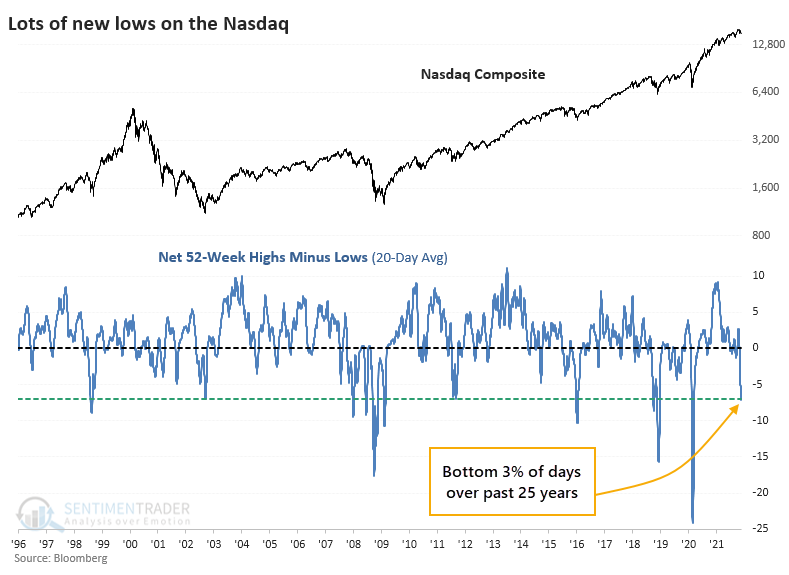
By the time the net percentage of stocks at highs minus lows exceeded 6.75% of all issues on the Nasdaq, most of the selling tended to be absorbed. However, this was not a low-risk buy signal as it preceded massive losses (after a quick rebound) during the Great Financial Crisis, and it was painfully early in 2018 and 2020. Even so, 7 out of the 8 signals showed a gain over the next couple of weeks.
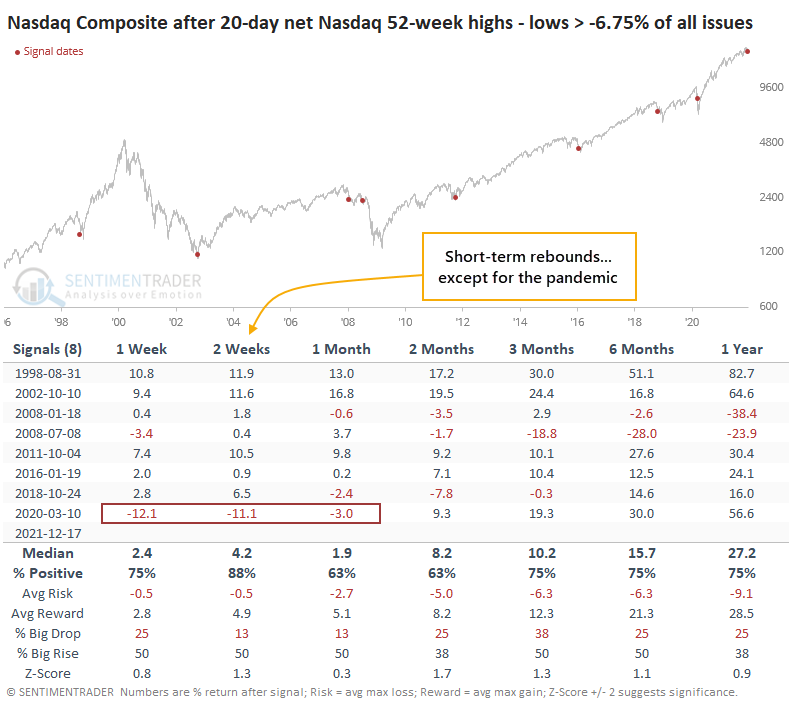
This damage is remarkable because the Nasdaq Composite has barely suffered a pullback. On average, the Composite was more than 20% off its 52-week high when these signals triggered, versus just over 6% now. No other signal was triggered when the Nasdaq was within 12% of its 52-week high.
Bears will suggest this is an ominous sign of what's to come for the Composite as the indexes catch down to the average stock. Bulls will tell us that it's a good thing because the index will soar as the average stock recovers.
History doesn't give either of them much ammunition. When we've looked at these scenarios, evidence is mixed, but there is a slightly strong argument for bulls. Generally, deep oversold readings under the surface when an index is relatively close to a 52-week high favors stronger-than-random returns going forward. The exceptions tend to be major turning points when bull markets turn into bears.
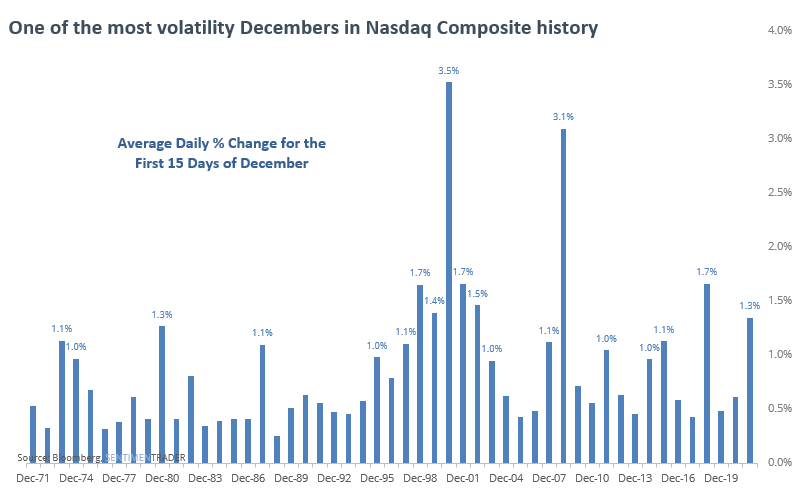
A volatile month, despite its reputation
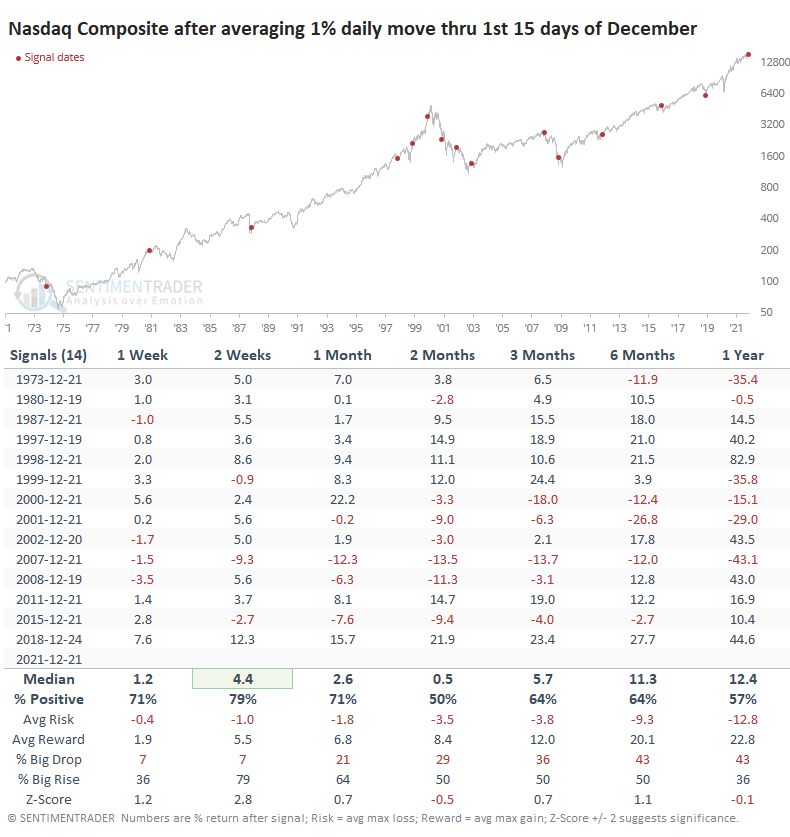
Investors holding stocks on the Nasdaq have suffered one of the most volatile Decembers ever. Through the first 15 days of the month, the Composite has swung an average of more than 1.3% per day, the 8th most-volatile December in the index's history.
After other Decembers that swung an average of 1% or more through the first 15 days, the next couple of weeks tended to be strong.
What the research tells us...
This isn't quite like Christmas Eve of 2018 and all the extremes we saw then, but some readings are getting there, especially in specific sectors. This is a highly bifurcated market, with extreme winners and extreme (and more numerous) losers. For stocks traded on the Nasdaq, signs are quickly building that a short-term rebound into the New Year is likely. If that fails, then the precedents aren't pretty.
Active Studies
| Time Frame | Bullish | Bearish | | Short-Term | 2 | 3 | | Medium-Term | 14 | 2 | | Long-Term | 16 | 8 |
|
Indicators at Extremes
Portfolio
| Position | Description | Weight % | Added / Reduced | Date | | Stocks | RSP | 10.7 | Added 6.4% | 2021-10-01 | | Bonds | 32.7% BND, 7.1% SCHP | 39.8 | Added 8.3% | 2021-10-26 | | Commodities | GCC | 2.4 | Reduced 2.1%
| 2020-09-04 | | Precious Metals | GDX | 4.6 | Reduced 4.2% | 2021-05-19 | | Special Situations | 9.8% KWEB, 4.7% XLE, 2.9% PSCE | 17.3 | Added 9.78% | 2021-10-01 | | Cash | | 24.1 | | |
|
Updates (Changes made today are underlined)
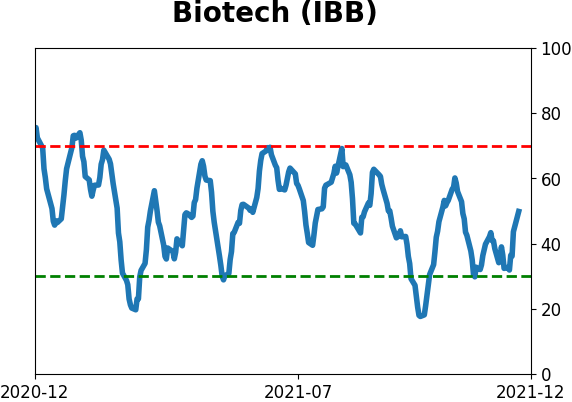
No surprise for 2021, but we're seeing conflicting messages in some of what has developed lately. There was a jump in pessimism heading into December, which has been relieved to some degree. The subsequent breadth thrust has extremely positive implications for forward returns, especially longer-term. The negatives are mostly sector-related, especially the negative divergences among Nasdaq 100 stocks. Consumer Staples have seen an impressive surge, and Biotech may be oversold, but otherwise there are a whole lot of crosscurrents and seemingly not much edge. Bond sentiment is trying to recover from a recent bout of pessimism, and gold stocks are doing their thing which is not much at all. They've been flat for six months. Chinese tech stocks were doing exactly what they're supposed to do, then did *not* by plunging to new lows. This is troubling on a shorter-term time frame, but this was never meant for a trade, rather a multi-year investment. Recent behavior is troubling and I will not be adding any exposure as long as that's the case. RETURN YTD: 7.8% 2020: 8.1%, 2019: 12.6%, 2018: 0.6%, 2017: 3.8%, 2016: 17.1%, 2015: 9.2%, 2014: 14.5%, 2013: 2.2%, 2012: 10.8%, 2011: 16.5%, 2010: 15.3%, 2009: 23.9%, 2008: 16.2%, 2007: 7.8%
|
|
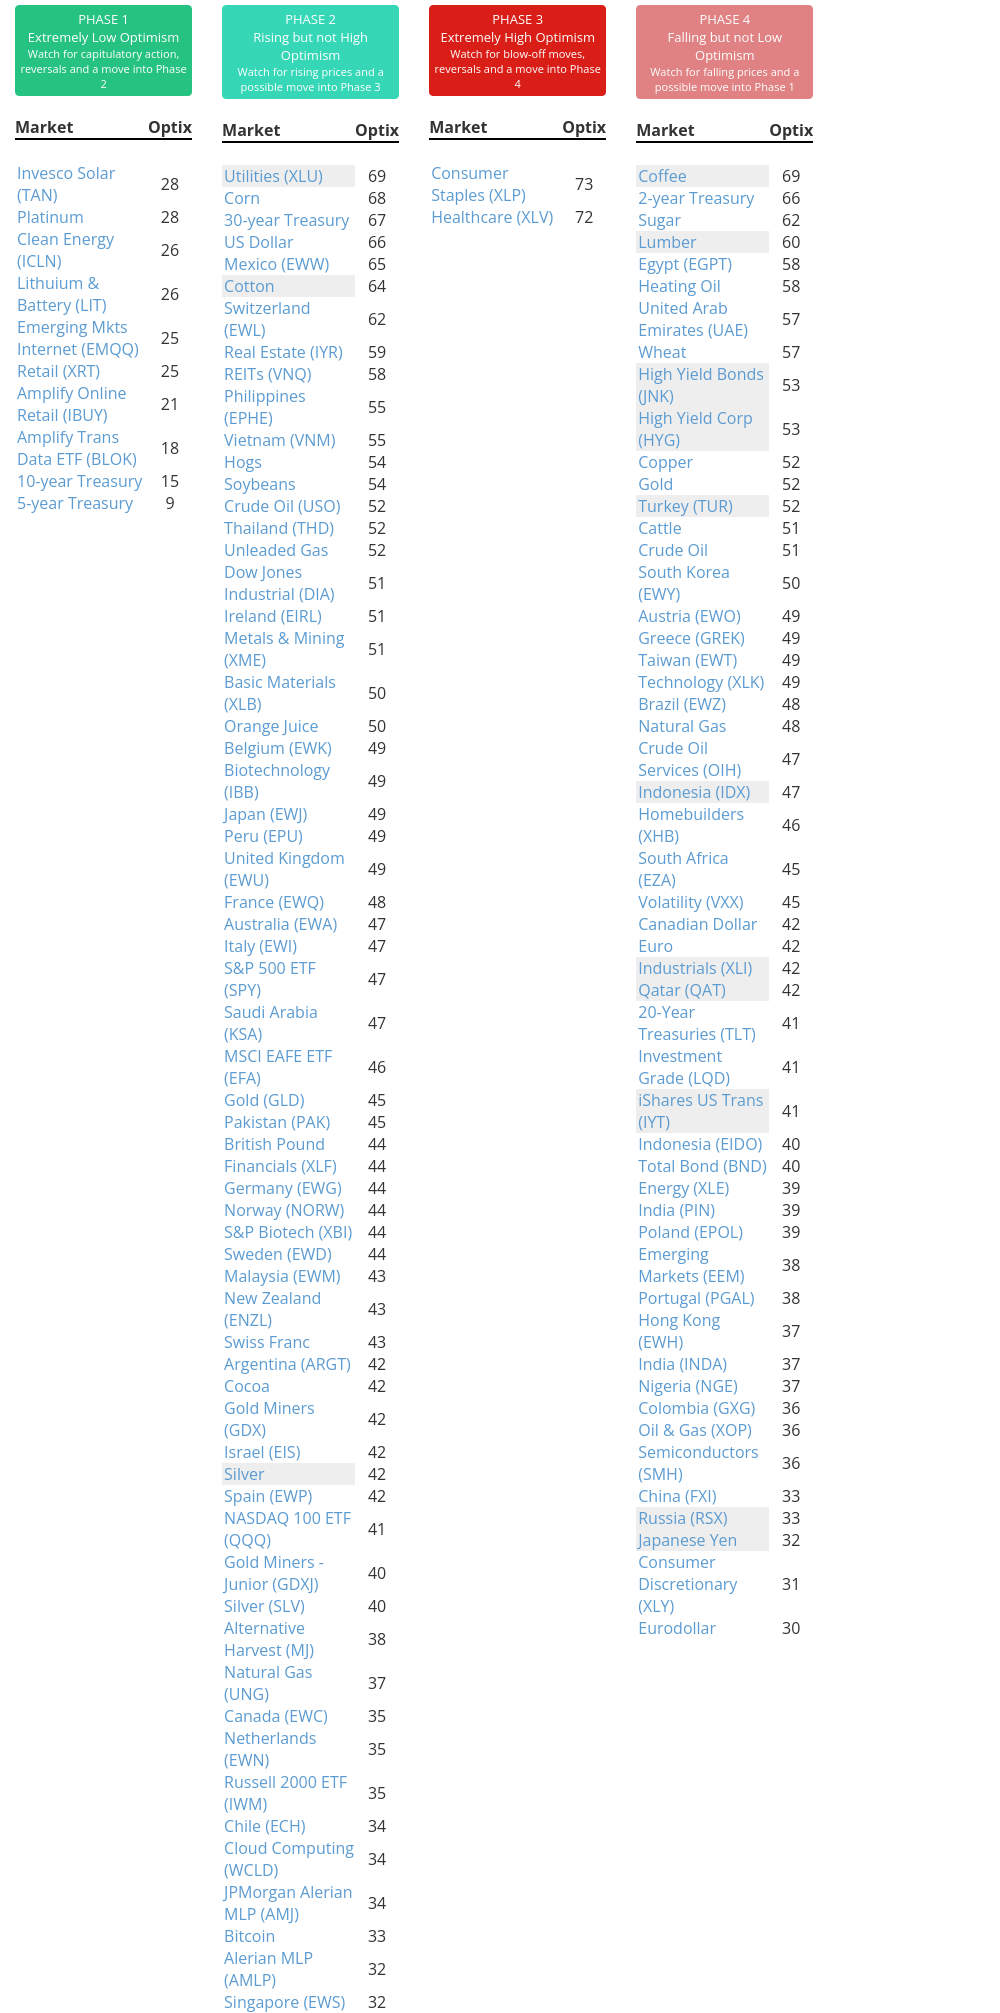
Phase Table
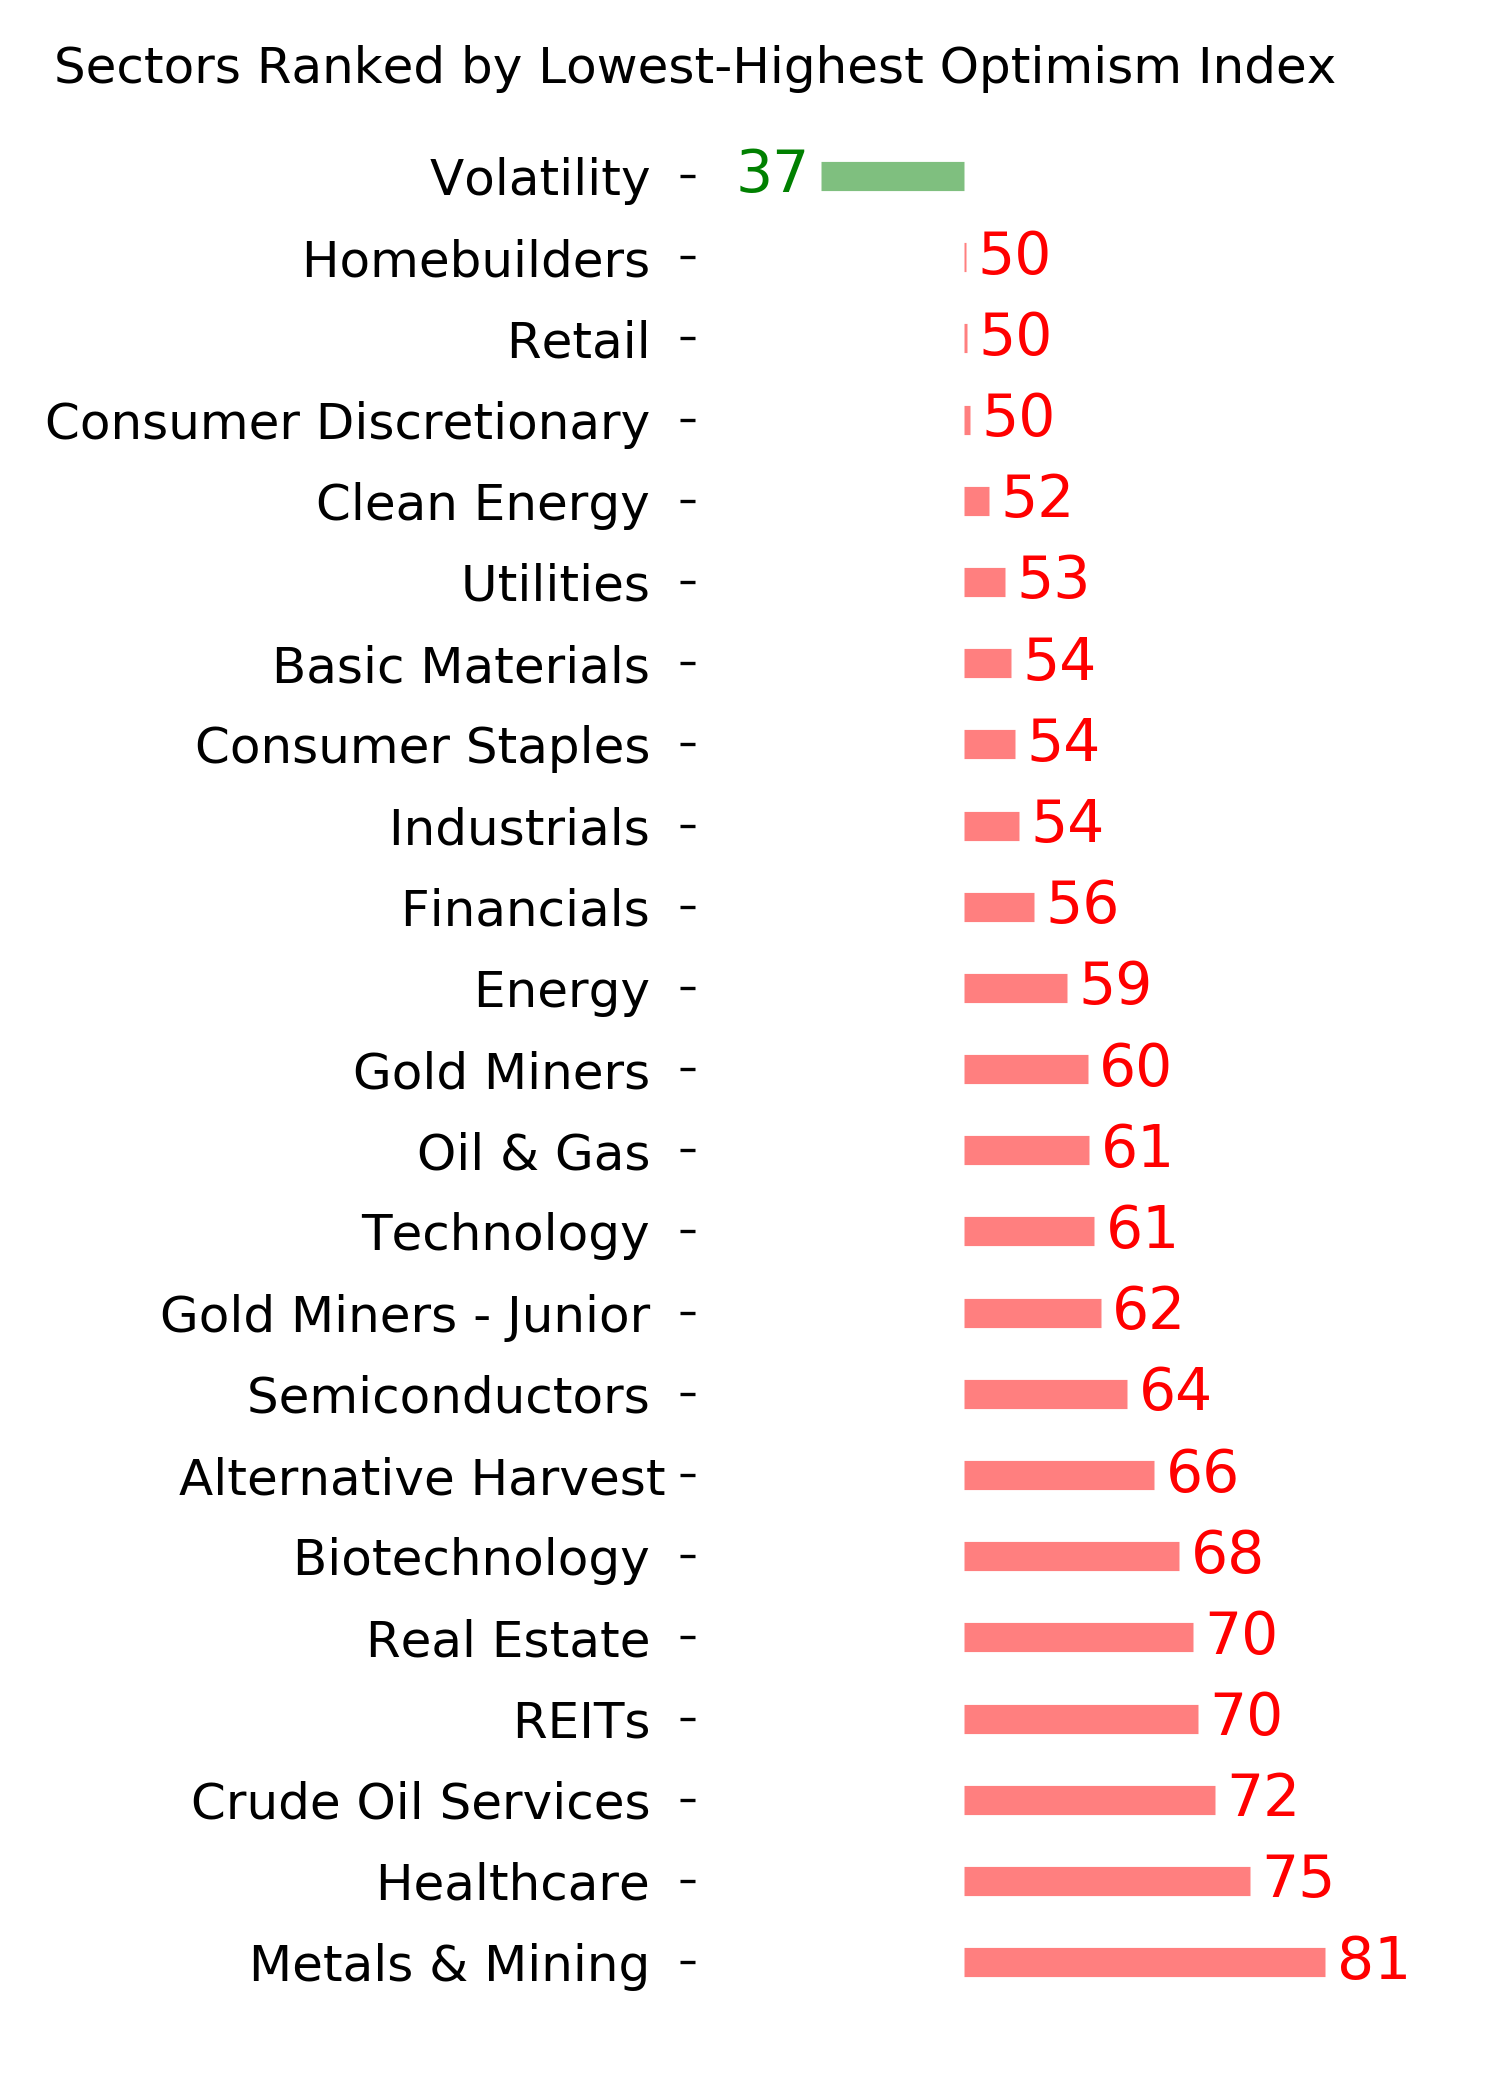
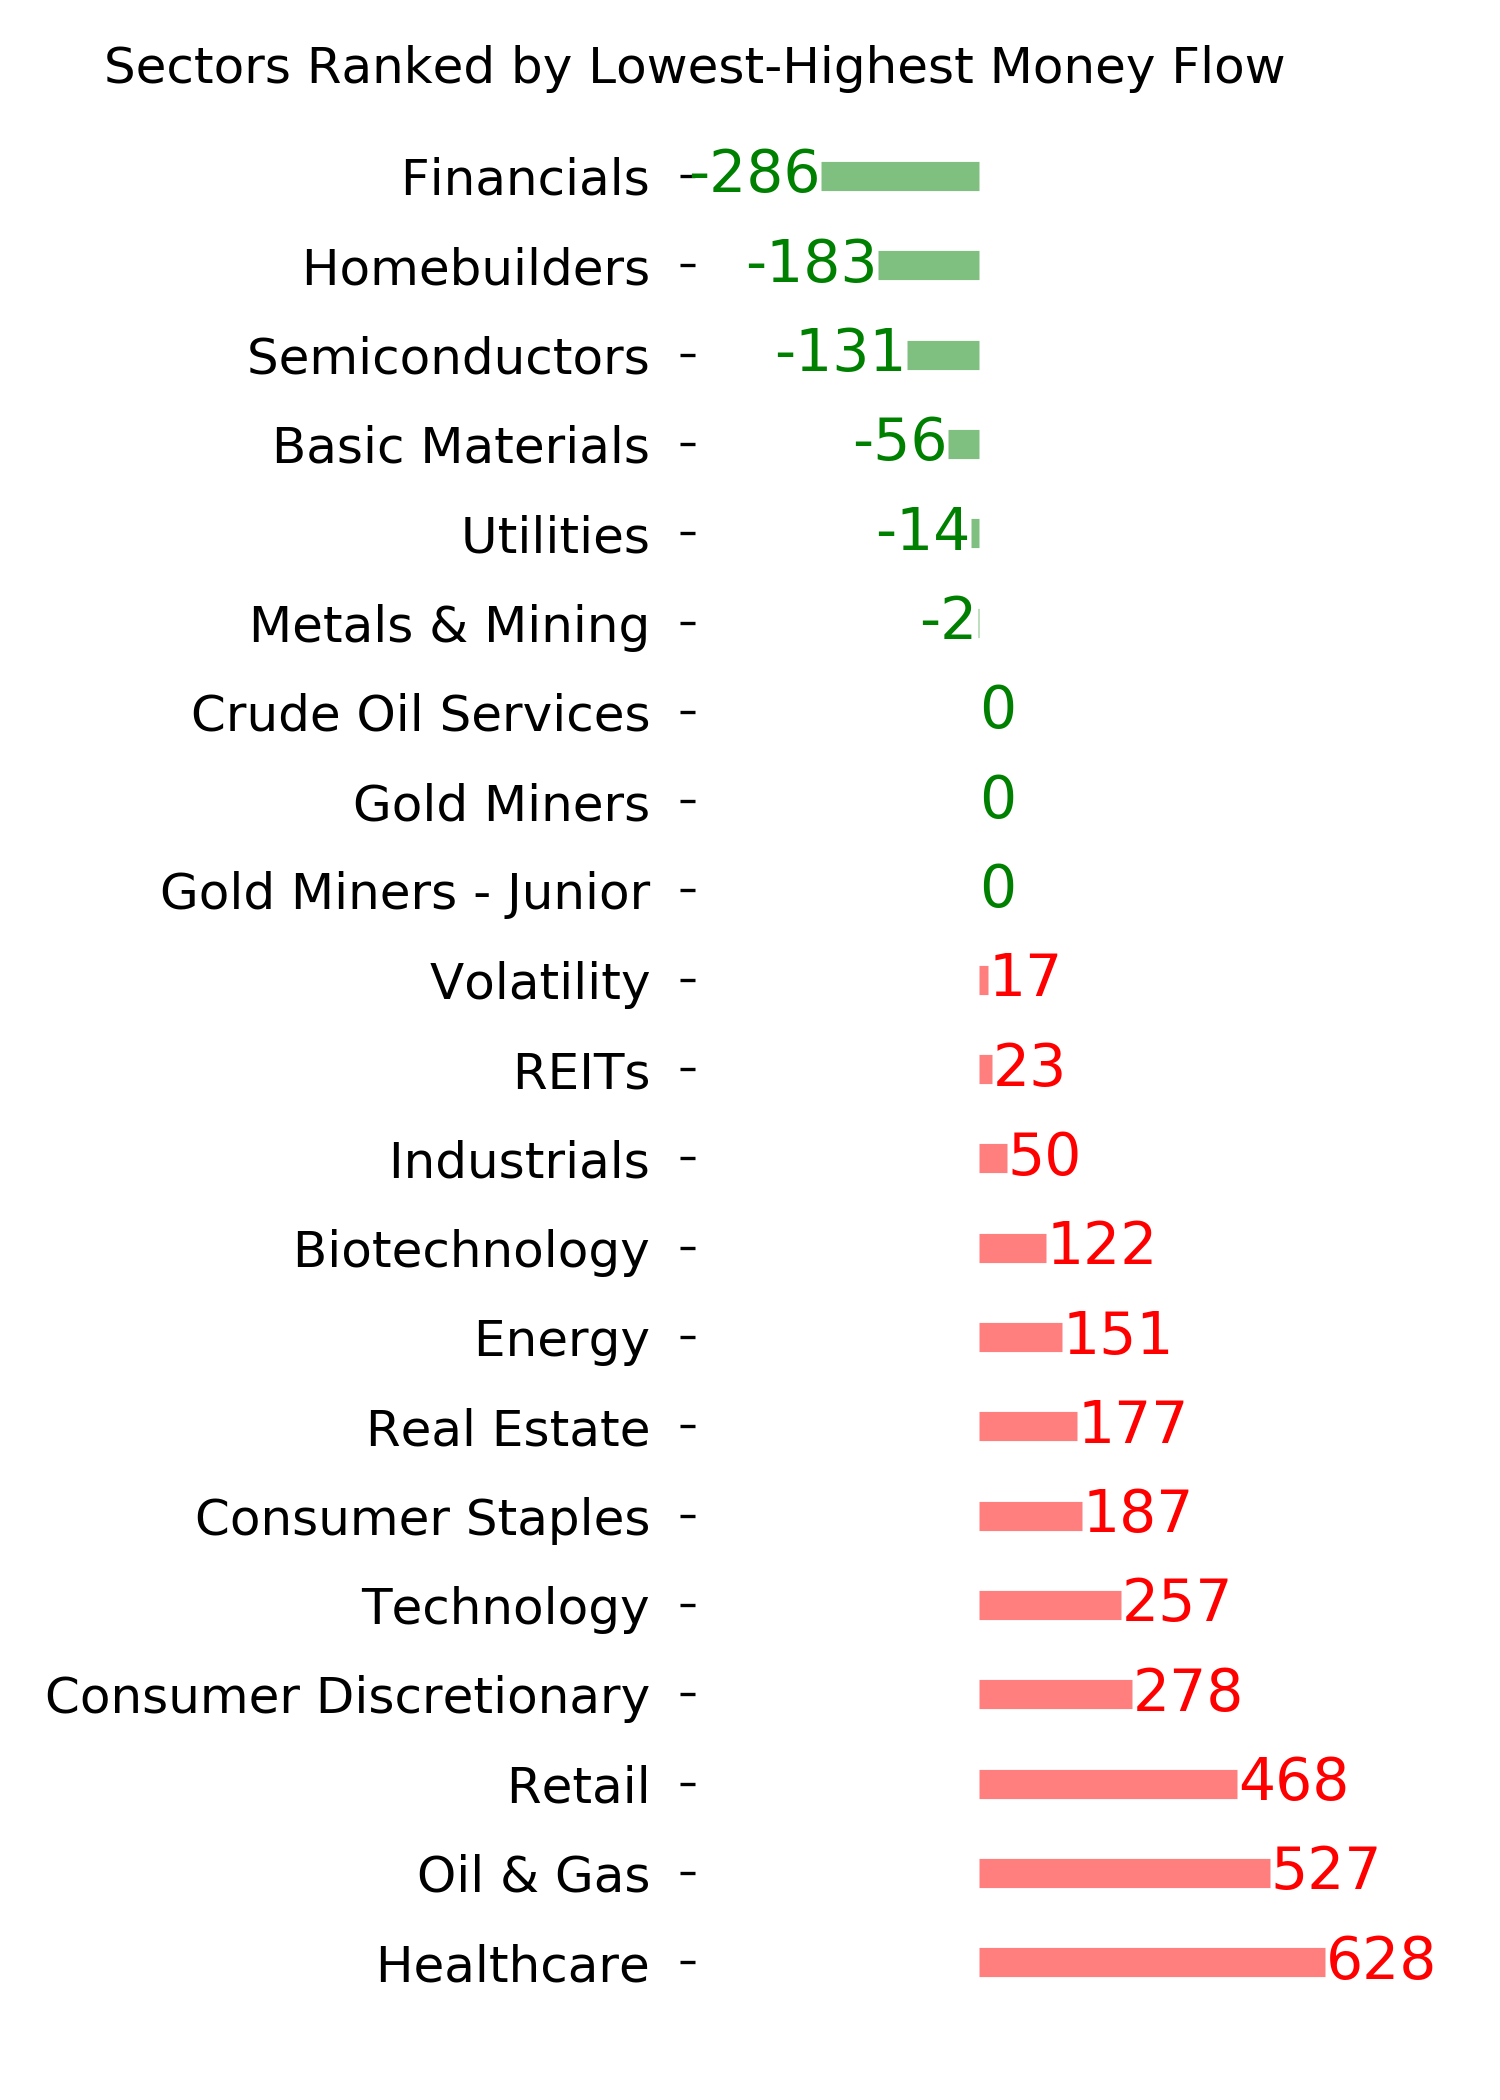
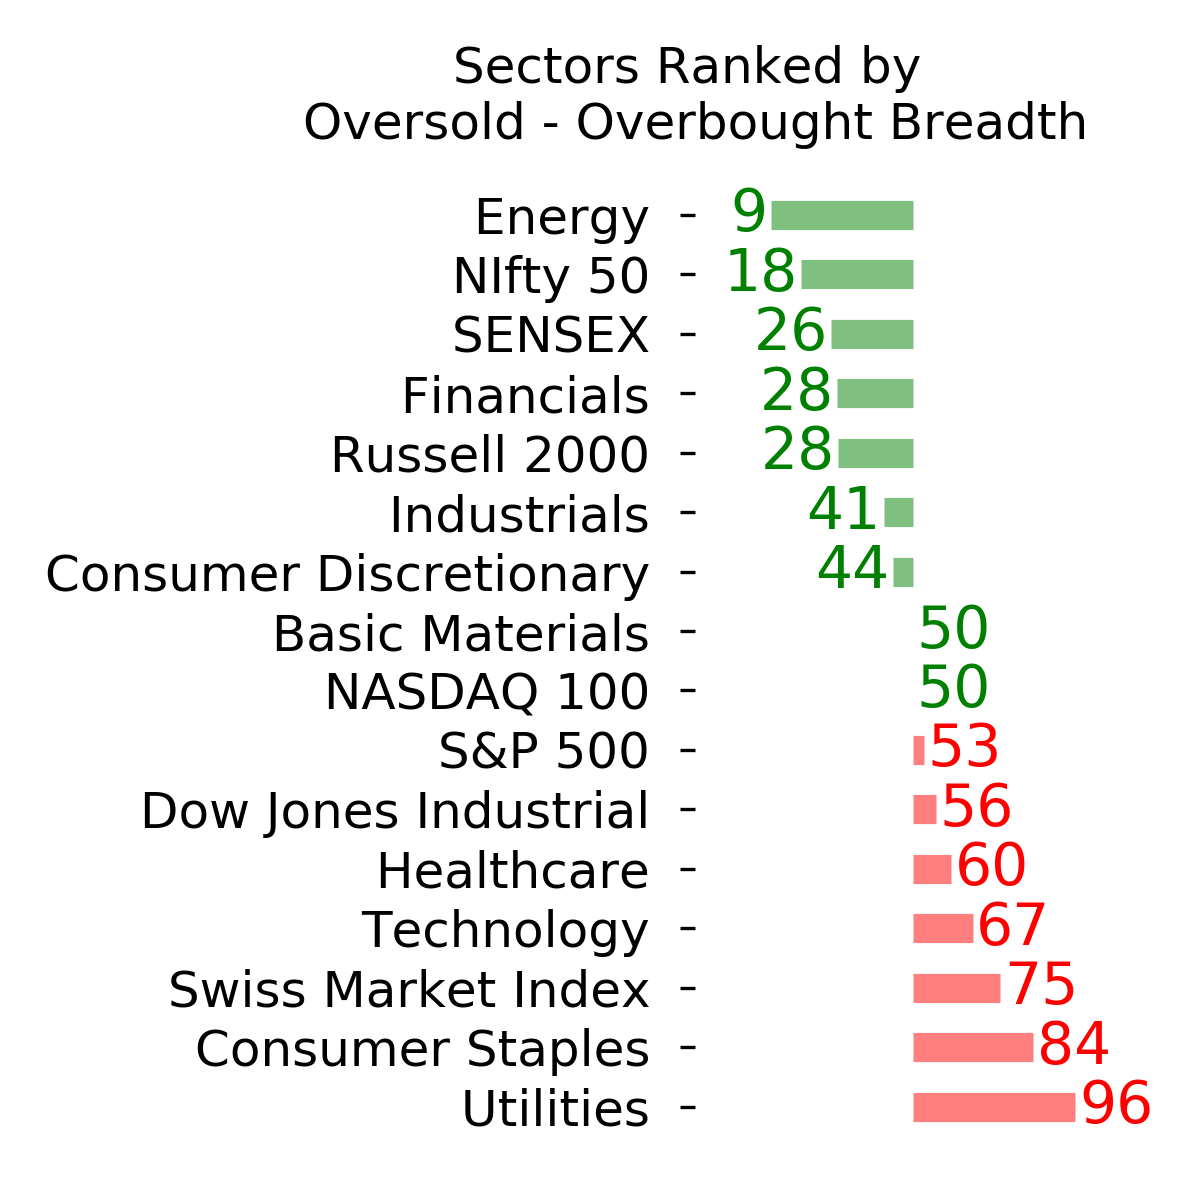
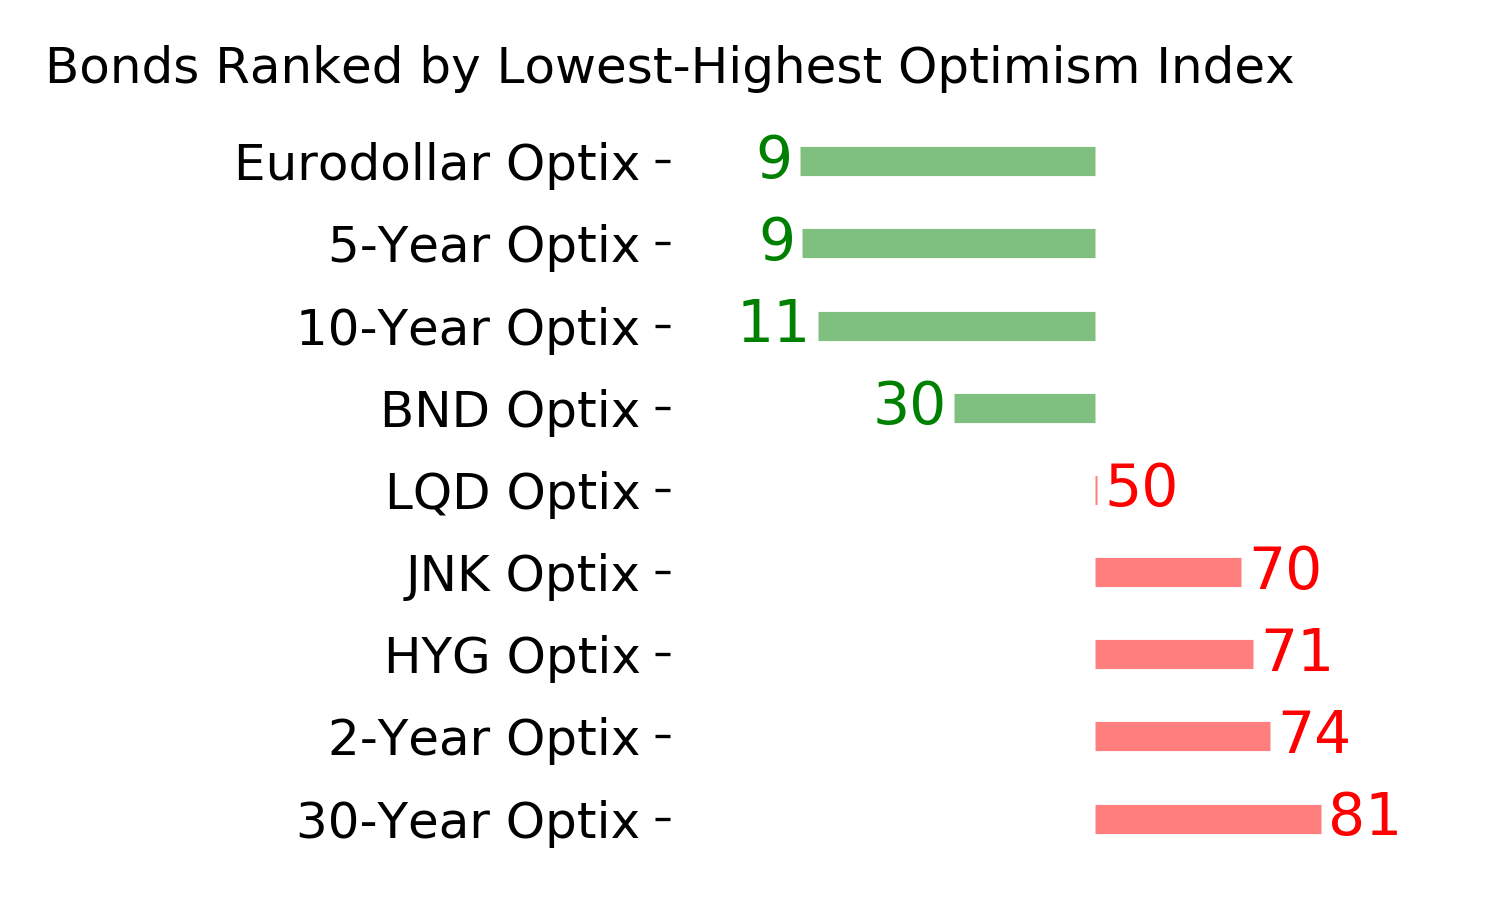
Ranks
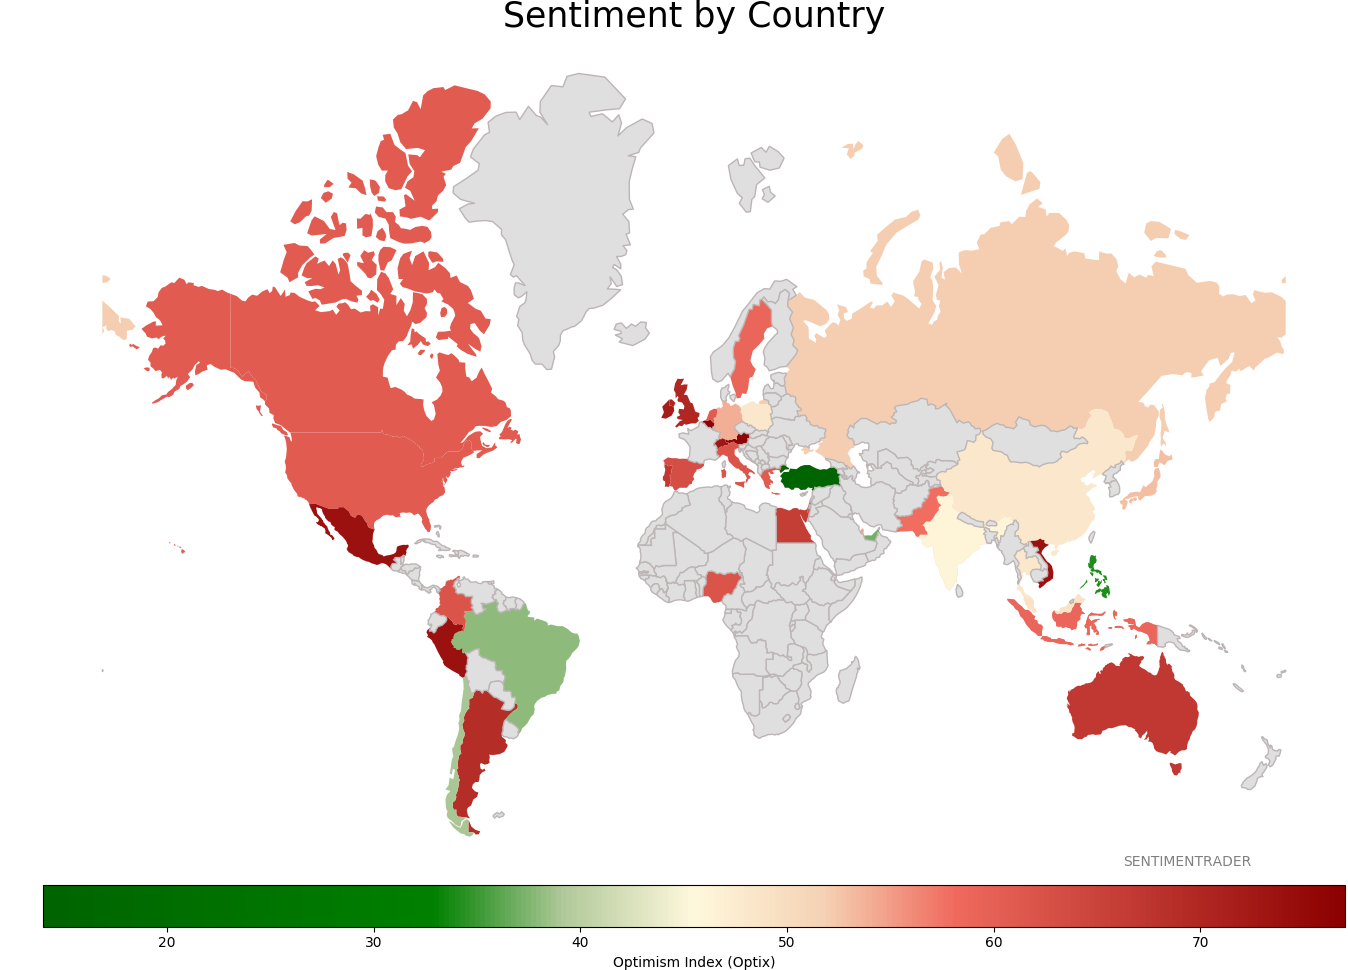
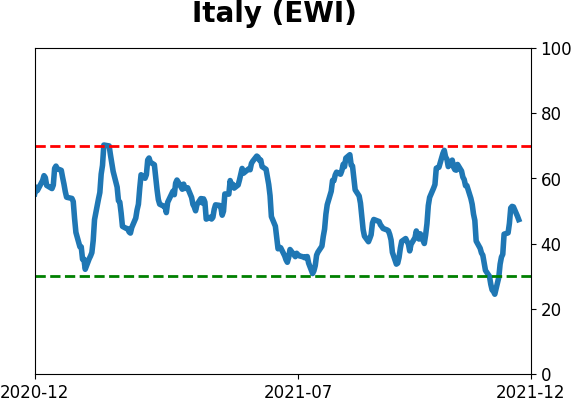
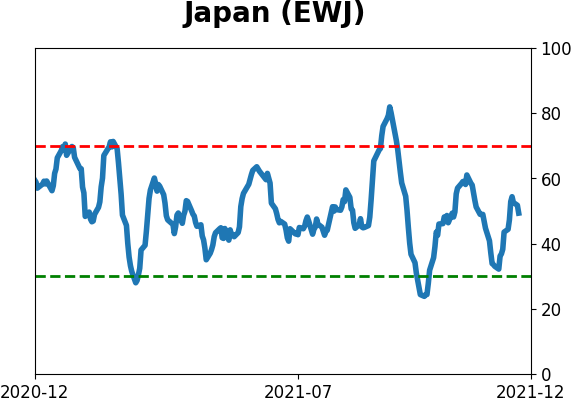
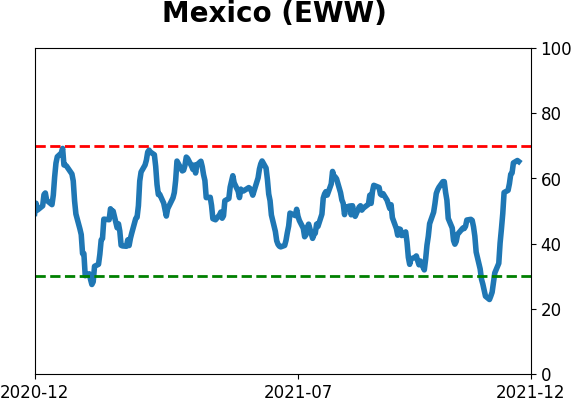
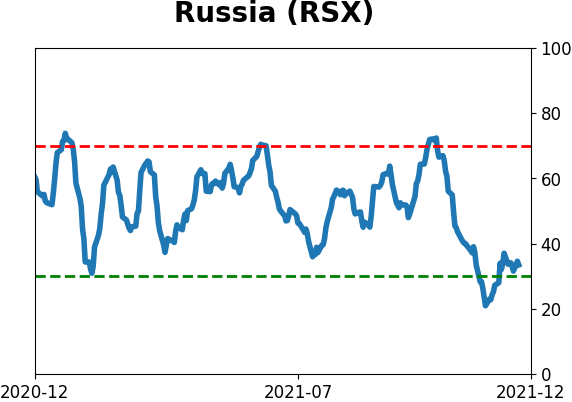
Sentiment Around The World
Optimism Index Thumbnails
|
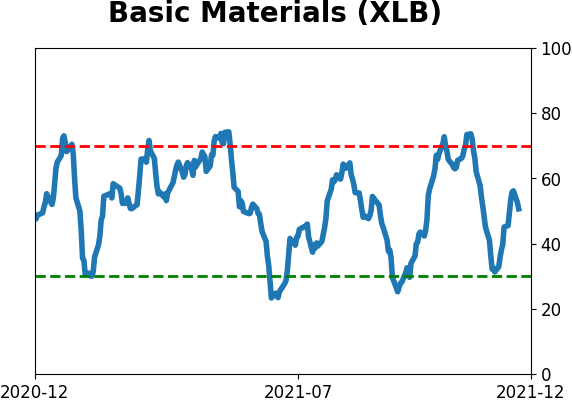
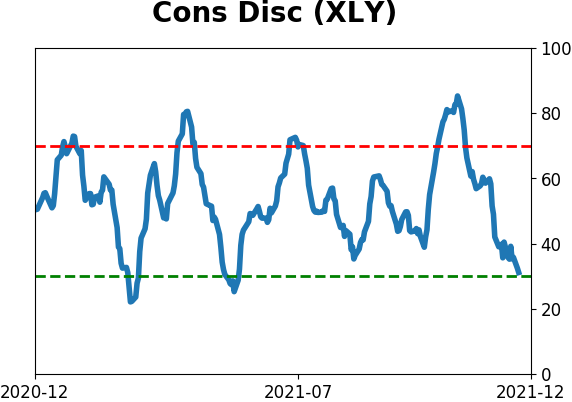
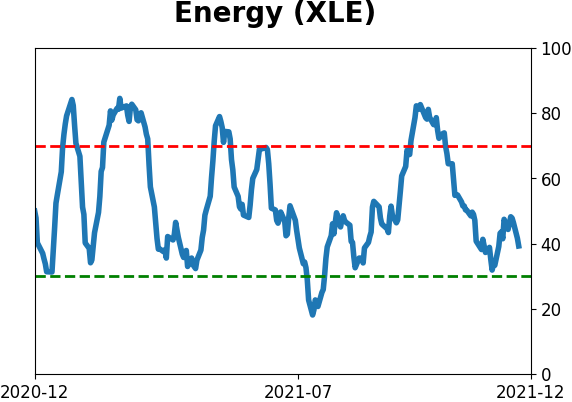
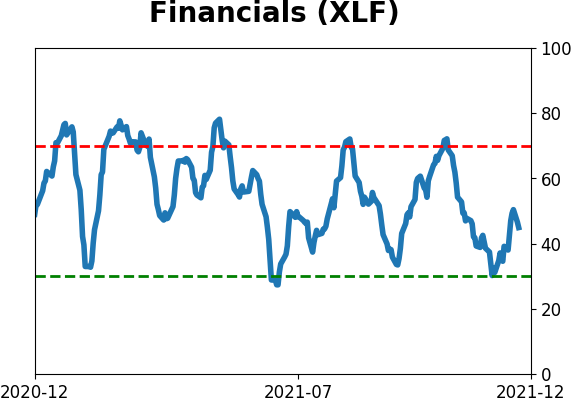
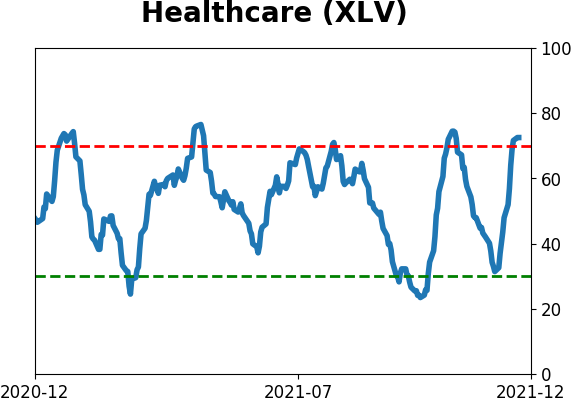
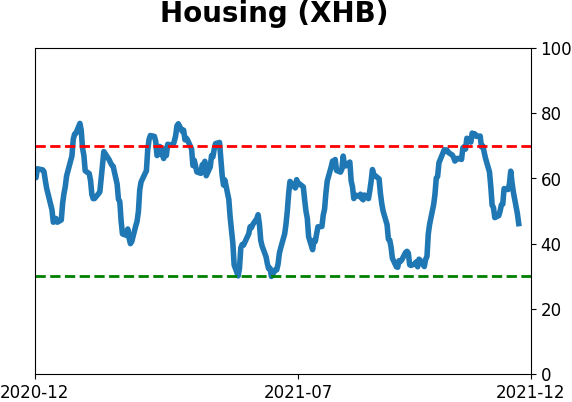
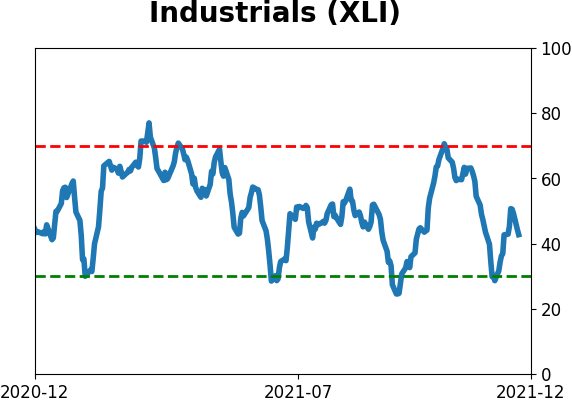
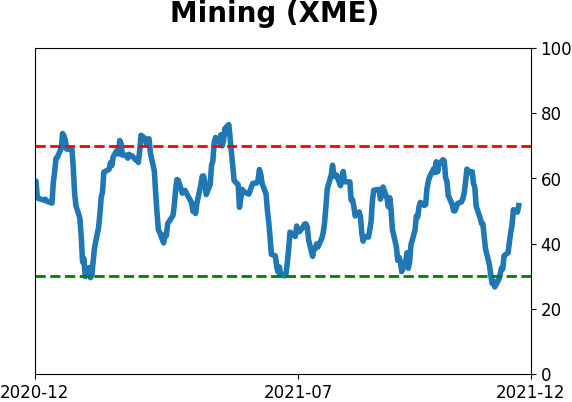
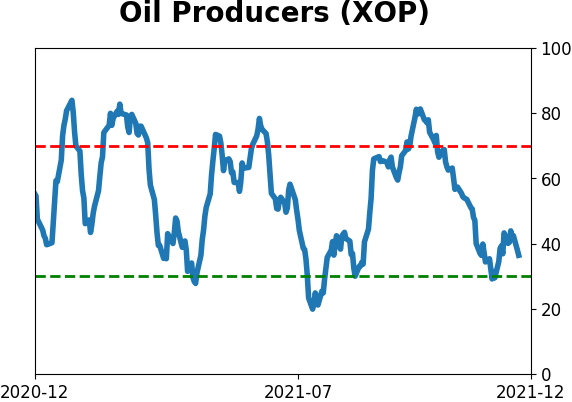
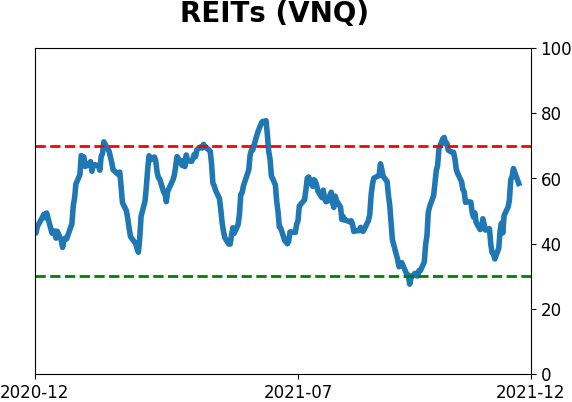
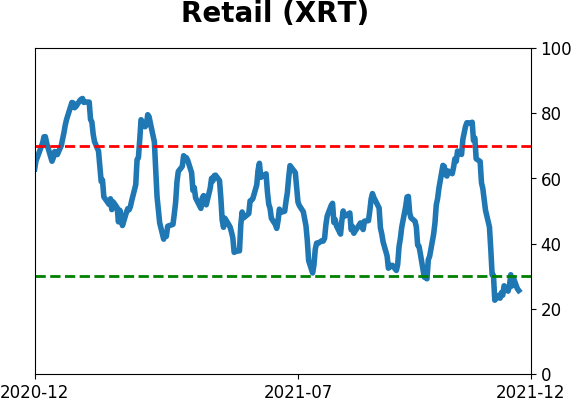
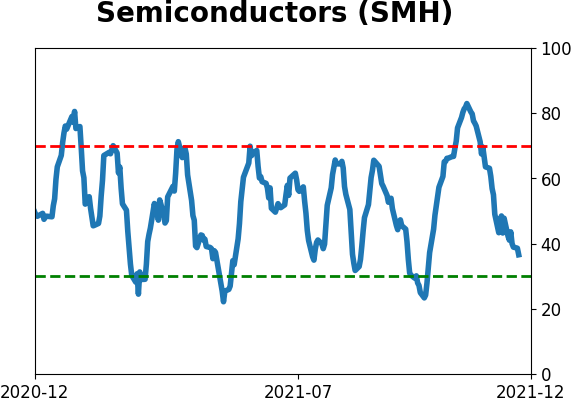
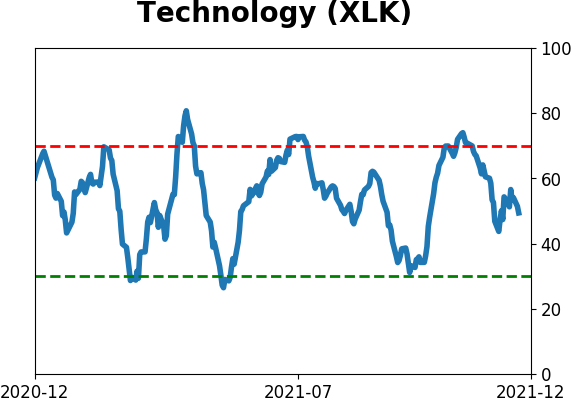
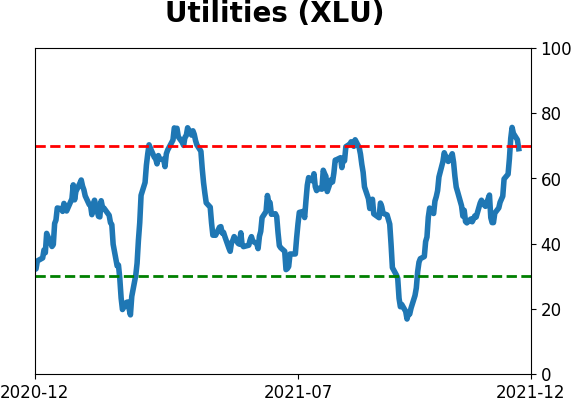
Sector ETF's - 10-Day Moving Average
|
|
|
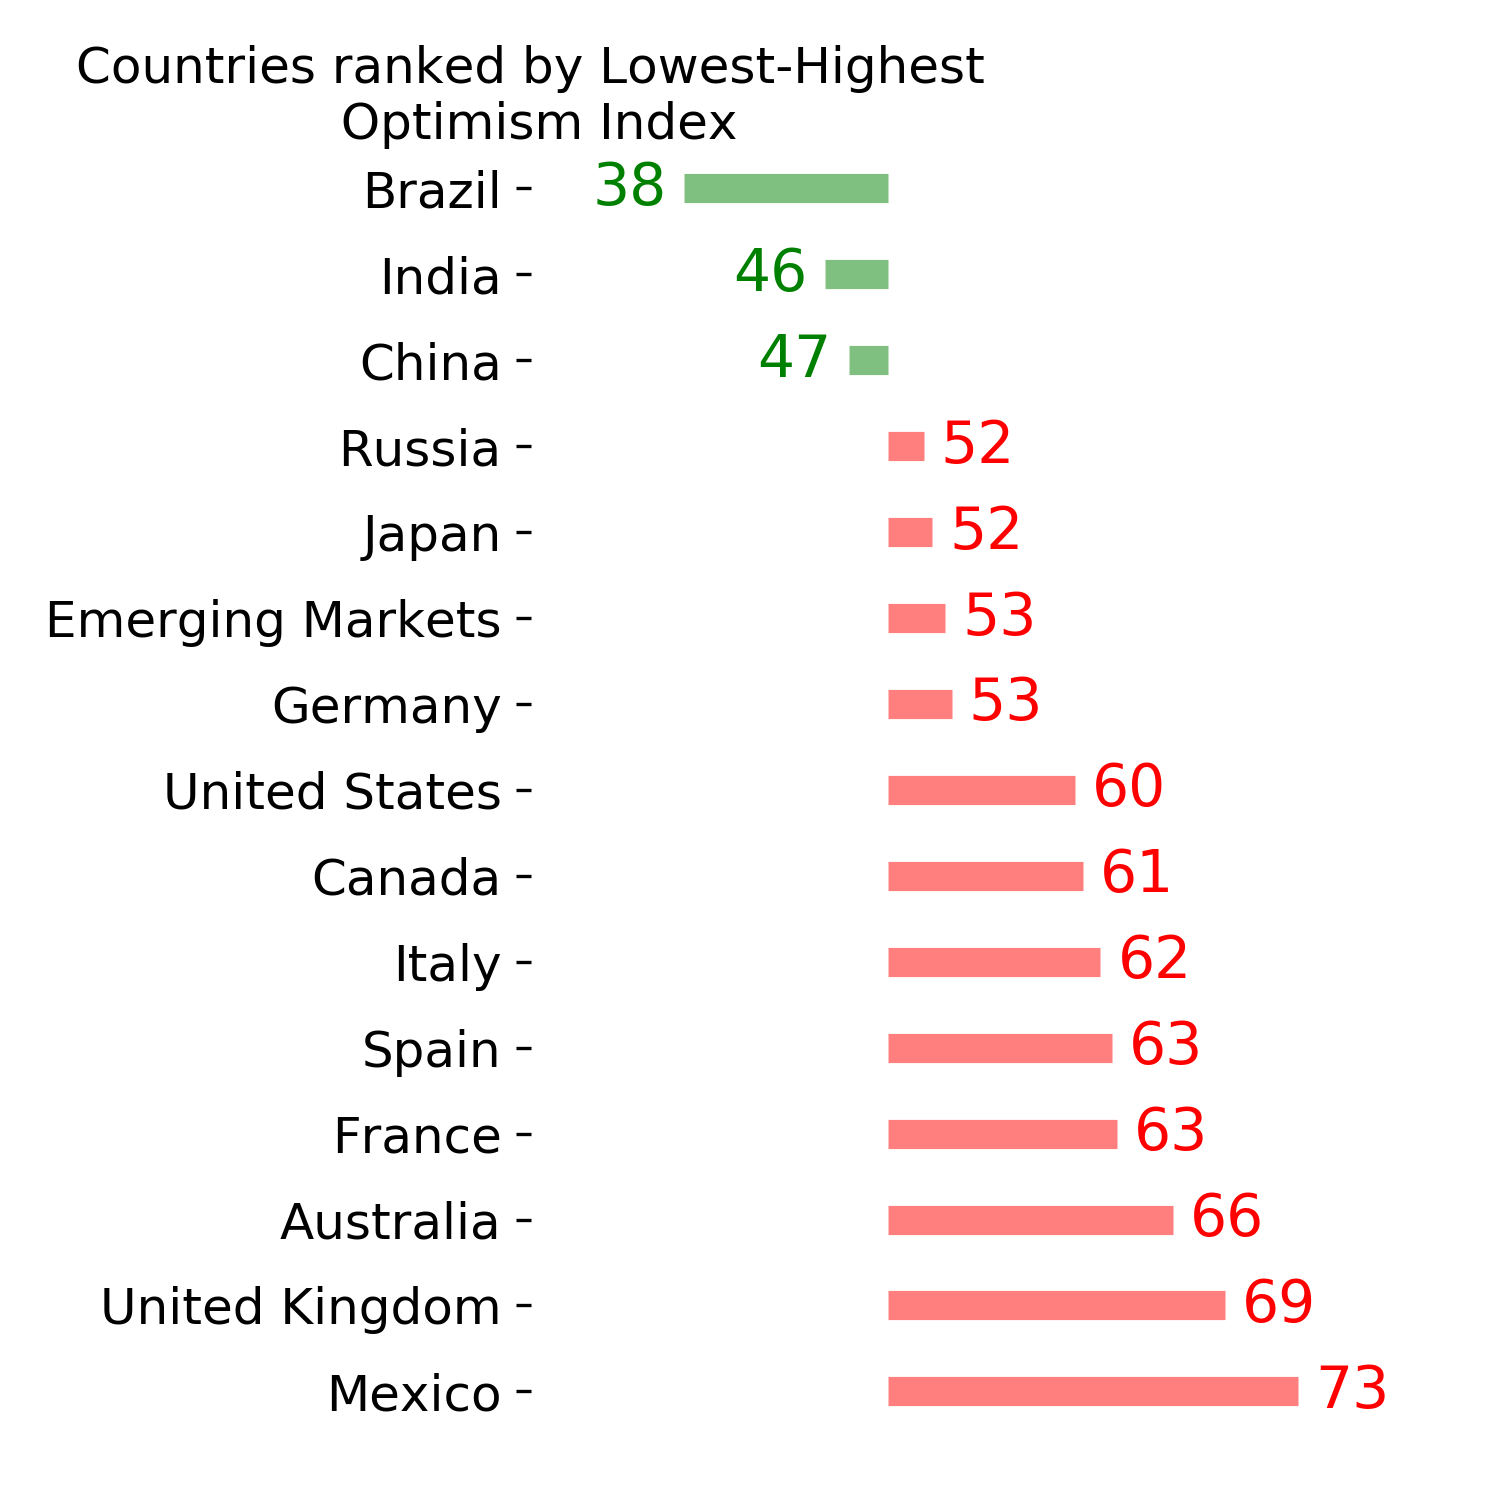
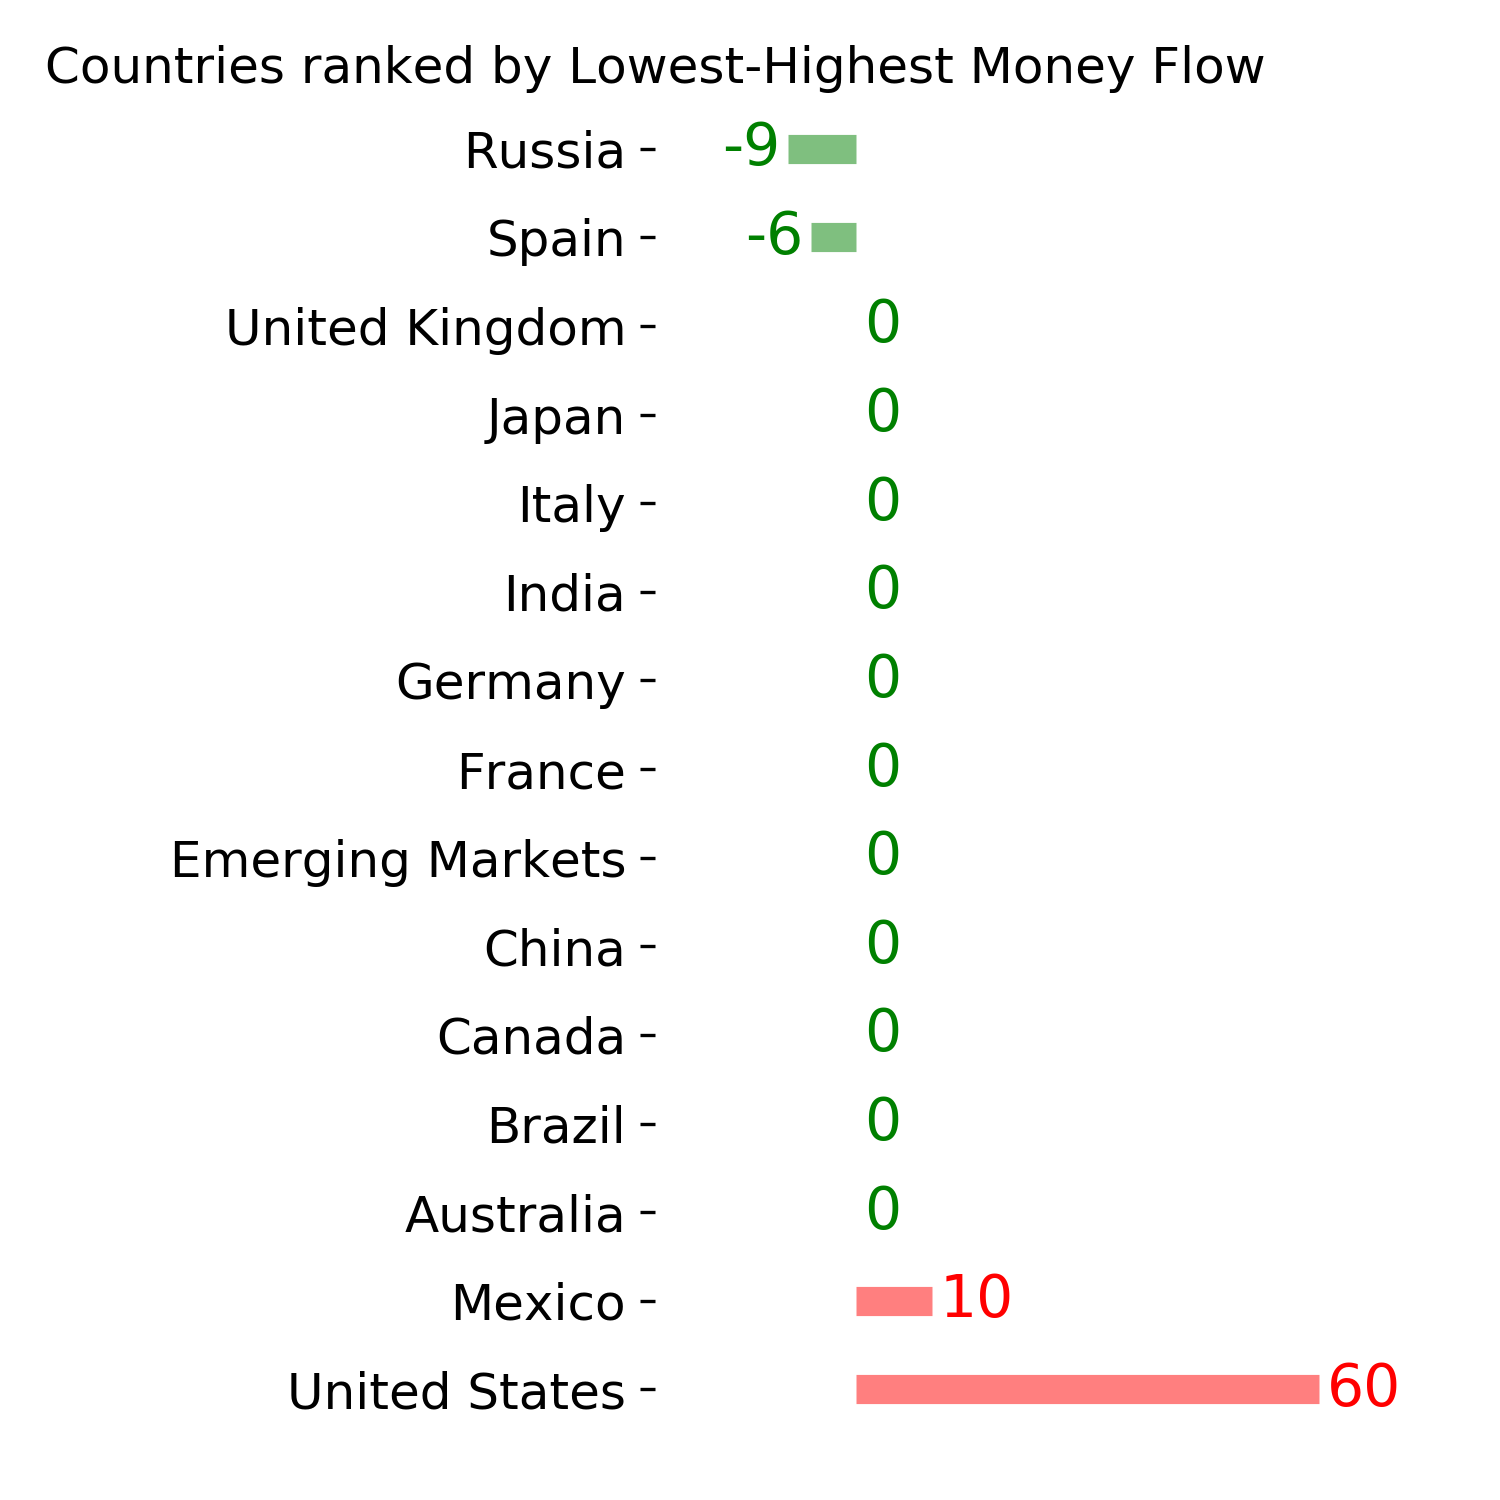
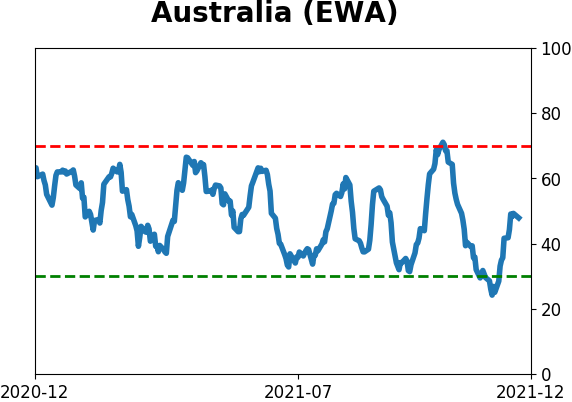
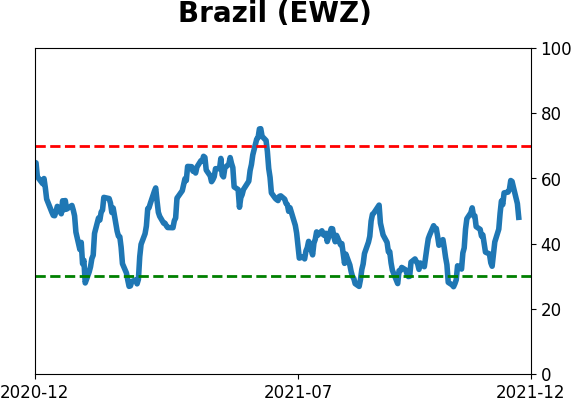
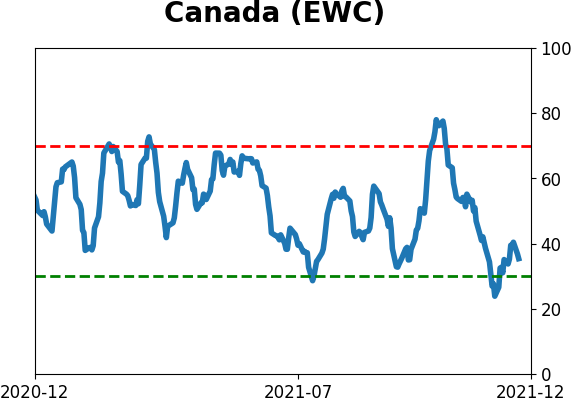
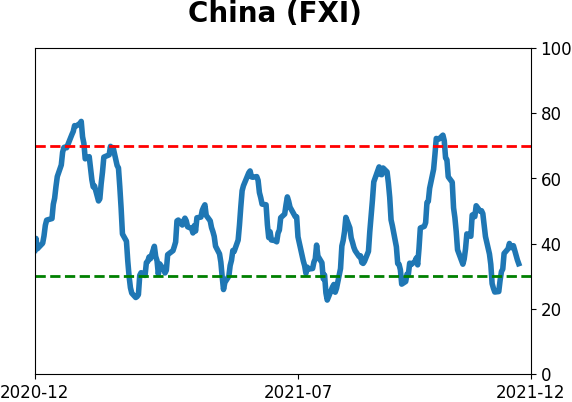
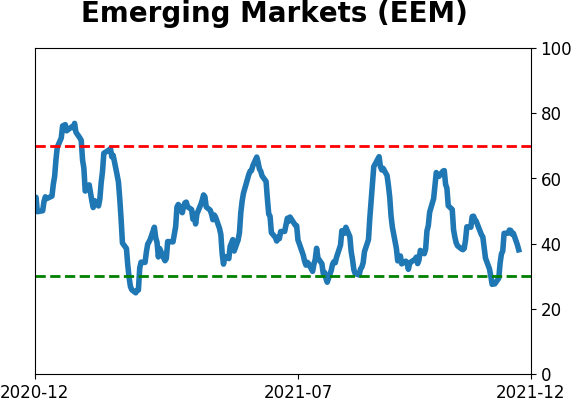
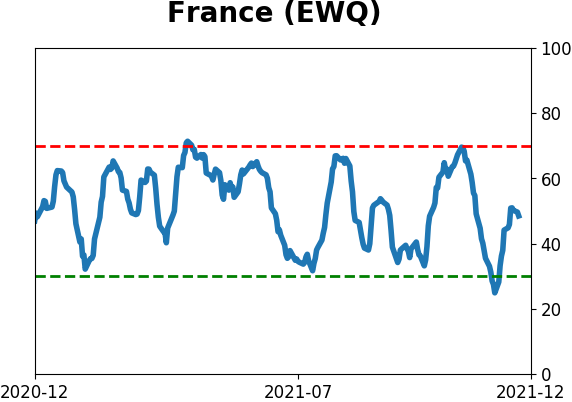
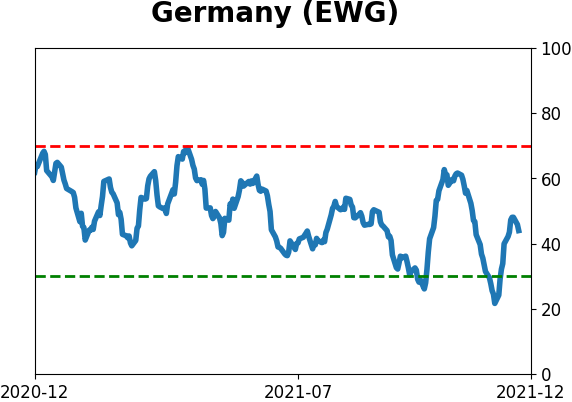
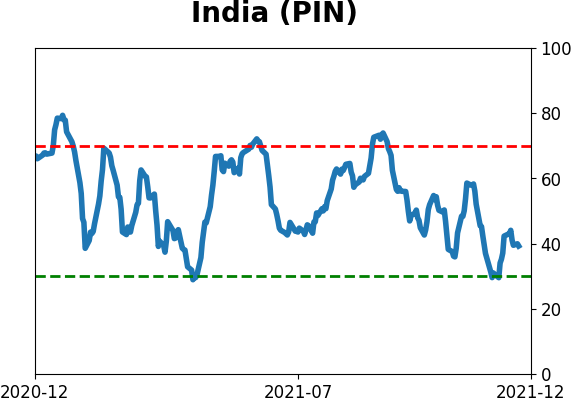
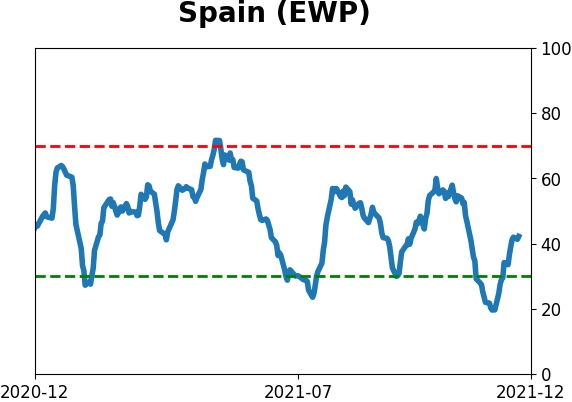
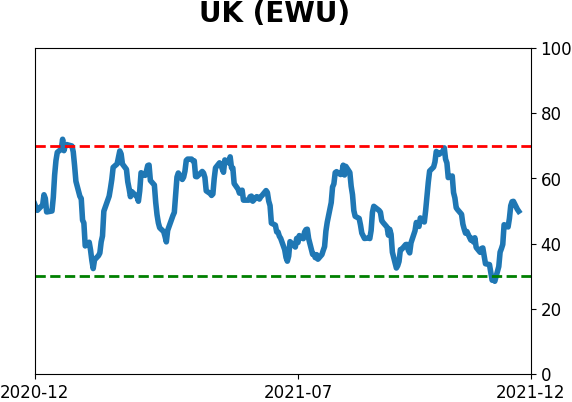
Country ETF's - 10-Day Moving Average
|
|
|
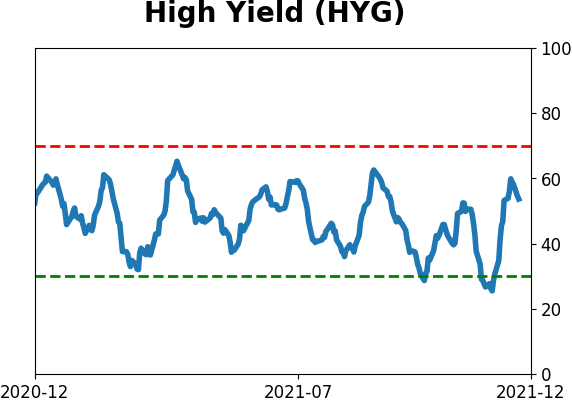
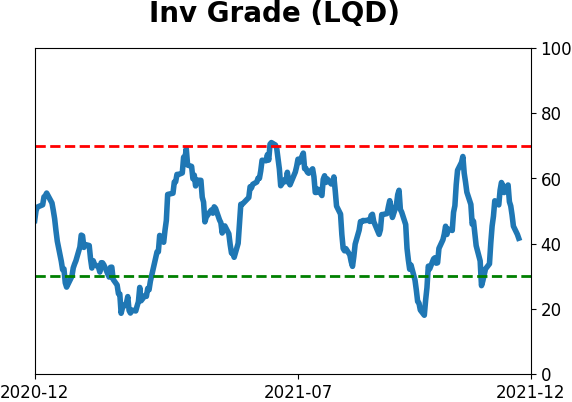
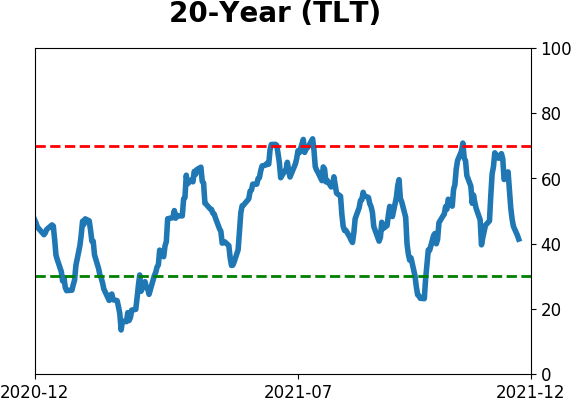
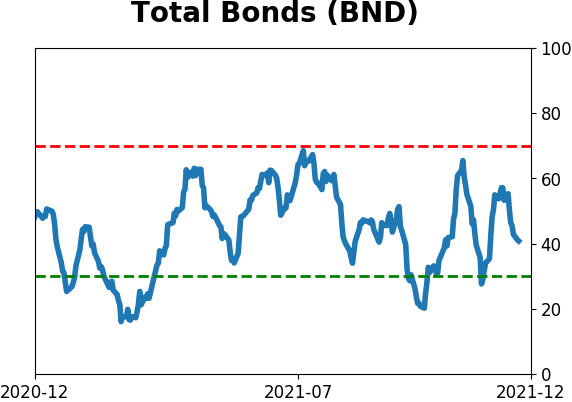
Bond ETF's - 10-Day Moving Average
|
|
|
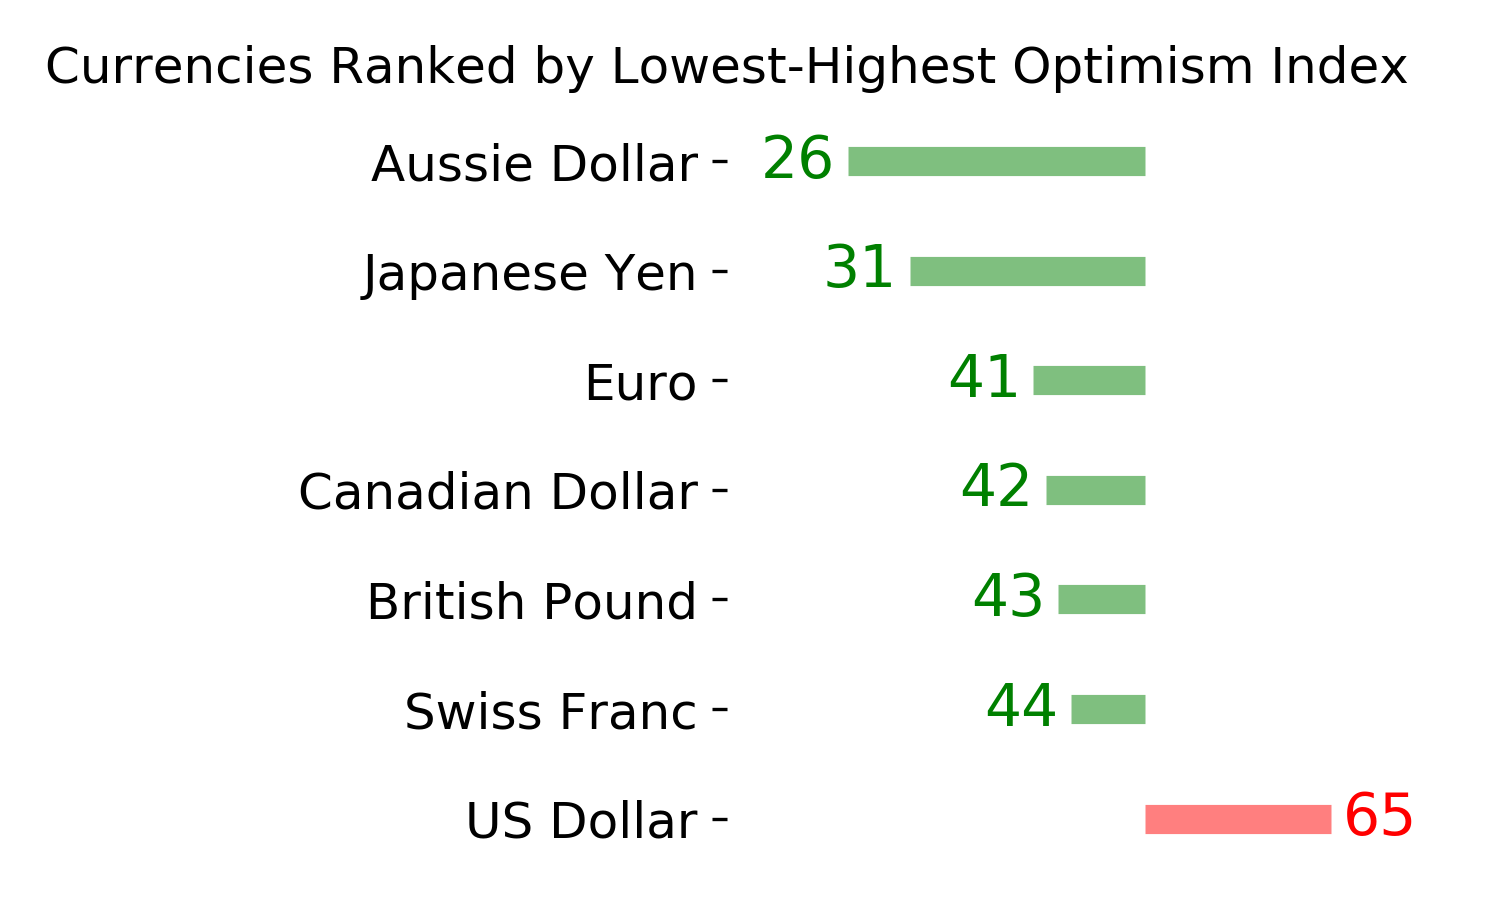
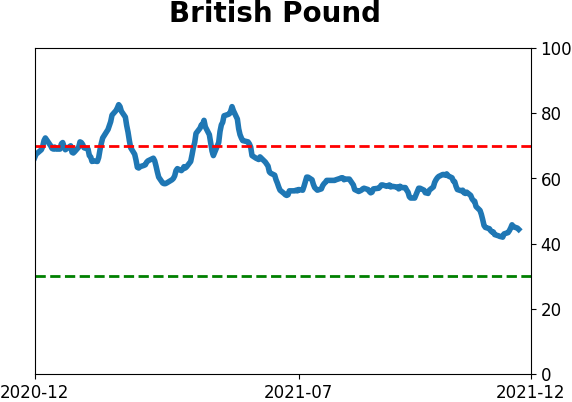
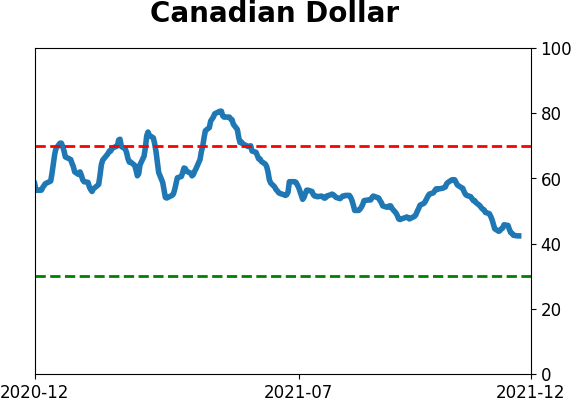
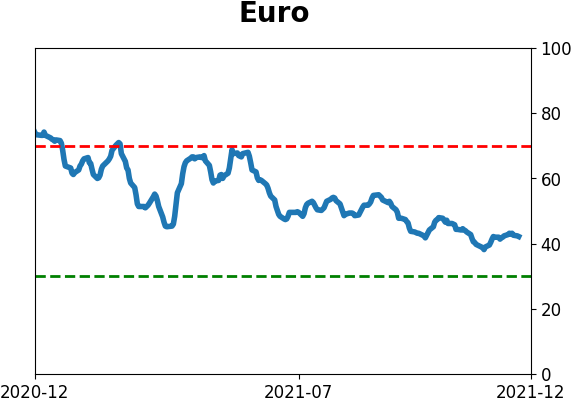
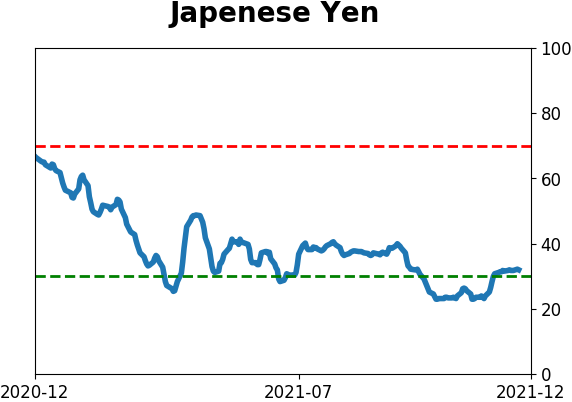
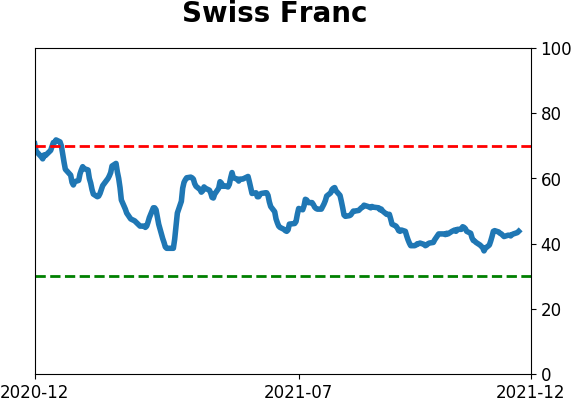
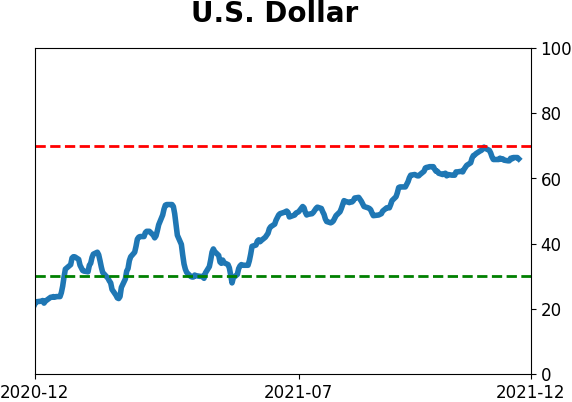
Currency ETF's - 5-Day Moving Average
|
|
|
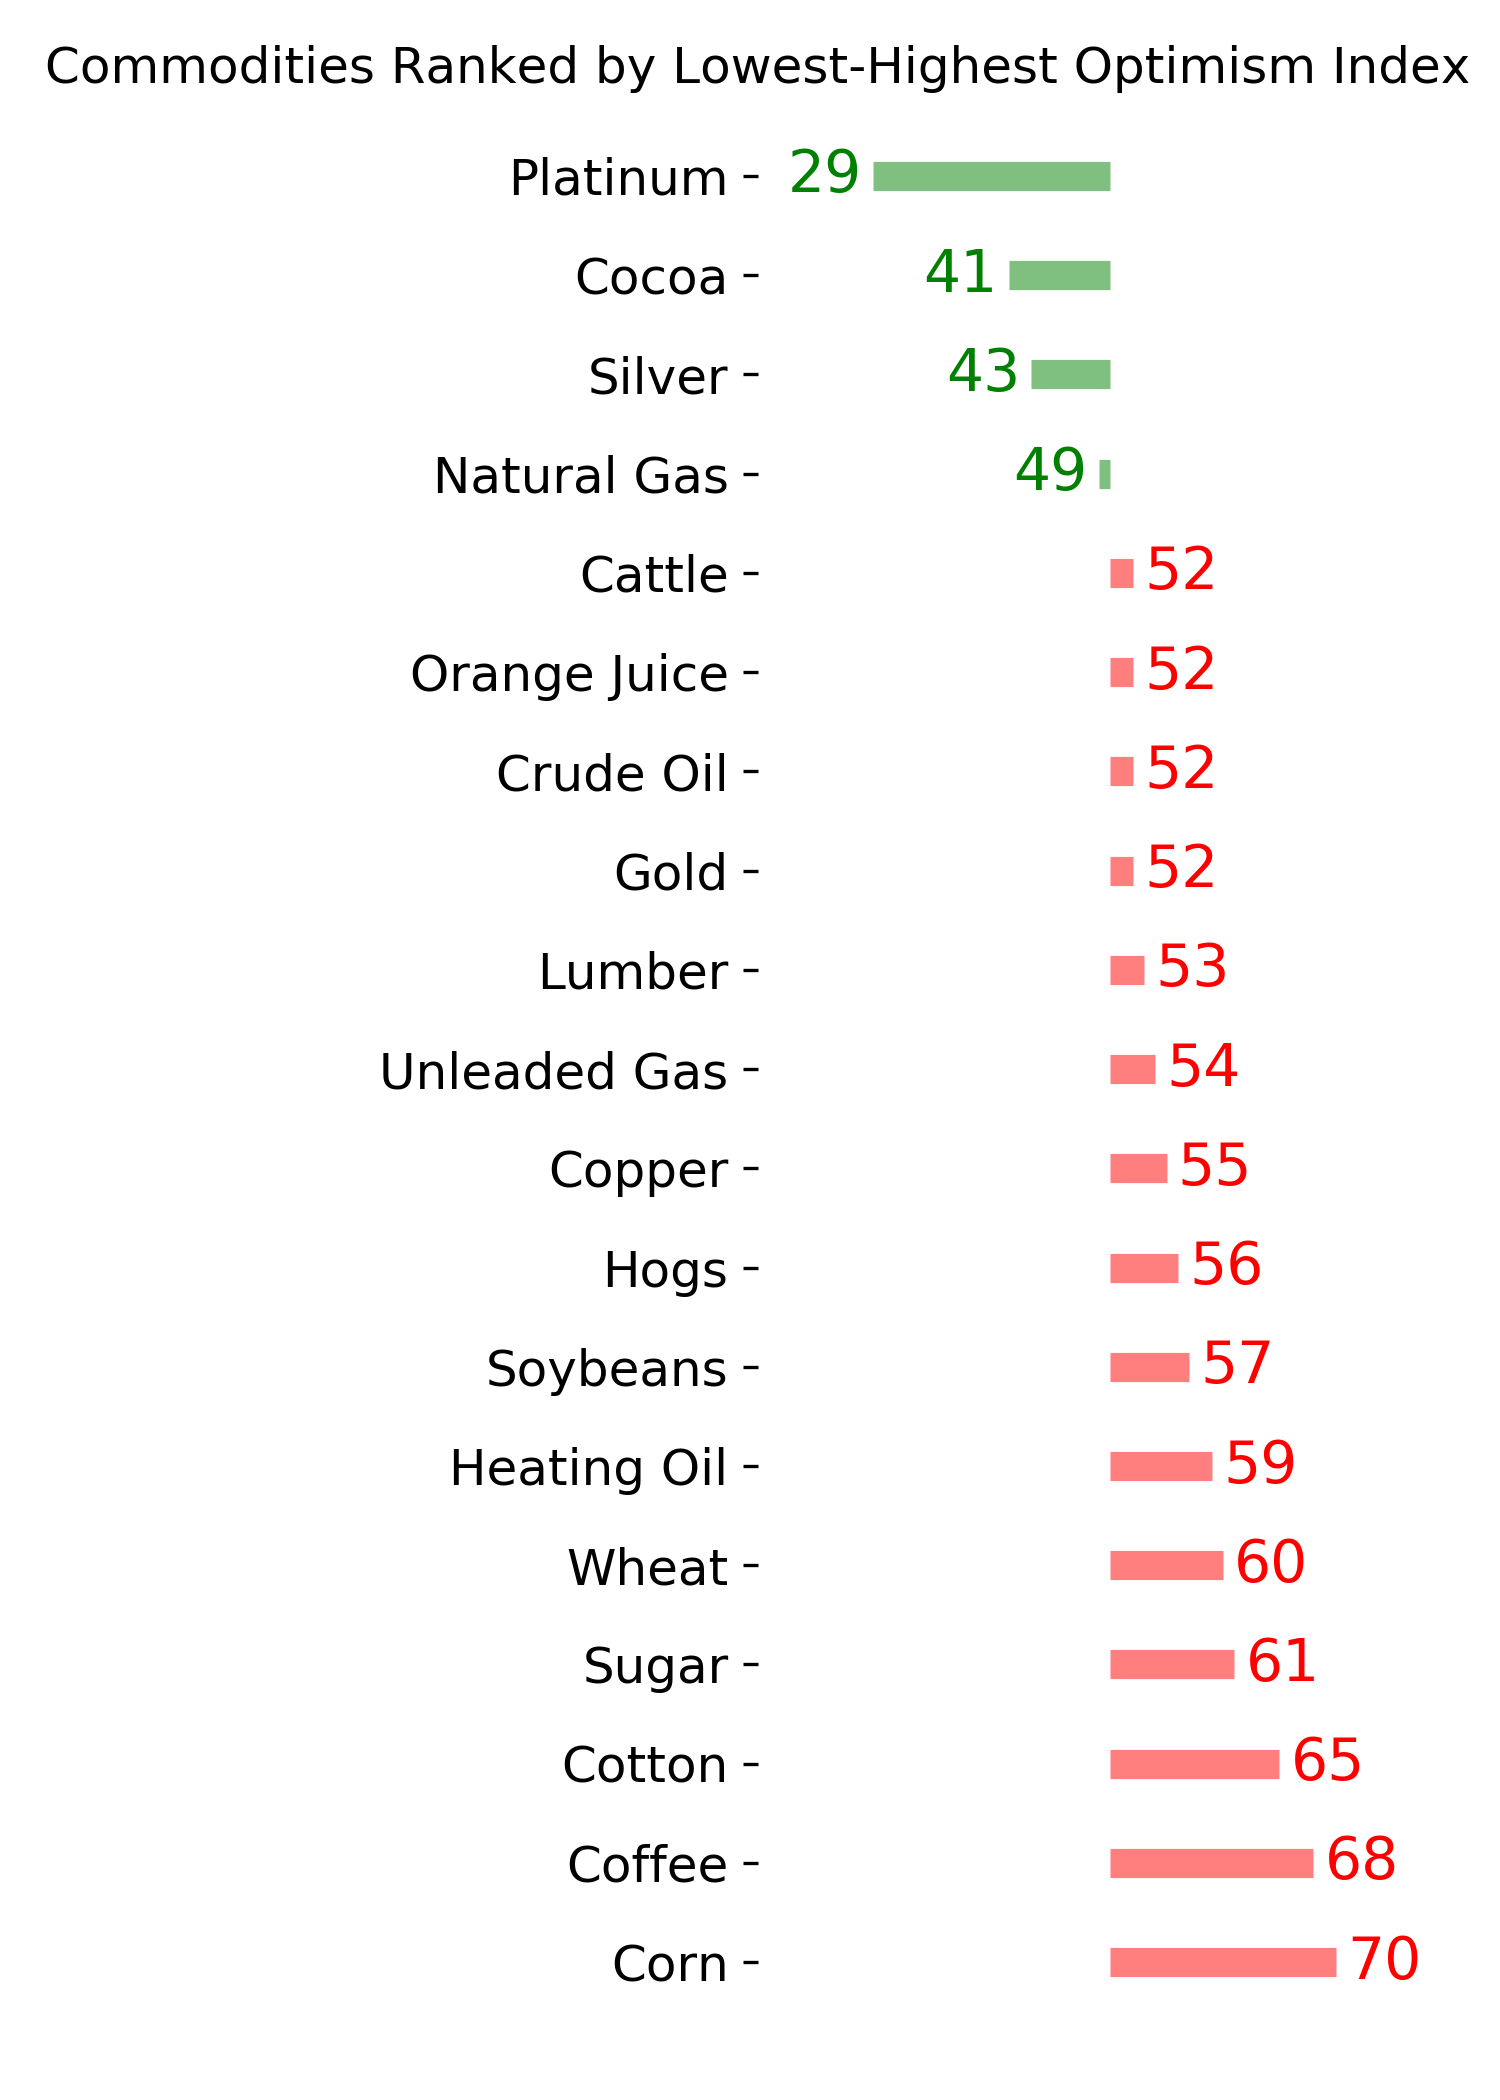
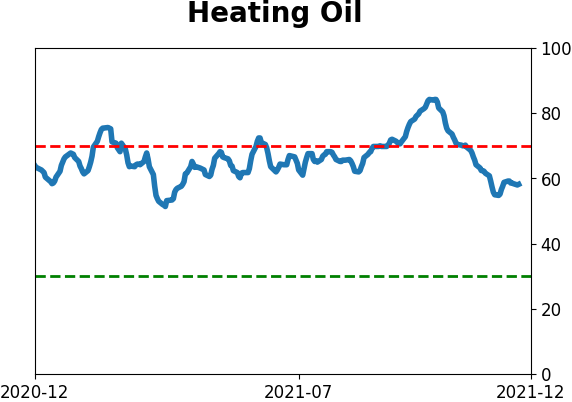
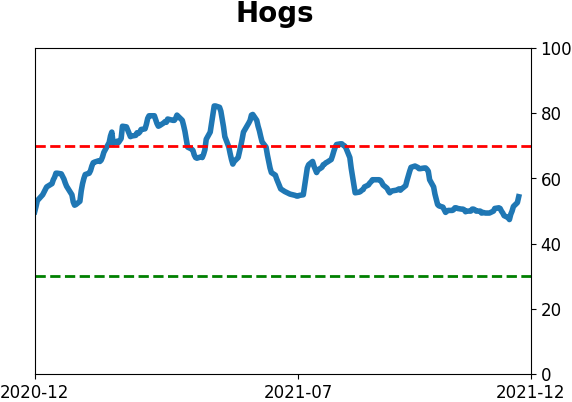
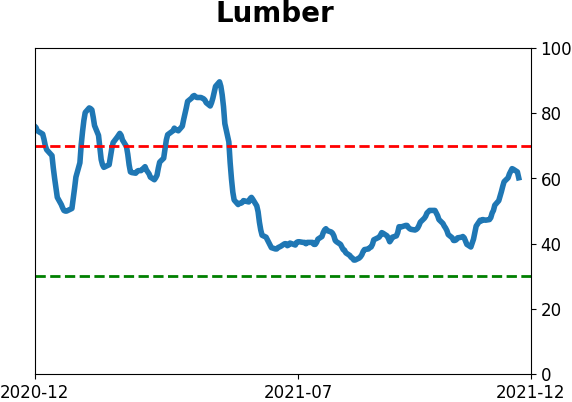
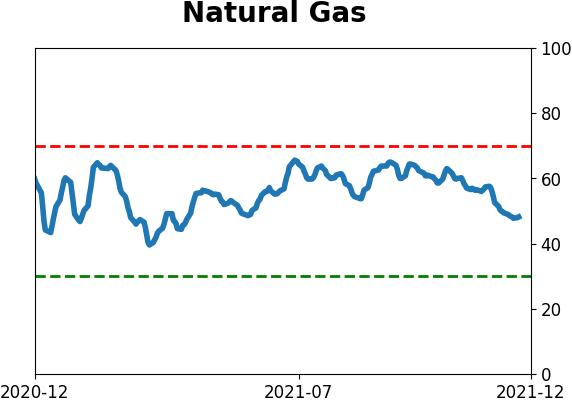
Commodity ETF's - 5-Day Moving Average
|
|