
A Pre-Holiday Review

The release of some of the weekly data we follow has confirmed just how extreme last week’s activity moved sentiment. I will be travelling for the holiday, so no end-of-day report will be published.
One of the most reliable gauges we have is showing an extreme like we’ve rarely seen. When we watch the activity of the smallest of options traders, those trading 10 contracts or less, we know exactly who is doing exactly what, and with real money. It’s hard to find indicators like that.
This past week, they bought to open nearly 3 million put contracts, the 2nd-most on record. That made up 27% of their options volume, matched or exceeded on only 5 other weeks since 2000 (the returns shown in the table may be a bit off based on how the engine calculates returns for weekly or monthly data series).
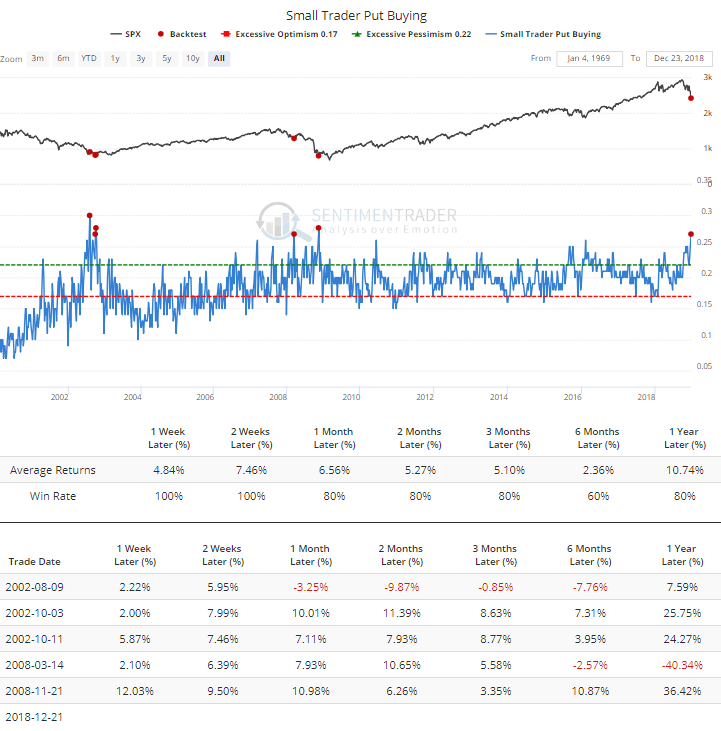
About the only downside here is that they didn’t back off their call buying as much as they have in the past. It’s only in neutral territory, not very low like it has been at most of the other lows in recent years.
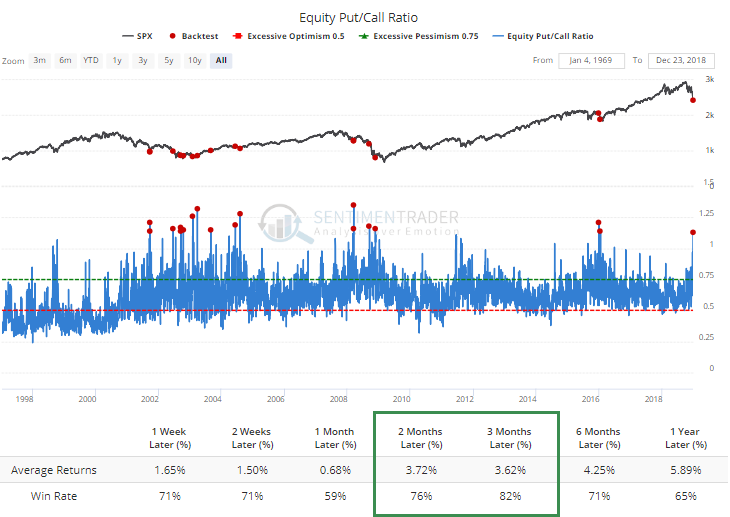
All that activity among small traders was reflective of the activity in general, as the Equity-only Put/Call Ratio spiked to the 2nd-highest level since the financial crisis. Most of the other readings triggered during the last two protracted bear markets, yet the S&P still rebounded over the next 2-3 months most of the time.
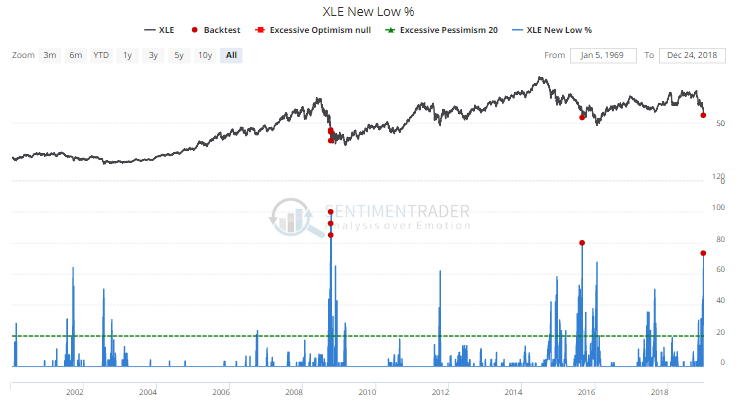
There was wholesale selling pressure last week. In Friday’s report, we saw that it caused a historic rise in the percentage of securities trading to new 52-week lows. That continued Friday. More than 70% of Energy stocks hit a low.
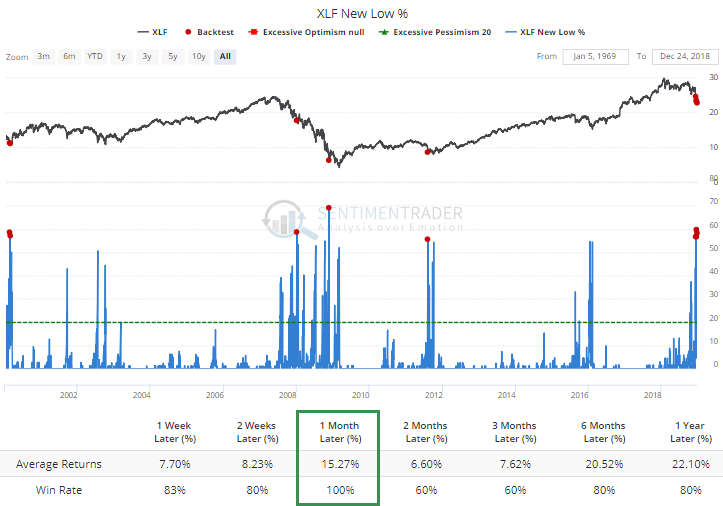
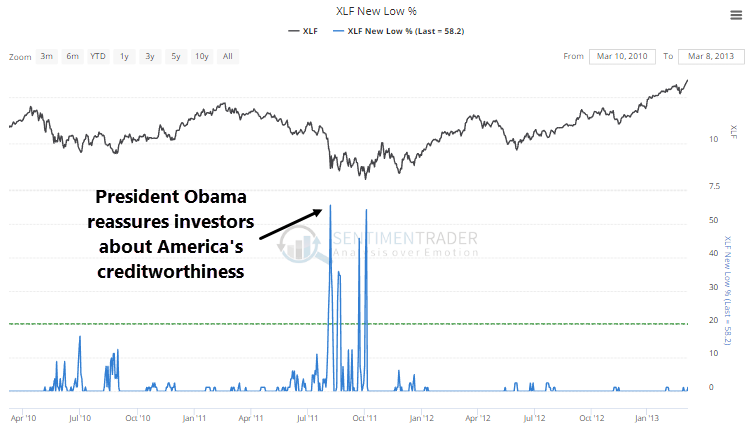
And nearly 60% of Financials, a level that has been surpassed only by November 20, 2008. When more than 55% of them hit a new low together, the average return on XLF over the next month was more than 15%.
Investors seem to be worried that the U.S. Treasury Secretary called major financial institutions to determine if the volatility is causing systemic damage. Apparently this is being taken as a negative from investors. We forget that this is not new. Something similar happened in August 2011.
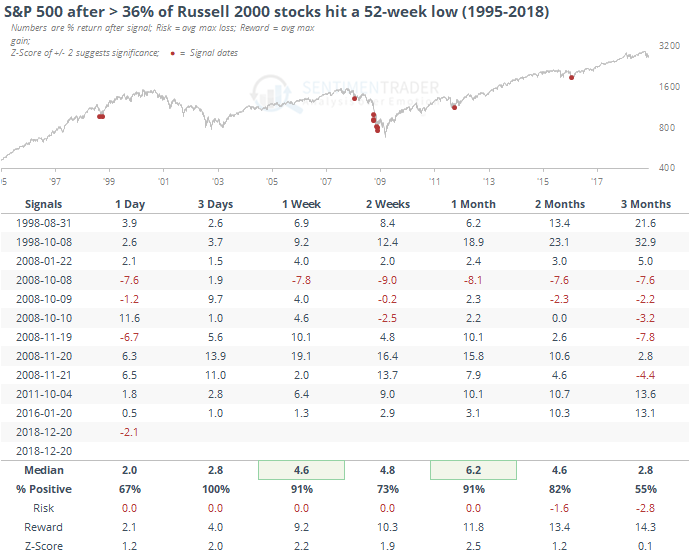
In a broader sense, more than 36% of small-cap stocks in the Russell 2000 index hit a new low late last week, another rarely-achieved level. As we’ve seen before, when there is carnage in the small-cap universe, it almost always creates extreme in breadth and is an almost universally positive sign for the market in general.
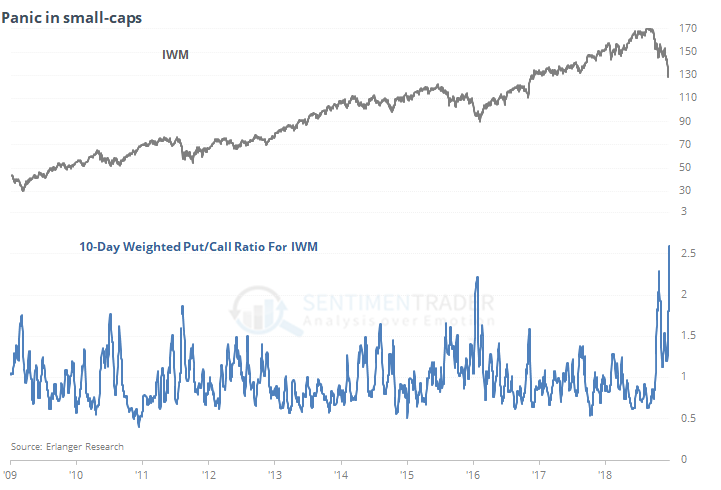
The big sell-off in small-caps has triggered some panic there. Premiums paid for put options, combined with heavy volume, has triggered a new decade-long record in the 10-day weight put/call ratio for IWM.
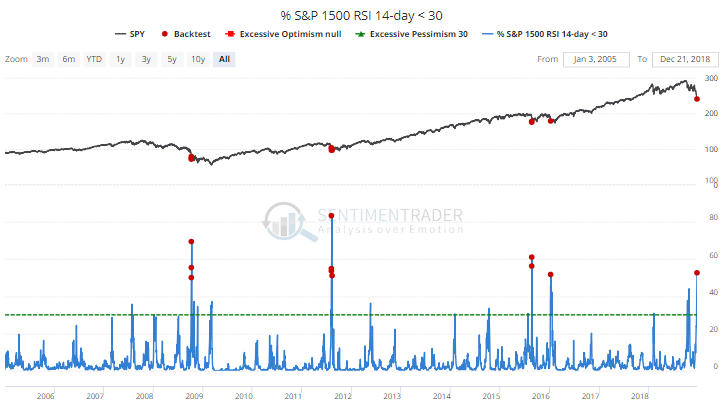
Back to breadth, it isn’t just bond funds or other “stuff” that can influence the breadth figures. Among all common stocks in the S&P 1500 index, more than half of them hit an oversold level on Friday. We haven’t seen that very often.
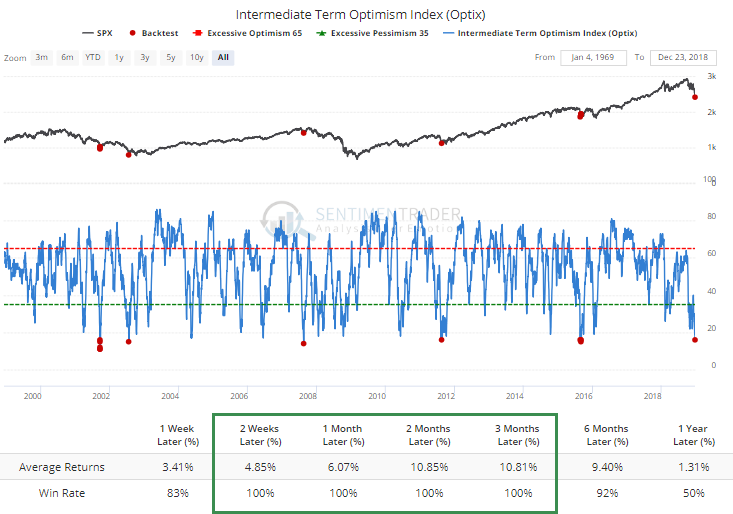
All of these indicators have helped to push our models to true extremes as well. Dumb Money Confidence is tied for the lowest on record. The Medium-term Optimism Index, which has a very high correlation to the Dumb Money Confidence, has dropped below 17. There have been 12 other days since 2000 when it has been this low.
We could go over a bunch more, because there’s no shortage of extremes. More than 50% of our indicators are now registering a pessimistic extreme, the first time since February 2016 there have been so many, and only the third time since the financial crisis (September 2015 was the other).
On the other side of the ledger, there is some signs that “smart money” investors are moving in.
In the futures market, hedgers actually became more net short last week, instead of buying heavily. That is discouraging for bulls, and a knock against a rally attempt here. They’re not perfect, no indicator is, but it’s better to see more signs pointing the same way.
Regardless of whether it seems like everyone else is expecting a bounce, they’re not. Evidence is overwhelming that pessimism is rampant and a very strong case can be made that the last few days triggered outright panic. There is a perceived sense of panic over recent moves and statements from the political establishment, but hair-trigger investors tend to give that way more weight than it’s due.
What should be thin holiday trading is an issue. Stocks have tended to struggle in the immediate aftermath when sinking to a new low ahead of a schedule exchange closure.
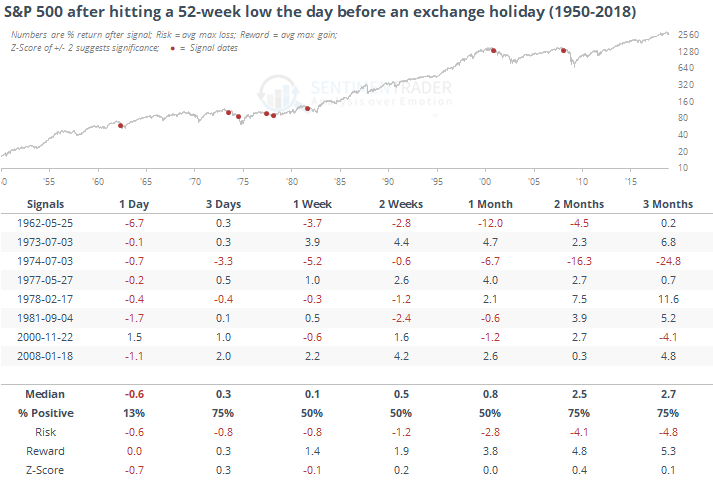
The day after the holiday, when a bit of volume tends to return, the S&P continued its selling pressure every time but once (usual caveats about small sample sizes apply). The fact that the last two instances were near the beginning of the last two protracted bear markets should not go unnoticed, though neither should their positive returns over the next couple of months.
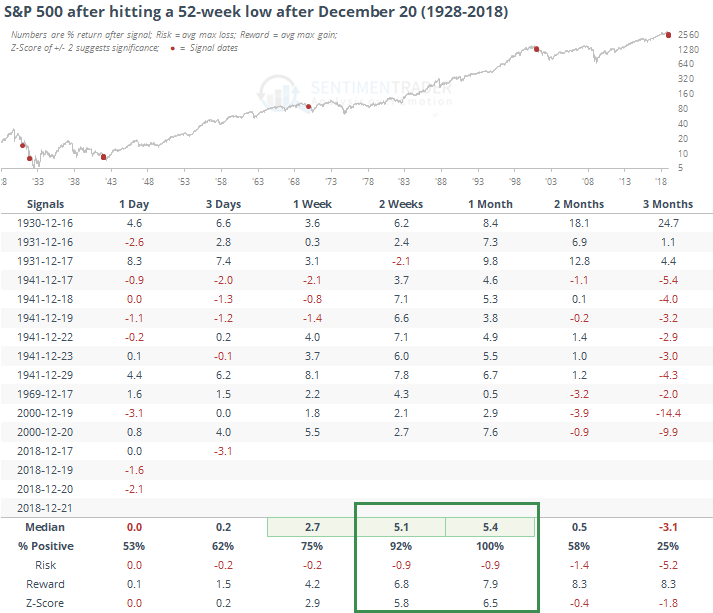
Seasonality has not worked well the last couple of weeks, as we have very rarely seen declines on a scale like this during this time of year (or any other time of year, really). The few times the S&P did sink to a new low in late December, though, it rebounded into January each time, even in the midst of very difficult markets.
Most of what we’ve looked at shows relatively low risk and extremely high reward over a 2-12 week time frame, even with the assumption we’re in a new bear market environment. The very short-term is more concerning, because there is less agreement about what could happen, much of the very short-term movement is random headline-chasing anyway, and we have tepid pre-holiday trading ahead of us for the next week+. Whatever weakness we might see in the coming day(s) should be more than made up for during the next several weeks to months.
For those observing, have a very Merry Christmas, and for those not, Happy Holidays and try to enjoy the break!