Headlines
|
|
Lots of speculation, very little hedging:
Options traders continue to push their luck, with a heavy focus on speculation. At the same time, hedging activity has dropped off and is now extremely low. Curiously, institutional investors may be starting to hedge against a decline, with a spike in SKEW and Gamma Exposure.
Whippy session: What a weird day. Maybe it's the Tesla effect, year-end machinations, or just general chicanery, but there were a lot of odd prints and major whipsaws across markets on Monday. Among the most severe was the VIX "fear gauge" which spiked more than 40% intraday then lost more than 20% into the close. There have only been 4 other days with this much of a reversal (1992-10-05, 1997-10-28, 2015-08-24, and 2017-06-29), after each of which the S&P rallied at least 2% during the next month, for what it's worth. There were 12 times it jumped more than 30% then lost more than 15% by the close, after which the S&P gained 9 times during the next month. So it looks like at least a mild positive, but we'd hesitate to read too much into Monday's big whipsaws.
Bottom Line:
- The market environment is pristine, but with near-historic optimism, gains tend to be muted, with a high probability of being reversed at some point over the ensuing weeks.
|
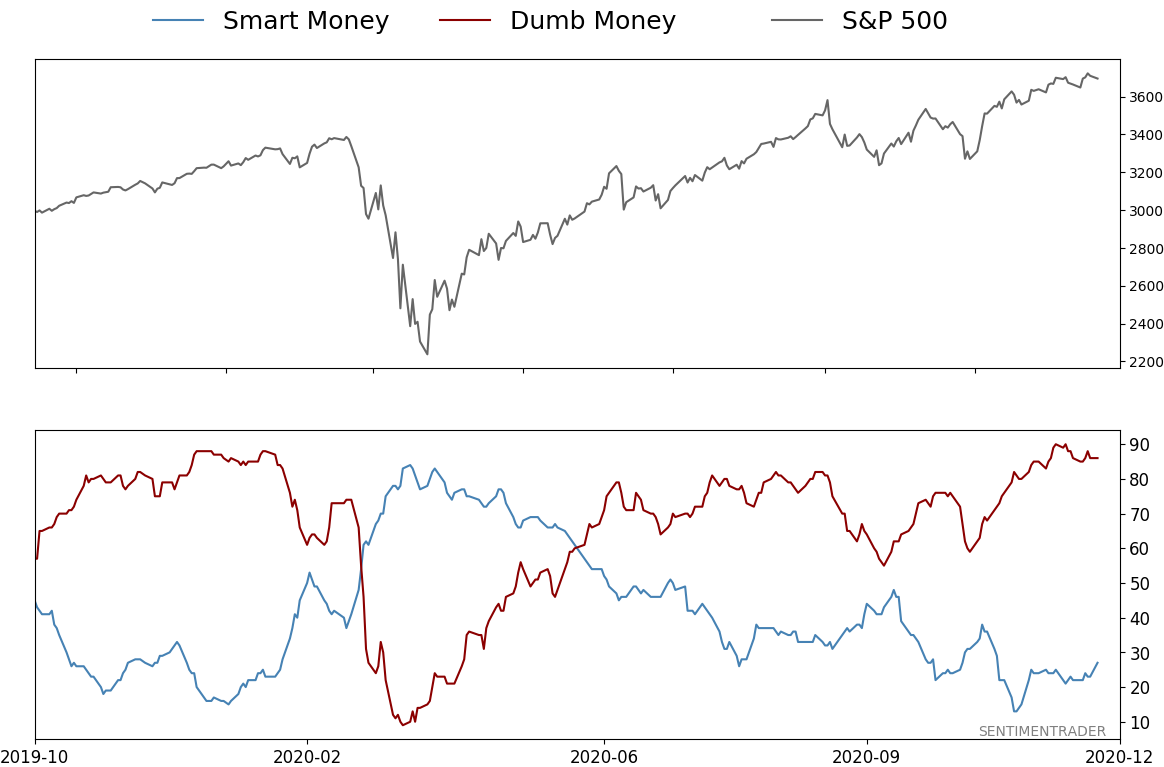
Smart / Dumb Money Confidence
|
Smart Money Confidence: 27%
Dumb Money Confidence: 86%
|
|
Risk Levels
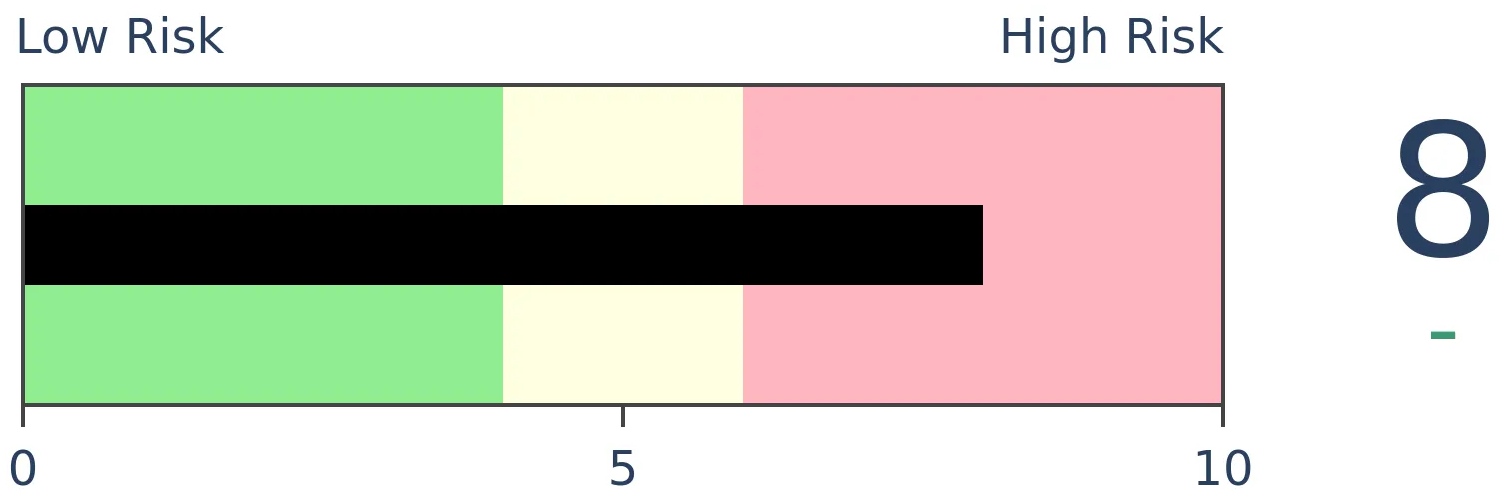
Stocks Short-Term
|
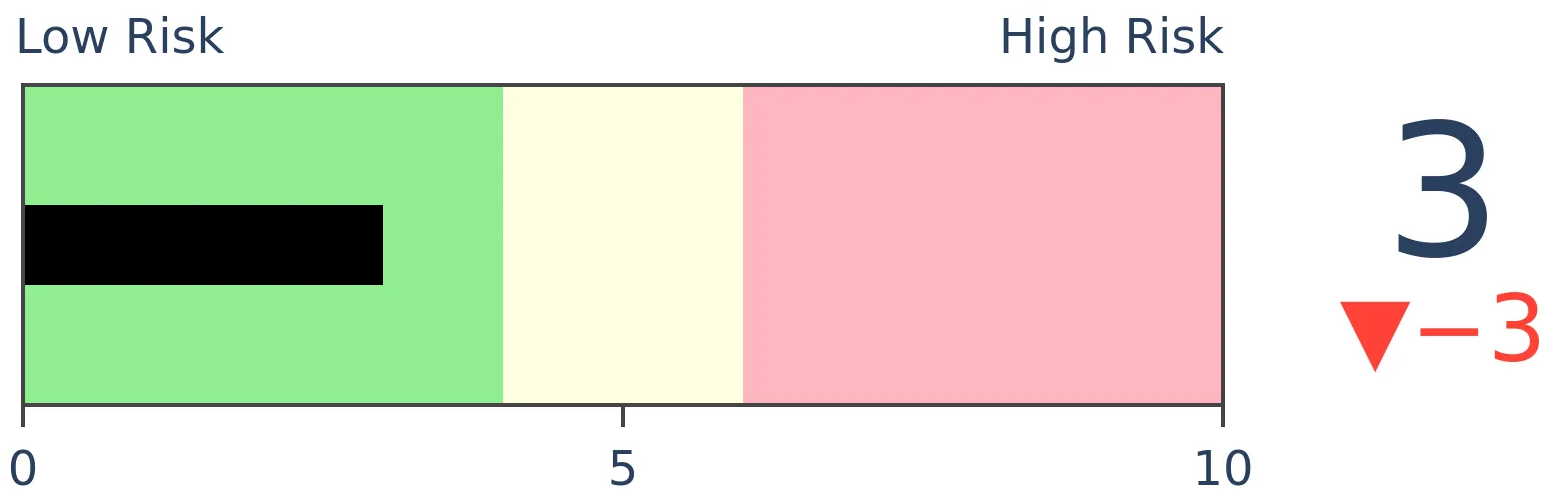
Stocks Medium-Term
|
|
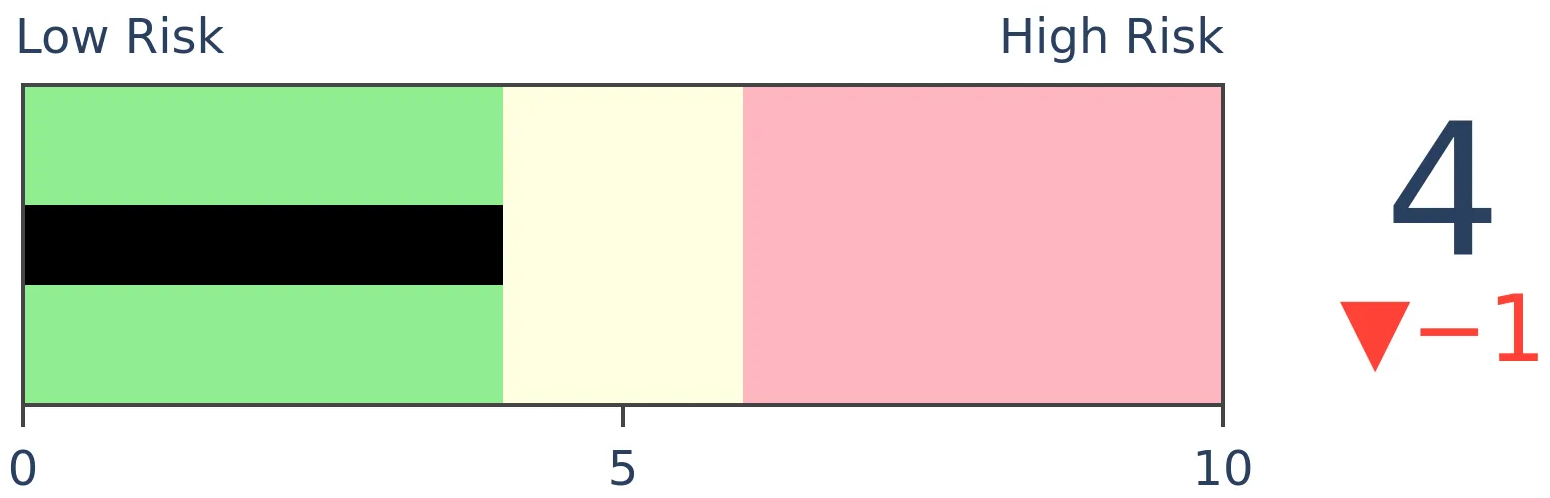
Bonds
|
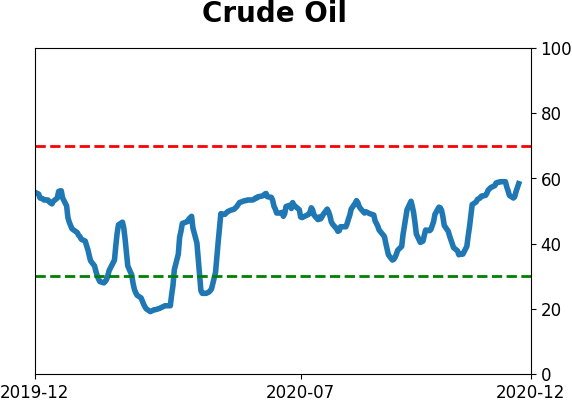
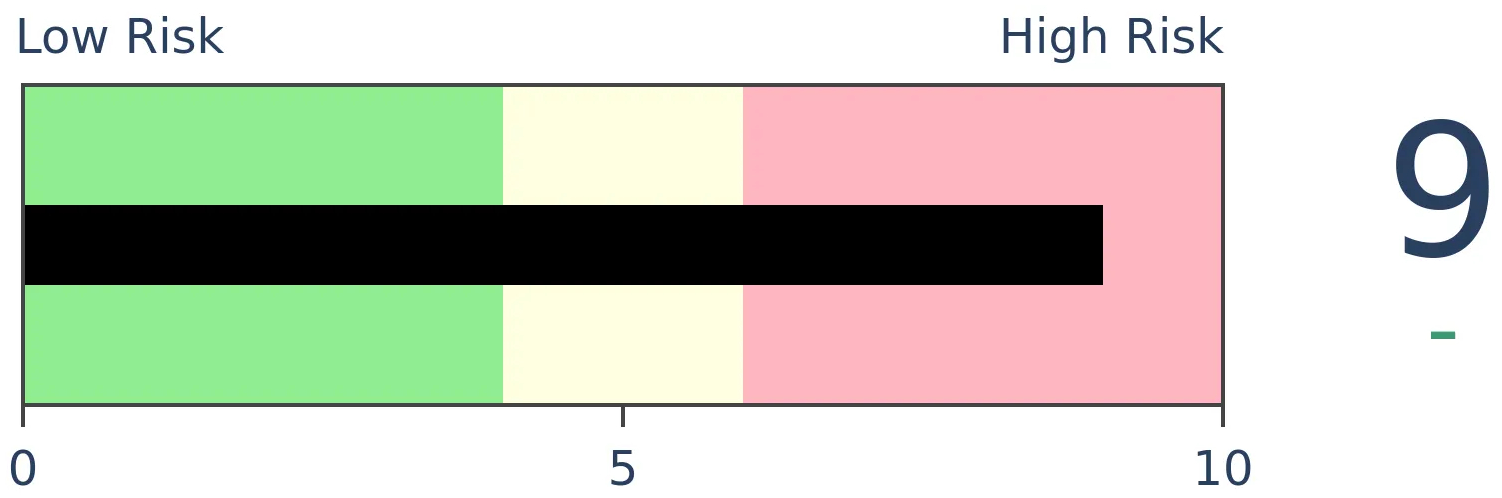
Crude Oil

|
|
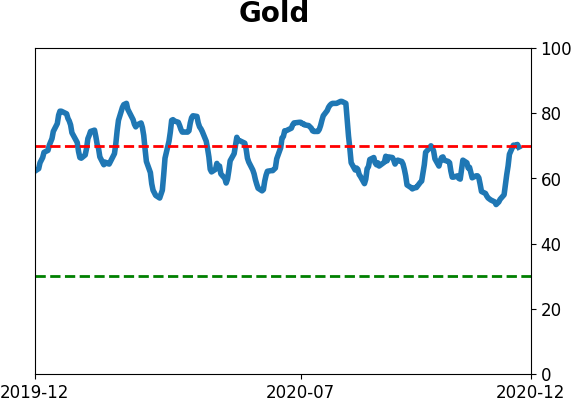
Gold
|
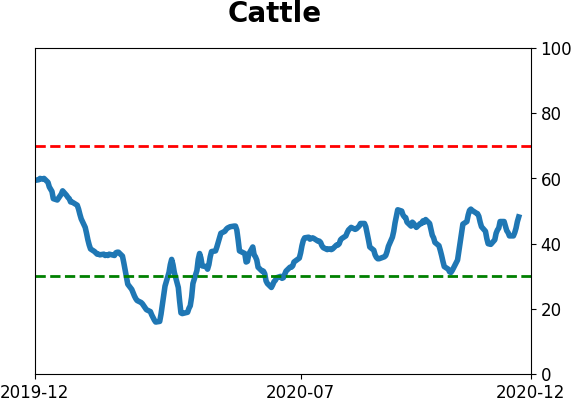
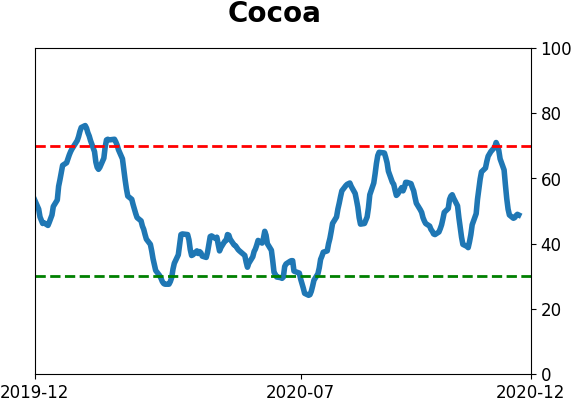
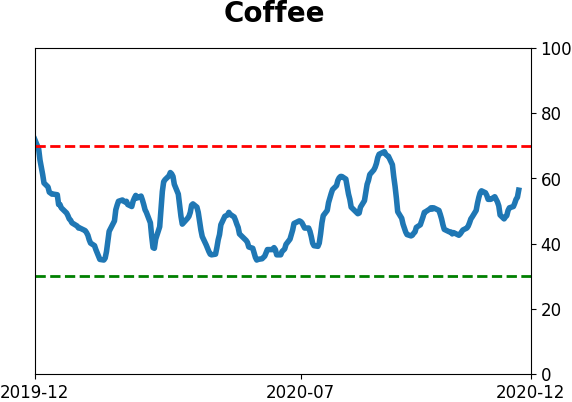
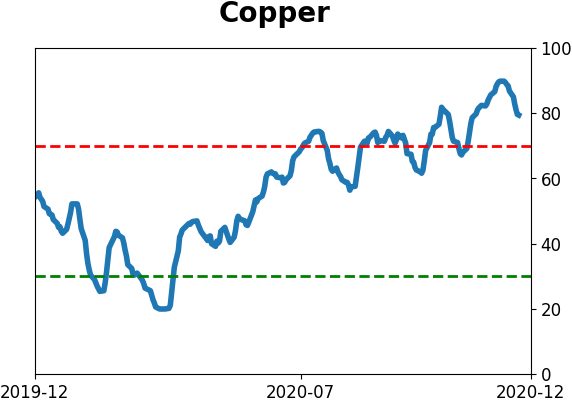
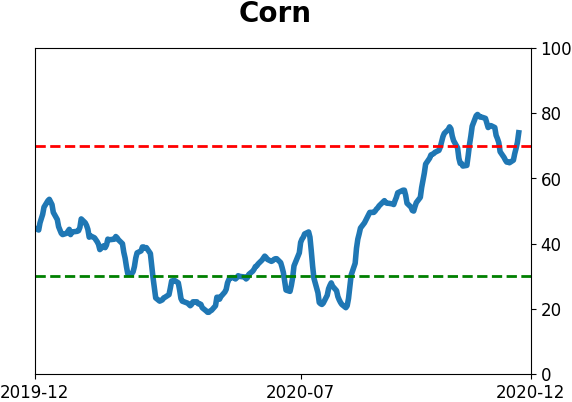
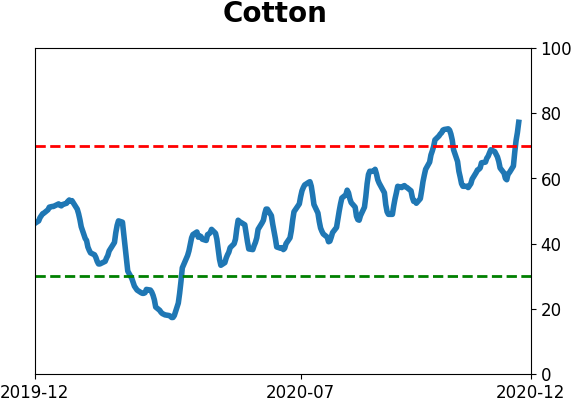
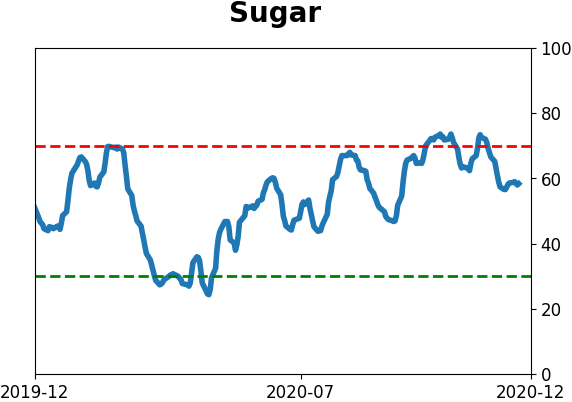
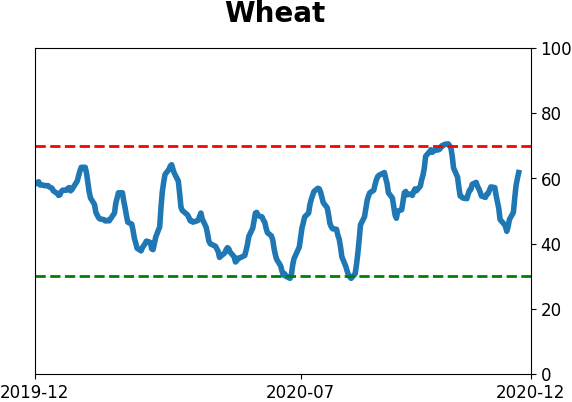
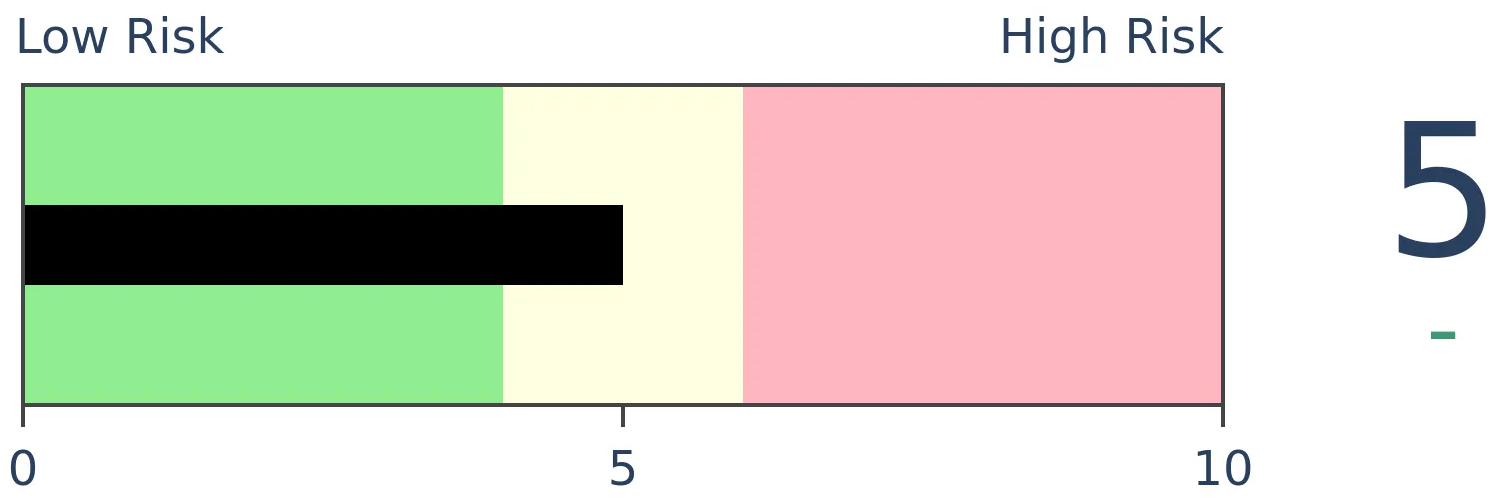
Agriculture
|
|
Research
BOTTOM LINE
Options traders continue to push their luck, with a heavy focus on speculation. At the same time, hedging activity has dropped off and is now extremely low. Curiously, institutional investors may be starting to hedge against a decline, with a spike in SKEW and Gamma Exposure.
FORECAST / TIMEFRAME
SPY -- Down, Medium-Term
|
In recent weeks, we've had occasion to yet again focus on the behavior of options traders. Depending on the metric, we're currently seeing a record or near-record level of speculation, with very little hedging.
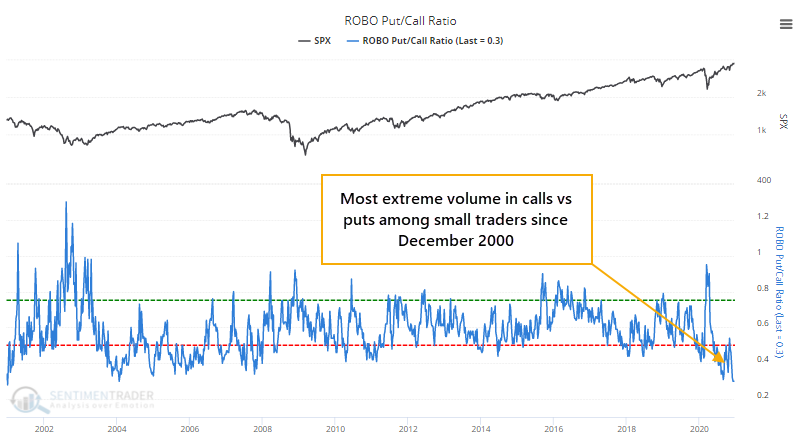
Nothing much changed last week. Stocks levitated, and options traders continued to believe it's going to continue. Well, at least some of them.
Among the smallest of traders, buy-to-open volume in speculative calls was still more than triple that of protective puts, pushing the ROBO Put/Call Ratio to the most extreme level in almost exactly 20 years.
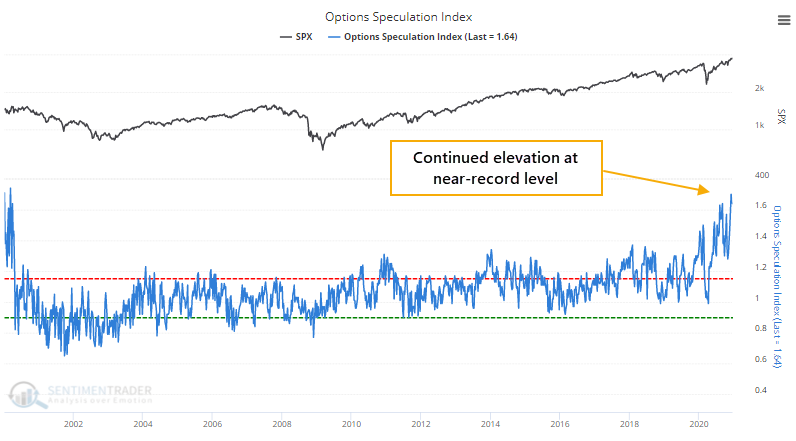
Among all strategies and all traders, the focus on strategies that only pay out if stocks rise continues to hover near record highs, with the Option Speculation Index showing that bullish volume is 64% higher than bearish volume.
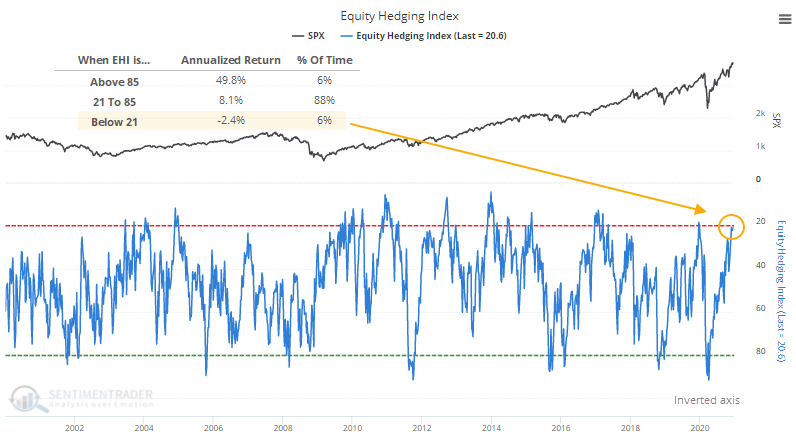
So we can see that speculation is high, which is troubling enough. Adding to the concern is that hedging activity, in the options market or elsewhere, has become scarce. The Equity Hedging Index (EHI) is now in the lowest 6% of all readings since 1986.
There are many ways in which an investor or speculator can hedge against a stock market decline, among them:
- Raise cash
- Buy put options
- Buy an inverse exchange-traded fund
- Buy an inverse mutual fund
- Sell short a futures contract
- Buy credit default swaps
The EHI looks at each of those factors and compares the current level to its historical average. The more each indicator shows hedging activity, the higher the Equity Hedging Index will be. The fact that it's currently very low suggests that there is little evidence that traders are establishing hedges.
The chart below shows us that when the EHI is below 21, the S&P 500's annualized return has been -2.4% versus +49.8% when the EHI is above 85. In the chart below, the axis is inverted so that a low reading more obviously lines up with overbought conditions and vice-versa.
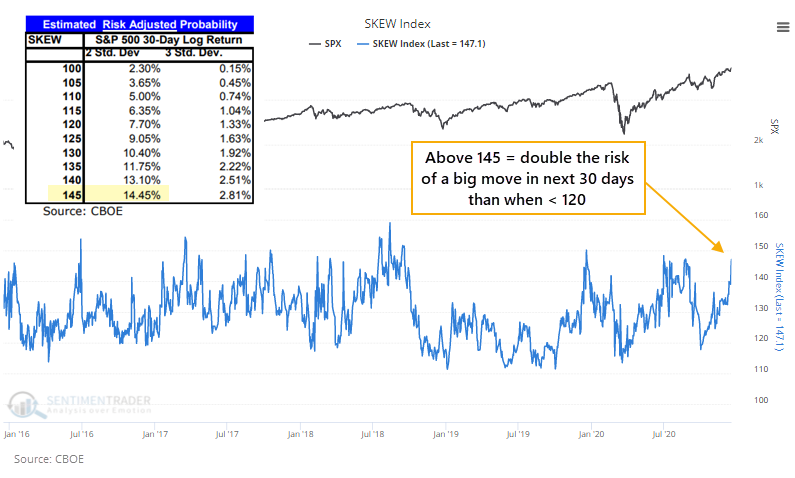
Curiously, though, we can see that someone, somewhere, is starting to price in the potential for a big move in the next 30 days. The CBOE SKEW Index spiked above 145 to end last week. Maybe this is related to Tesla's inclusion in the S&P 500. Maybe not.
According to a white paper by the CBOE, a reading above 145% has suggested a 14.5% probability of a 2 standard deviation move in the S&P 500 over the next 30 days. That's not very high, but it's well above the risk of a big move when the Skew is at lower levels.
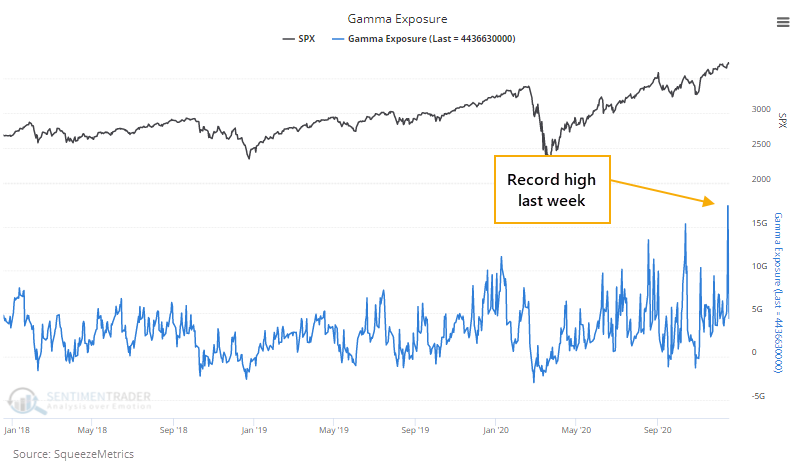
At the same time, Gamma Exposure spiked to a record high last week. As calculated by SqueezeMetrics based on an in-depth look at option positioning, this is an estimate of how much dealers may have to sell for every 1% move higher in the S&P 500.
Both of these measures, SKEW and Gamma Exposure, have been elevated for a few weeks. Over the past month, there have been 14 days when both of them were above their upper thresholds at the same time. Going back to 2011, there have only been 3 times when there was this much of a cluster of extreme readings in both of them.
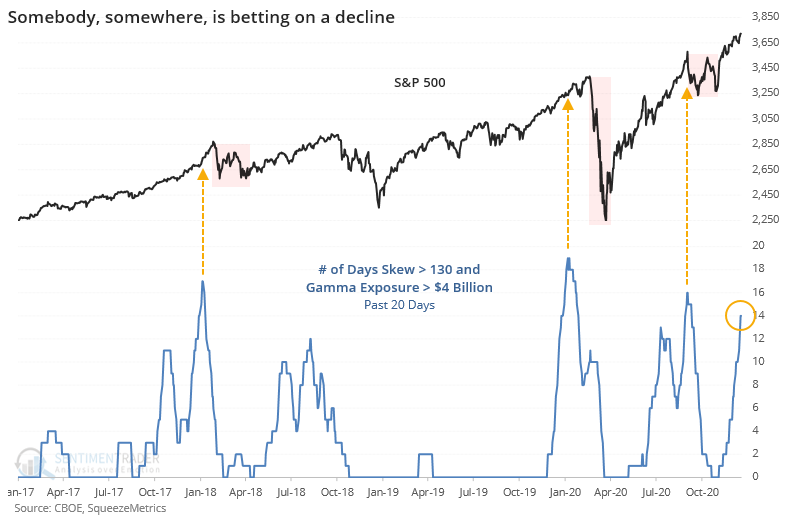
It's curious that SKEW and Gamma Exposure is suggesting that (presumably) institutional investors have started, or will have to start, hedging against a decline while the broader base of investors have continued to push into deeply speculative territory with little evidence of hedging activity.
This kind of behavior has never not led to further short-term gains being given back during a subsequent pullback, even though sometimes it took a while. Momentum is a very strong force, which is why we spend a lot of time on it, and since October it has been excellent, both in terms of magnitude and participation. It would be extremely unusual to see this kind of quality rally lead to a deep and protracted decline over the next 6-12 months. It wouldn't be all that unusual, however, to see a multi-week to multi-month decline, particularly when we're seeing the kinds of sentiment readings that have triggered in recent weeks.
Active Studies
| Time Frame | Bullish | Bearish | | Short-Term | 0 | 0 | | Medium-Term | 4 | 1 | | Long-Term | 47 | 2 |
|
Indicators at Extremes
Portfolio
| Position | Description | Weight % | Added / Reduced | Date | | Stocks | 10.4% VWO, 9.1% XLE, 8.5% RSP, 6.6% PSCE | 34.5 | Reduced 6.7% | 2020-12-14 | | Bonds | 10% BND, 10% SCHP, 10% ANGL | 28.4 | Reduced 0.1% | 2020-10-02 | | Commodities | GCC | 2.4 | Reduced 2.1%
| 2020-09-04 | | Precious Metals | GDX | 8.9 | Added 4.8% | 2020-12-01 | | Special Situations | | 0.0 | Reduced 5% | 2020-10-02 | | Cash | | 25.8 | | |
|
Updates (Changes made today are underlined)
Quite a few of the studies that have been triggering for stocks have showed a poor risk/reward skew over a short- to medium-term time frame, even though many of them have also been quite positive over medium- to long-term time frames. We're in a very favorable seasonal window, so it would be somewhat odd to see a substantial pullback in the next few weeks. Leave it to 2020 to do just that, I suppose, but the calendar is a point in bulls' favor. Even so, record-high-and-declining sentiment, coupled with early signs of a reversal were enough that I reduced my S&P 500 position a bit. I fully expect that the energy funds will suffer some losses in the coming weeks, but as I noted when buying them, they're intended as long-term positions and almost by definition they're going to be volatile. RETURN YTD: 7.1% 2019: 12.6%, 2018: 0.6%, 2017: 3.8%, 2016: 17.1%, 2015: 9.2%, 2014: 14.5%, 2013: 2.2%, 2012: 10.8%, 2011: 16.5%, 2010: 15.3%, 2009: 23.9%, 2008: 16.2%, 2007: 7.8%
|
|
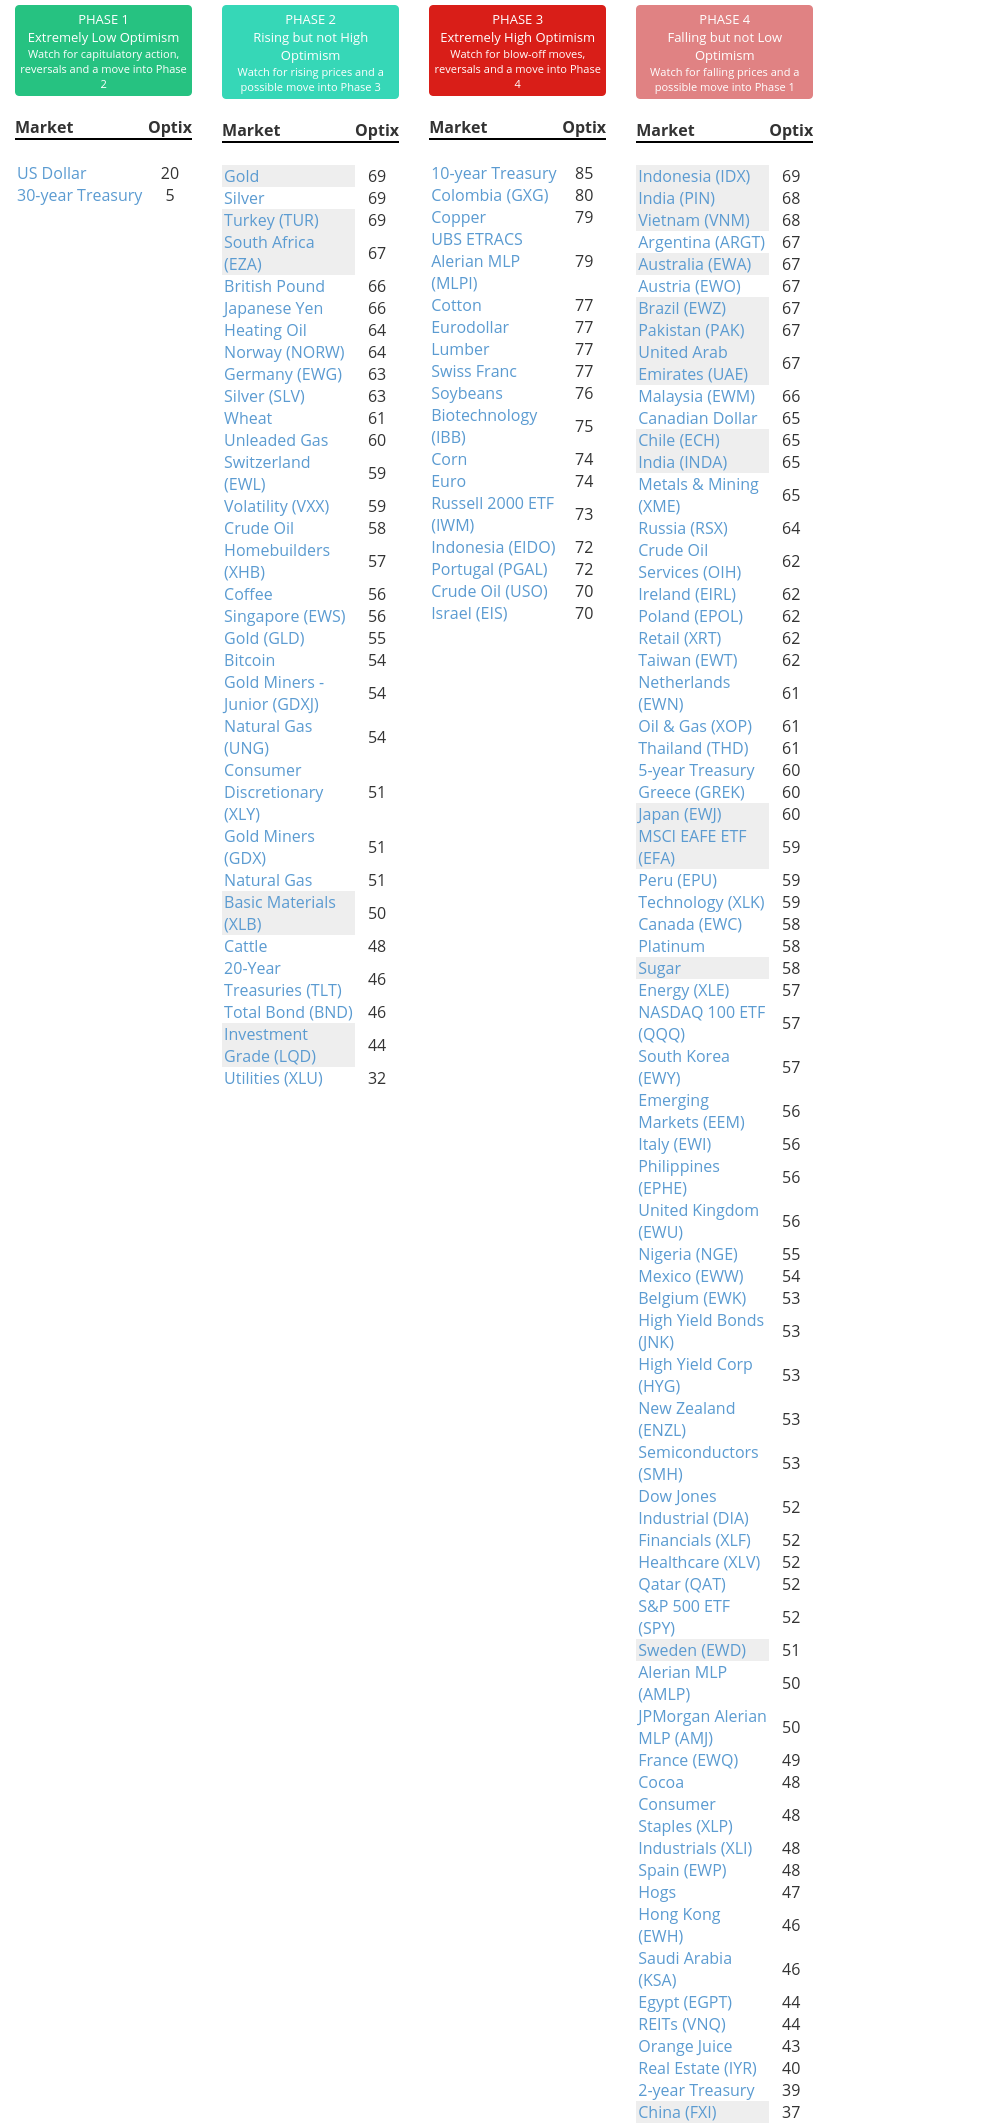
Phase Table
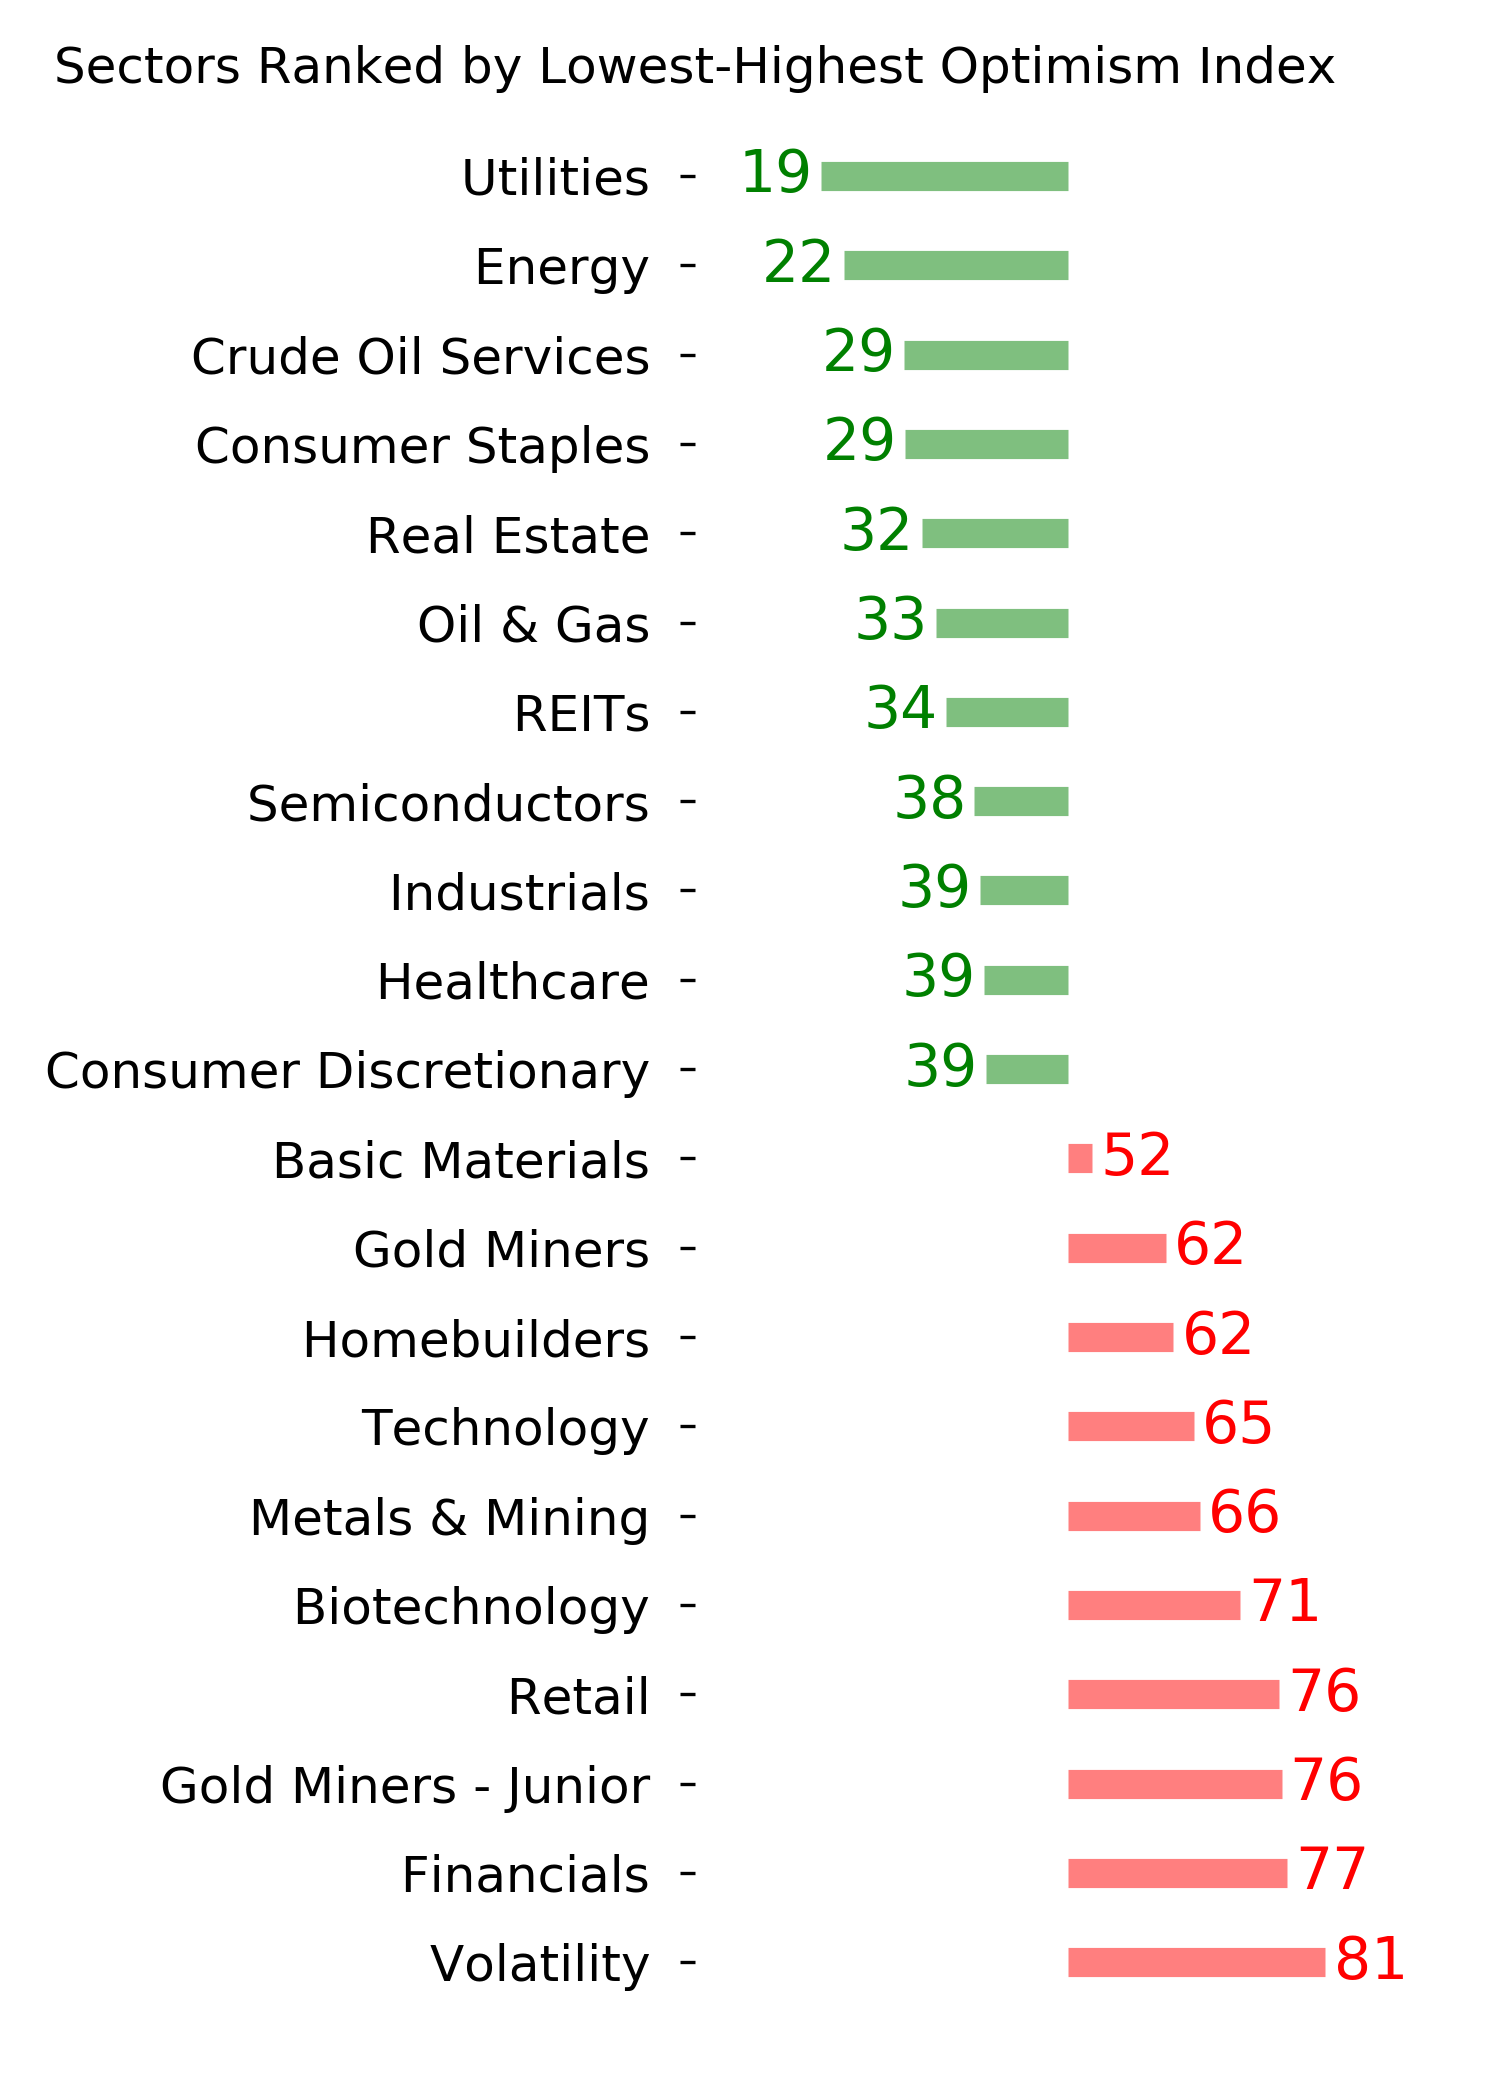
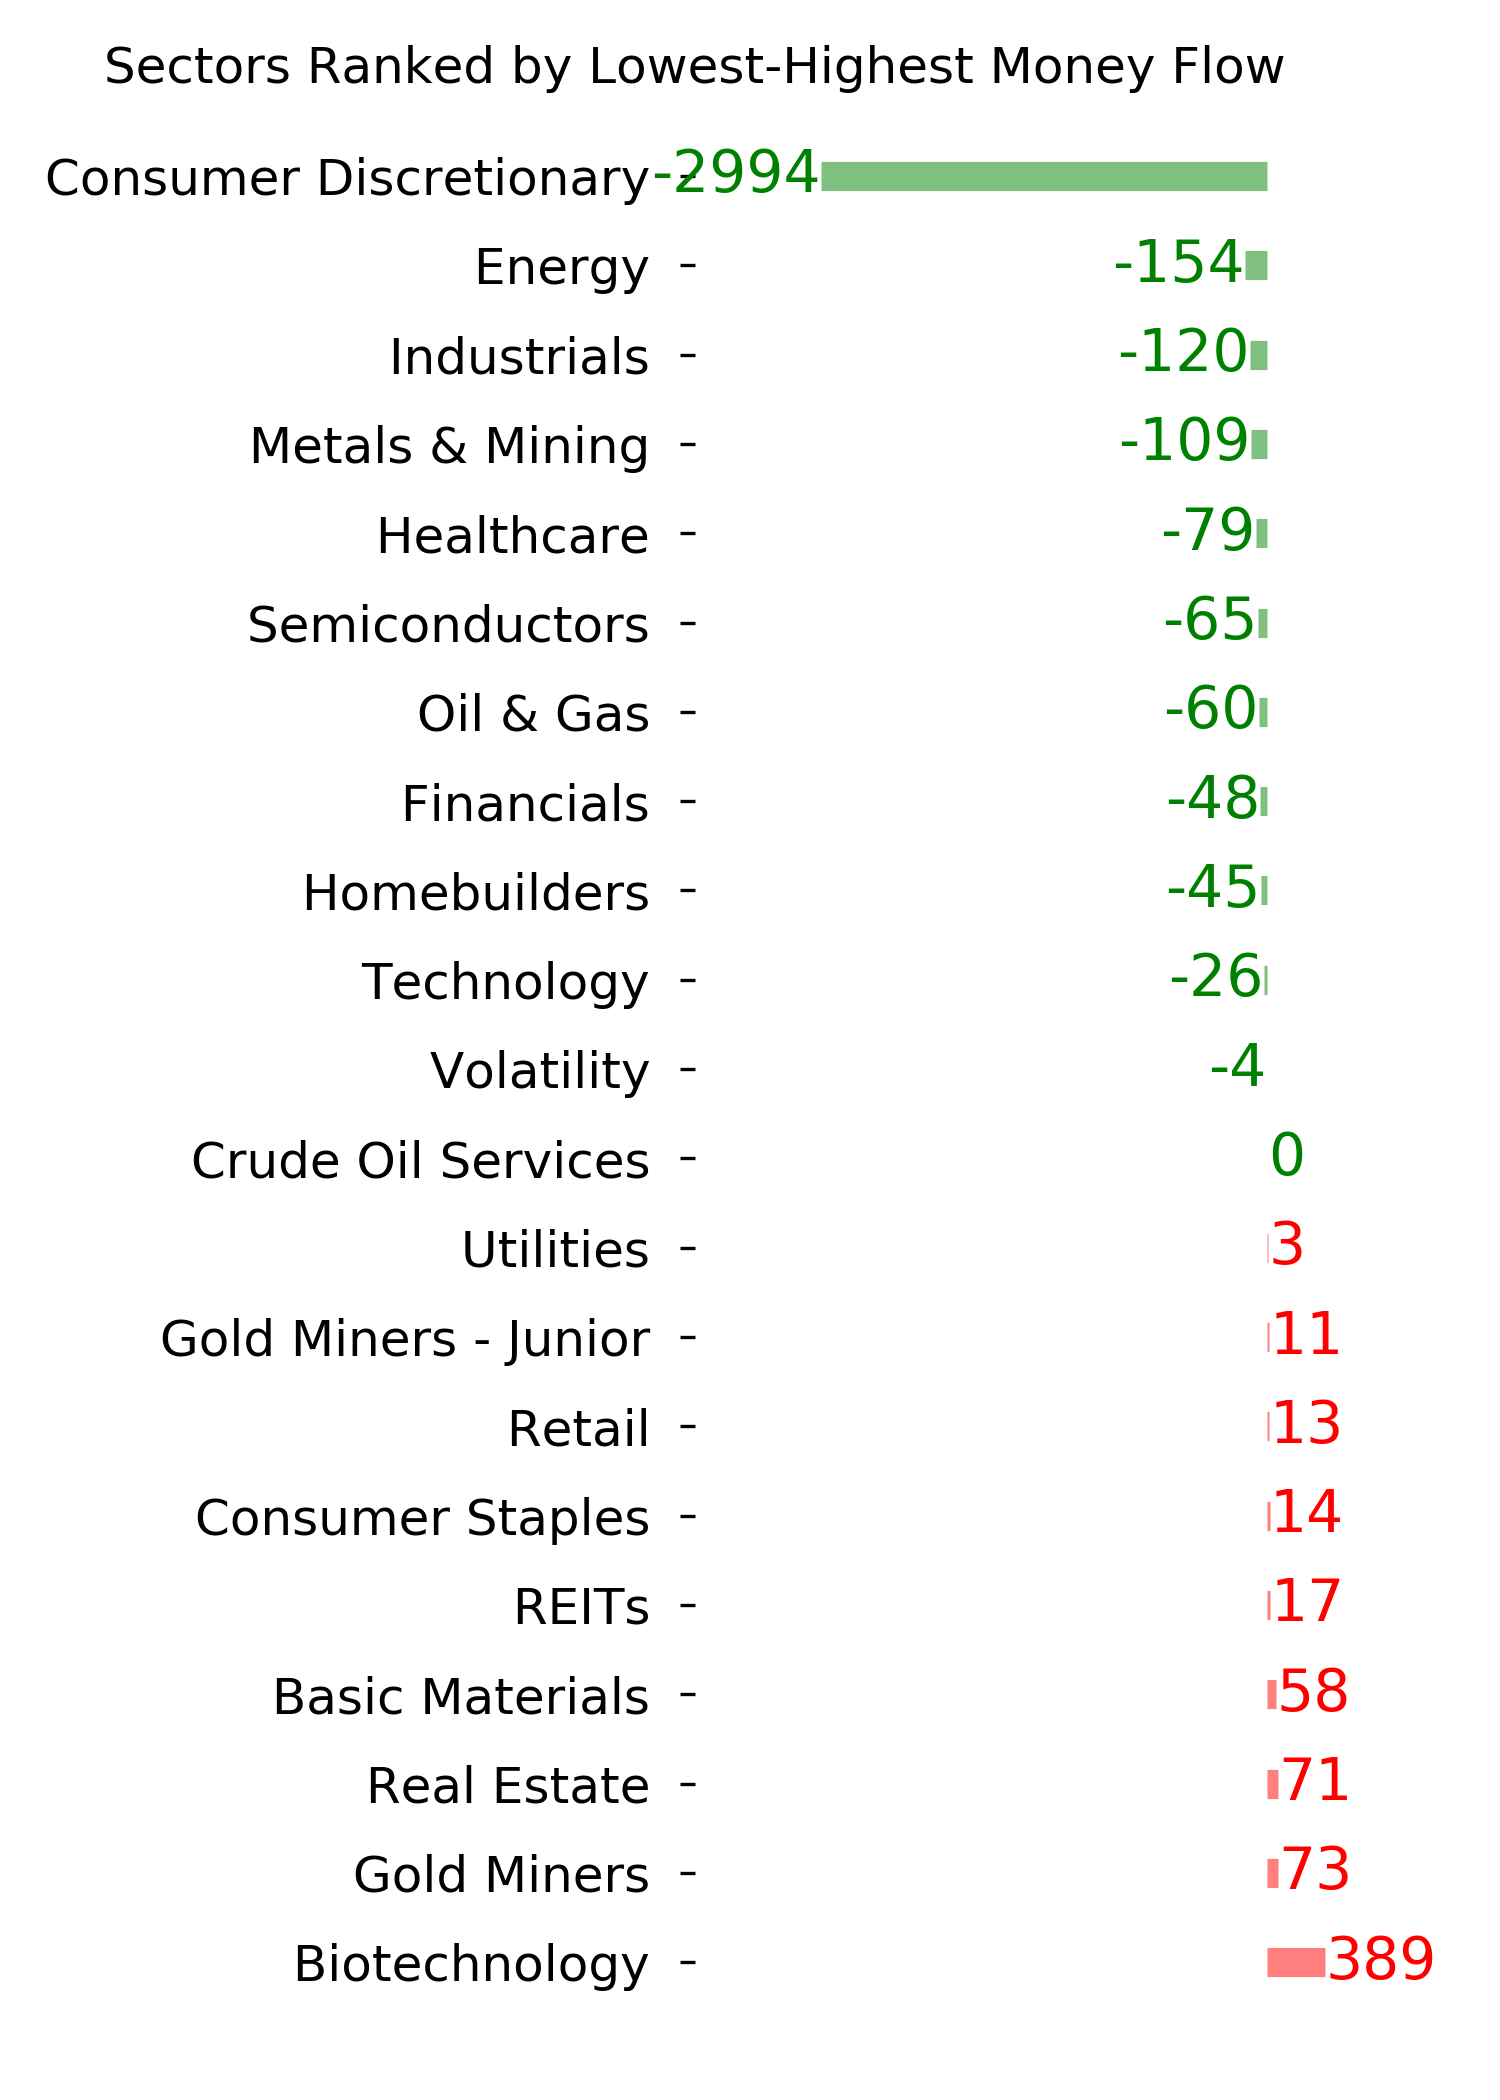
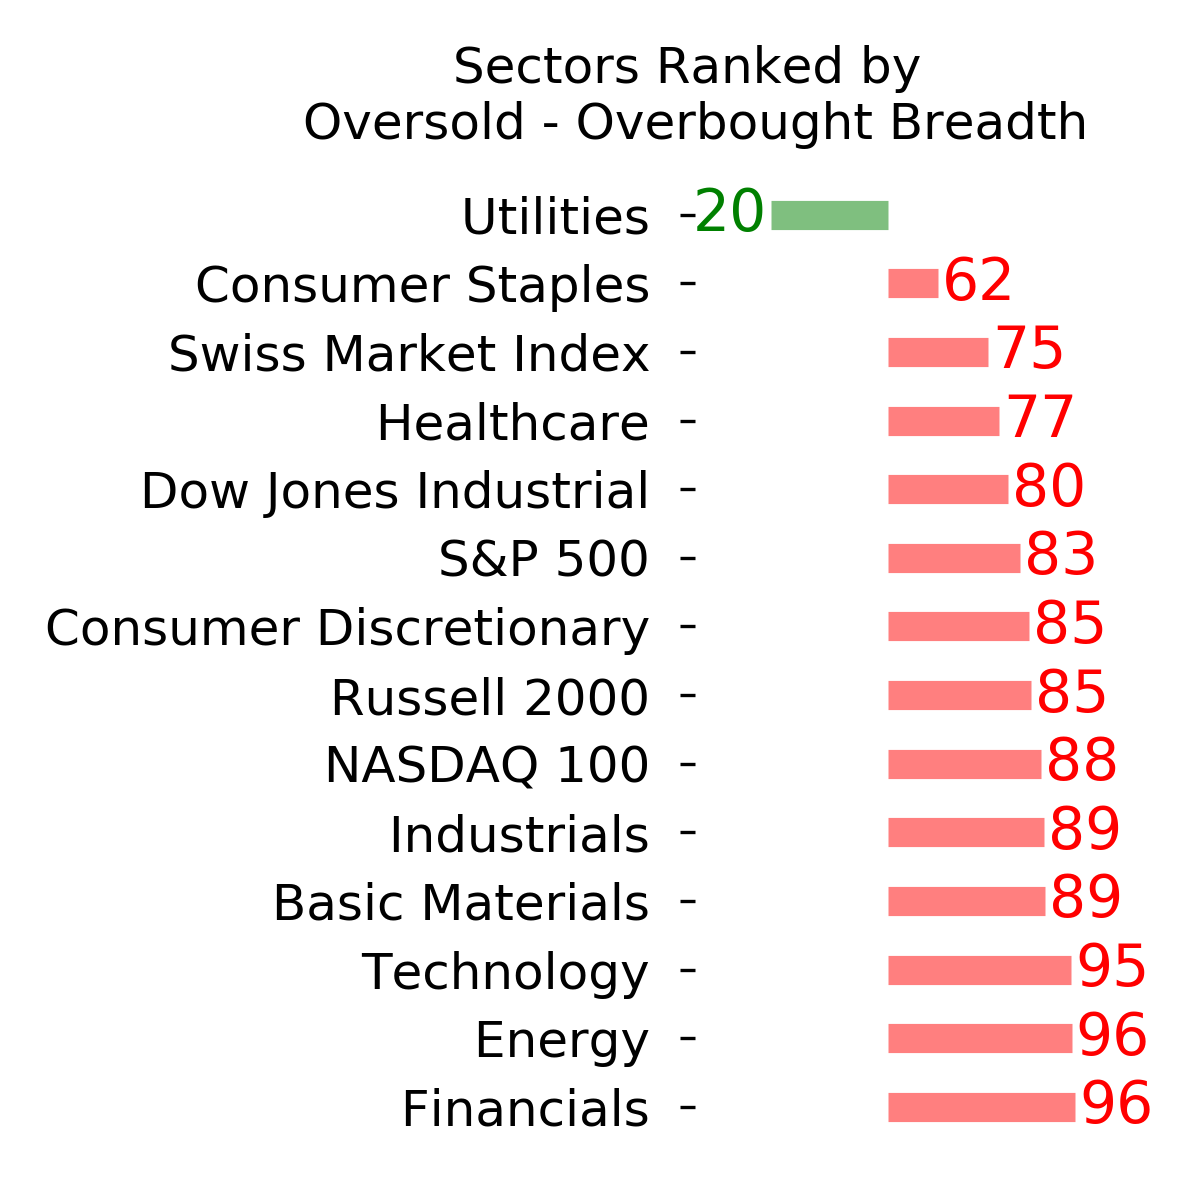
Ranks
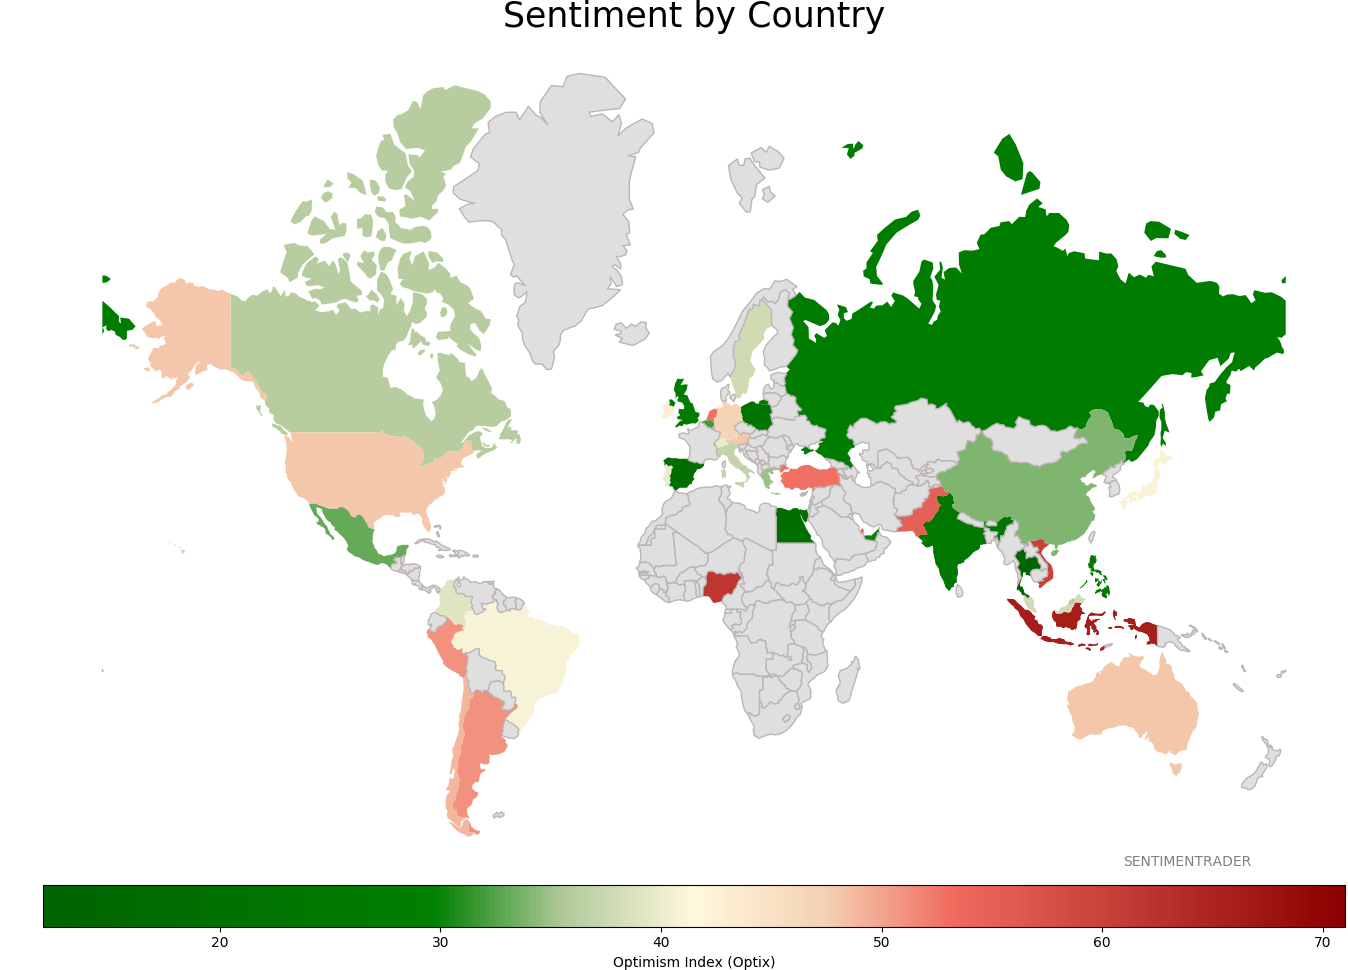
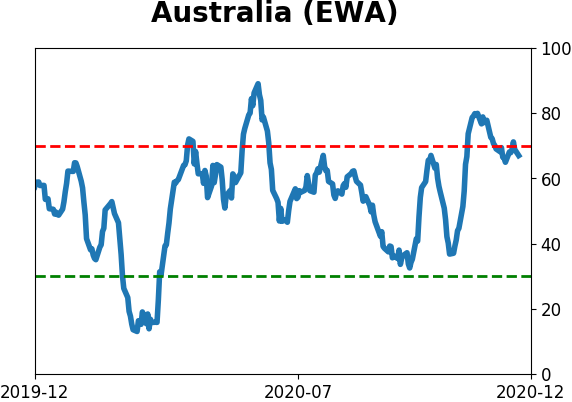
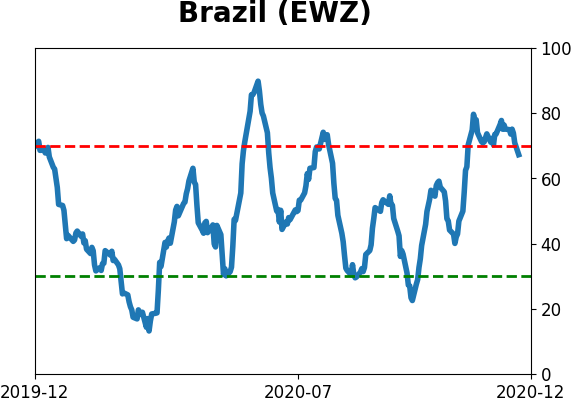
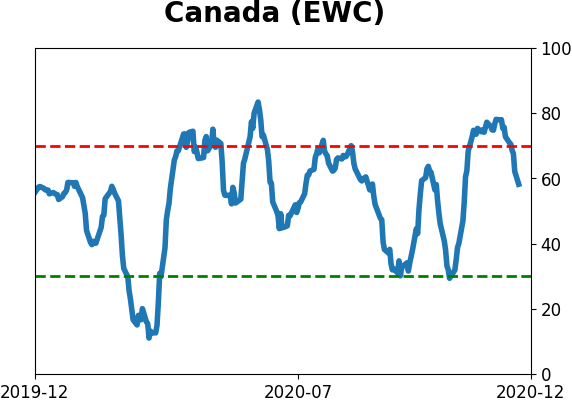
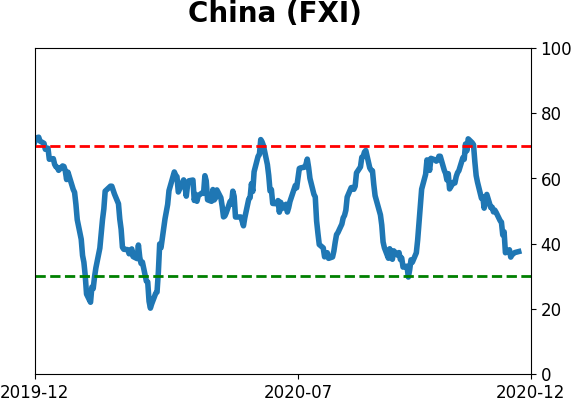
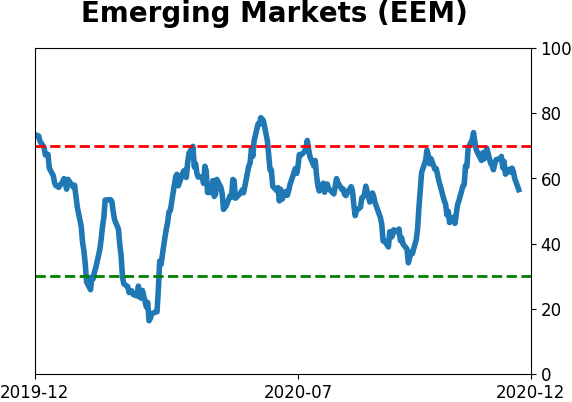
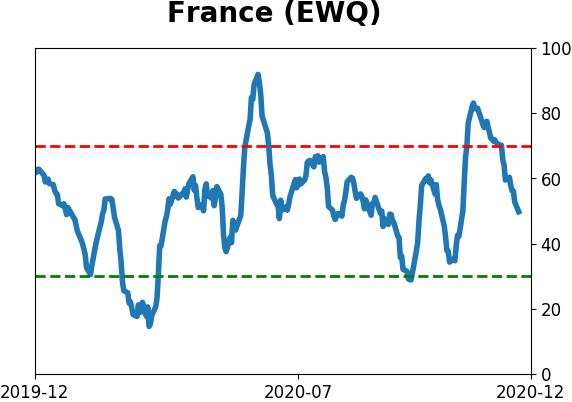
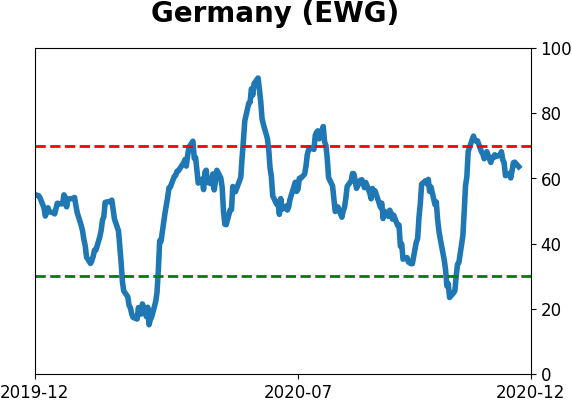
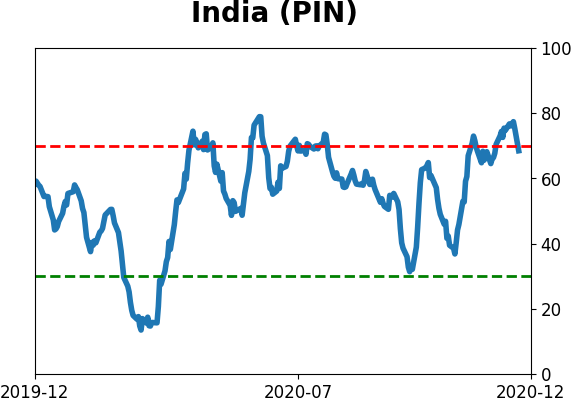
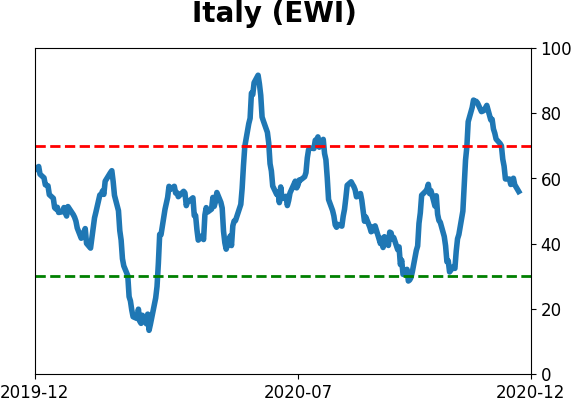
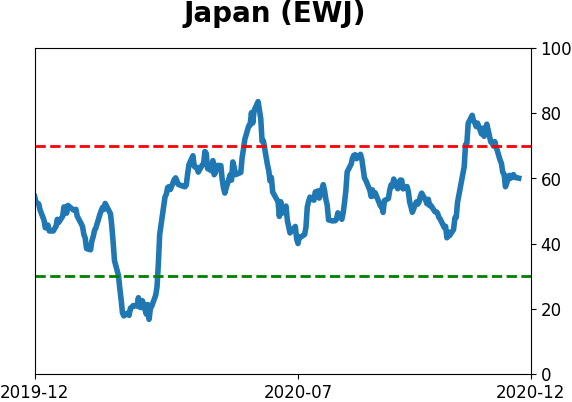
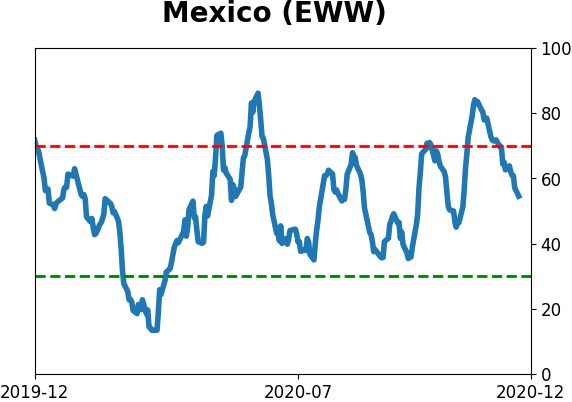
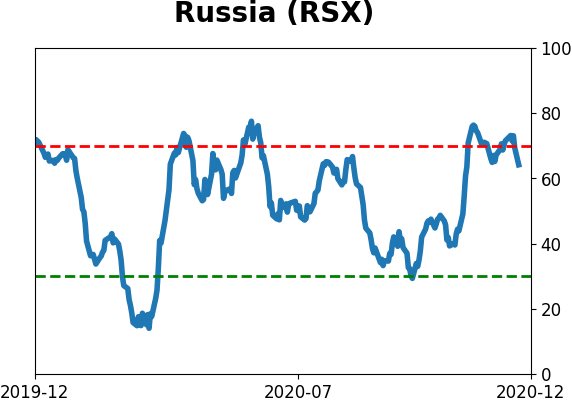
Sentiment Around The World
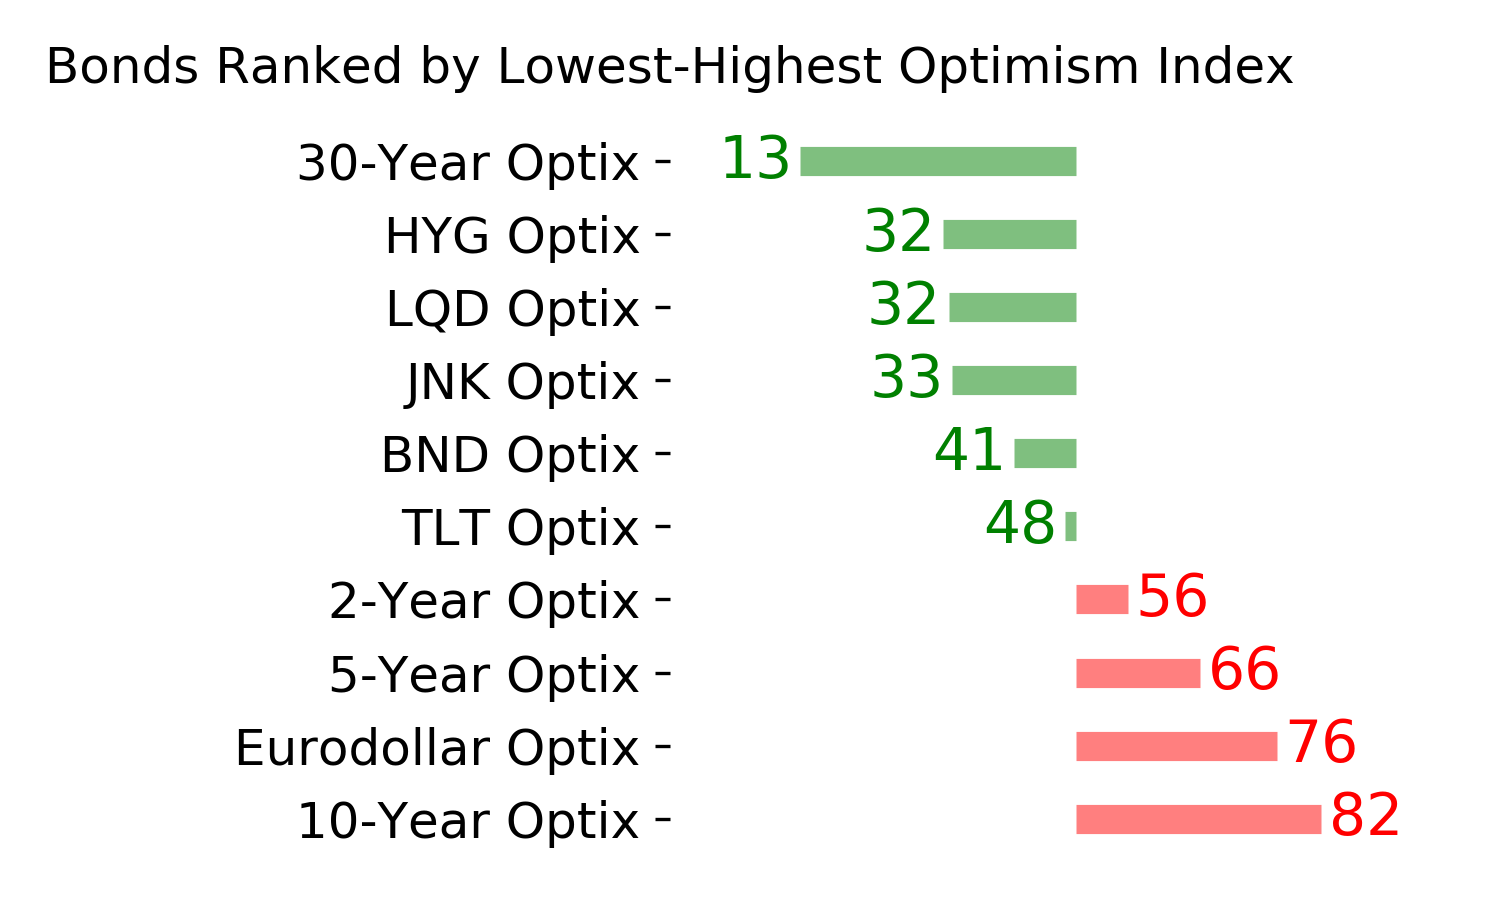
Optimism Index Thumbnails
|
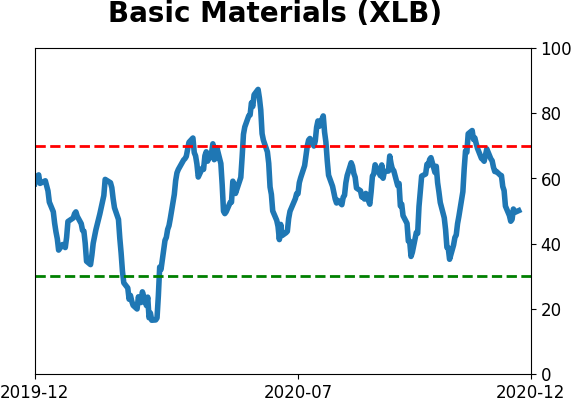
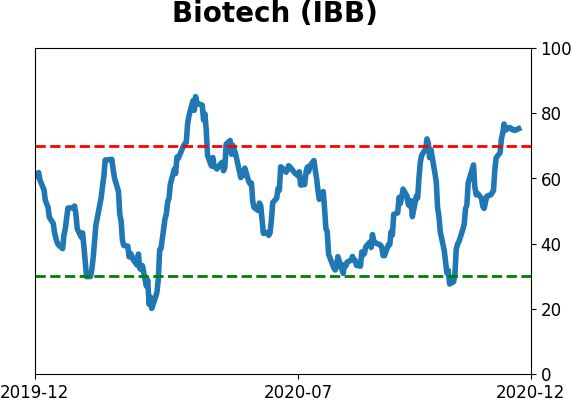
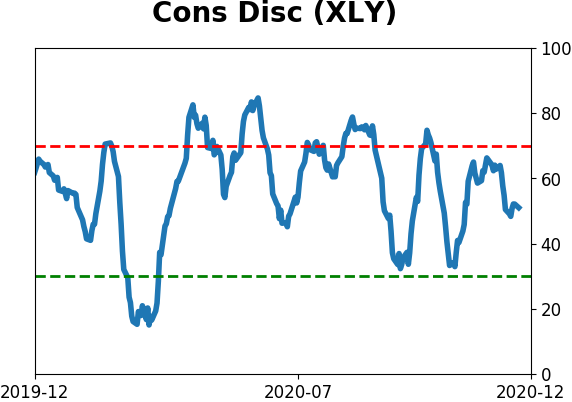
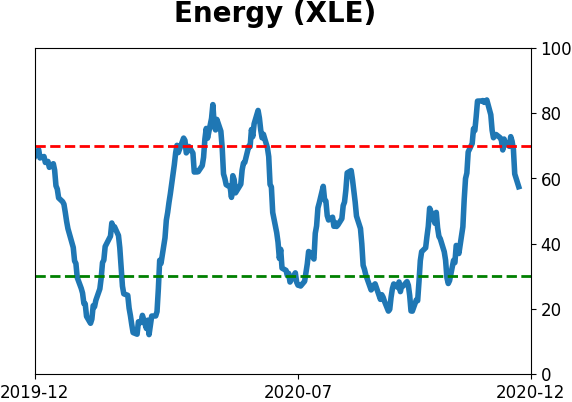
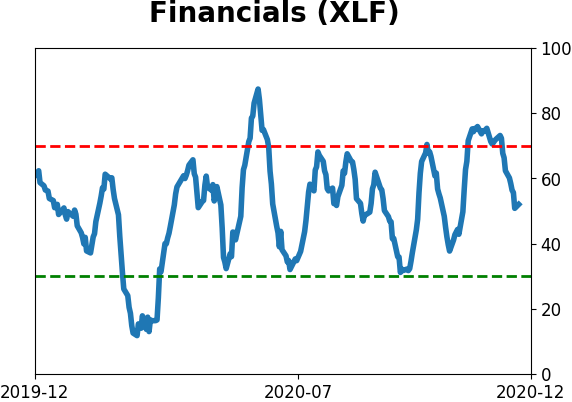
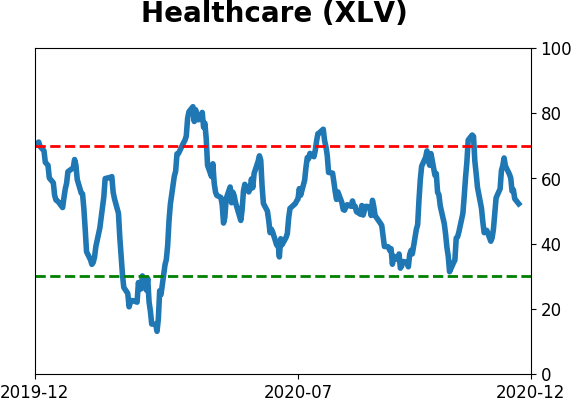
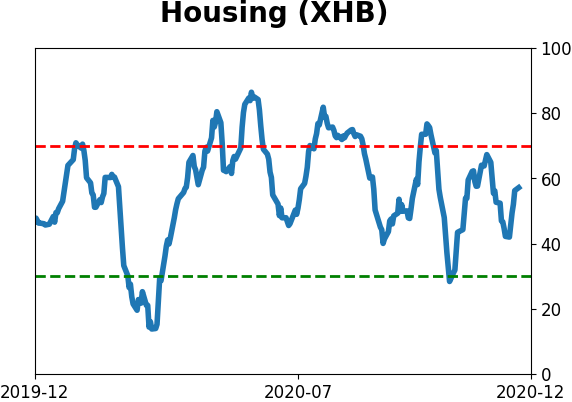
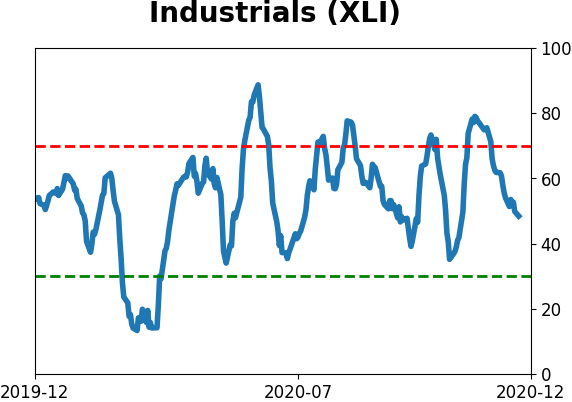
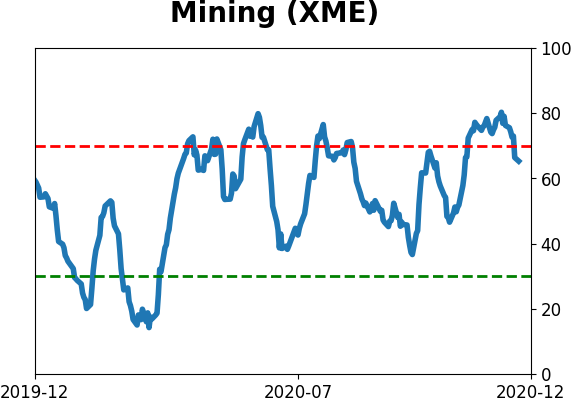
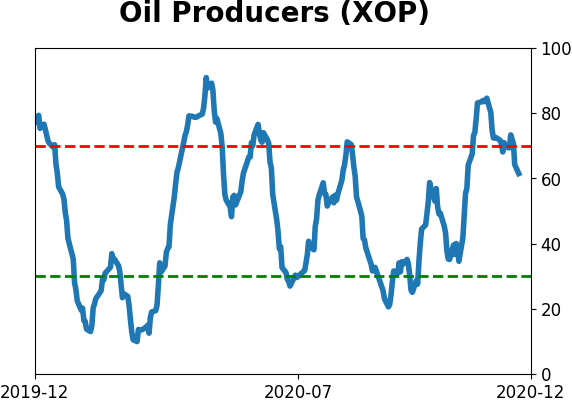
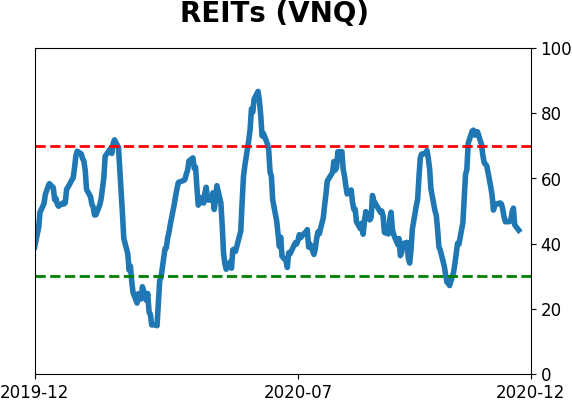
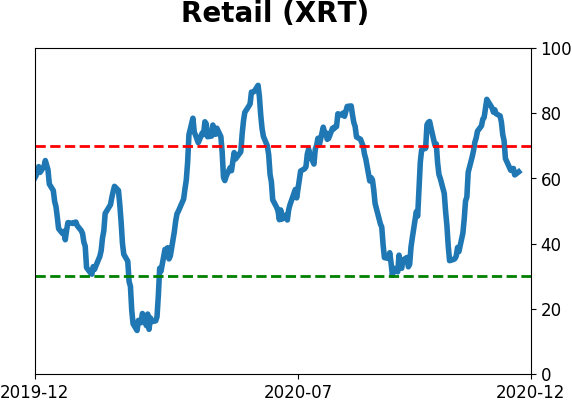
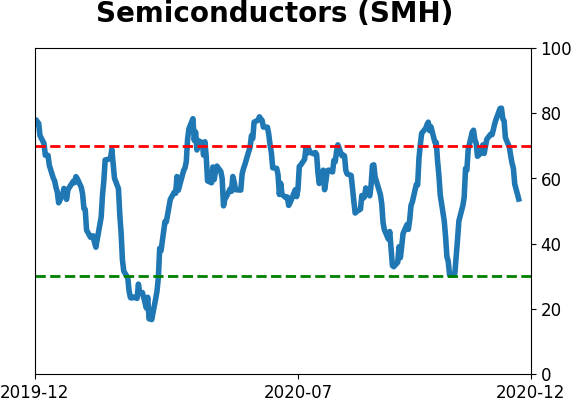
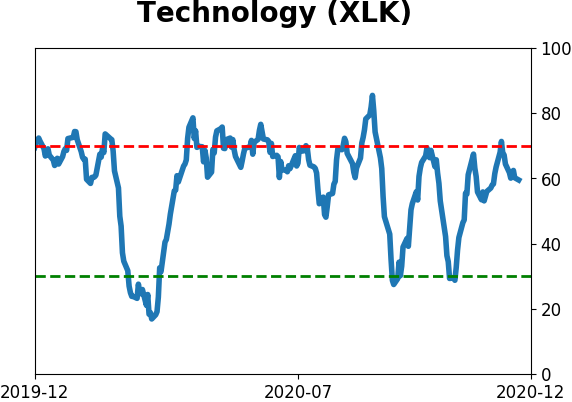
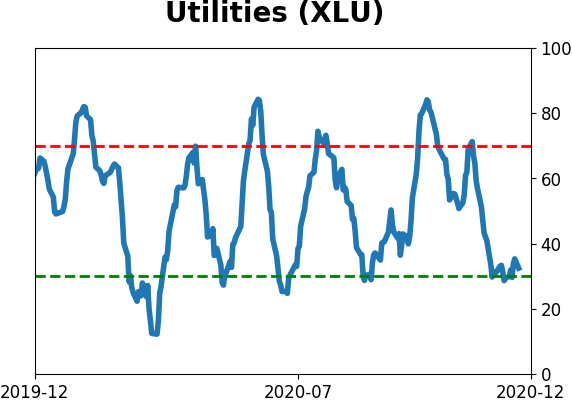
Sector ETF's - 10-Day Moving Average
|
|
|
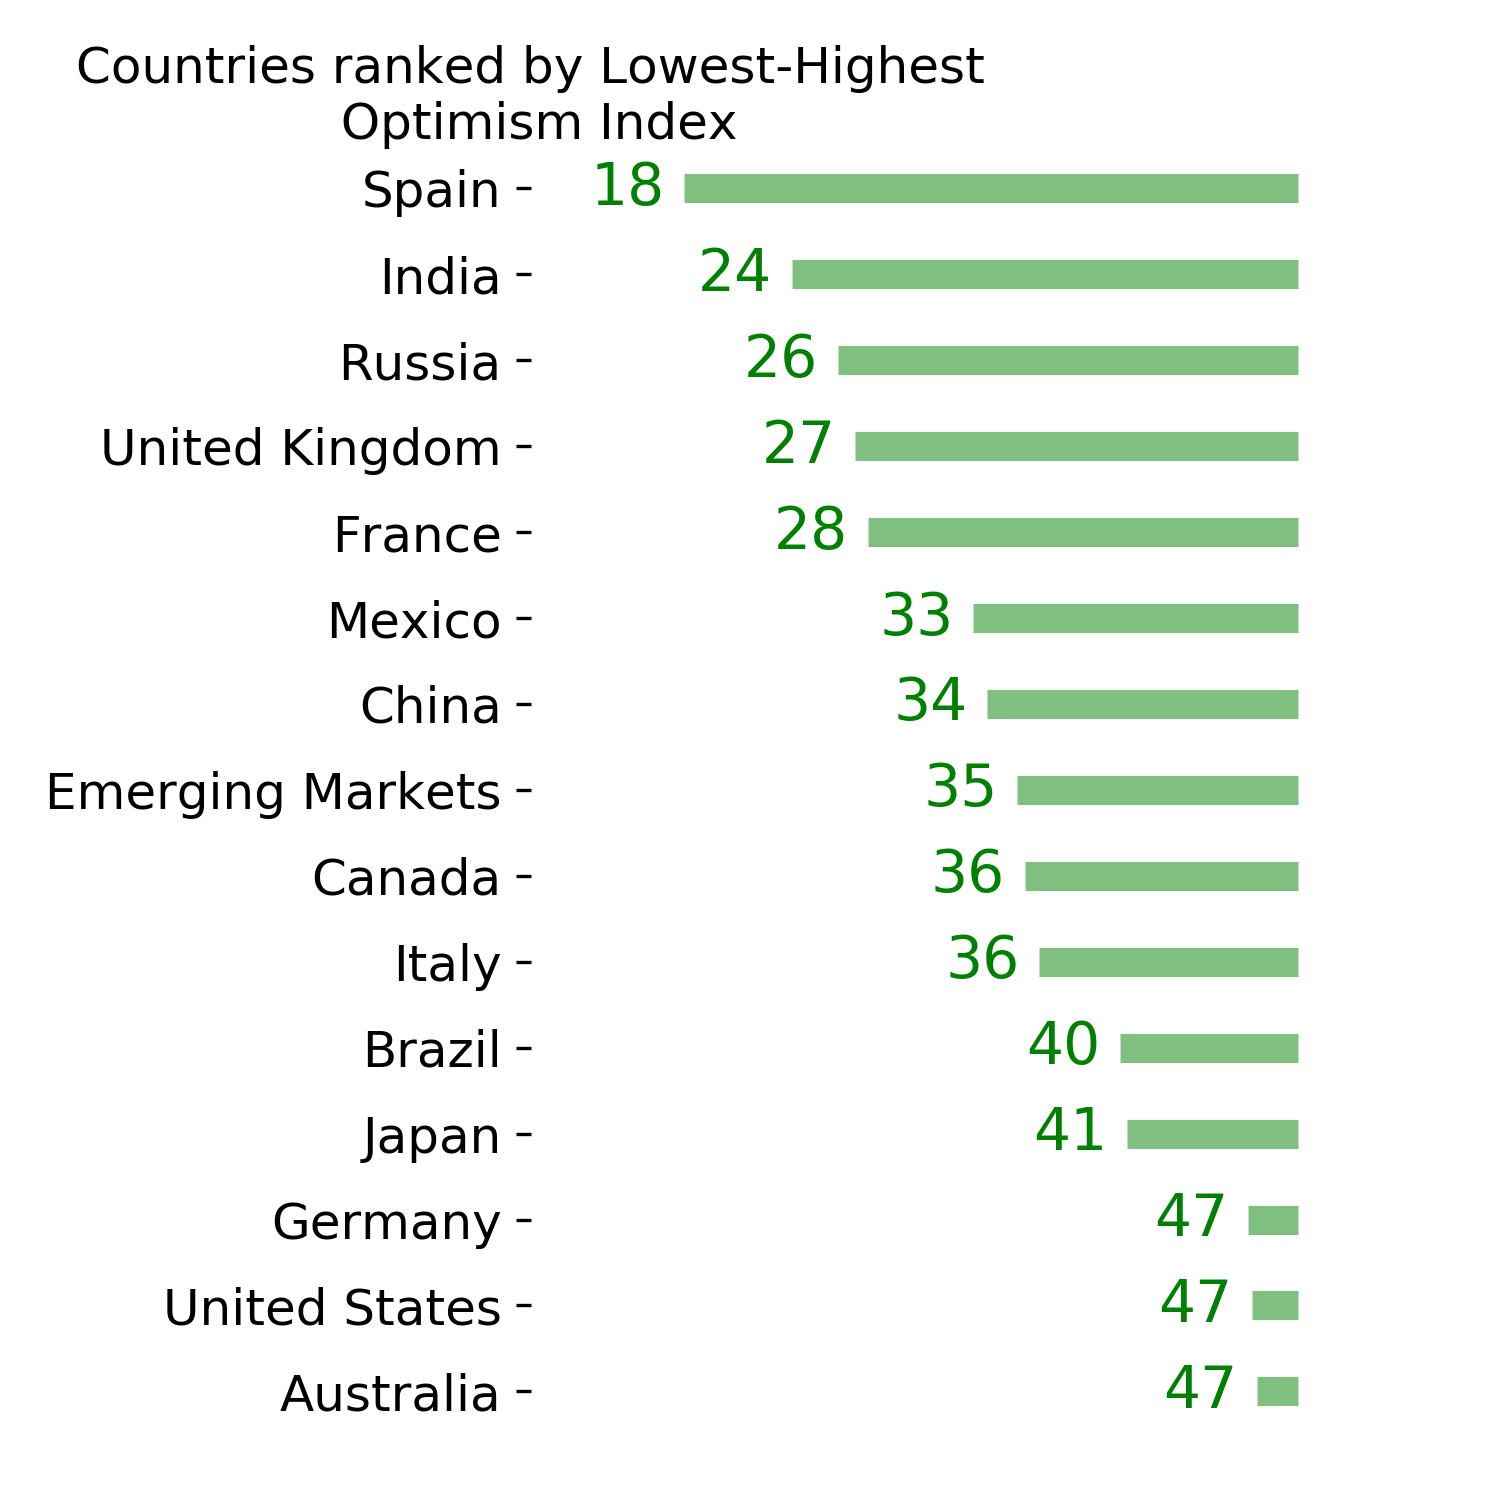
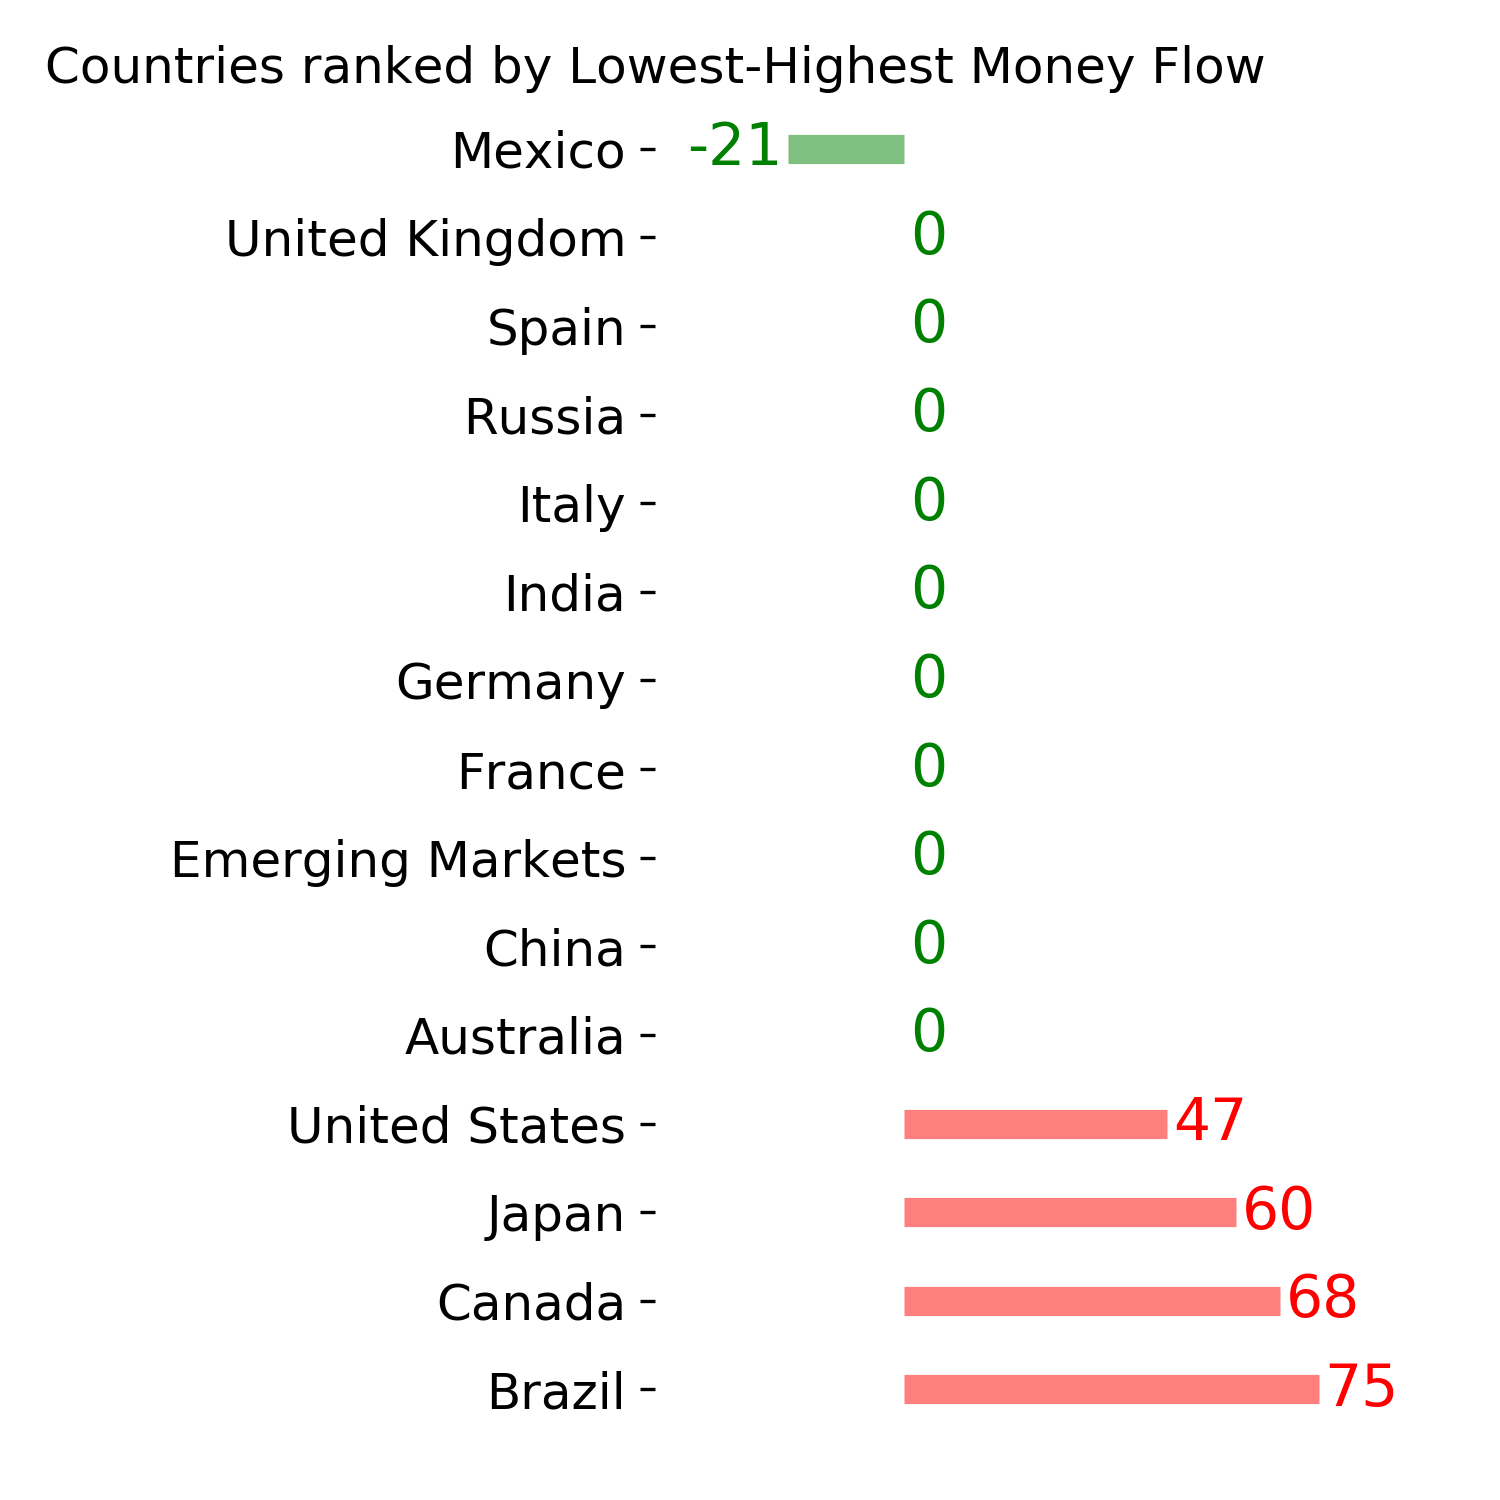
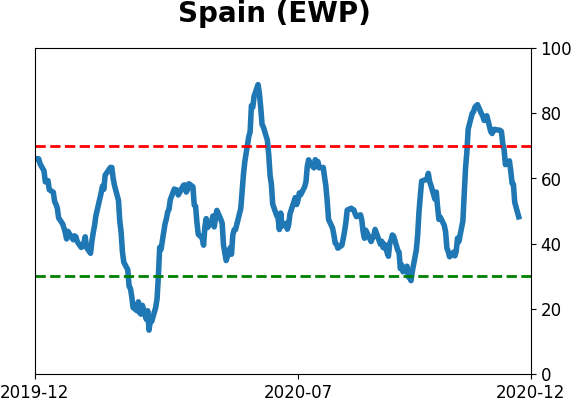
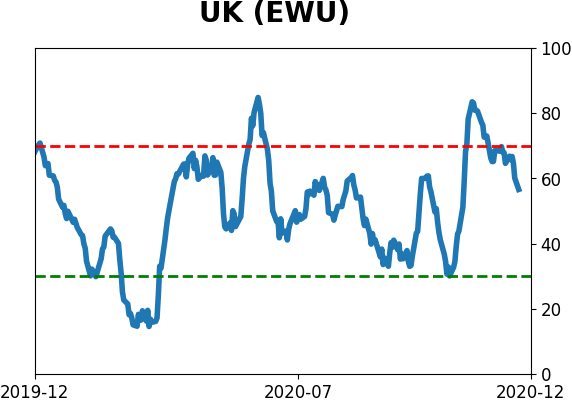
Country ETF's - 10-Day Moving Average
|
|
|
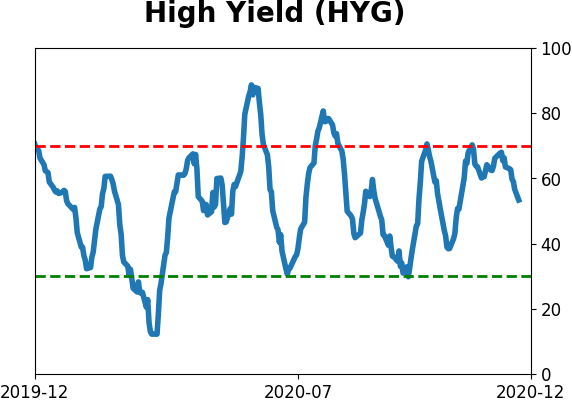
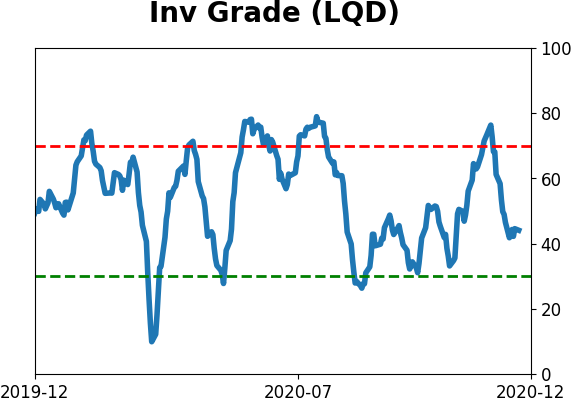
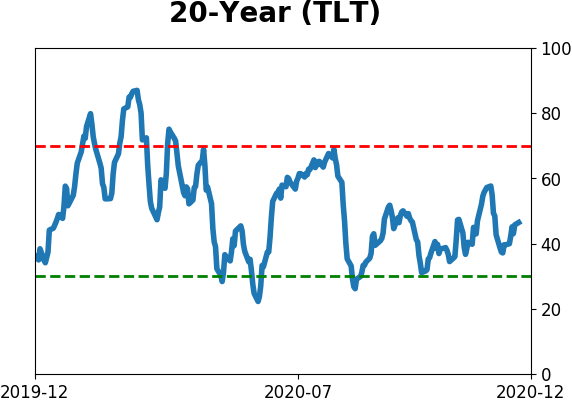
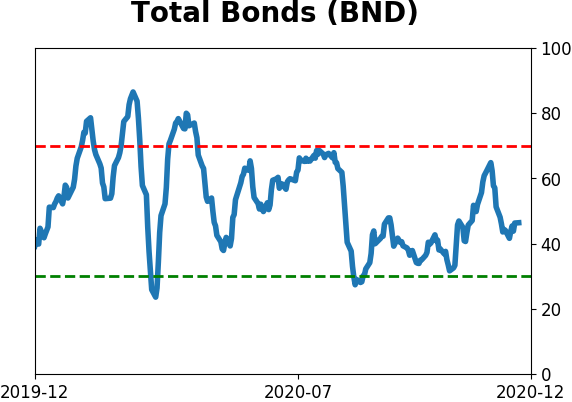
Bond ETF's - 10-Day Moving Average
|
|
|
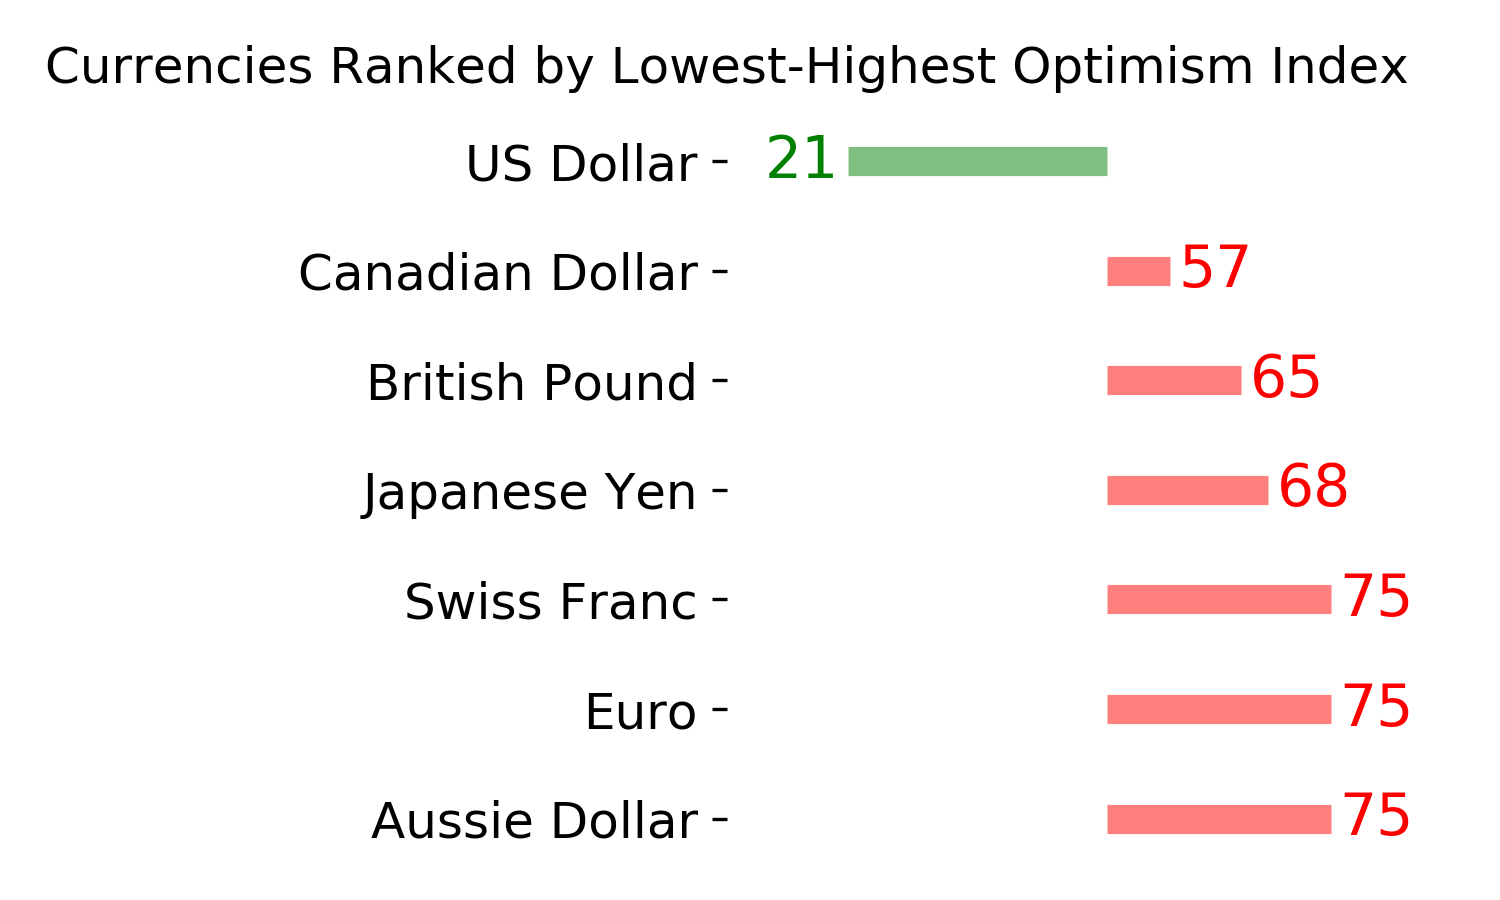
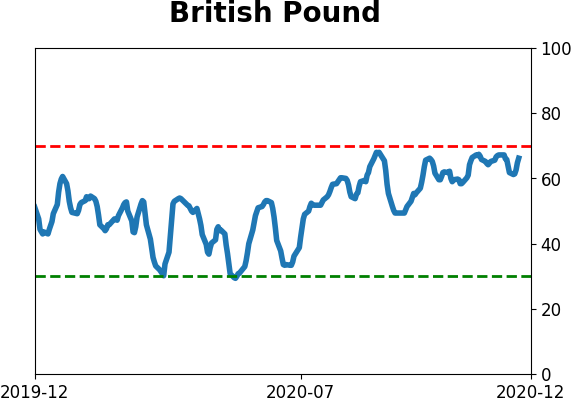
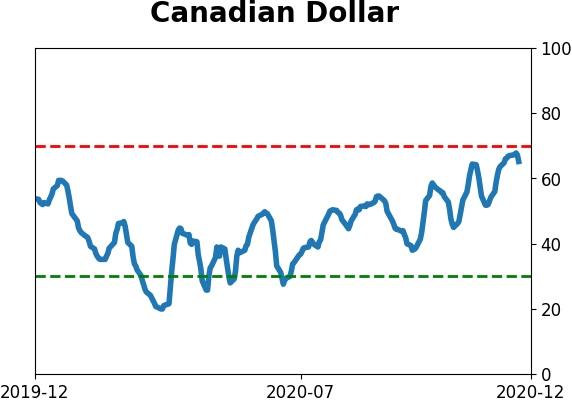
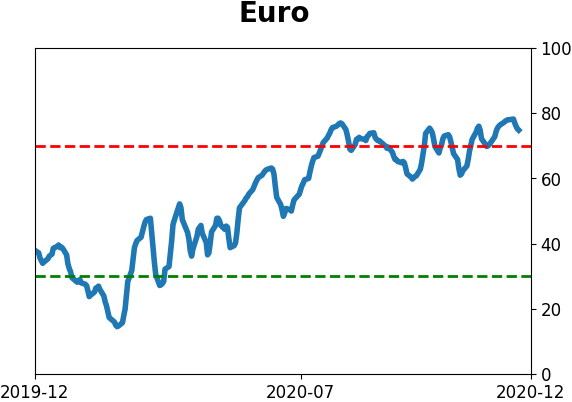
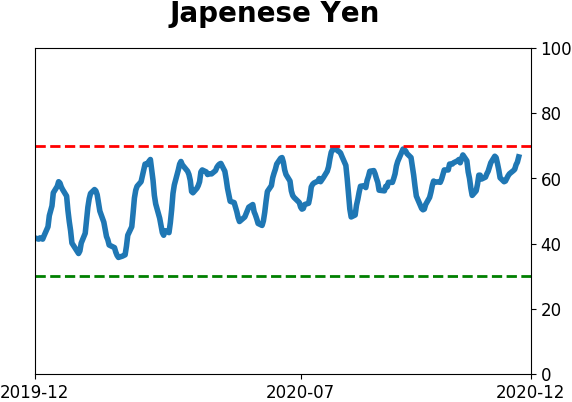
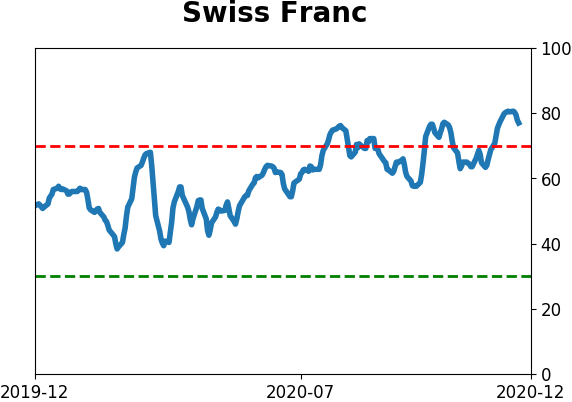
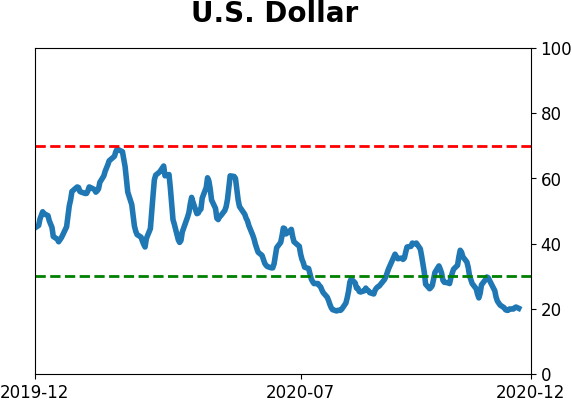
Currency ETF's - 5-Day Moving Average
|
|
|
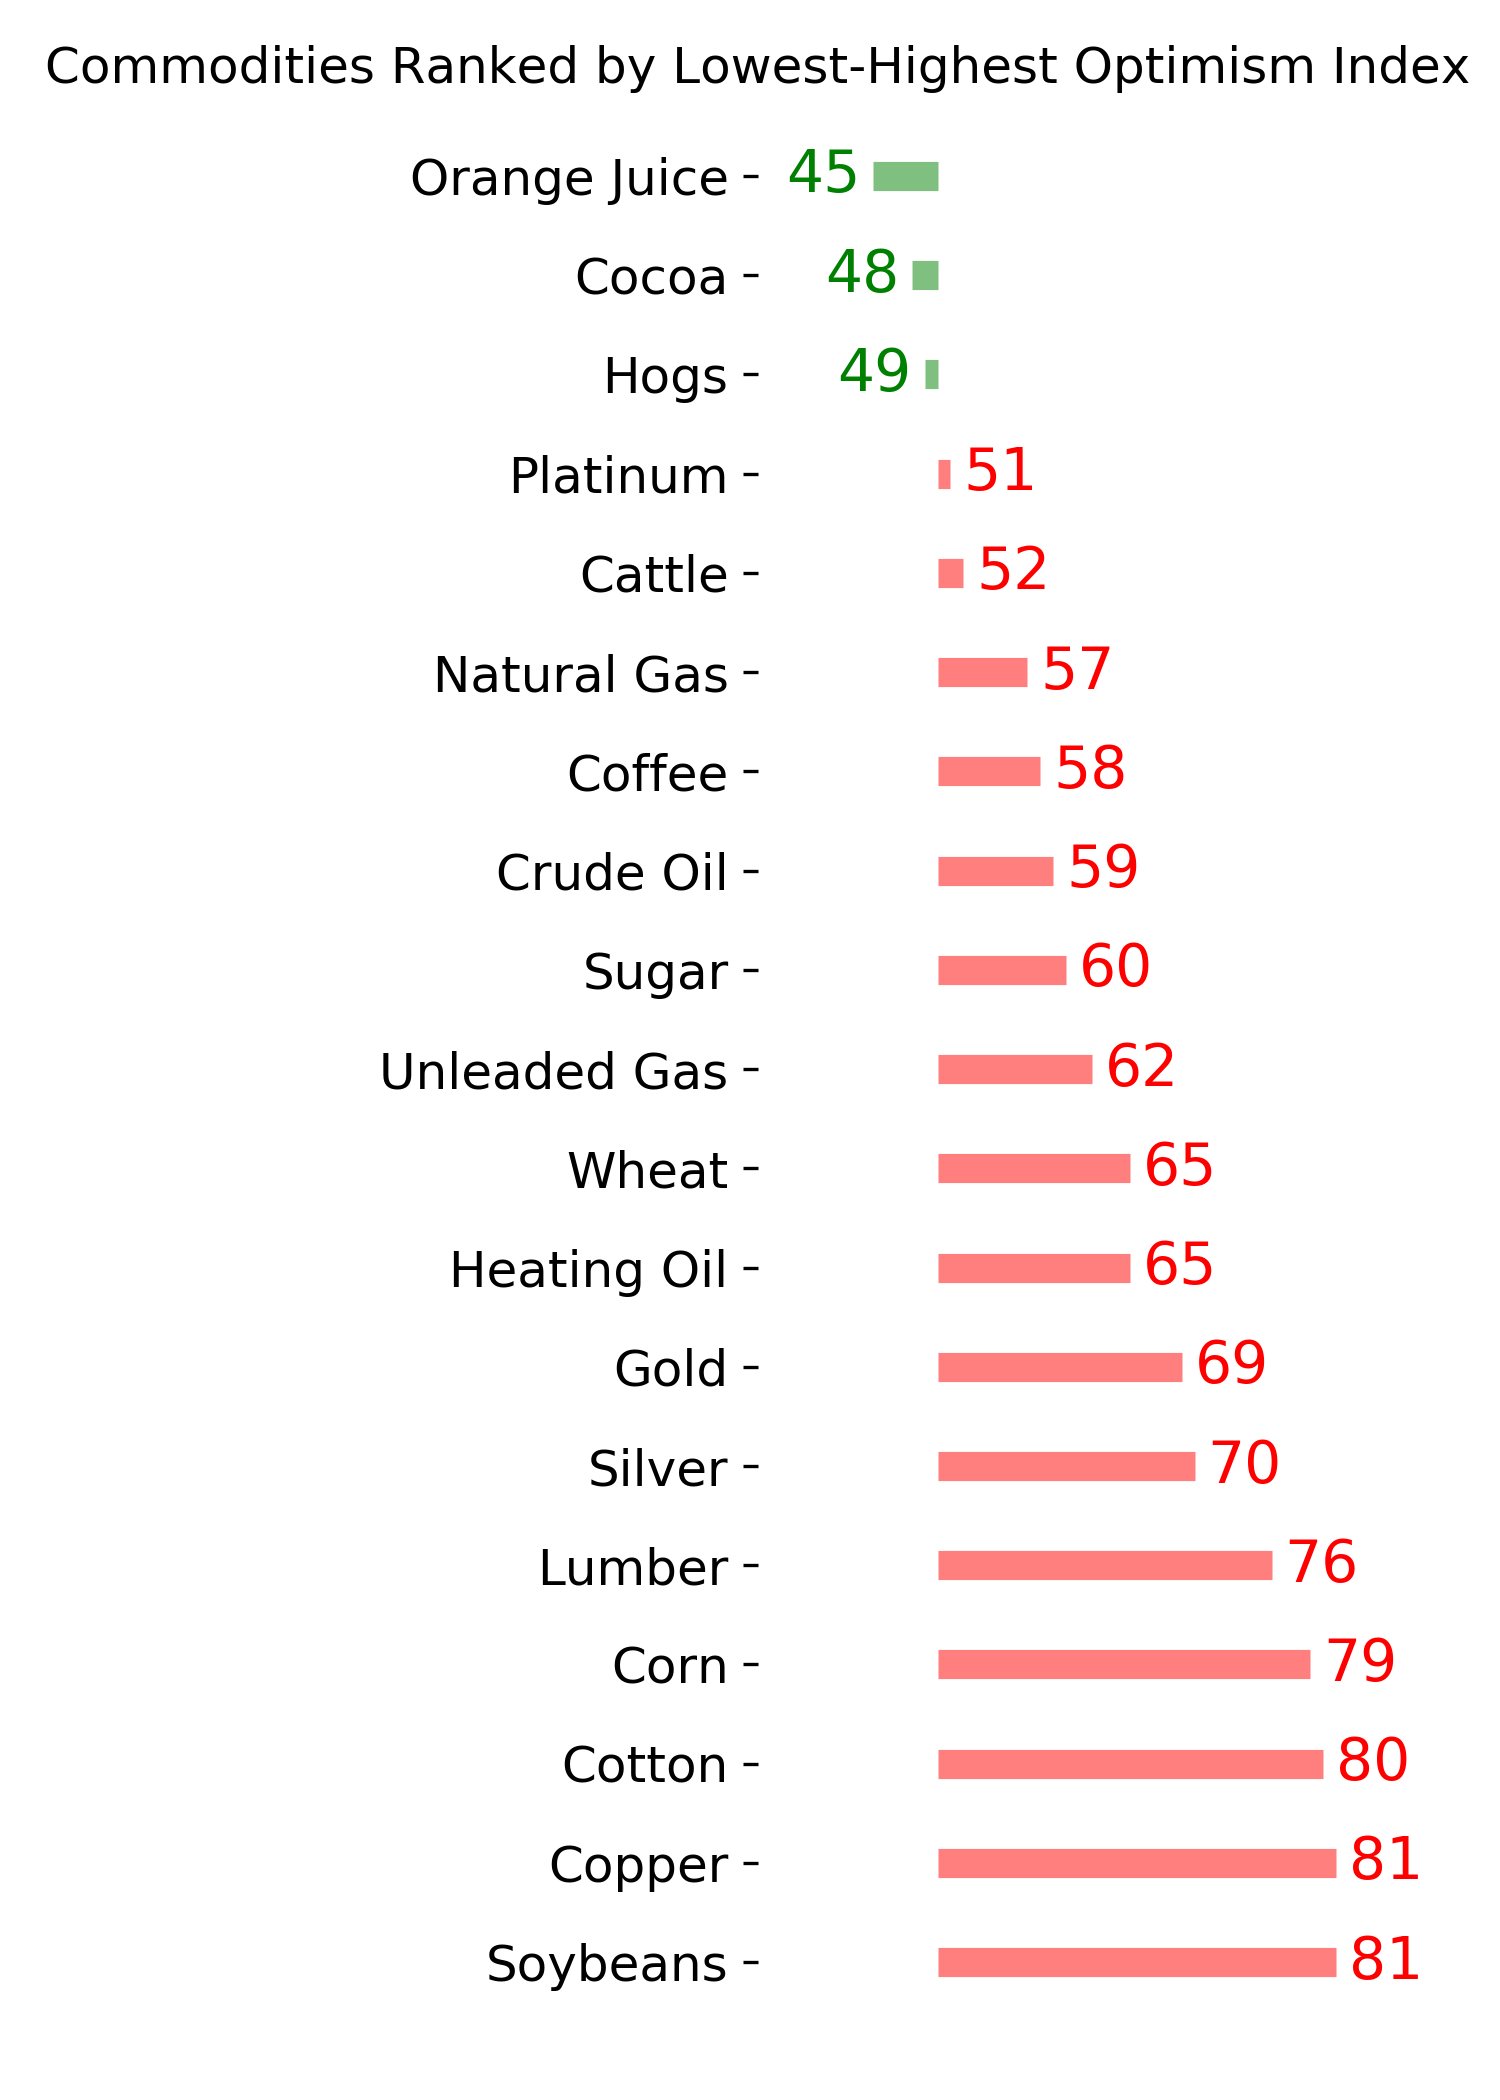
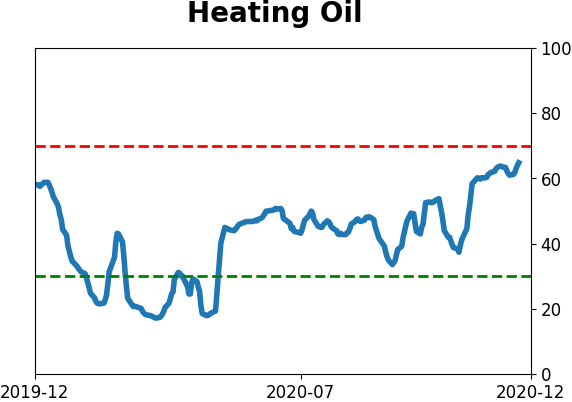
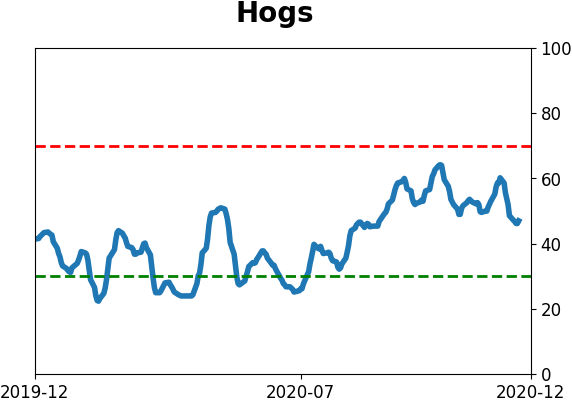
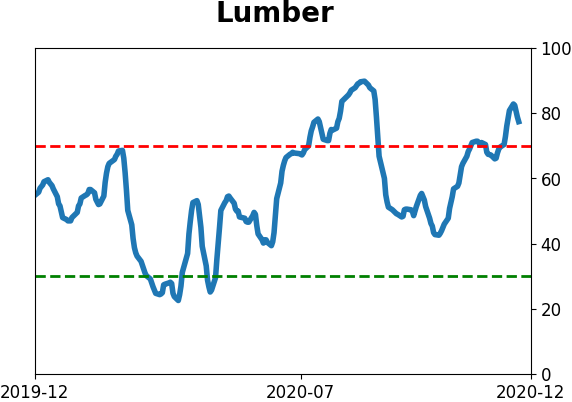
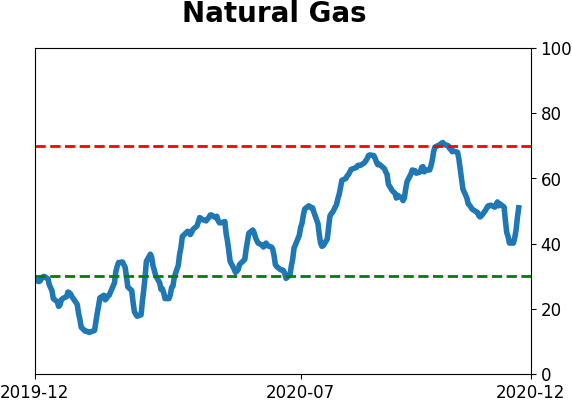
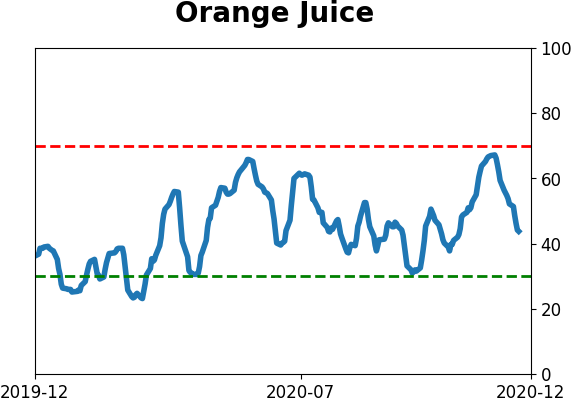
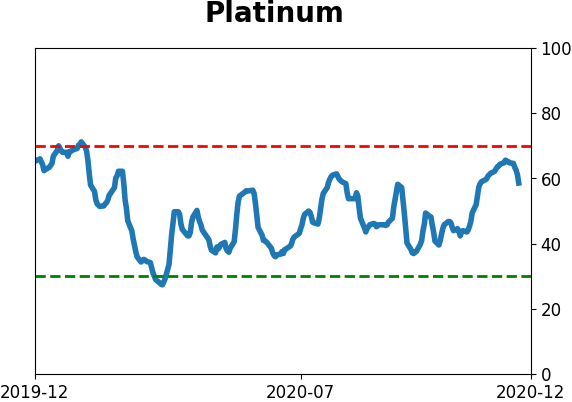
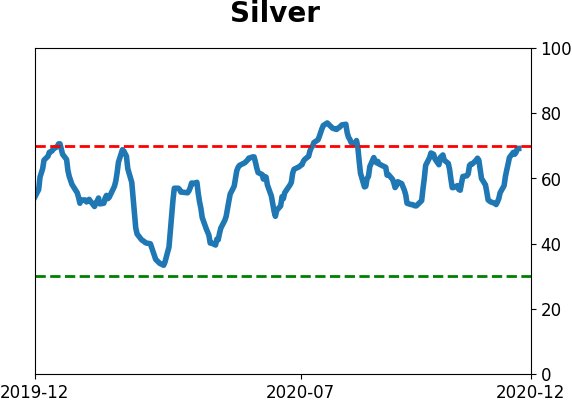
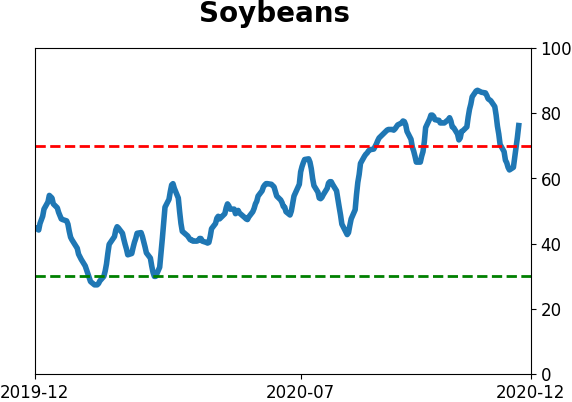
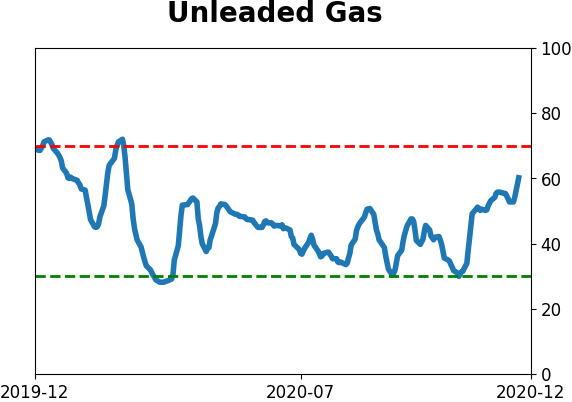
Commodity ETF's - 5-Day Moving Average
|
|