Headlines
|
|
Wall Street (and Twitter) is about as bullish as can be:
Wall Street strategists are expecting another good year in 2021, with more than a 10% gain expected. That's among the most aggressive price targets in 20 years at this point in the year. Analysts are getting very bullish, too. Twitter users are also very optimistic, with more positive than negative tweets about the "big four" equity index ETFs.
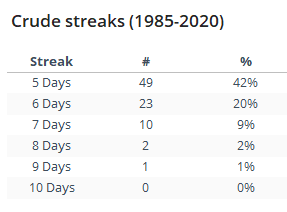
A slick rally: Crude oil futures have strung together 4 straight up days, closing at a 3-month high on Thursday. These streaks have a decent record at leading to longer-term rallies, but bulls shouldn't count too heavily on the streak lasting much longer. It rallied 4 days in a row to a multi-month high 116 times. Once it went 4 days in a row, it managed another up day 49 times. It went 6 days only 20% of the time, and dropped off dramatically after that.
Bottom Line:
- The market environment is pristine, but with near-historic optimism, gains tend to be muted, with a high probability of being reversed at some point over the ensuing weeks.
|
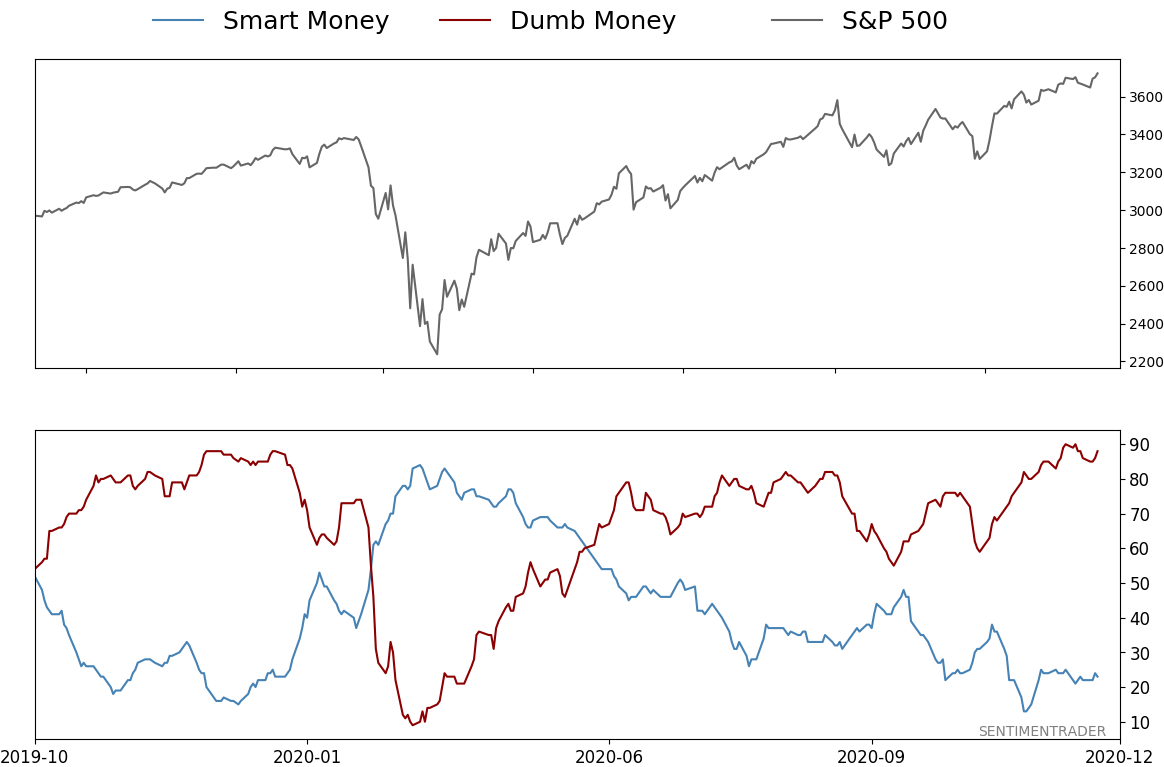
Smart / Dumb Money Confidence
|
Smart Money Confidence: 23%
Dumb Money Confidence: 88%
|
|
Risk Levels
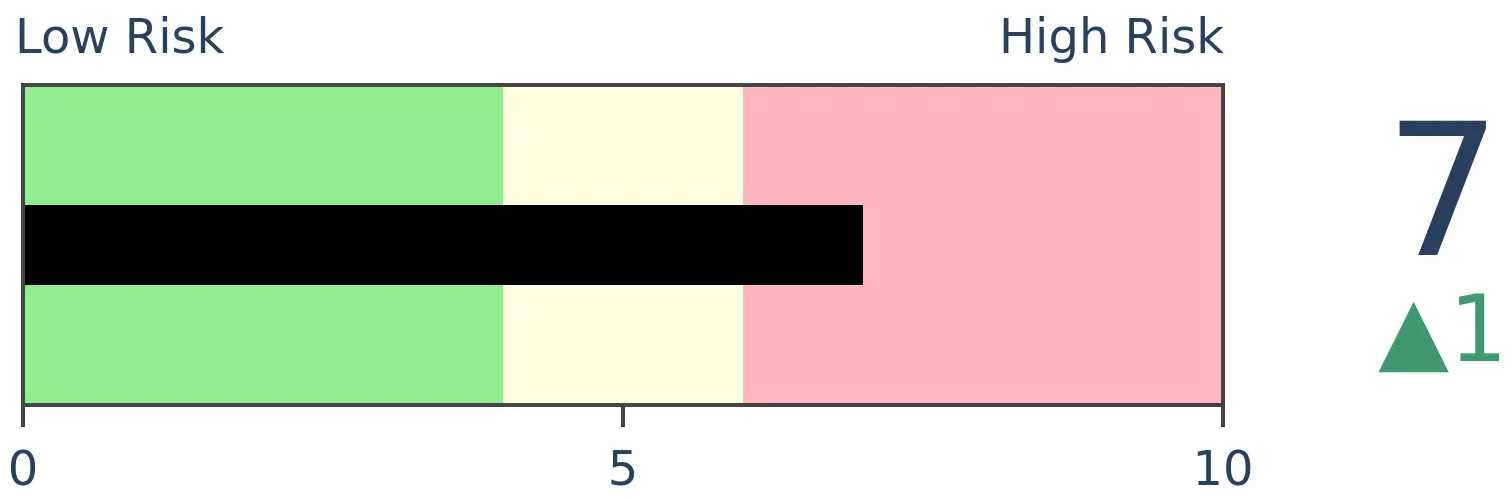
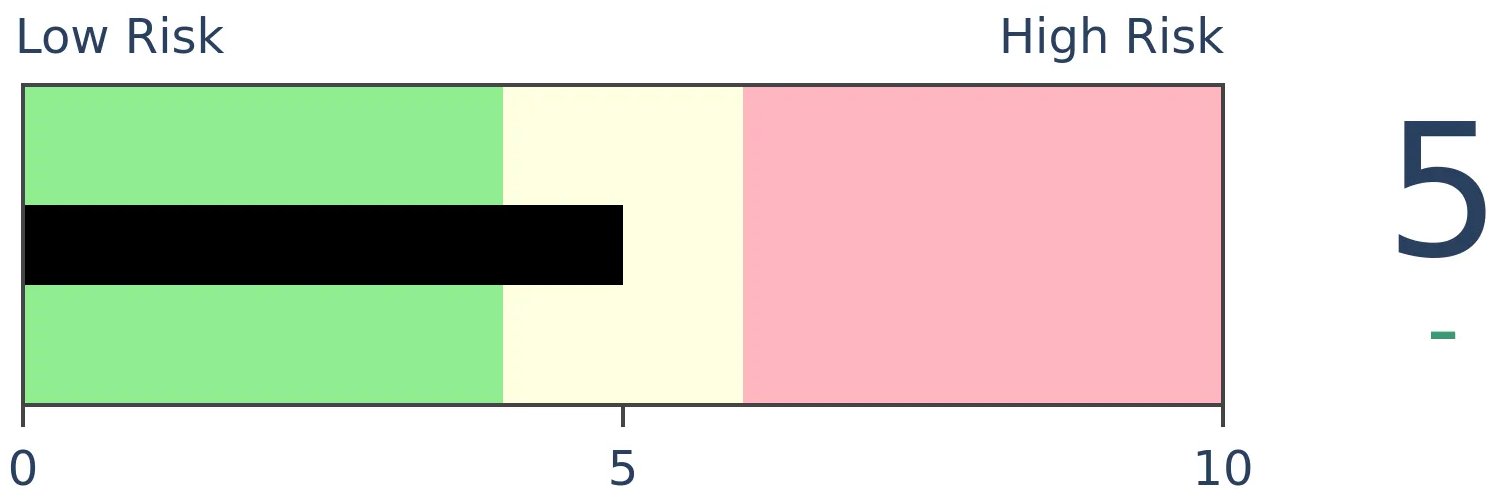
Stocks Short-Term
|
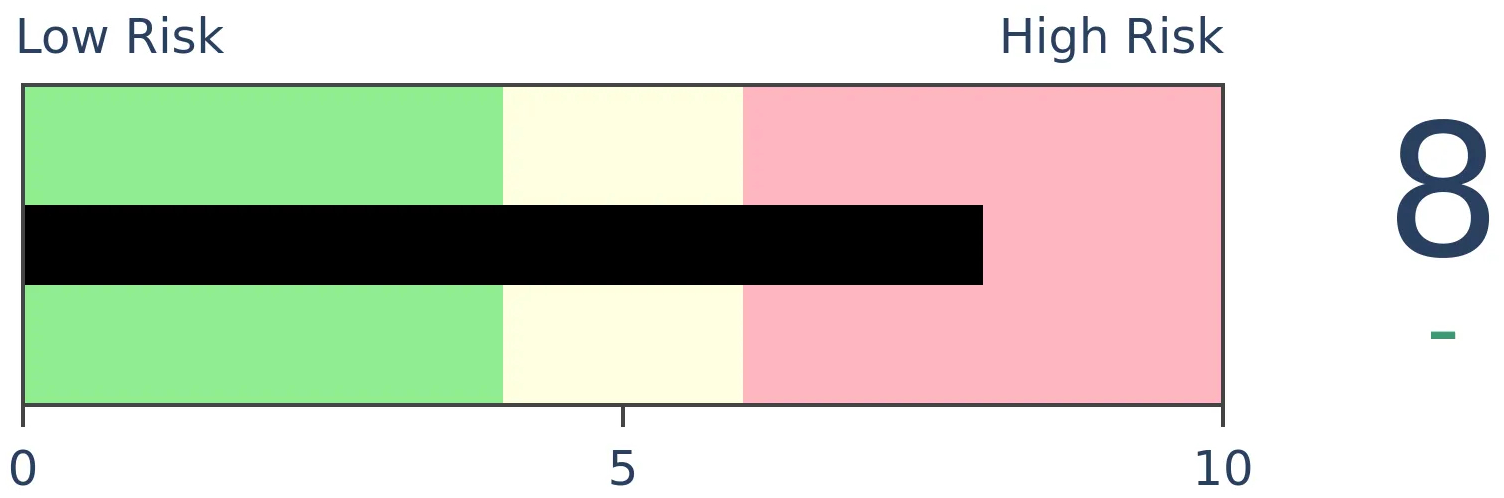
Stocks Medium-Term
|
|
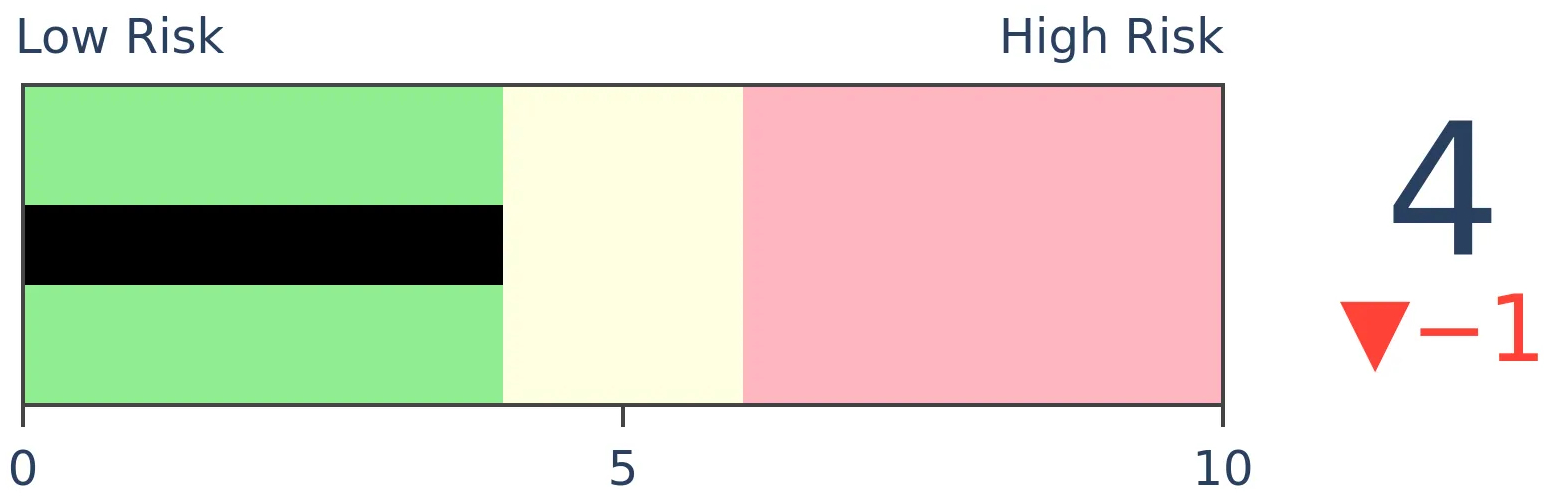
Bonds
|
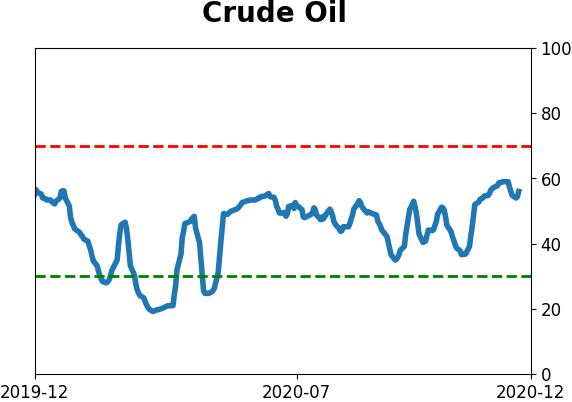
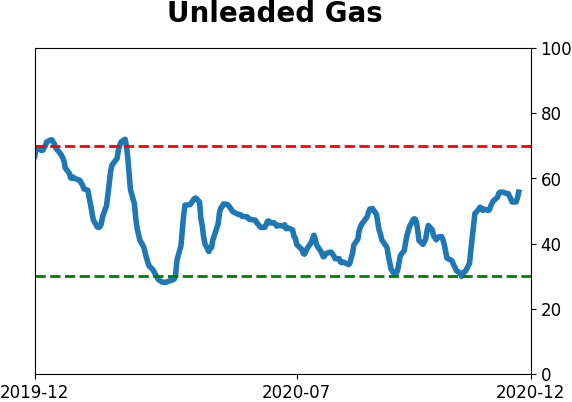
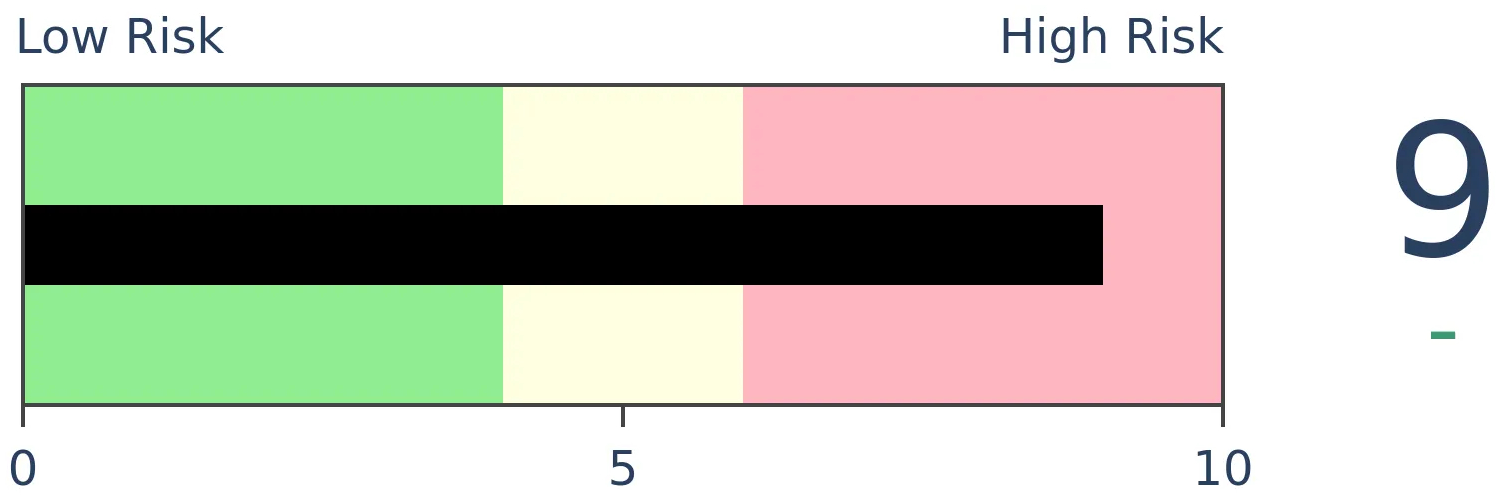
Crude Oil
|
|
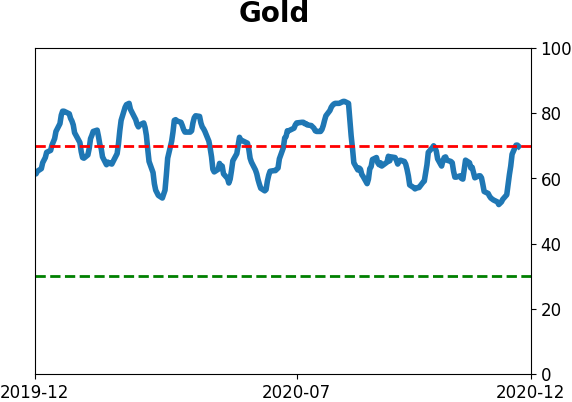
Gold
|
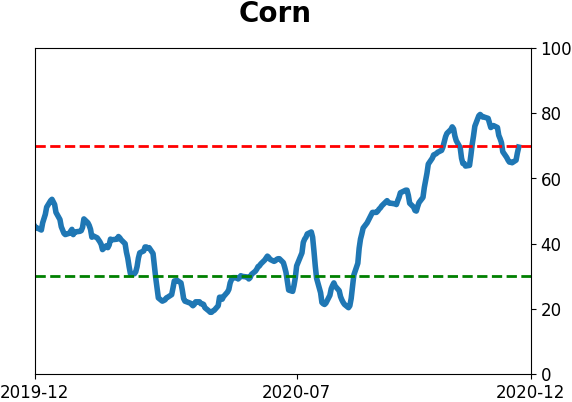
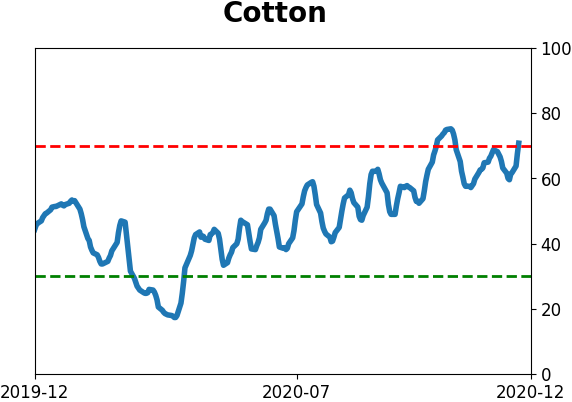
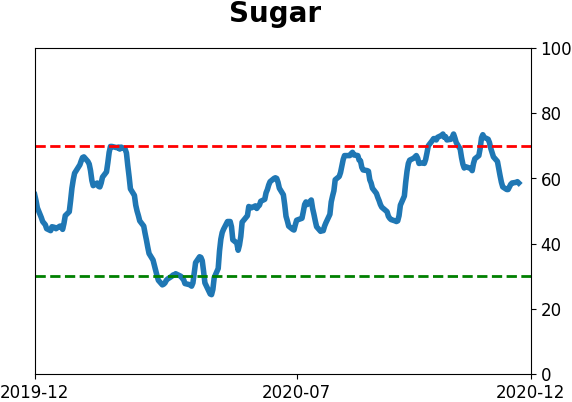
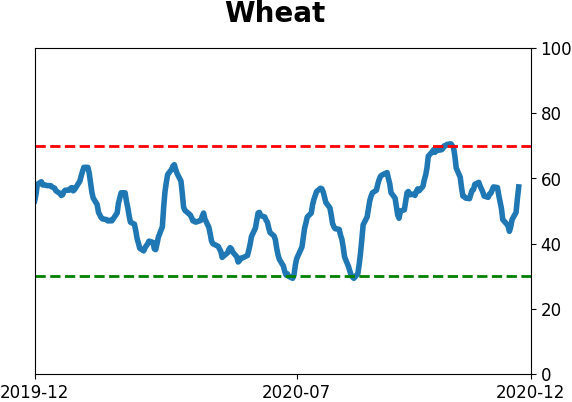
Agriculture

|
|
Research
BOTTOM LINE
Wall Street strategists are expecting another good year in 2021, with more than a 10% gain expected. That's among the most aggressive price targets in 20 years at this point in the year. Analysts are getting very bullish, too. Twitter users are also very optimistic, with more positive than negative tweets about the "big four" equity index ETFs.
FORECAST / TIMEFRAME
None
|
This is the time of year to be thankful for what we have, make resolutions for improvement, and update our price targets for the S&P 500. Okay, maybe not that last one for most of us, but it's a must-do for many strategists on Wall Street.
According to the latest Bloomberg tally of prominent strategists on the Street, they're expecting the S&P 500 to gain a further 10% in 2021, a big jump from recent surveys.
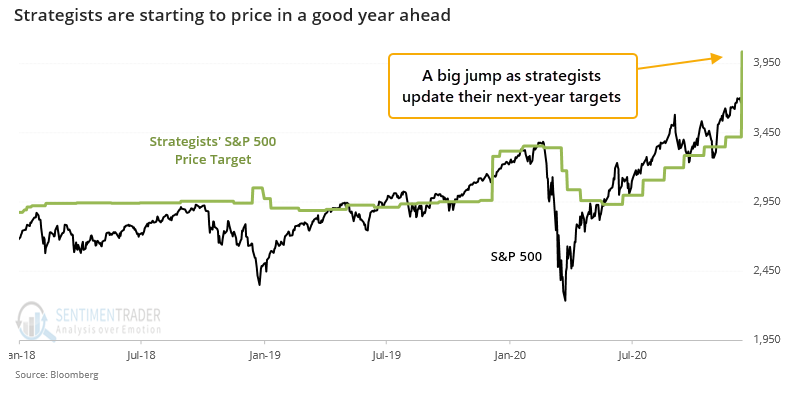
We've looked at this many times in the past, and an expected gain of around 9% is pretty typical, no matter what the market did in the current year. Still, a 10% jump for the next year is a bit aggressive, and they're updating their forecasts earlier than usual. That could be a coincidence, and it could not be.
Whatever the reason, it's among the biggest jumps that strategists have ever priced in by mid-December. Other times they foresaw a big gain for the following year, the next 1-3 months were spotty.
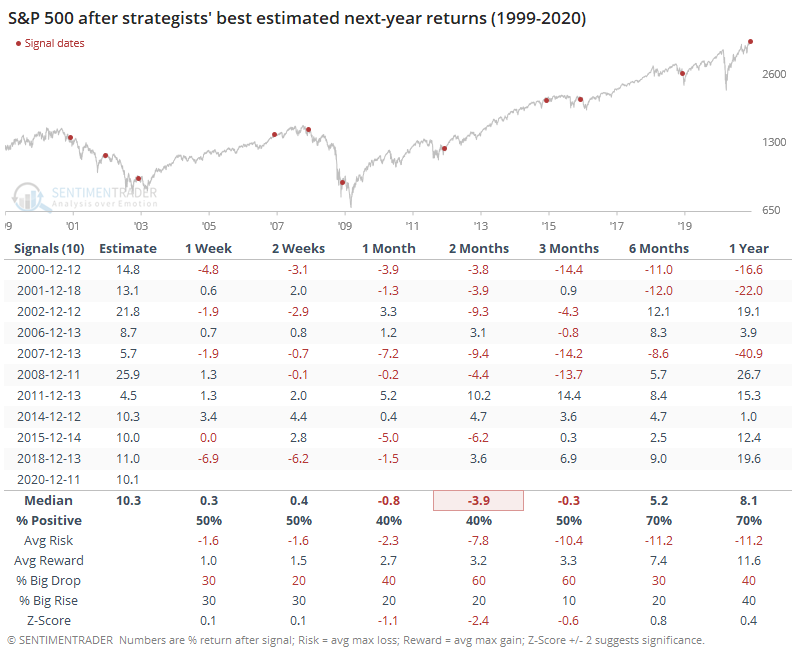
Out of the 10 signals, 8 of them showed a negative return somewhere between 1-3 months later. One of them showed a mild gain, while the other (2012) followed through very well on those positive expectations.
If we contrast to those years when strategists were the most conservative with their estimates, then we can see that there was a stark difference in forward returns.
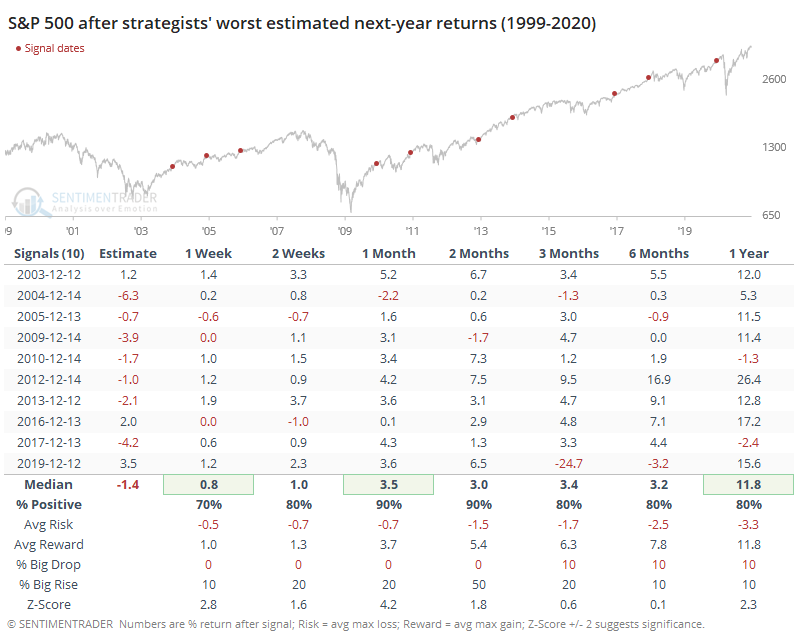
When strategists were expecting only a small gain, or an outright loss, in the S&P over the next year, then it bucked those expectations essentially every time over the next 1-2 months.
Some of this is dependent upon when Bloomberg surveys the strategists, and when those folks decide to update their forecasts. Some of them don't do so until the very end of the year, or even until the beginning of the new one, so the timing of when most strategists have updated their next-year price targets is inconsistent.
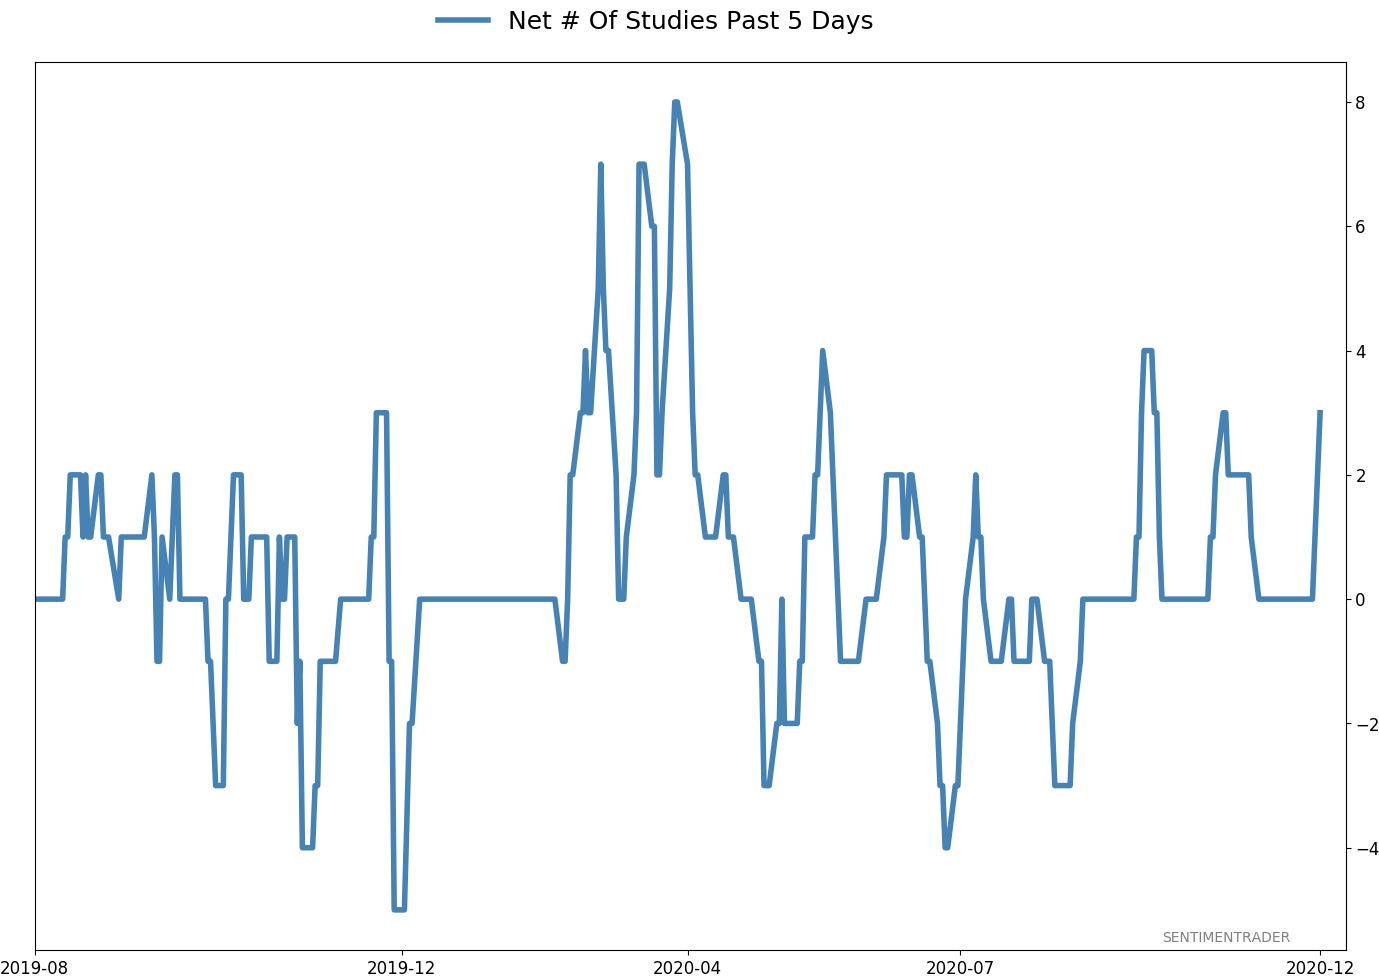
Analysts on Wall Street have been busy upgrading the price targets on their stocks, too. Strategists tend to work from the top down; analysts from the bottom up. From both directions, Wall Street is extremely optimistic.
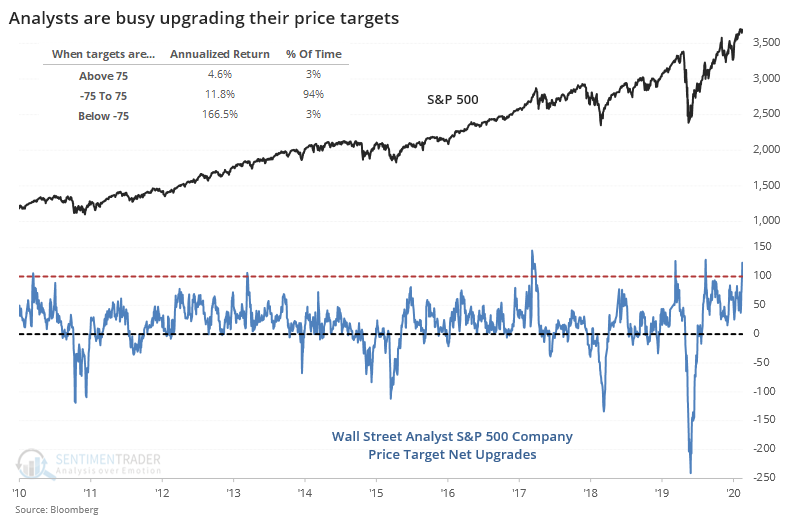
When analysts had upgraded a net 75 or more stocks on average over the past few days, the S&P returned an annualized +4.6%, well below times when analysts were sitting on their hands.
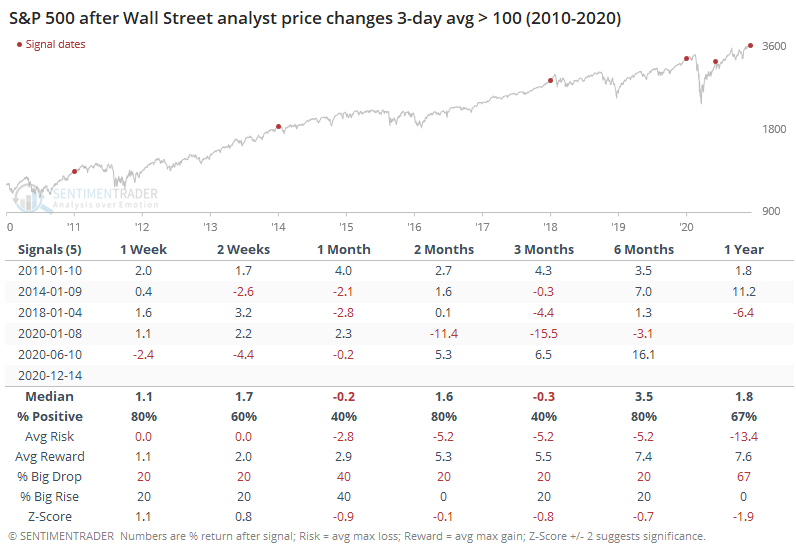
Other times the 3-day average of net upgrades first exceeded 100 stocks, the S&P stumbled 4 out of 5 times.
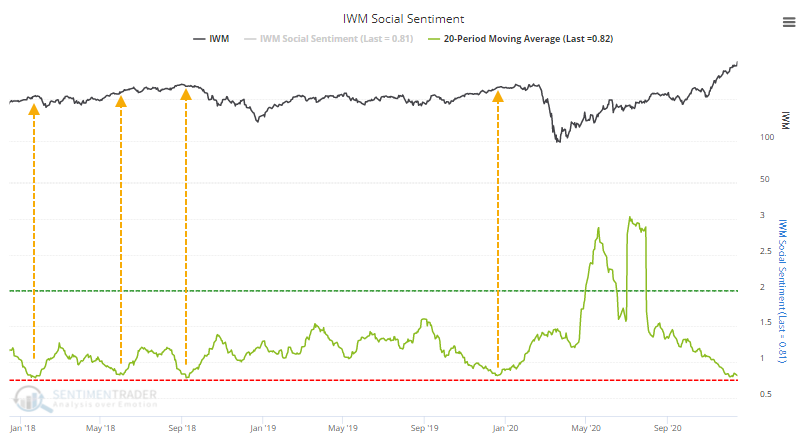
Twitter users seem to be just as bulled up as Wall Street strategists. Looking at Social Sentiment for the go-to small-cap fund, IWM, the 20-day average is nearing its lowest level in years. This is measured like a put/call ratio, with high readings meaning many more negative tweets than positive ones, and vice-versa. You can watch Eric's doctorate defense here for more information about how this is derived.
It's not just IWM that Twitter users are positive on, it's also SPY, QQQ, and DIA. The 20-day average Social Sentiment among these "big four" indexes is now among the lowest - most optimistic - in years.
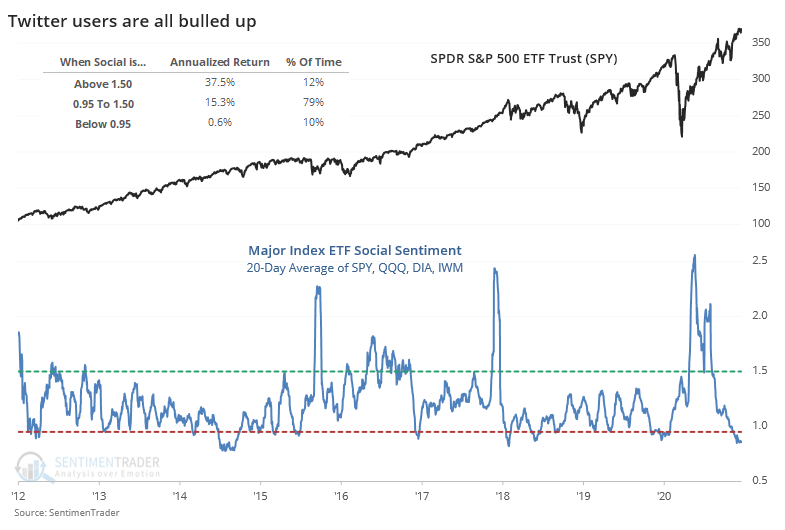
When the 20-day average score of these four major ETFs was above 1.5, meaning there were 50% more bearish tweets than positive ones, then SPY's annualized return was an impressive +37.5%. When the score was below 0.95, then its return was only +0.6%.
The calendar can influence some screwy trading activity as we near the end of a year, and start a new one, and several times in the past decade, we've seen stocks levitate in the face of extreme sentiment until the calendar turned. While there are always a few exceptions, we're currently seeing some of the most optimistic readings in 20 years, and that kind of behavior has almost always led to muted shorter-term gains that were erased at some point in the coming month(s) during a pullback. The sudden jump in optimism on Wall Street is another brick in the worry wall.
Active Studies
| Time Frame | Bullish | Bearish | | Short-Term | 0 | 0 | | Medium-Term | 4 | 0 | | Long-Term | 47 | 2 |
|
Indicators at Extremes
Portfolio
| Position | Description | Weight % | Added / Reduced | Date | | Stocks | 10.4% VWO, 9.1% XLE, 8.5% RSP, 6.6% PSCE | 34.5 | Reduced 6.7% | 2020-12-14 | | Bonds | 10% BND, 10% SCHP, 10% ANGL | 28.4 | Reduced 0.1% | 2020-10-02 | | Commodities | GCC | 2.4 | Reduced 2.1%
| 2020-09-04 | | Precious Metals | GDX | 8.9 | Added 4.8% | 2020-12-01 | | Special Situations | | 0.0 | Reduced 5% | 2020-10-02 | | Cash | | 25.8 | | |
|
Updates (Changes made today are underlined)
Quite a few of the studies that have been triggering for stocks have showed a poor risk/reward skew over a short- to medium-term time frame, even though many of them have also been quite positive over medium- to long-term time frames. We're in a very favorable seasonal window, so it would be somewhat odd to see a substantial pullback in the next few weeks. Leave it to 2020 to do just that, I suppose, but the calendar is a point in bulls' favor. Even so, record-high-and-declining sentiment, coupled with early signs of a reversal were enough that I reduced my S&P 500 position a bit. I fully expect that the energy funds will suffer some losses in the coming weeks, but as I noted when buying them, they're intended as long-term positions and almost by definition they're going to be volatile. RETURN YTD: 8.5% 2019: 12.6%, 2018: 0.6%, 2017: 3.8%, 2016: 17.1%, 2015: 9.2%, 2014: 14.5%, 2013: 2.2%, 2012: 10.8%, 2011: 16.5%, 2010: 15.3%, 2009: 23.9%, 2008: 16.2%, 2007: 7.8%
|
|
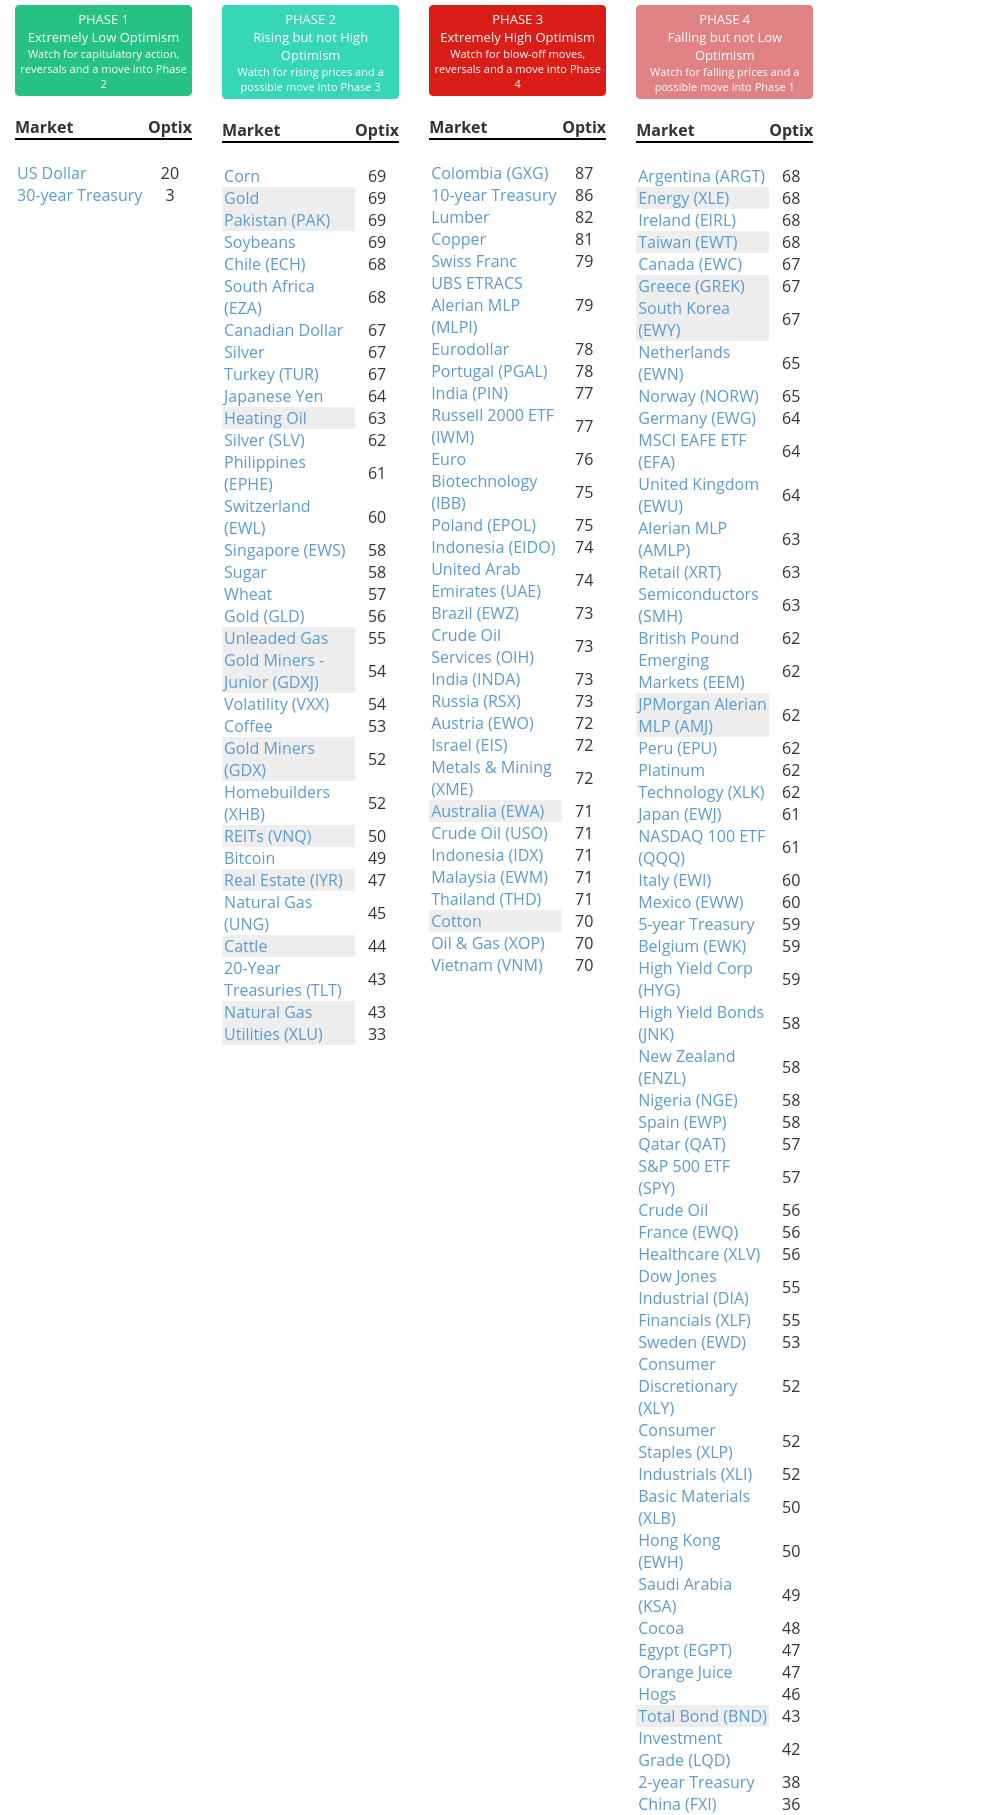
Phase Table
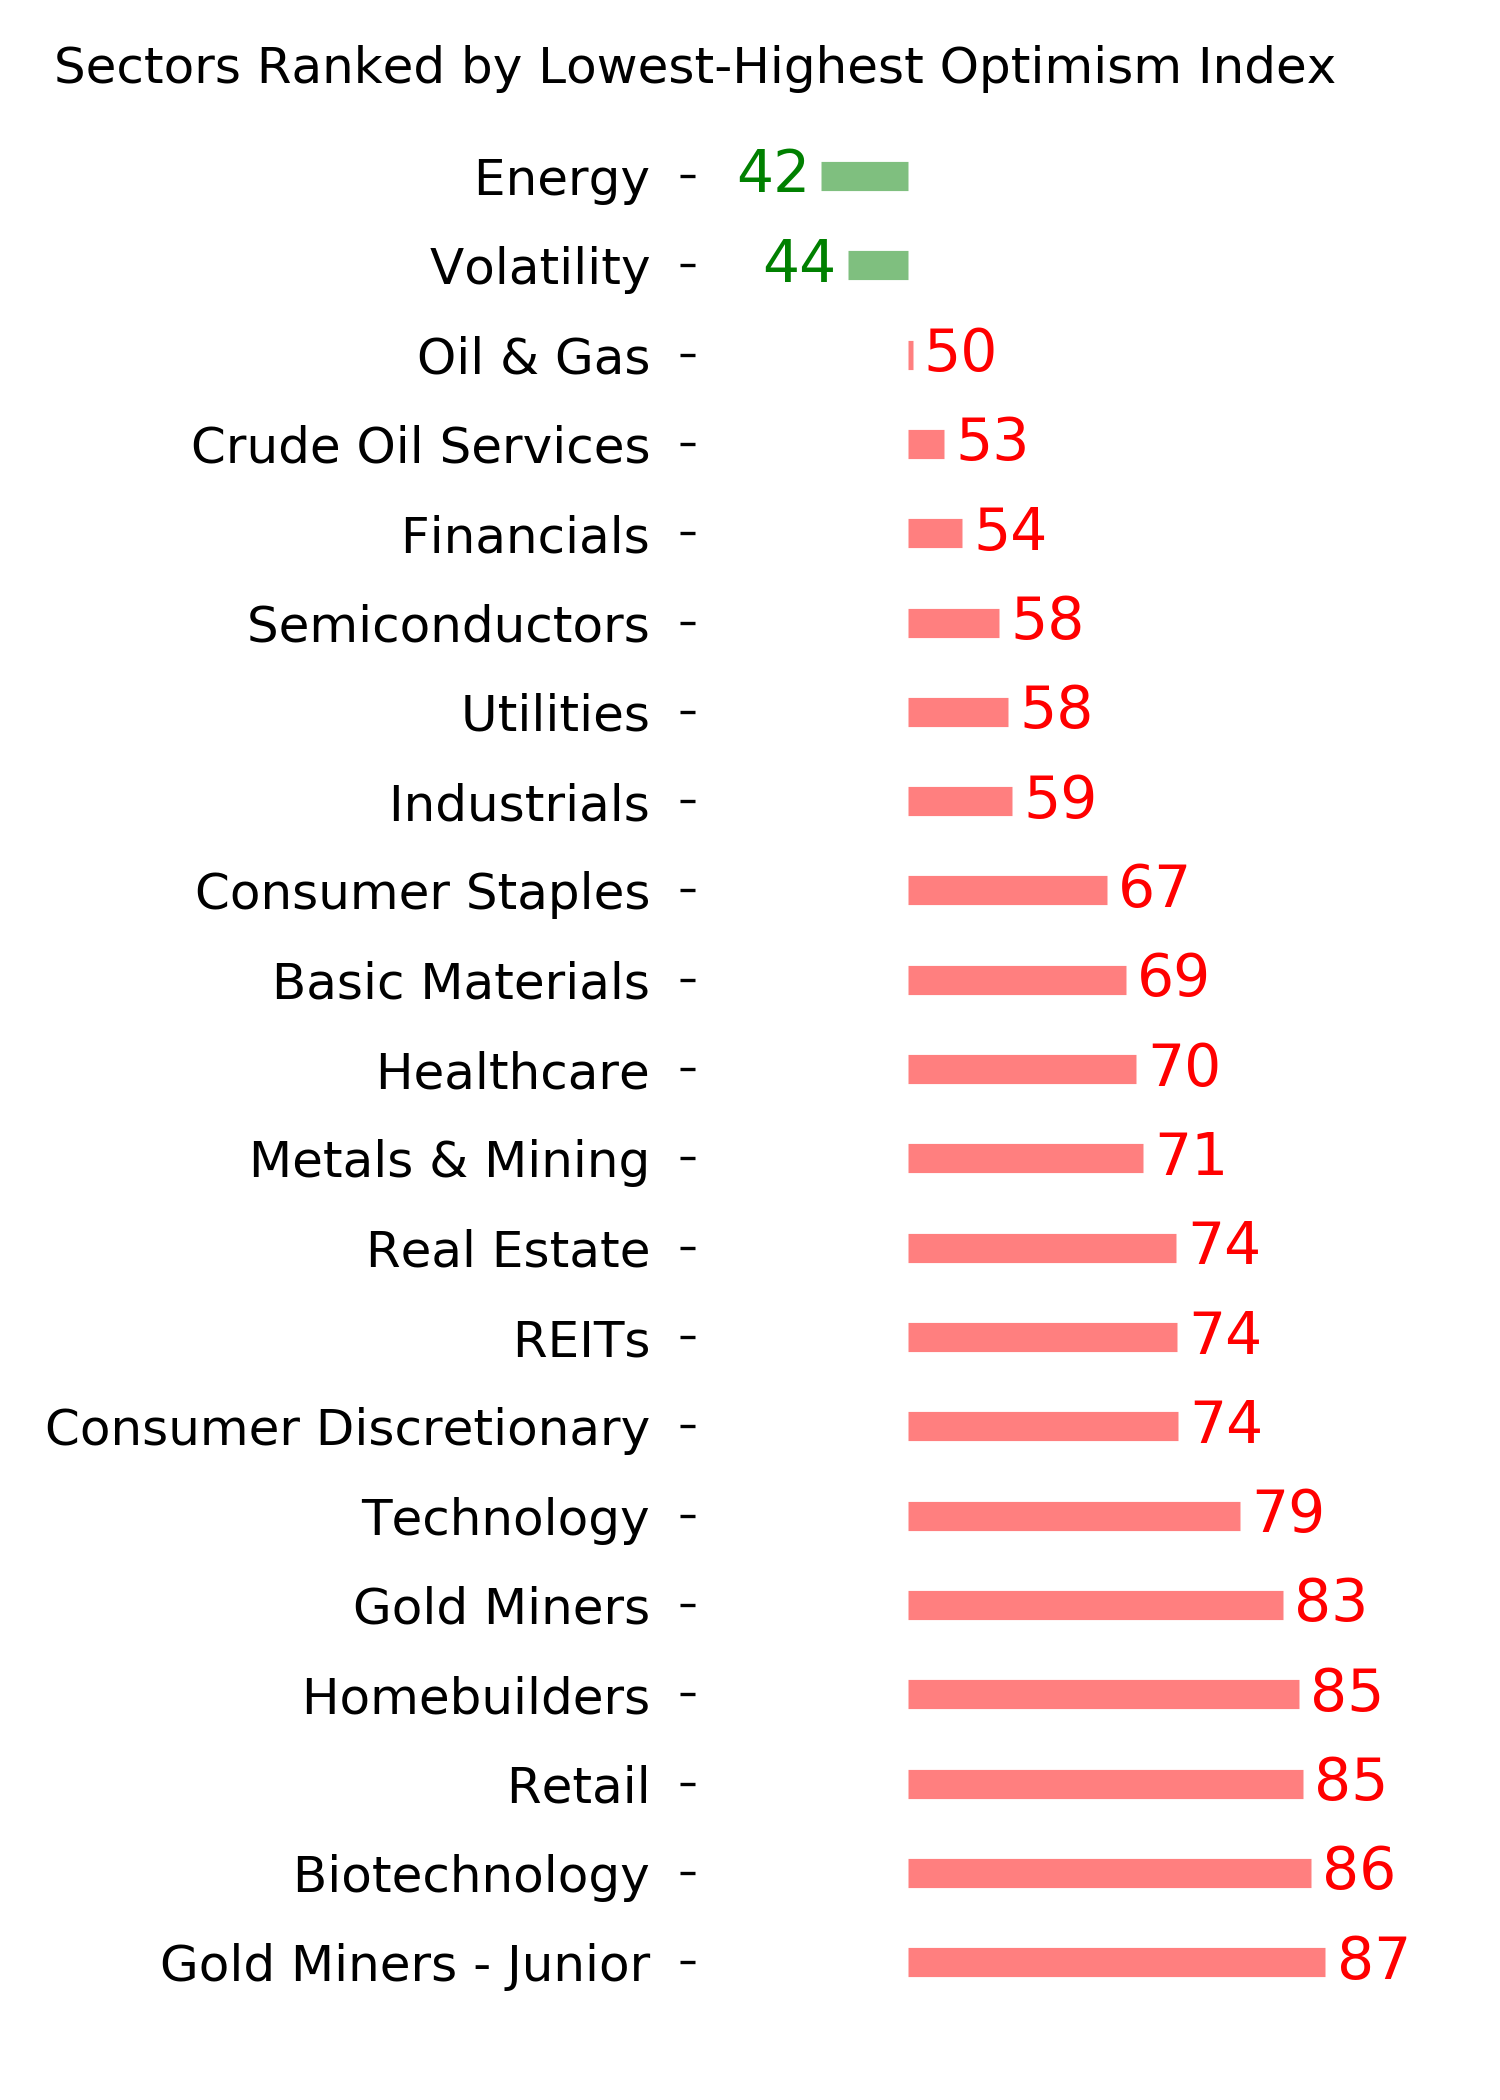
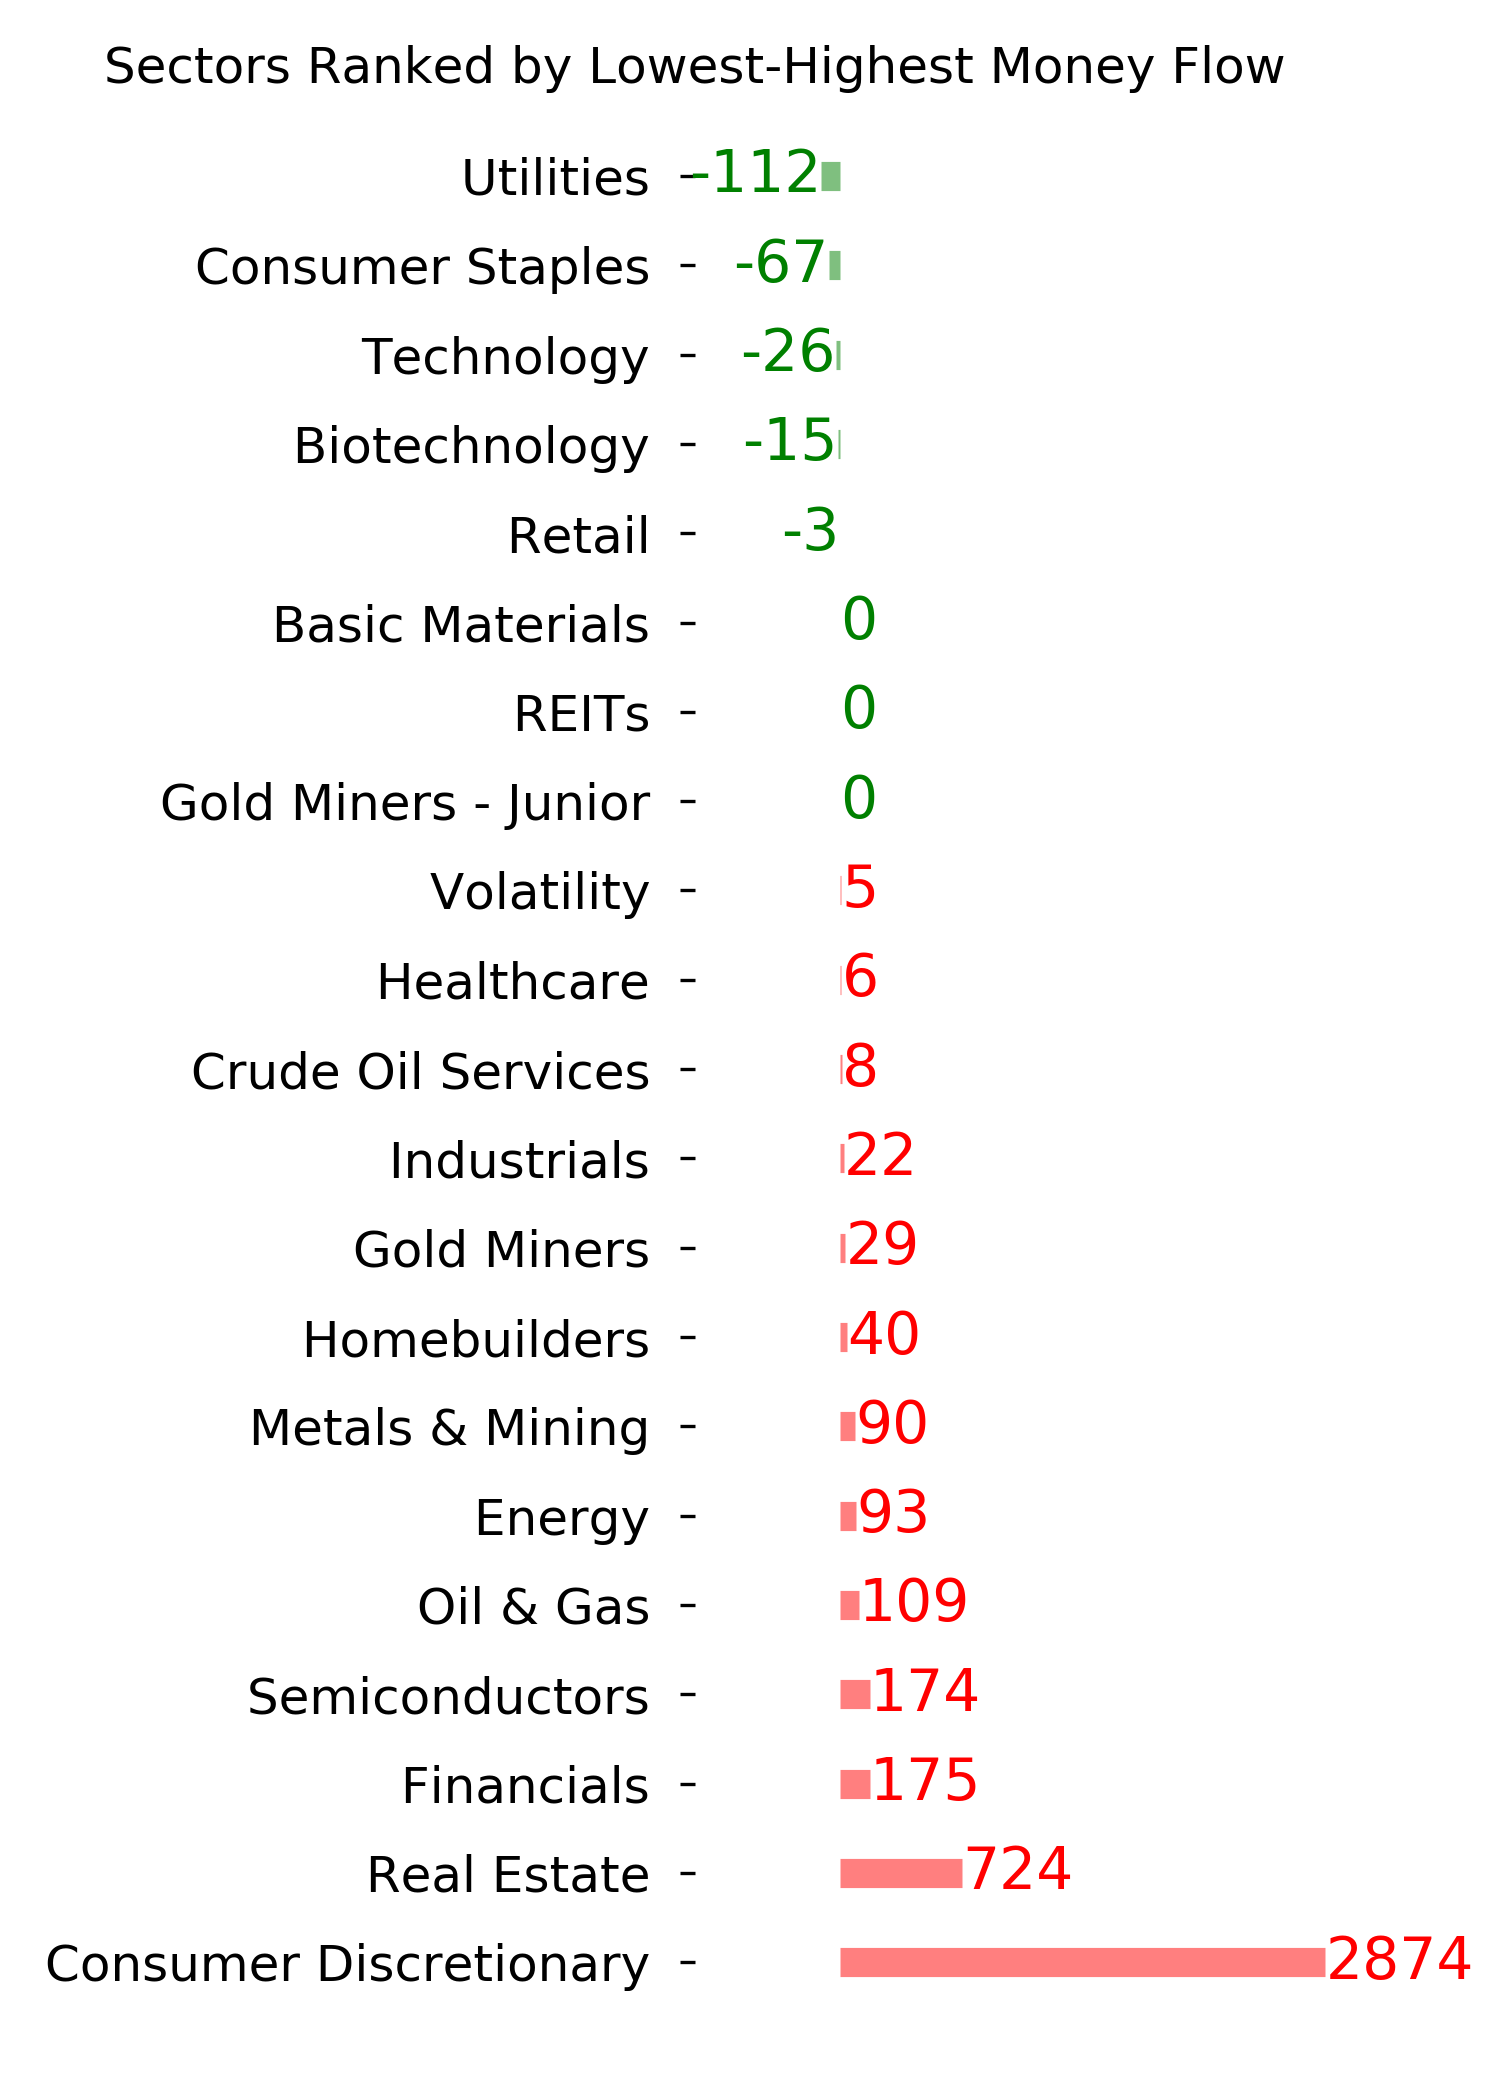
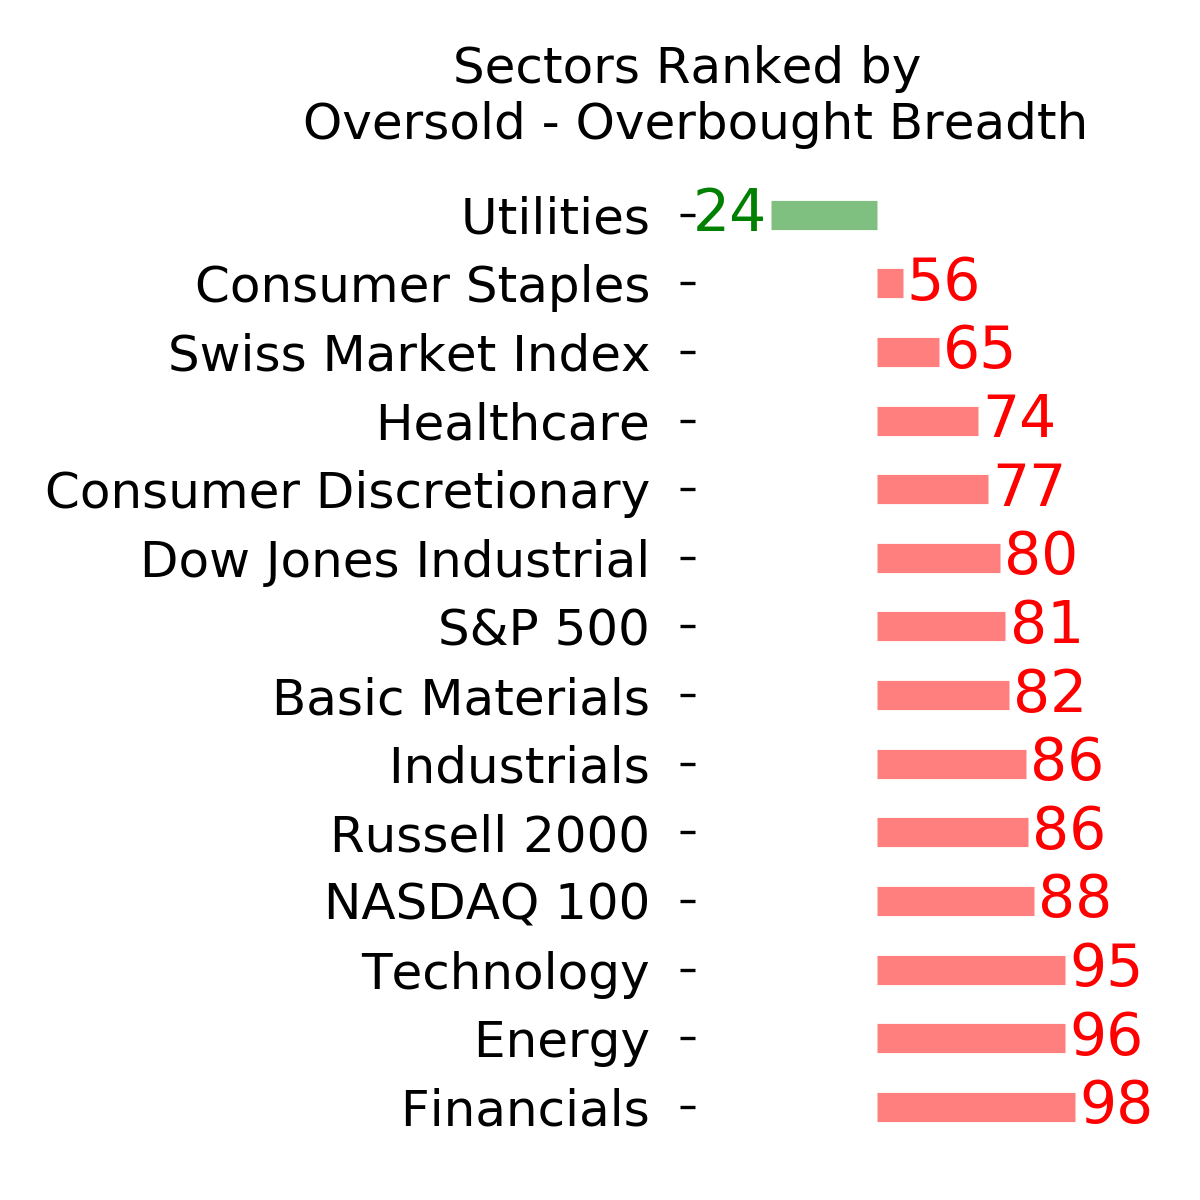
Ranks
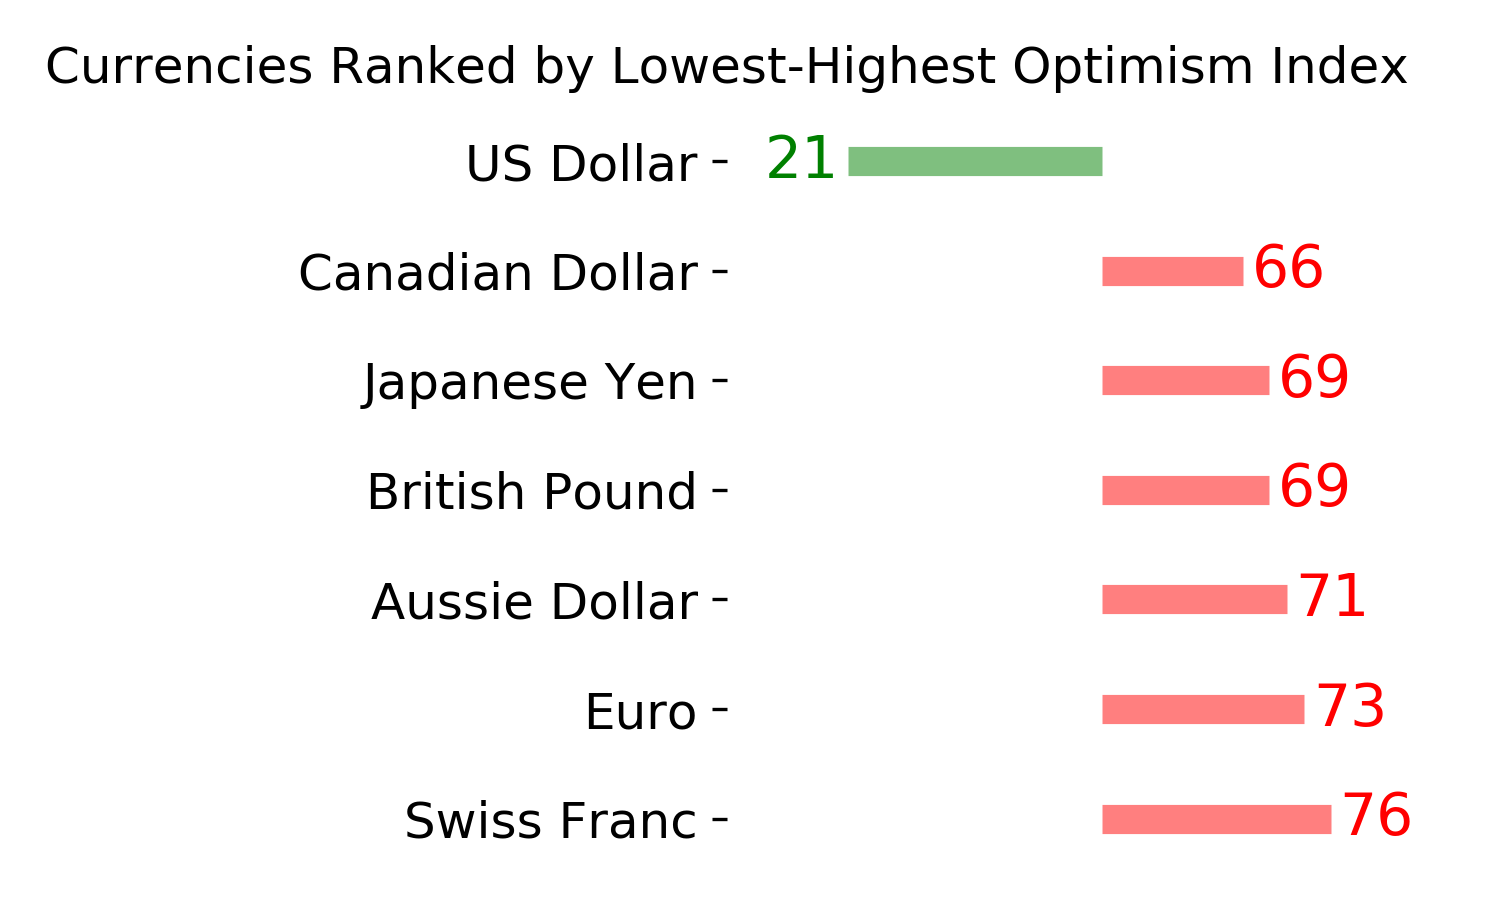
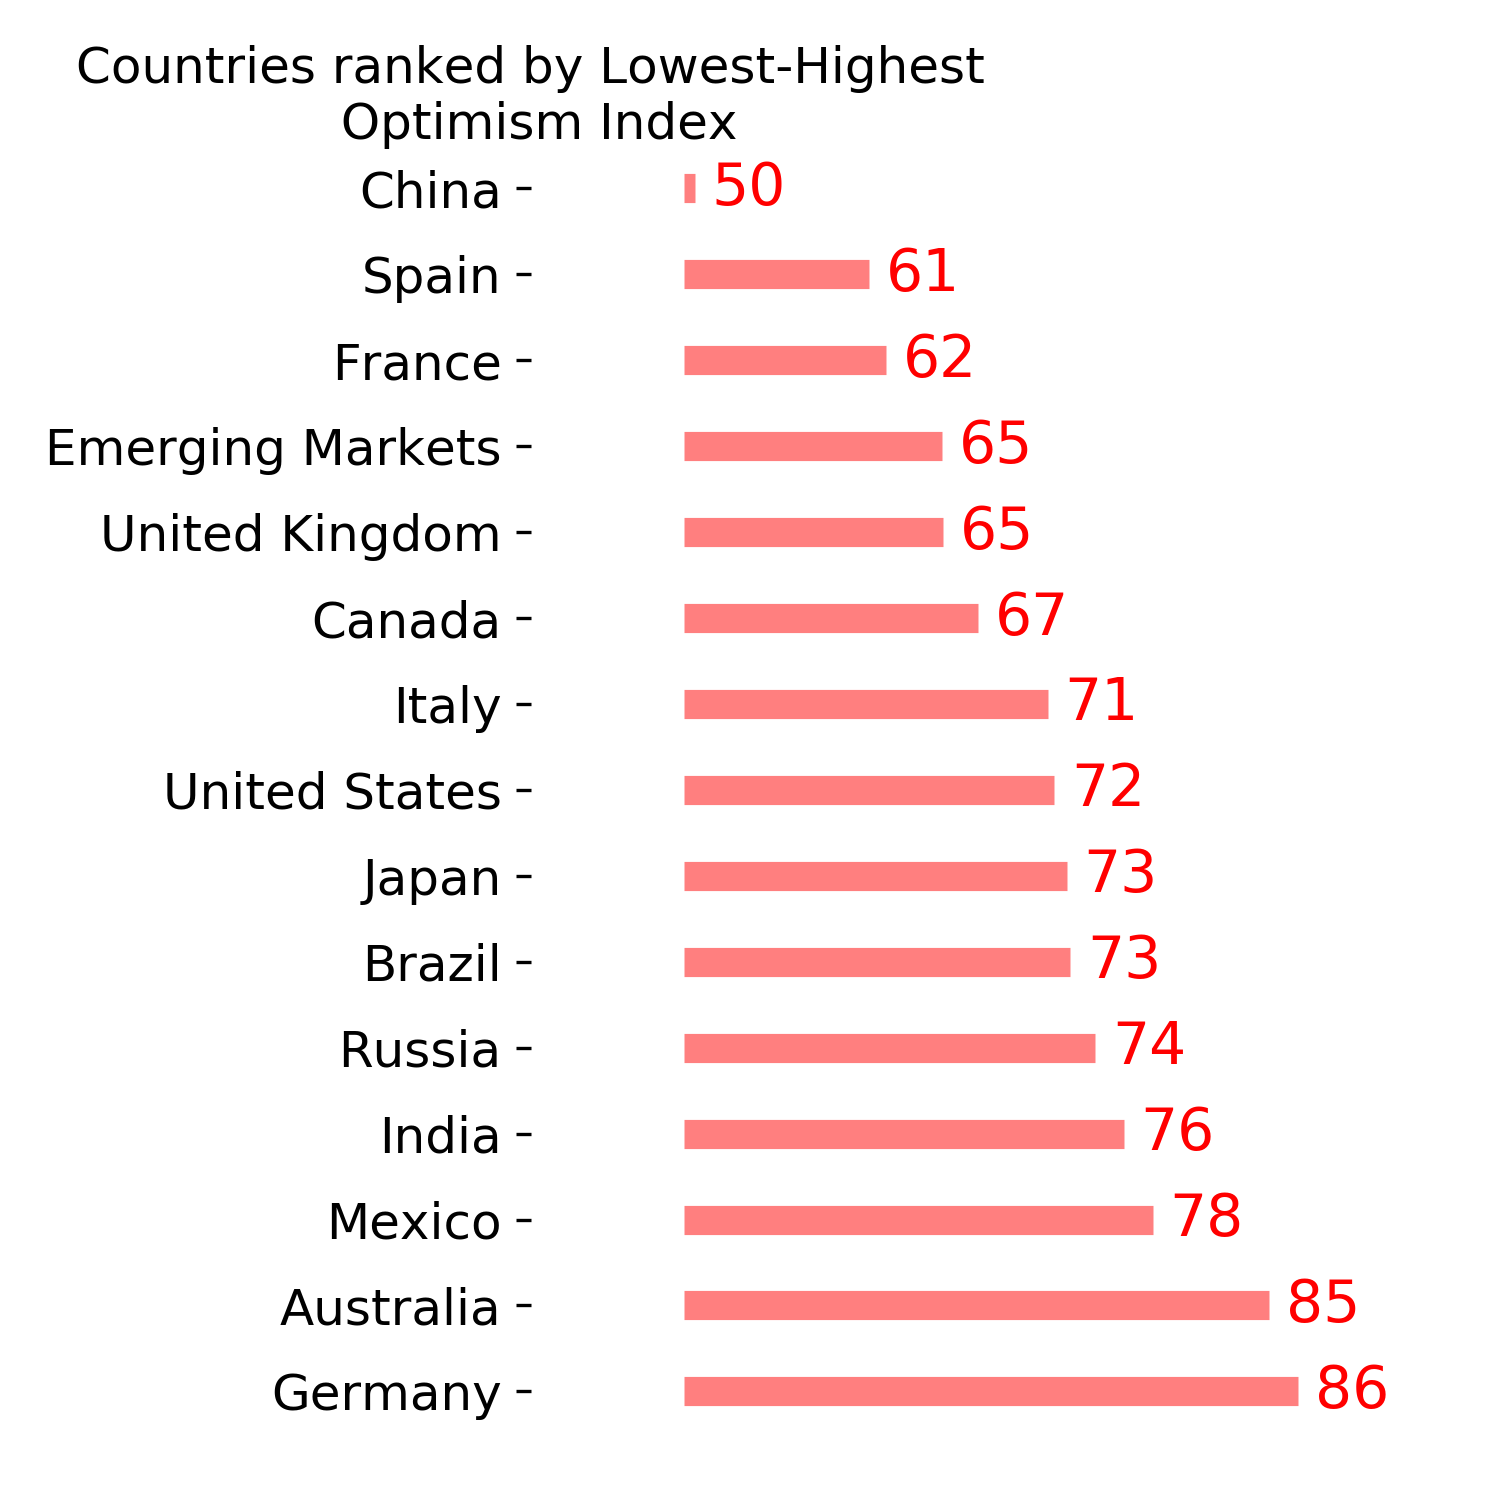
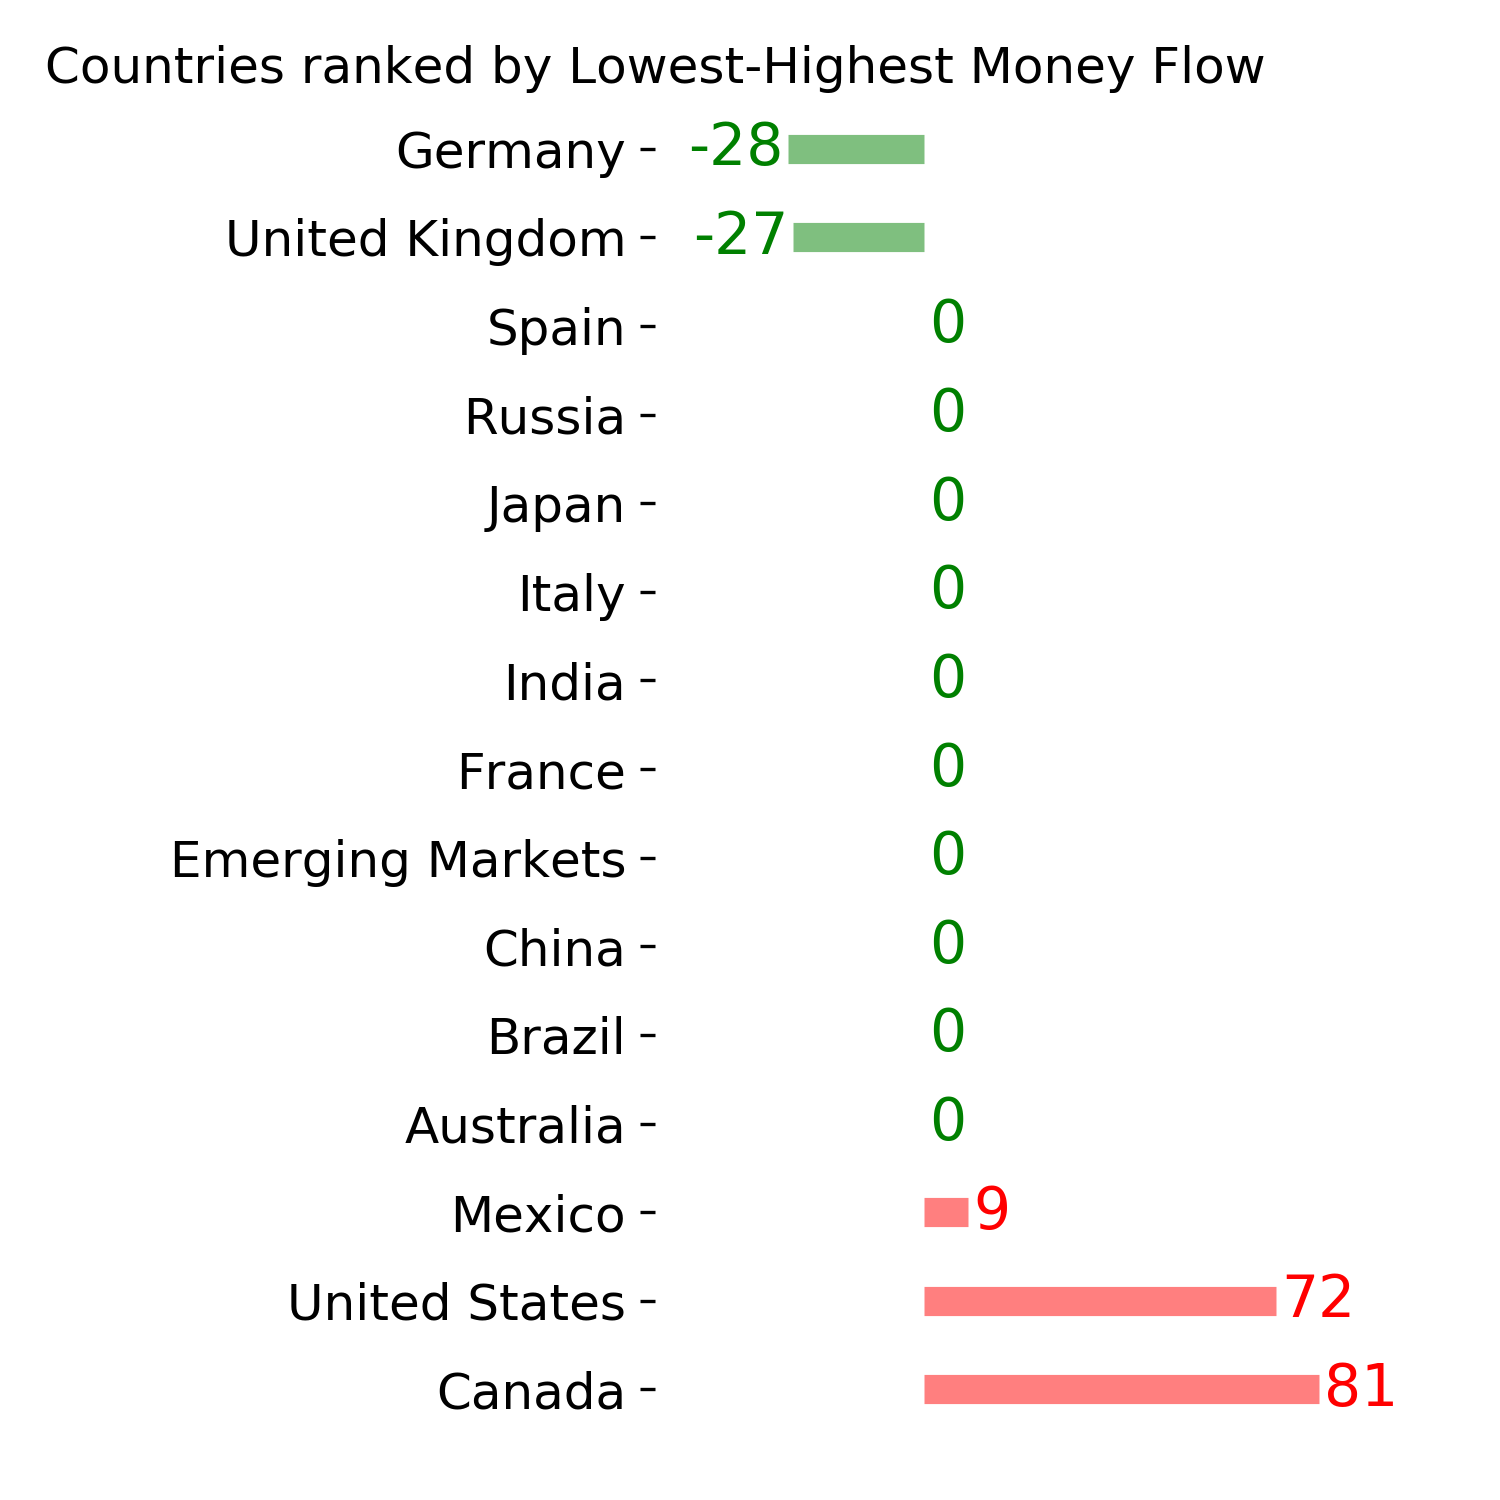
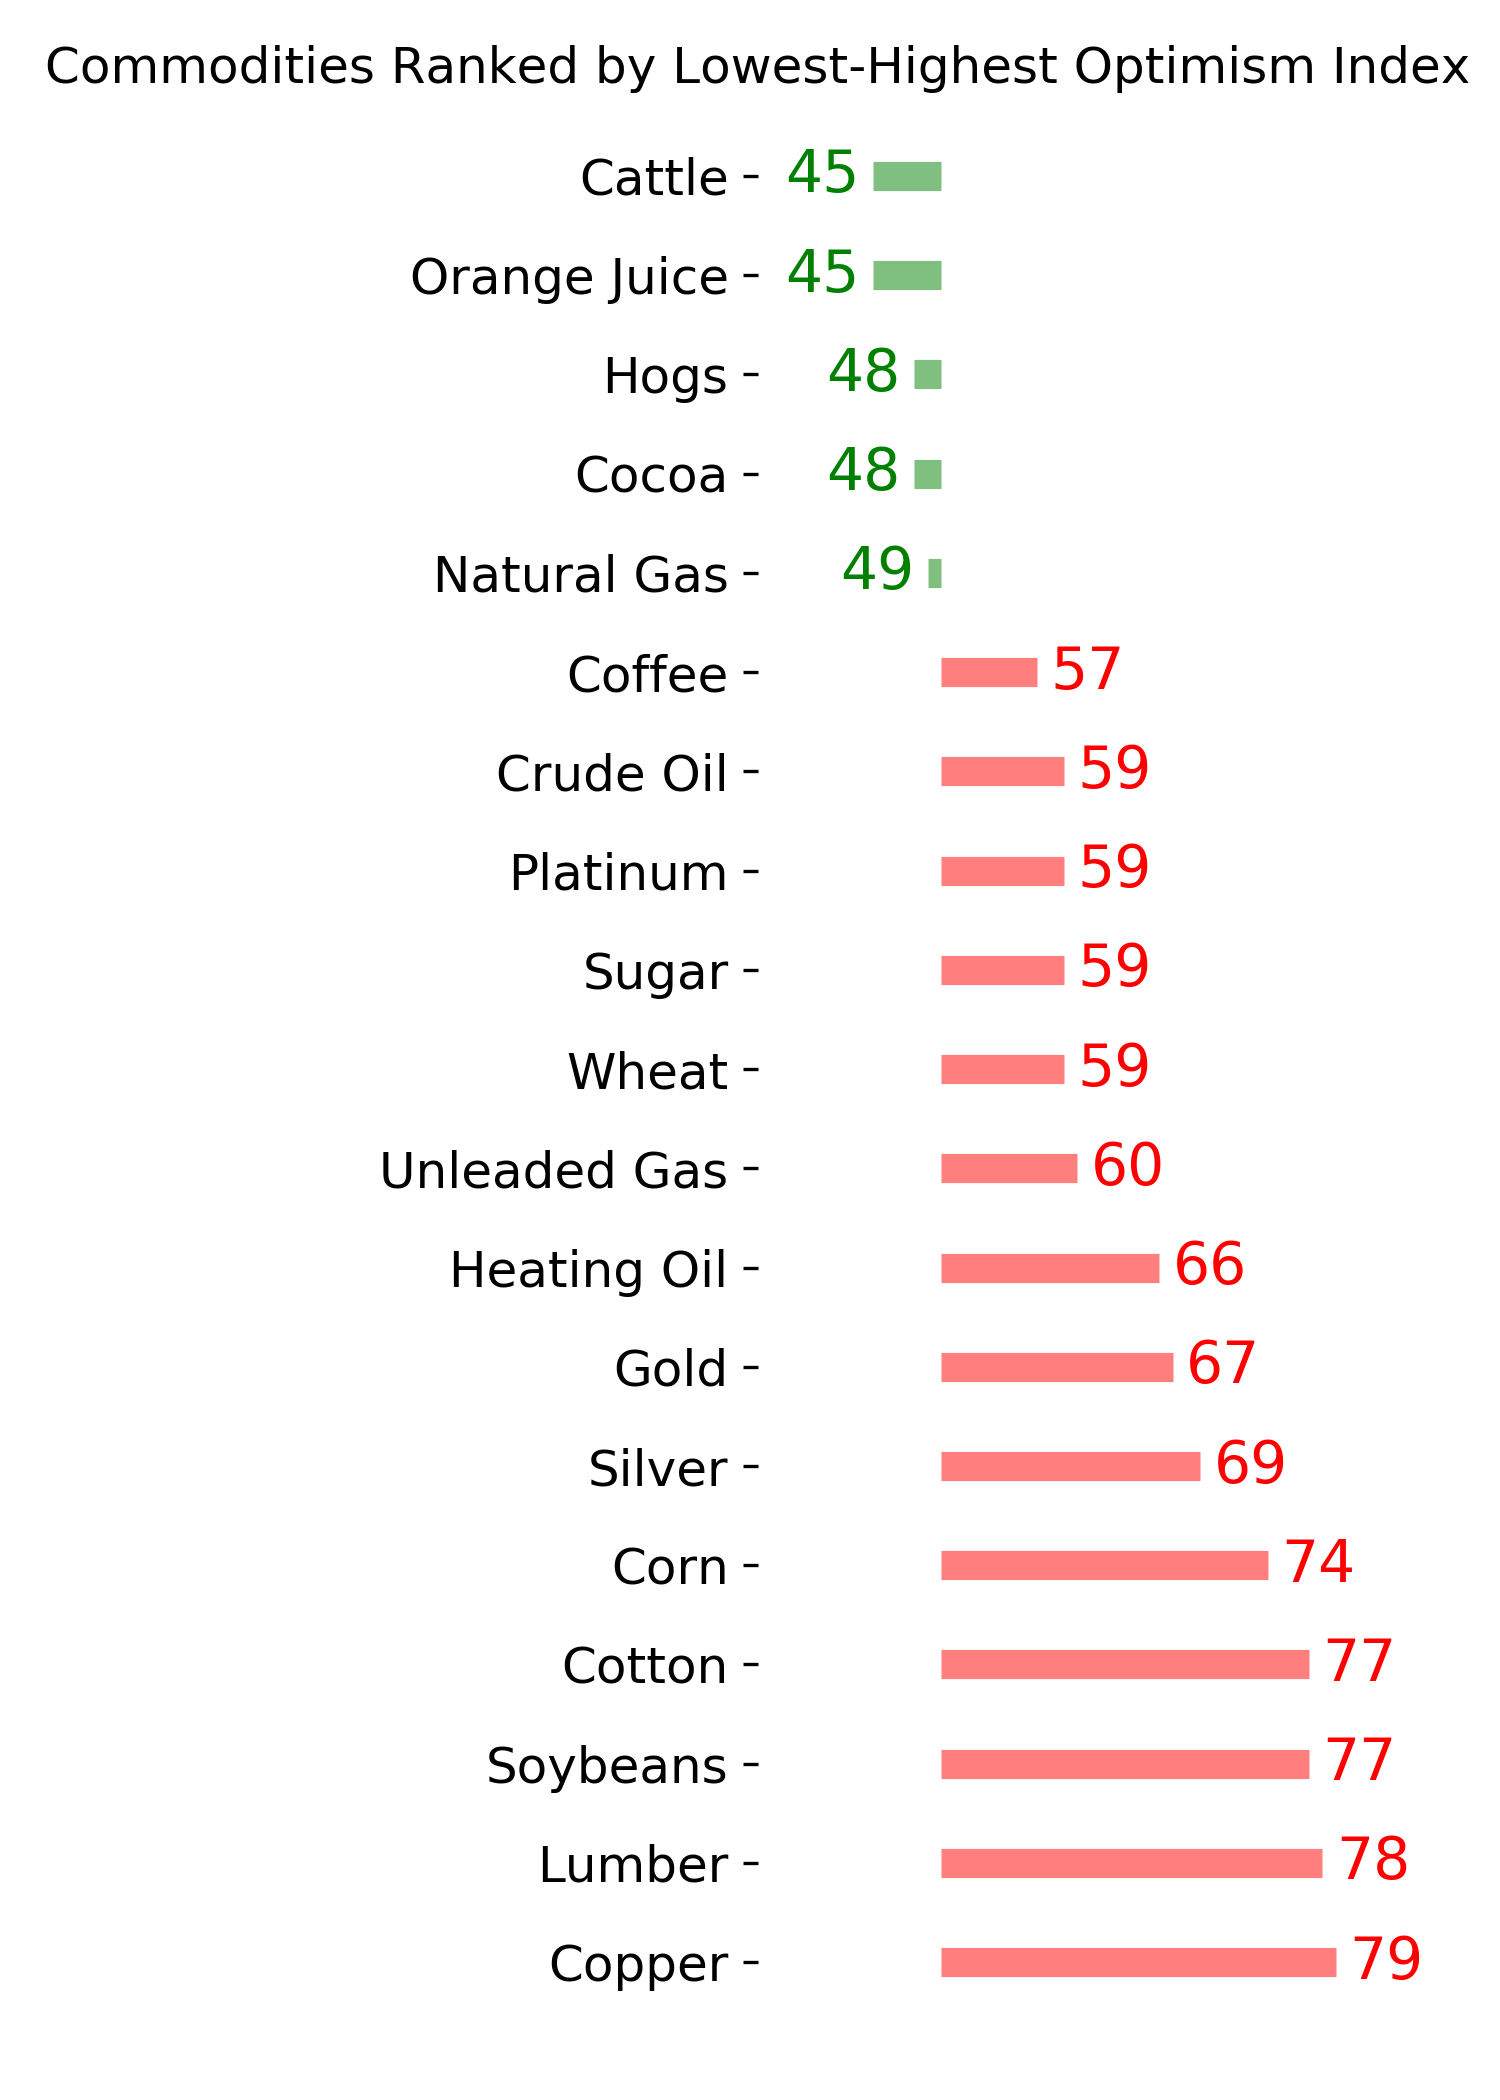
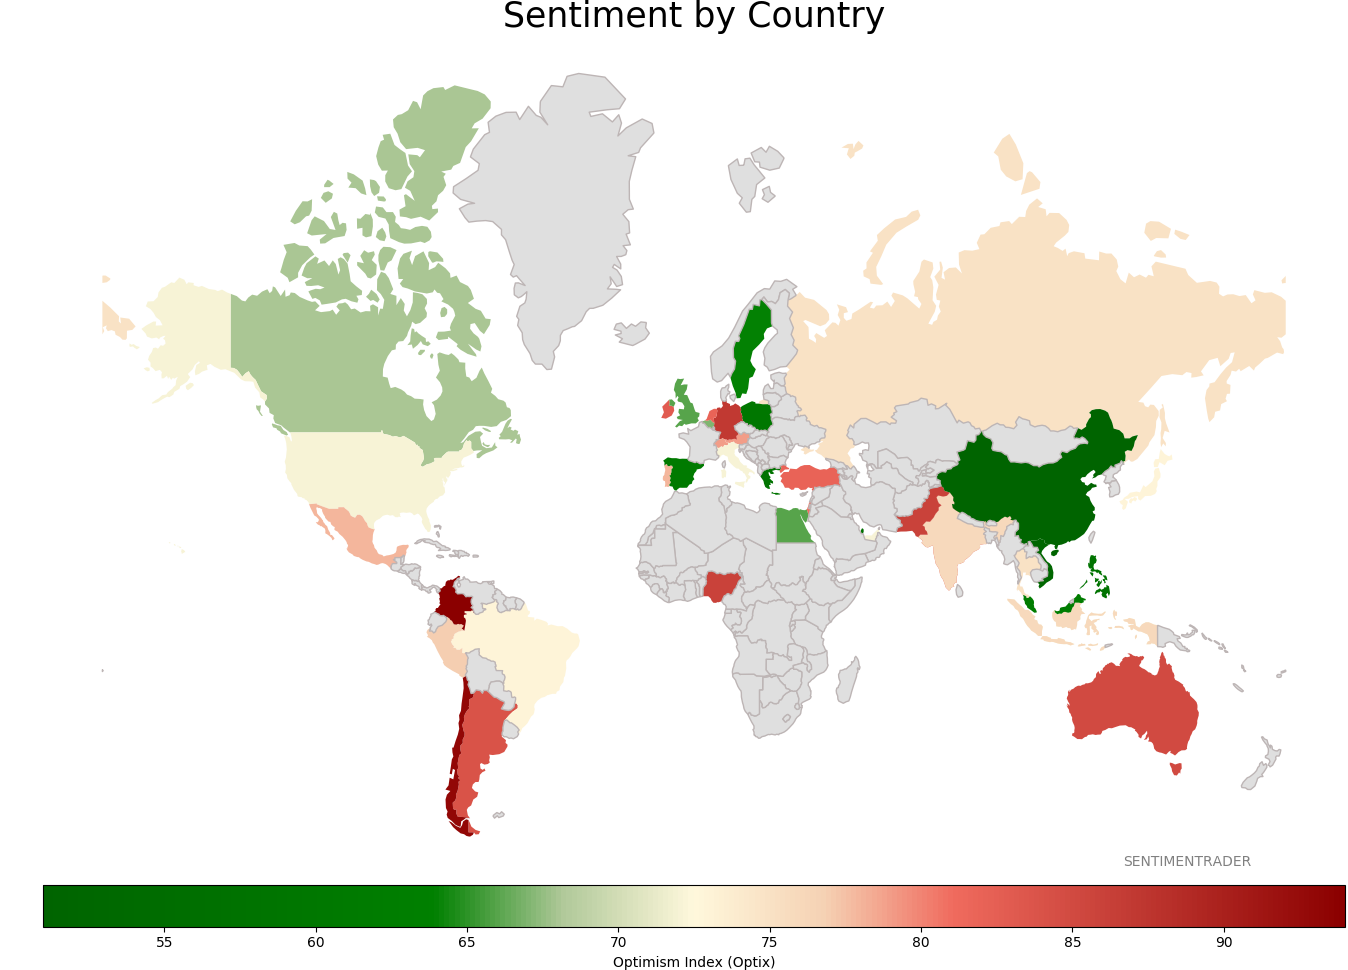
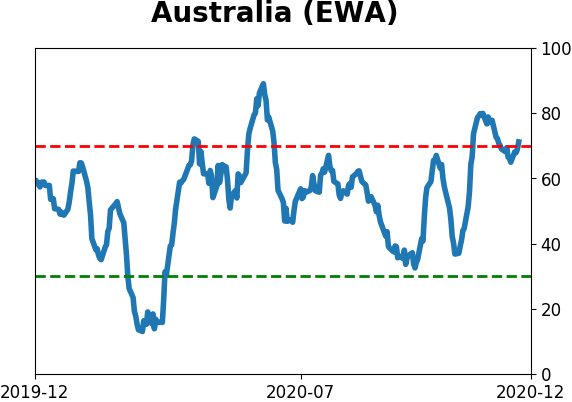
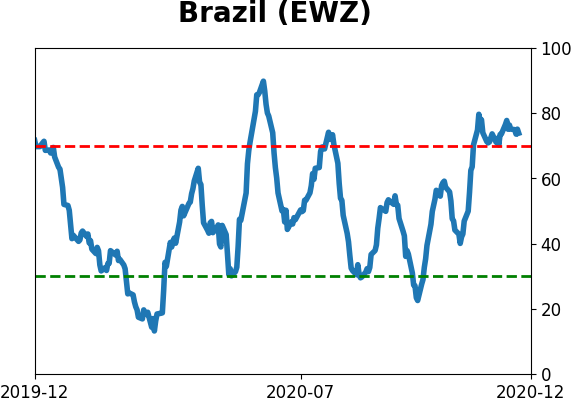
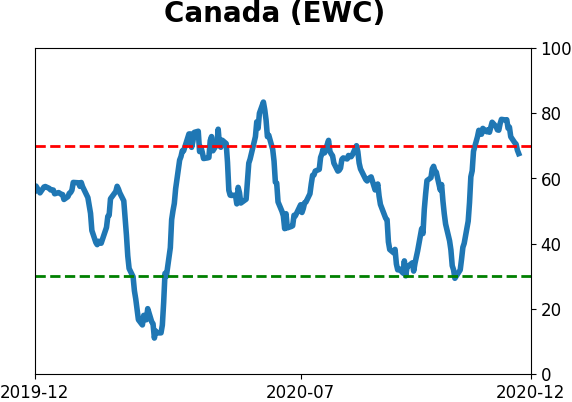
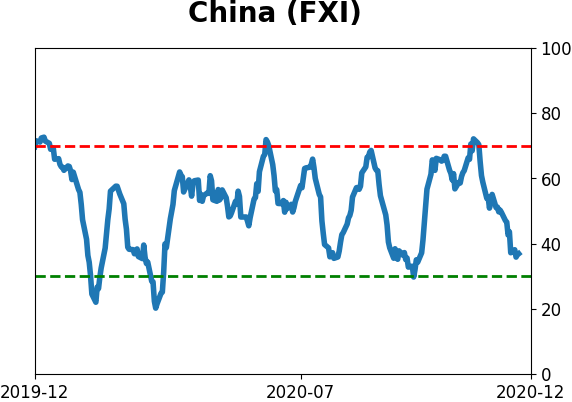
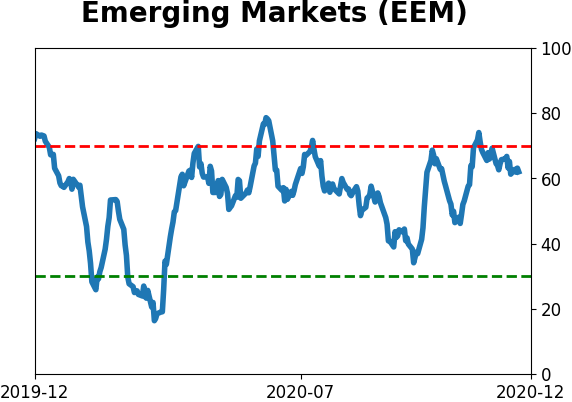
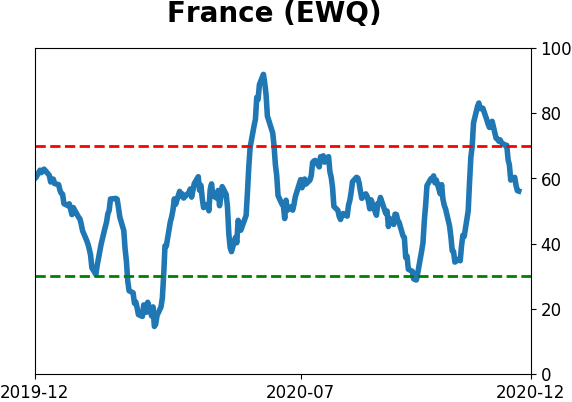
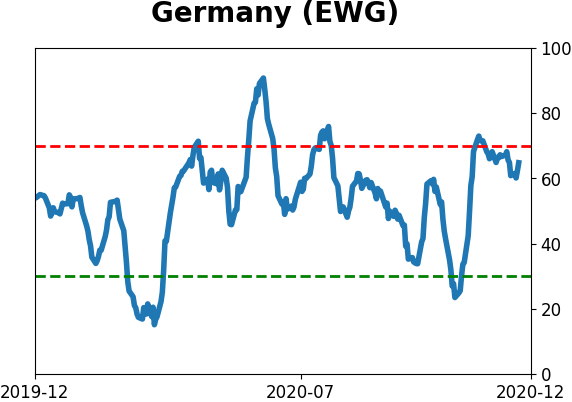
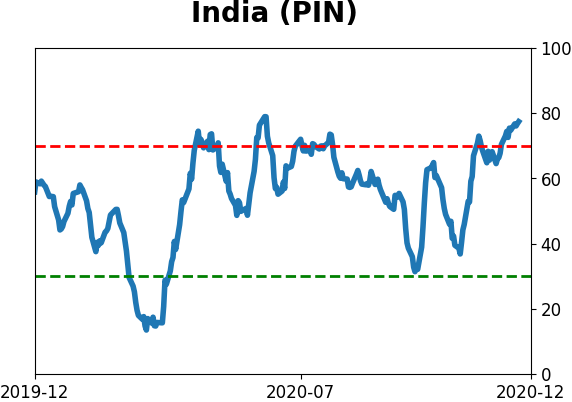
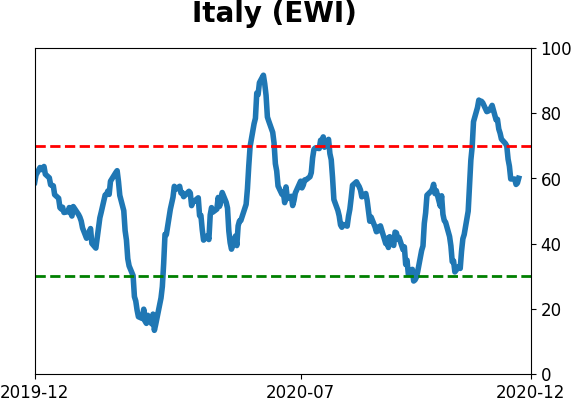
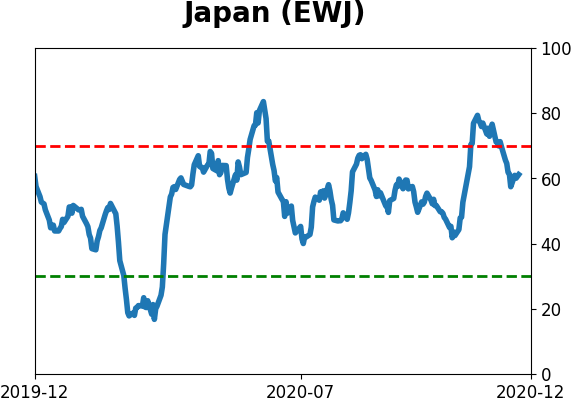
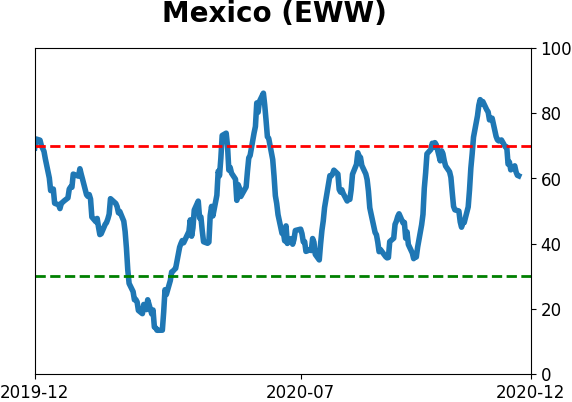
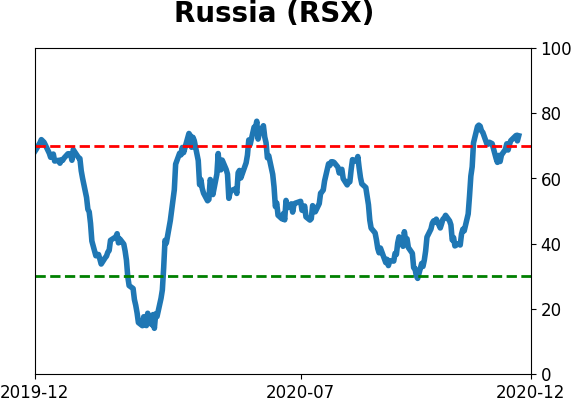
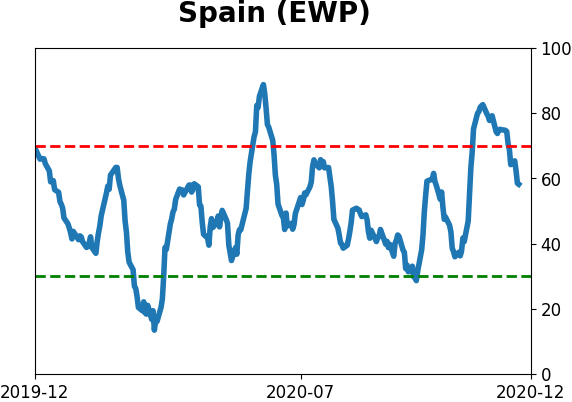
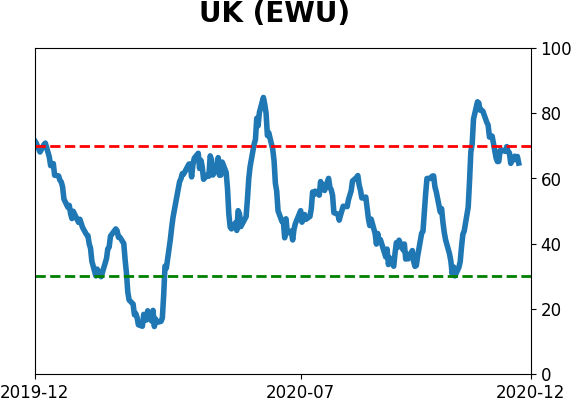
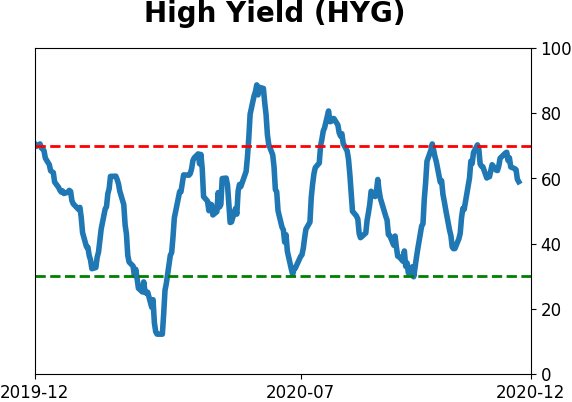
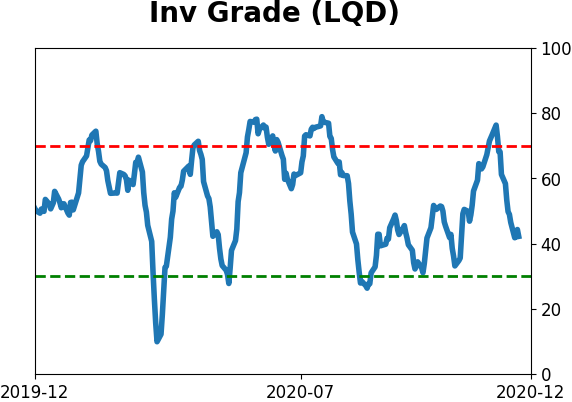
Sentiment Around The World
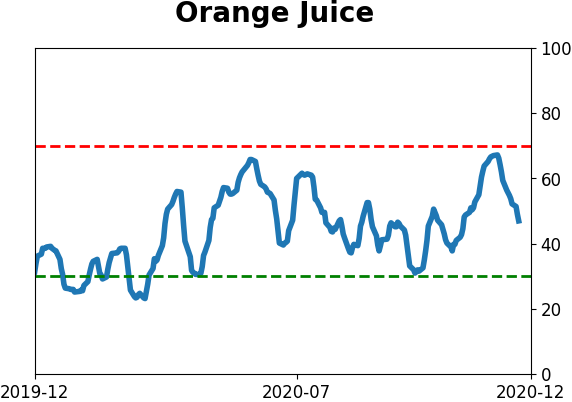
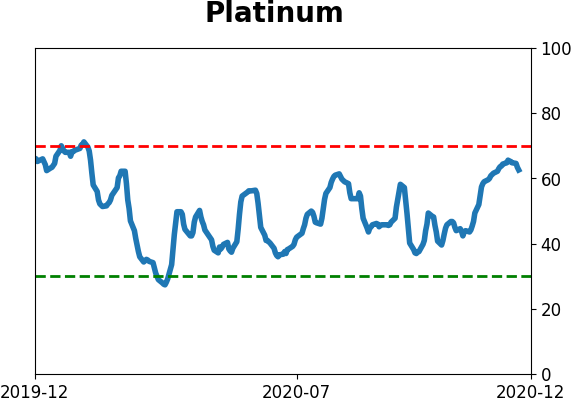
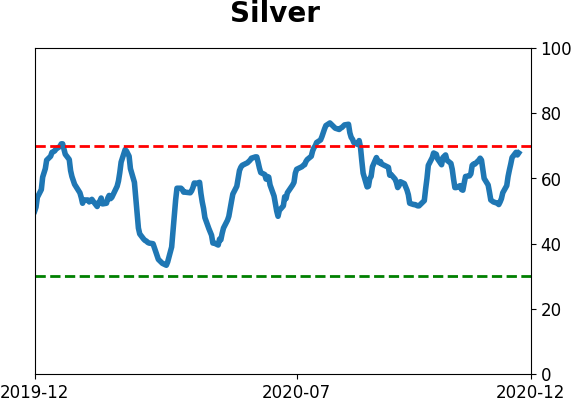
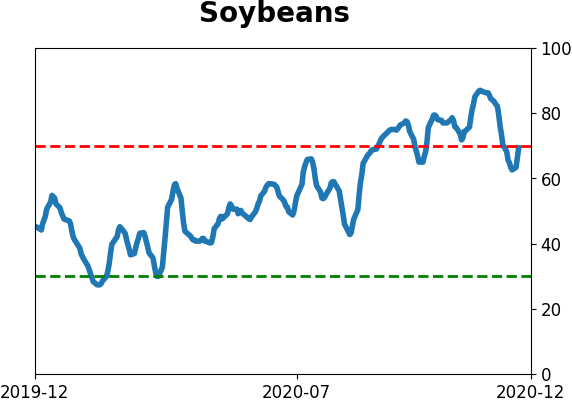
Optimism Index Thumbnails
|
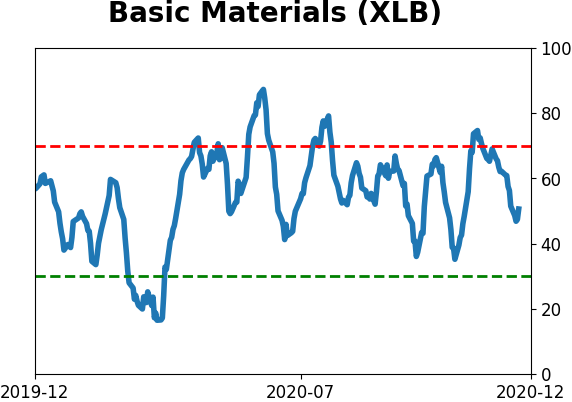
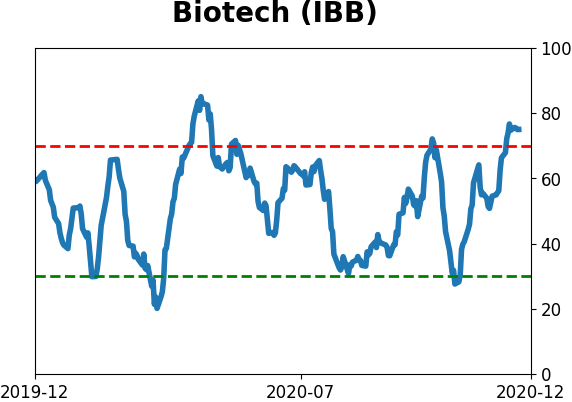
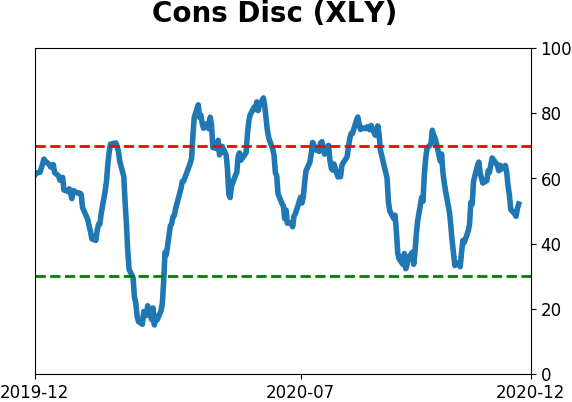
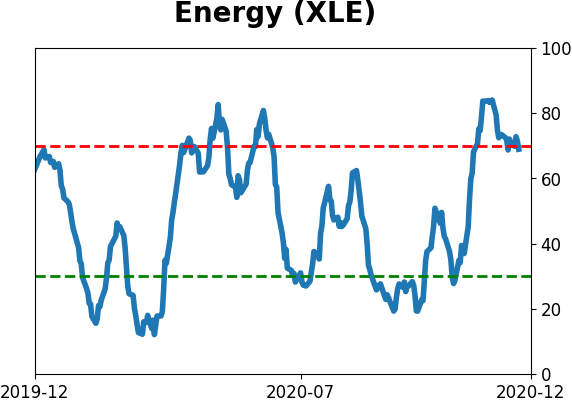
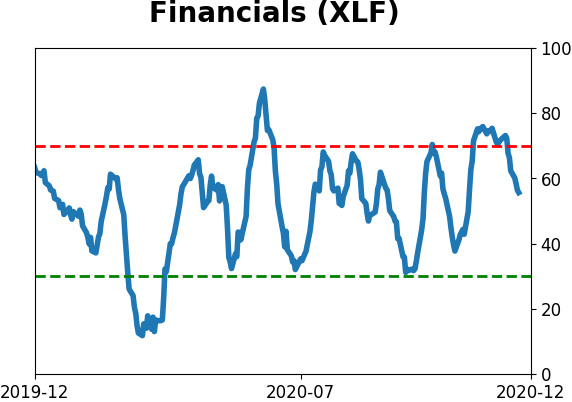
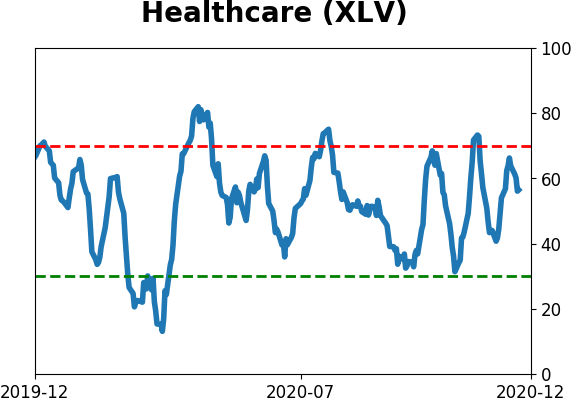
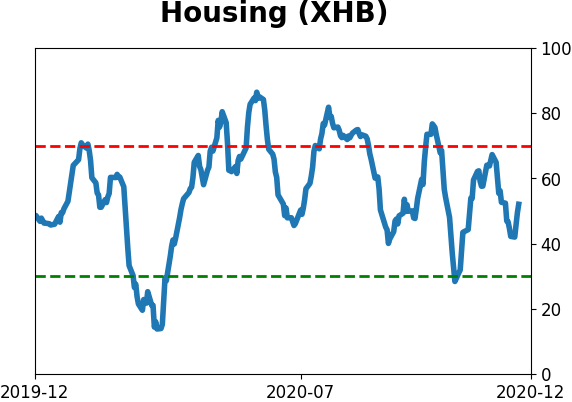
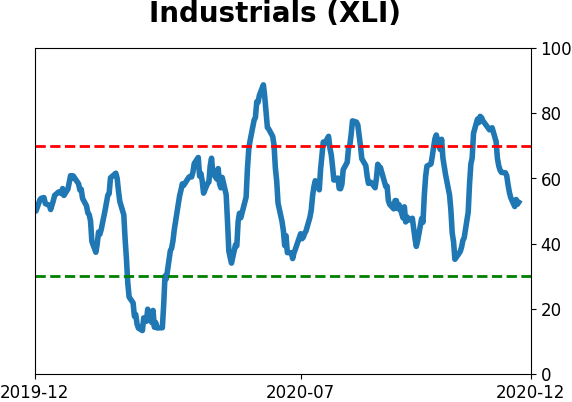
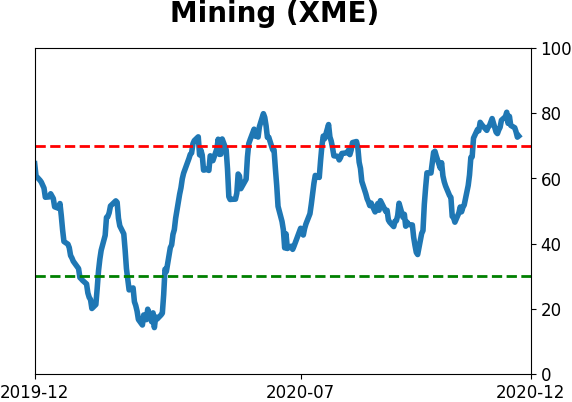
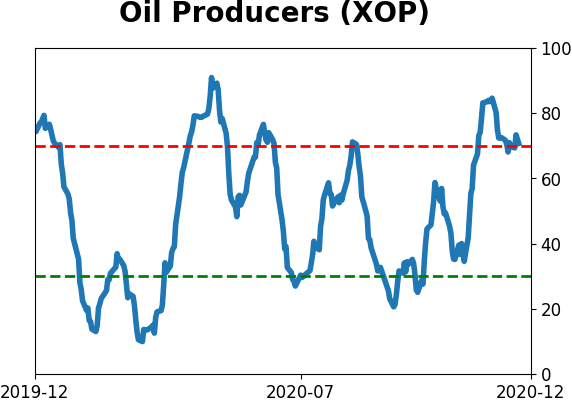
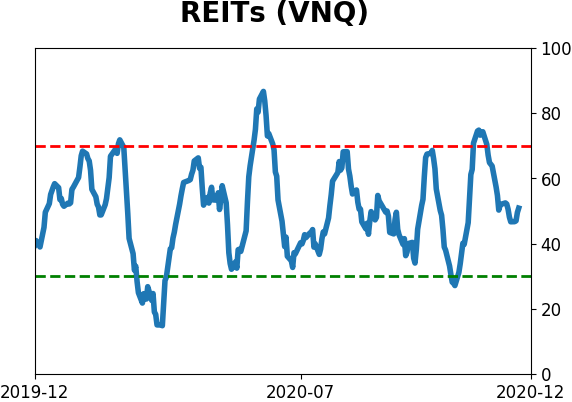
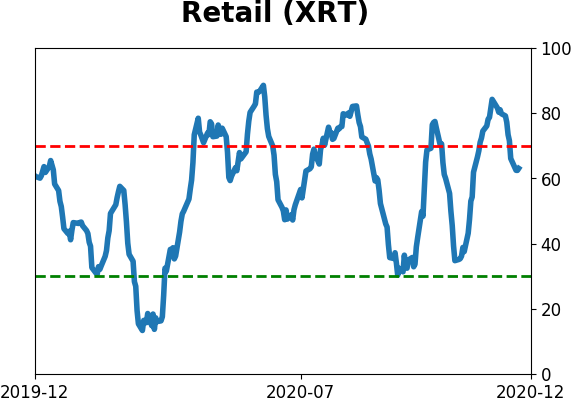
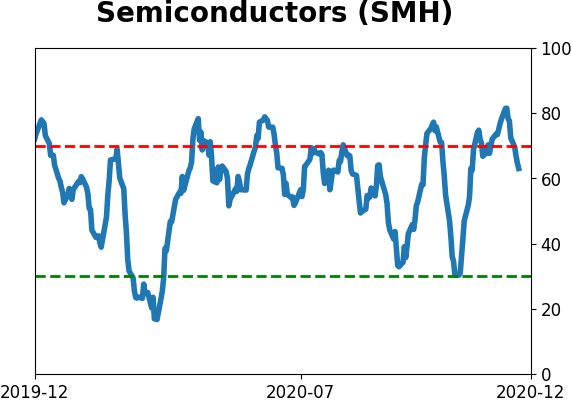
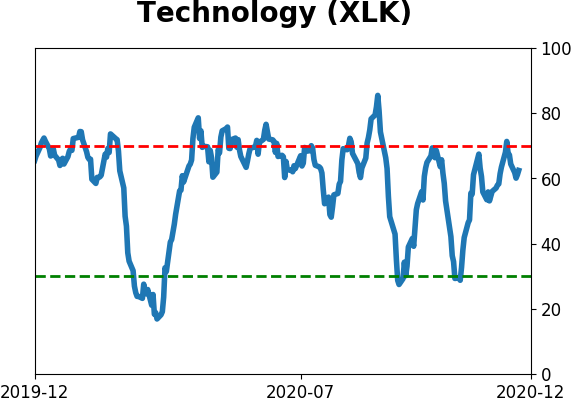
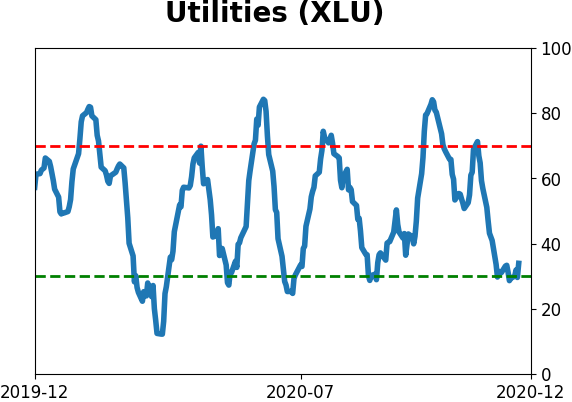
Sector ETF's - 10-Day Moving Average
|
|
|
Country ETF's - 10-Day Moving Average
|
|
|
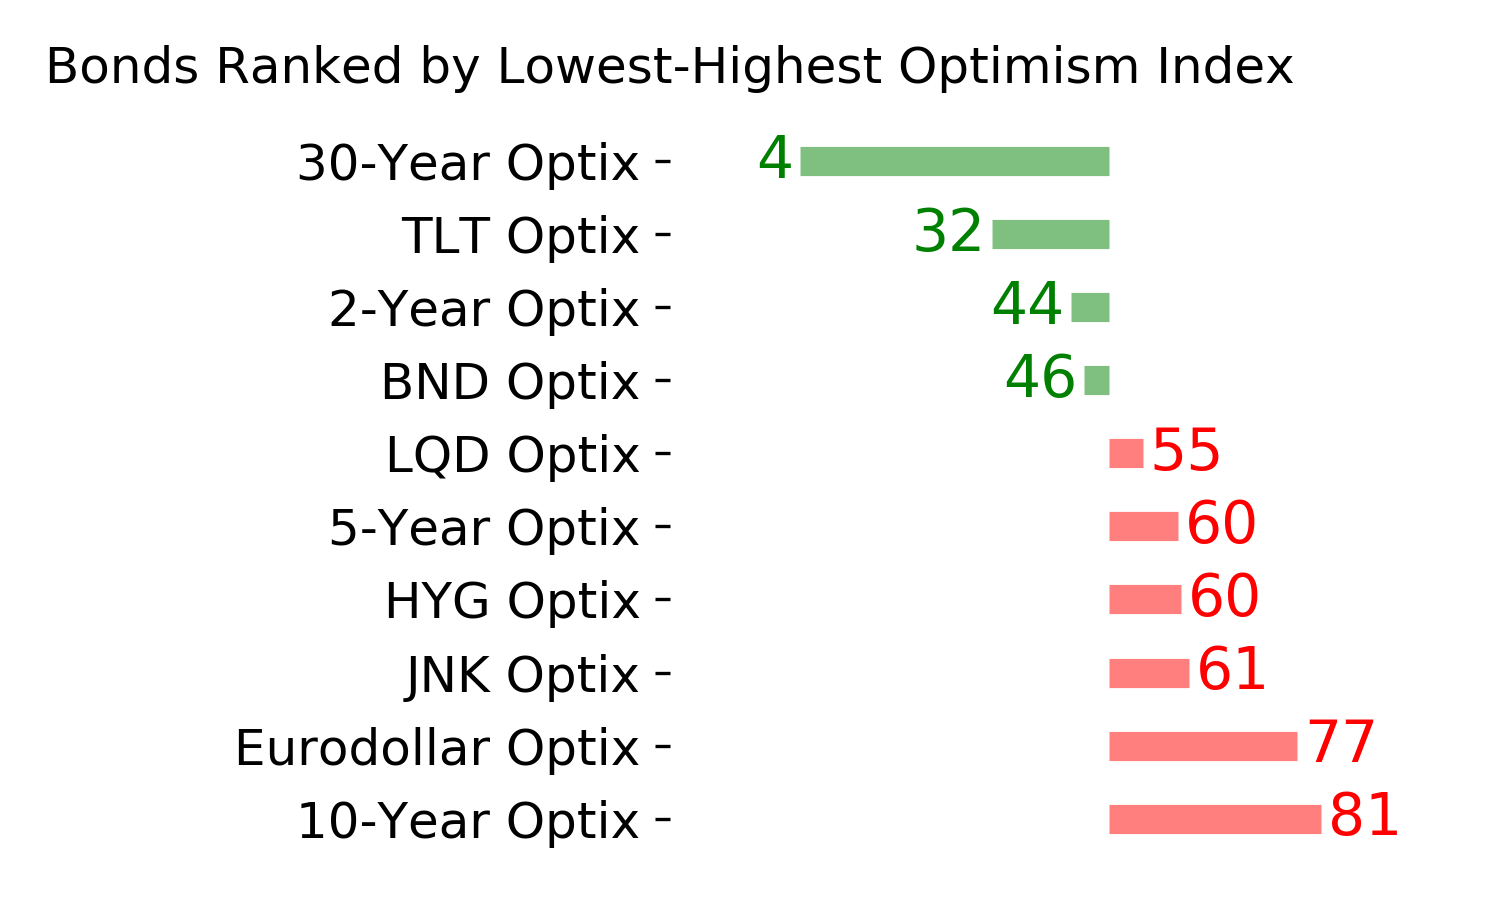
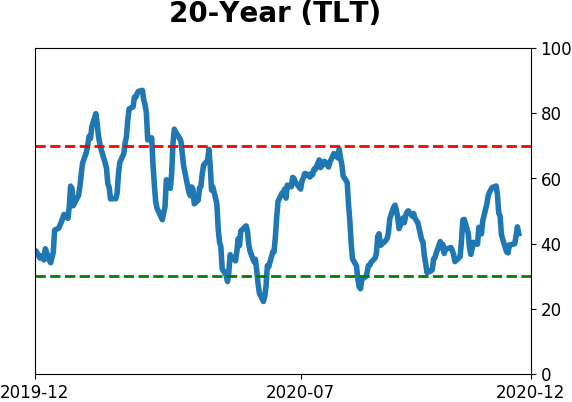
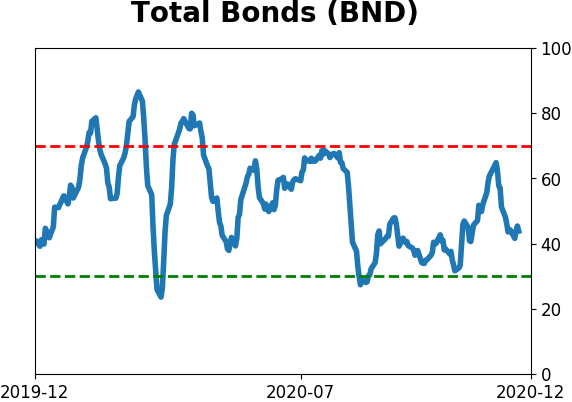
Bond ETF's - 10-Day Moving Average
|
|
|
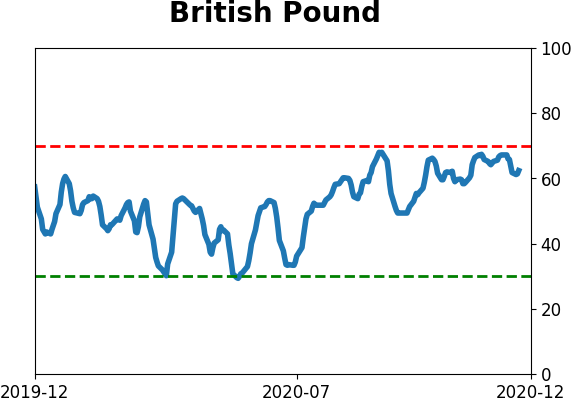
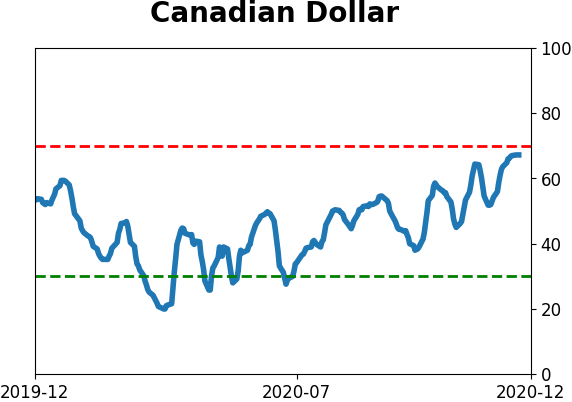
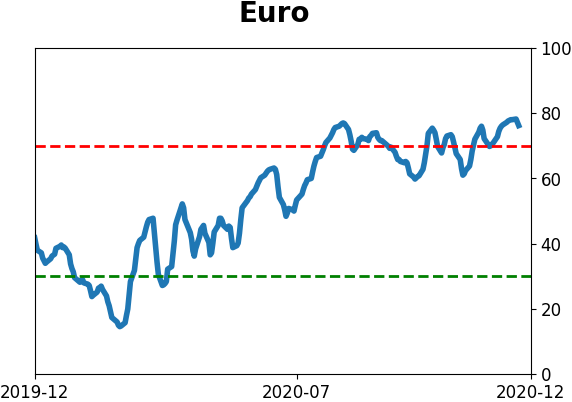
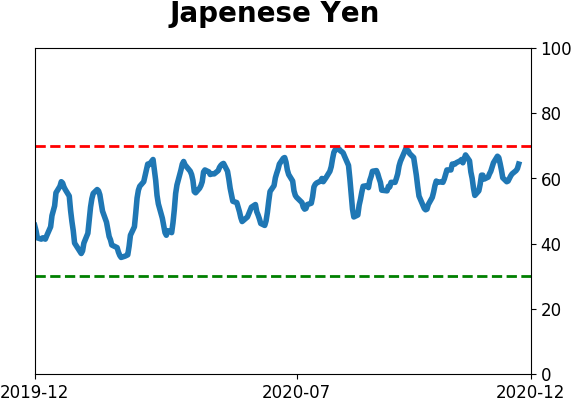
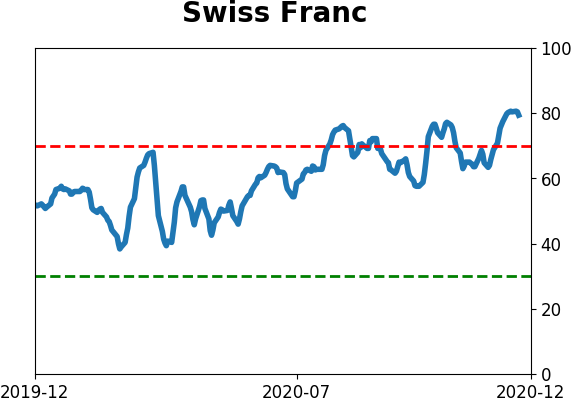
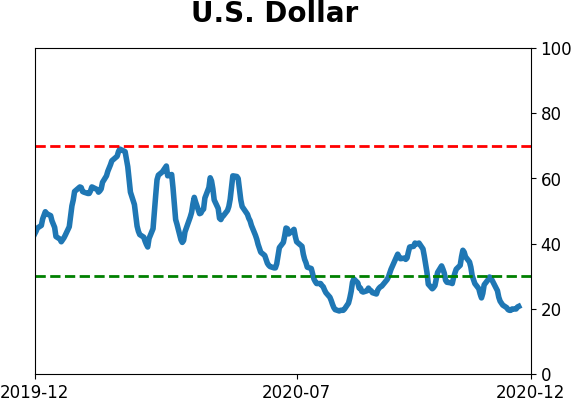
Currency ETF's - 5-Day Moving Average
|
|
|
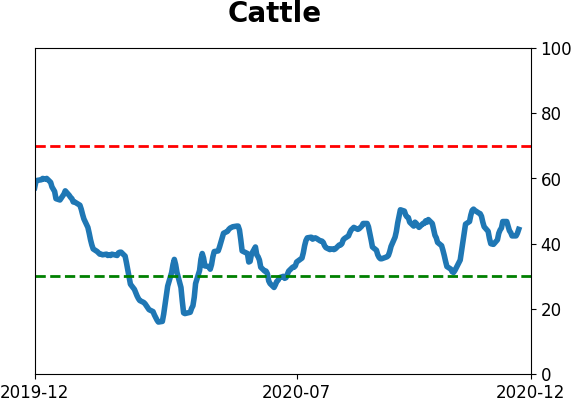
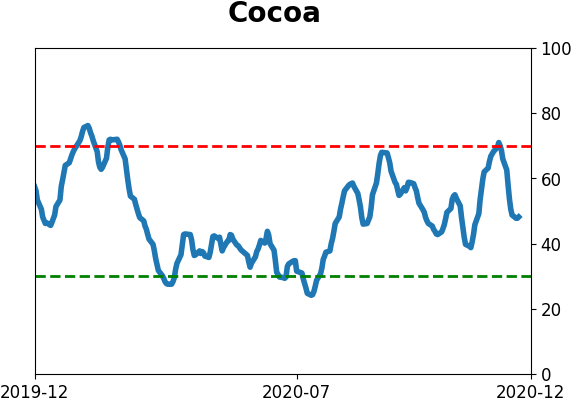
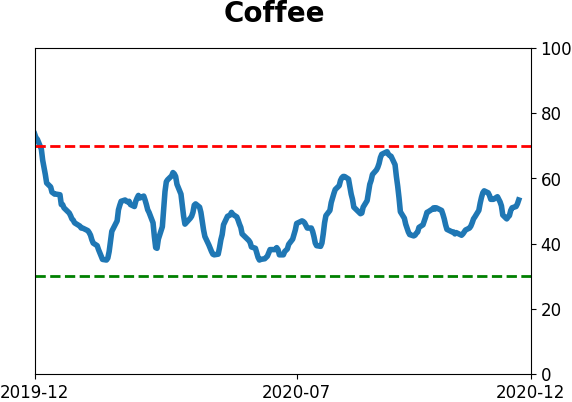
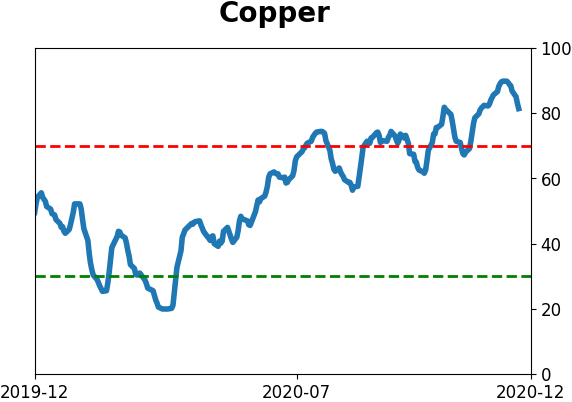
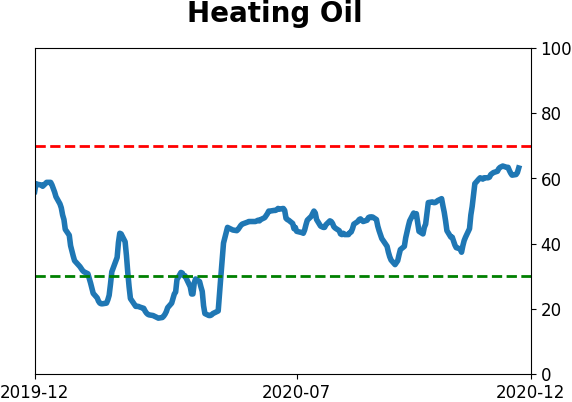
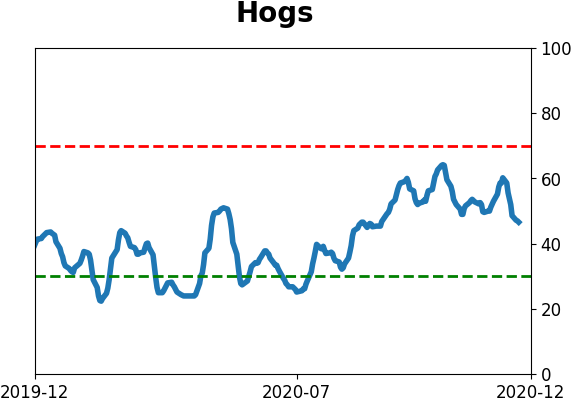
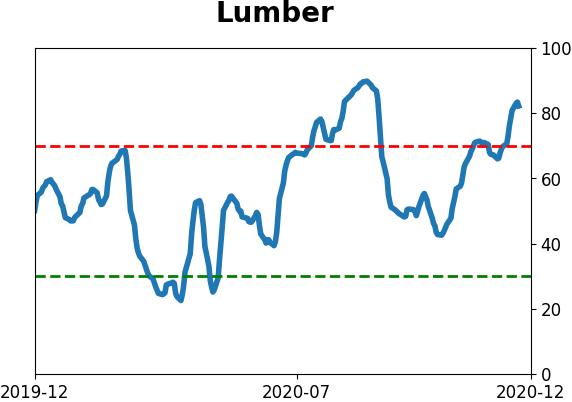
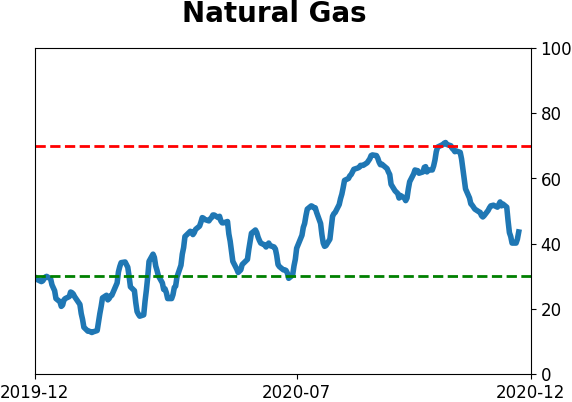
Commodity ETF's - 5-Day Moving Average
|
|