Headlines
|
|
New highs dominate a broad market:
The net number of securities hitting 52-week highs is the most dominant in 4 years. That has pushed long-term momentum above a key level, even as shorter-term measures relax. This kind of setup has been very positive for long-term returns.
Bottom Line:
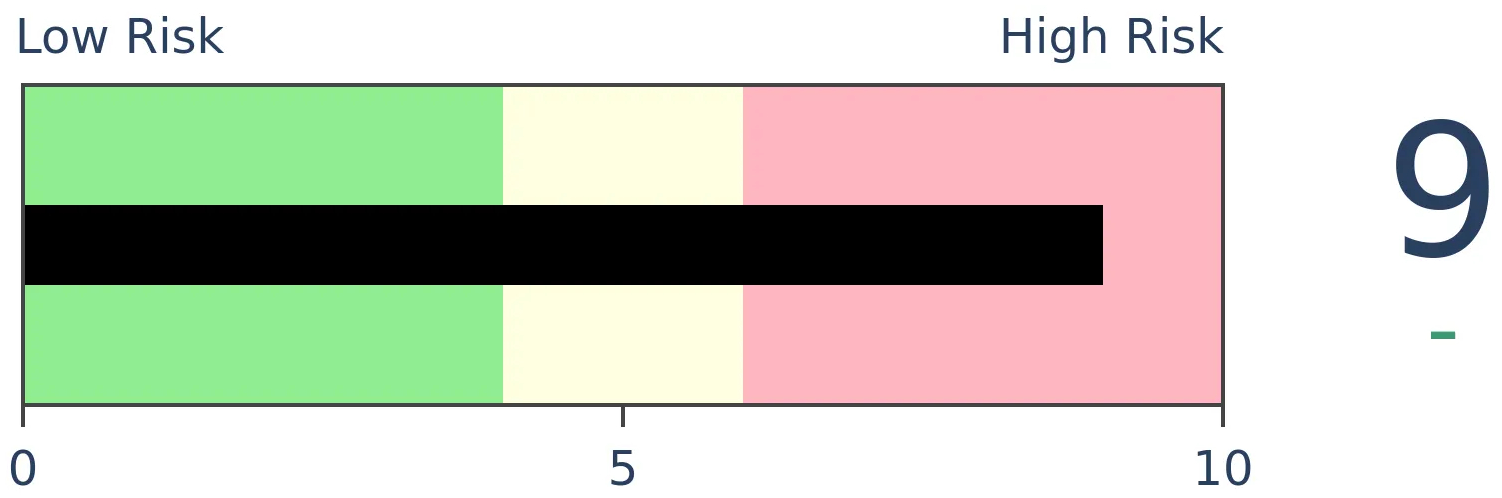
- The market environment is pristine, but with near-historic optimism, gains tend to be muted, with a high probability of being reversed at some point over the ensuing weeks.
|
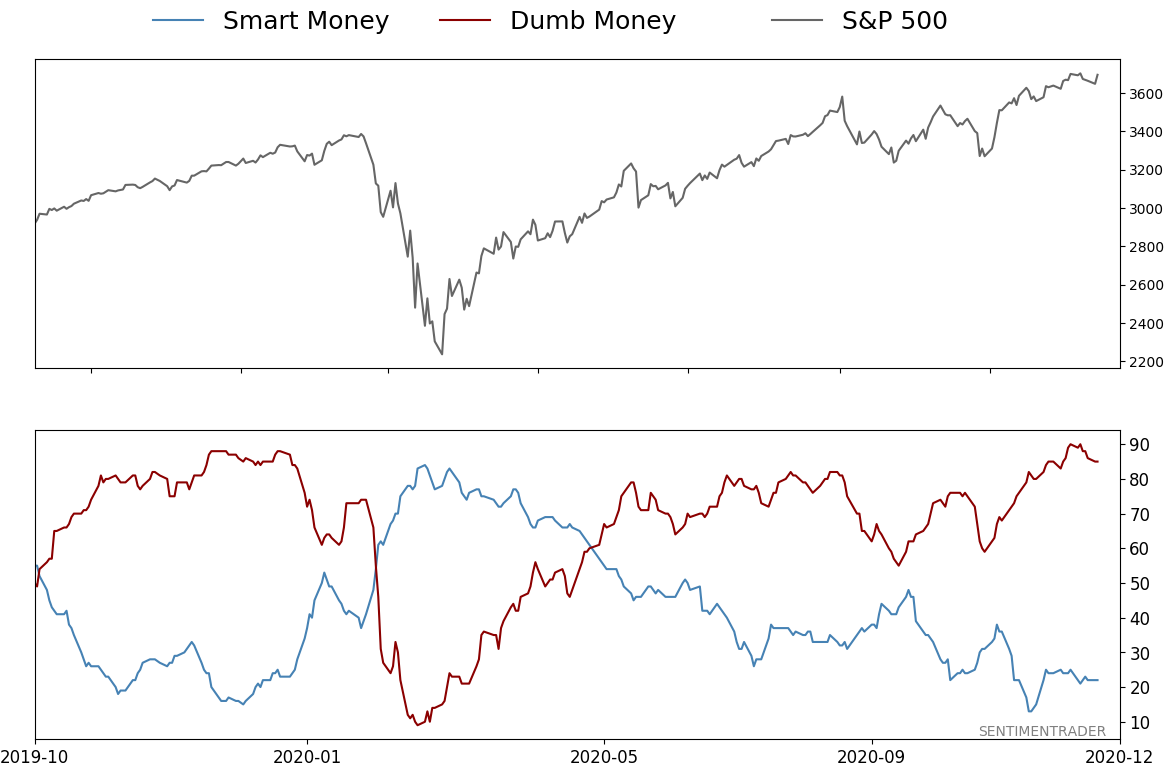
Smart / Dumb Money Confidence
|
Smart Money Confidence: 22%
Dumb Money Confidence: 85%
|
|
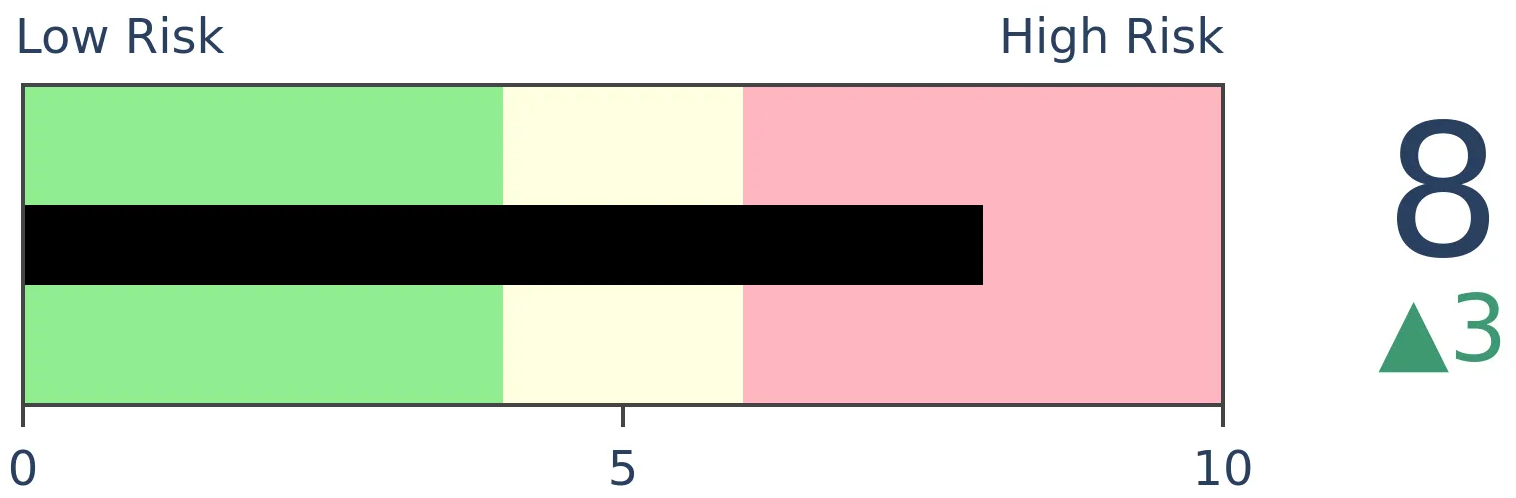
Risk Levels
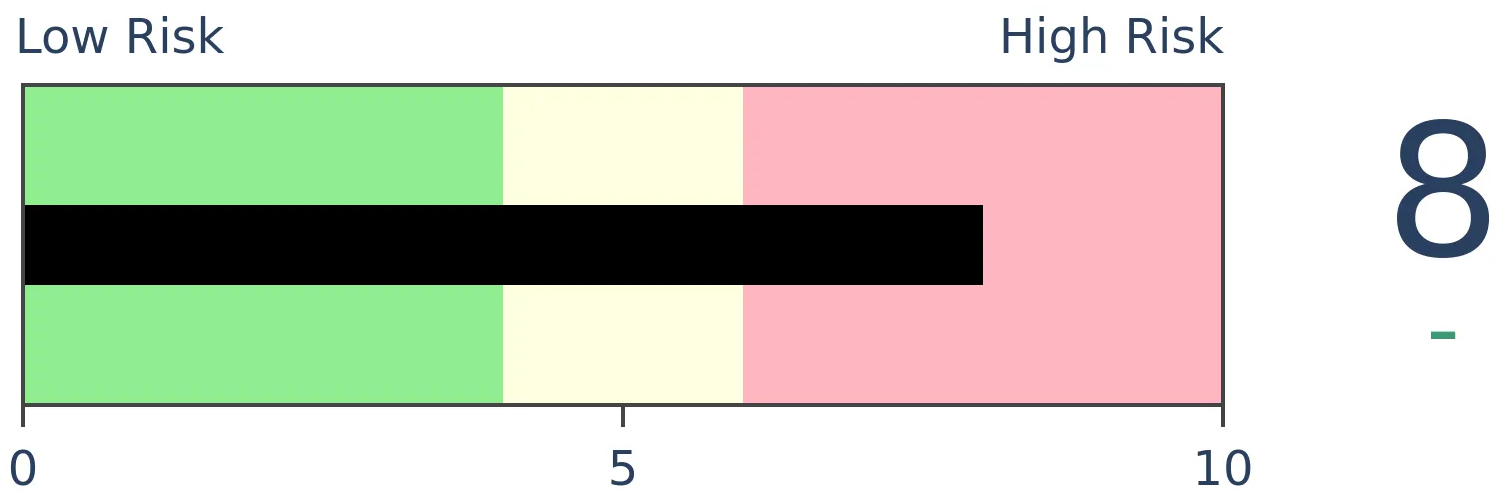
Stocks Short-Term
|
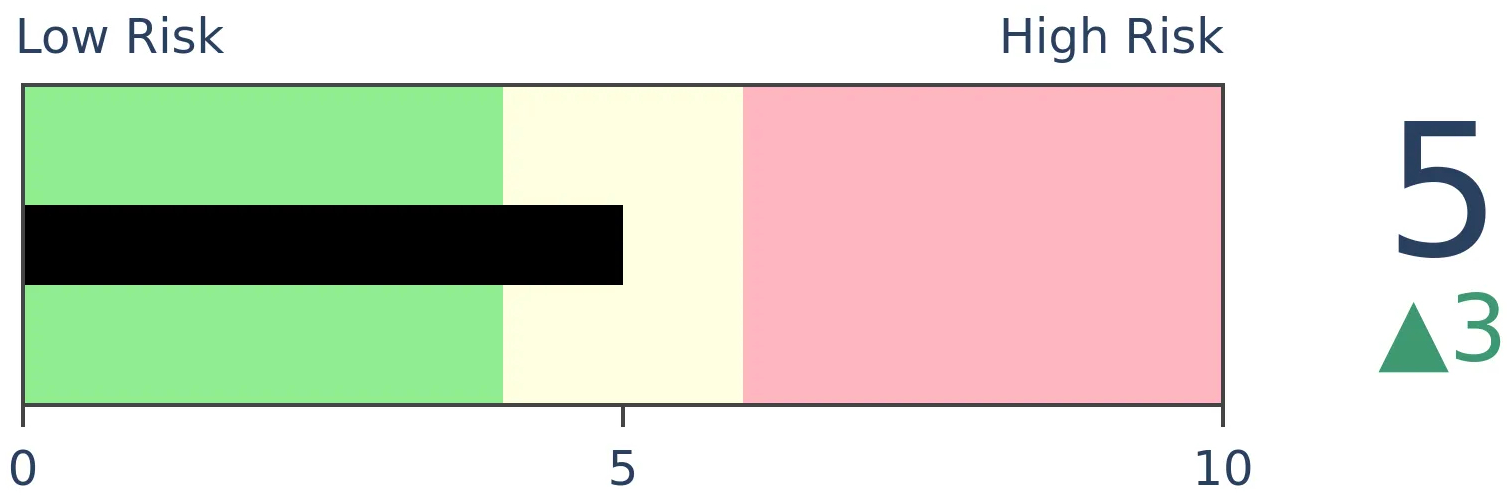
Stocks Medium-Term
|
|
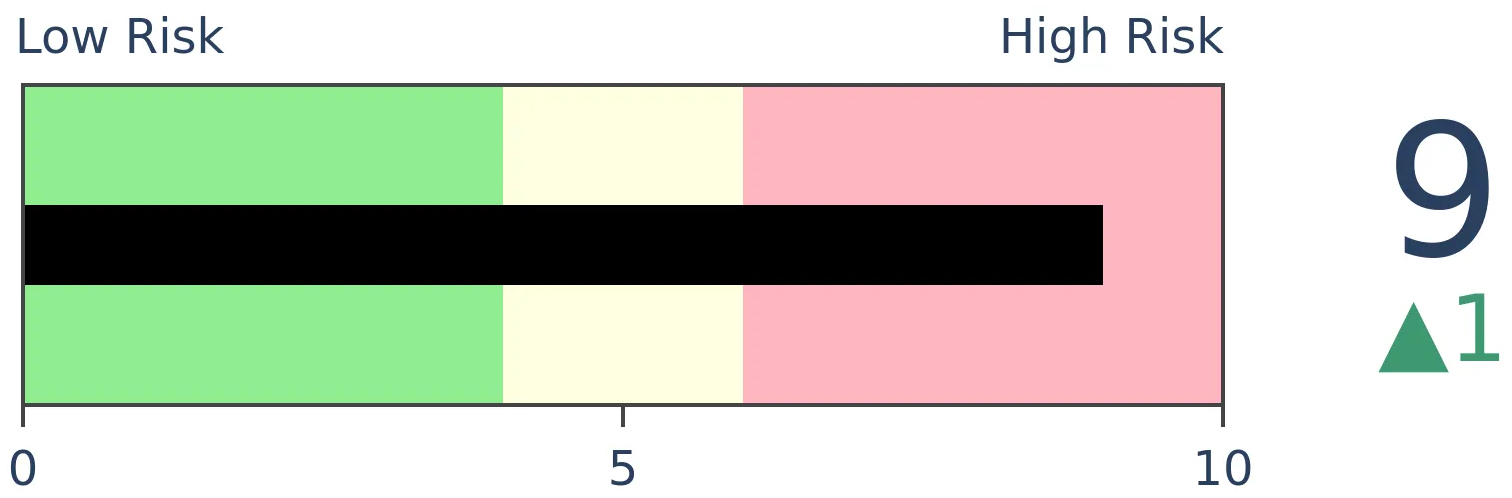
Bonds
|
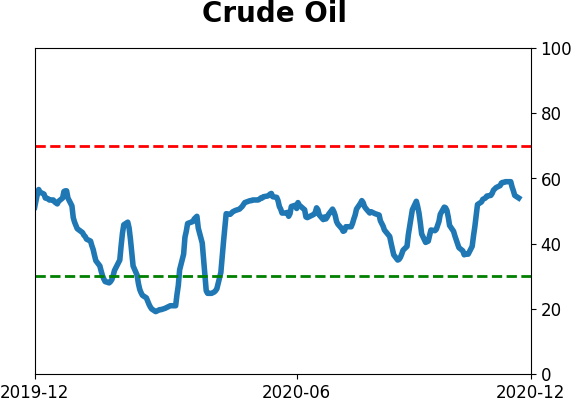
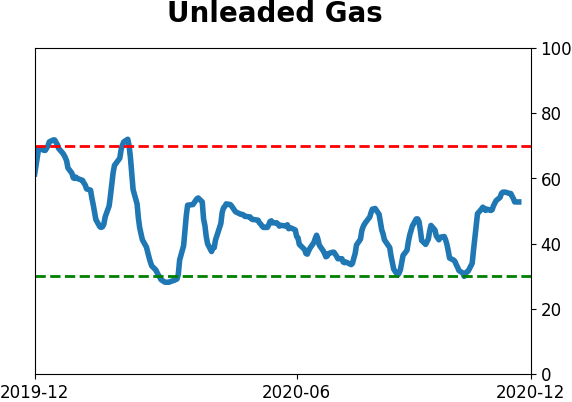
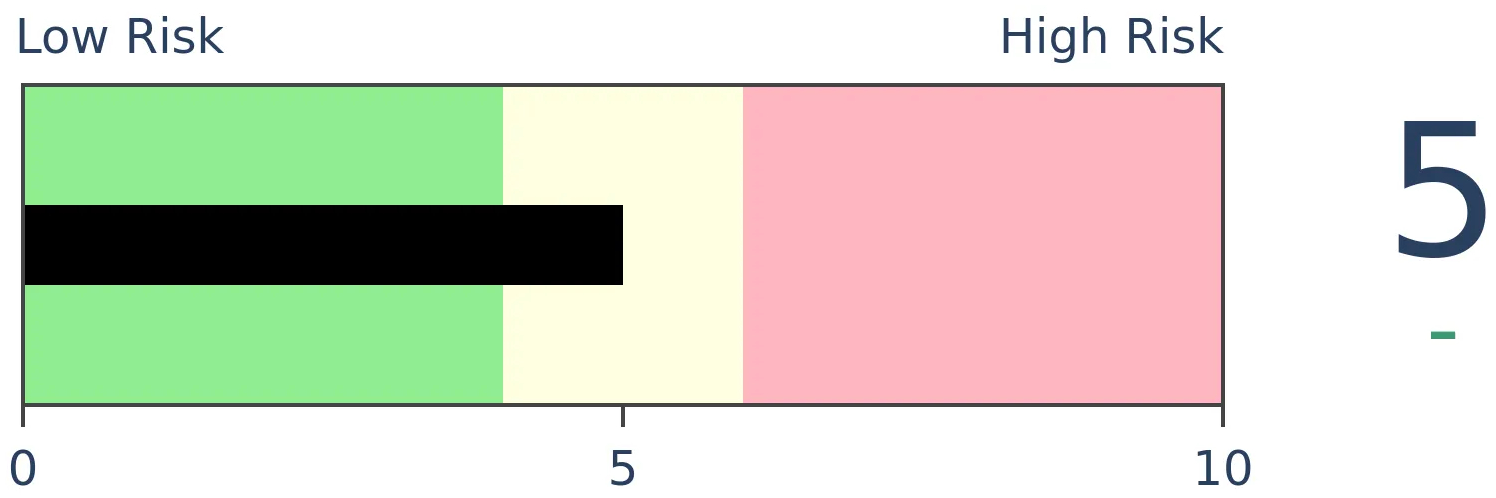
Crude Oil
|
|
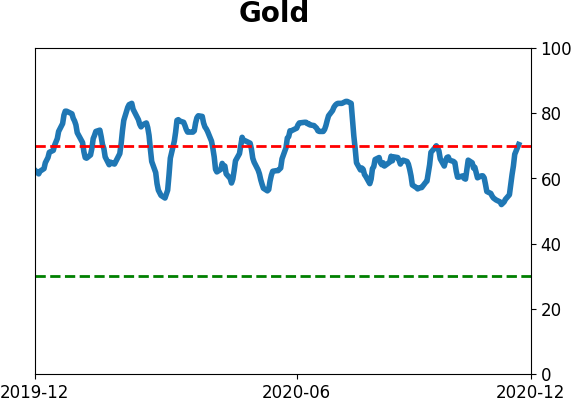
Gold
|
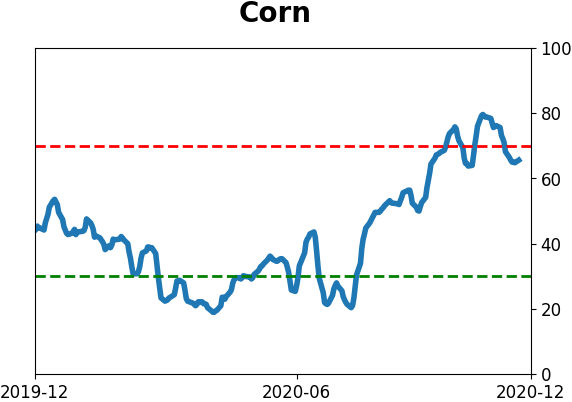
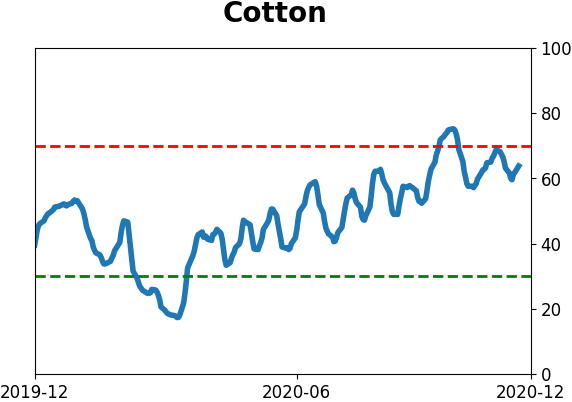
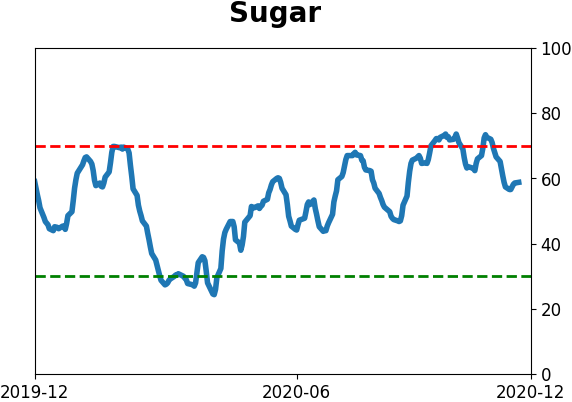
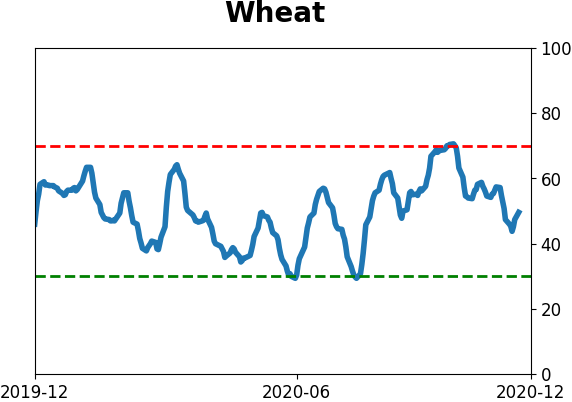
Agriculture
|
|
Research
BOTTOM LINE
The net number of securities hitting 52-week highs is the most dominant in 4 years. That has pushed long-term momentum above a key level, even as shorter-term measures relax. This kind of setup has been very positive for long-term returns.
FORECAST / TIMEFRAME
SPY -- Up, Long-Term
|
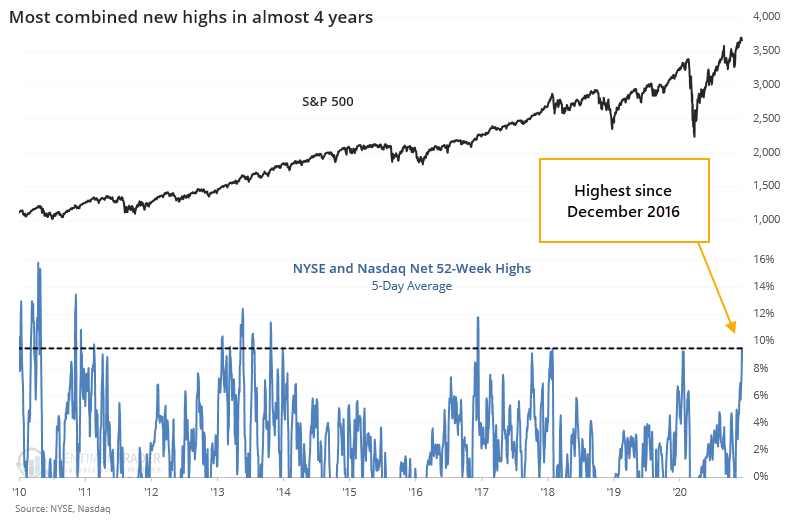
The biggest thing this rally has had going for it is broad participation. It's not slowing down much.
Over the past week, nearly 10% more securities trading on the NYSE and Nasdaq managed to tick at a 52-week high than fell to a 52-week low. That's the most in almost exactly 4 years.
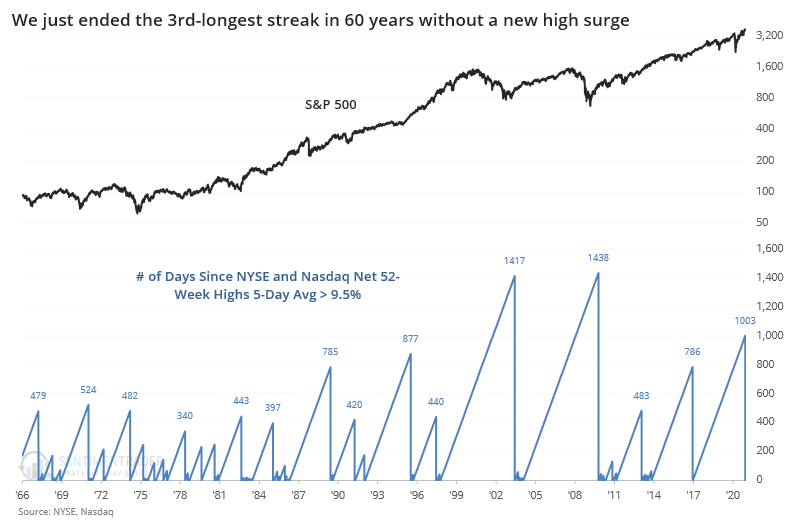
If that sounds like a long time, it's because it is. This ends the 3rd-longest streak in almost 60 years with fewer than a net 9.5% of securities at new highs over a 5-day period.
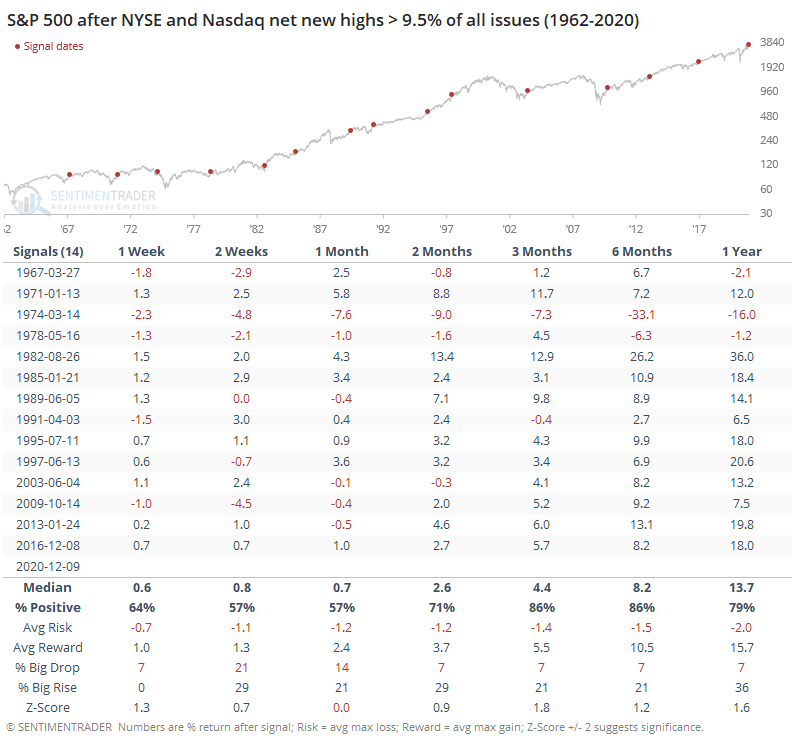
Below, we can see how the S&P 500 performed after ending a streak of at least 2 years with fewer than 9.5% of issues at a new high across both exchanges. The returns were impressive, and eerily consistent, over the medium- to long-term.
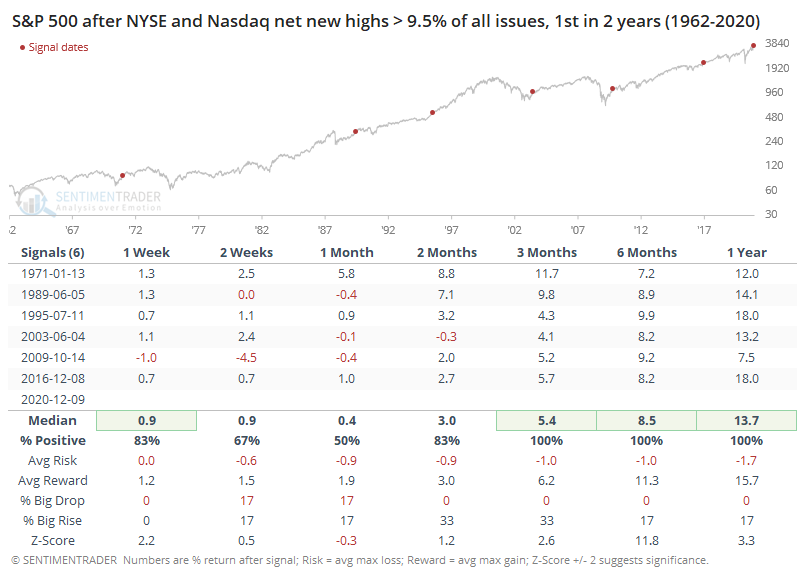
Those impressive longer-term returns shouldn't be too surprising, since it meshes with similar types of studies we looked at this fall. One of the standout features of these signals has been the impressively positive risk/reward ratios.
The Nasdaq did even better.
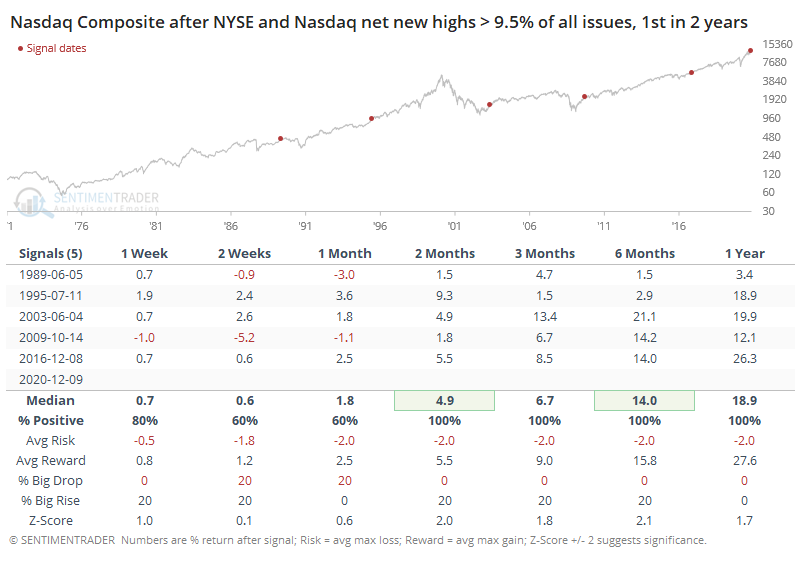
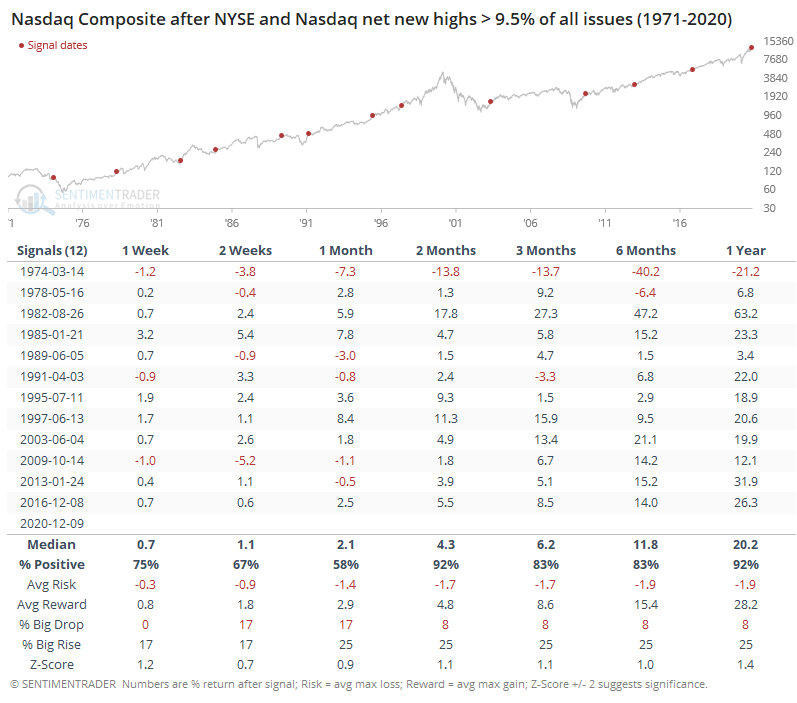
If we relax the parameters to get a larger sample size, then it's still quite positive. The table below shows returns after a streak longer than one year finally ended (instead of two years).
It was for good the Nasdaq as well, with only a loss in 1974 marring its one-year forward returns.
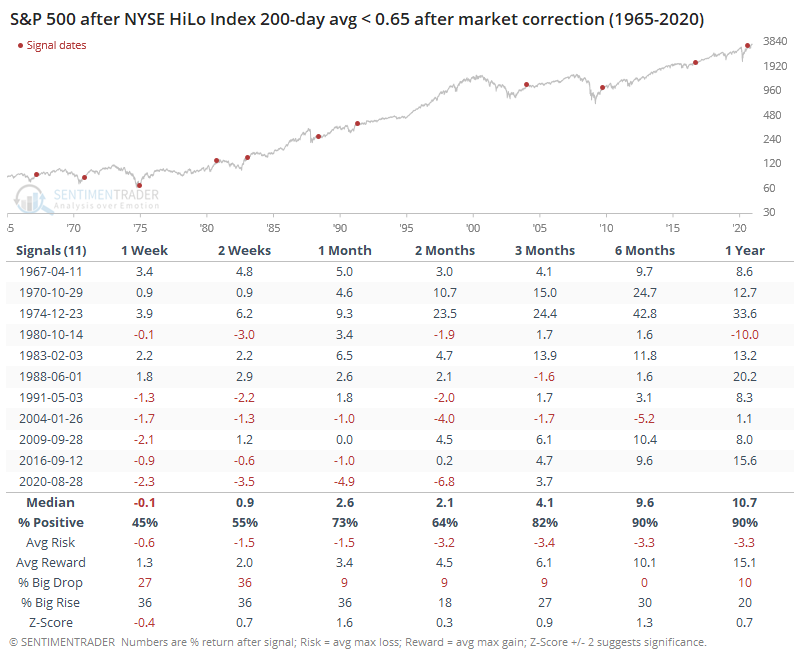
Because new highs have become so dominant, and new lows are almost nonexistent, the HiLo Logic Index has plunged over the past 200 days and is nearing a record low. The indicator will drop when either 52-week highs or 52-week lows dominate the market, and in practice that usually means new highs.
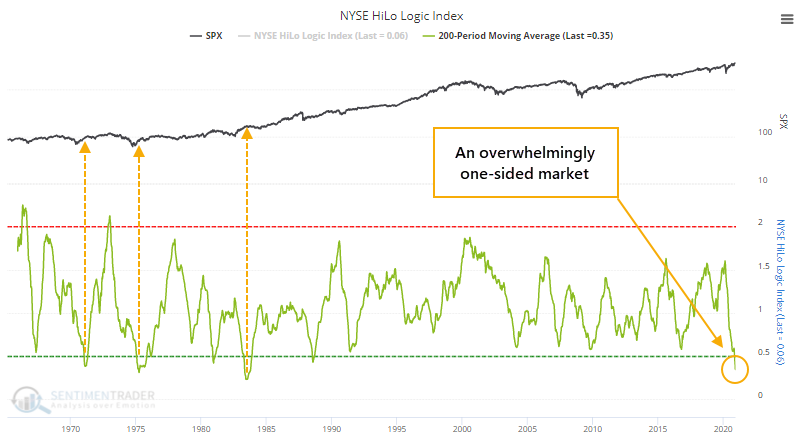
Back in January, we were looking at the opposite scenario. At the time, HiLo Logic was very high, and that has consistently preceded trouble, which it did again.
When the indicator drops to a very low level following a market correction, which it did way back in August, it has usually meant long-term gains.
The kind of sustained momentum it takes to push so many securities to new highs is the same kind that has pushed the McClellan Summation Index above +1,000. At the same time, some short-term choppiness has been enough to push the shorter-term Oscillator below zero for the first time in a month.
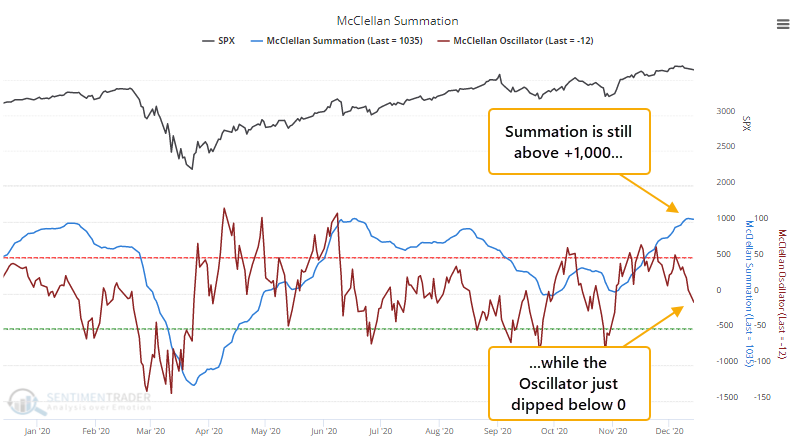
The last time we saw that was during the recovery from the year-end 2018 correction. It proved to be only a temporary setback, which was more the rule than the exception.
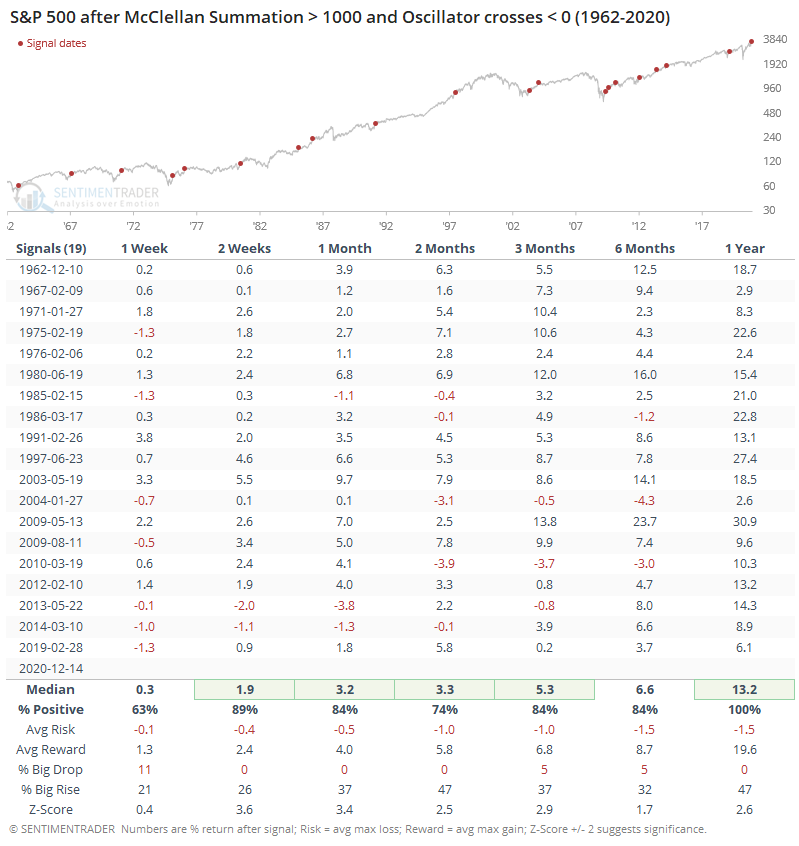
We can see above that out of the 19 other times that this triggered since 1962, the S&P saw only 3 losses over the next 3 months, and 2 of those were less than -1%. Over the next year, all 19 showed a positive return, once again with an exceptionally positive risk/reward skew and a tremendously better probability of seeing a big rise than a big decline (see the Knowledge Base for more info on these terms).
There is really no way to perfectly square the conflict that's happening right now between high (even record-breaking) optimistic sentiment versus high (even record-breaking) momentum. There is almost always a conflict between them, which is why we spend a lot of time looking at the quality of participation and momentum - to see if it's the type that can consistently overrule sentiment extremes.
The market has never really undergone a conflict as severe as the current one, which is a challenge. Those who are bearish, or under-invested, will prefer to look at the negatives from extreme sentiment. Those who aren't will prefer to comfort themselves with high momentum readings.
Objectively, the most likely scenario is limited, choppy upside at best, with a high probability of a 3%-8% minimum pullback over the next 1-2 months. Buying breakouts with leveraged positions in this kind of environment is highly risky. Shorting isn't much better, since momentum conditions like this can continue for weeks or months before it finally cracks. That leaves both sides with a poor setup.
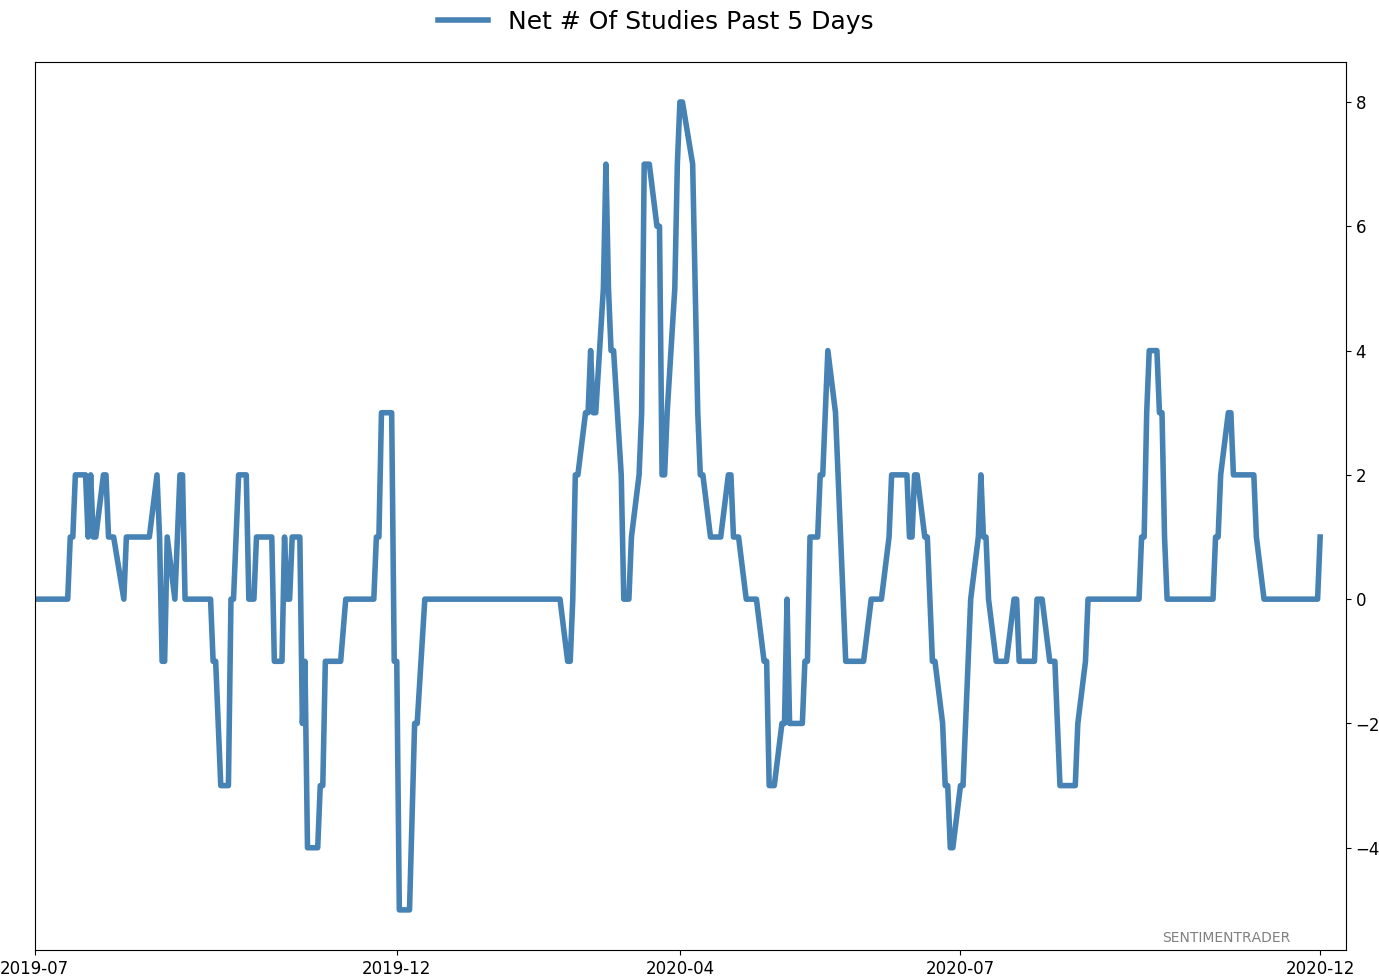
Active Studies
| Time Frame | Bullish | Bearish | | Short-Term | 0 | 1 | | Medium-Term | 5 | 8 | | Long-Term | 53 | 2 |
|
Indicators at Extremes
Portfolio
| Position | Description | Weight % | Added / Reduced | Date | | Stocks | 10.4% VWO, 9.1% XLE, 8.5% RSP, 6.6% PSCE | 34.5 | Reduced 6.7% | 2020-12-14 | | Bonds | 10% BND, 10% SCHP, 10% ANGL | 28.4 | Reduced 0.1% | 2020-10-02 | | Commodities | GCC | 2.4 | Reduced 2.1%
| 2020-09-04 | | Precious Metals | GDX | 8.9 | Added 4.8% | 2020-12-01 | | Special Situations | | 0.0 | Reduced 5% | 2020-10-02 | | Cash | | 25.8 | | |
|
Updates (Changes made today are underlined)
Quite a few of the studies that have been triggering for stocks have showed a poor risk/reward skew over a short- to medium-term time frame, even though many of them have also been quite positive over medium- to long-term time frames. We're in a very favorable seasonal window, so it would be somewhat odd to see a substantial pullback in the next few weeks. Leave it to 2020 to do just that, I suppose, but the calendar is a point in bulls' favor. Even so, record-high-and-declining sentiment, coupled with early signs of a reversal were enough that I reduced my S&P 500 position a bit. I fully expect that the energy funds will suffer some losses in the coming weeks, but as I noted when buying them, they're intended as long-term positions and almost by definition they're going to be volatile. RETURN YTD: 8.0% 2019: 12.6%, 2018: 0.6%, 2017: 3.8%, 2016: 17.1%, 2015: 9.2%, 2014: 14.5%, 2013: 2.2%, 2012: 10.8%, 2011: 16.5%, 2010: 15.3%, 2009: 23.9%, 2008: 16.2%, 2007: 7.8%
|
|
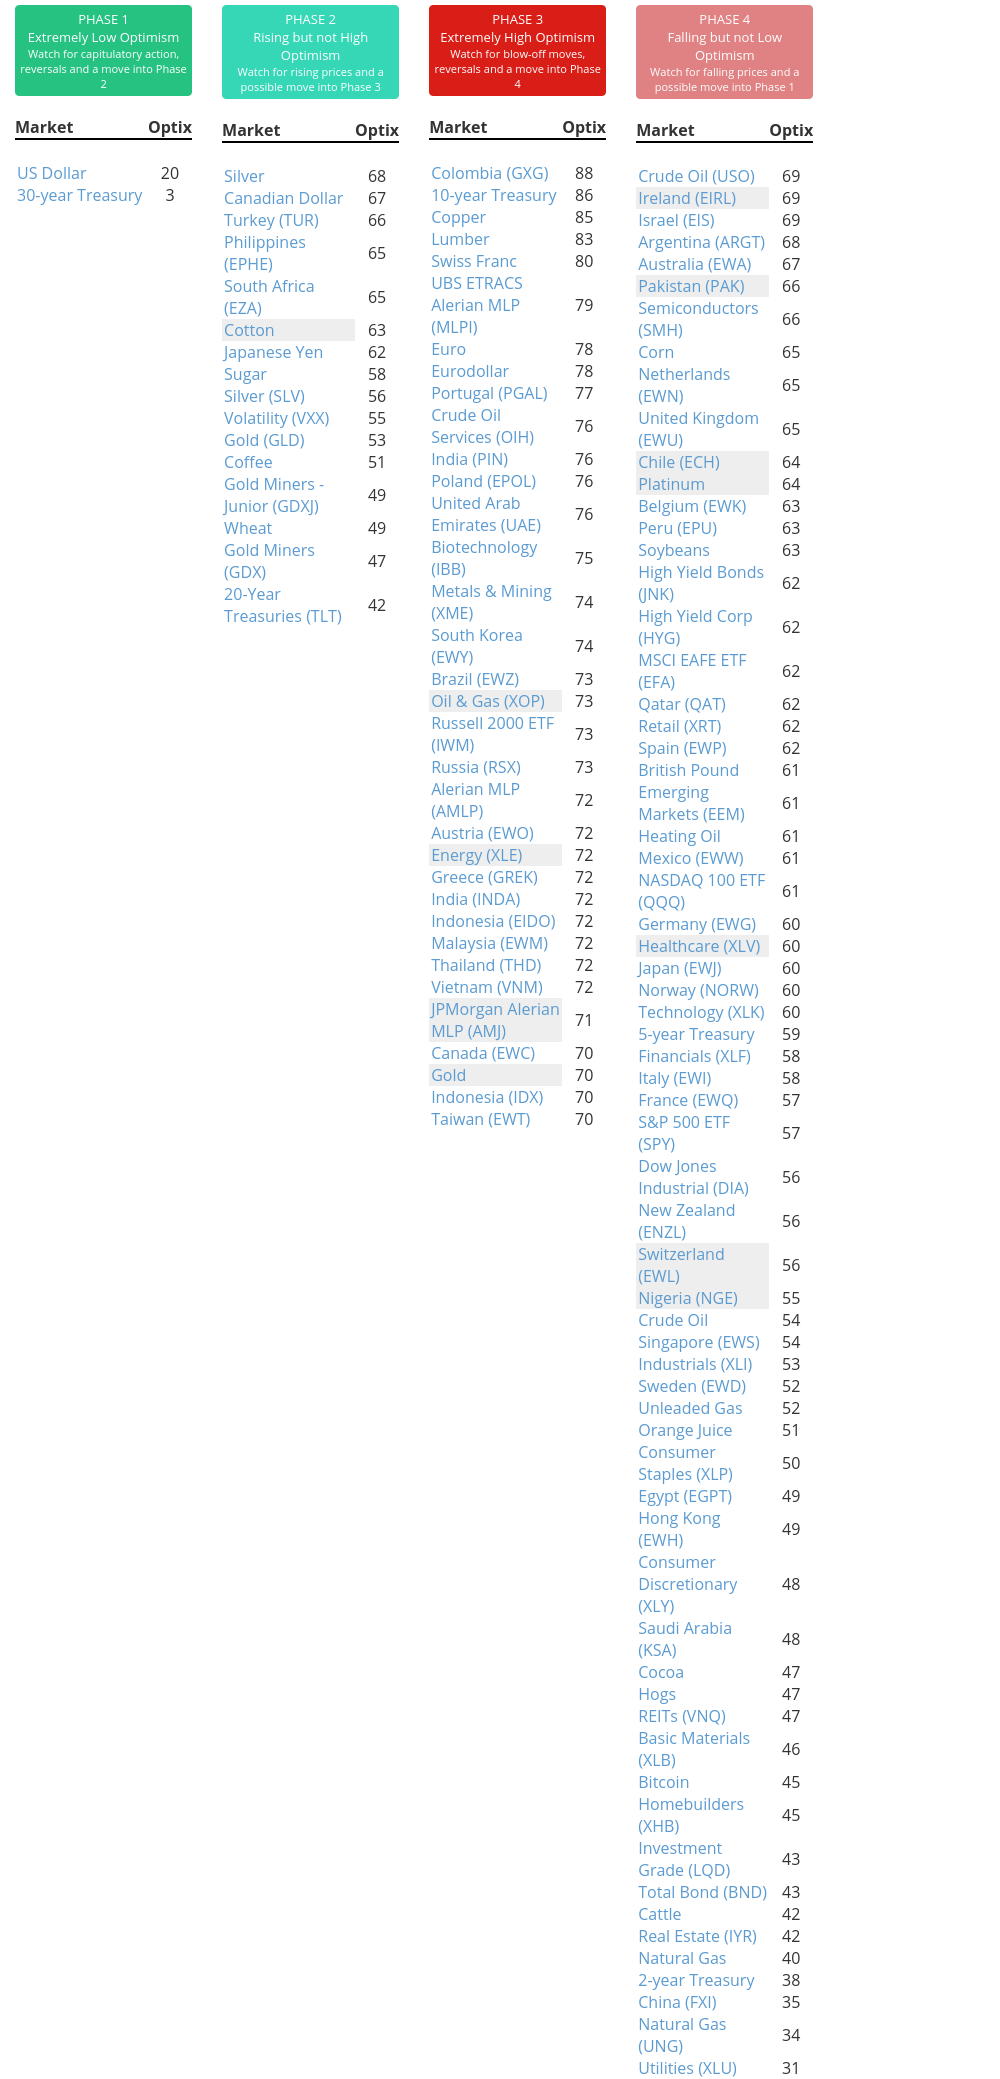
Phase Table
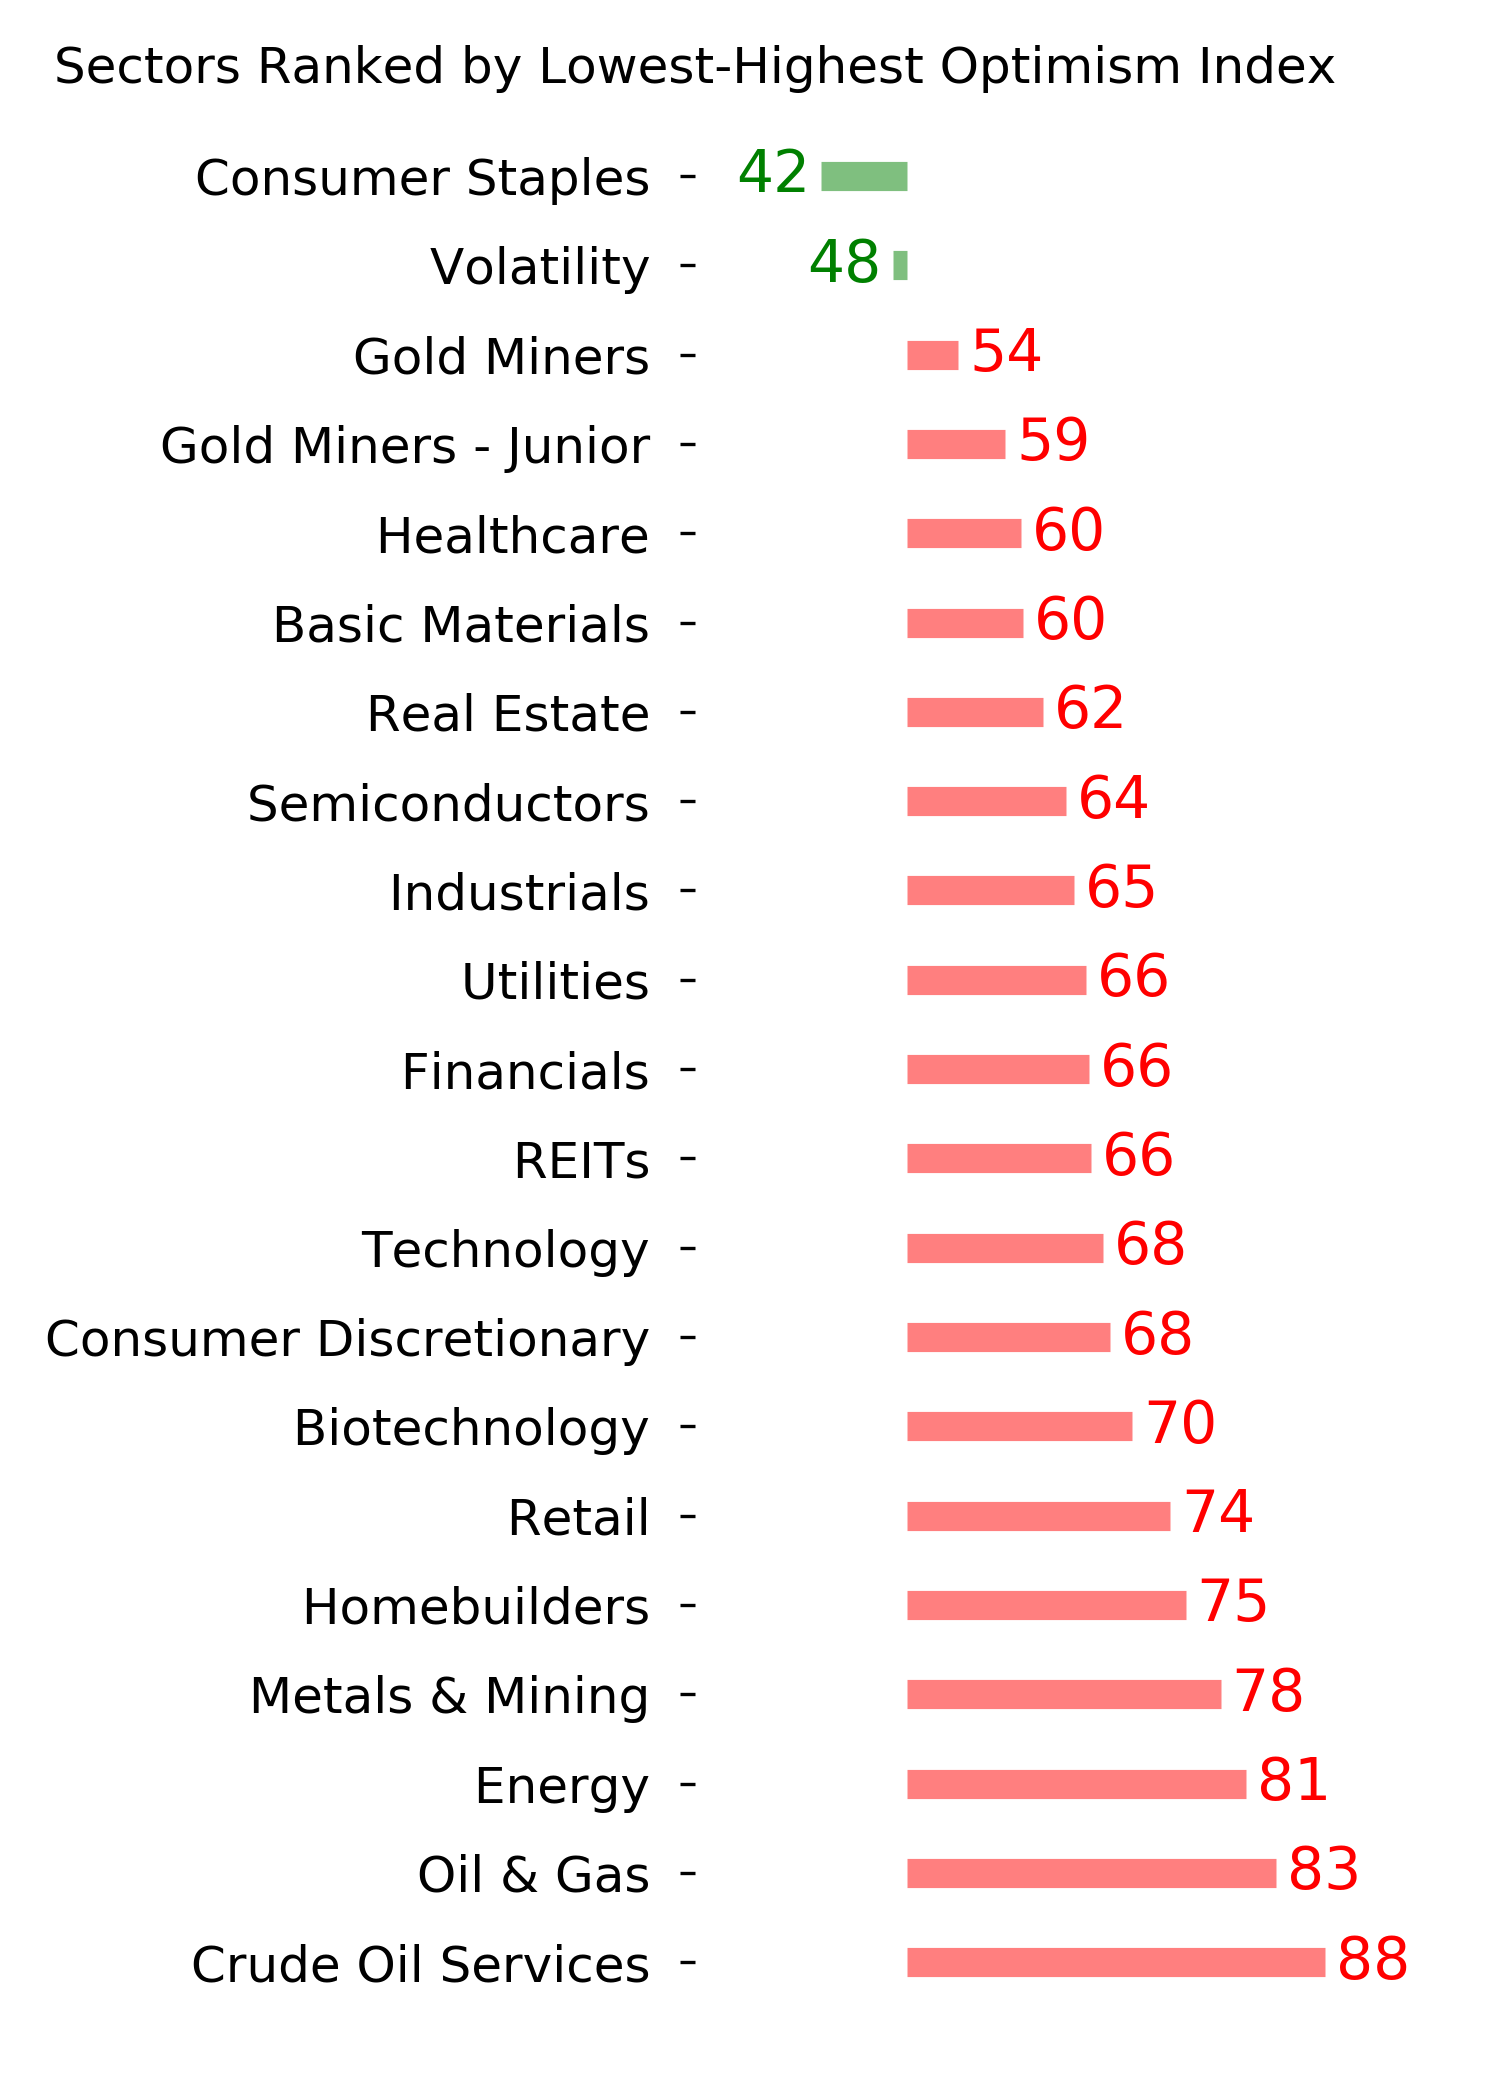
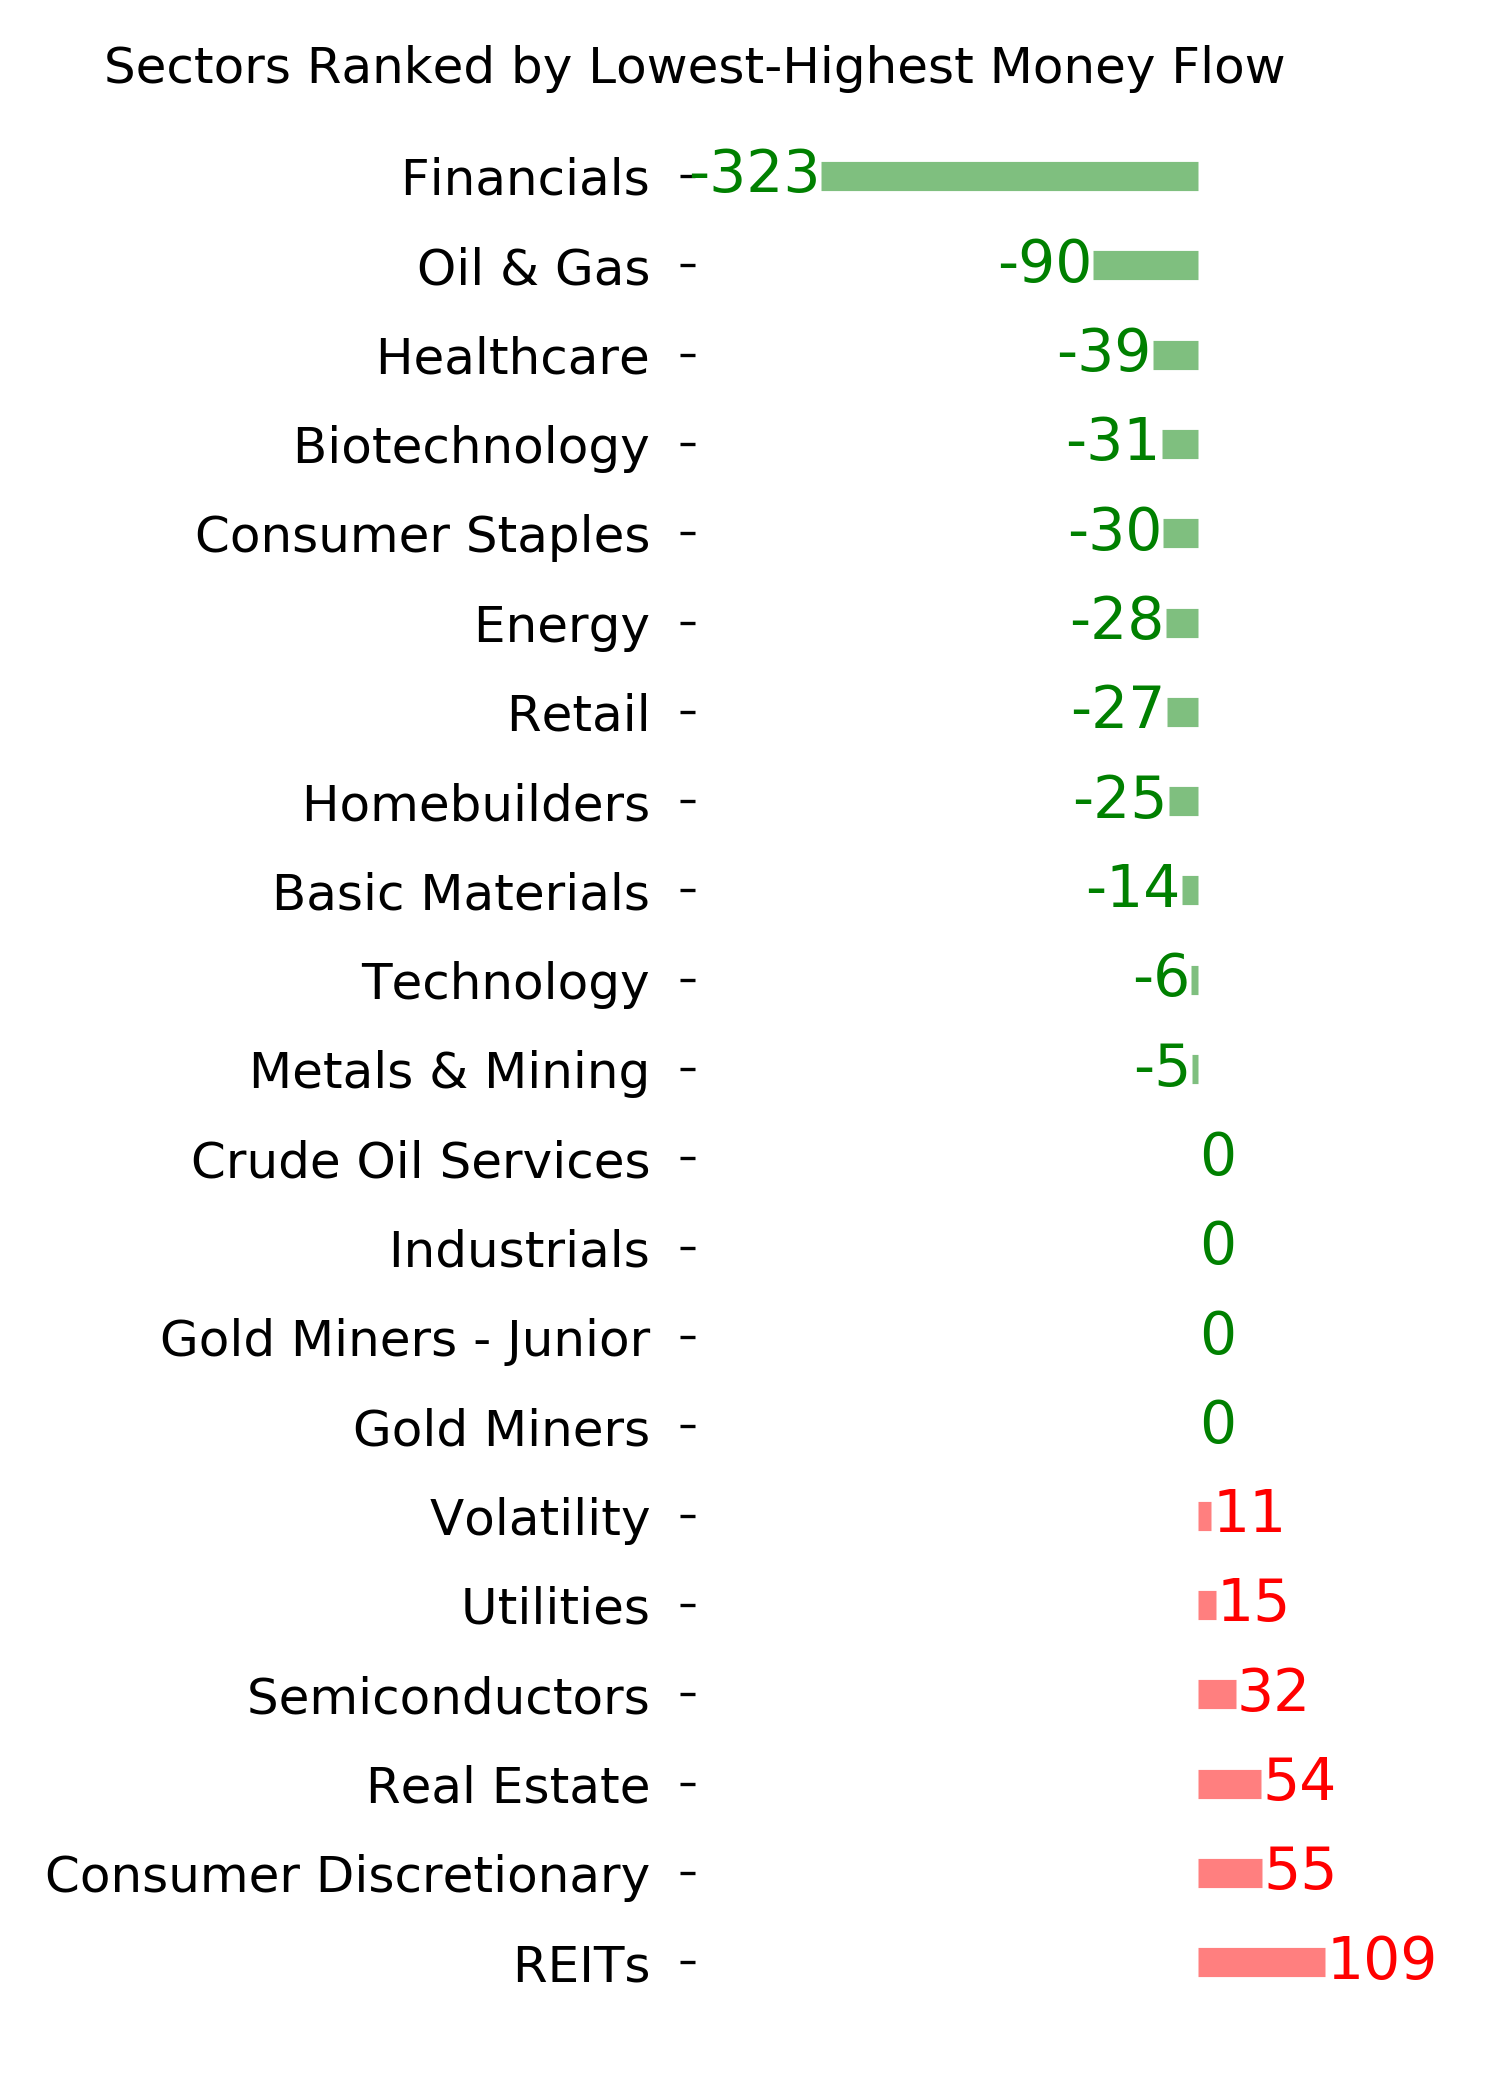
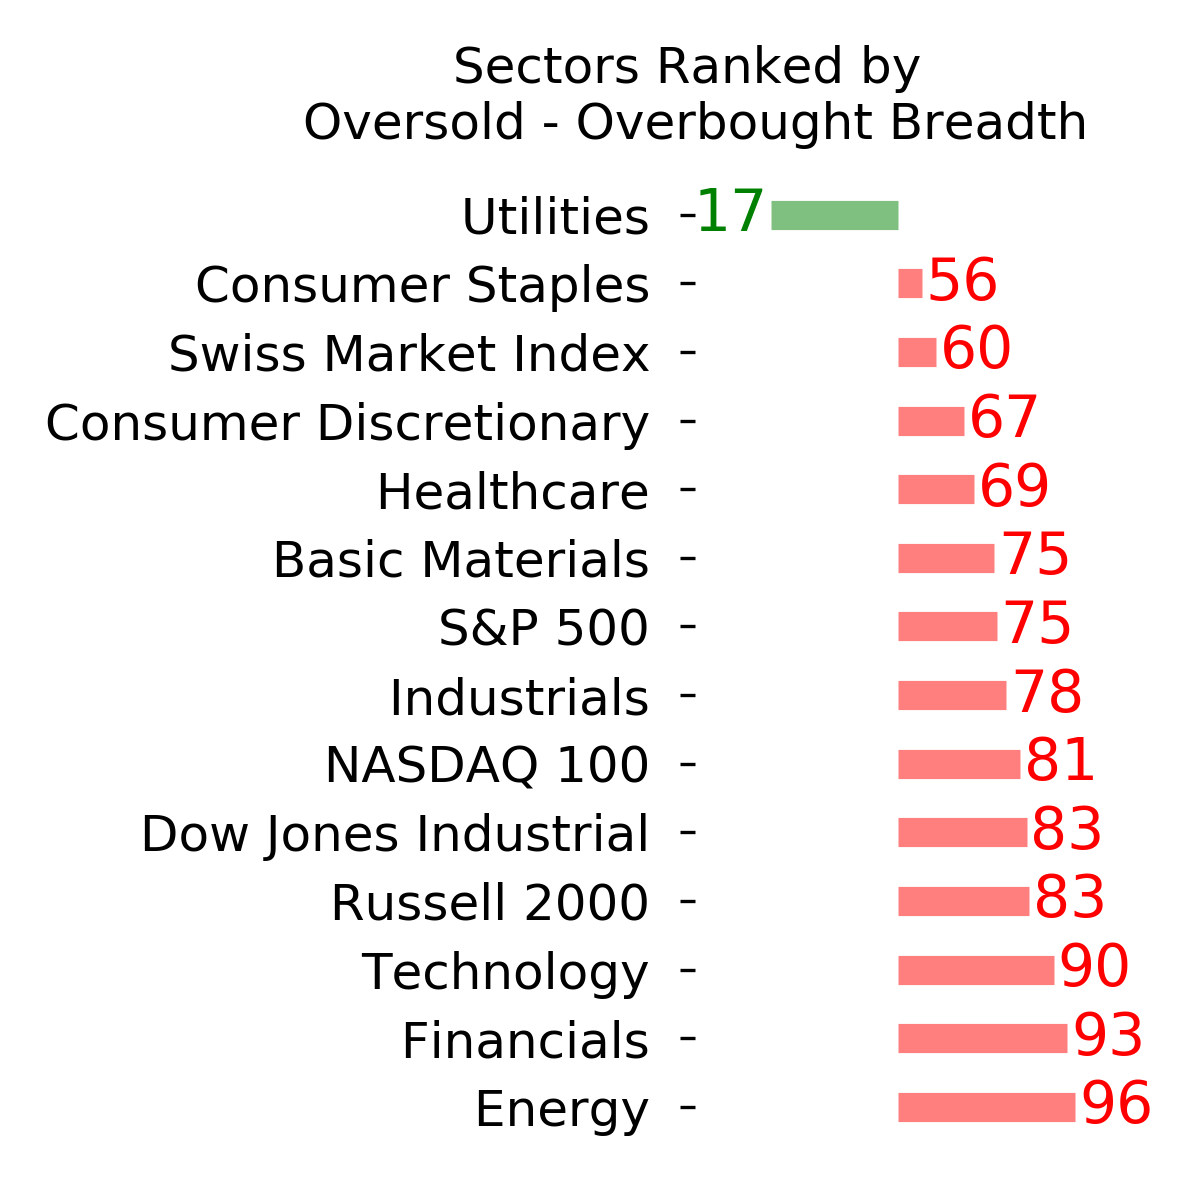
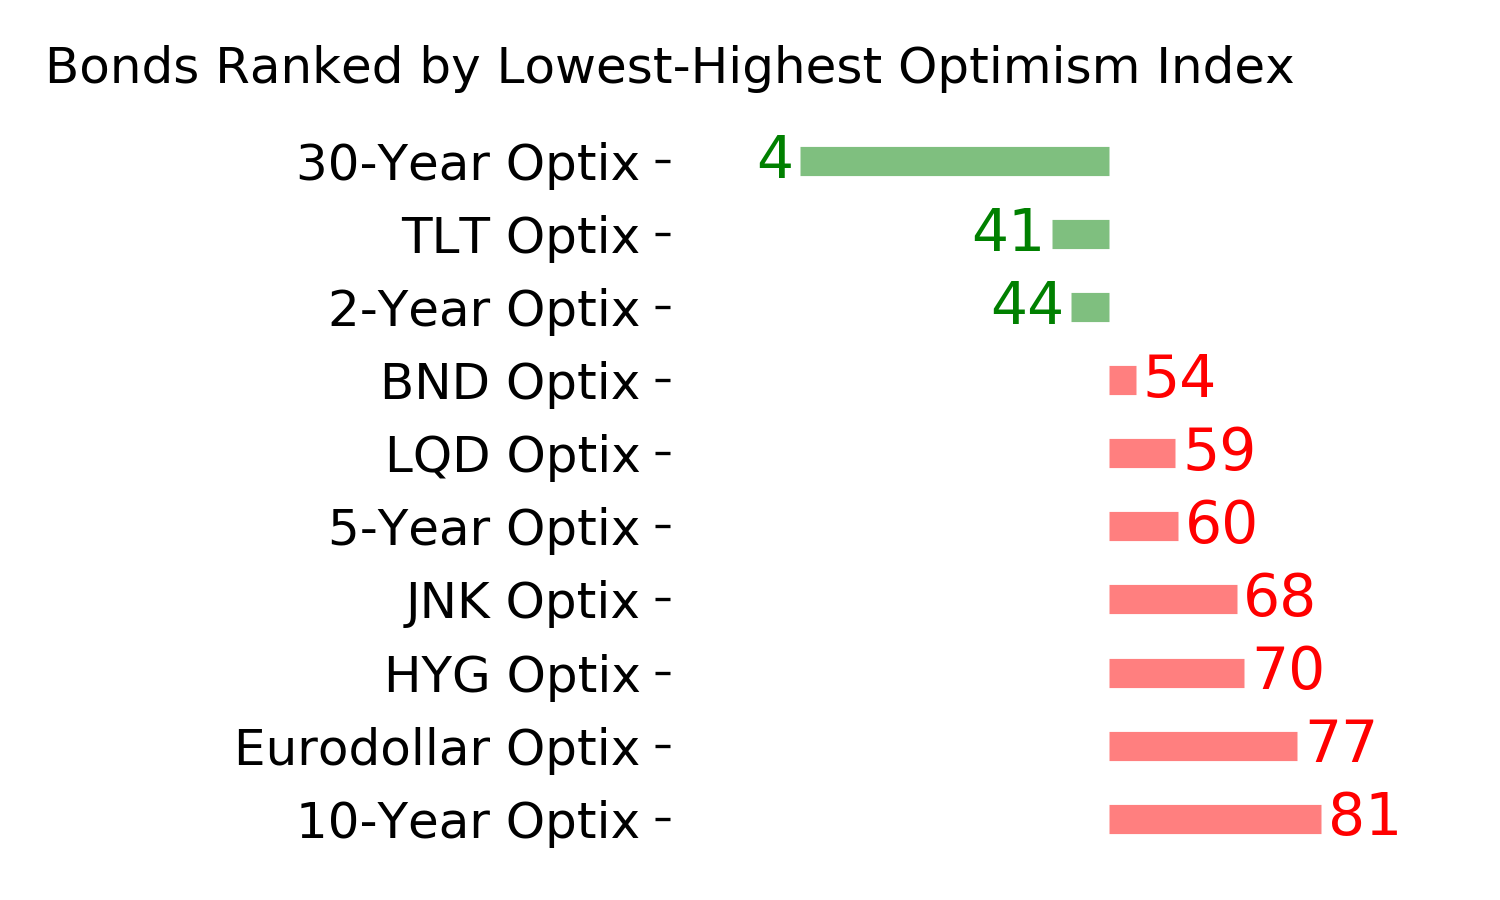
Ranks
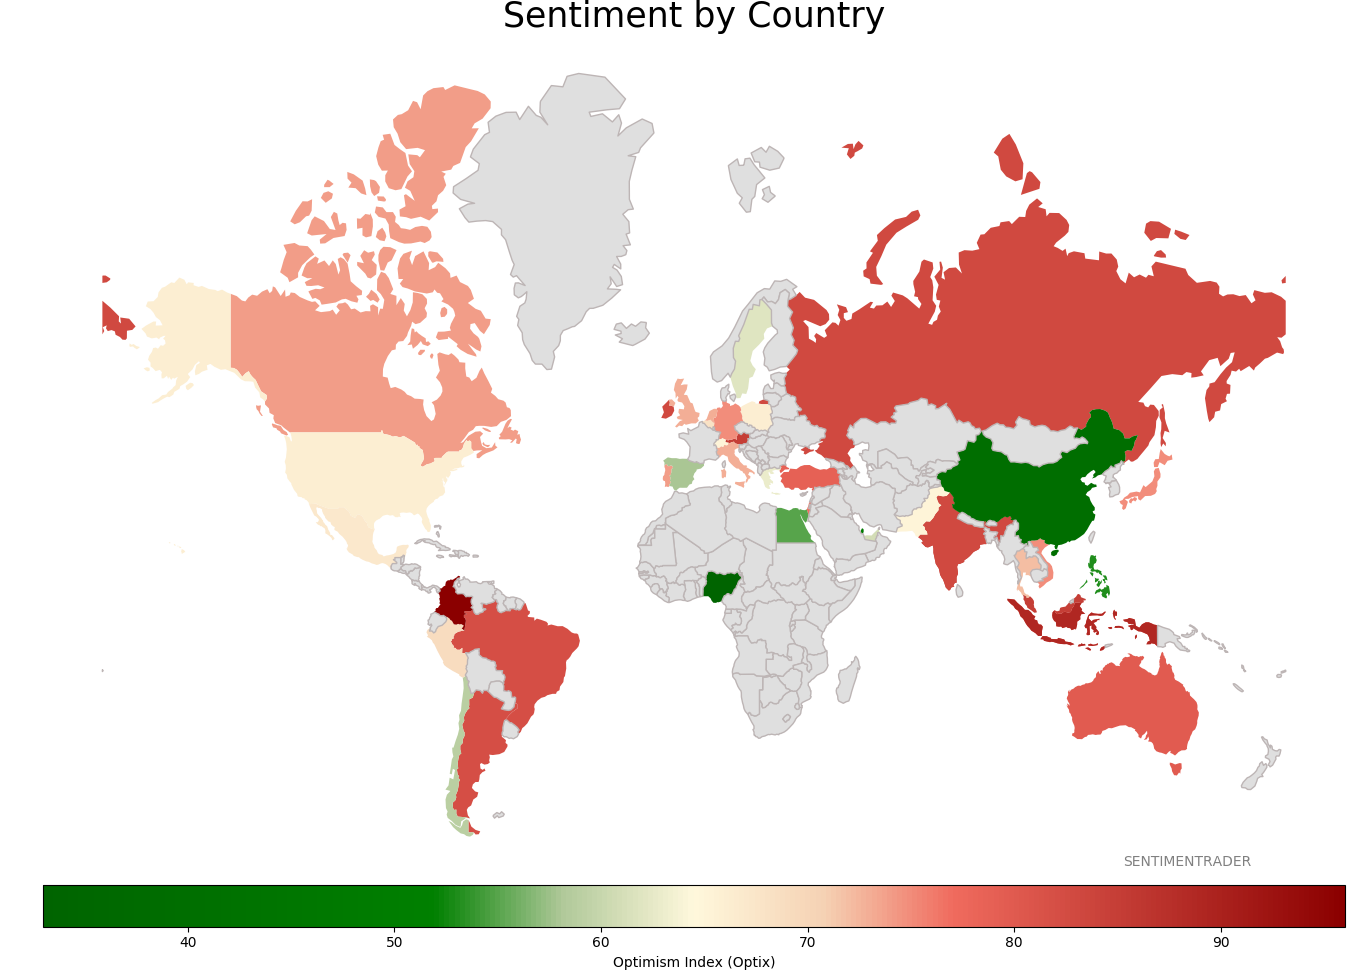
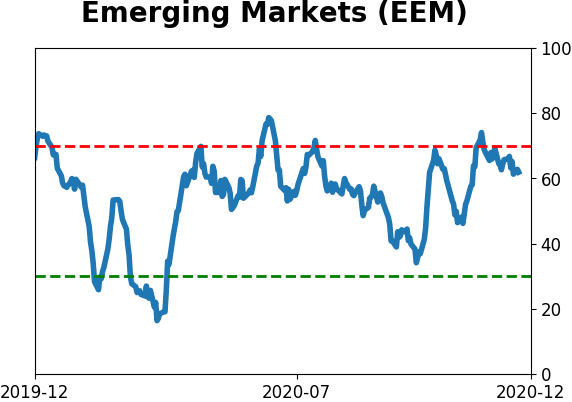
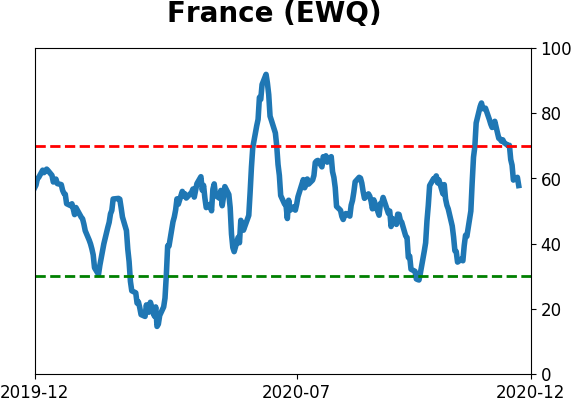
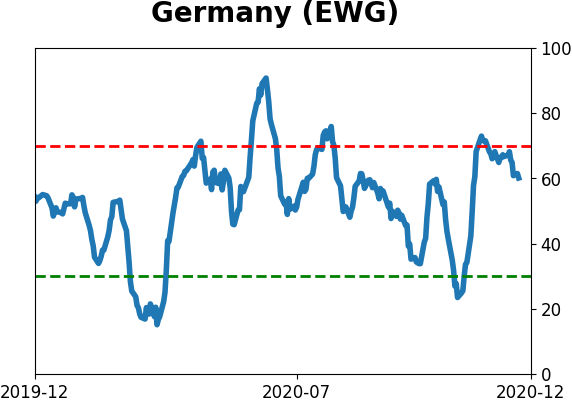
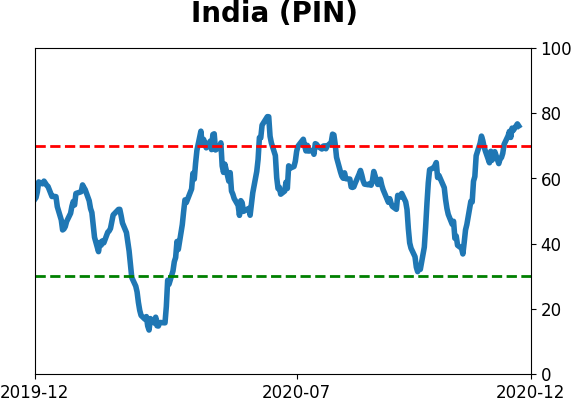
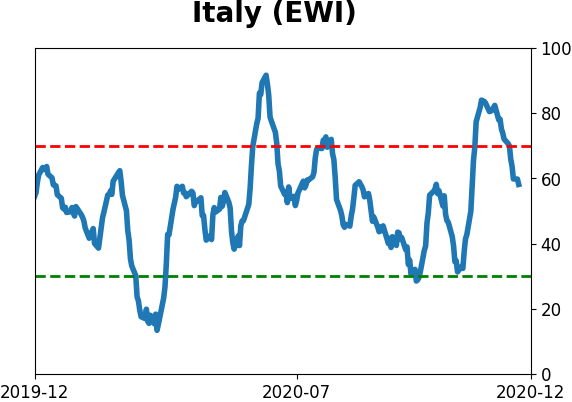
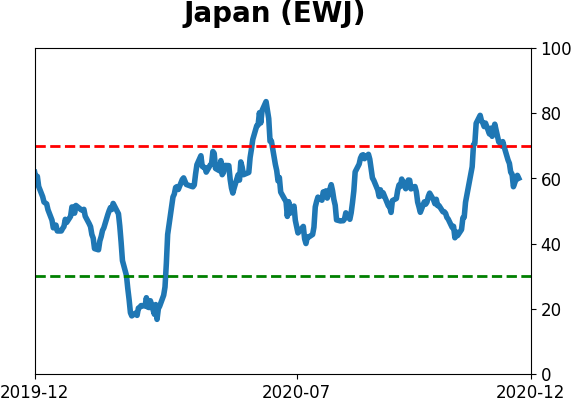
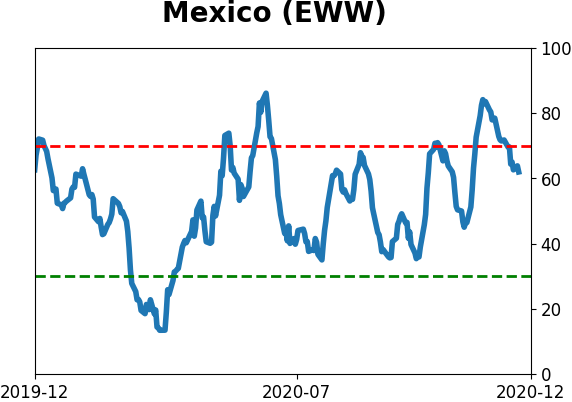
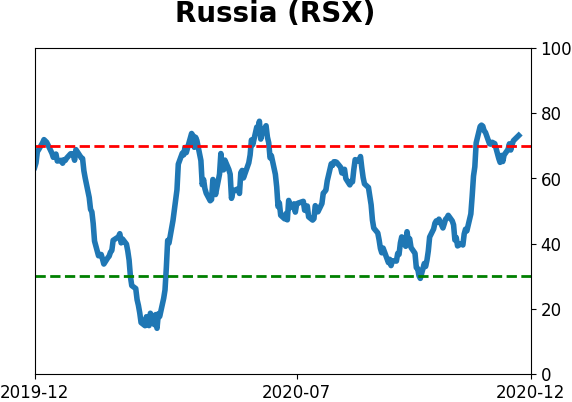
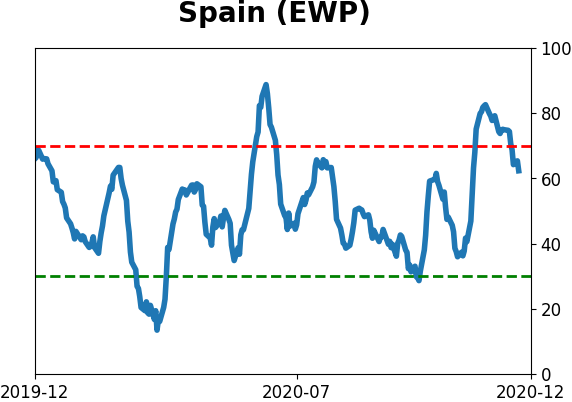
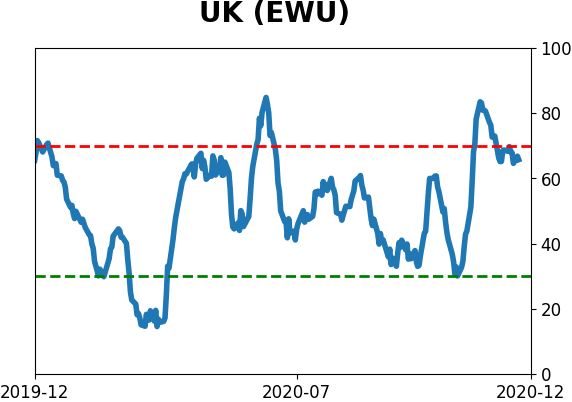
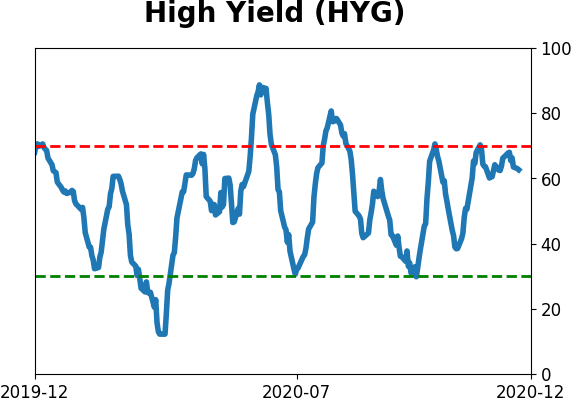
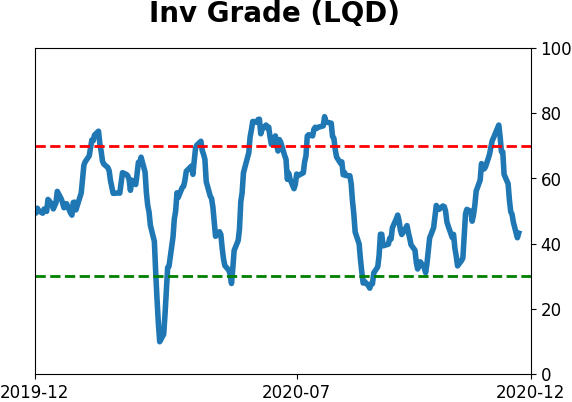
Sentiment Around The World
Optimism Index Thumbnails
|
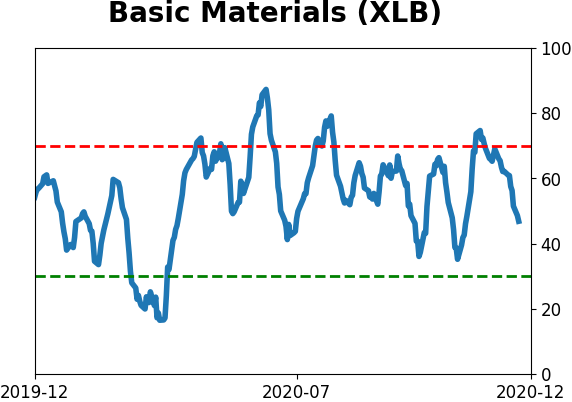
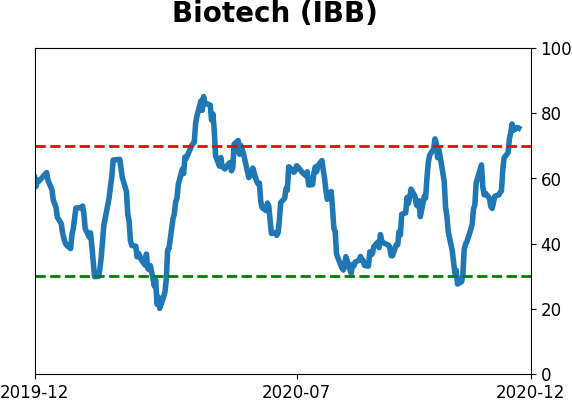
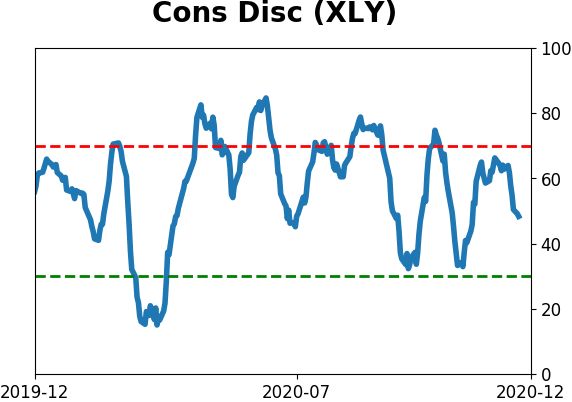
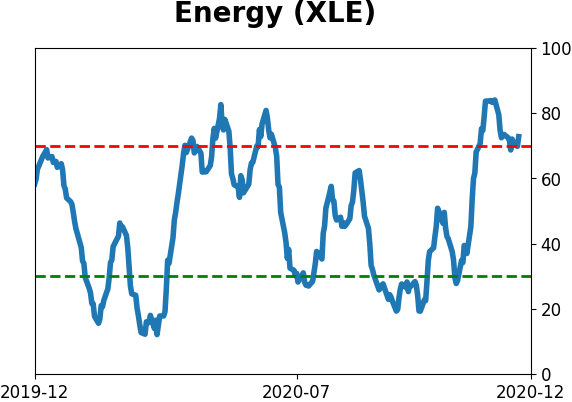
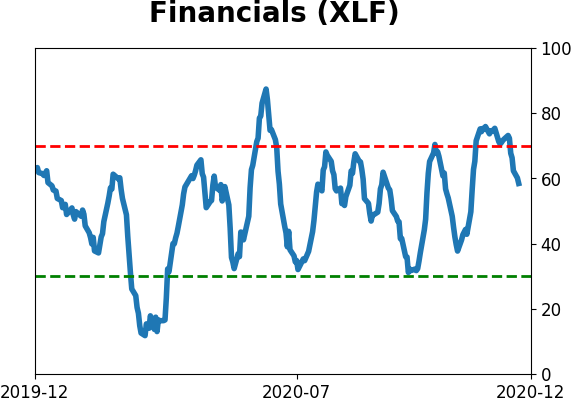
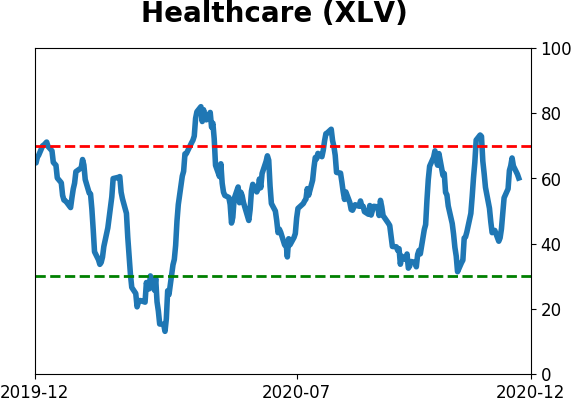
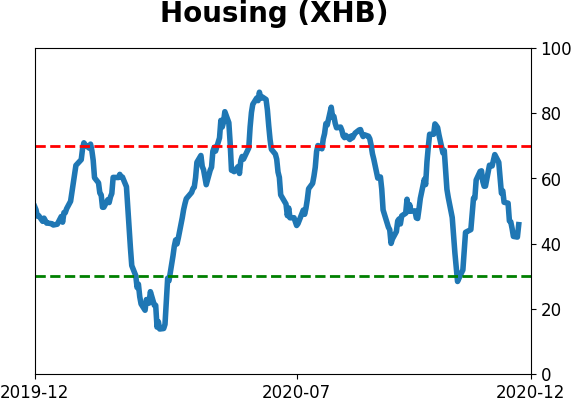
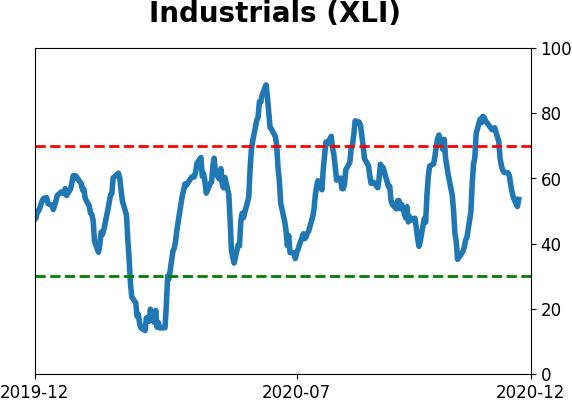
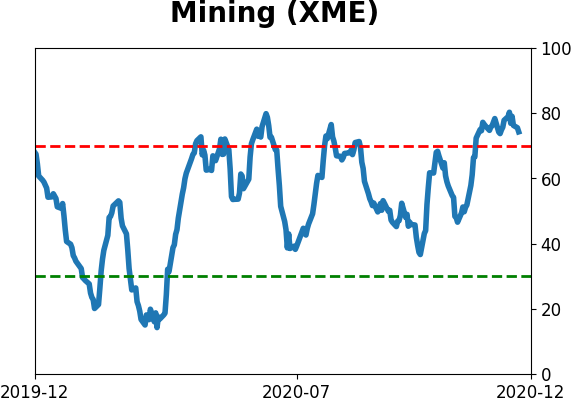
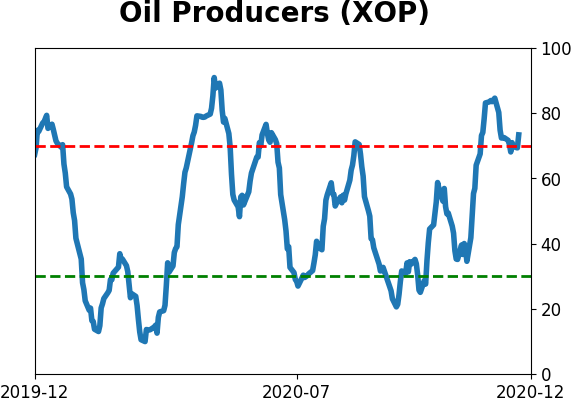
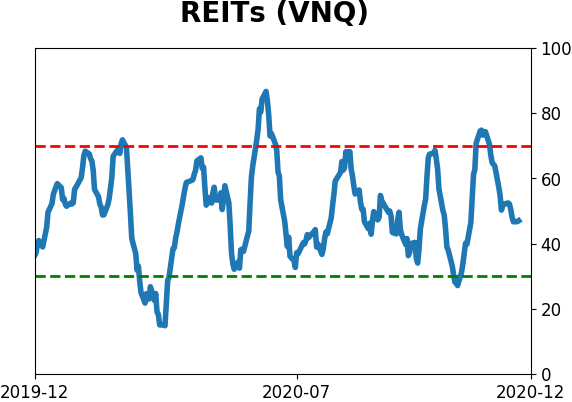
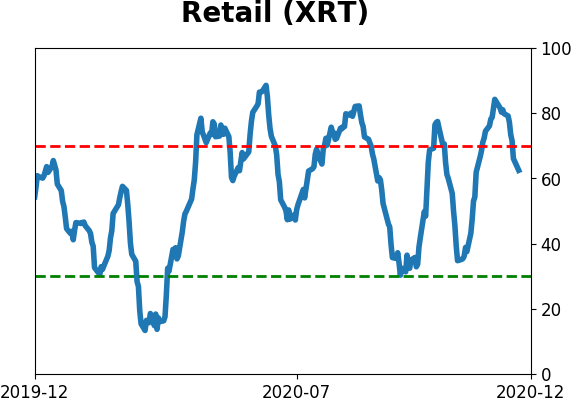
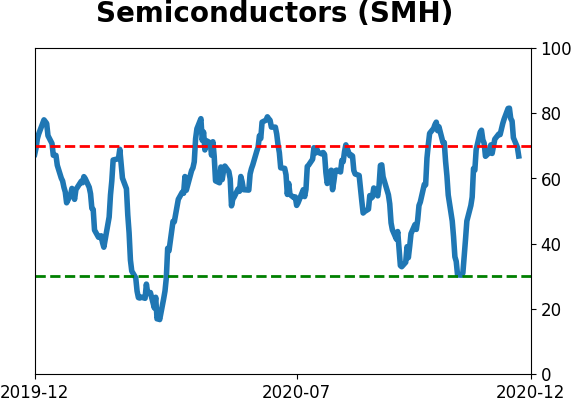
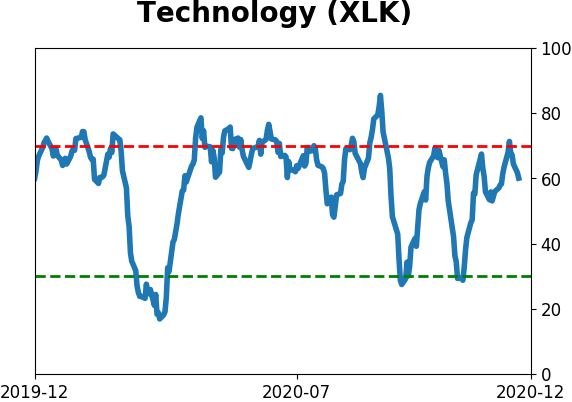
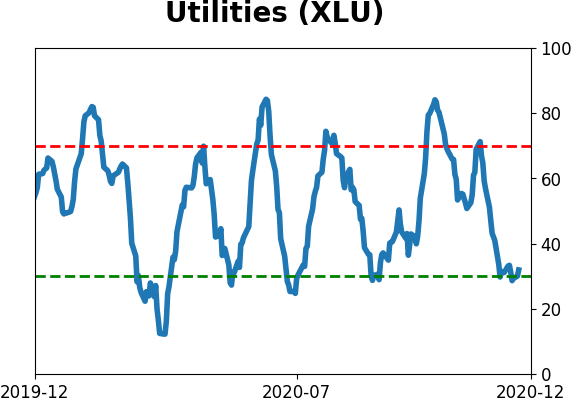
Sector ETF's - 10-Day Moving Average
|
|
|
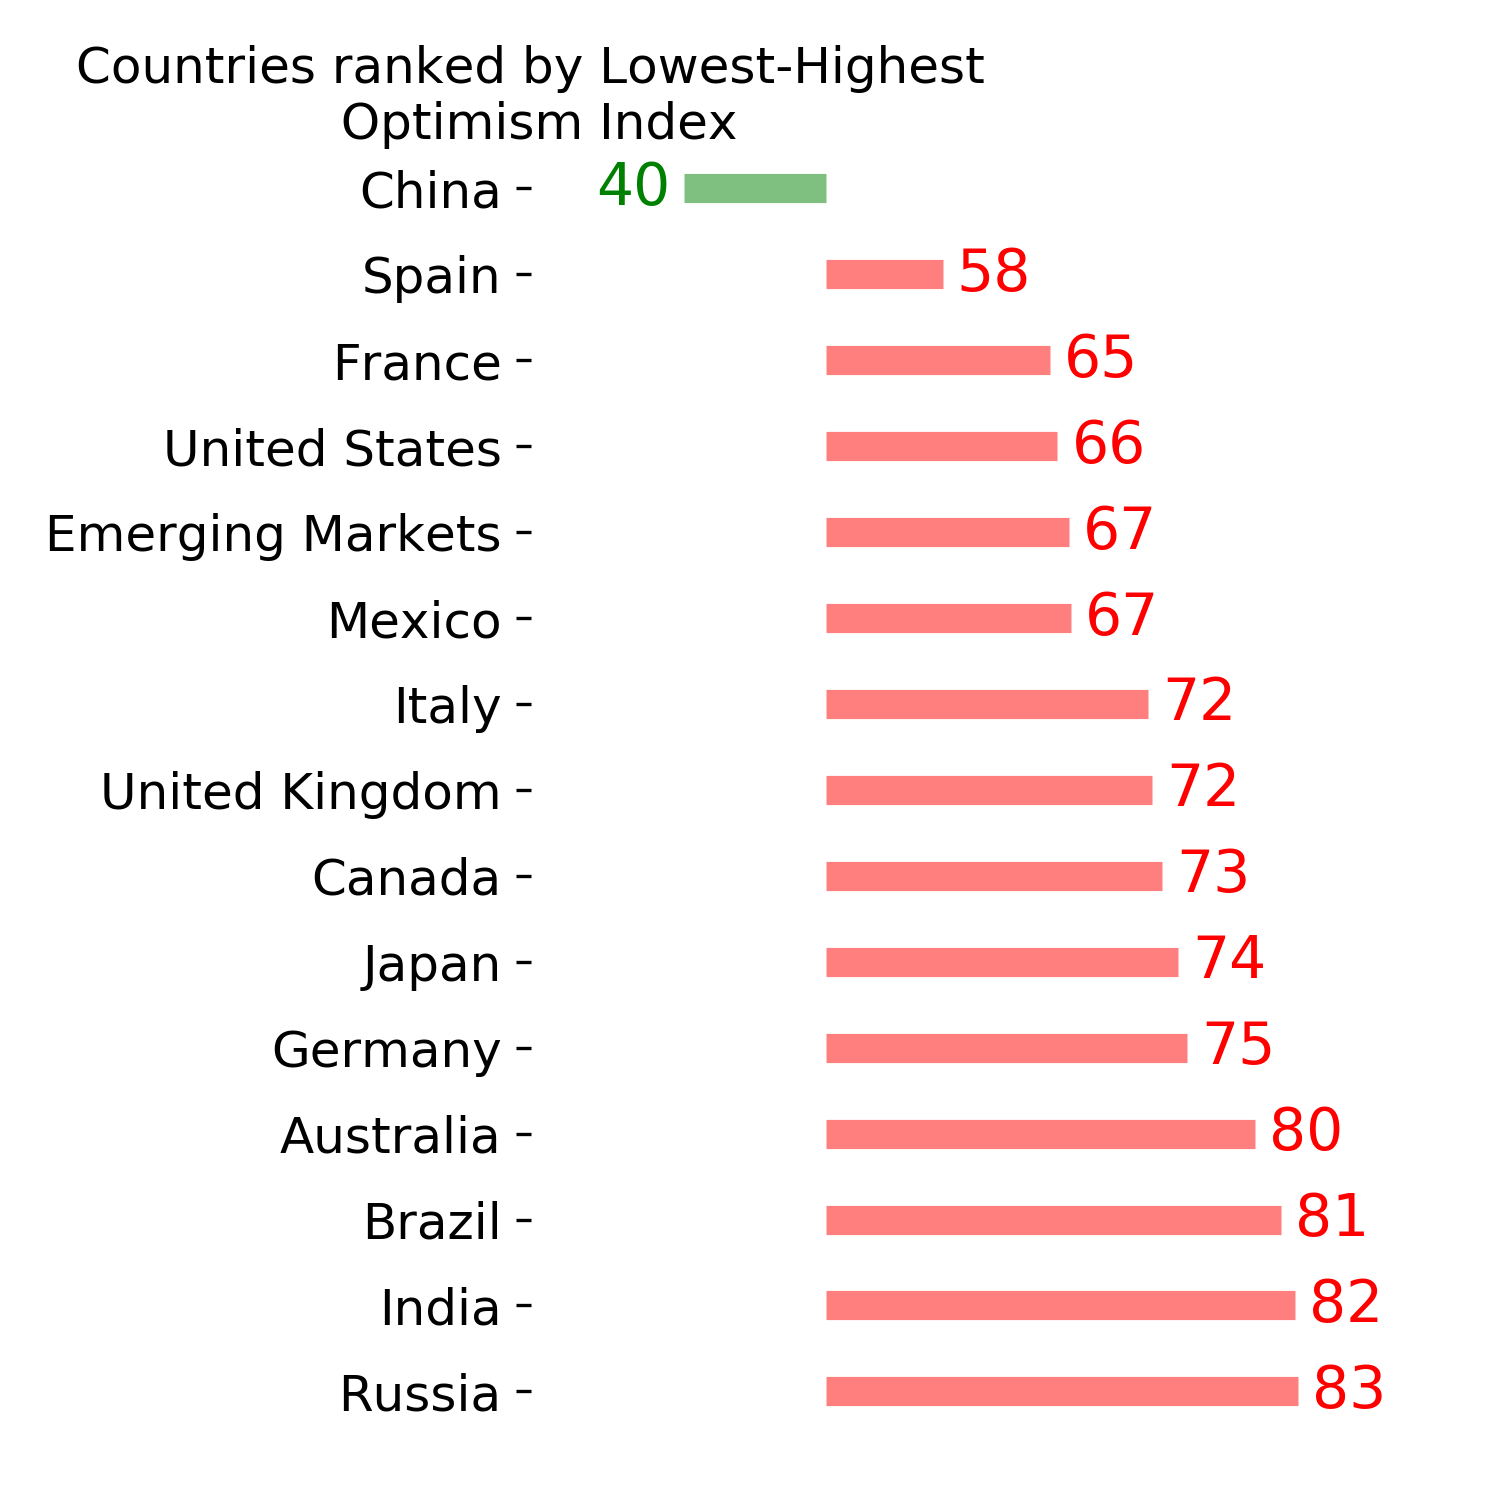
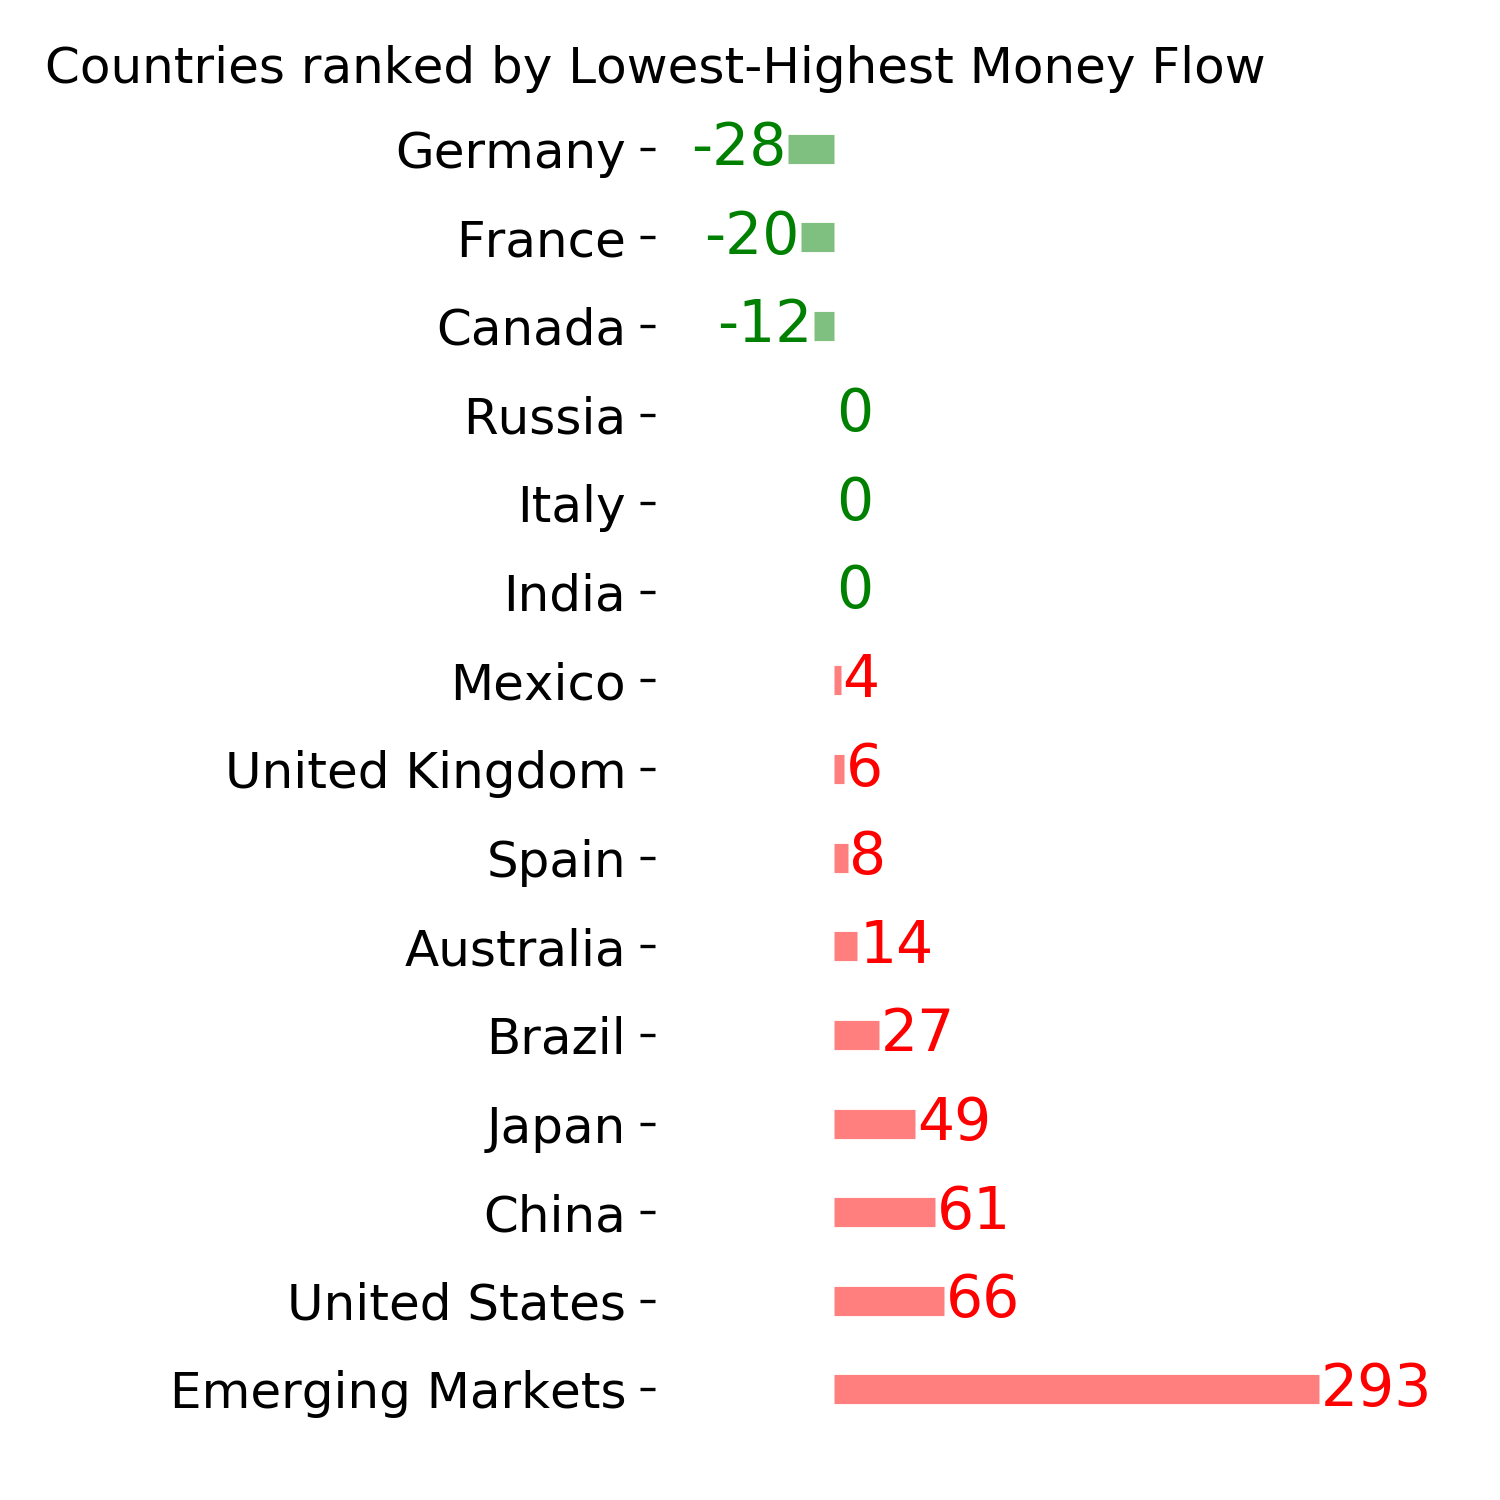
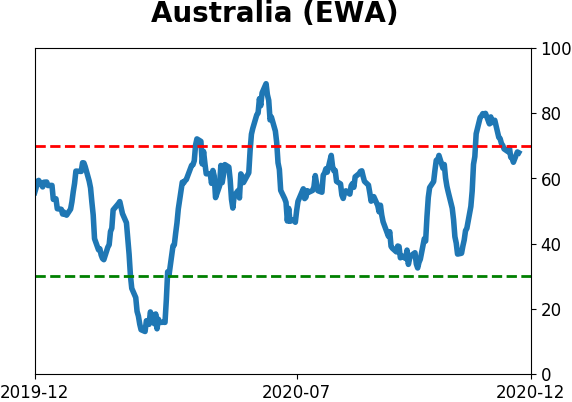
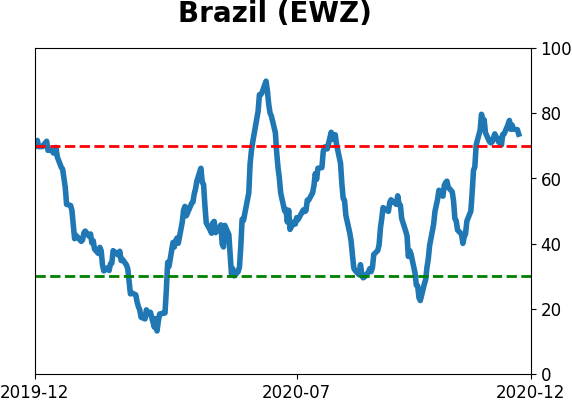
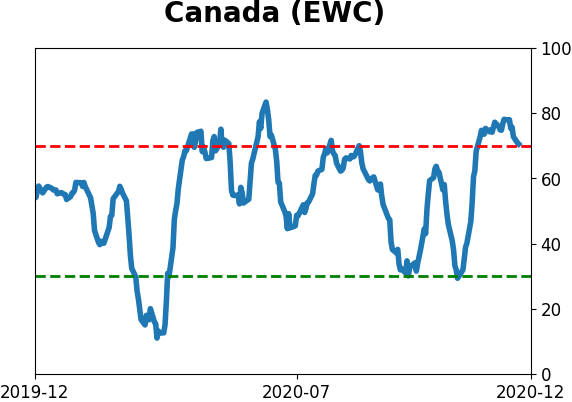
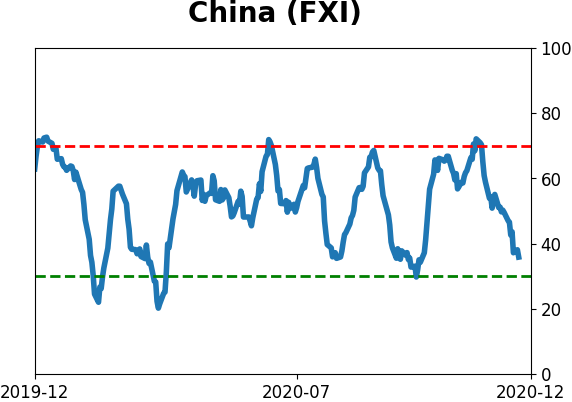
Country ETF's - 10-Day Moving Average
|
|
|
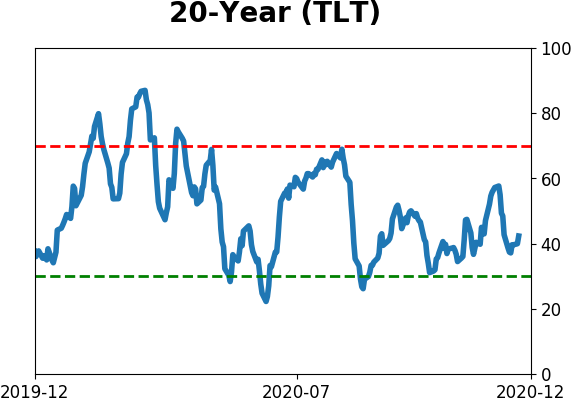
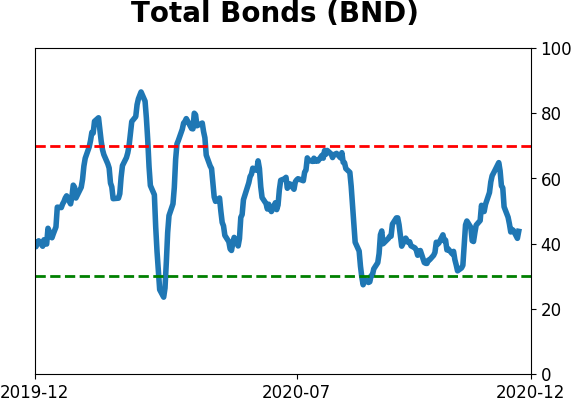
Bond ETF's - 10-Day Moving Average
|
|
|
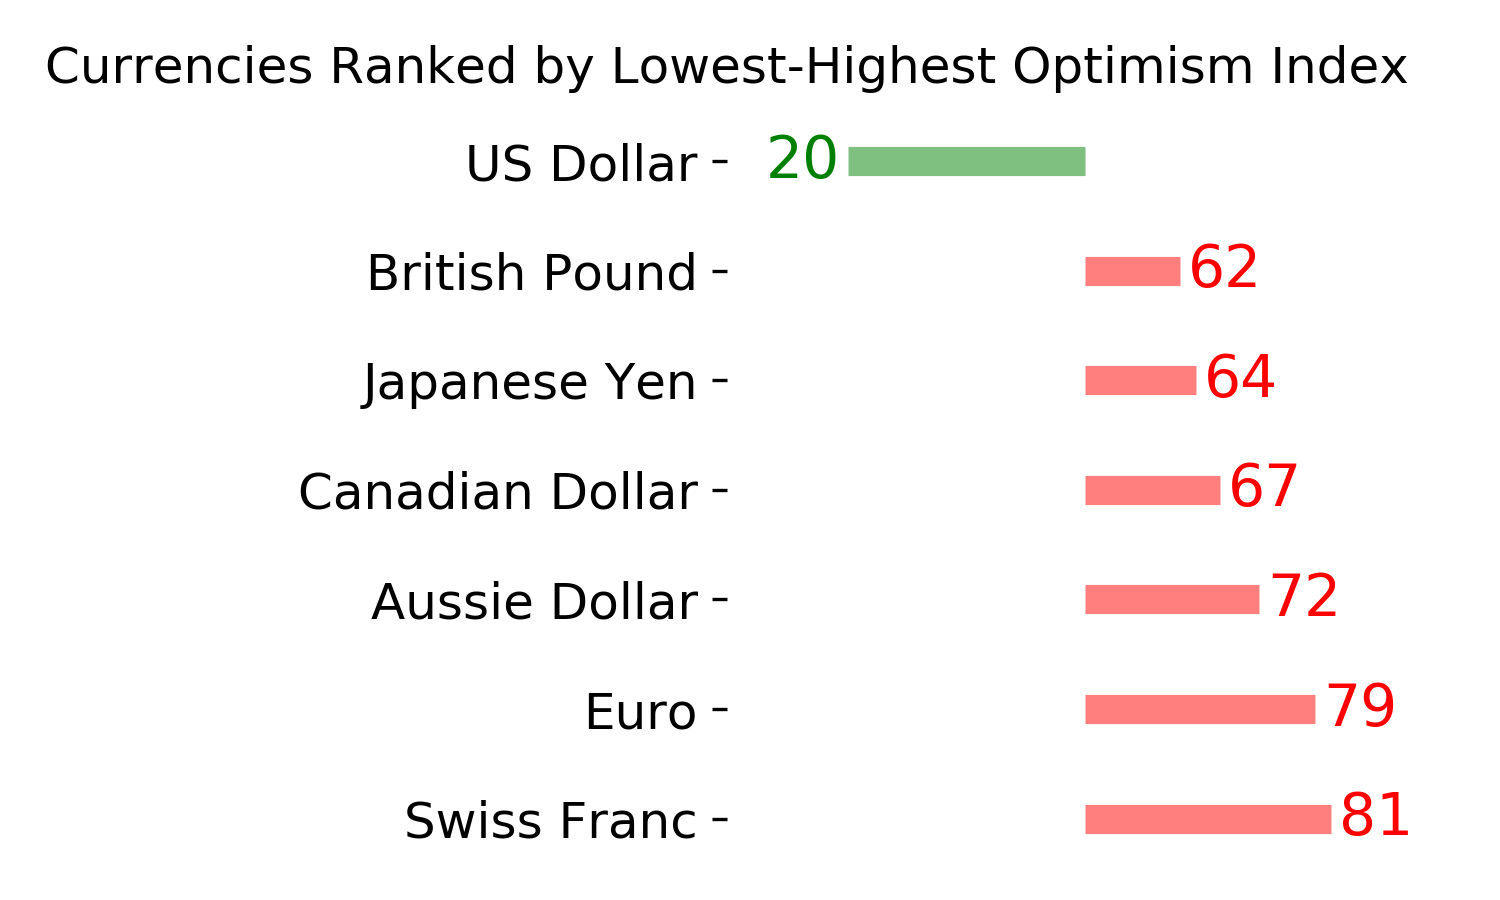
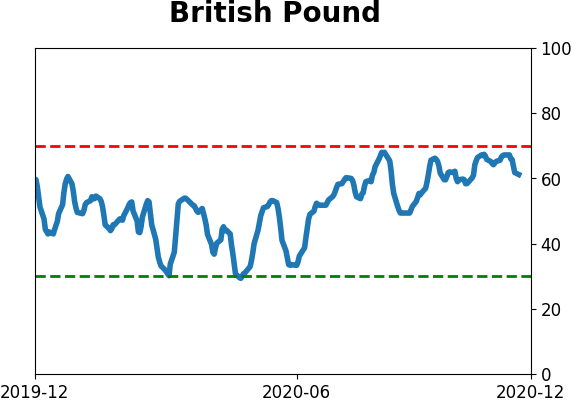
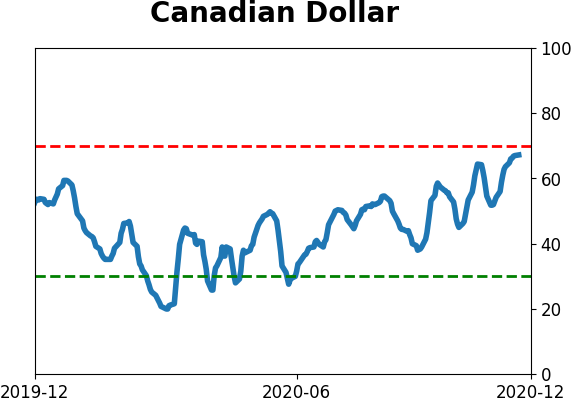
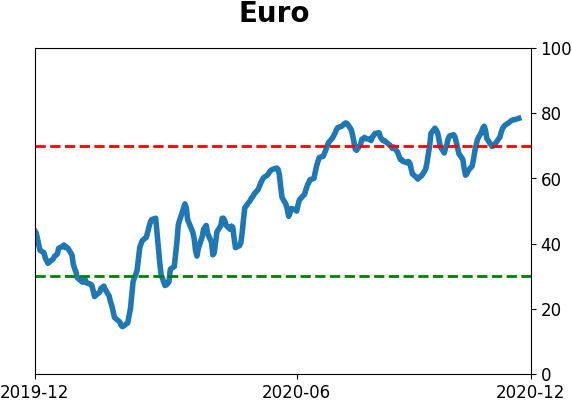
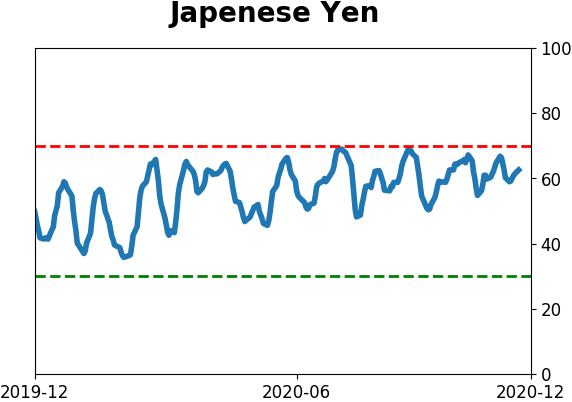
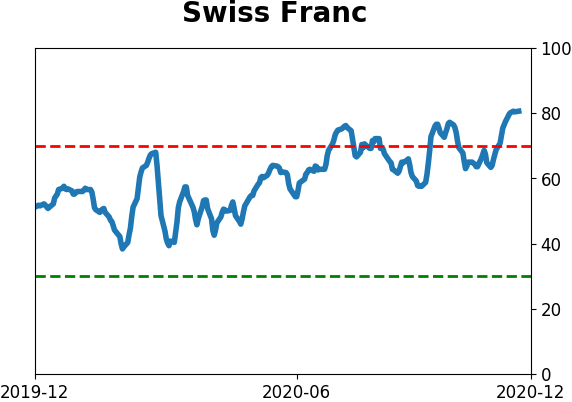
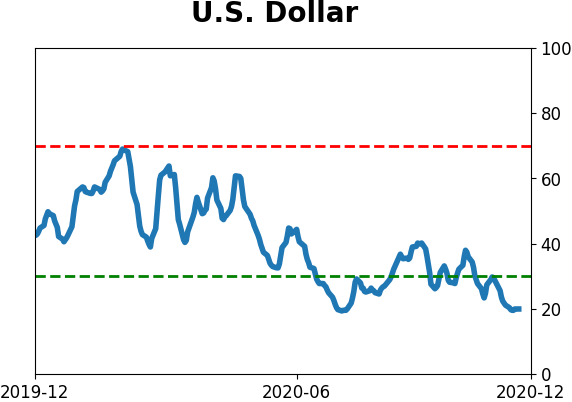
Currency ETF's - 5-Day Moving Average
|
|
|
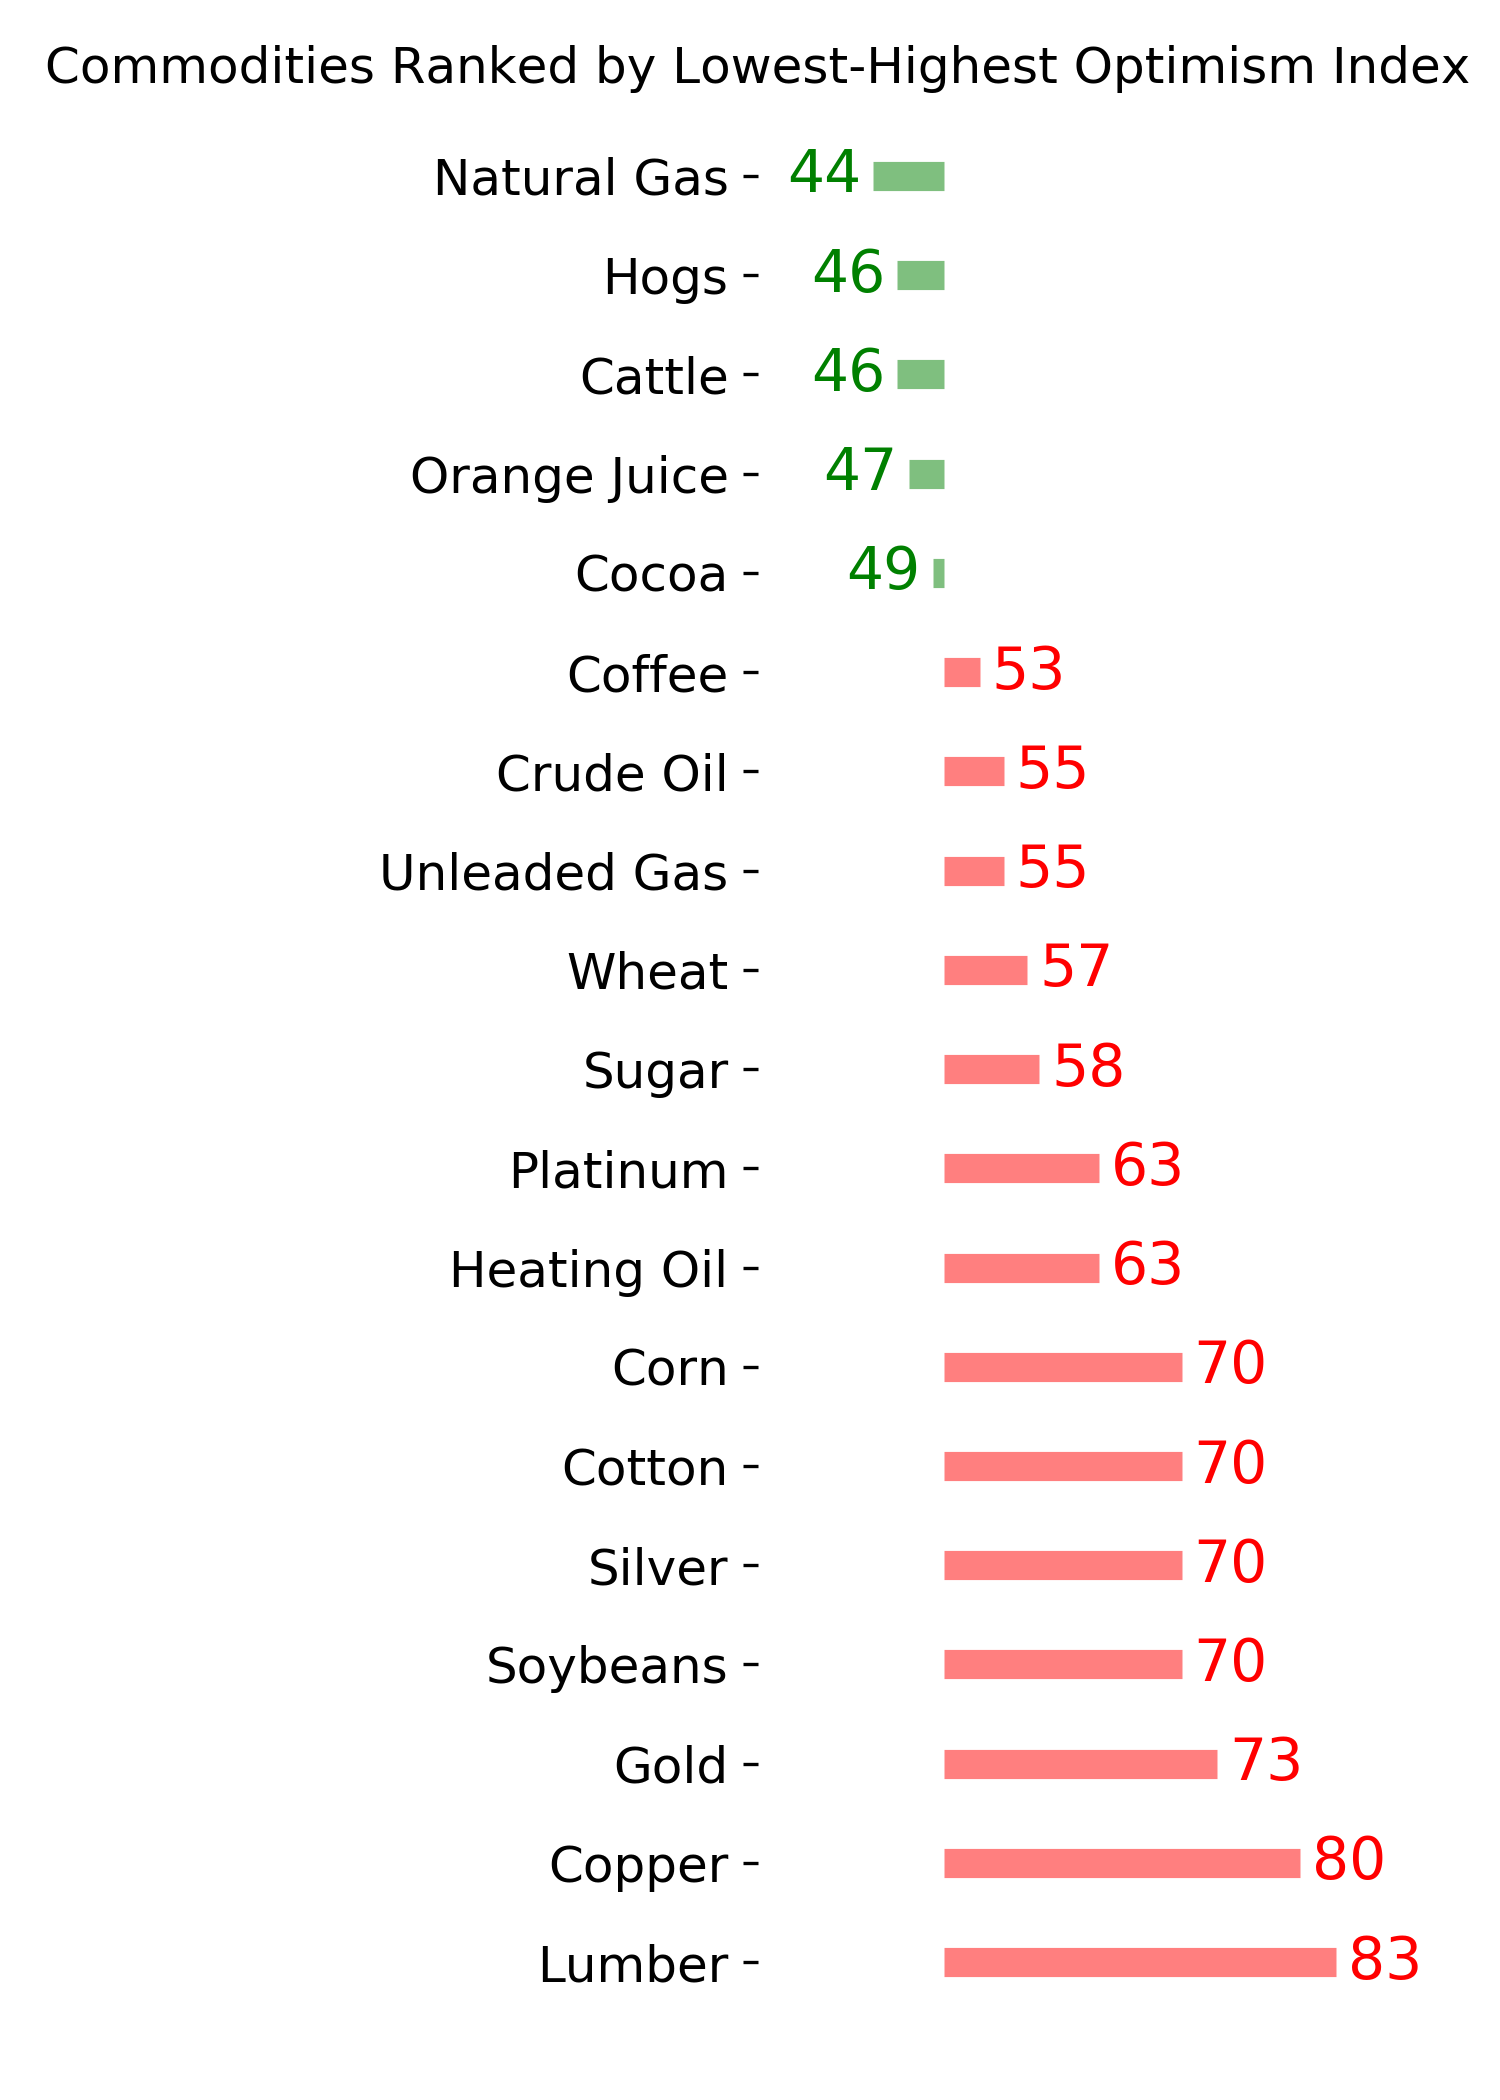
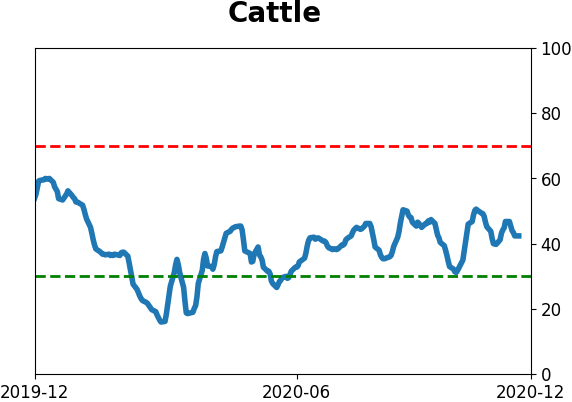
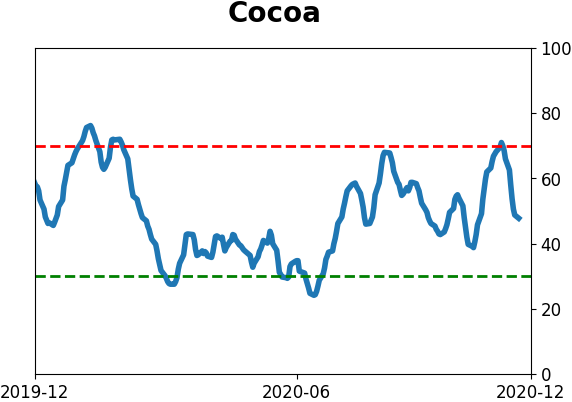
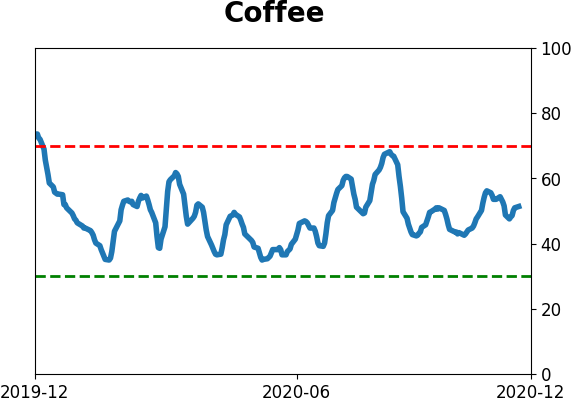
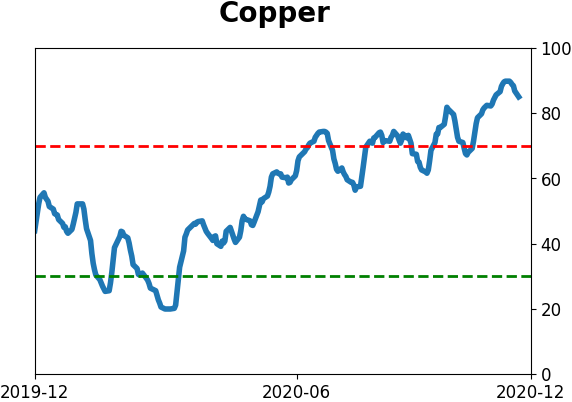
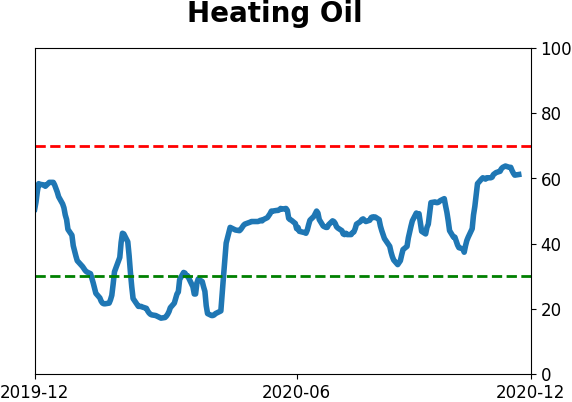
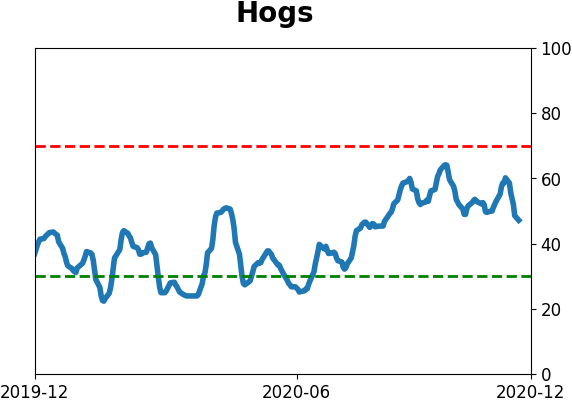
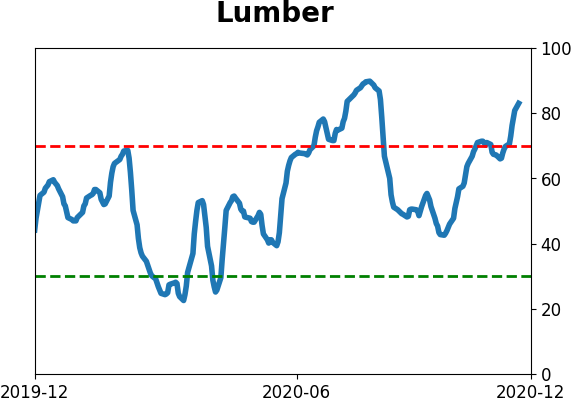
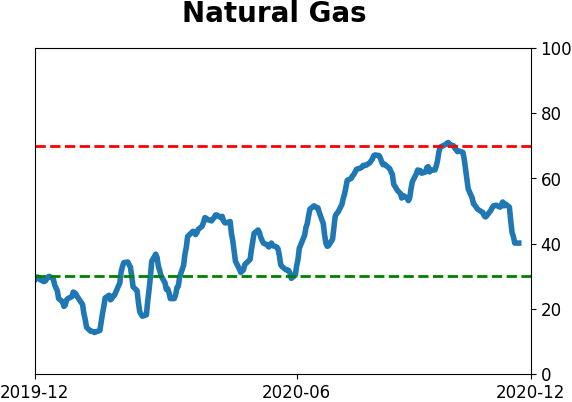
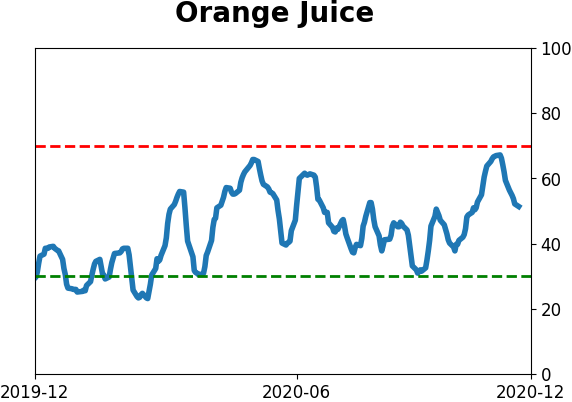
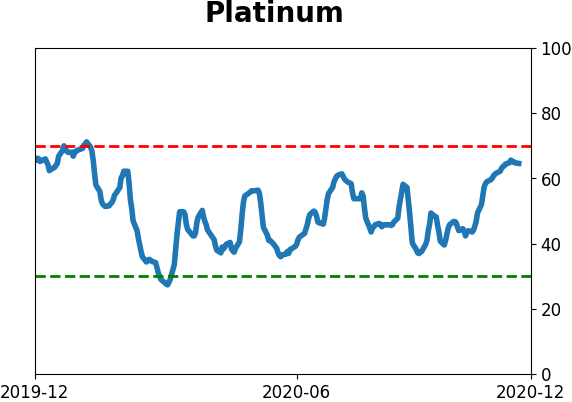
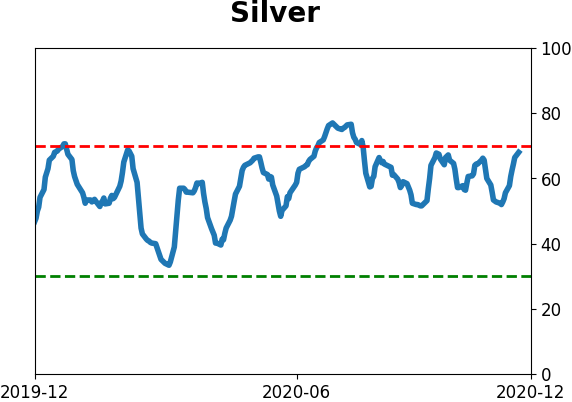
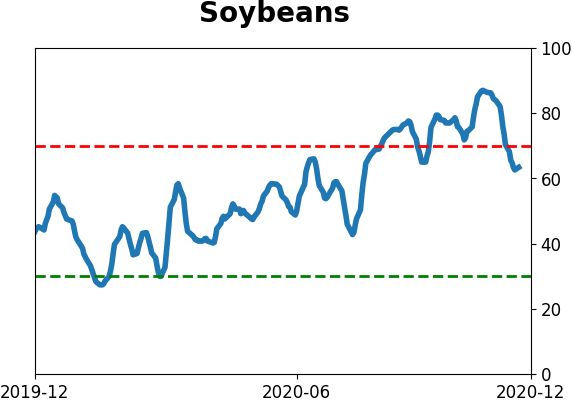
Commodity ETF's - 5-Day Moving Average
|
|