Headlines
|
|
Young and unprofitable - the best combination for going public:
The most companies since the year 2000 are going public without first turning a profit. As a ratio to money-making companies, money-losers are at record highs. And never before in 35 years have such young companies managed to sell shares to the public.
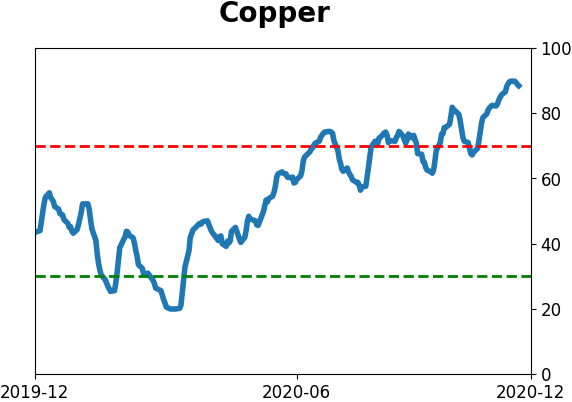
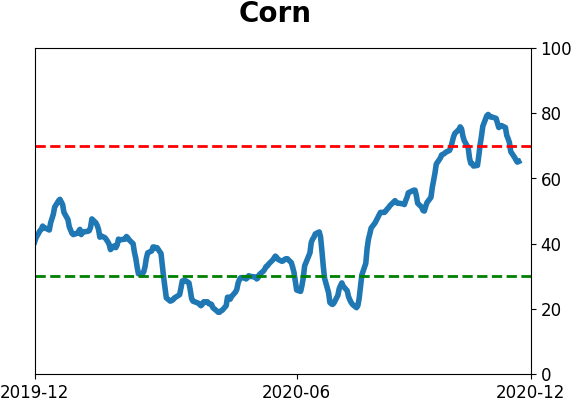
The latest Commitments of Traders report was released, covering positions through Tuesday: The 3-Year Min/Max Screen shows that "smart money" commercial hedgers continued their recent pattern of selling more copper and yen. As a percentage of open interest, this is their biggest position against copper in 15 years. They're nearing a 100,000 contract short position against metals, which preceded declines in 2016 and 2017, but at worst only led to volatile upside at the start of this year. While not new extremes, they continue to hold heavy positions against contracts like corn, and just agriculture in general. They reduced their net long position a bit in equity index futures but it remains historically high.
Bottom Line:
- The market environment is pristine, but with near-historic optimism, gains tend to be muted, with a high probability of being reversed at some point over the ensuing weeks.
|
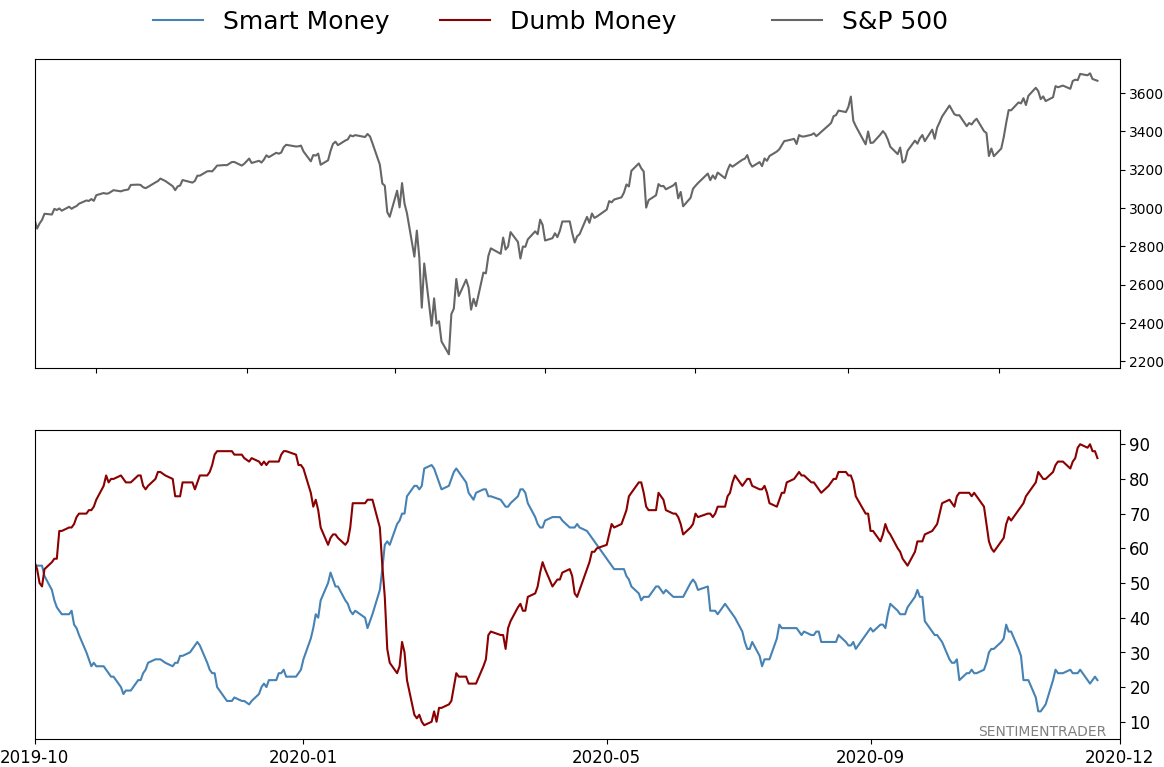
Smart / Dumb Money Confidence
|
Smart Money Confidence: 22%
Dumb Money Confidence: 86%
|
|
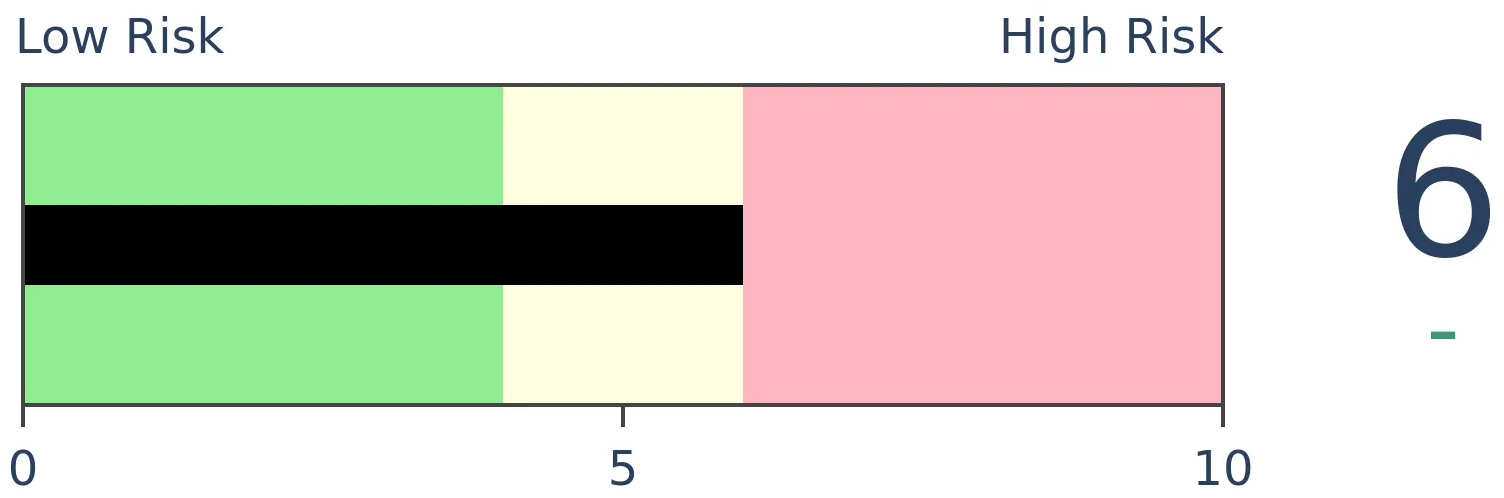
Risk Levels
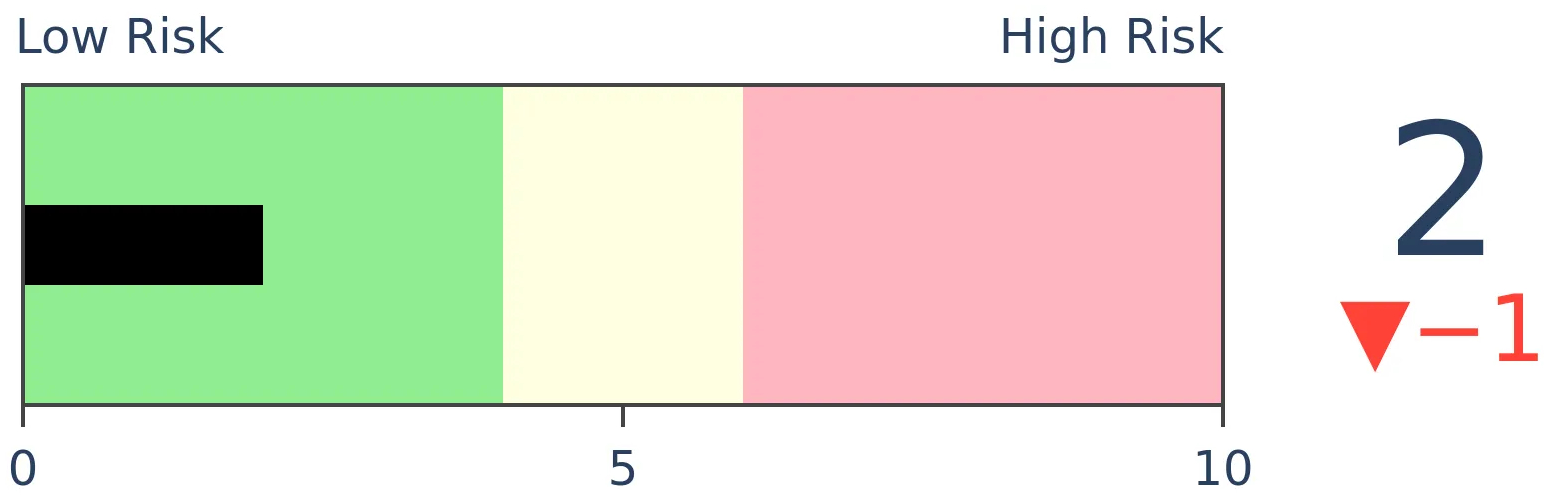
Stocks Short-Term
|
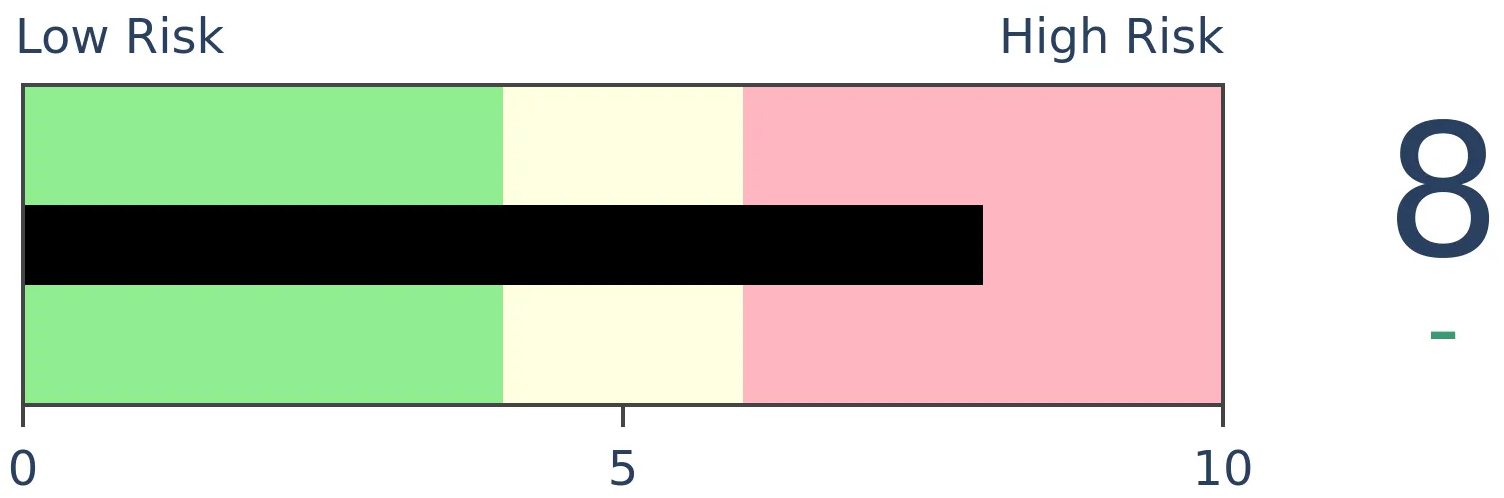
Stocks Medium-Term

|
|
Bonds
|
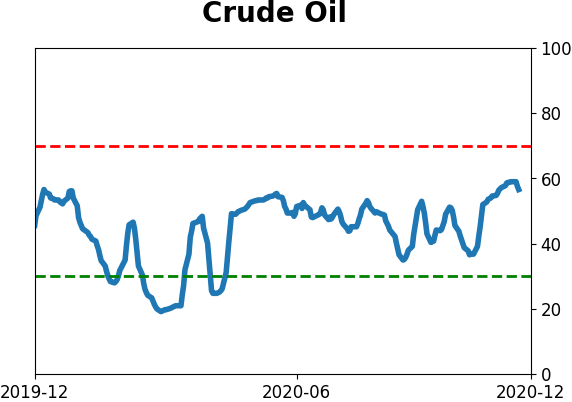
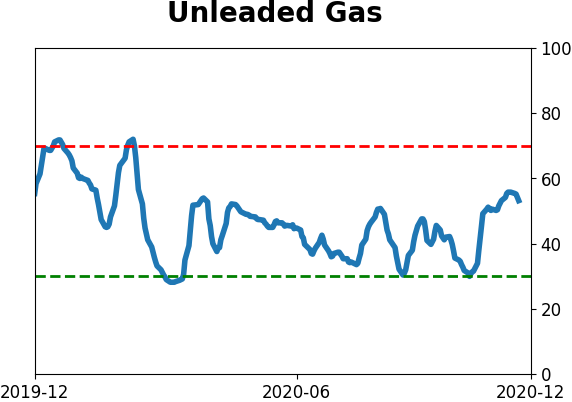
Crude Oil
|
|
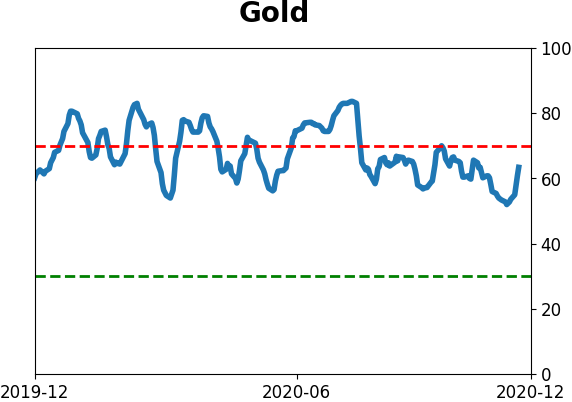
Gold
|
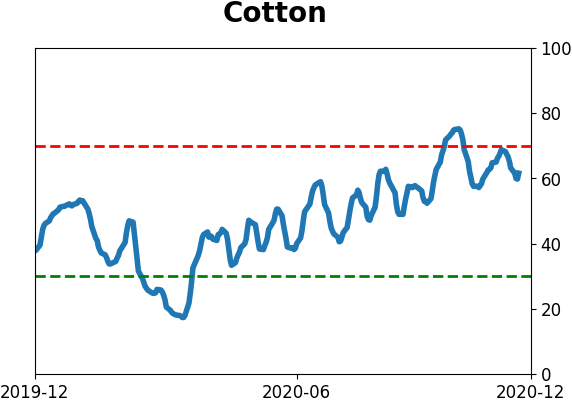
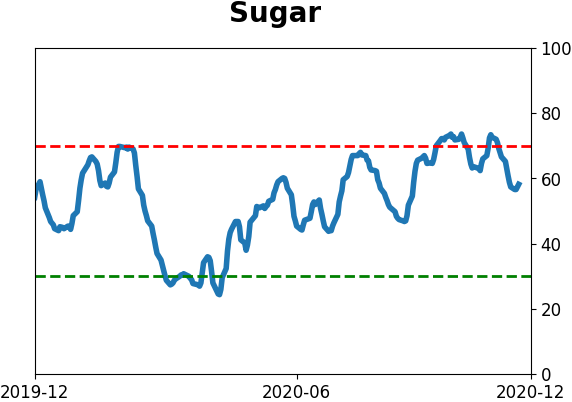
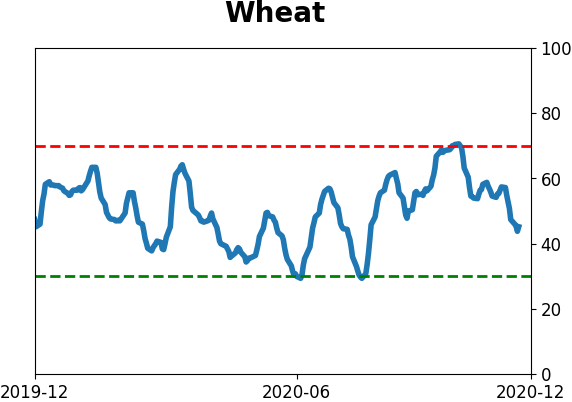
Agriculture

|
|
Research
BOTTOM LINE
The most companies since the year 2000 are going public without first turning a profit. As a ratio to money-making companies, money-losers are at record highs. And never before in 35 years have such young companies managed to sell shares to the public.
FORECAST / TIMEFRAME
None
|
The hunger for new issues is voracious and bankers trying to pad year-end bonus numbers can't keep up. Their new stocks are making money, but the companies themselves certainly are not.
Here's the Wall Street Journal, writing about DoorDash (abbreviated, with highlights added):
"DoorDash Inc. delivered for investors, surging 86% in its stock-market debut on Wednesday. The seven-year-old company ended its first trading day valued at about $71.8 billion, higher than many of the restaurant companies that depend on its couriers. The San Francisco-based company has never turned an annual profit, but a surge in demand during the Covid-19 pandemic has helped to transform it."
And Airbnb:
"A pandemic that brought global travel to a standstill couldn’t halt Airbnb Inc.’s hotly anticipated public debut. Like many Silicon Valley startups that are bleeding red ink when they go public, Airbnb has never posted a full-year profit. Its loss last year was greater than its losses in the previous four years combined."
And C3:
"Shares of C3.ai Inc. soared on their first day of trading. The artificial-intelligence software company’s stock closed Wednesday at $92.49, more than double the IPO price. Like other startups to hit public markets, C3.ai isn’t profitable. The company had a net loss of $69.4 million on revenue of $156.7 million for the fiscal year, ended April 30, according to its S-1 filing with the Securities and Exchange Commission."
Using Bloomberg data going back to the early 1990s, let's look at the total number of U.S. listed initial public offerings that showed a negative net income at the time of the offering. If they didn't report financials at the time, then we ignored the listing.
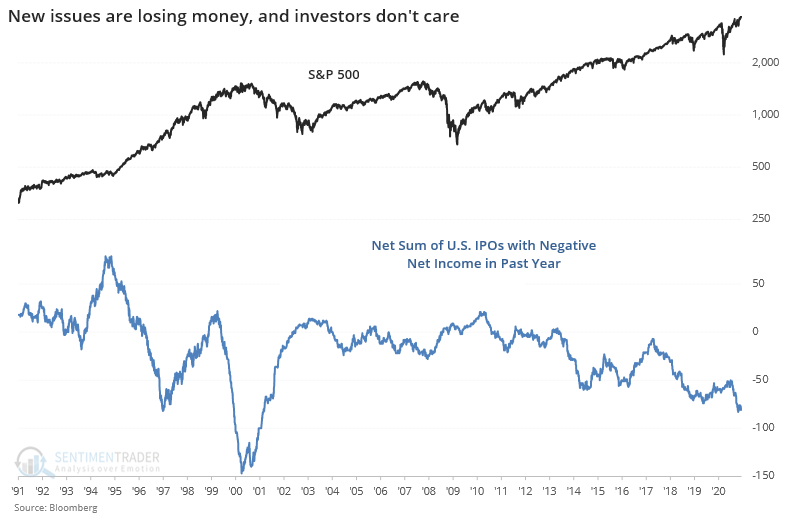
Over the past year, there have been 88 IPOs that showed a negative number on the net income line. That exceeds all other rolling one-year periods except for 2000.
But that year also had quite a few IPOs that were actually making money at the time. If we look at a ratio of money-losing to money-making companies that issued shares, the current environment stands out.
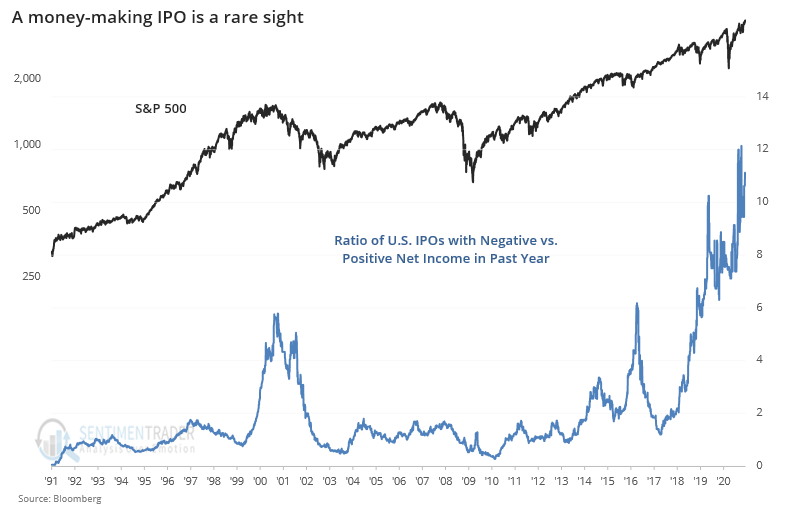
This isn't a new thing. We looked at it in May 2015, when the percentage of IPOs with negative earnings was matching what we saw in 2000. After that, things dried up. By early 2016, we'd seen the longest streak without an IPO since 2009 and it had been 8 months since an IPO priced above its range. Then they started to come back later that year.
Part of the reason why so many companies are going public without turning a profit first is that they just haven't had time to do so. The median age of a company going public over the past year is barely 5 years old. The CDC suggests that a human child doesn't understand the concept of the future tense until their 5th year. Maybe companies aren't much different.
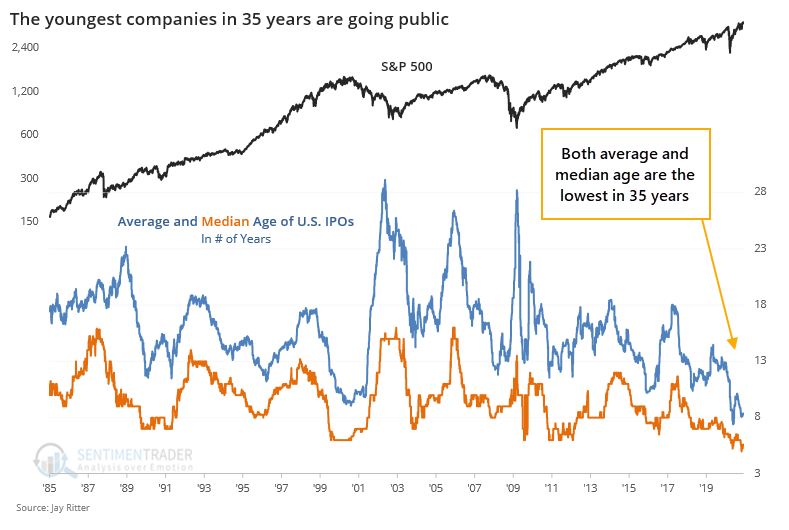
When investors are uncertain about the future, they want to see that a company is well-established and can make a profit before taking a flyer on their stock. When risk appetite is high, equity investors are willing to accept ideas and concepts in lieu of revenue and profit. The only other time when both the average and median age of a newly public company neared this low of an age was 2000. So there's that.
A few months ago, we saw that supply was rising as IPO and secondary offerings jumped at the same time companies were pulling back from buying back their own shares. And the trend of big gains on new issues has continued, but still remains below the peak in 1999-2000. On that metric, at least, we're not in bubble territory.
By most others, though, the current appetite of IPOs, which are overwhelmingly losing money with no evidence of being going concerns, and which have the shortest track records in 35 years, is extremely concerning. When bankers can feed investor appetites to this degree, and the only concern seems to be finding the next candidate to feed them, investors as a whole have a strong tendency to suffer in the months ahead.
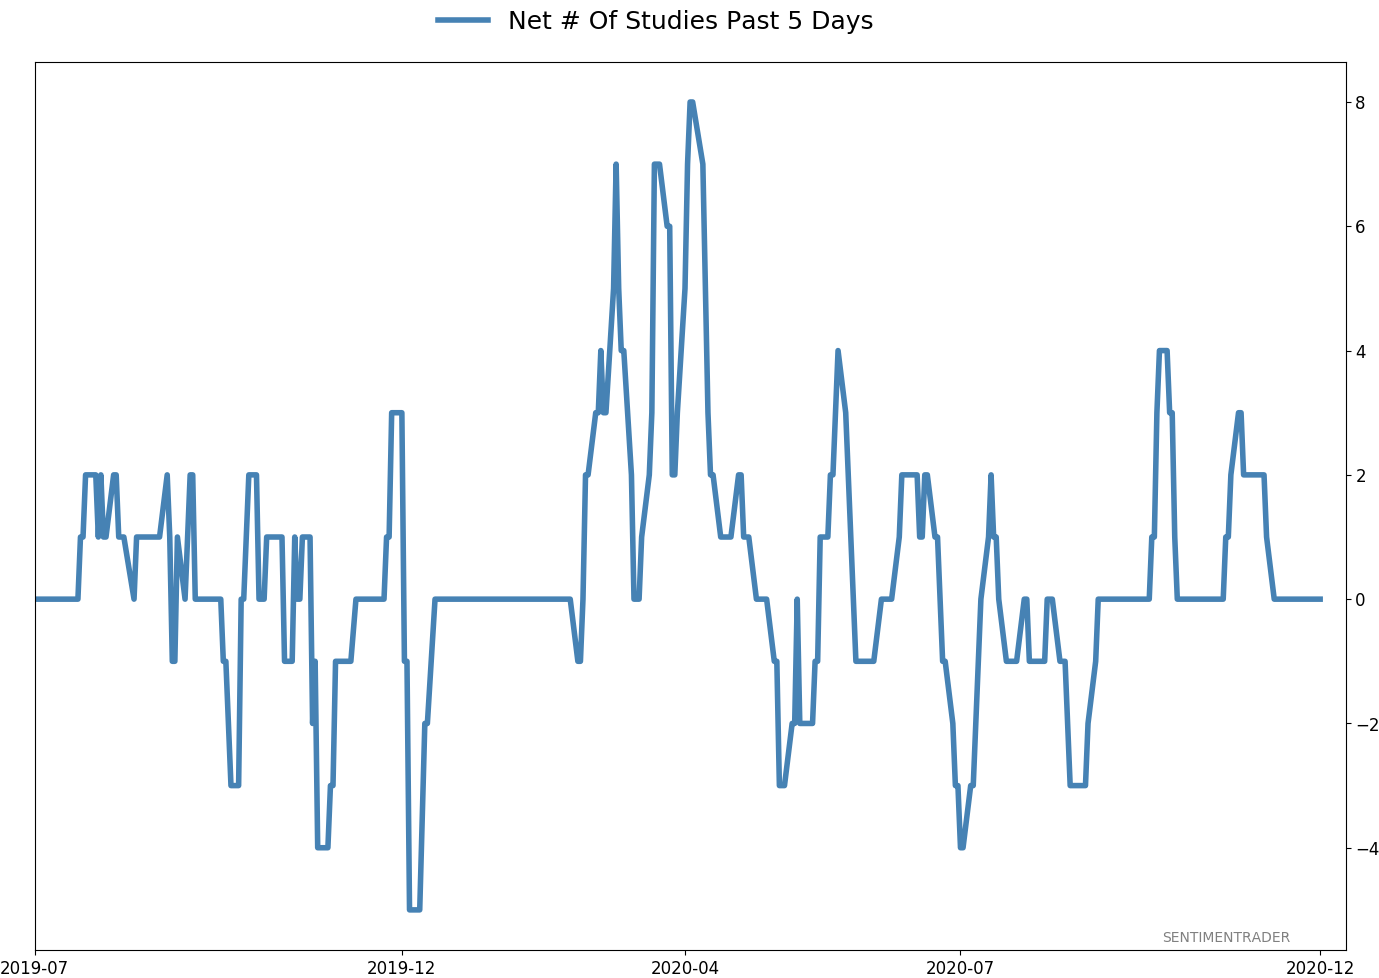
Active Studies
| Time Frame | Bullish | Bearish | | Short-Term | 0 | 1 | | Medium-Term | 5 | 8 | | Long-Term | 52 | 2 |
|
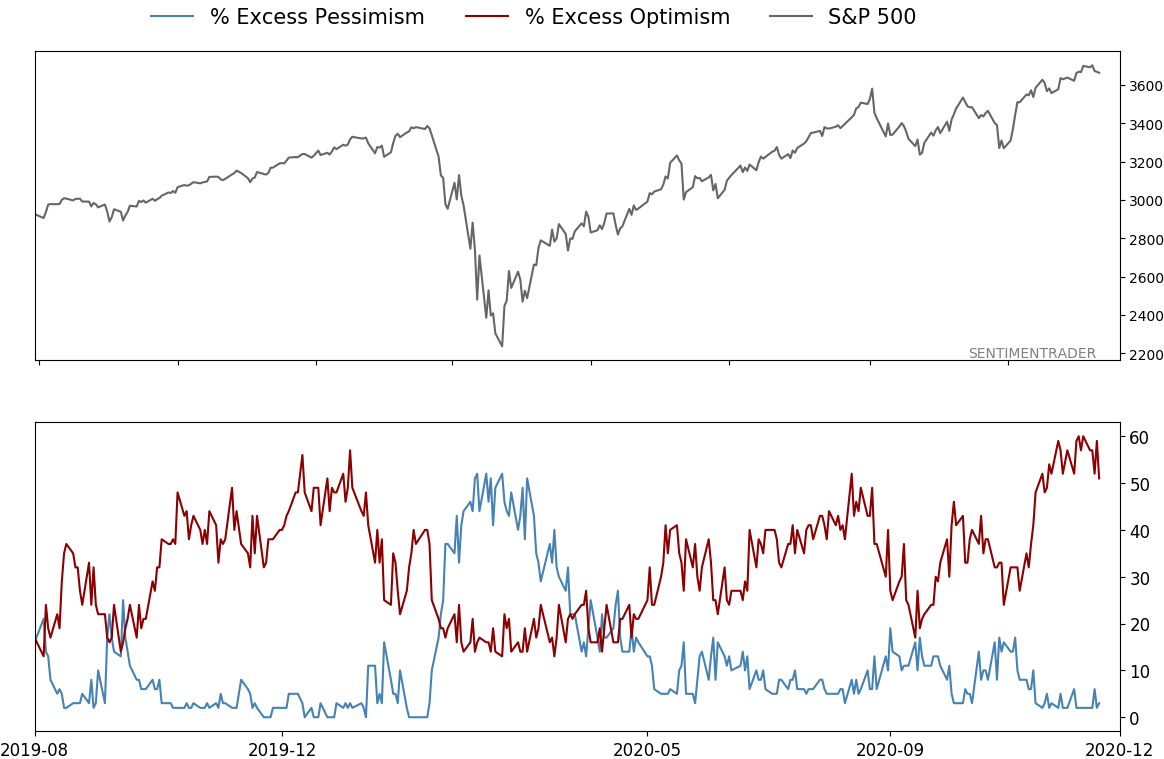
Indicators at Extremes
% Showing Pessimism: 3%
Bullish for Stocks
VIX
|
|
Portfolio
| Position | Description | Weight % | Added / Reduced | Date | | Stocks | 15.6% RSP, 10.1% VWO, 7.5% XLE, 5.1% PSCE | 41.2 | Added 5% | 2020-10-15 | | Bonds | 10% BND, 10% SCHP, 10% ANGL | 28.6 | Reduced 0.1% | 2020-10-02 | | Commodities | GCC | 2.4 | Reduced 2.1%
| 2020-09-04 | | Precious Metals | GDX | 9.5 | Added 4.8% | 2020-12-01 | | Special Situations | | 0.0 | Reduced 5% | 2020-10-02 | | Cash | | 18.3 | | |
|
Updates (Changes made today are underlined)
I've been quiet here because there hasn't been much to do. The things that were supposed to work have pretty much been doing so. With sentiment extremely stretched, I have no desire to add exposure there. About the only place I would add is energy, which has been following through exactly as it should. I did add back to my position in gold miners, due to the studies recently posted to the site. When gold (and miners) have pulled back after momentum like they enjoyed since March, the typical reaction is a resumption of the uptrend over the medium-term, and not a rollover into a bear phase. The continued weakness in the dollar certainly helps. RETURN YTD: 7.7% 2019: 12.6%, 2018: 0.6%, 2017: 3.8%, 2016: 17.1%, 2015: 9.2%, 2014: 14.5%, 2013: 2.2%, 2012: 10.8%, 2011: 16.5%, 2010: 15.3%, 2009: 23.9%, 2008: 16.2%, 2007: 7.8%
|
|
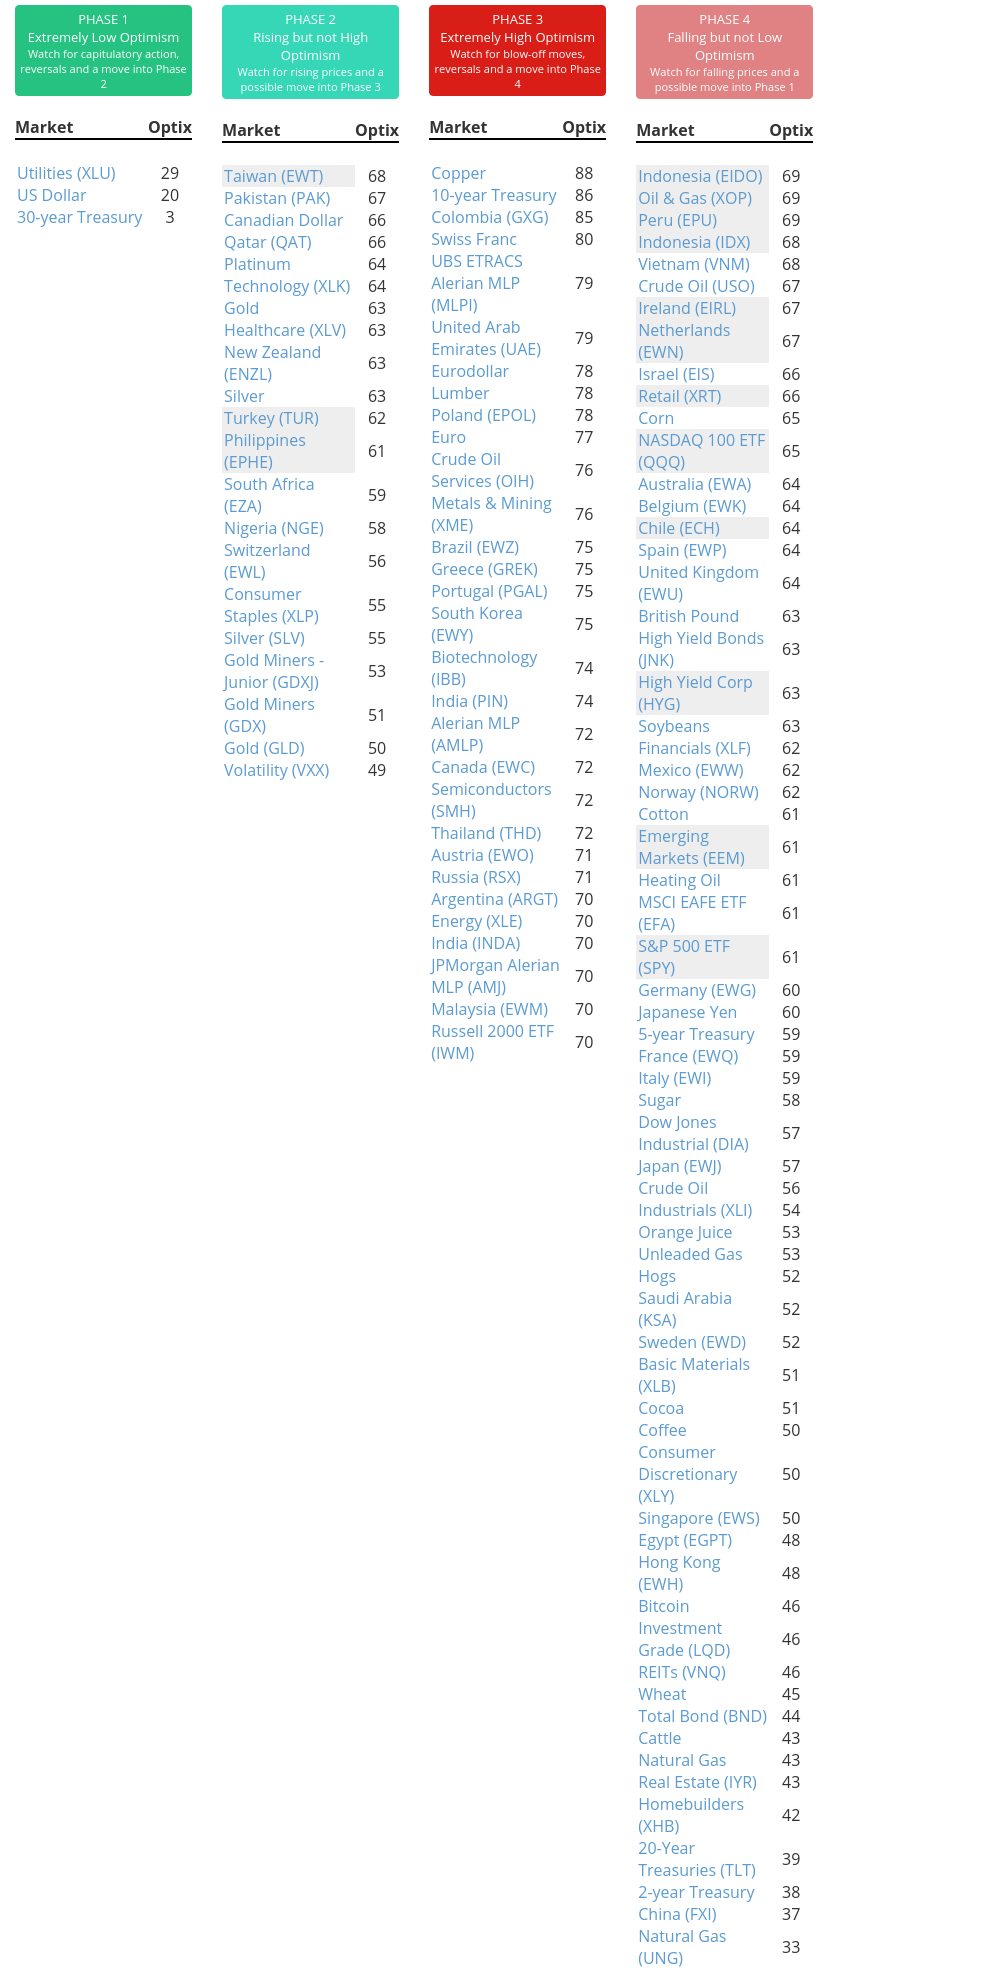
Phase Table
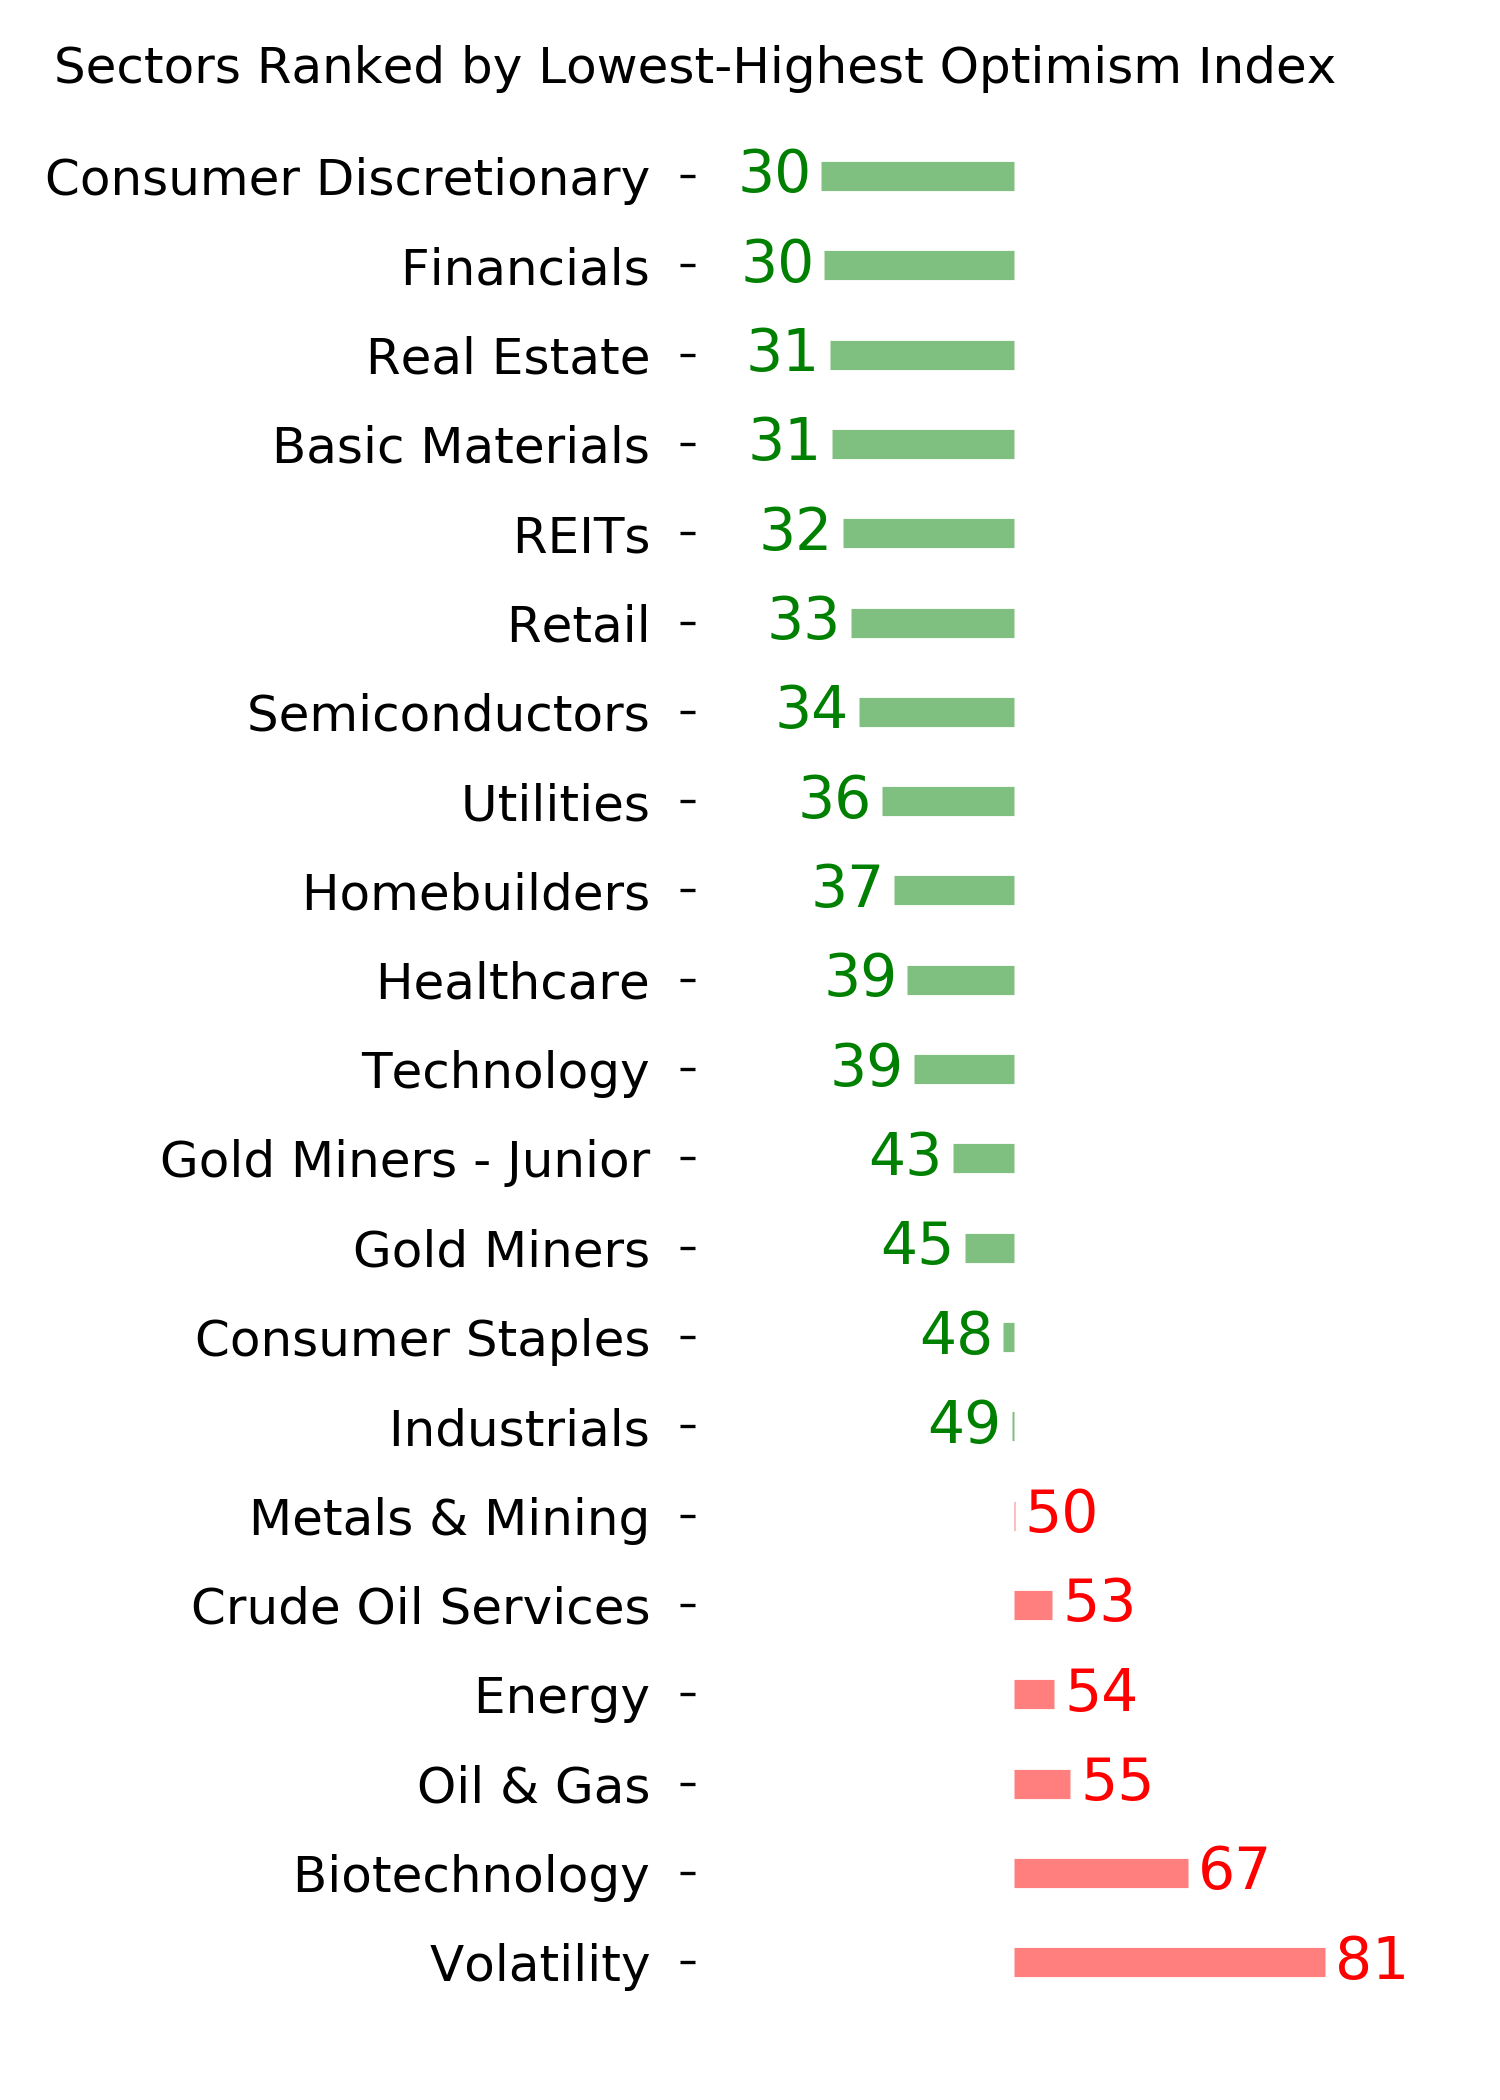
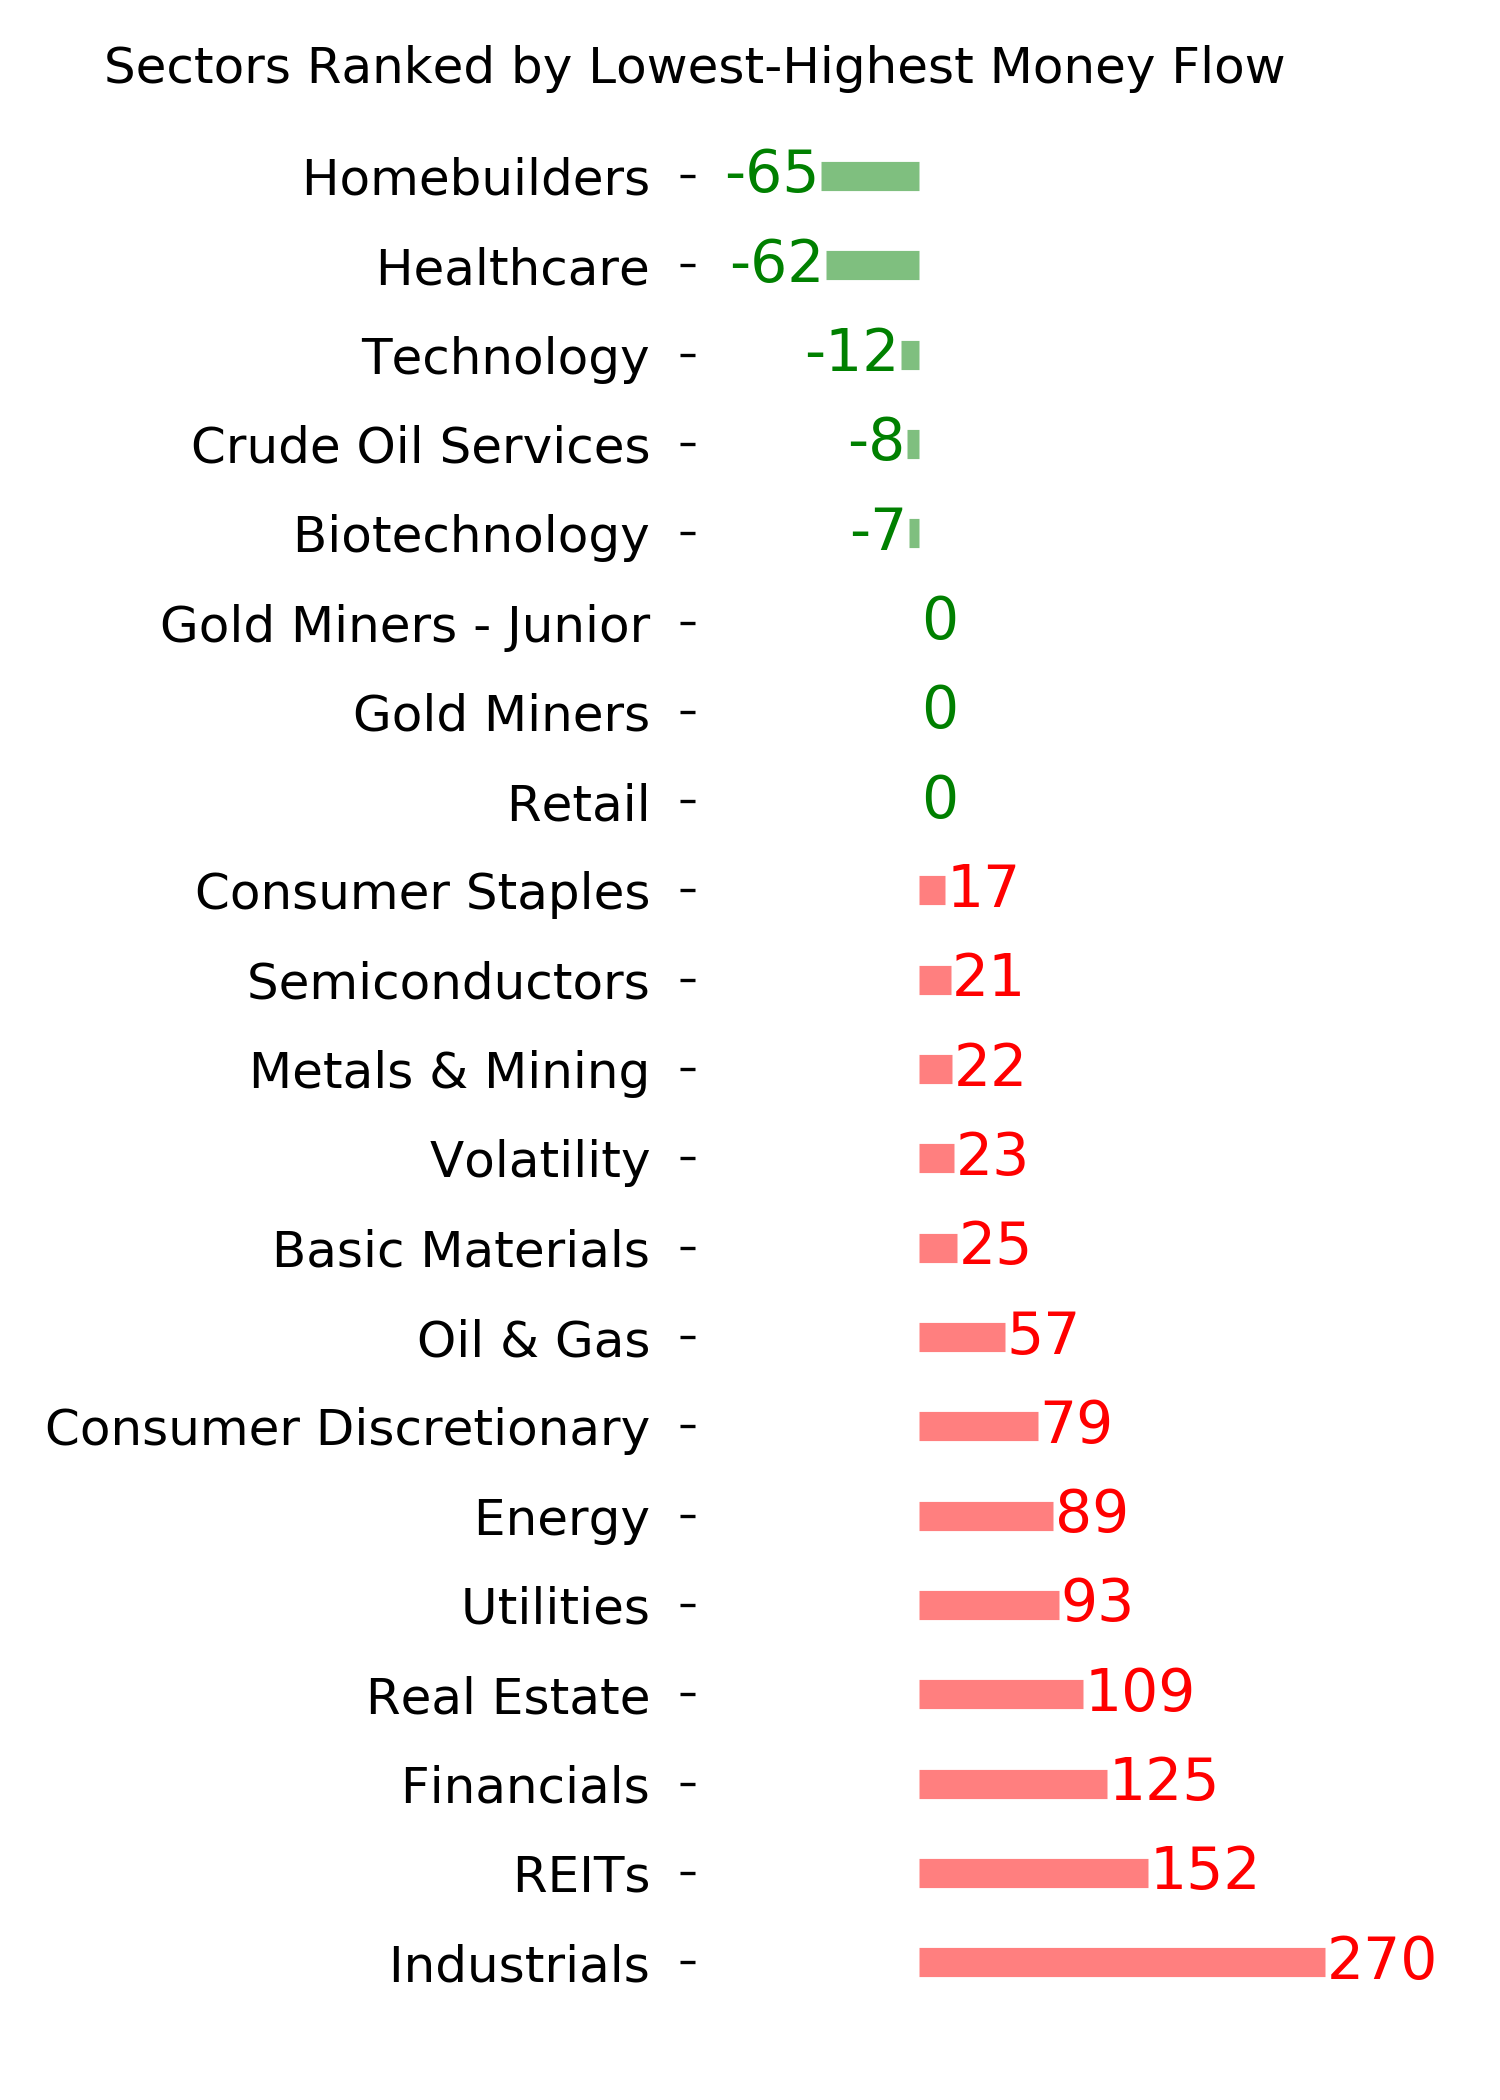
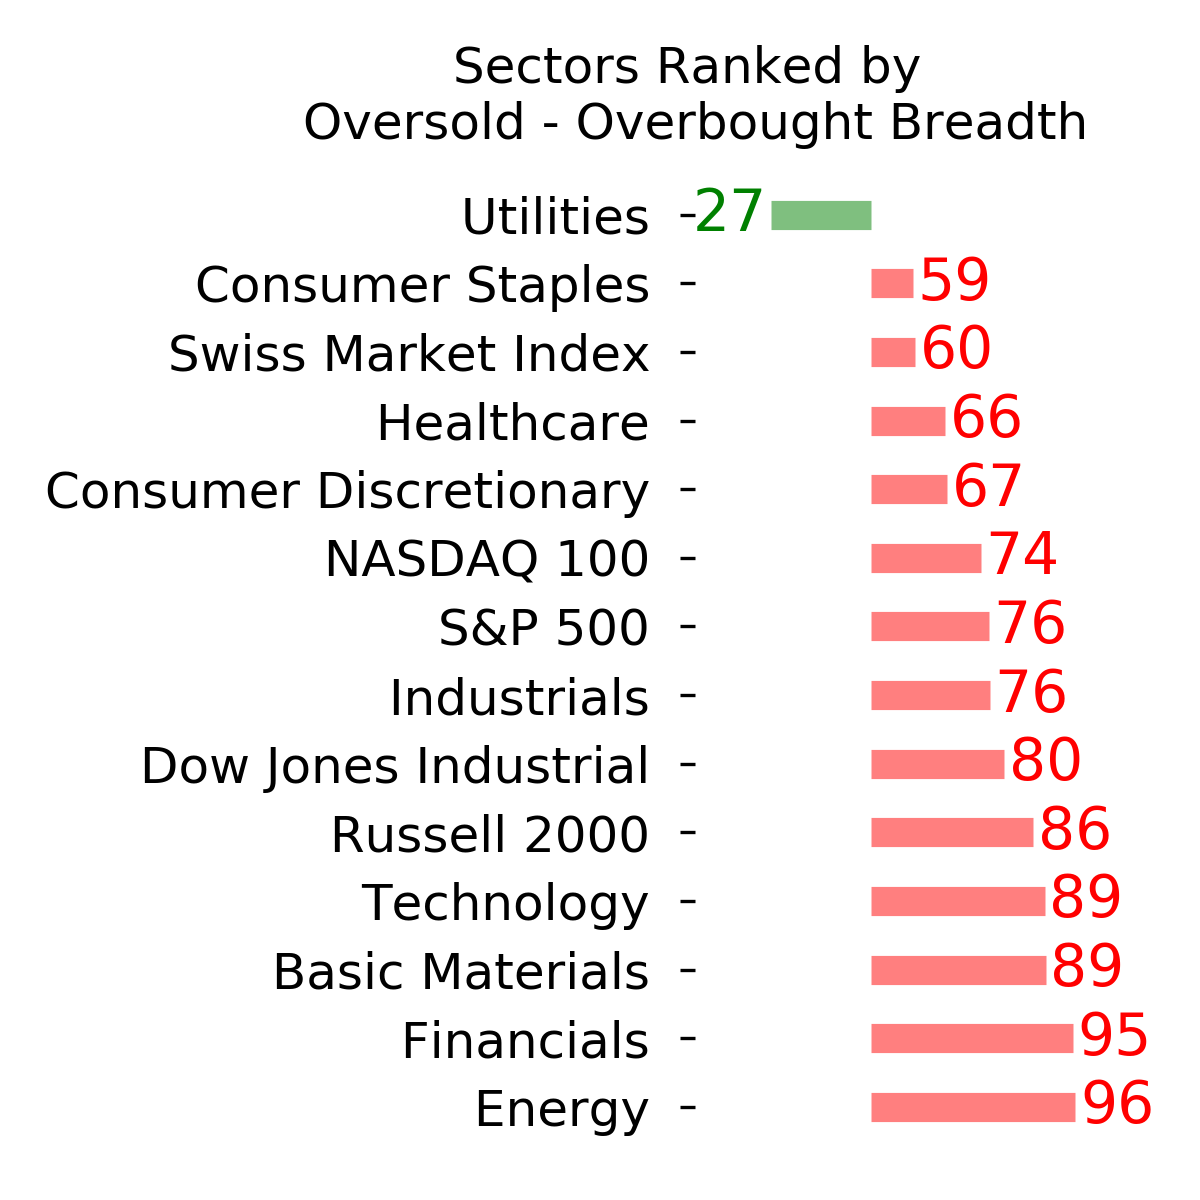
Ranks
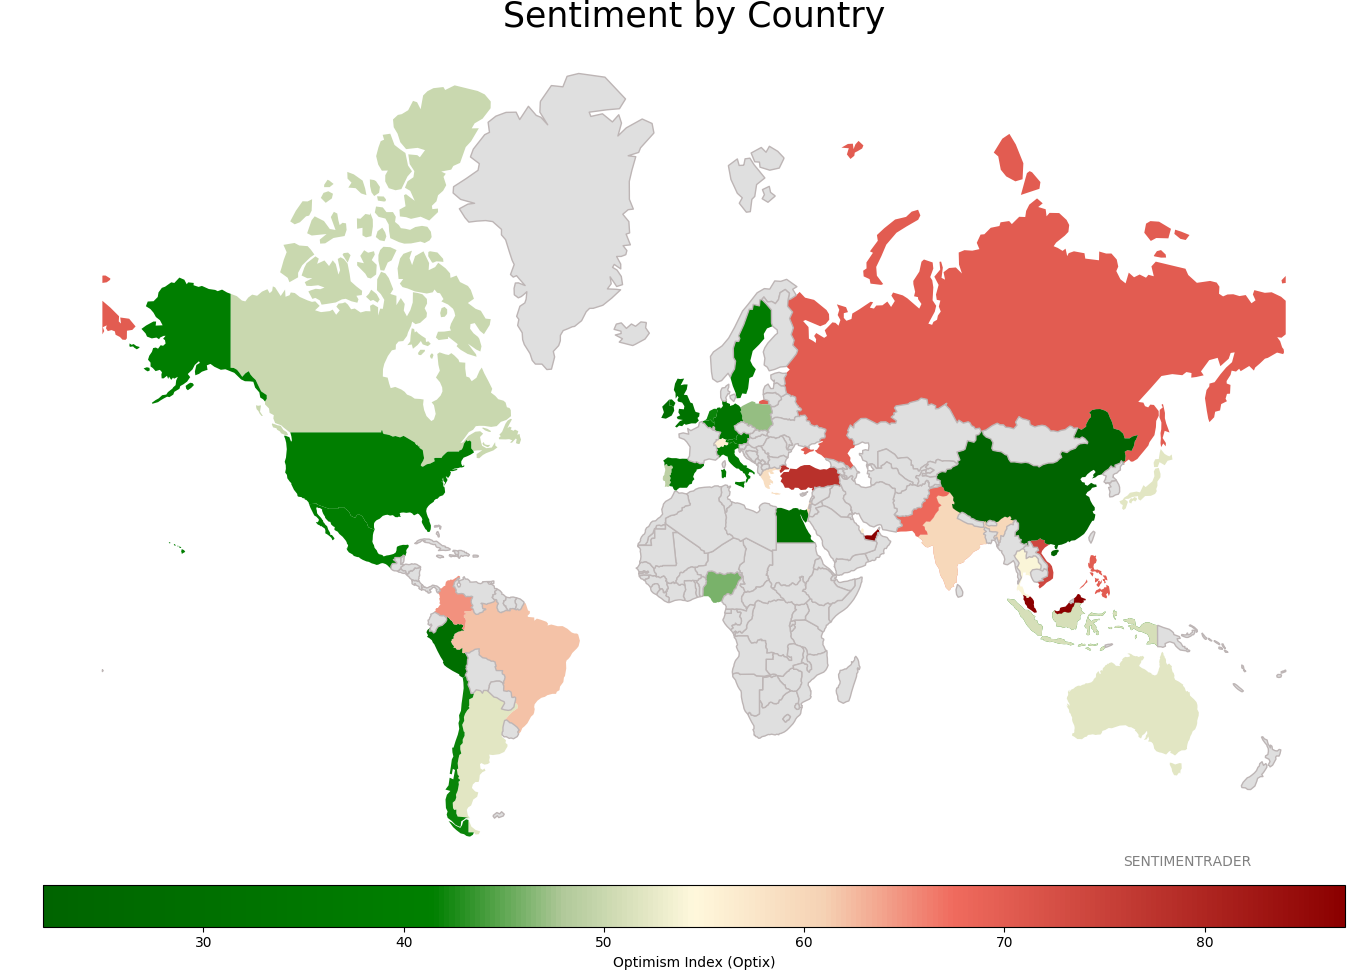
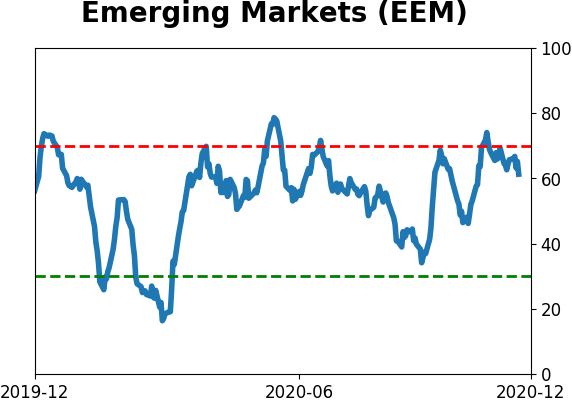
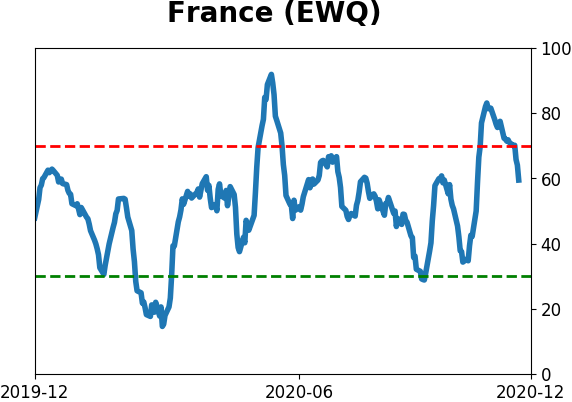
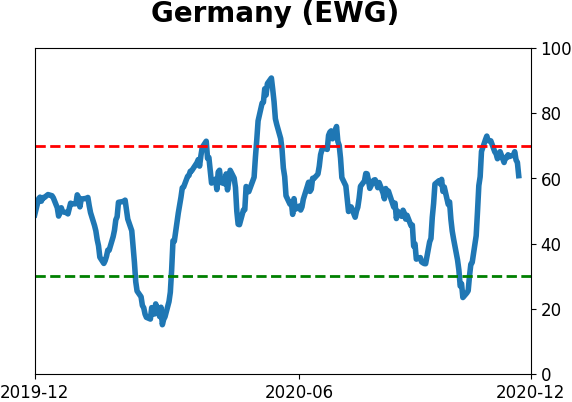
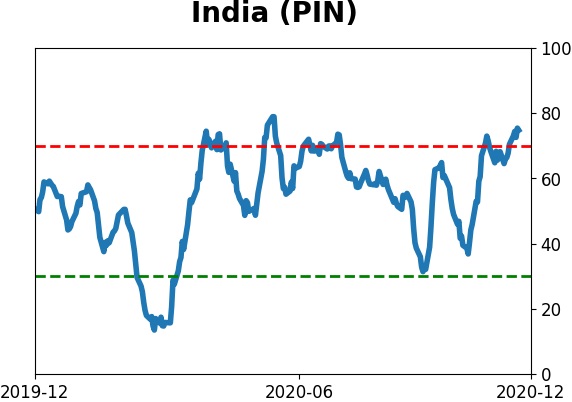
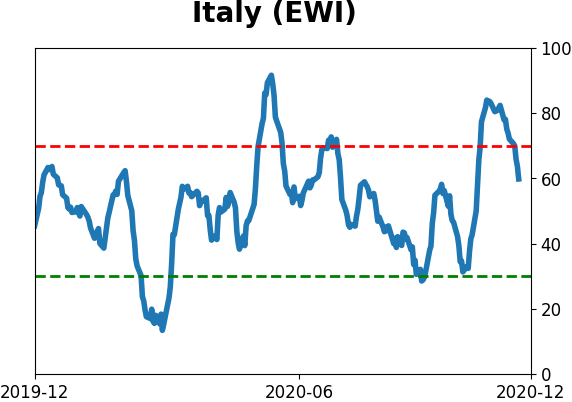
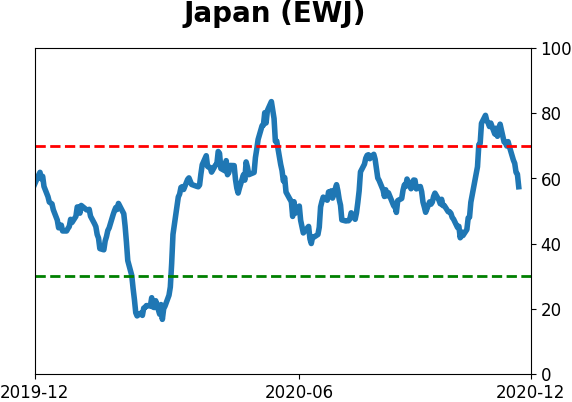
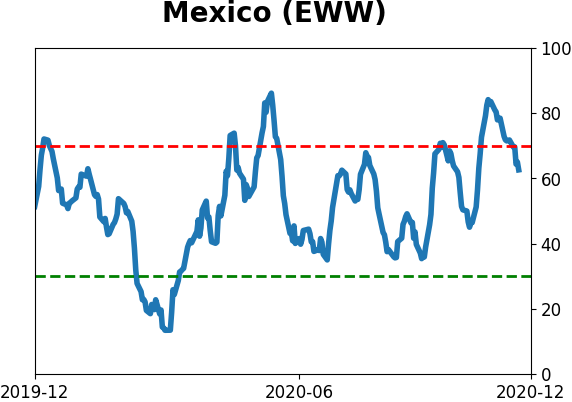
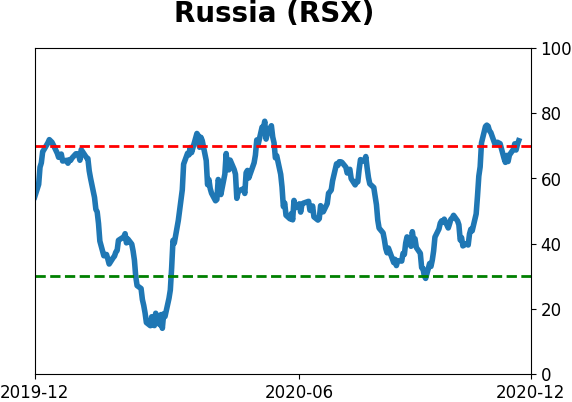
Sentiment Around The World
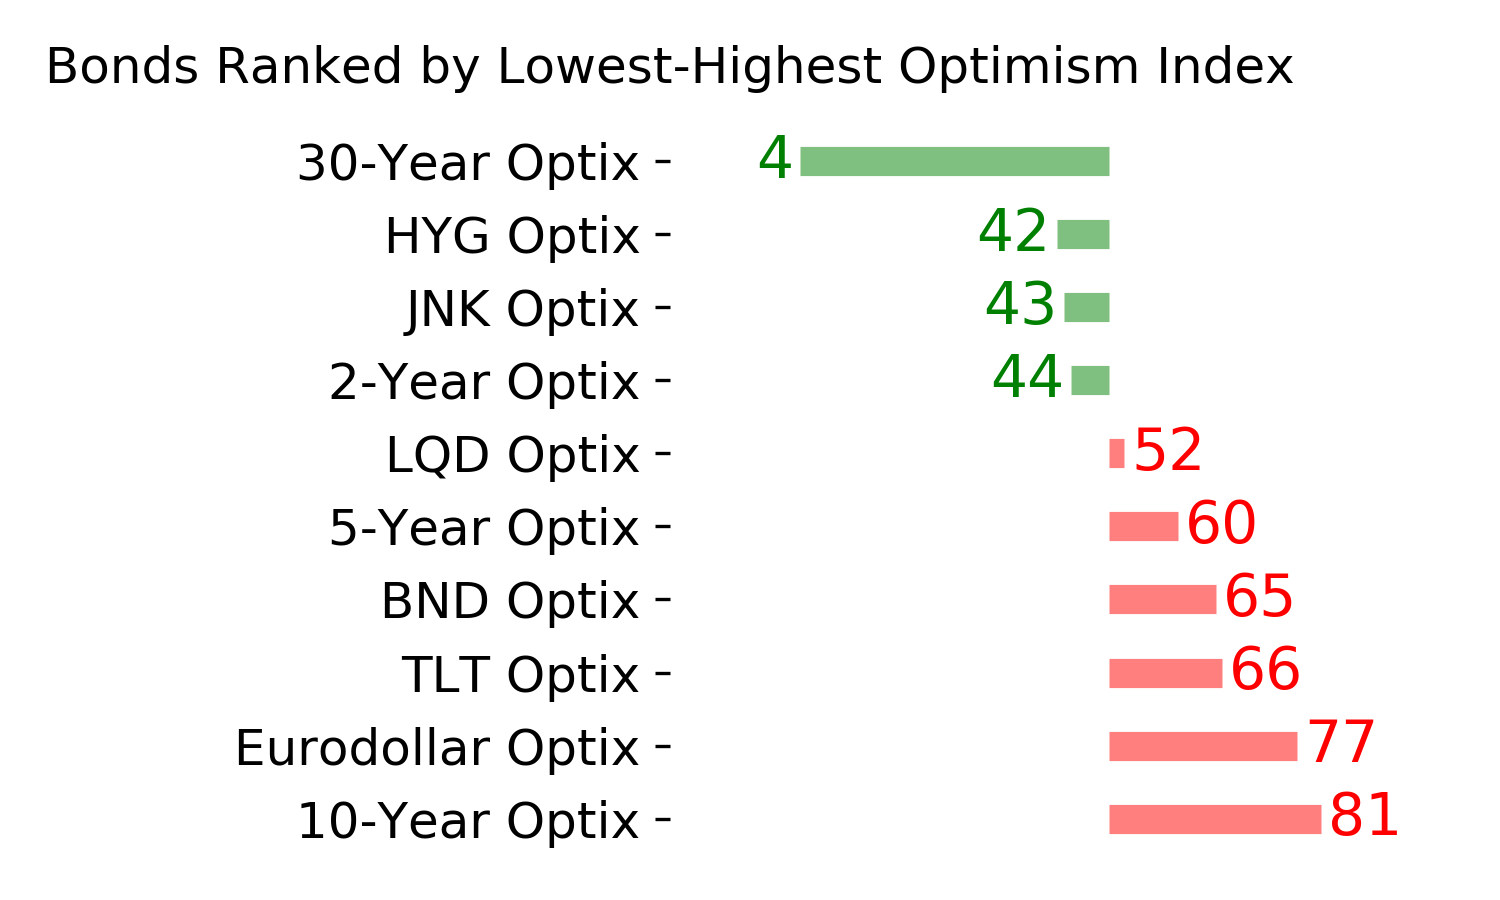
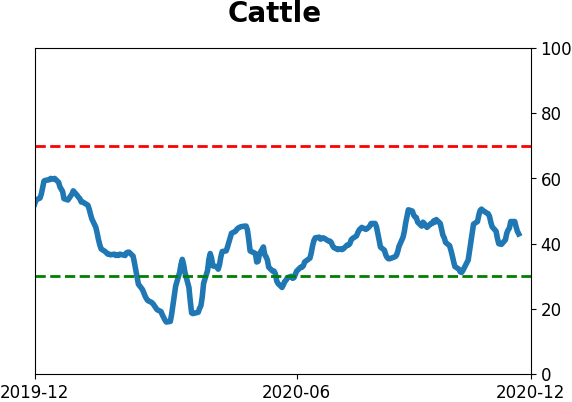
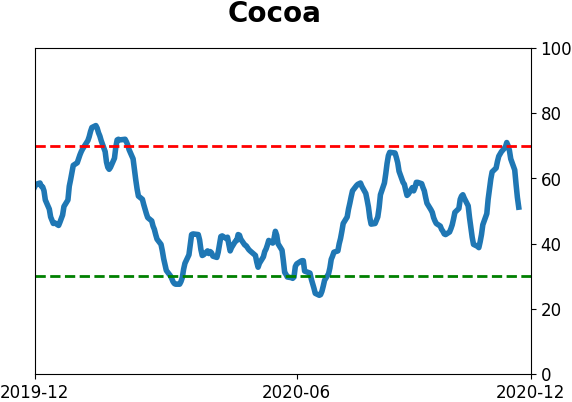
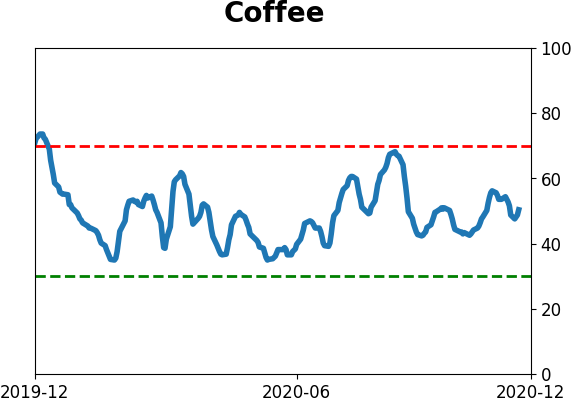
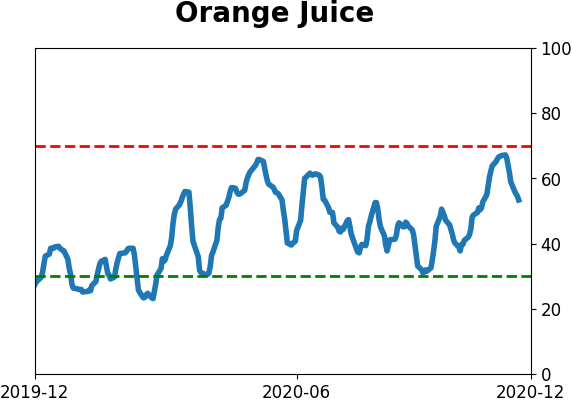
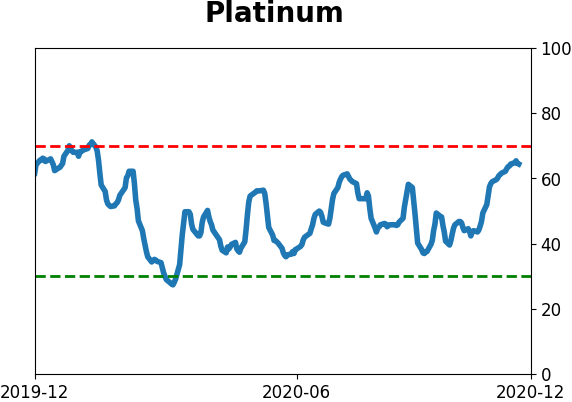
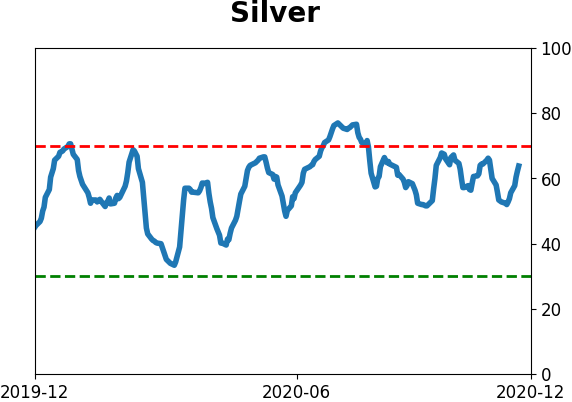
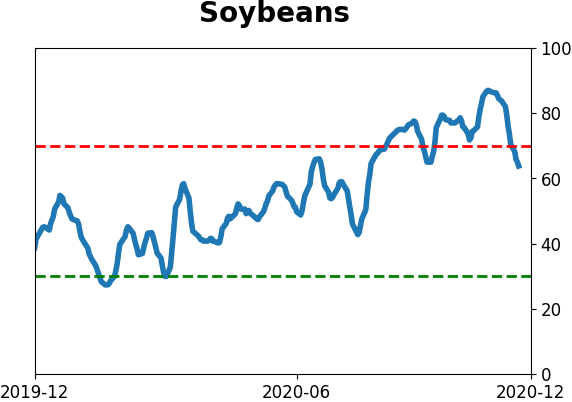
Optimism Index Thumbnails
|
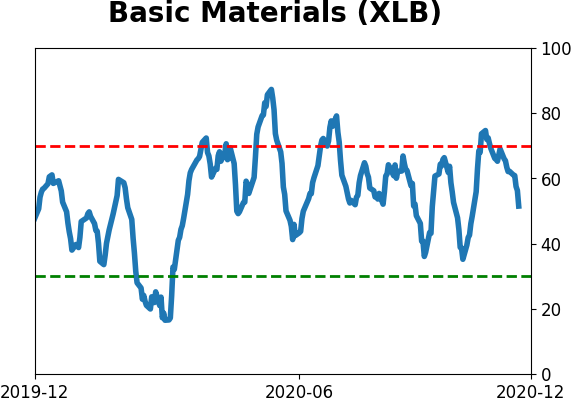
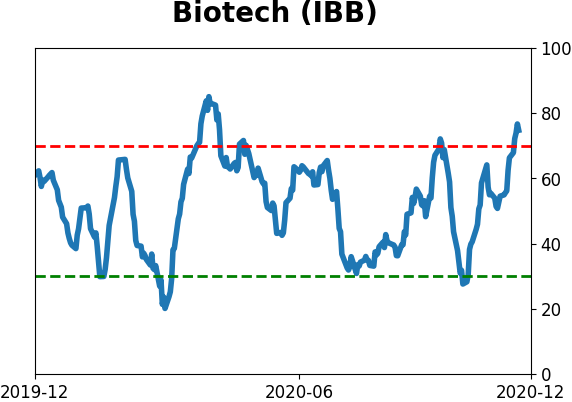
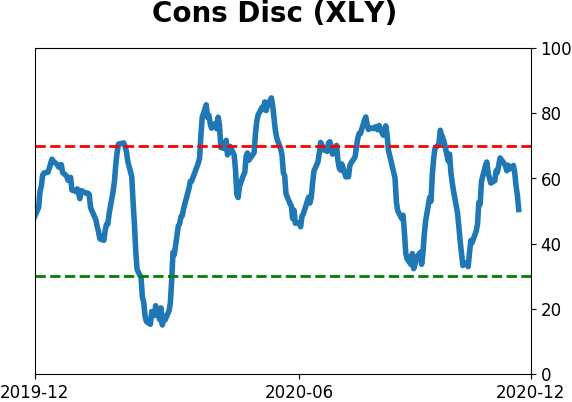
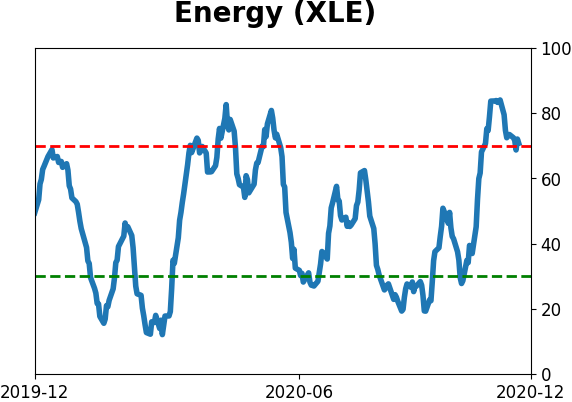
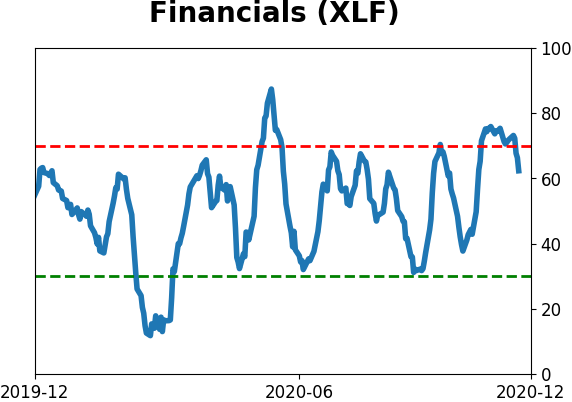
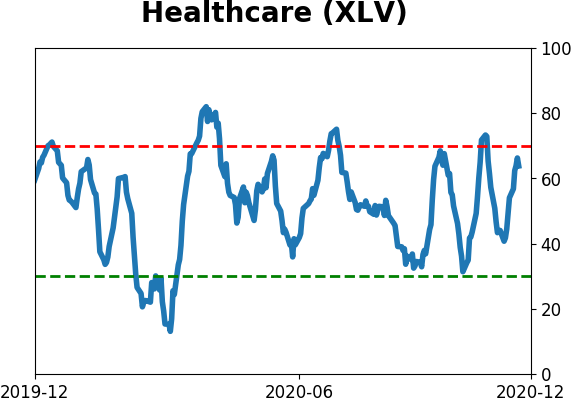
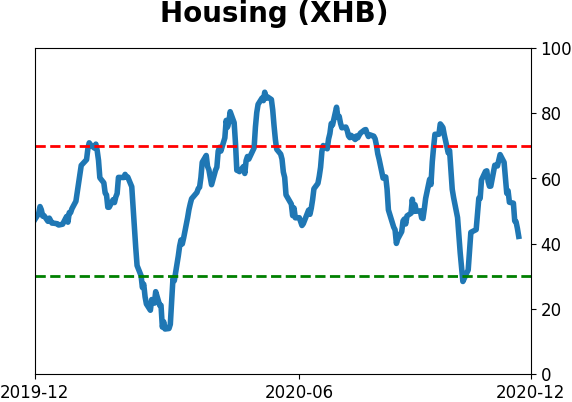
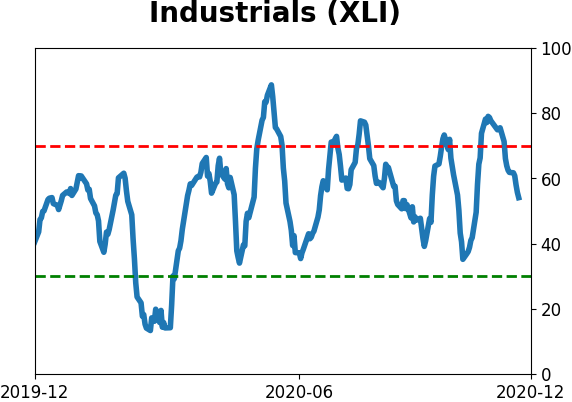
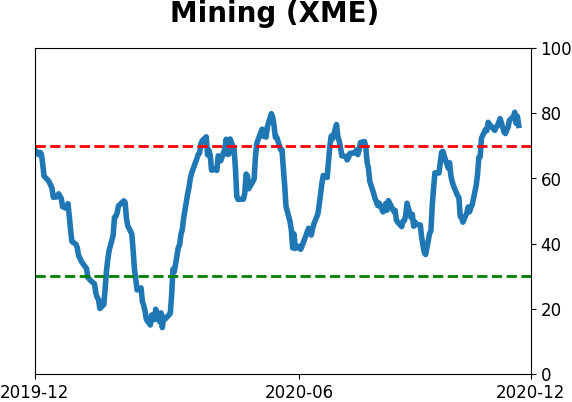
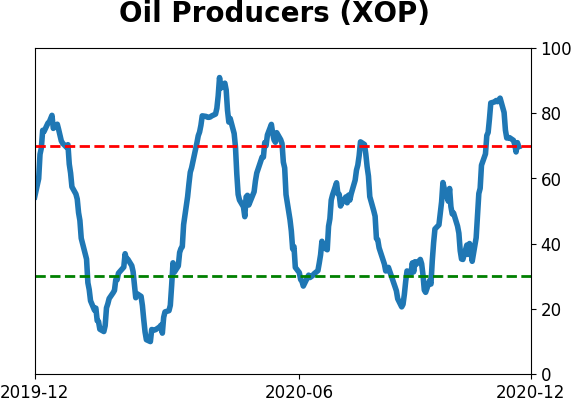
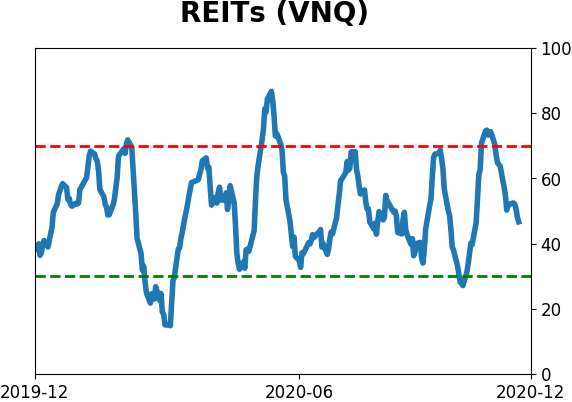
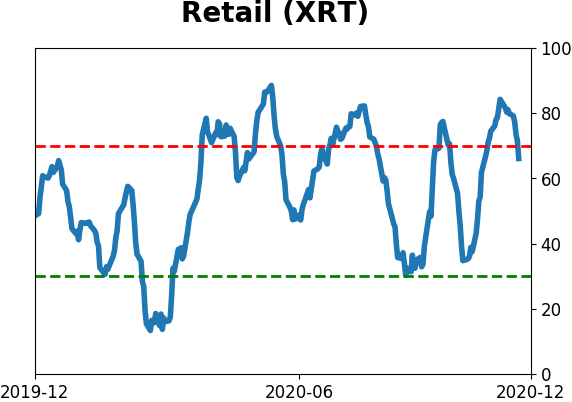
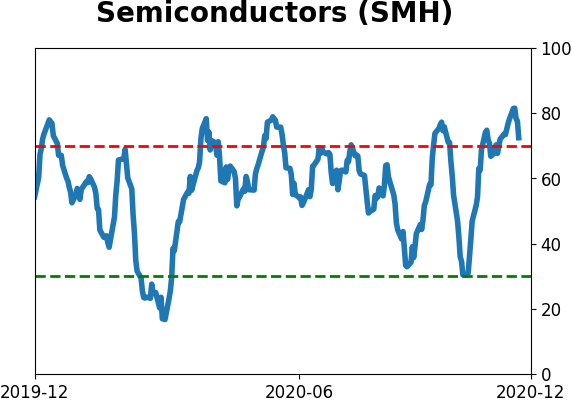
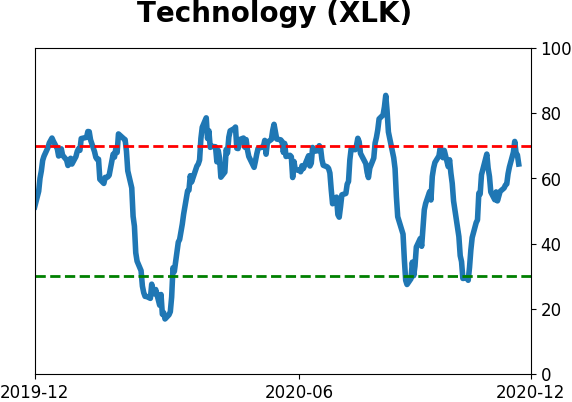
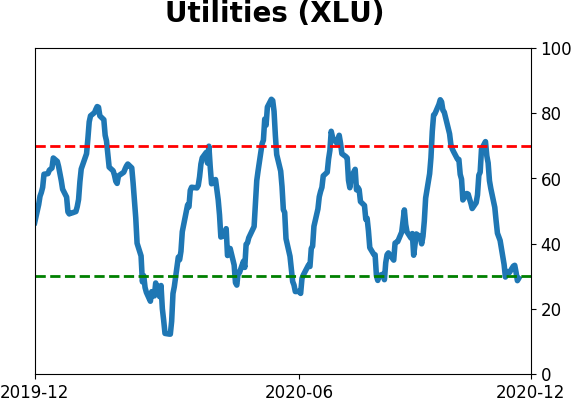
Sector ETF's - 10-Day Moving Average
|
|
|
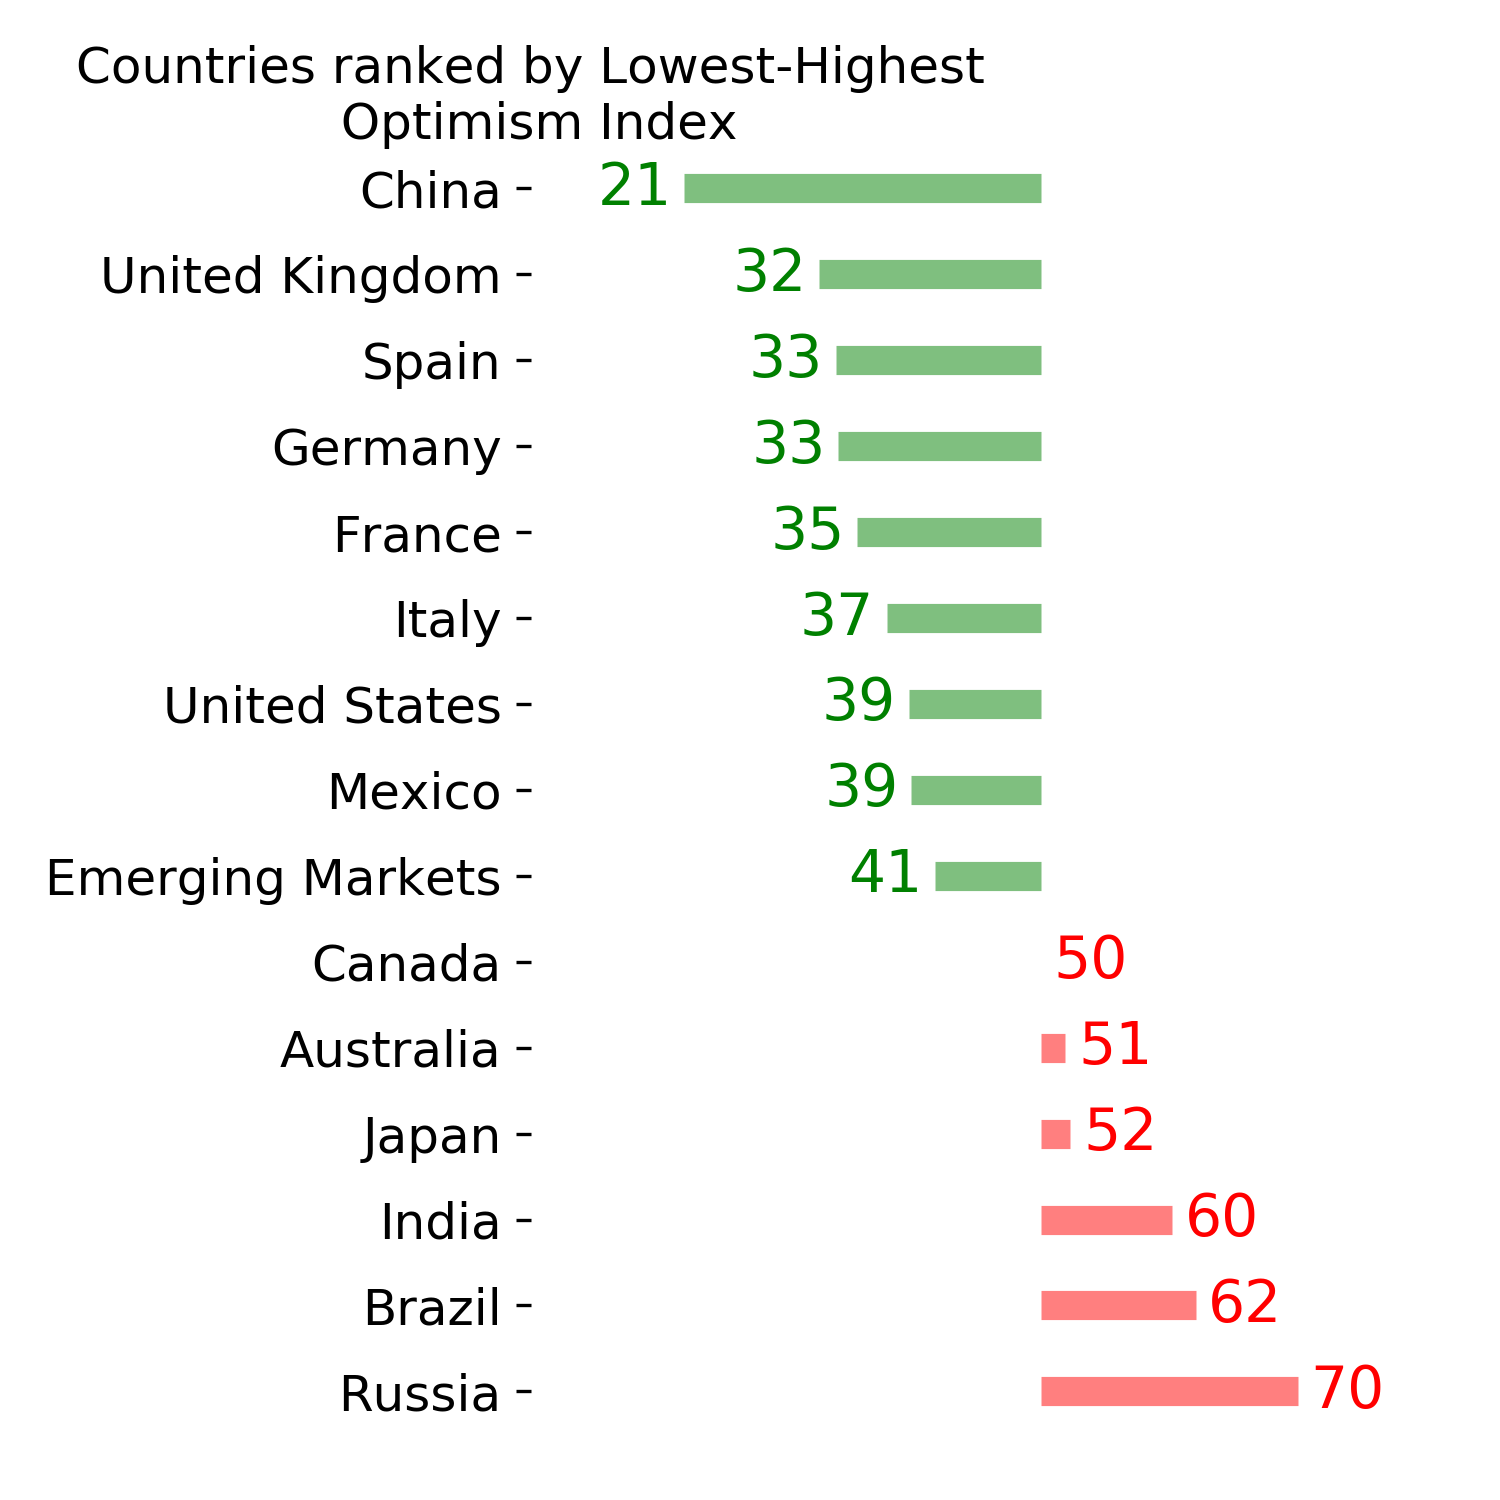
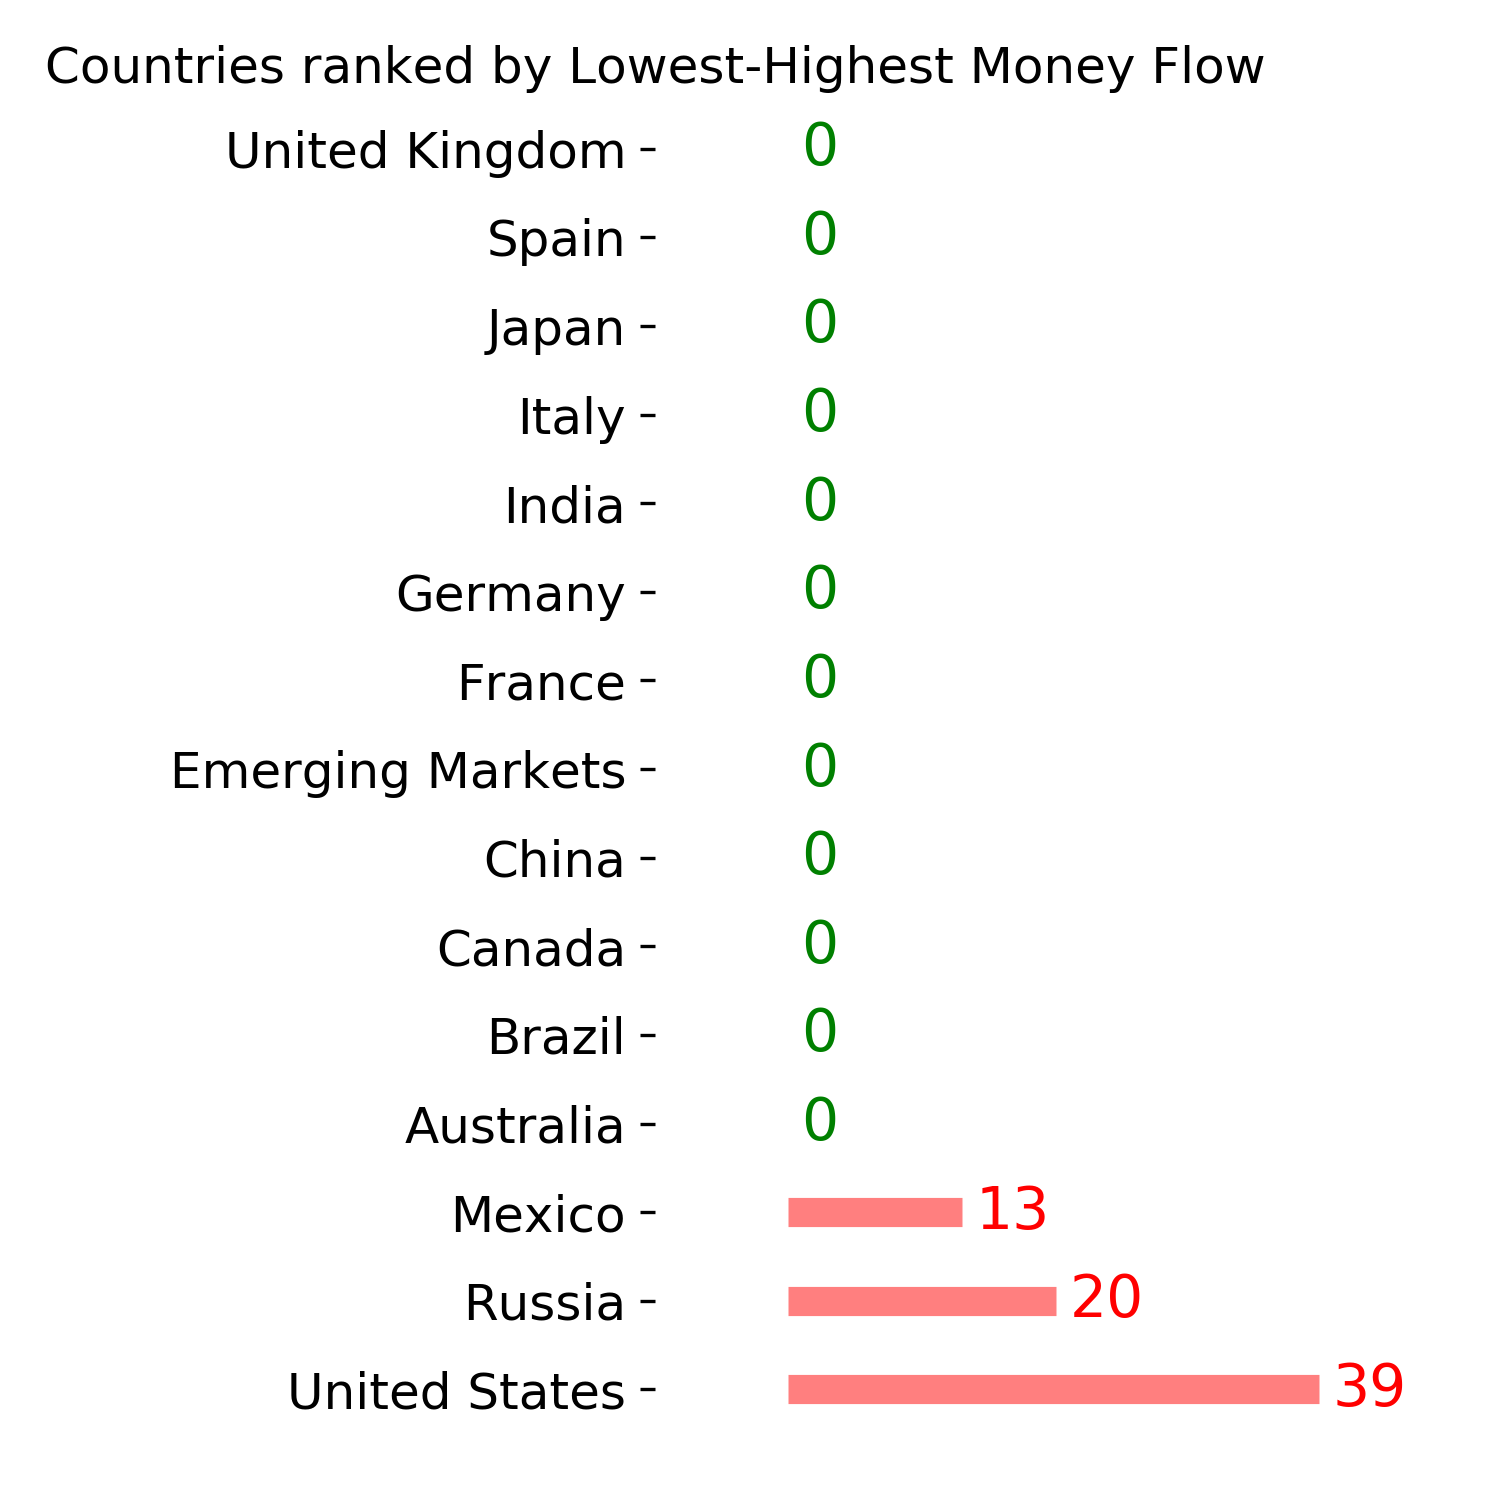
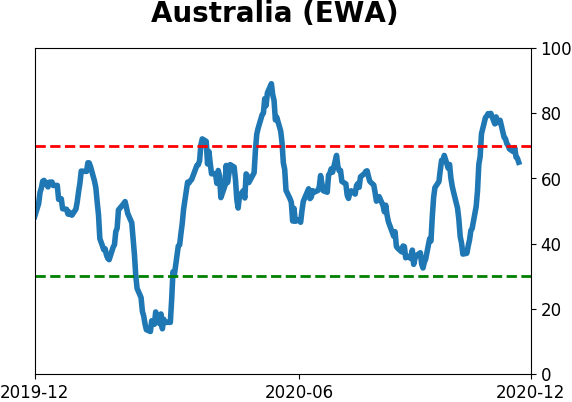
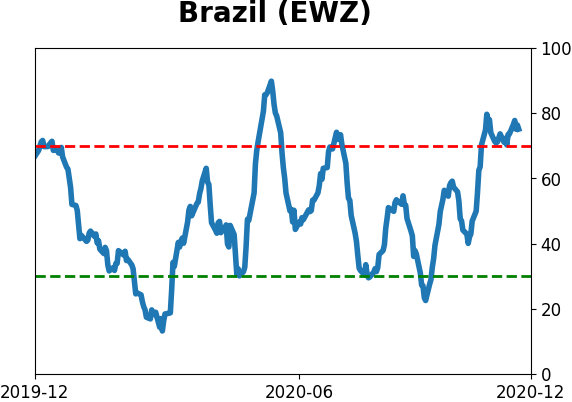
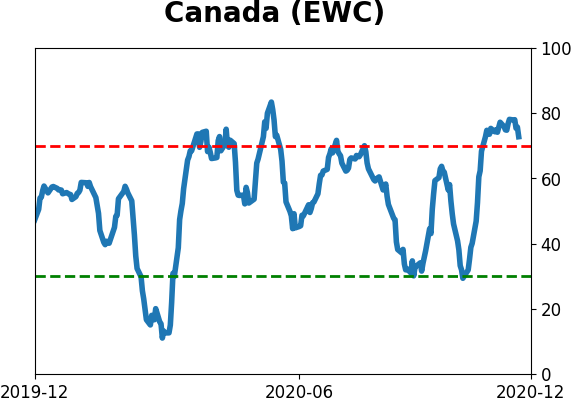
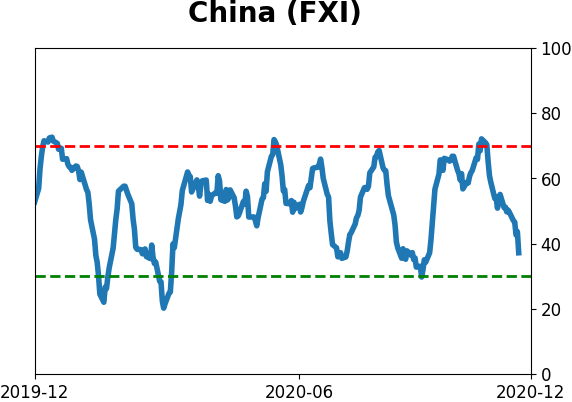
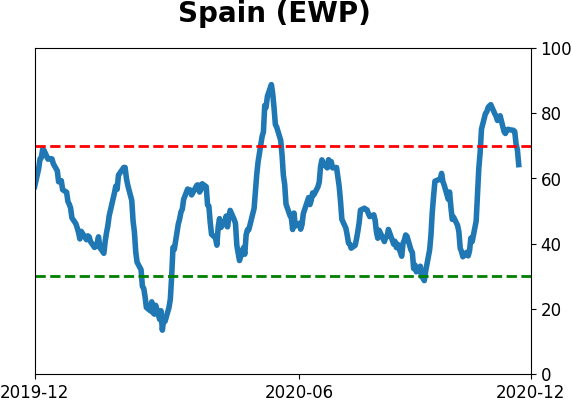
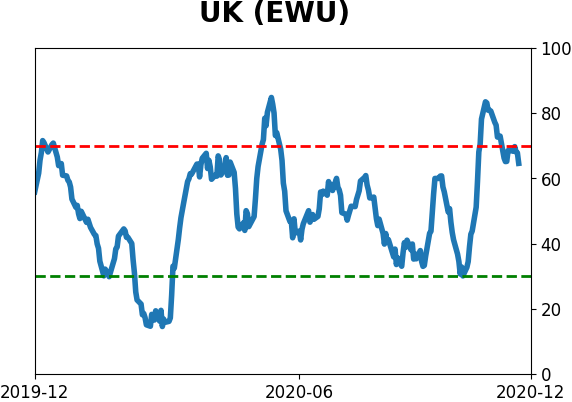
Country ETF's - 10-Day Moving Average
|
|
|
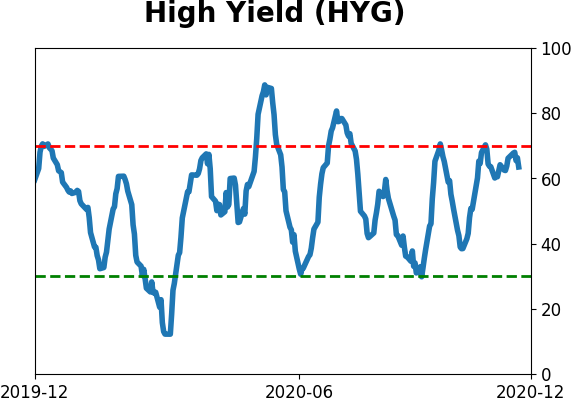
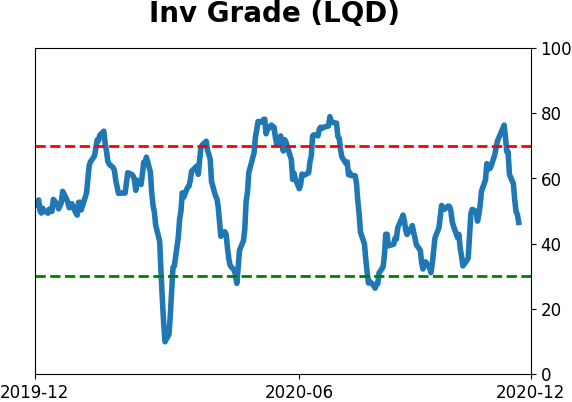
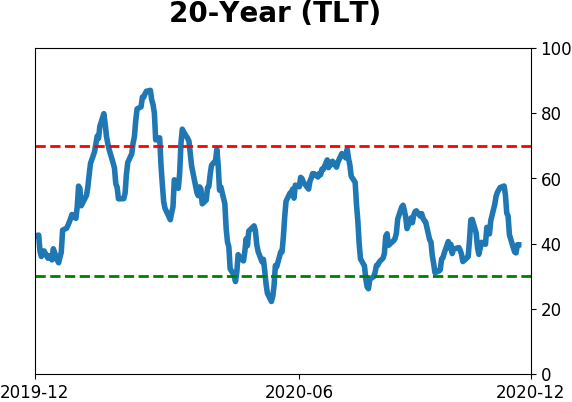
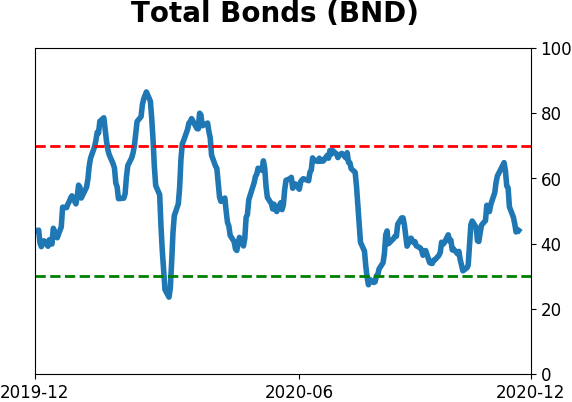
Bond ETF's - 10-Day Moving Average
|
|
|
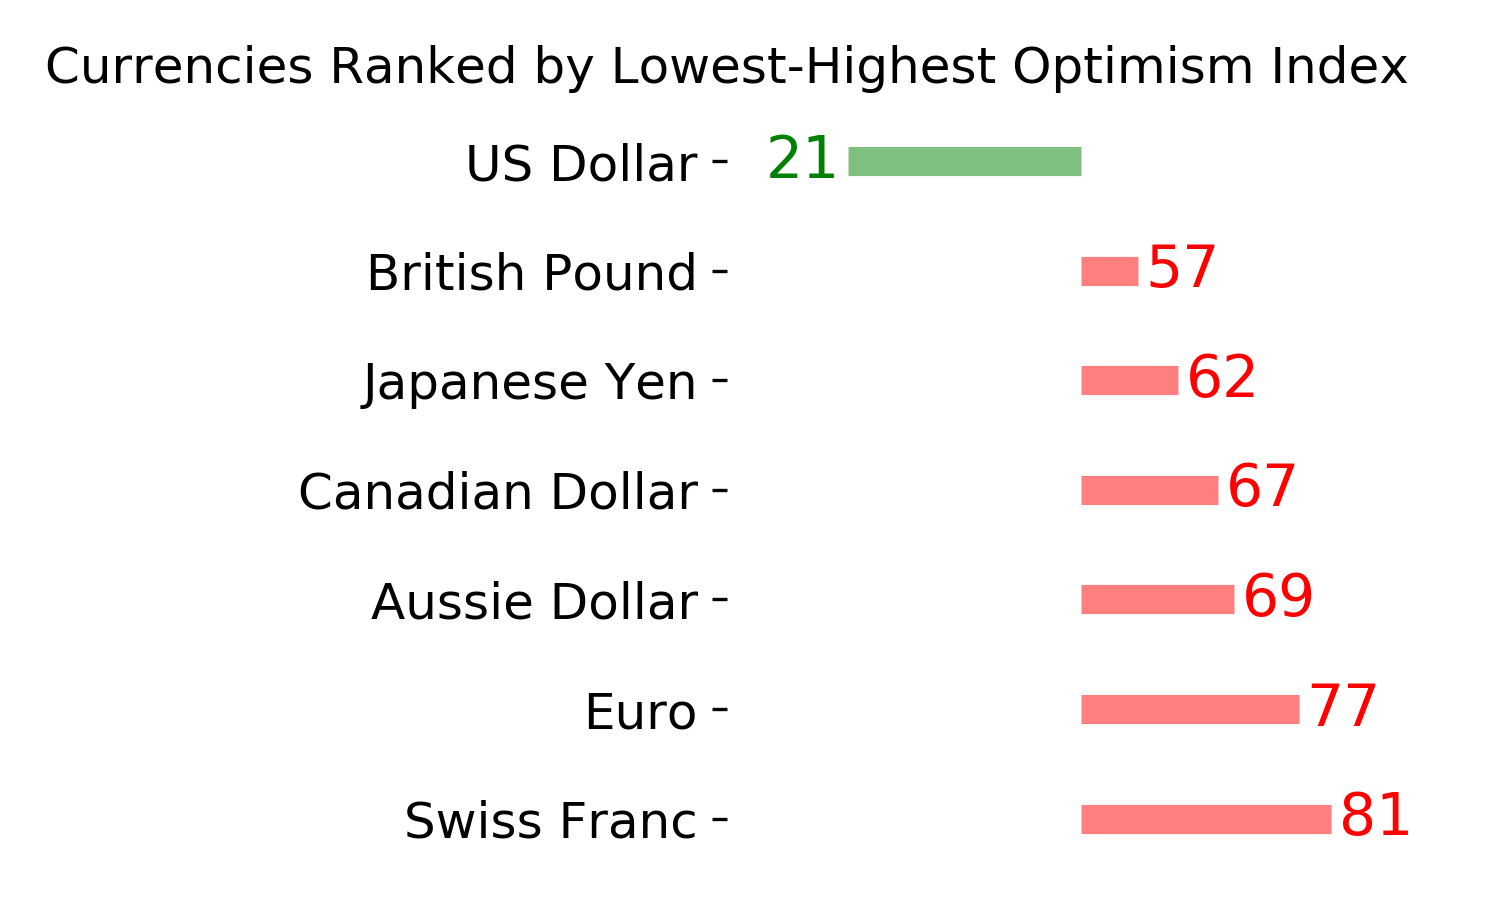
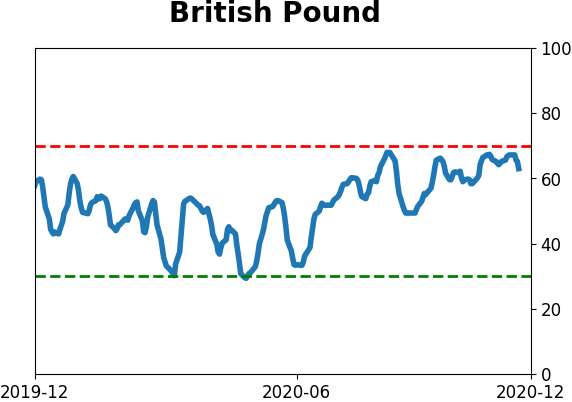
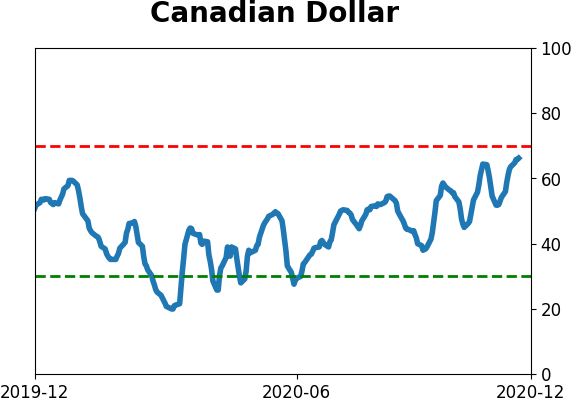
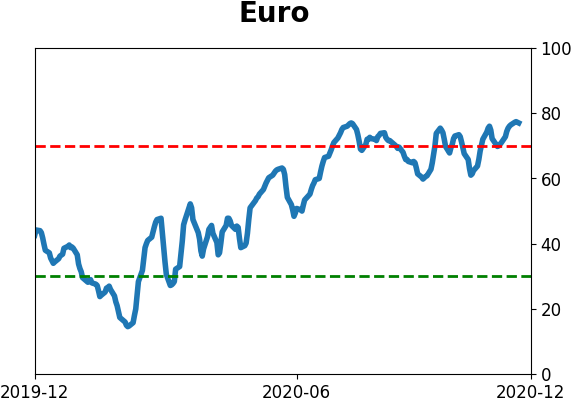
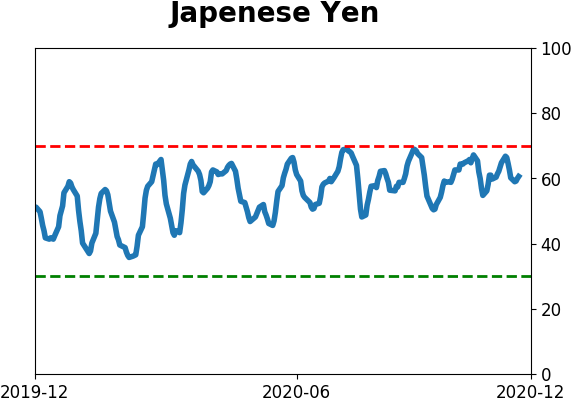
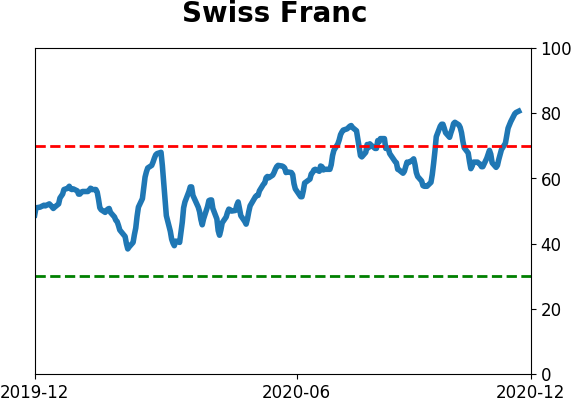
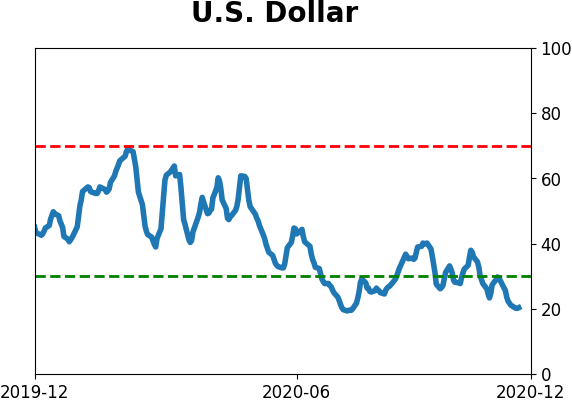
Currency ETF's - 5-Day Moving Average
|
|
|
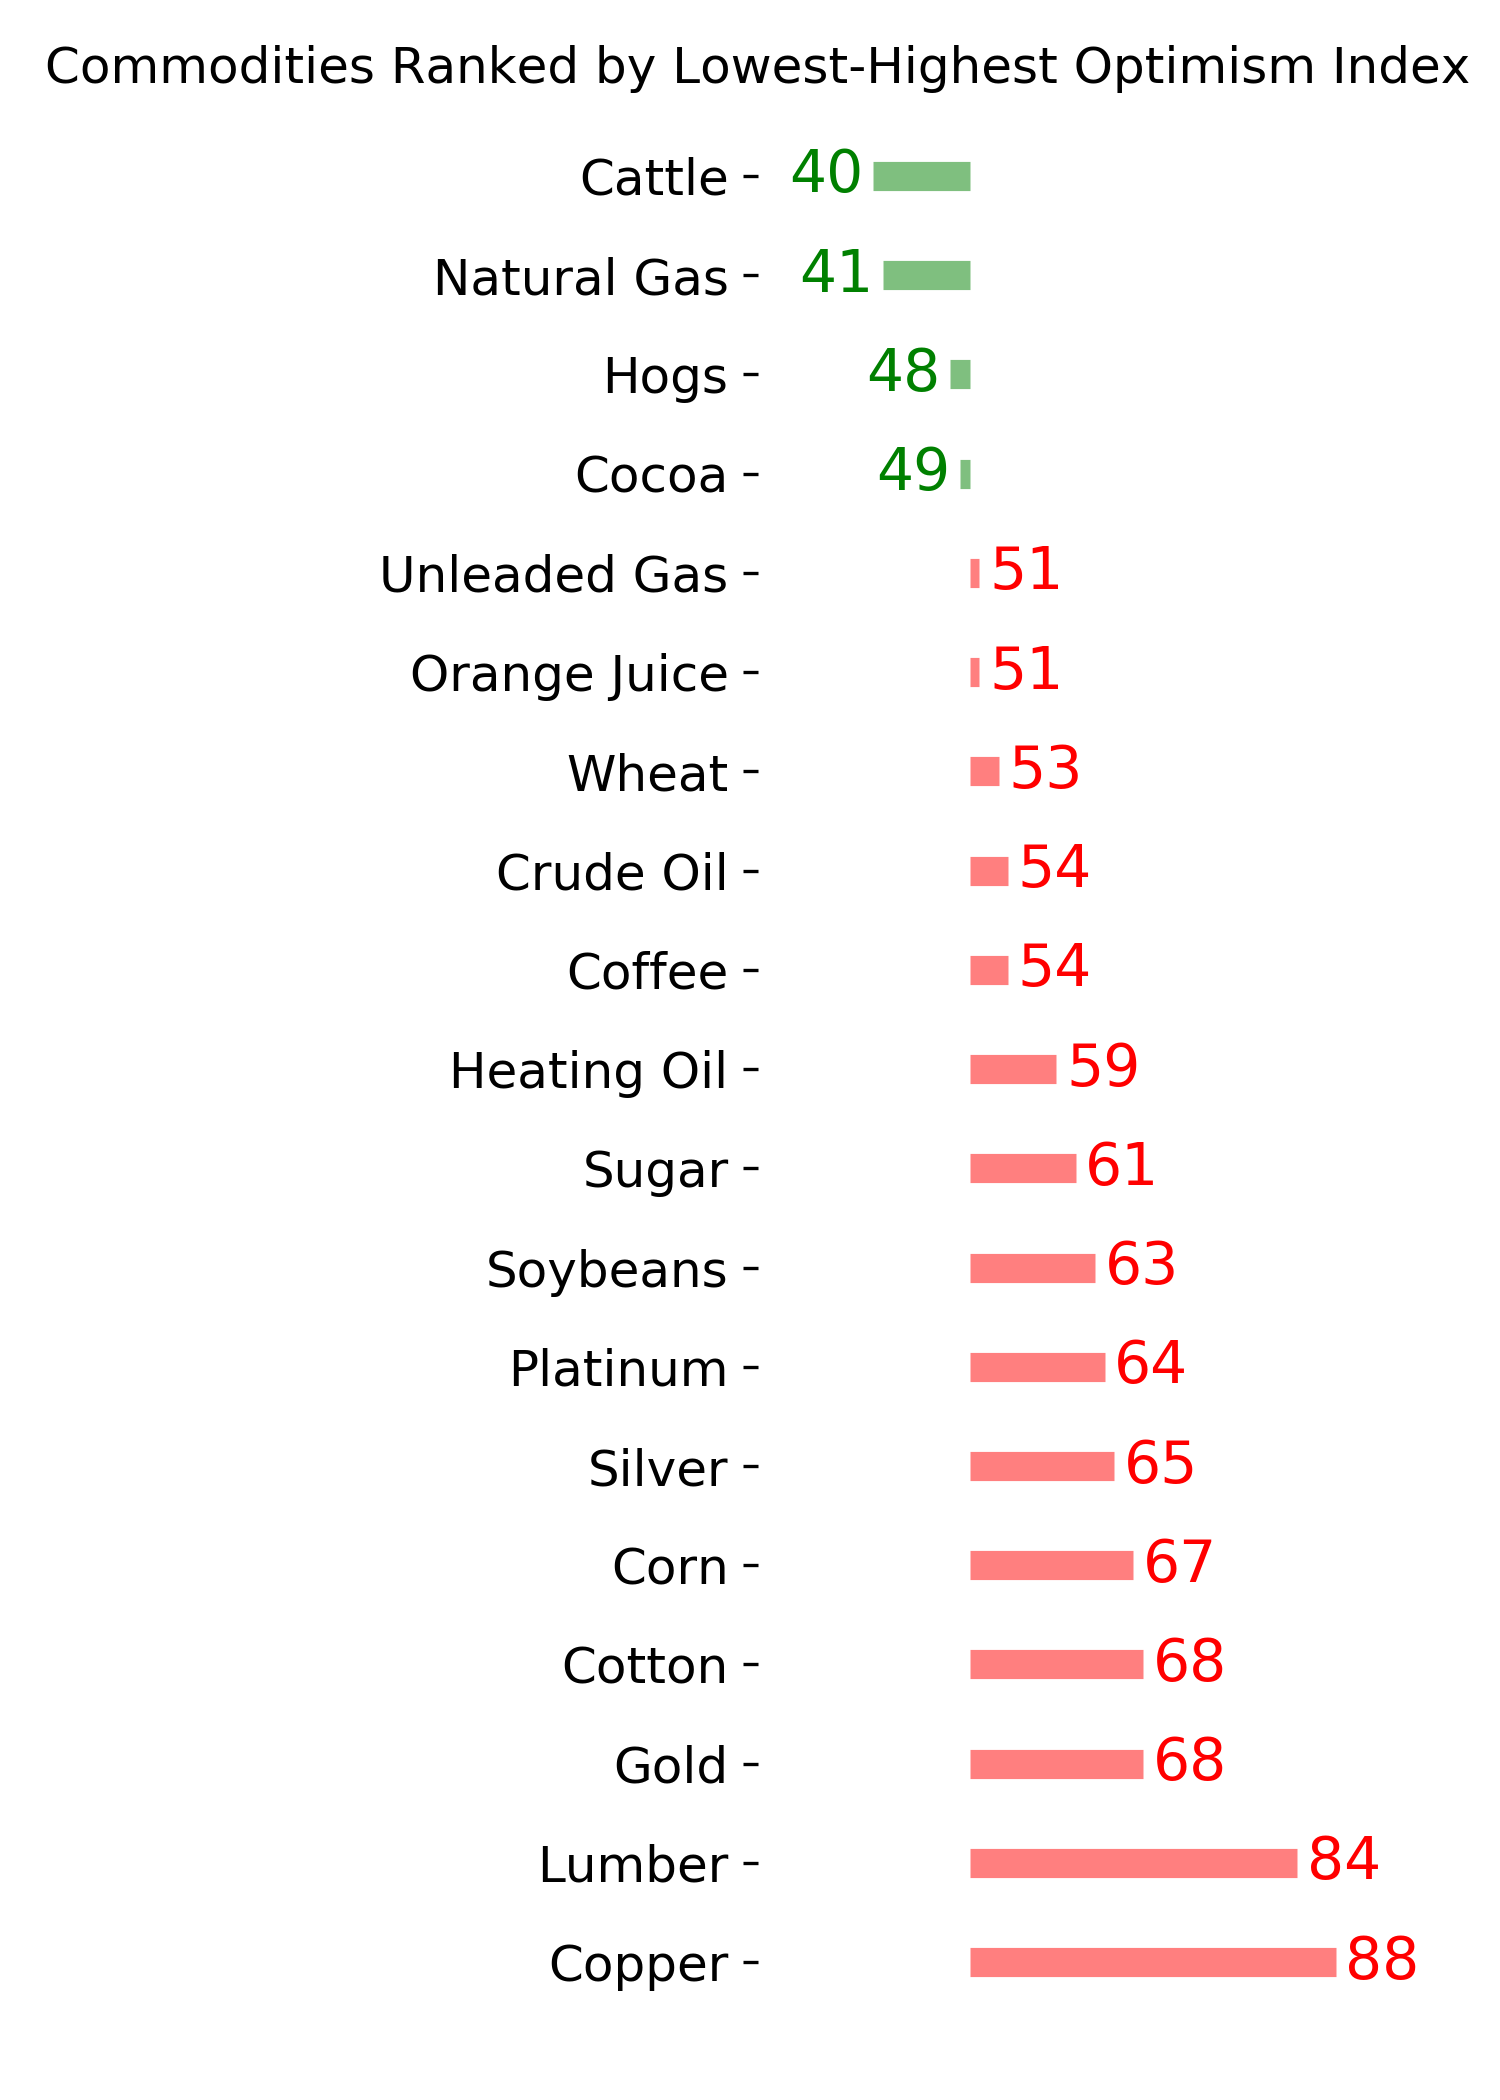
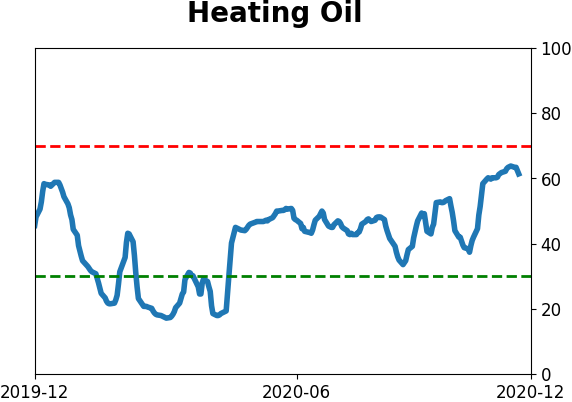
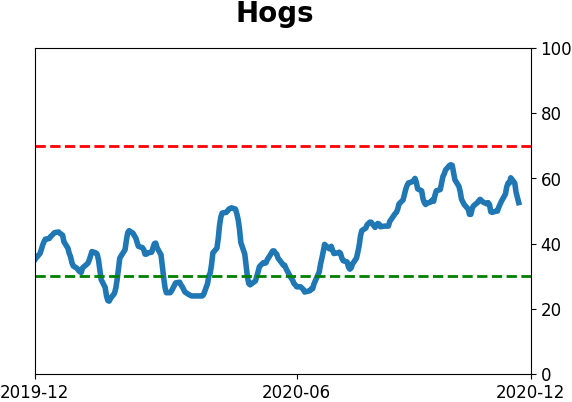
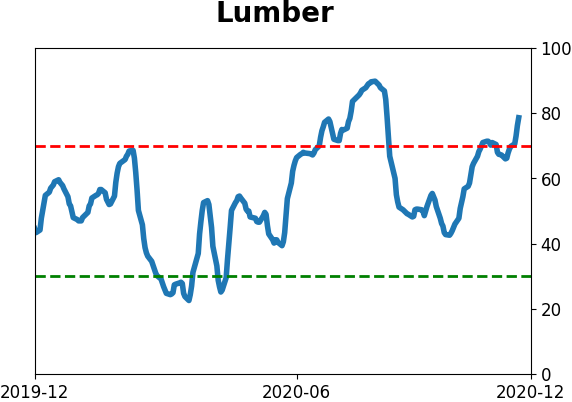
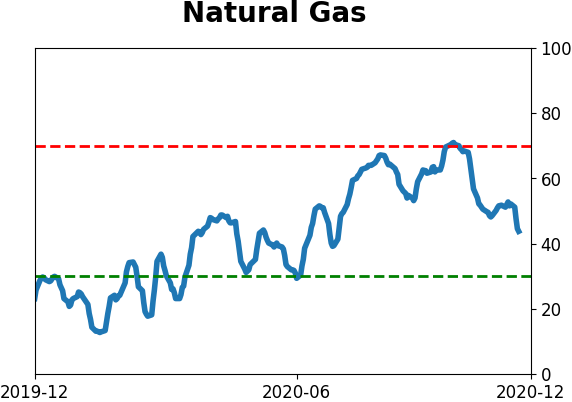
Commodity ETF's - 5-Day Moving Average
|
|