Headlines
|
|
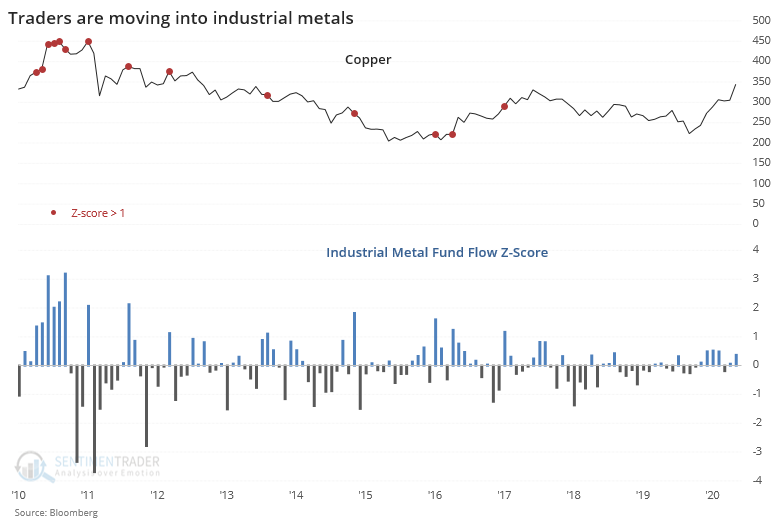
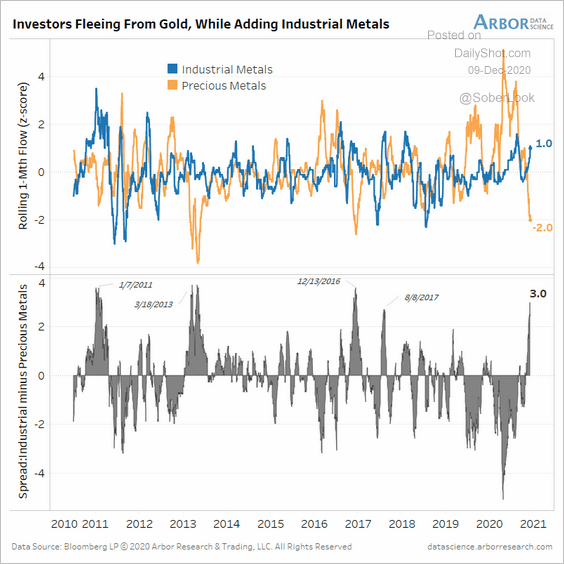
Traders flee precious metals for their industrial cousins:
Traders have been pulling out of precious metals funds, specifically GLD, at an extreme rate over the past month. Instead, they're moving partially into industrial metal funds that focus on markets like copper. Speculators are pulling back on gold as well, just as it enters a positive seasonal window.
IPO mania: The IPOs in 2020 have two things in common - investors have been receiving them well, and the companies don't make any money. According to Blomberg data, there have been 69 trading days this year that saw at least one IPO priced in the U.S. and that reported net income over the past year. Out of those 69 days, only 8 of them saw more IPOs that managed positive net income over the past 12 months while 57 days saw more IPOs that lost money than made money. As we'll see on Friday, this is unlike anything the market has accommodated in 30 years.
Bottom Line:
- The market environment is pristine, but with near-historic optimism, gains tend to be muted, with a high probability of being reversed at some point over the ensuing weeks.
|
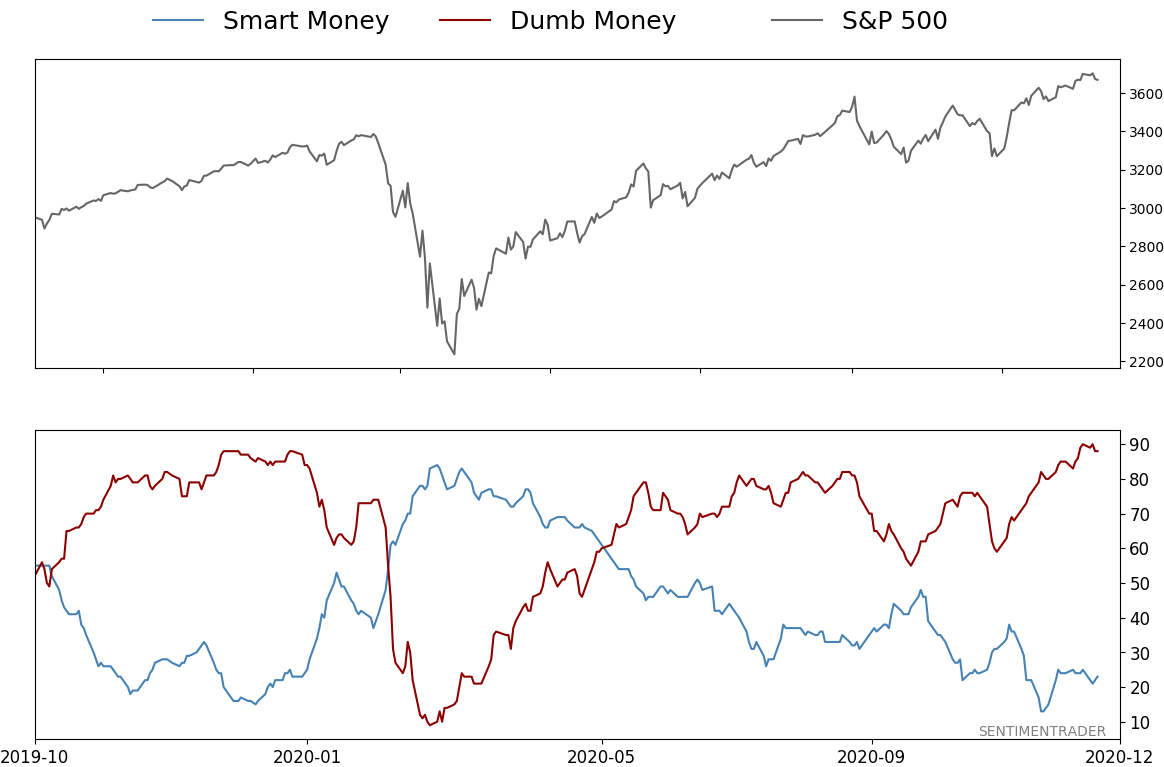
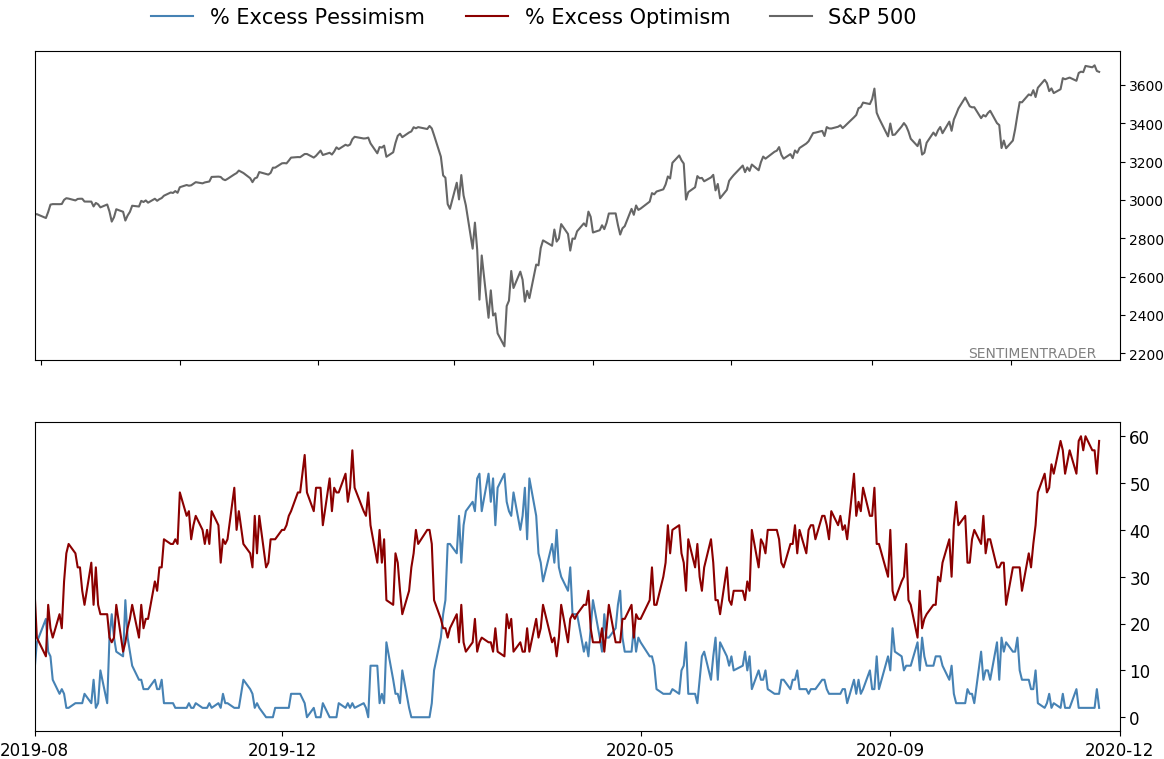
Smart / Dumb Money Confidence
|
Smart Money Confidence: 23%
Dumb Money Confidence: 88%
|
|
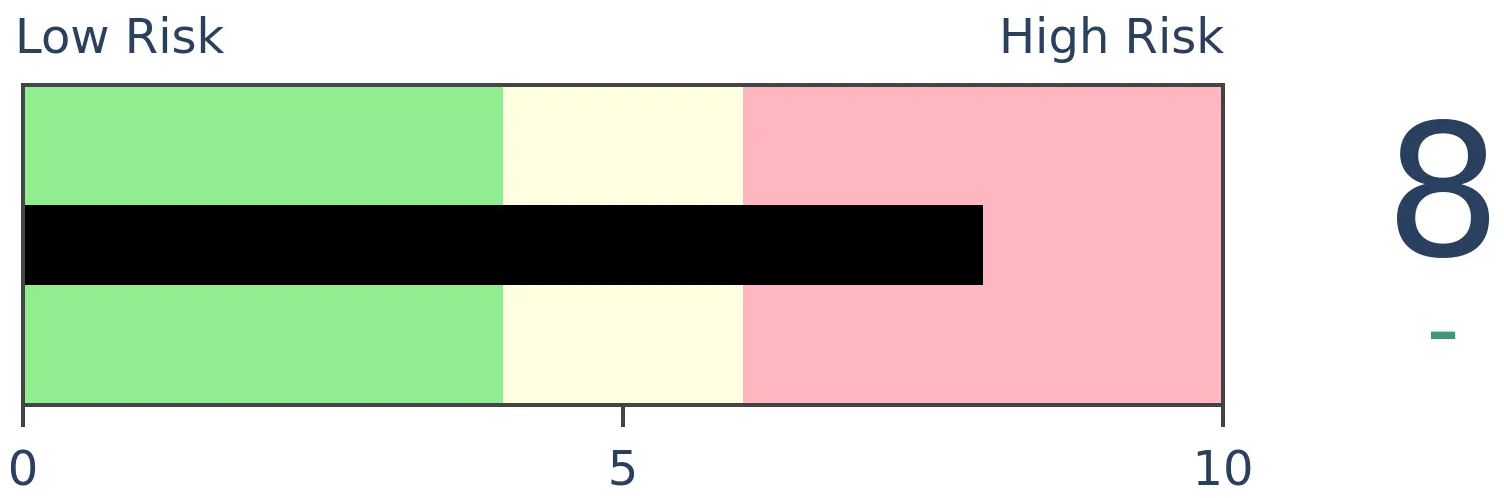
Risk Levels
Stocks Short-Term
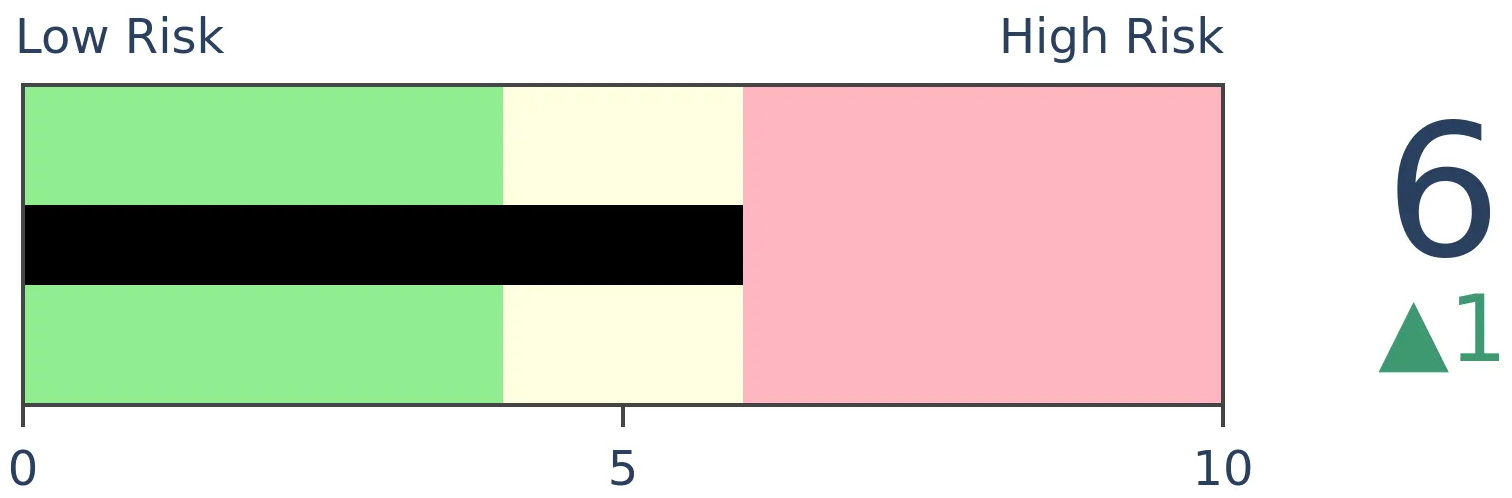
|
Stocks Medium-Term
|
|
Bonds
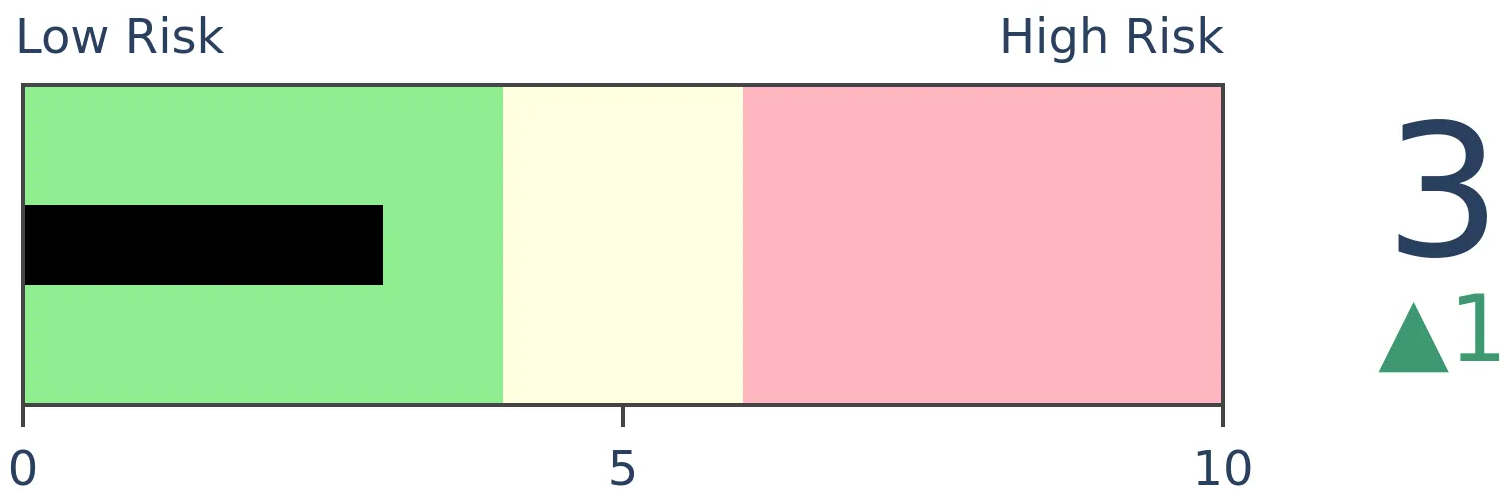
|
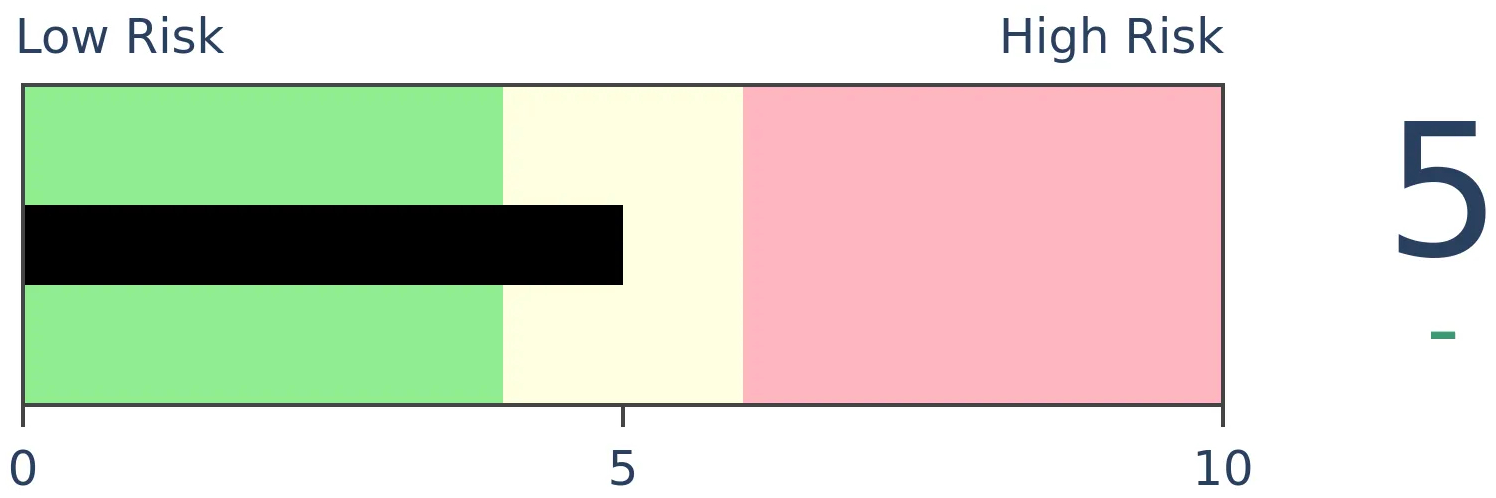
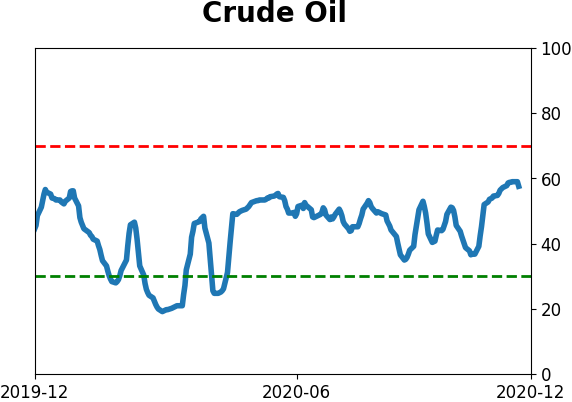
Crude Oil

|
|
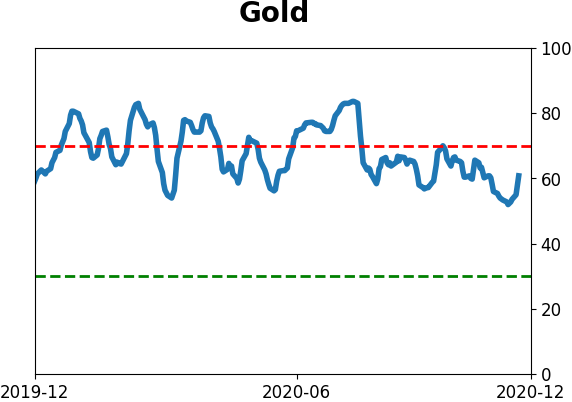
Gold
|
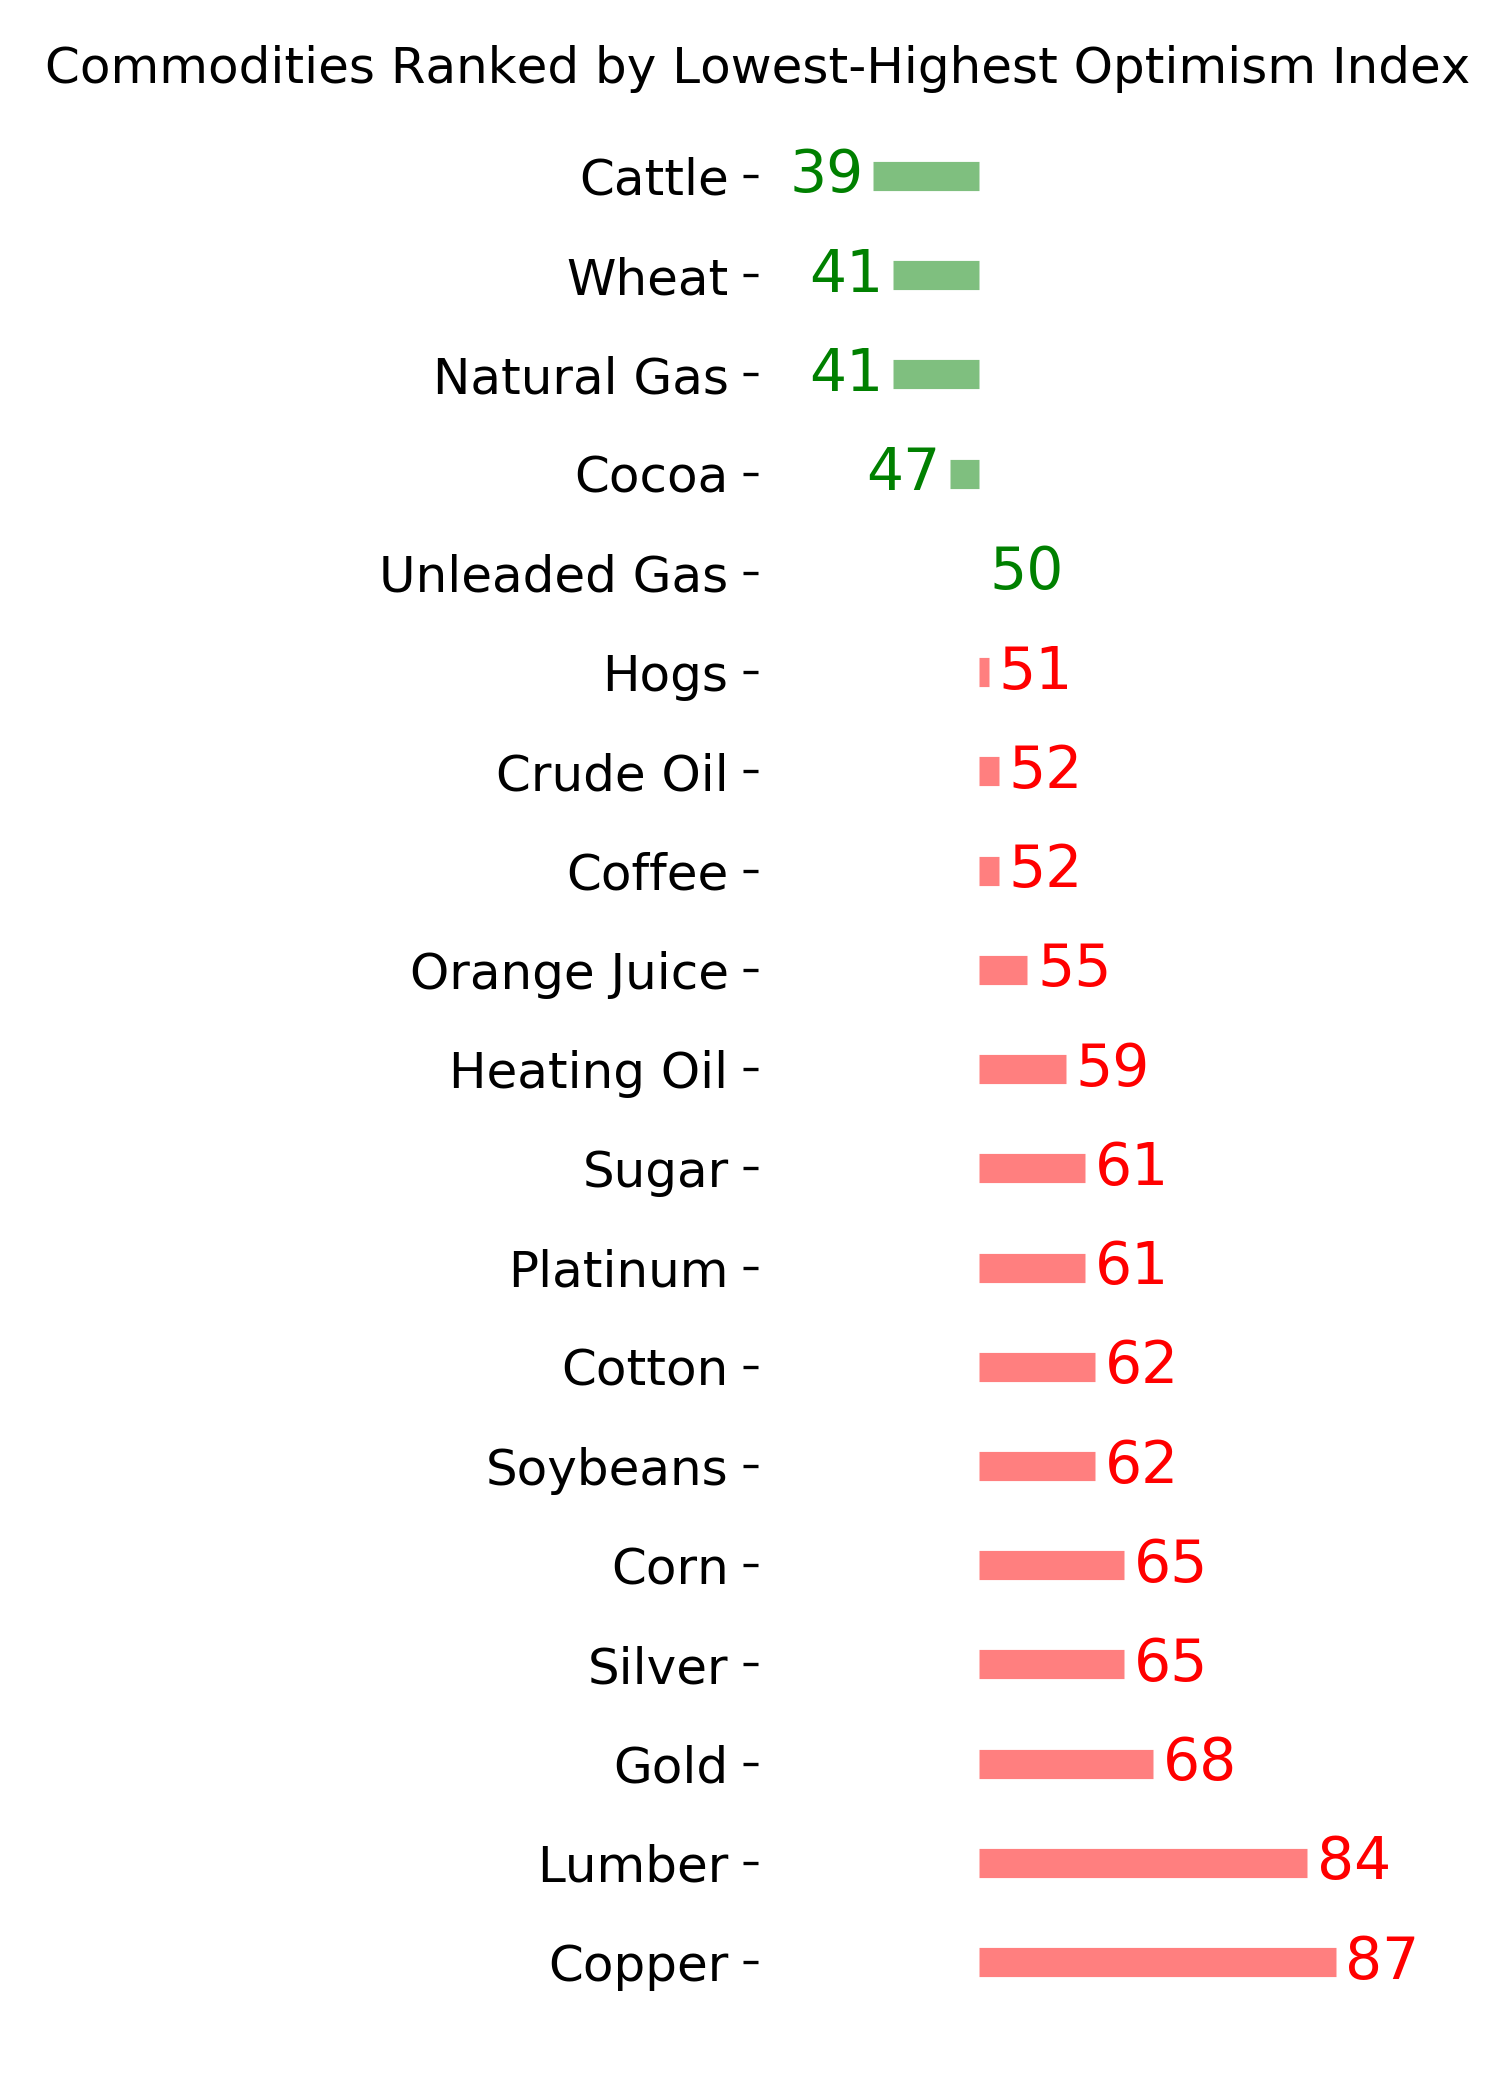
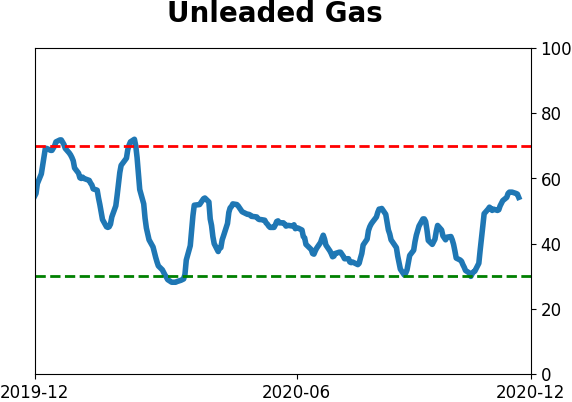
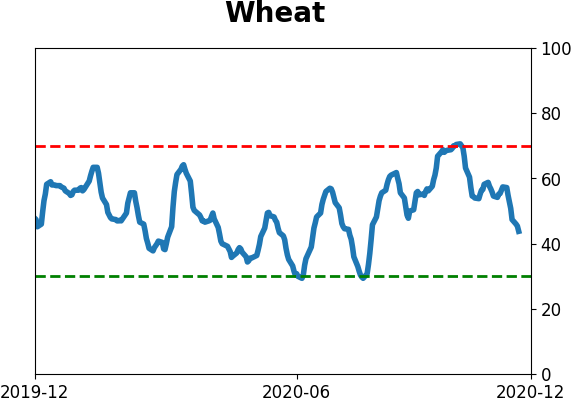
Agriculture
|
|
Research
BOTTOM LINE
Traders have been pulling out of precious metals funds, specifically GLD, at an extreme rate over the past month. Instead, they're moving partially into industrial metal funds that focus on markets like copper. Speculators are pulling back on gold as well, just as it enters a positive seasonal window.
FORECAST / TIMEFRAME
None
|
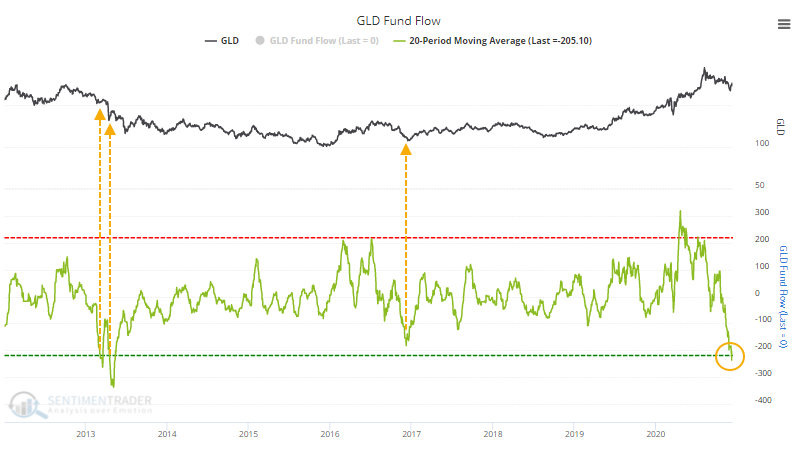
Traders in ETFs are often considered to be hot money, chasing trends and getting out at the first sign of trouble. In precious metals, that seems to be the case, and they pulled out in a big way over the past month.
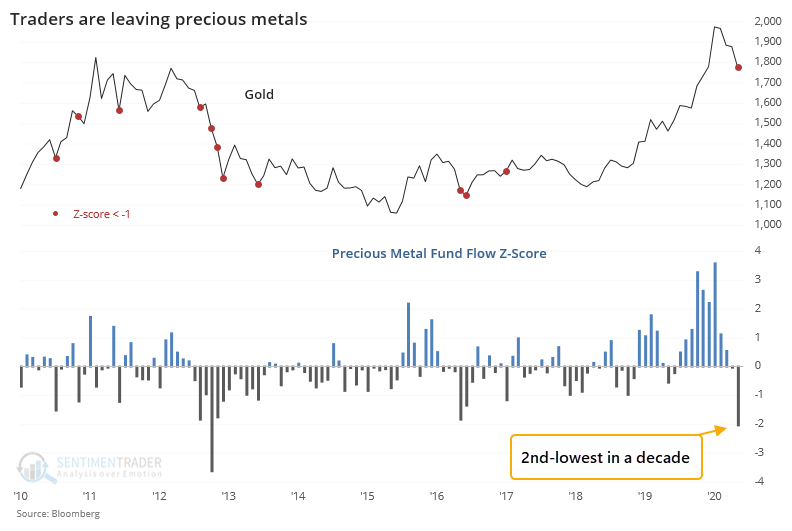
The folks at Arbor Research noted that the z-score on precious metal fund flows hit -2. The z-score measures the current flow relative to the average and standard deviation of previous flows. The more negative the number, the more significant it might be. Over the past month, this has become the 2nd-lowest in a decade.
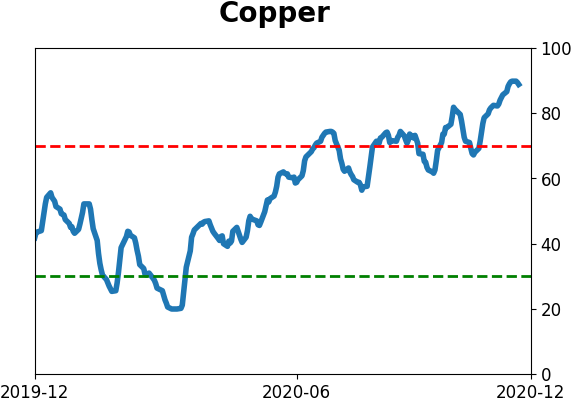
At the same time, they've moved into funds that focus on industrial metals, like copper. It's not all that extreme given some wild gyrations in 2010 and 2011, but it's still positive.
That means the difference in z-scores between precious metals and industrial metals has dropped to a significantly low level, well below -2.
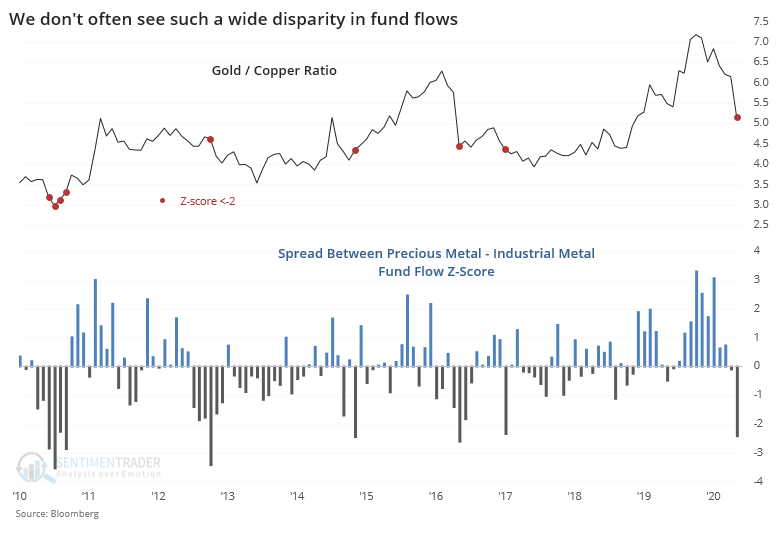
The red dots on the chart highlight other times the difference in z-scores was below -2. There were 5 distinct instances, with 4 of them occurring near the end of gold's underperformance relative to copper.
We can see this flow out of gold funds clearly by watching GLD. Over the past 20 days, the fund has lost an average of more than $200 million in assets per day, challenging the worst stretch in its history. A big outflow coincided with the end of a pullback in late 2016, but in 2013 it was closer to the beginning of a decline than the end.
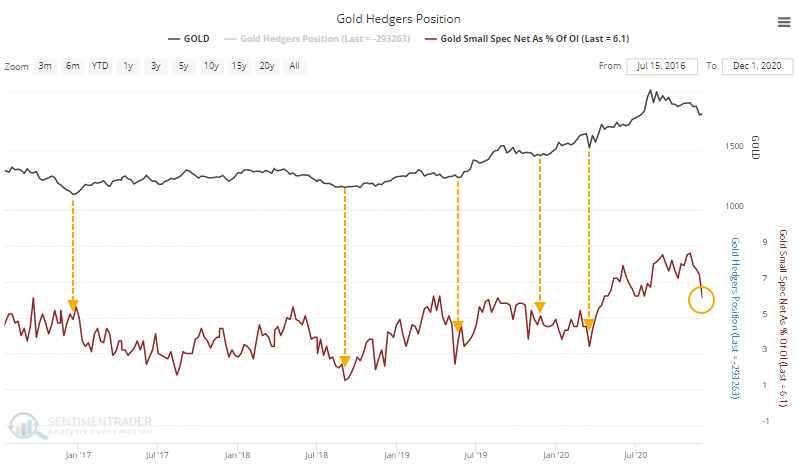
Small speculators in gold futures haven't quite given up, though. As of last Tuesday, they were holding a little more than 6% of the contracts net long. That's down from almost 9% a few weeks ago, but since the 2016 bottom, pullbacks in gold have stopped when these traders were holding 5% or less of the contracts net long. Not a big difference there, but it's something to watch as a sign of give-up among a class of traders who tend to be contrary indicators.
One potential positive is the calendar. Gold, and funds like GLD, are now entering what is traditionally the most favorable seasonal window.
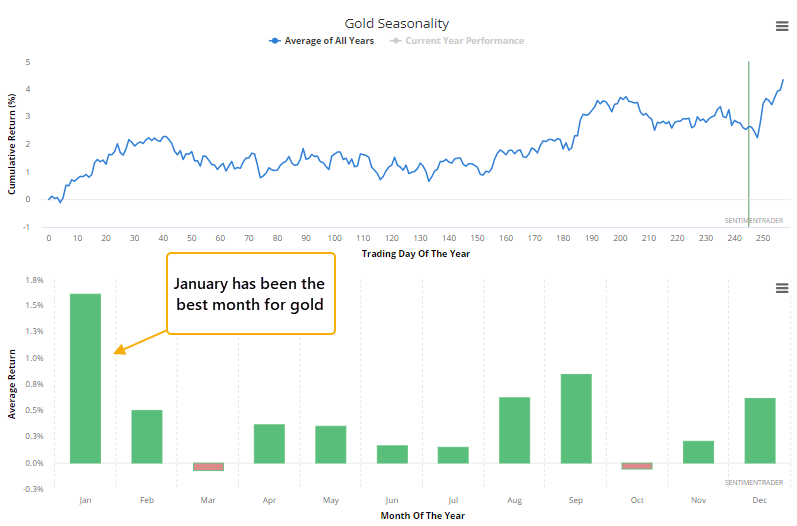
The outflow from precious metals funds should be positive for gold and related investments, especially as we head into what has often been a good time of year for the metal, though it would be more encouraging if there were more signs of pessimism, which are spotty outside of the fund flows. We saw a couple of weeks ago that when positive momentum in this market starts to wobble, it has usually recovered, and it's nearing a point where it really should take hold if it's going to follow through on those tendencies.
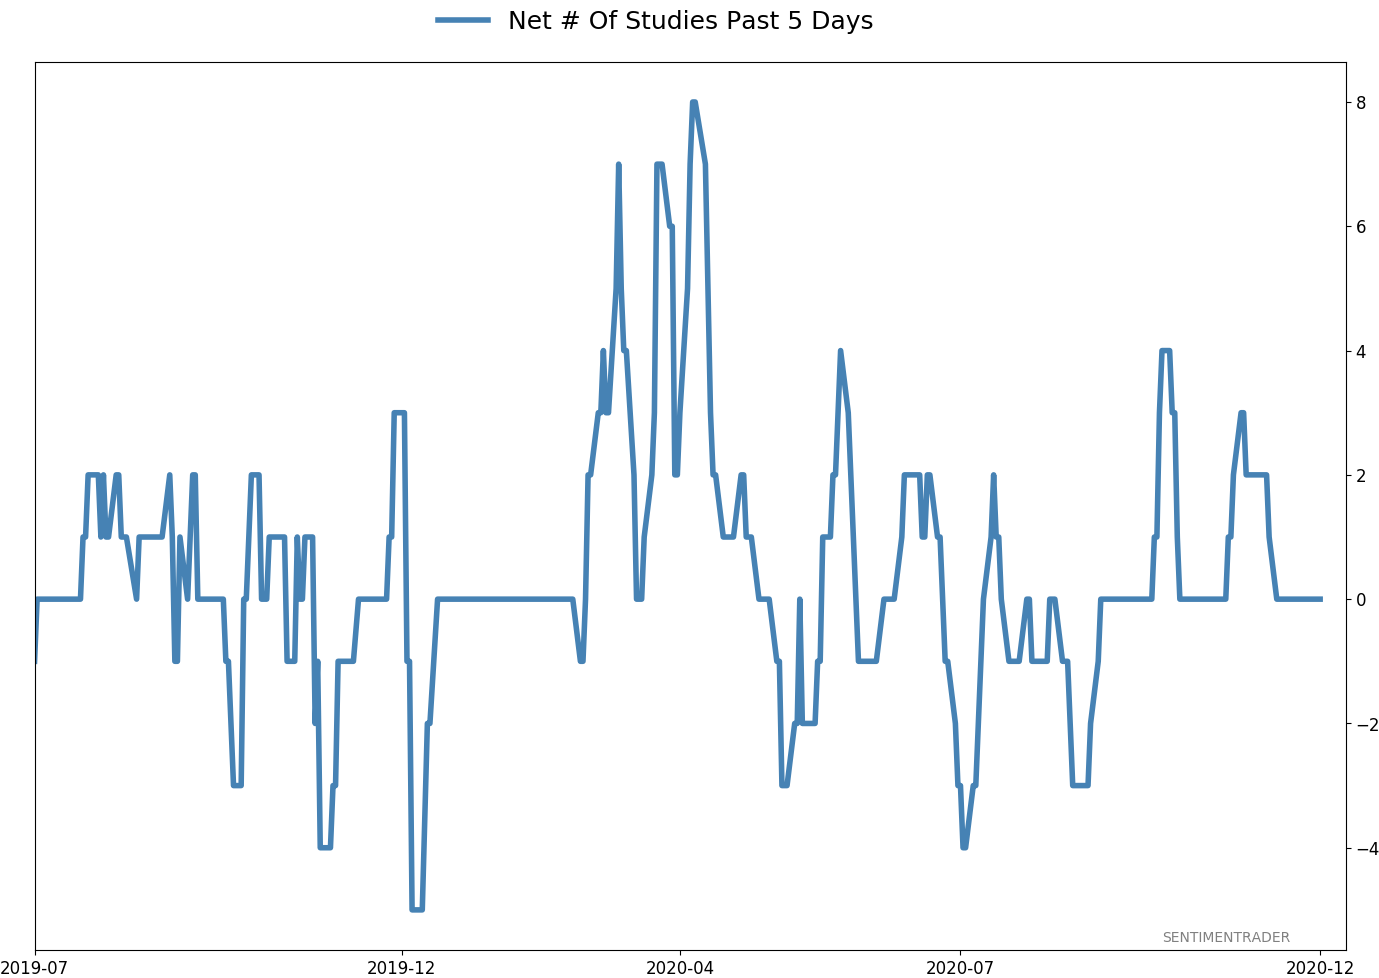
Active Studies
| Time Frame | Bullish | Bearish | | Short-Term | 0 | 1 | | Medium-Term | 5 | 8 | | Long-Term | 52 | 2 |
|
Indicators at Extremes
Portfolio
| Position | Description | Weight % | Added / Reduced | Date | | Stocks | 15.6% RSP, 10.1% VWO, 7.5% XLE, 5.1% PSCE | 41.2 | Added 5% | 2020-10-15 | | Bonds | 10% BND, 10% SCHP, 10% ANGL | 28.6 | Reduced 0.1% | 2020-10-02 | | Commodities | GCC | 2.4 | Reduced 2.1%
| 2020-09-04 | | Precious Metals | GDX | 9.5 | Added 4.8% | 2020-12-01 | | Special Situations | | 0.0 | Reduced 5% | 2020-10-02 | | Cash | | 18.3 | | |
|
Updates (Changes made today are underlined)
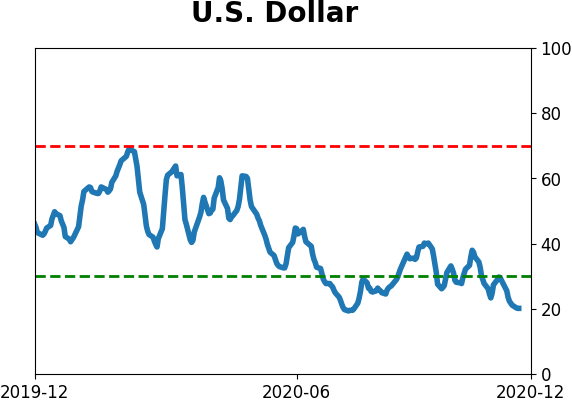
I've been quiet here because there hasn't been much to do. The things that were supposed to work have pretty much been doing so. With sentiment extremely stretched, I have no desire to add exposure there. About the only place I would add is energy, which has been following through exactly as it should. I did add back to my position in gold miners, due to the studies recently posted to the site. When gold (and miners) have pulled back after momentum like they enjoyed since March, the typical reaction is a resumption of the uptrend over the medium-term, and not a rollover into a bear phase. The continued weakness in the dollar certainly helps. RETURN YTD: 8.1% 2019: 12.6%, 2018: 0.6%, 2017: 3.8%, 2016: 17.1%, 2015: 9.2%, 2014: 14.5%, 2013: 2.2%, 2012: 10.8%, 2011: 16.5%, 2010: 15.3%, 2009: 23.9%, 2008: 16.2%, 2007: 7.8%
|
|
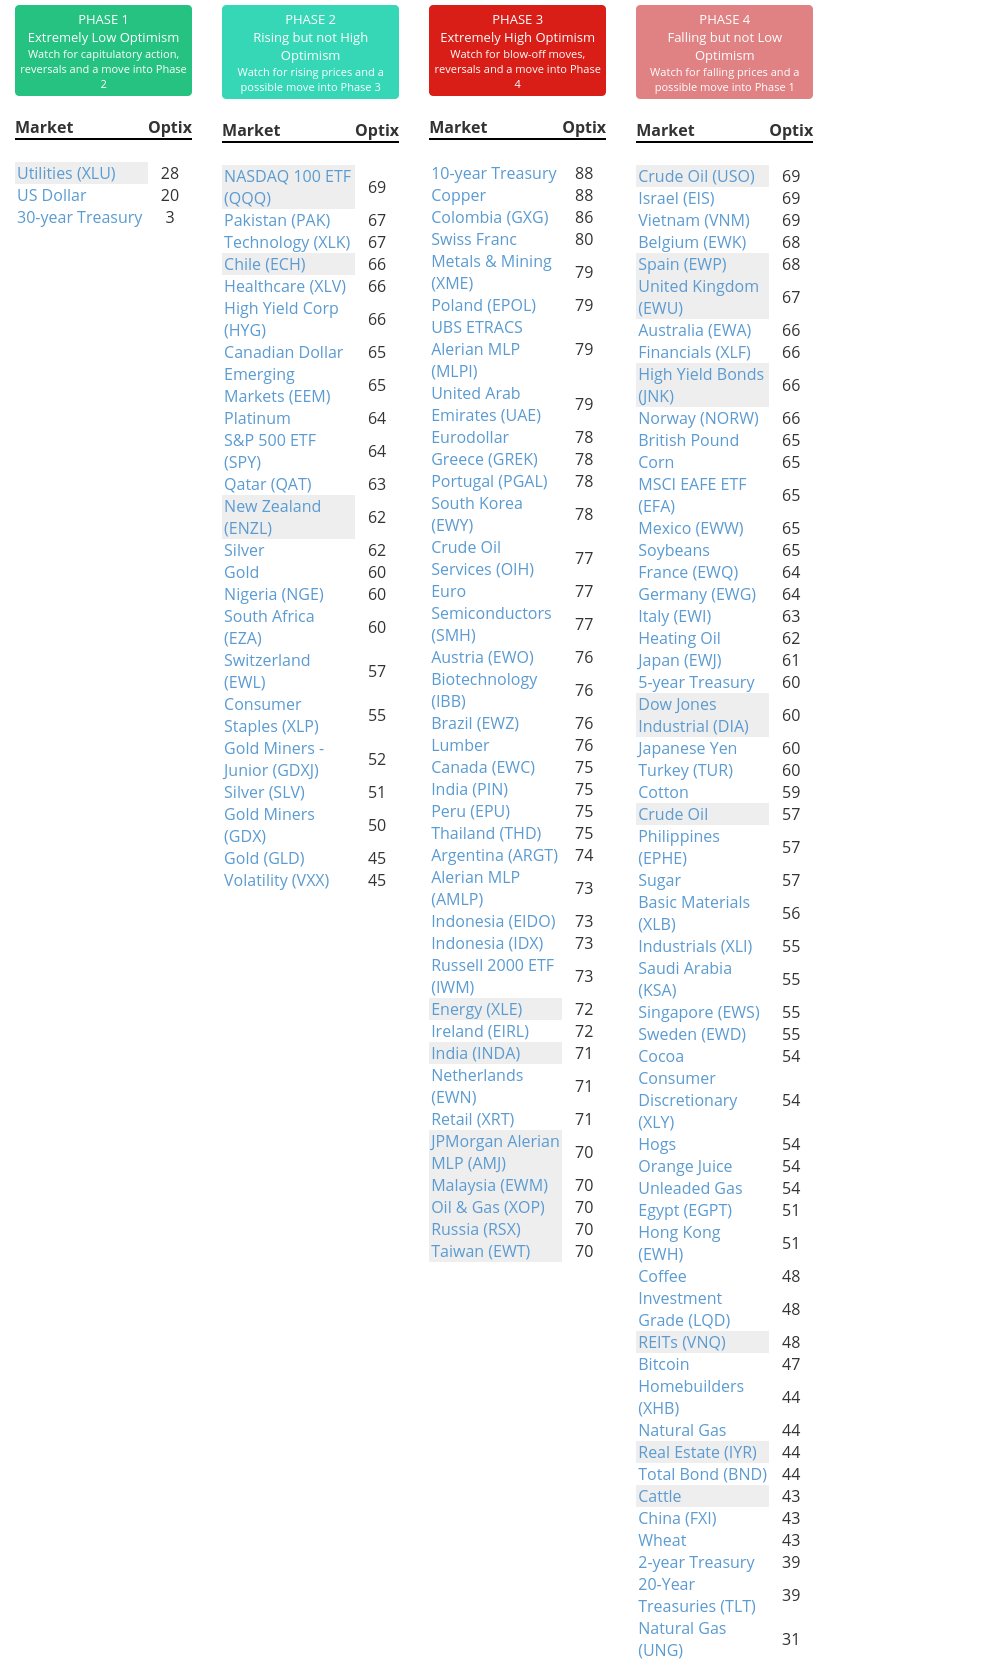
Phase Table
Ranks
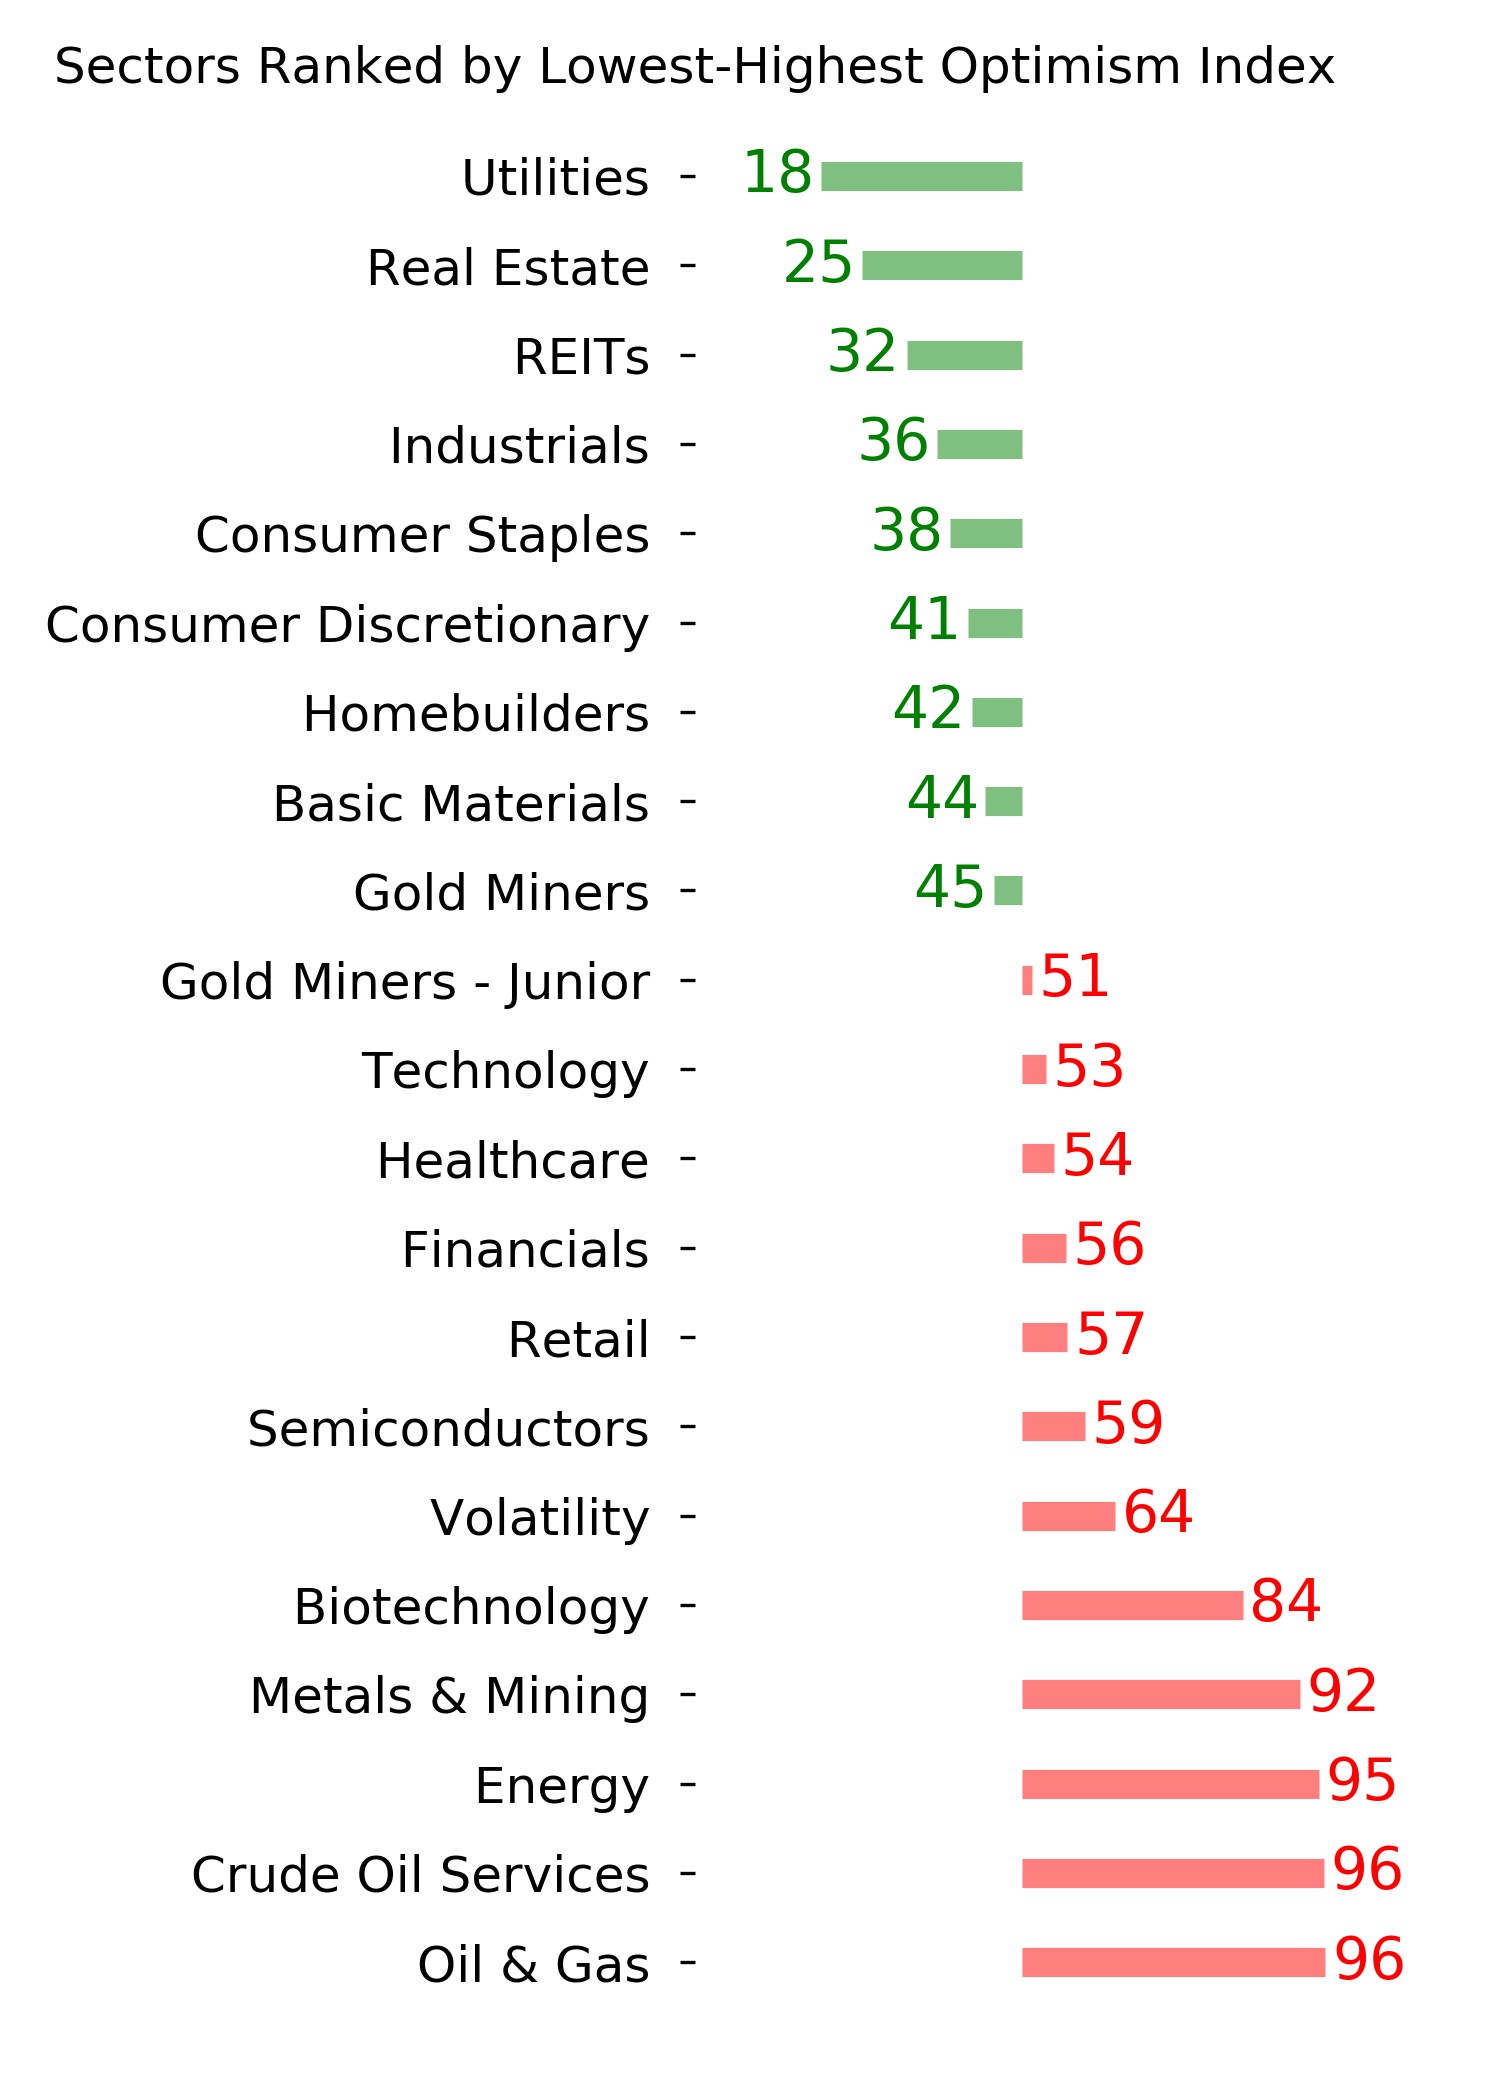
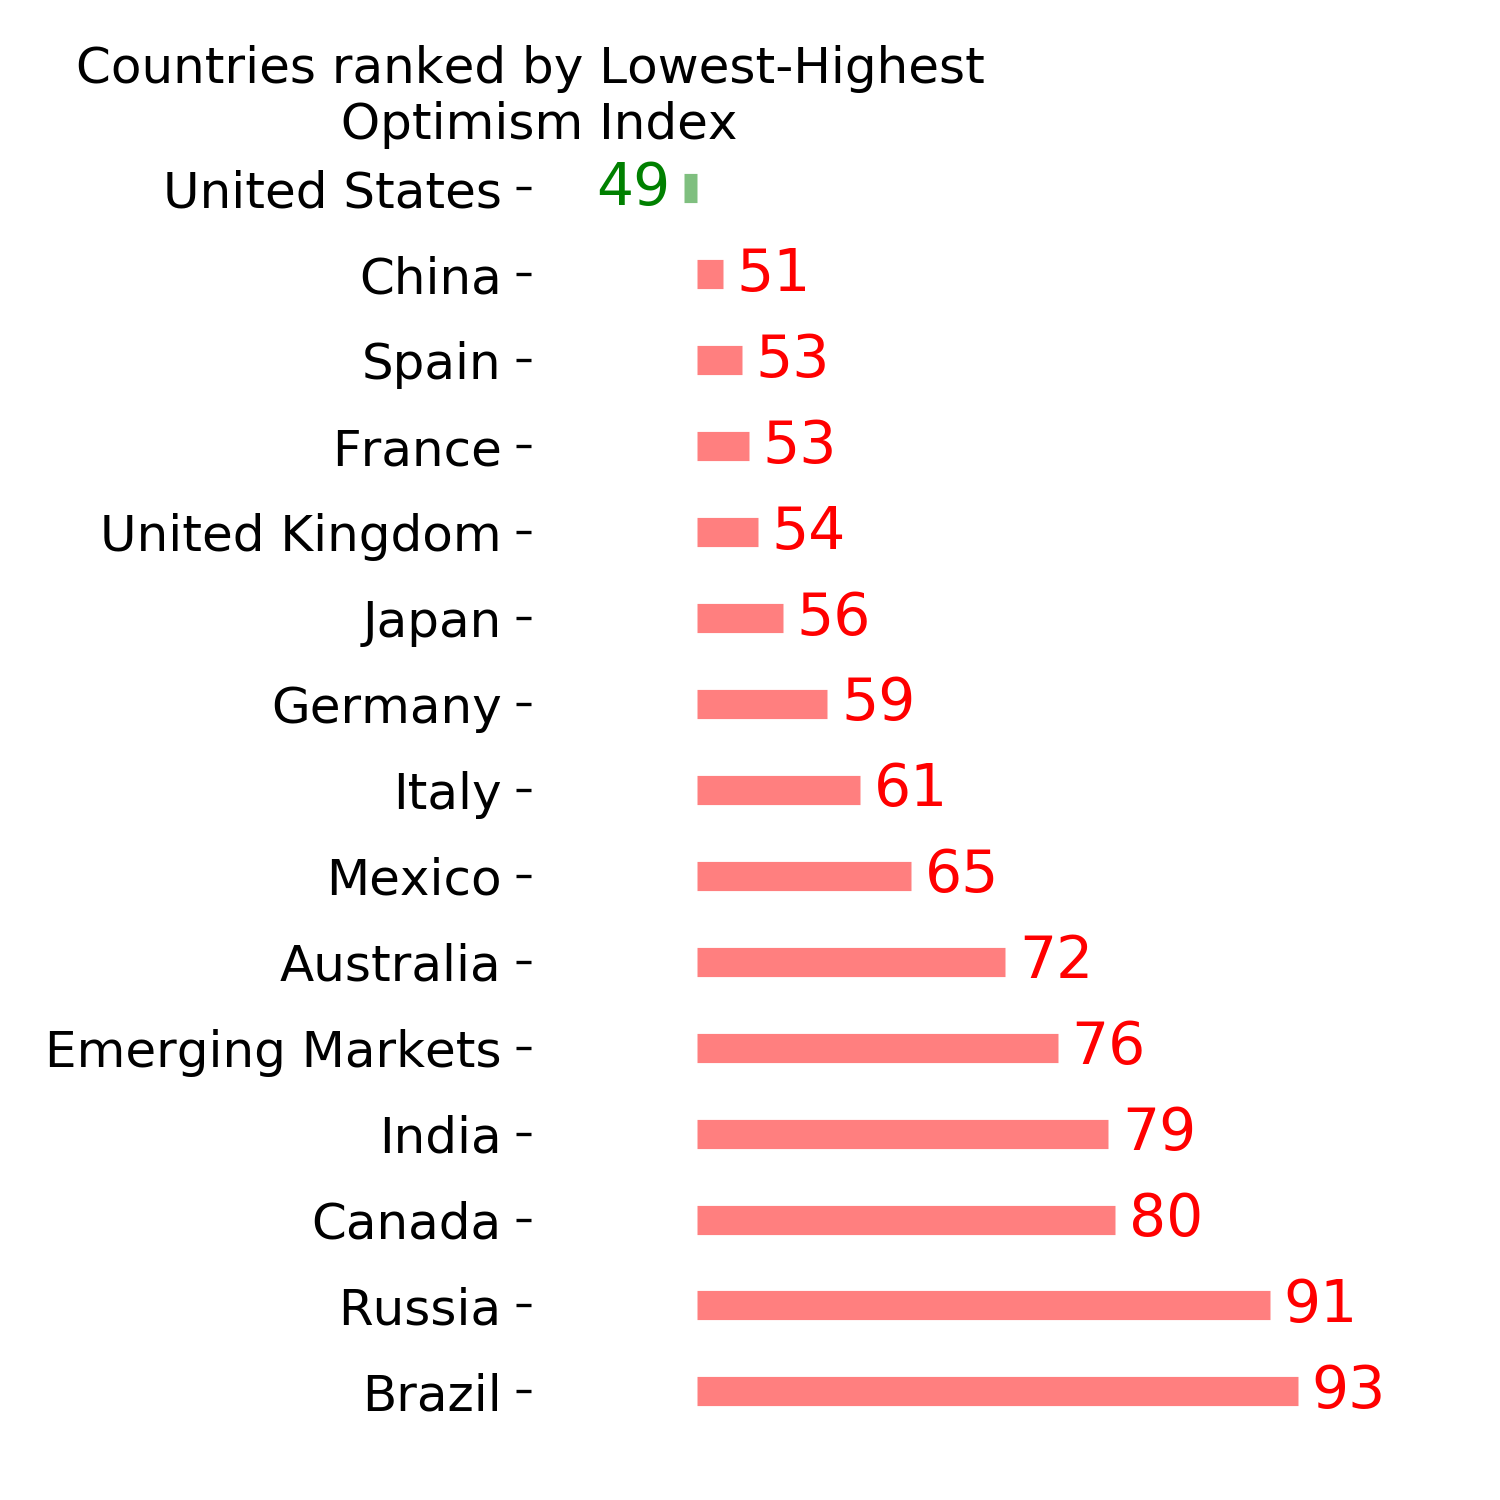
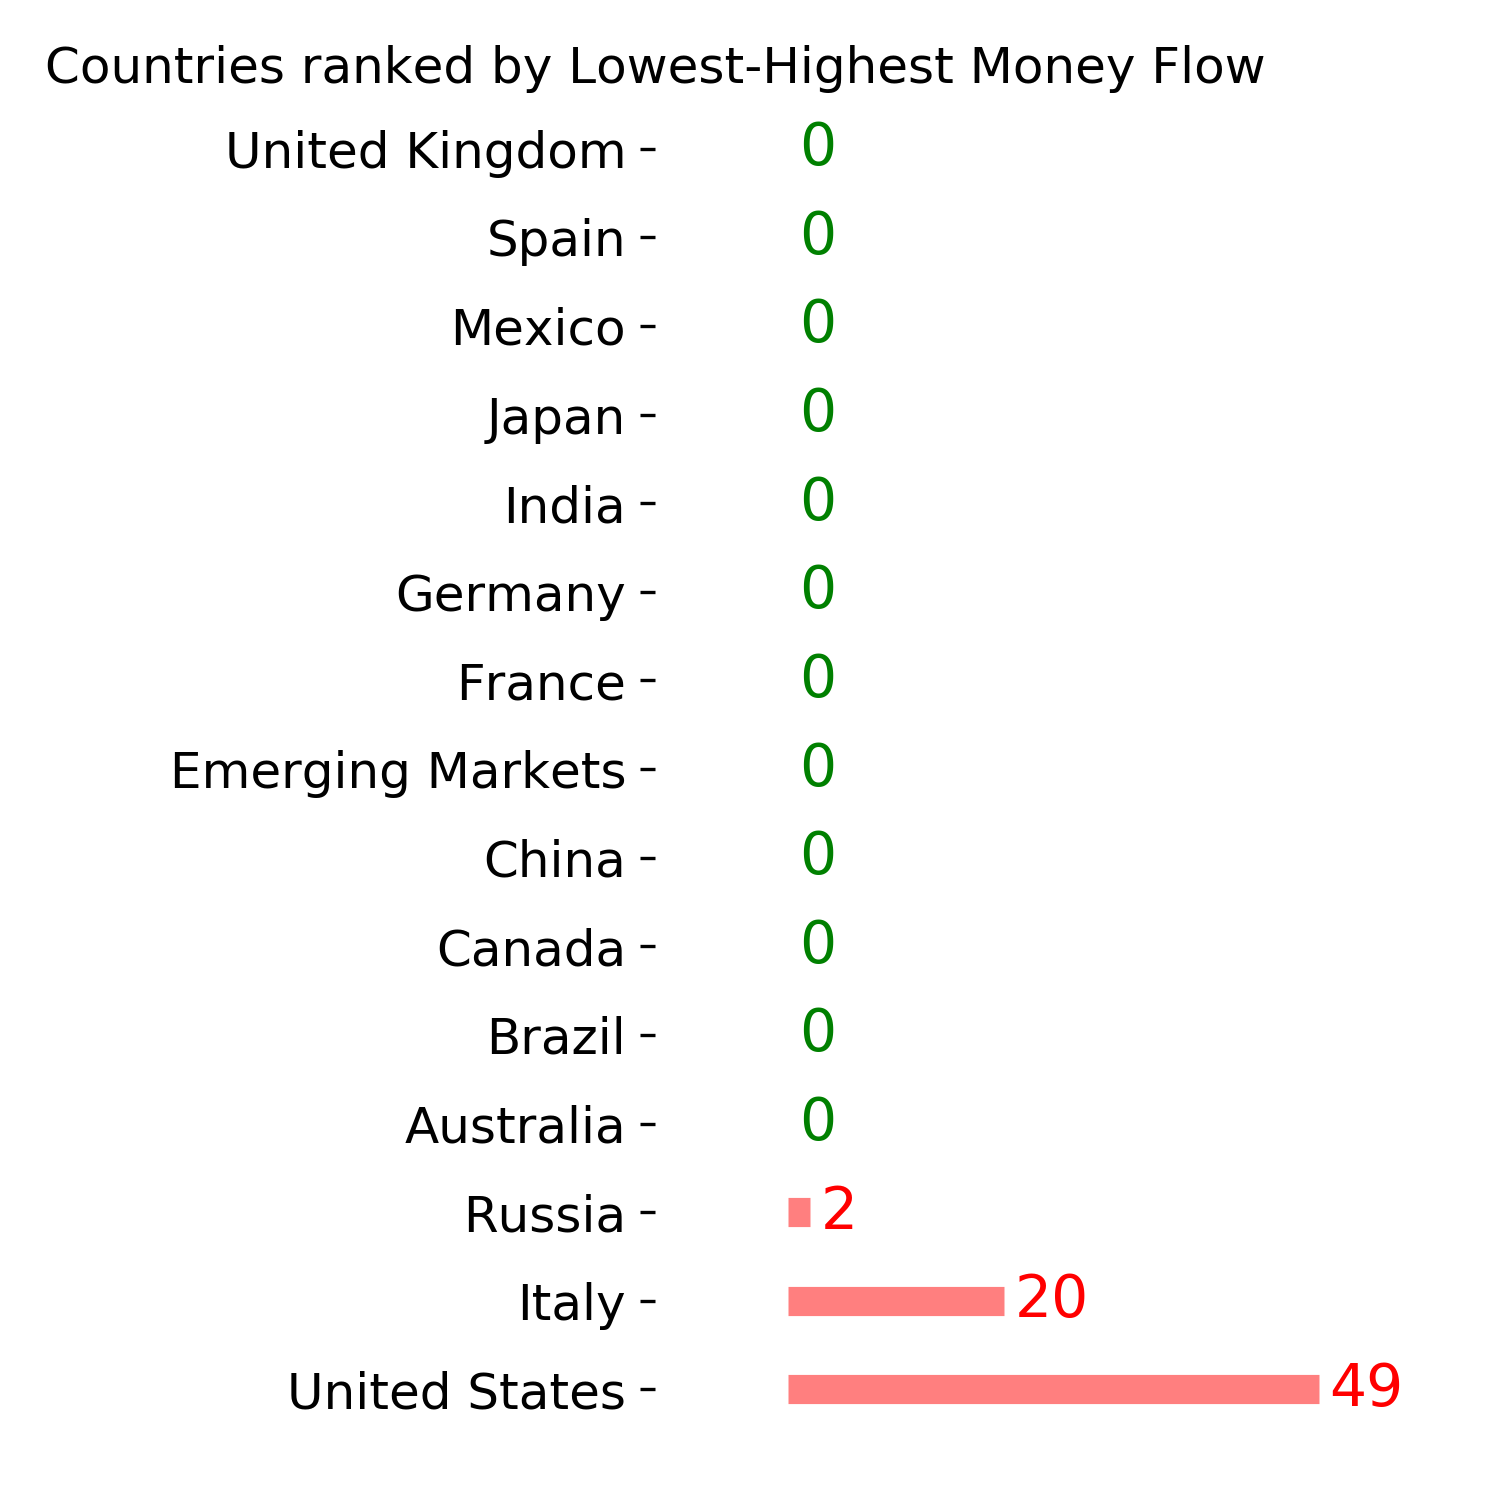
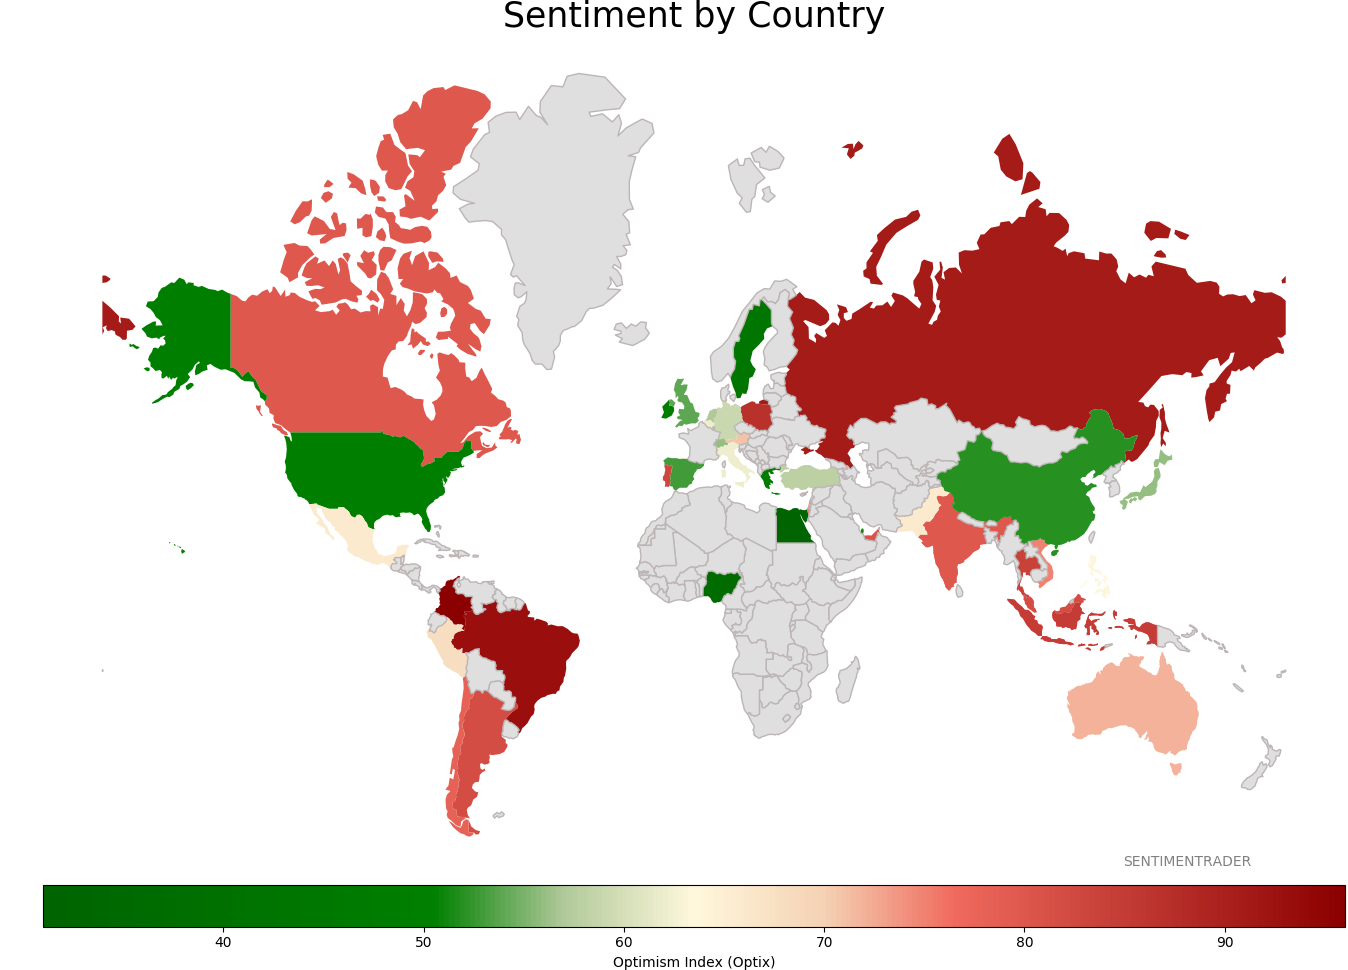
Sentiment Around The World
Optimism Index Thumbnails
|
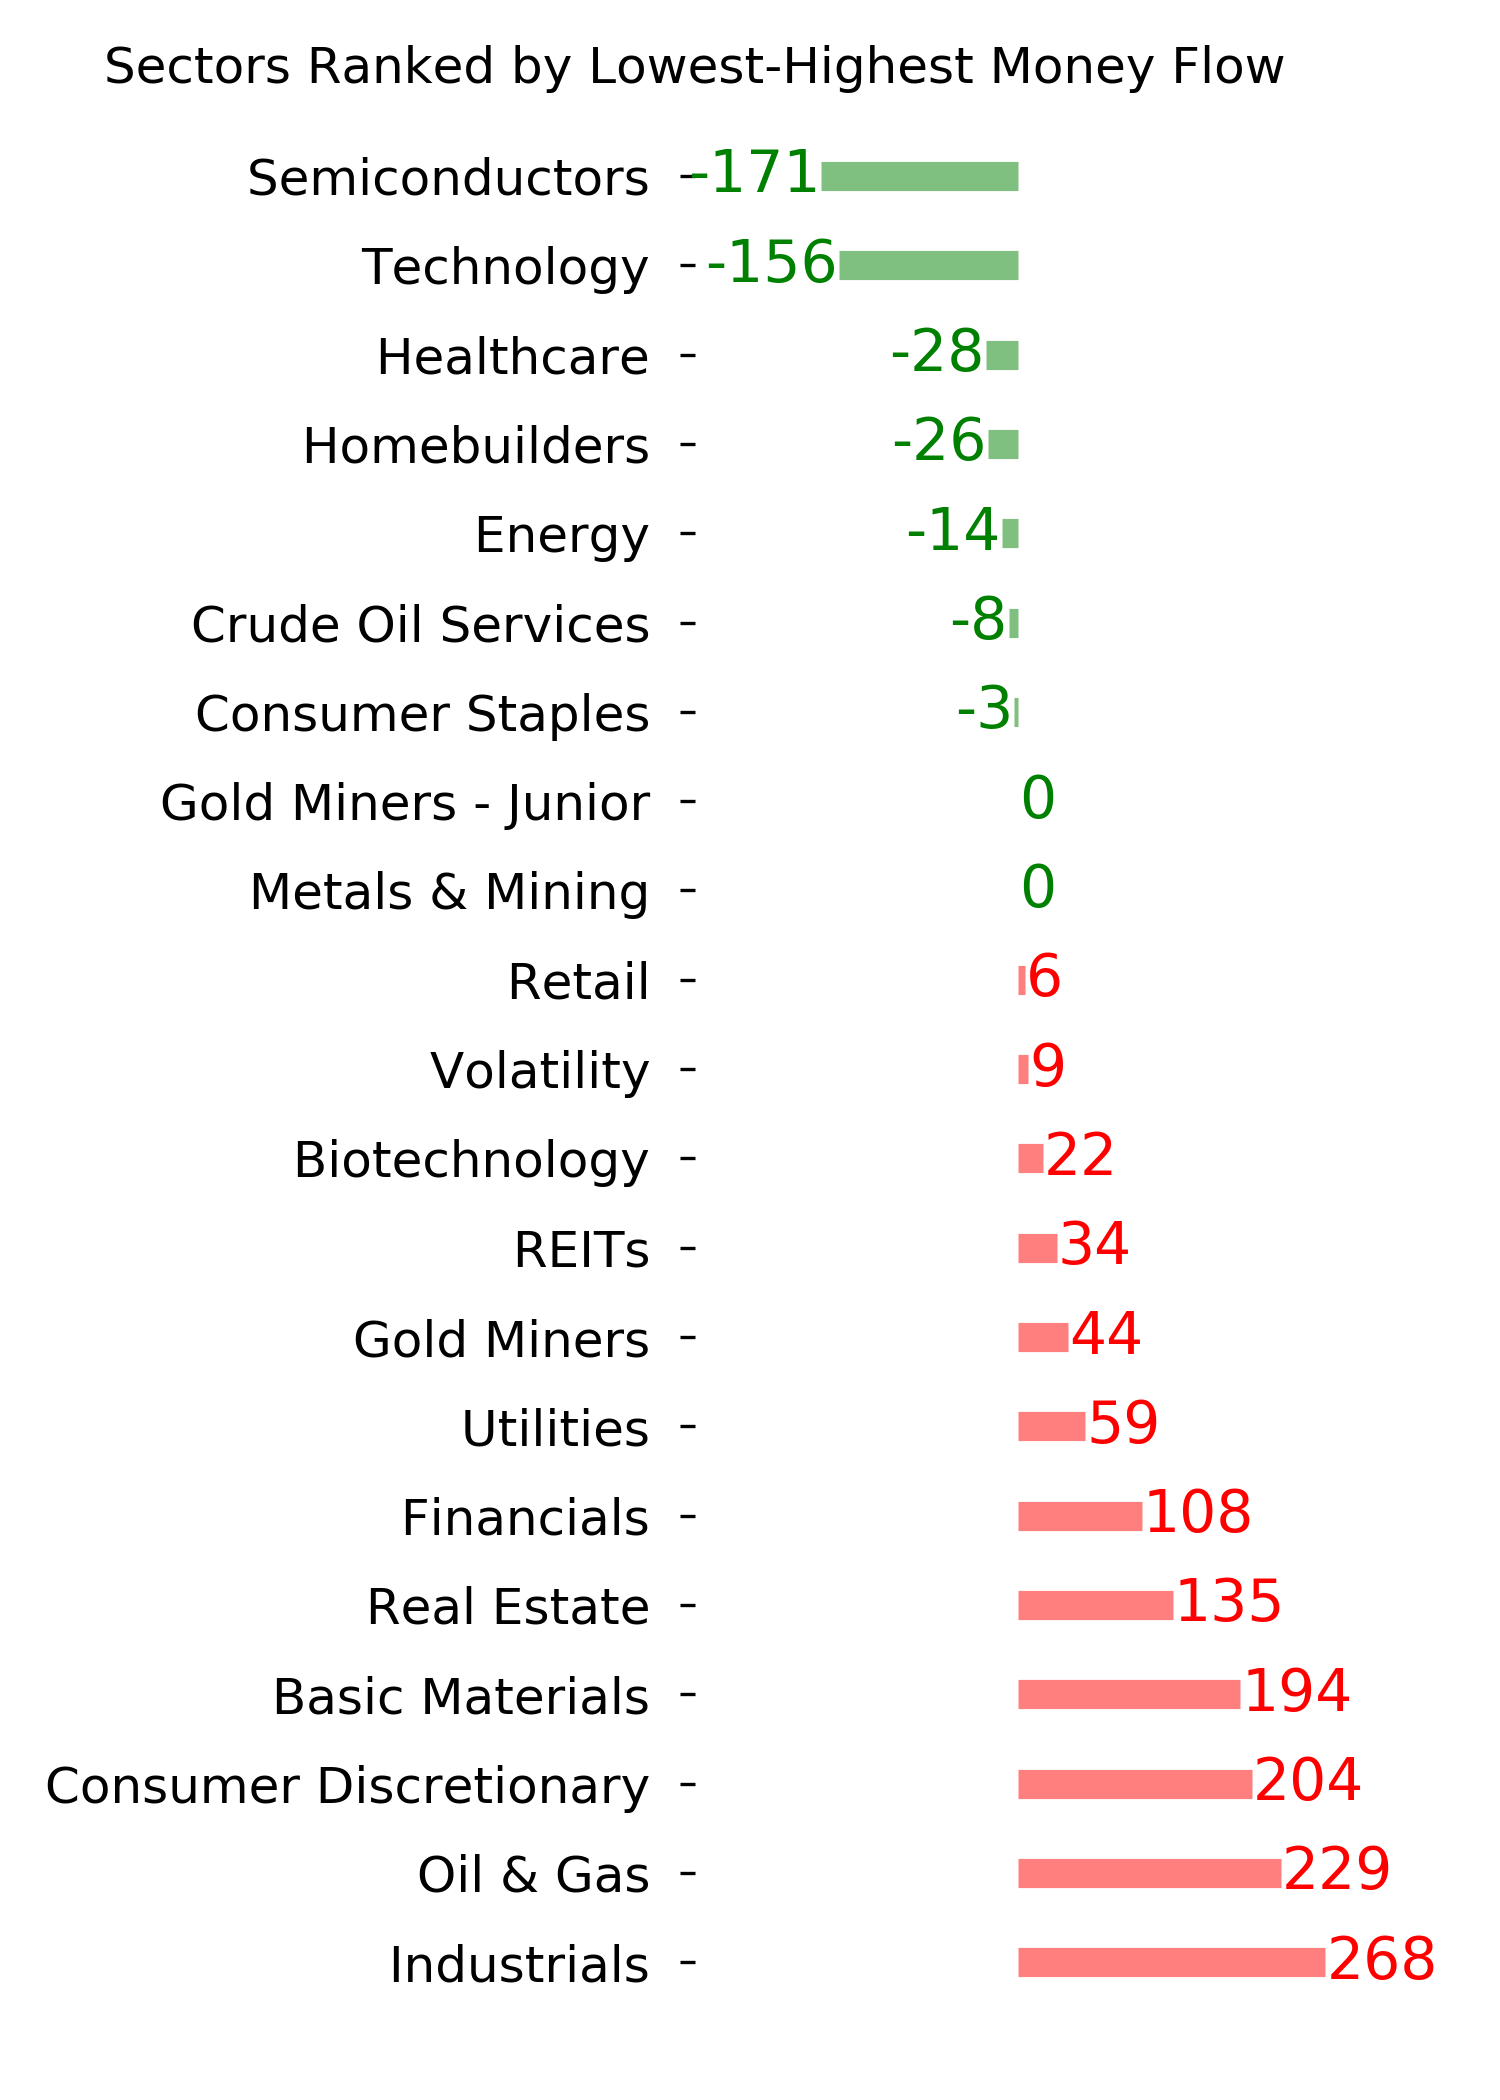
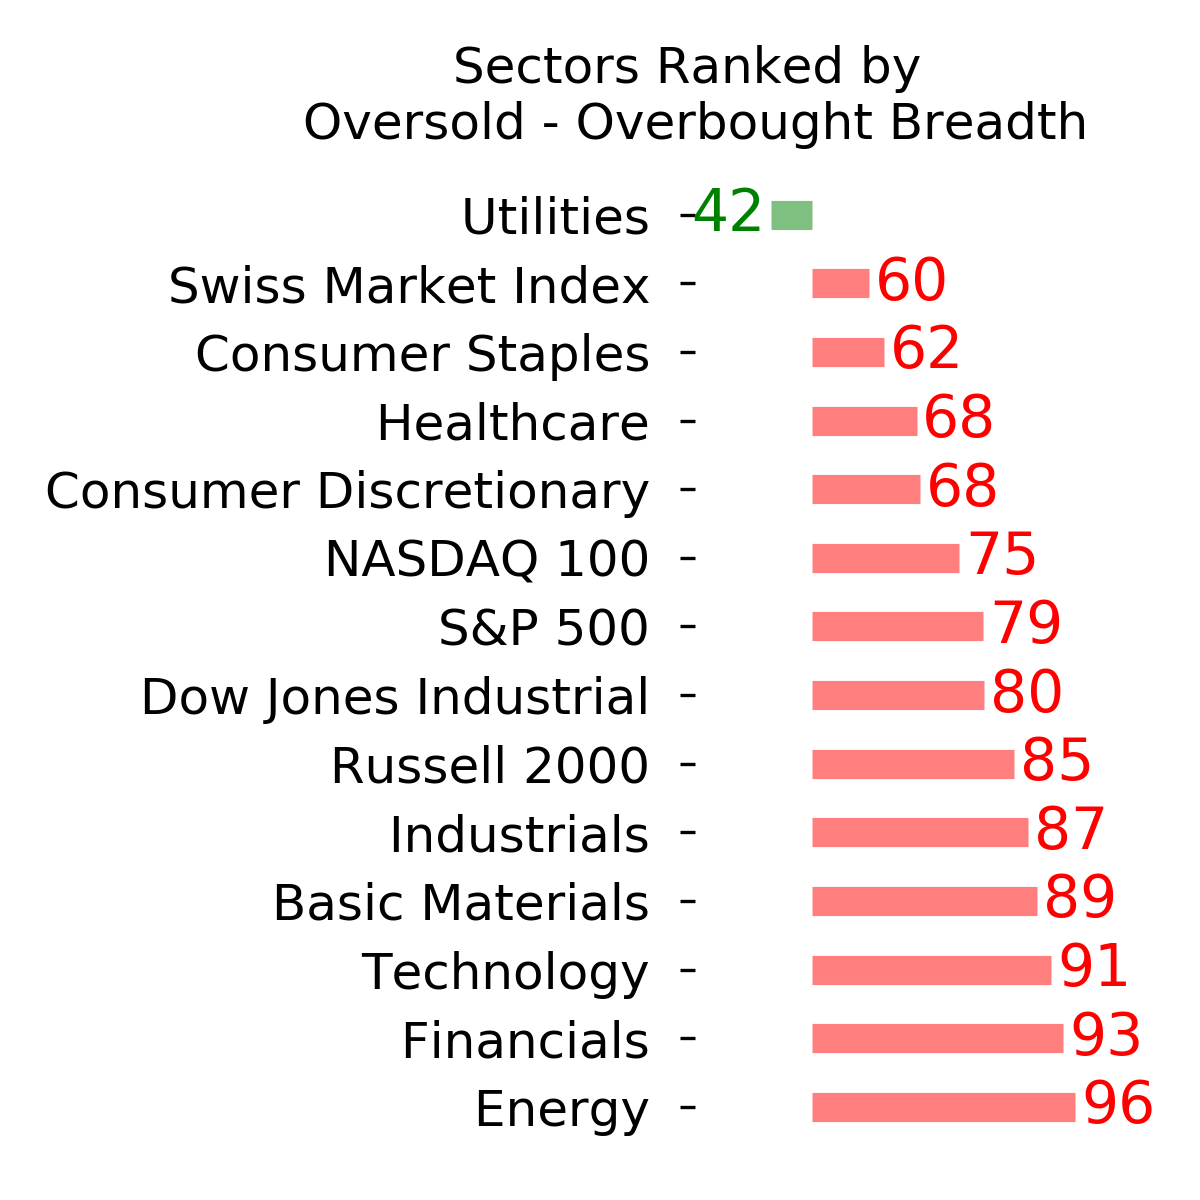
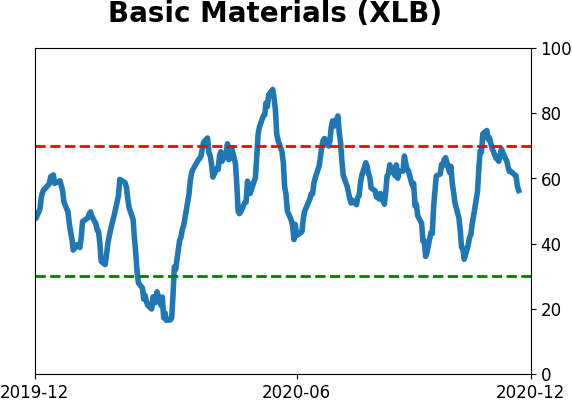
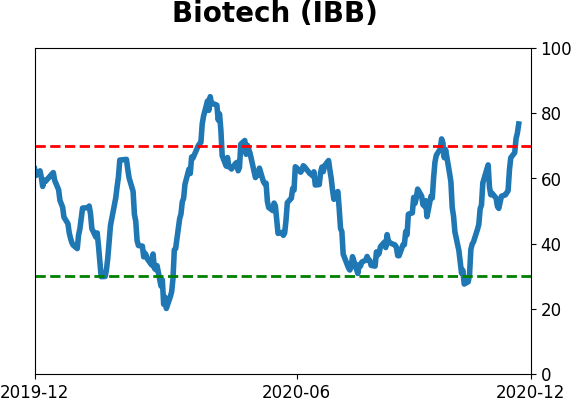
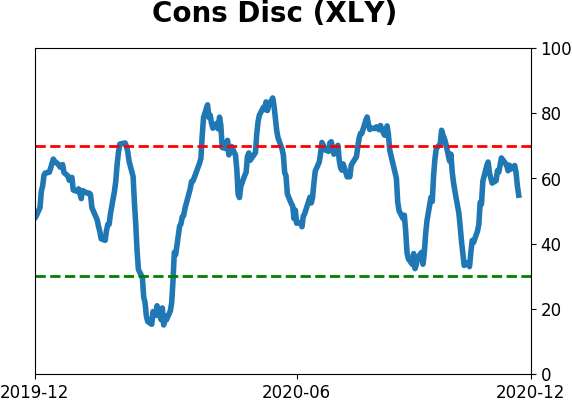
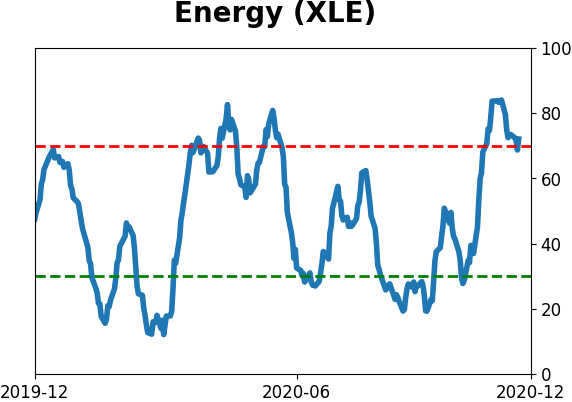
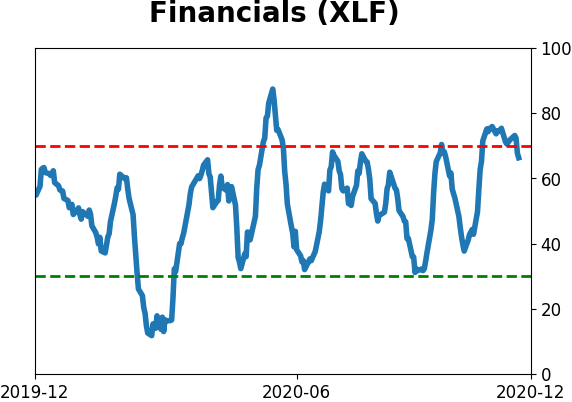
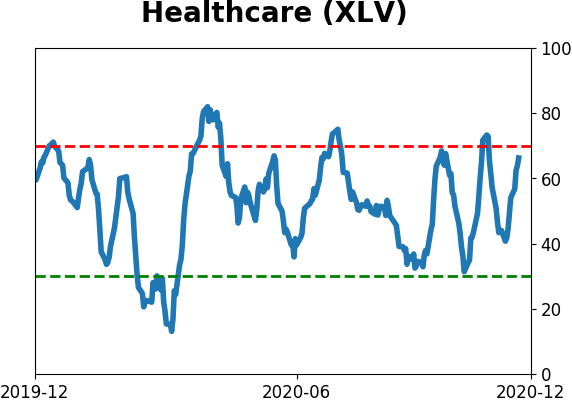
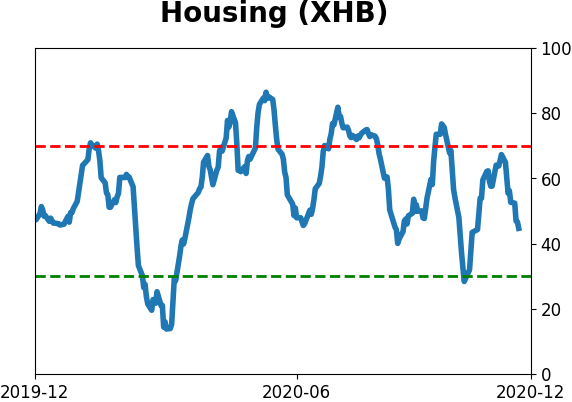
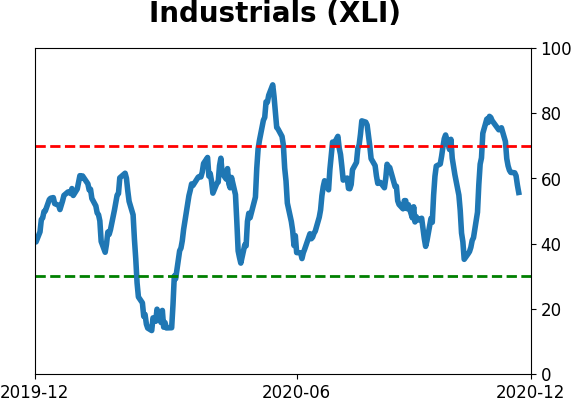
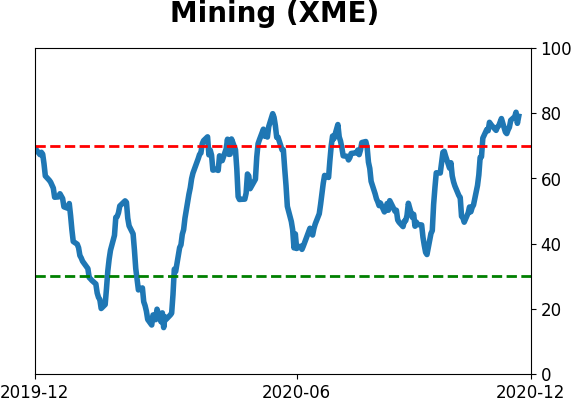
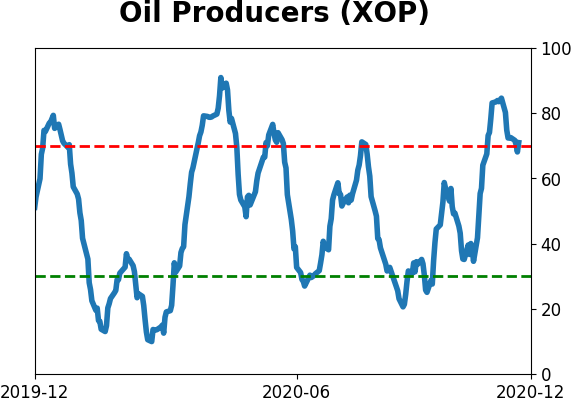
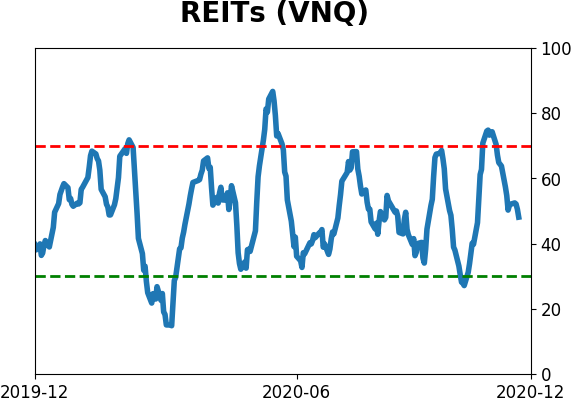
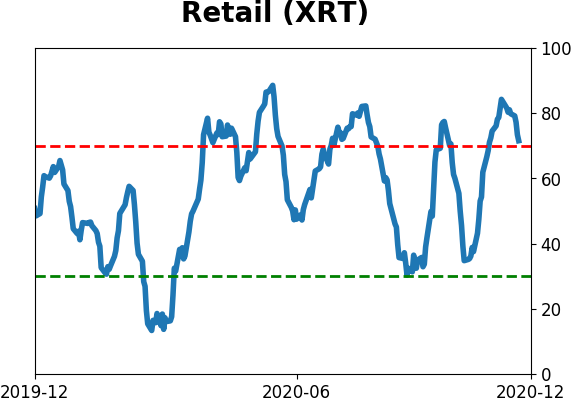
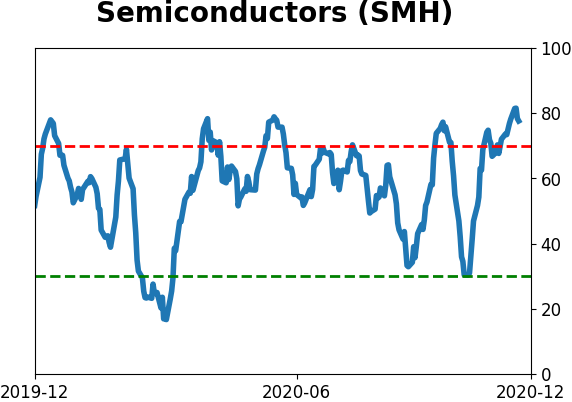
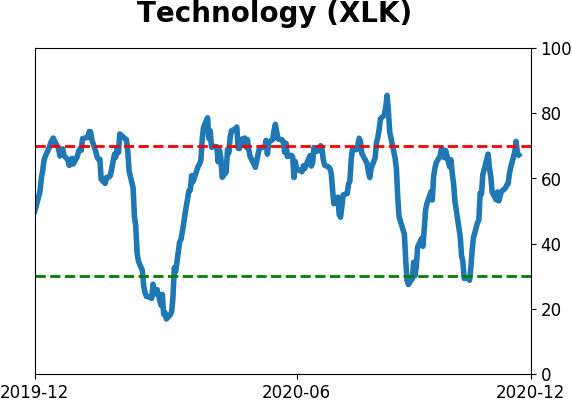
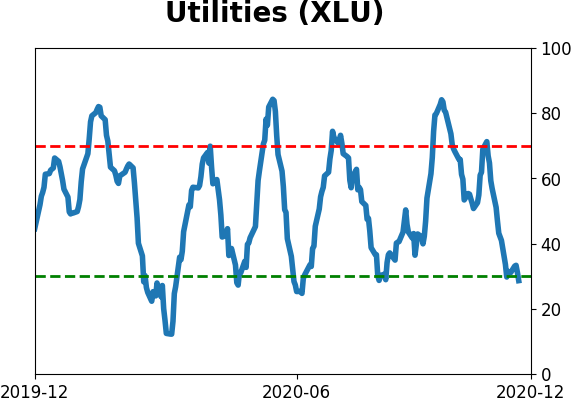
Sector ETF's - 10-Day Moving Average
|
|
|
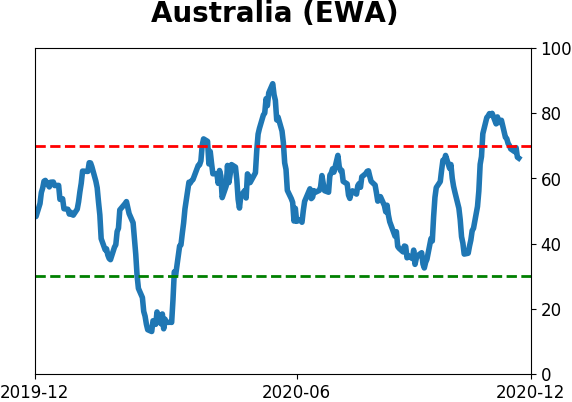
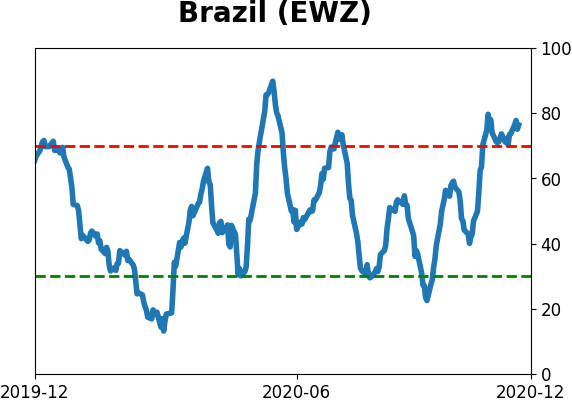
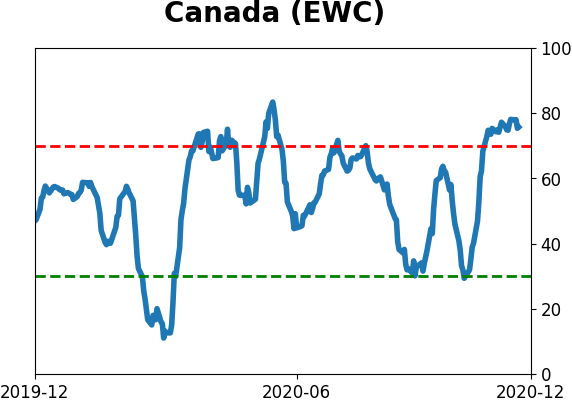
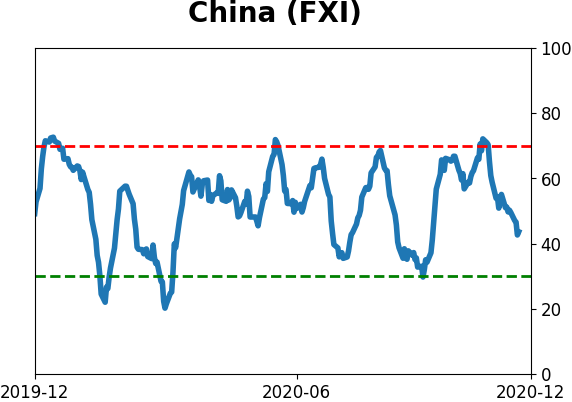
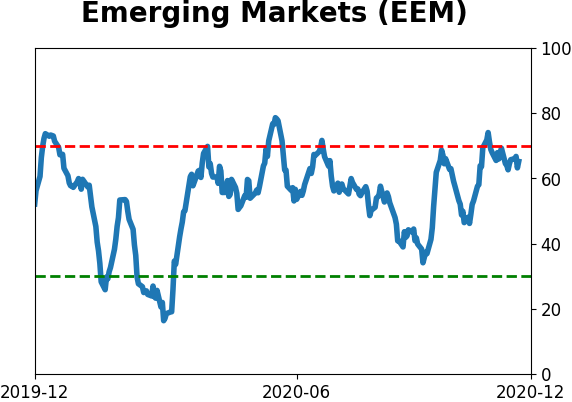
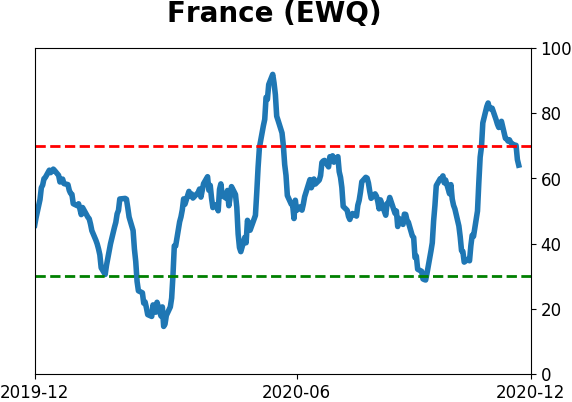
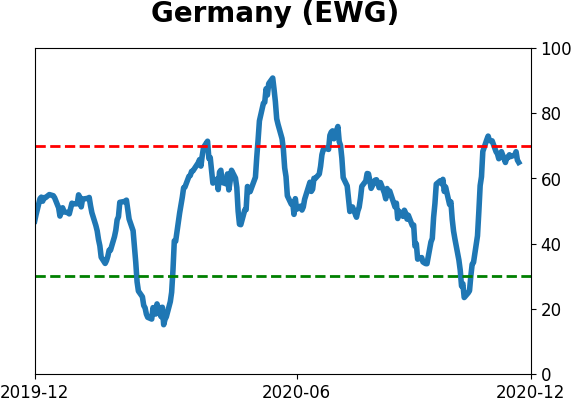
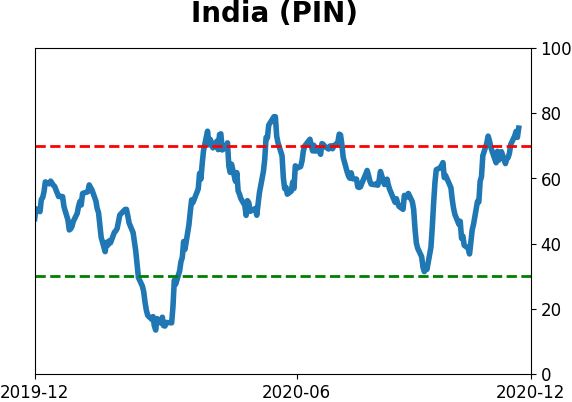
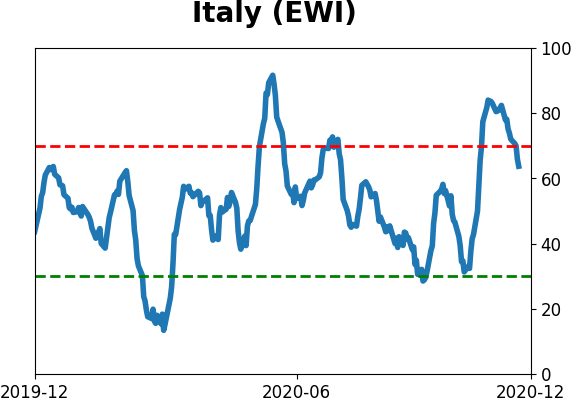
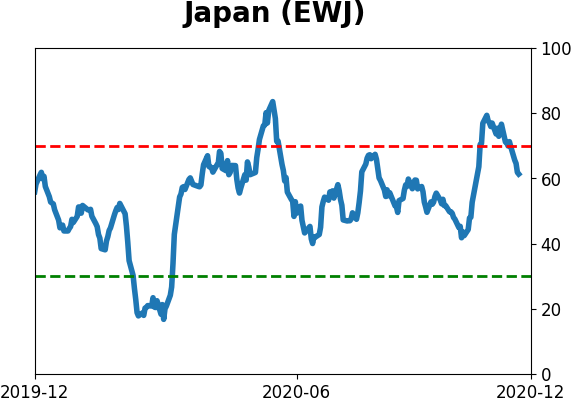
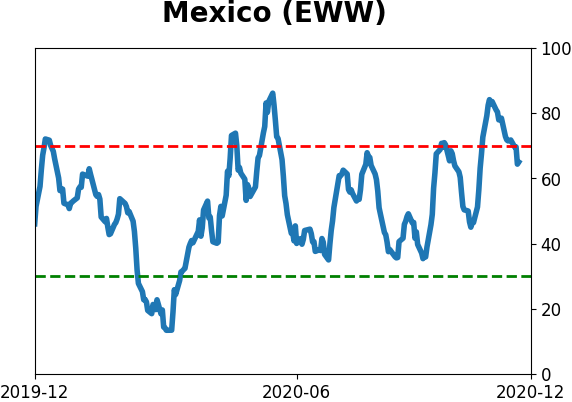
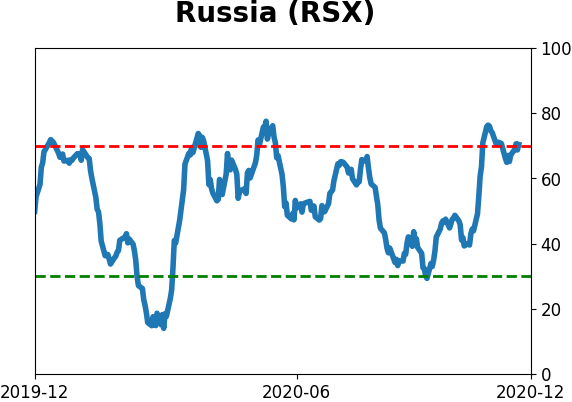
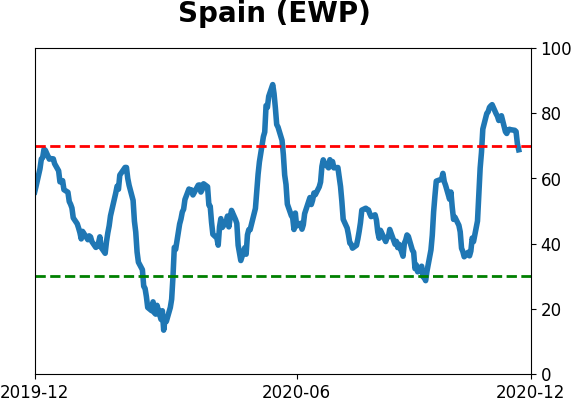
Country ETF's - 10-Day Moving Average
|
|
|
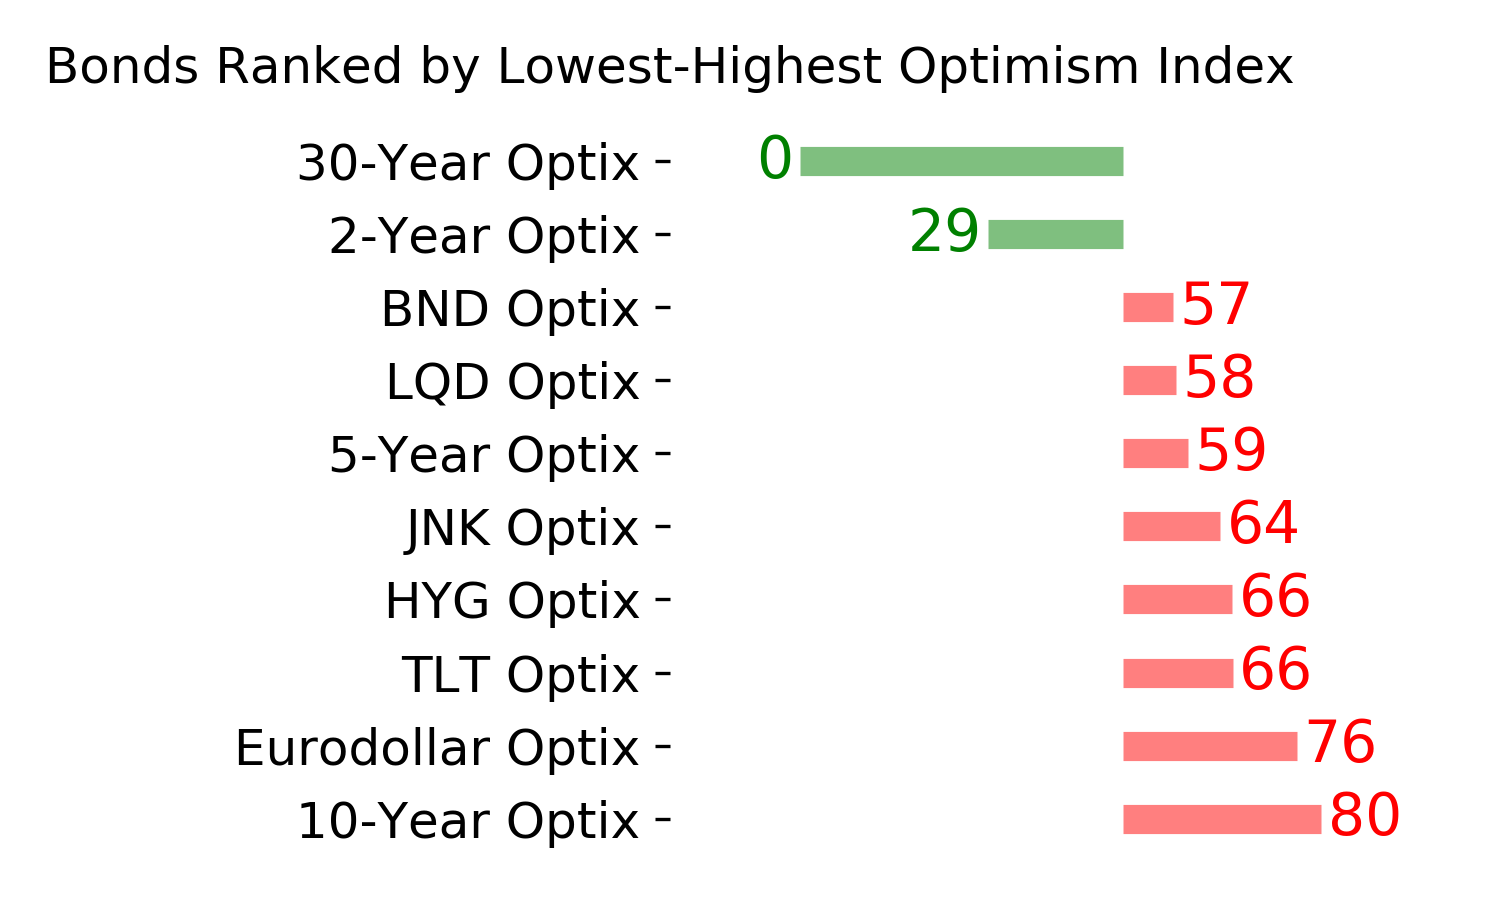
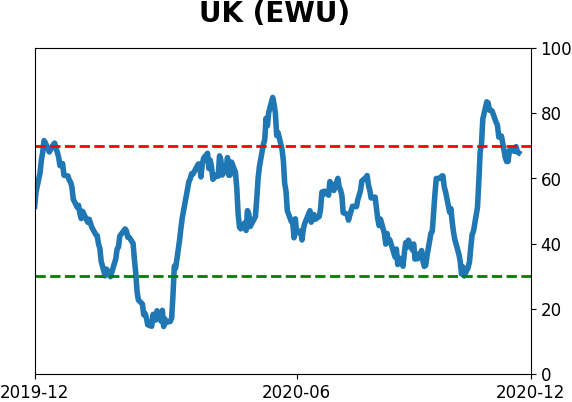
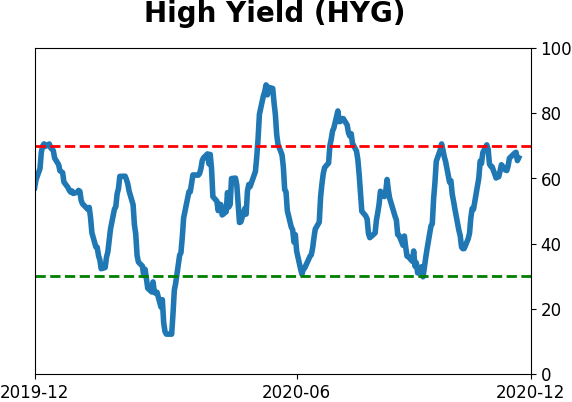
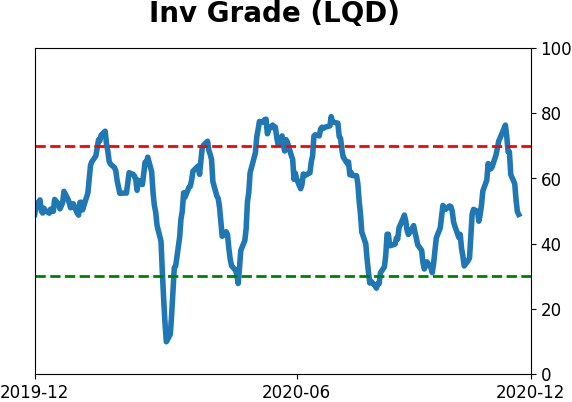
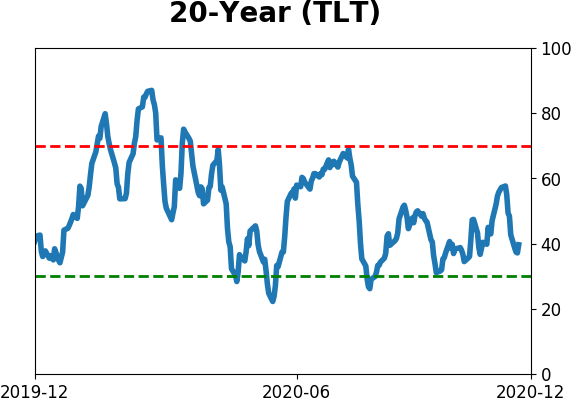
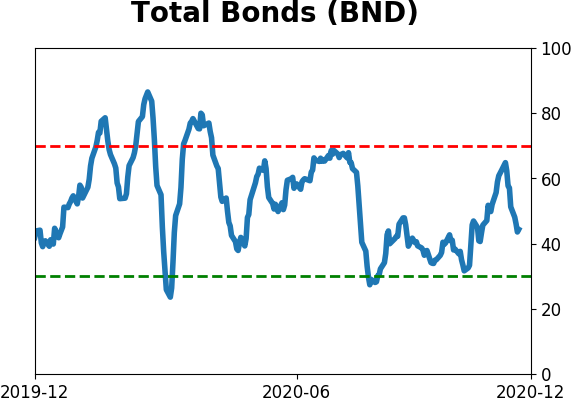
Bond ETF's - 10-Day Moving Average
|
|
|
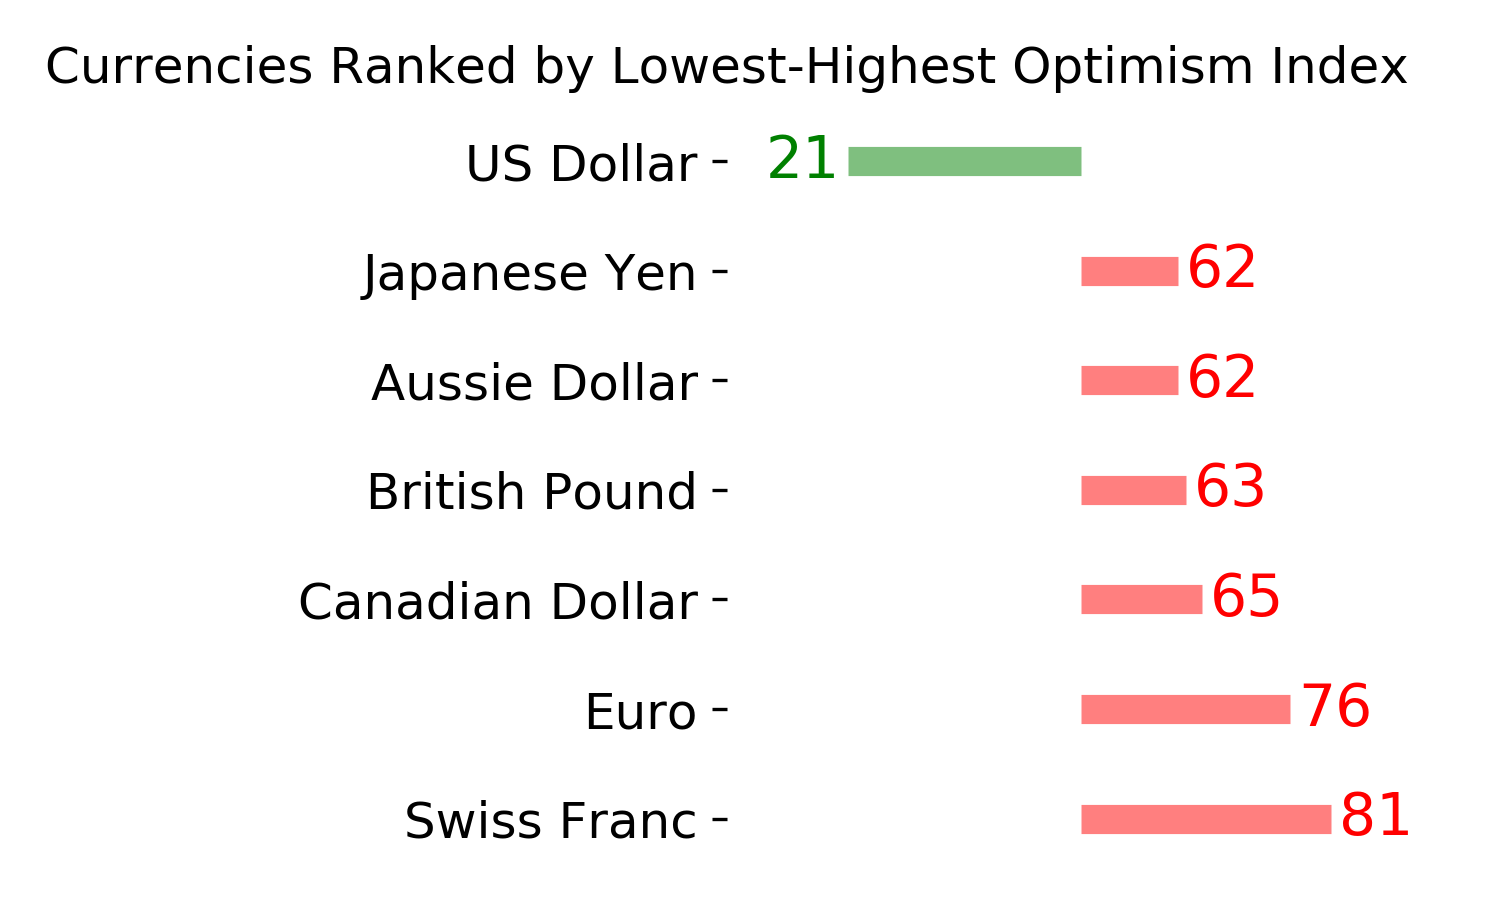
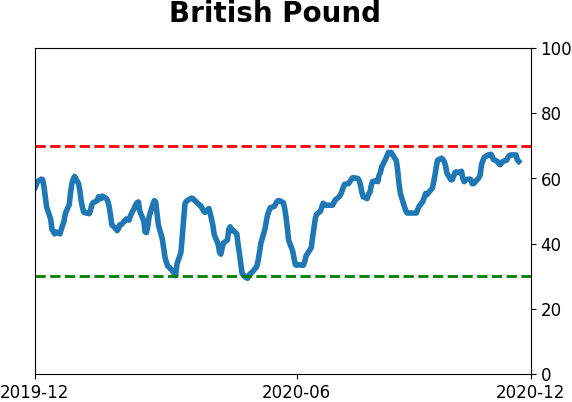
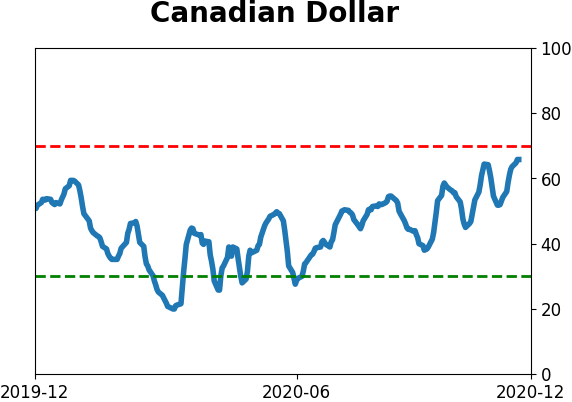
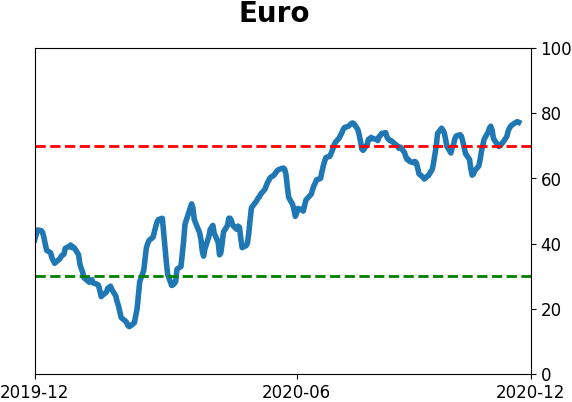
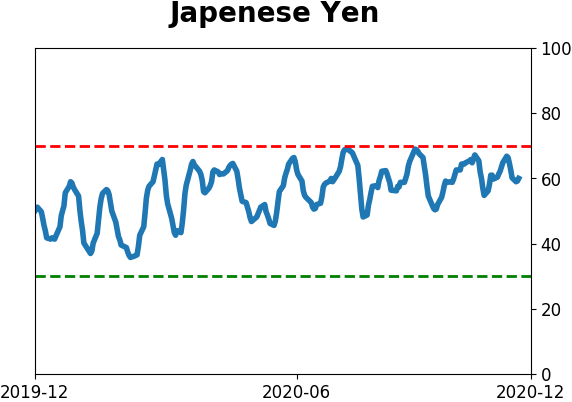
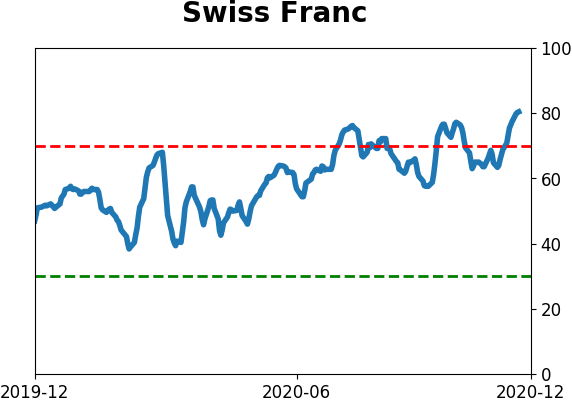
Currency ETF's - 5-Day Moving Average
|
|
|
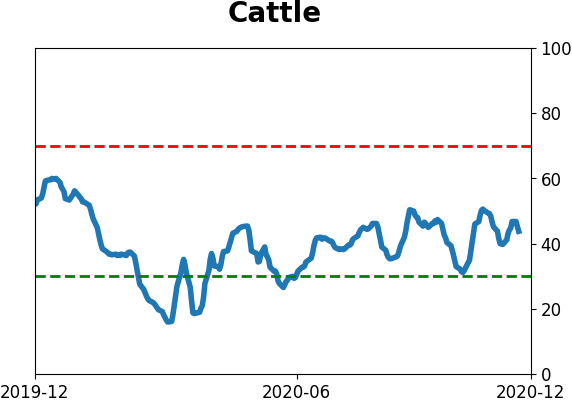
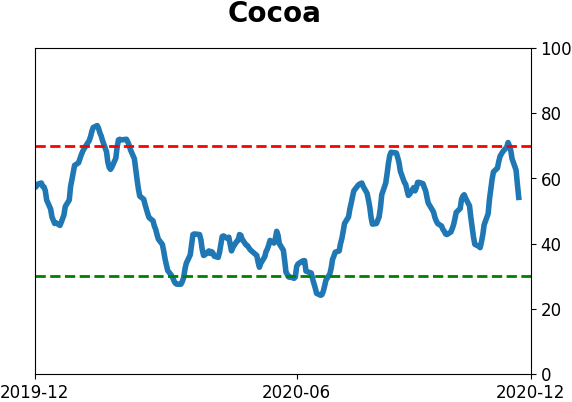
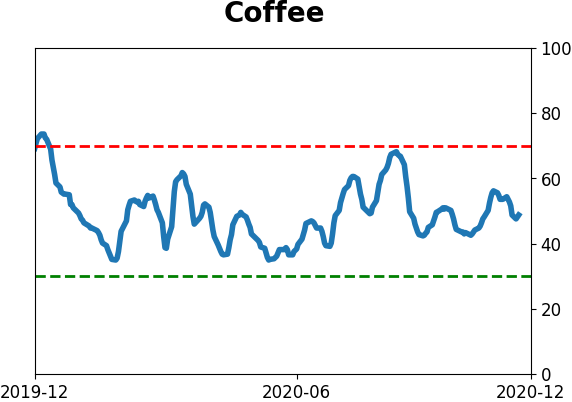
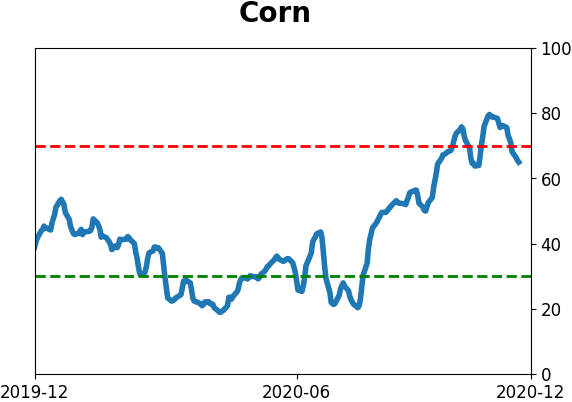
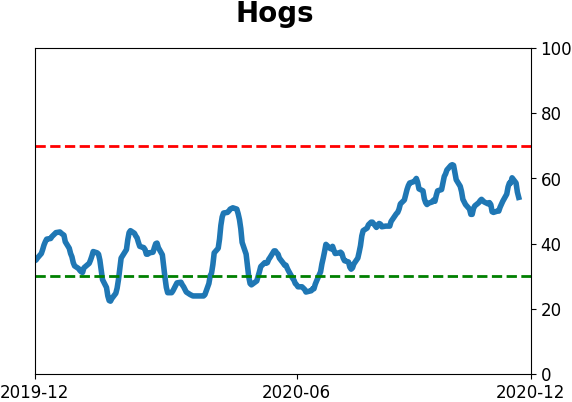
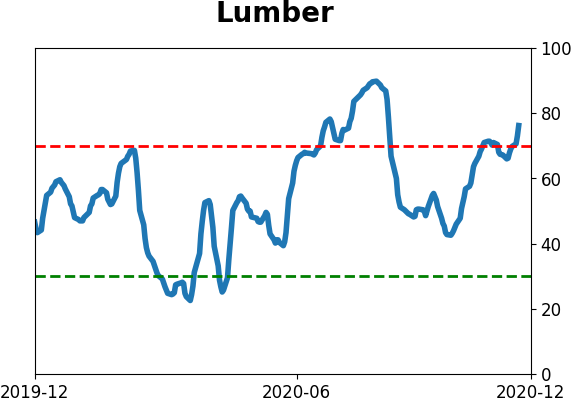
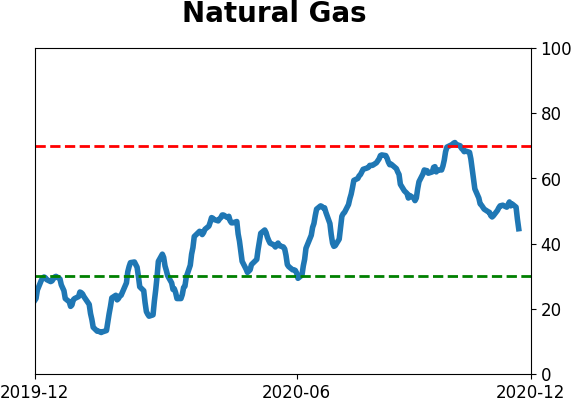
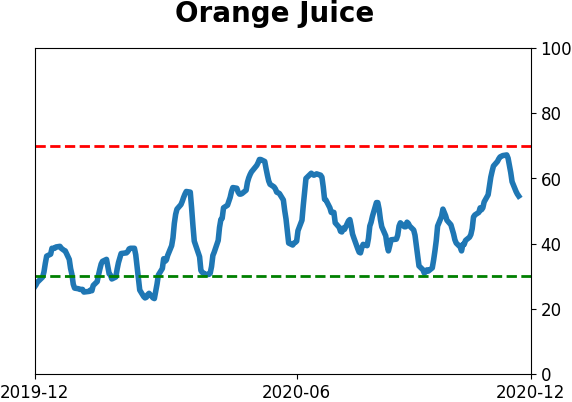
Commodity ETF's - 5-Day Moving Average
|
|

