Headlines
|
|
Interest rates rise, become golden:
Interest rates are rising, and the 50-day average of the yield on 10-year Treasuries has crossed above the 200-day average (a Golden Cross). At the same time, high-yield bond prices have done well, with positive momentum and good participation.
Xenoflow: According to the Investment Company Institute, investors pulled nearly $15 billion from mutual funds that focus on global markets (excluding the U.S.) in the week ending December 2. That's the 2nd-largest weekly outflow in 13 years, exceeded (barely) by a $15.1 billion outflow in the week ending December 19, 2018, soon after which those markets rebounded strongly. There is a seasonal bias to fund flows, and December often sees large outflows, but still, this seems excessive given recent good performance.
Big tech's big day: It's not like it's common to see a large selloff the day after traders were popping corks to celebrate another all-time high, but it's not all that uncommon, either. Below, we can see every instance when the Nasdaq 100 closed at an all-time high one day, then suffered a 2% or larger loss the next. It tended to precede some more weakness in the very short-term, but not much after that.
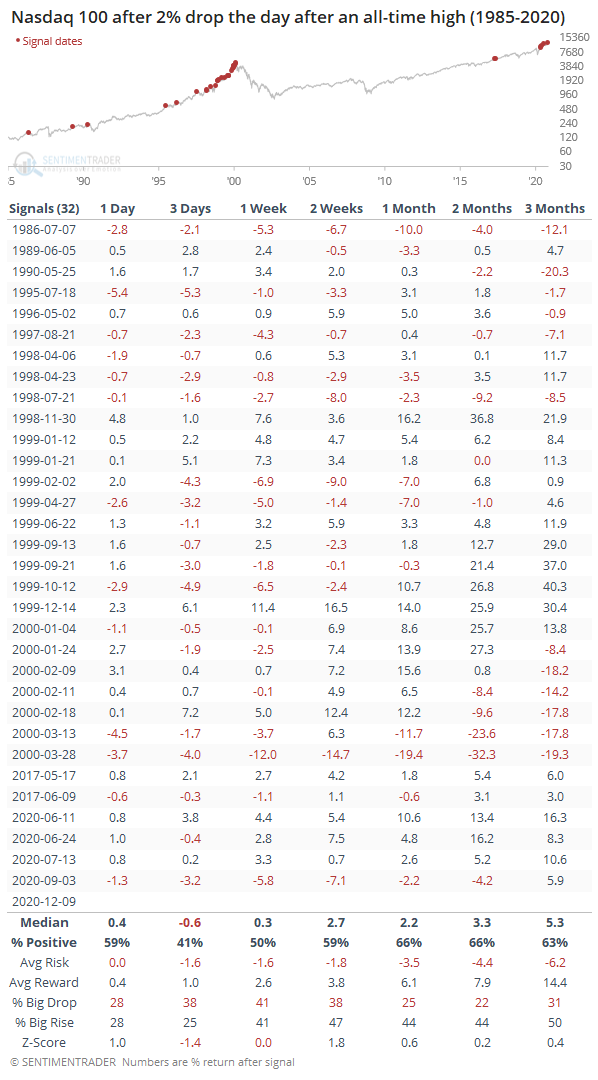
Bottom Line:
- The market environment is pristine, but with near-historic optimism, gains tend to be muted, with a high probability of being reversed at some point over the ensuing weeks.
|
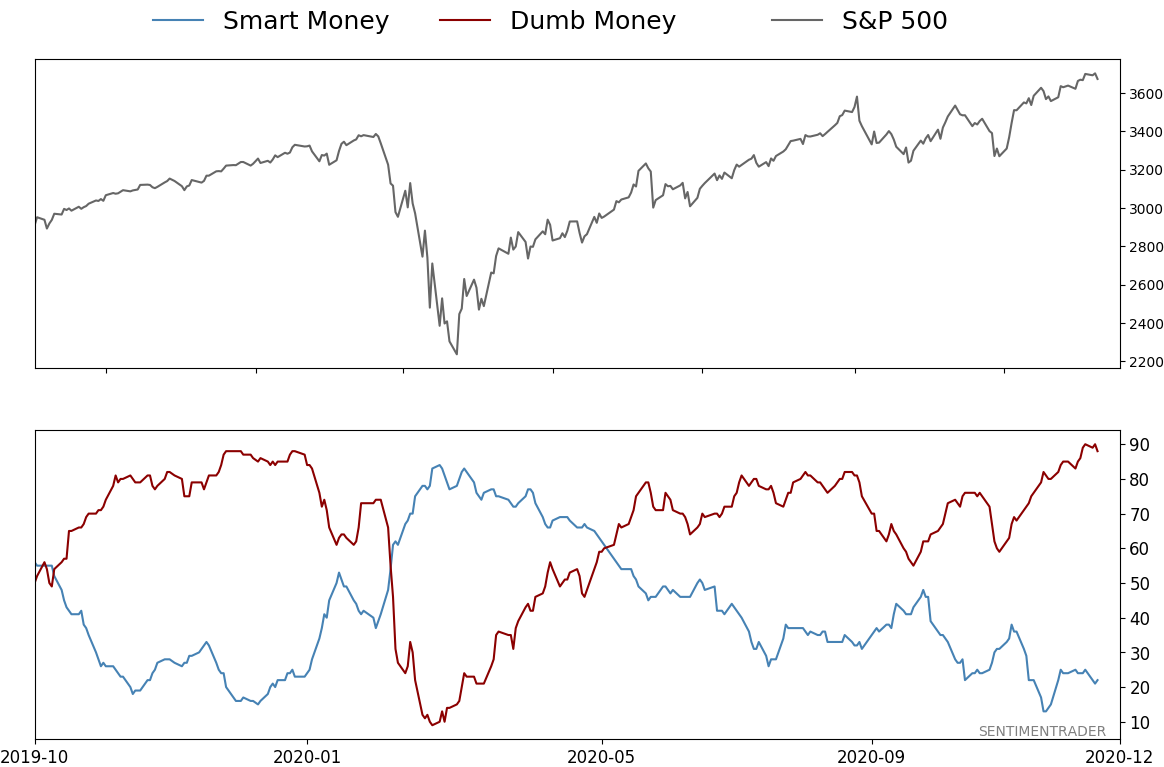
Smart / Dumb Money Confidence
|
Smart Money Confidence: 22%
Dumb Money Confidence: 88%
|
|
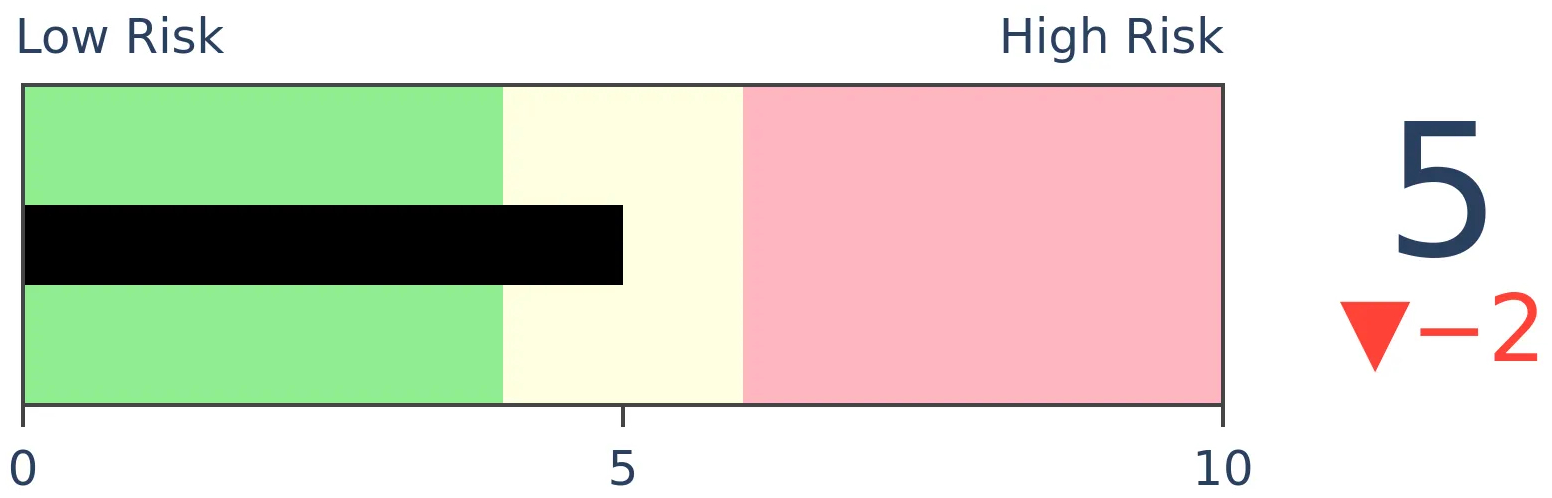
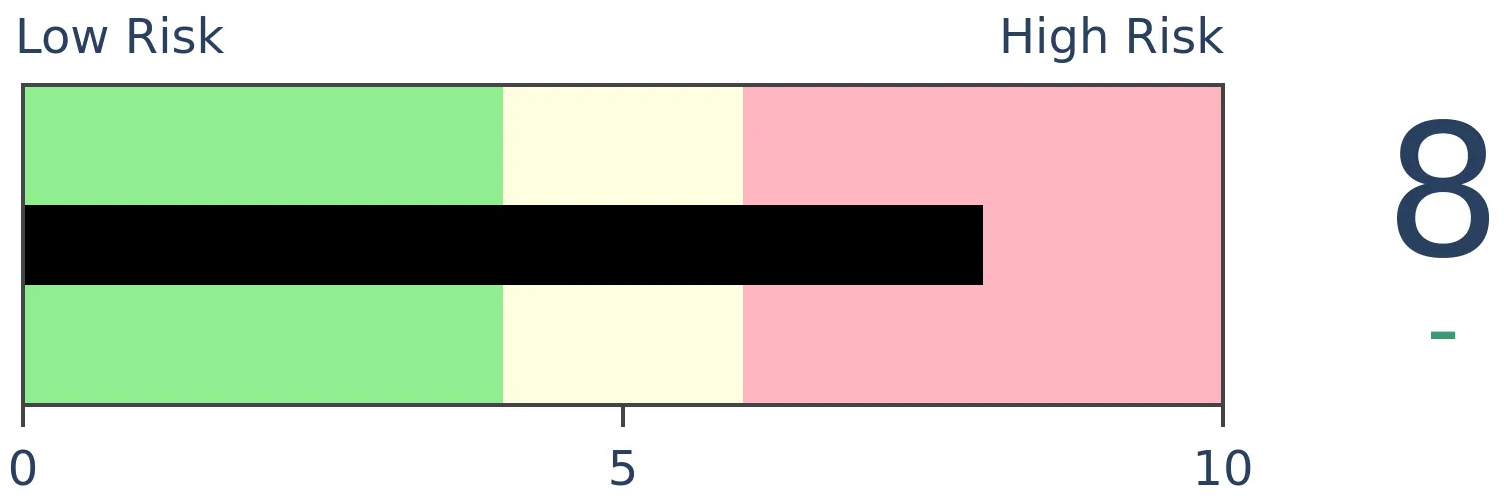
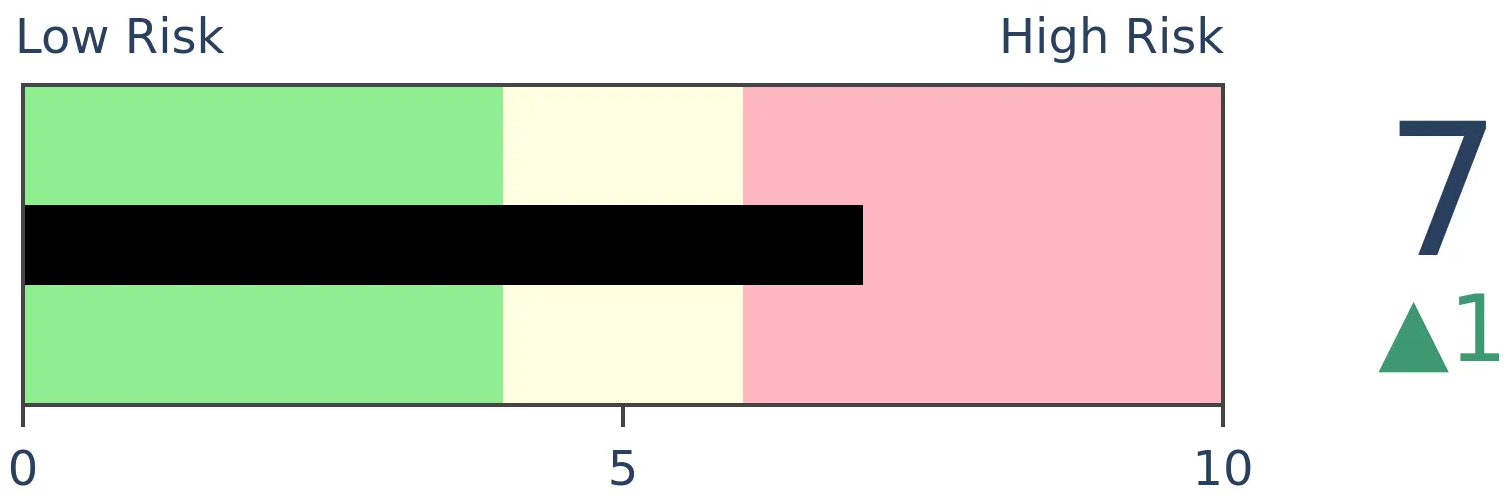
Risk Levels
Stocks Short-Term
|
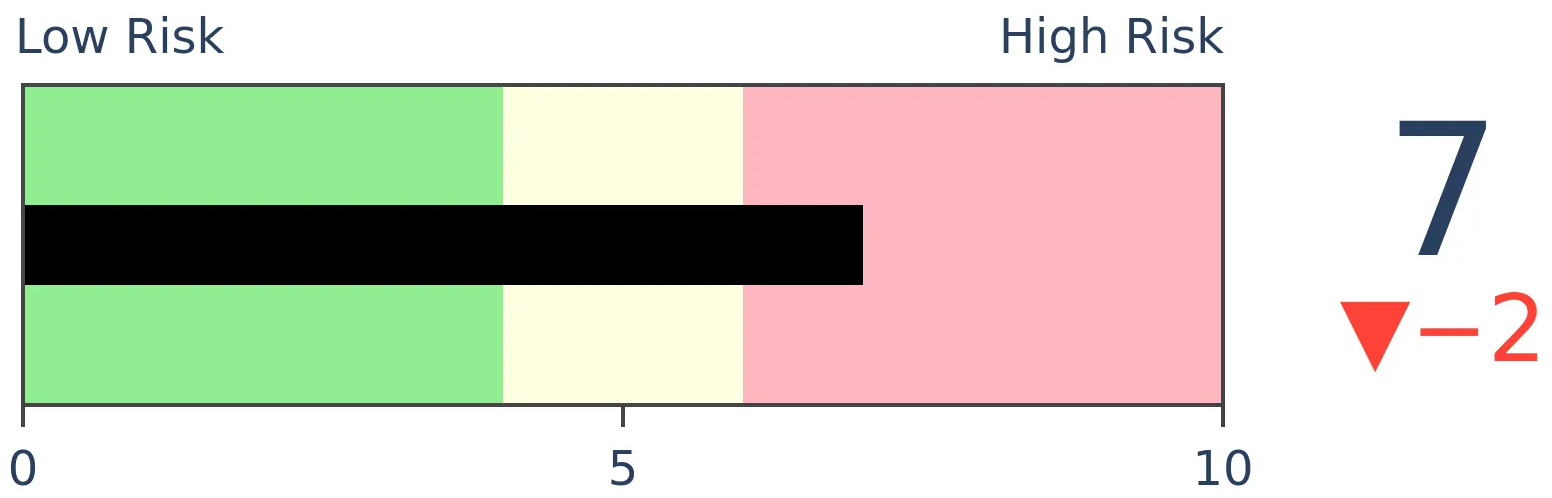
Stocks Medium-Term
|
|
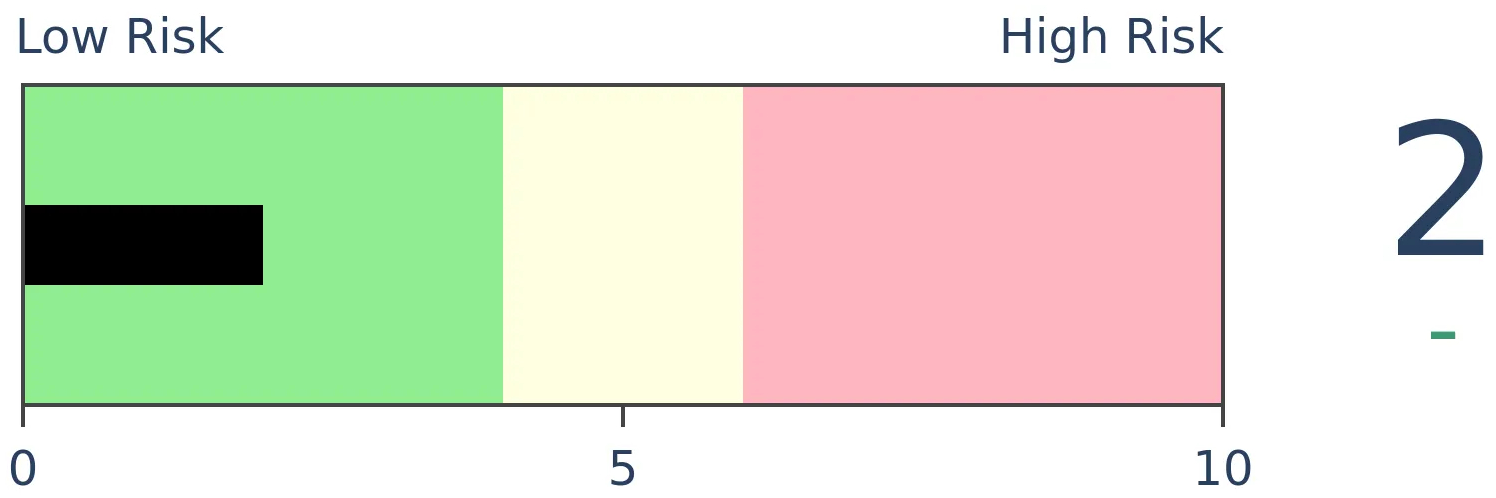
Bonds
|
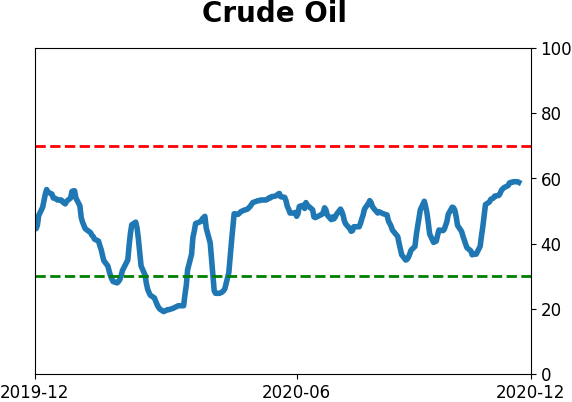
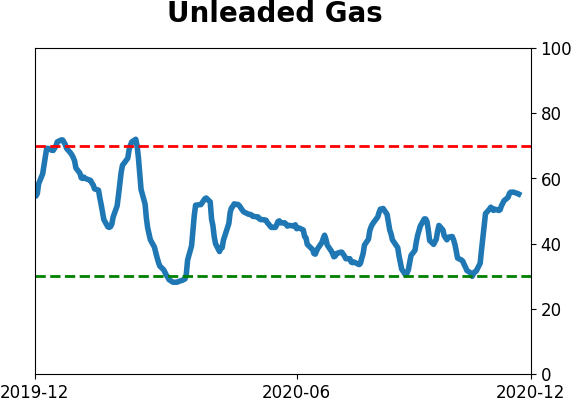
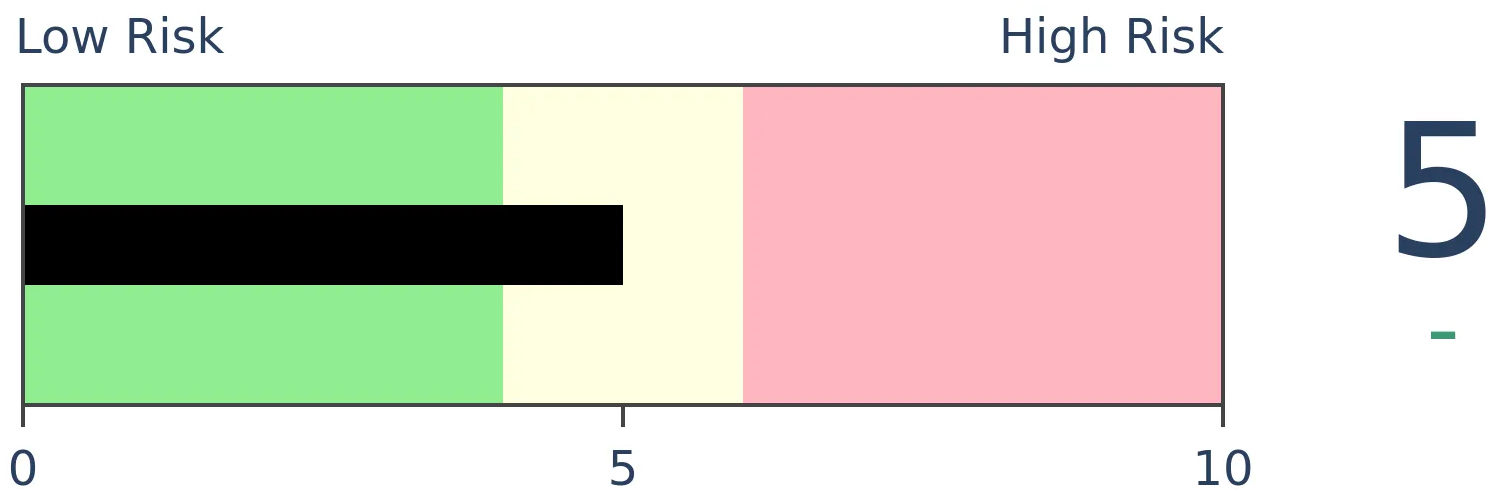
Crude Oil
|
|
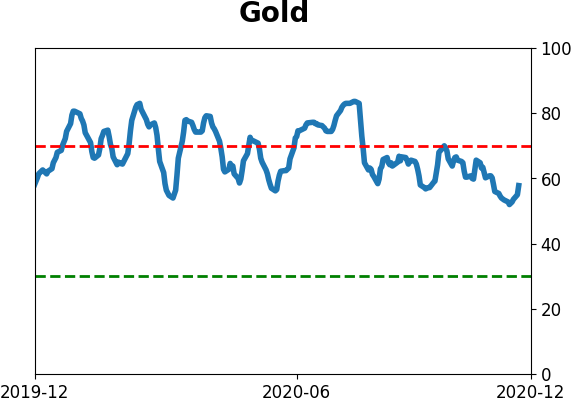
Gold
|
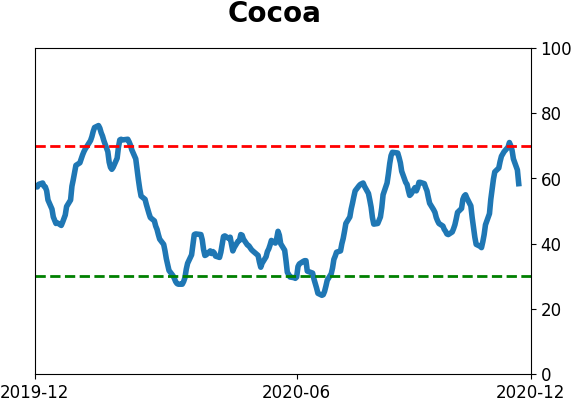
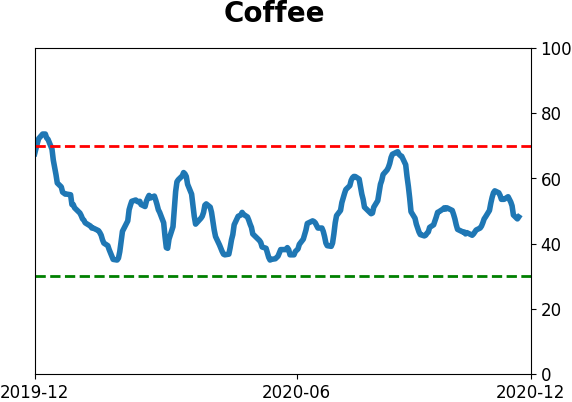
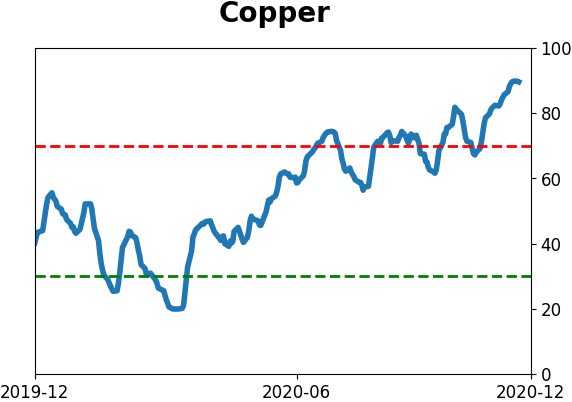
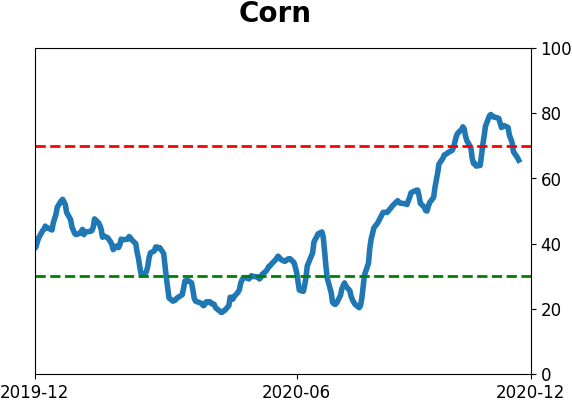
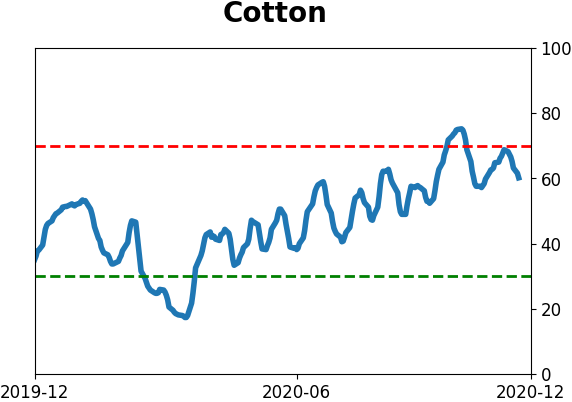
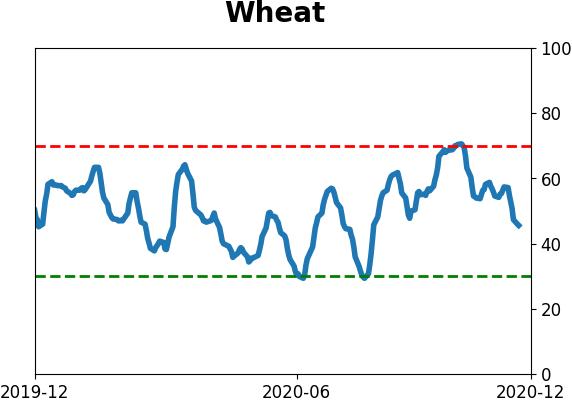
Agriculture
|
|
Research
BOTTOM LINE
Interest rates are rising, and the 50-day average of the yield on 10-year Treasuries has crossed above the 200-day average (a Golden Cross). At the same time, high-yield bond prices have done well, with positive momentum and good participation.
FORECAST / TIMEFRAME
None
|
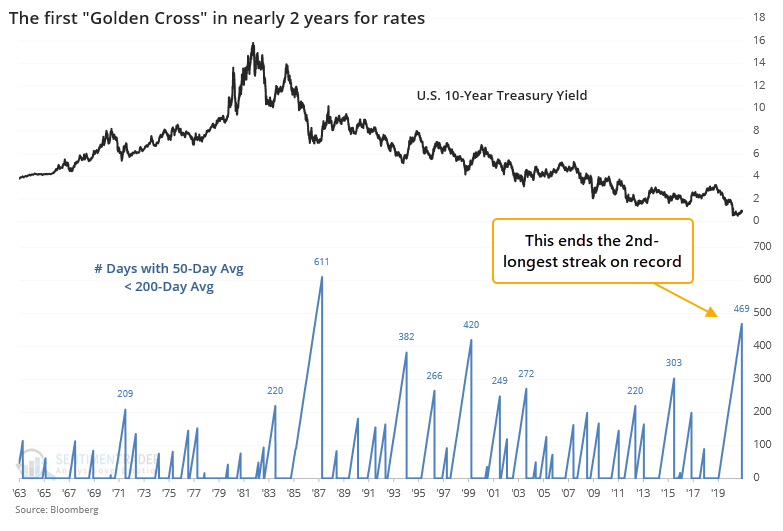
Investors have been fearing (or hoping, depending on one's perspective) for higher interest rates for a long time. Over the past couple of months, those fears/hopes have materialized.
For the first time in nearly 2 years, the yield on 10-year Treasury notes has undergone a "Golden Cross", with its 50-day moving average crossing above its 200-day average.
Prior to the past 20 years, the first Cross in at least 200 days tended to lead to even higher rates in the months ahead. Even after the peak in rates in the early 1980s, these signals saw the 10-year yield continue to rise. Not so much since then.
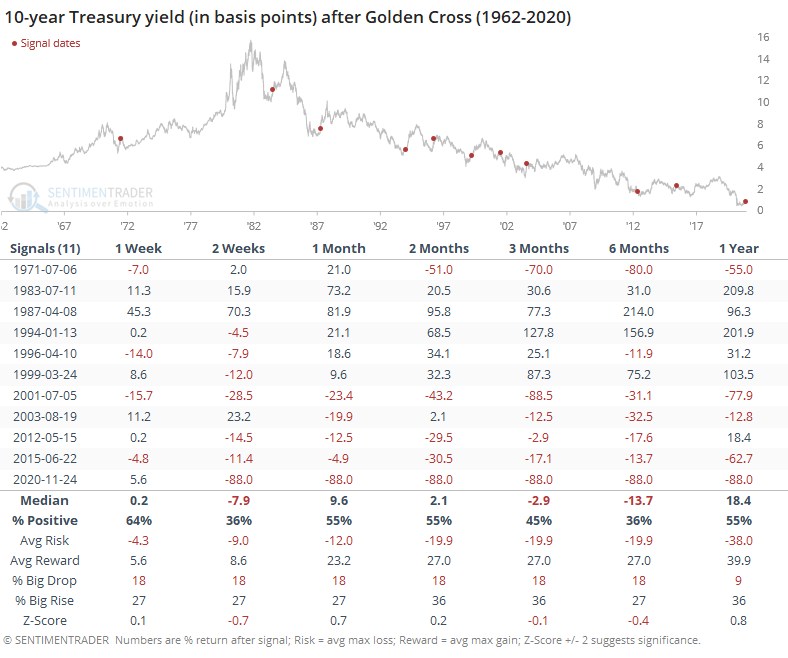
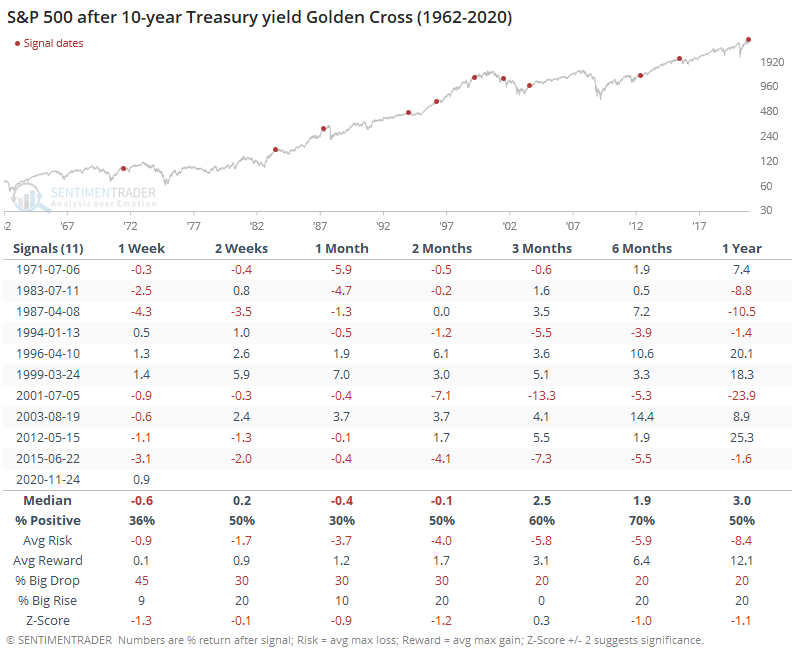
While some are hoping for higher rates as a sign of improved economic growth, these signals have been more of a hindrance for stock returns, at least over the short- to medium-term.
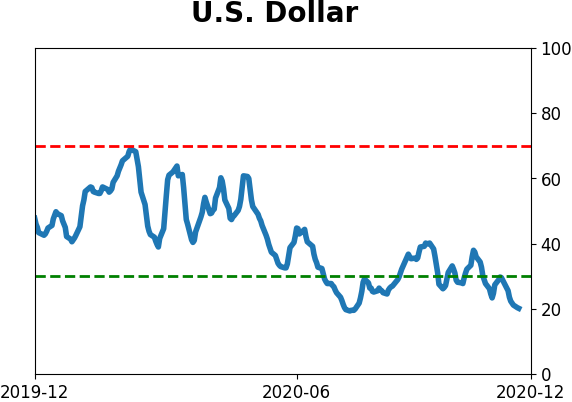
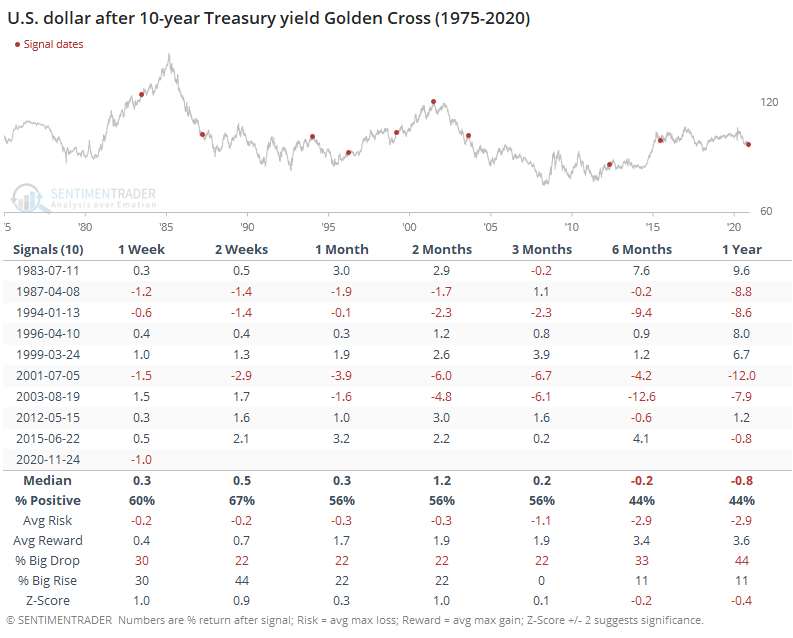
These bond market signals were mostly positive for the U.S. dollar in the shorter-term, but not beyond 3 months or so.
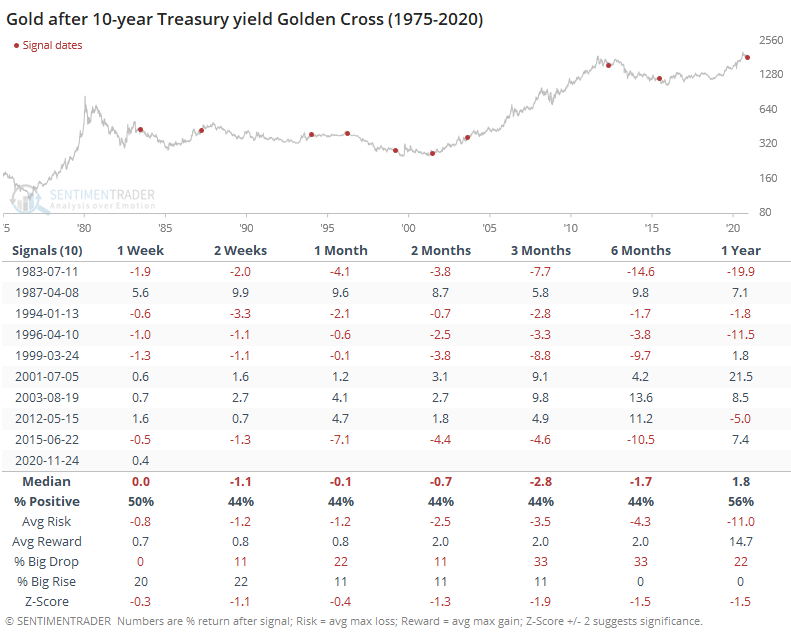
The tendency for the dollar to rise, as modest as it was, proved to be a headwind for gold prices. The metal showed a worse-than-random average return across all time frames, with a poor risk/reward skew. It did completely shrug off that trend a few times, so it was not a perfect sell signal by any means.
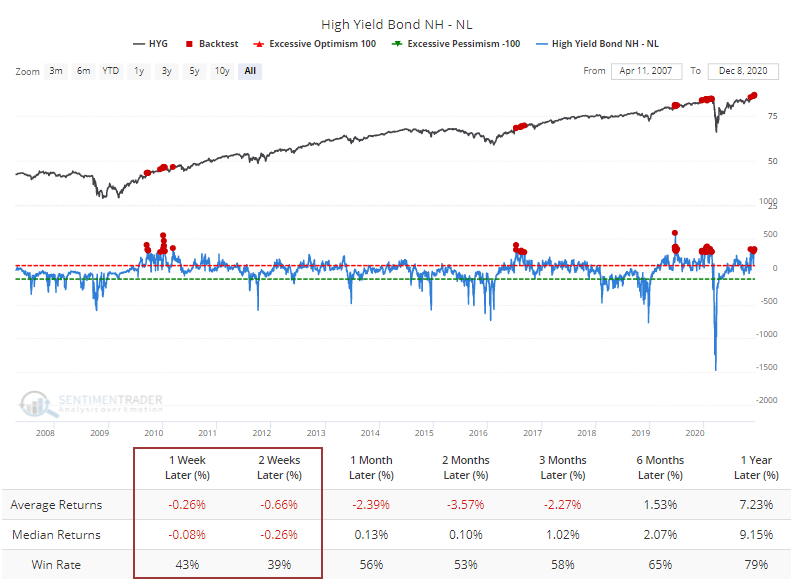
While Treasury prices have been selling off, high-yield bonds have held up well. Well enough, in fact, that the McClellan Summation Index for that market has climbed above +1,000, an impressive feat of internal strength among junk bonds.
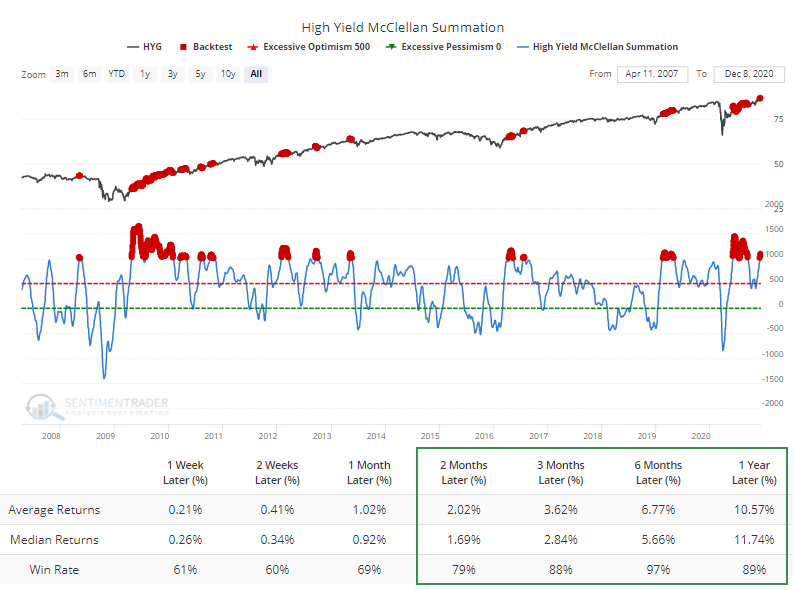
The Backtest Engine shows that since 2007, whenever the McSumm for the high-yield market was above +1,000, the popular HYG fund showed a positive return over the next 6 months after 378 out of 388 days. That's raw price return, not including its sometimes substantial dividend, which would have boosted returns even further.
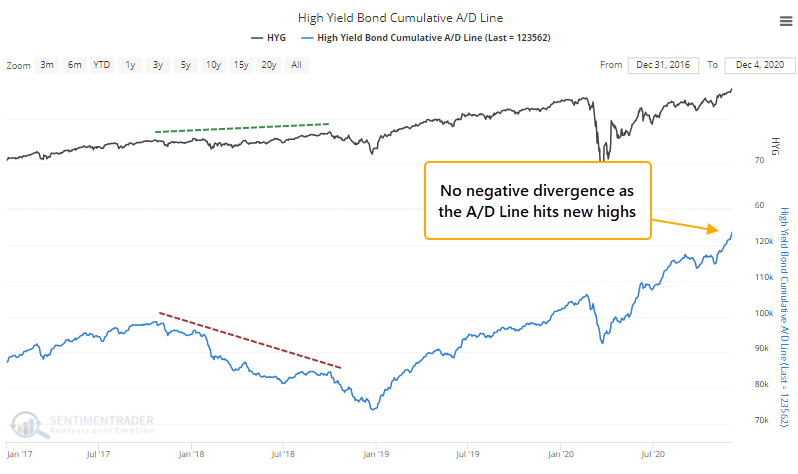
Good participation among a wide variety of bonds has helped to push the Cumulative Advance/Decline Line for the high-yield market to new highs. That's good confirmation that there's plenty of buying interest from investors, unlike in 2018 when the line was declining consistently.
One shorter-term worry there is that so many more bonds are hitting 52-week highs than 52-week lows that it has preceded some weak returns.
Another shorter-term worry is that the Twitterverse has caught on to the positive trend, and relatively high yield, in this market, and they've been tweeting quite positively about it. That hasn't been the best sign for HYG. Our Social Sentiment score acts like a put/call ratio, so the lower the value, the more positive that Twitter posts have been.
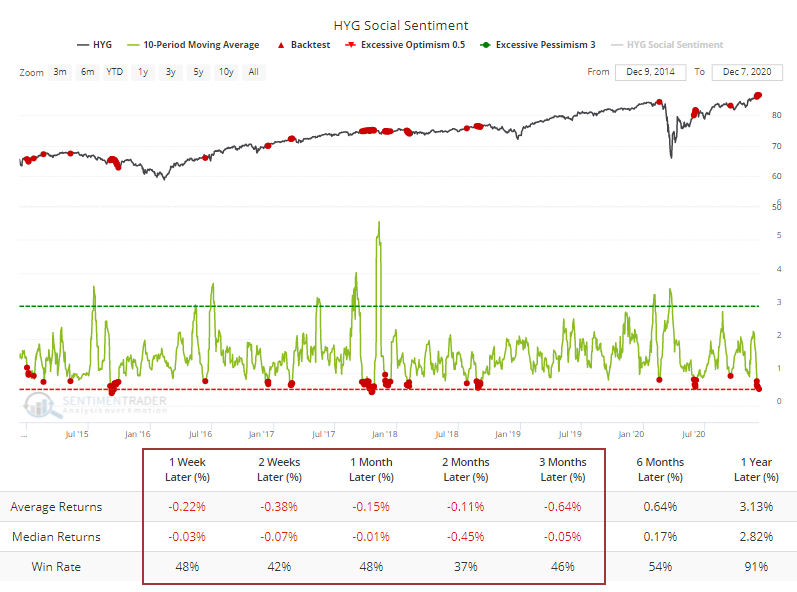
When Twitter users were posting twice as many negative as positive things about HYG, in contrast, over the next 2 months HYG returned a median +1.4% with 79% of the days showing a positive return, so quite a difference.
It's temping to think that this is "it" with rates, and we've seen a generational low. Based on some common technical indicators, there is a case to be made, but the past 20 years have witnessed too many false starts under somewhat similar conditions to have much faith that that's the case.
Whether it is or not, by the time rates have increased enough for the 50-day average to cross the 200-day, it has been a slight headwind for stocks. High-yield bonds, too, are seeing some shorter-term headwinds based on how well they've been doing, but that same good performance has indicated a higher-than-average probability of medium- to long-term gains.
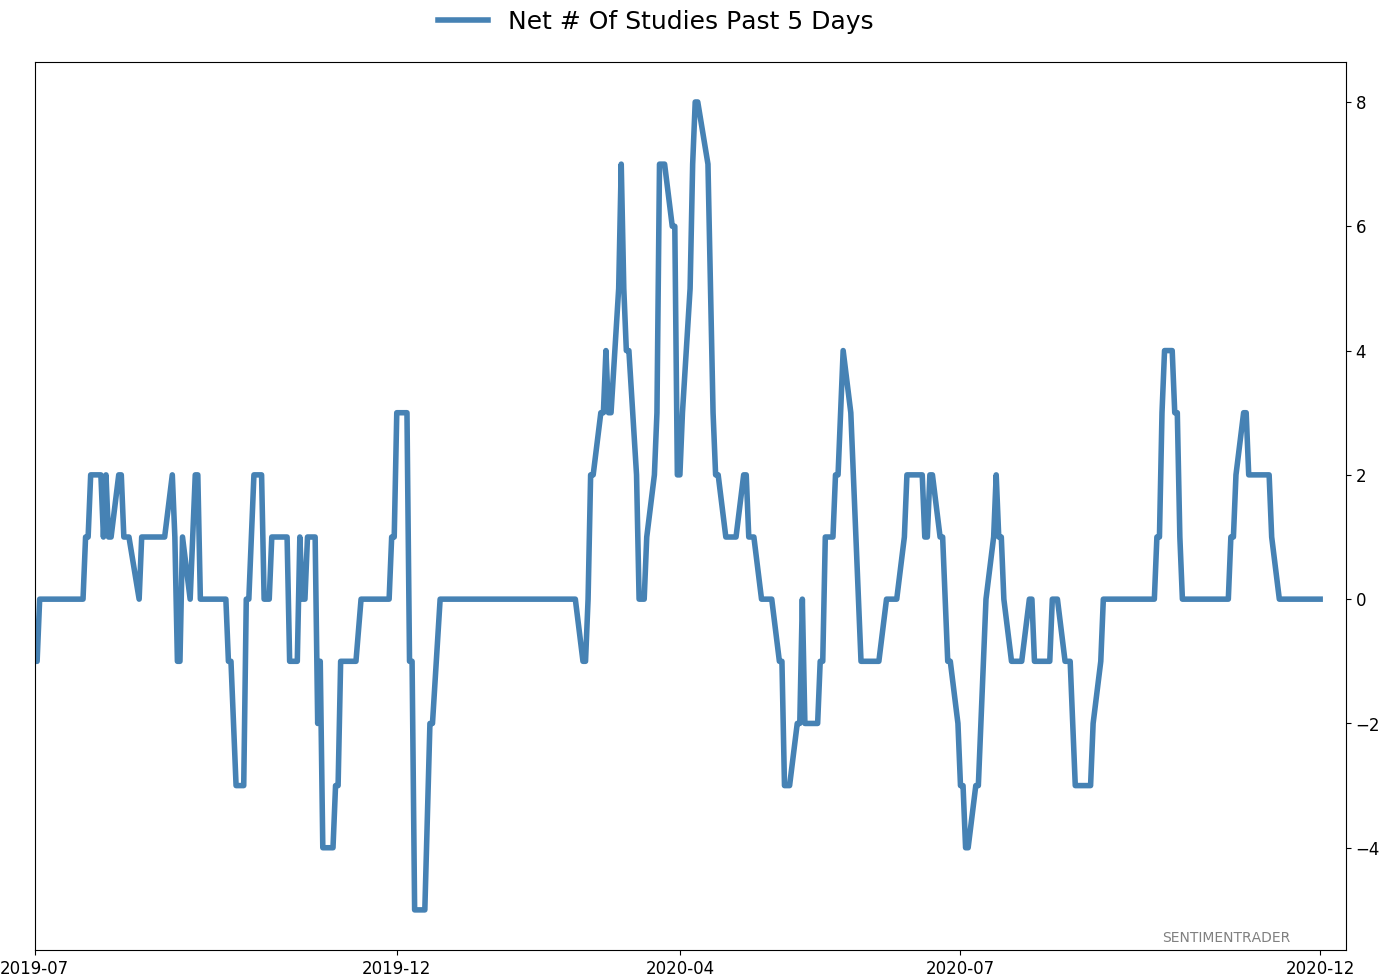
Active Studies
| Time Frame | Bullish | Bearish | | Short-Term | 0 | 1 | | Medium-Term | 5 | 8 | | Long-Term | 52 | 2 |
|
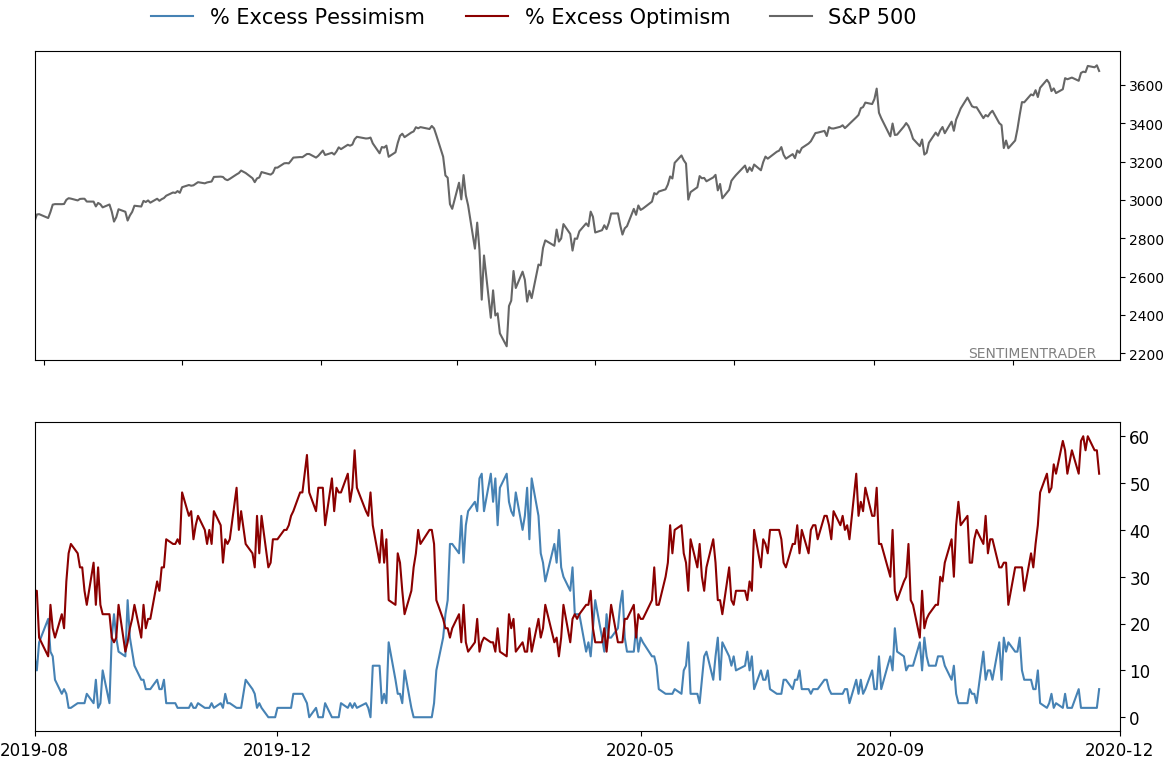
Indicators at Extremes
% Showing Pessimism: 6%
Bullish for Stocks
VIX
|
|
Portfolio
| Position | Description | Weight % | Added / Reduced | Date | | Stocks | 15.6% RSP, 10.1% VWO, 7.5% XLE, 5.1% PSCE | 41.2 | Added 5% | 2020-10-15 | | Bonds | 10% BND, 10% SCHP, 10% ANGL | 28.6 | Reduced 0.1% | 2020-10-02 | | Commodities | GCC | 2.4 | Reduced 2.1%
| 2020-09-04 | | Precious Metals | GDX | 9.5 | Added 4.8% | 2020-12-01 | | Special Situations | | 0.0 | Reduced 5% | 2020-10-02 | | Cash | | 18.3 | | |
|
Updates (Changes made today are underlined)
I've been quiet here because there hasn't been much to do. The things that were supposed to work have pretty much been doing so. With sentiment extremely stretched, I have no desire to add exposure there. About the only place I would add is energy, which has been following through exactly as it should. I did add back to my position in gold miners, due to the studies recently posted to the site. When gold (and miners) have pulled back after momentum like they enjoyed since March, the typical reaction is a resumption of the uptrend over the medium-term, and not a rollover into a bear phase. The continued weakness in the dollar certainly helps. RETURN YTD: 7.2% 2019: 12.6%, 2018: 0.6%, 2017: 3.8%, 2016: 17.1%, 2015: 9.2%, 2014: 14.5%, 2013: 2.2%, 2012: 10.8%, 2011: 16.5%, 2010: 15.3%, 2009: 23.9%, 2008: 16.2%, 2007: 7.8%
|
|
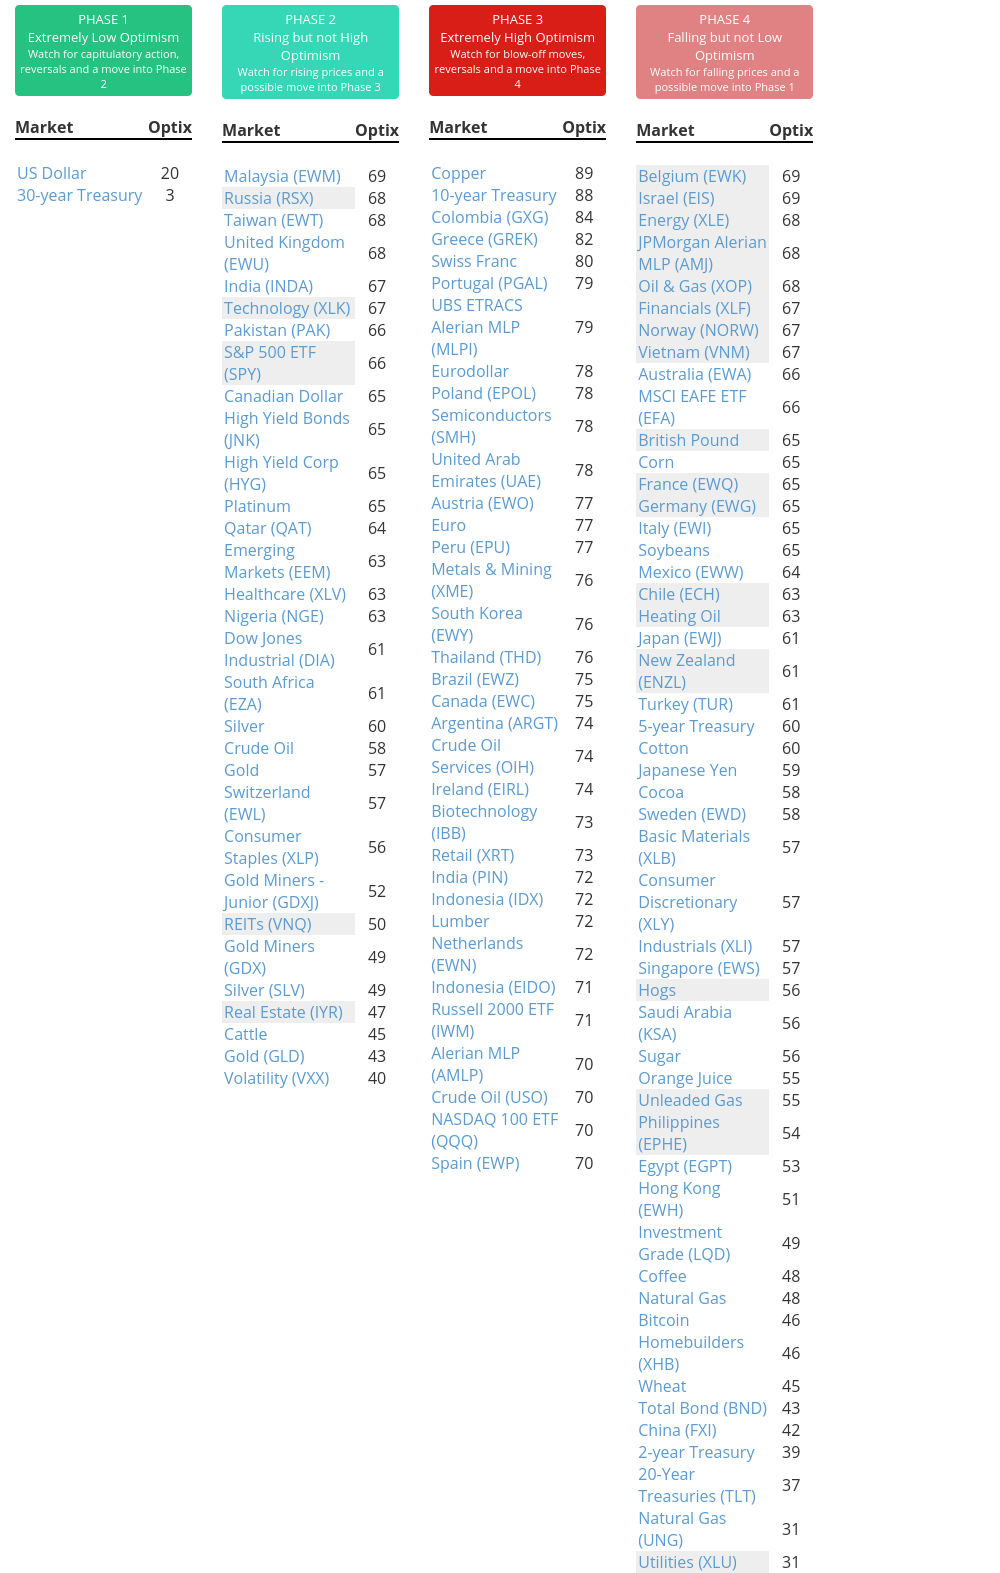
Phase Table
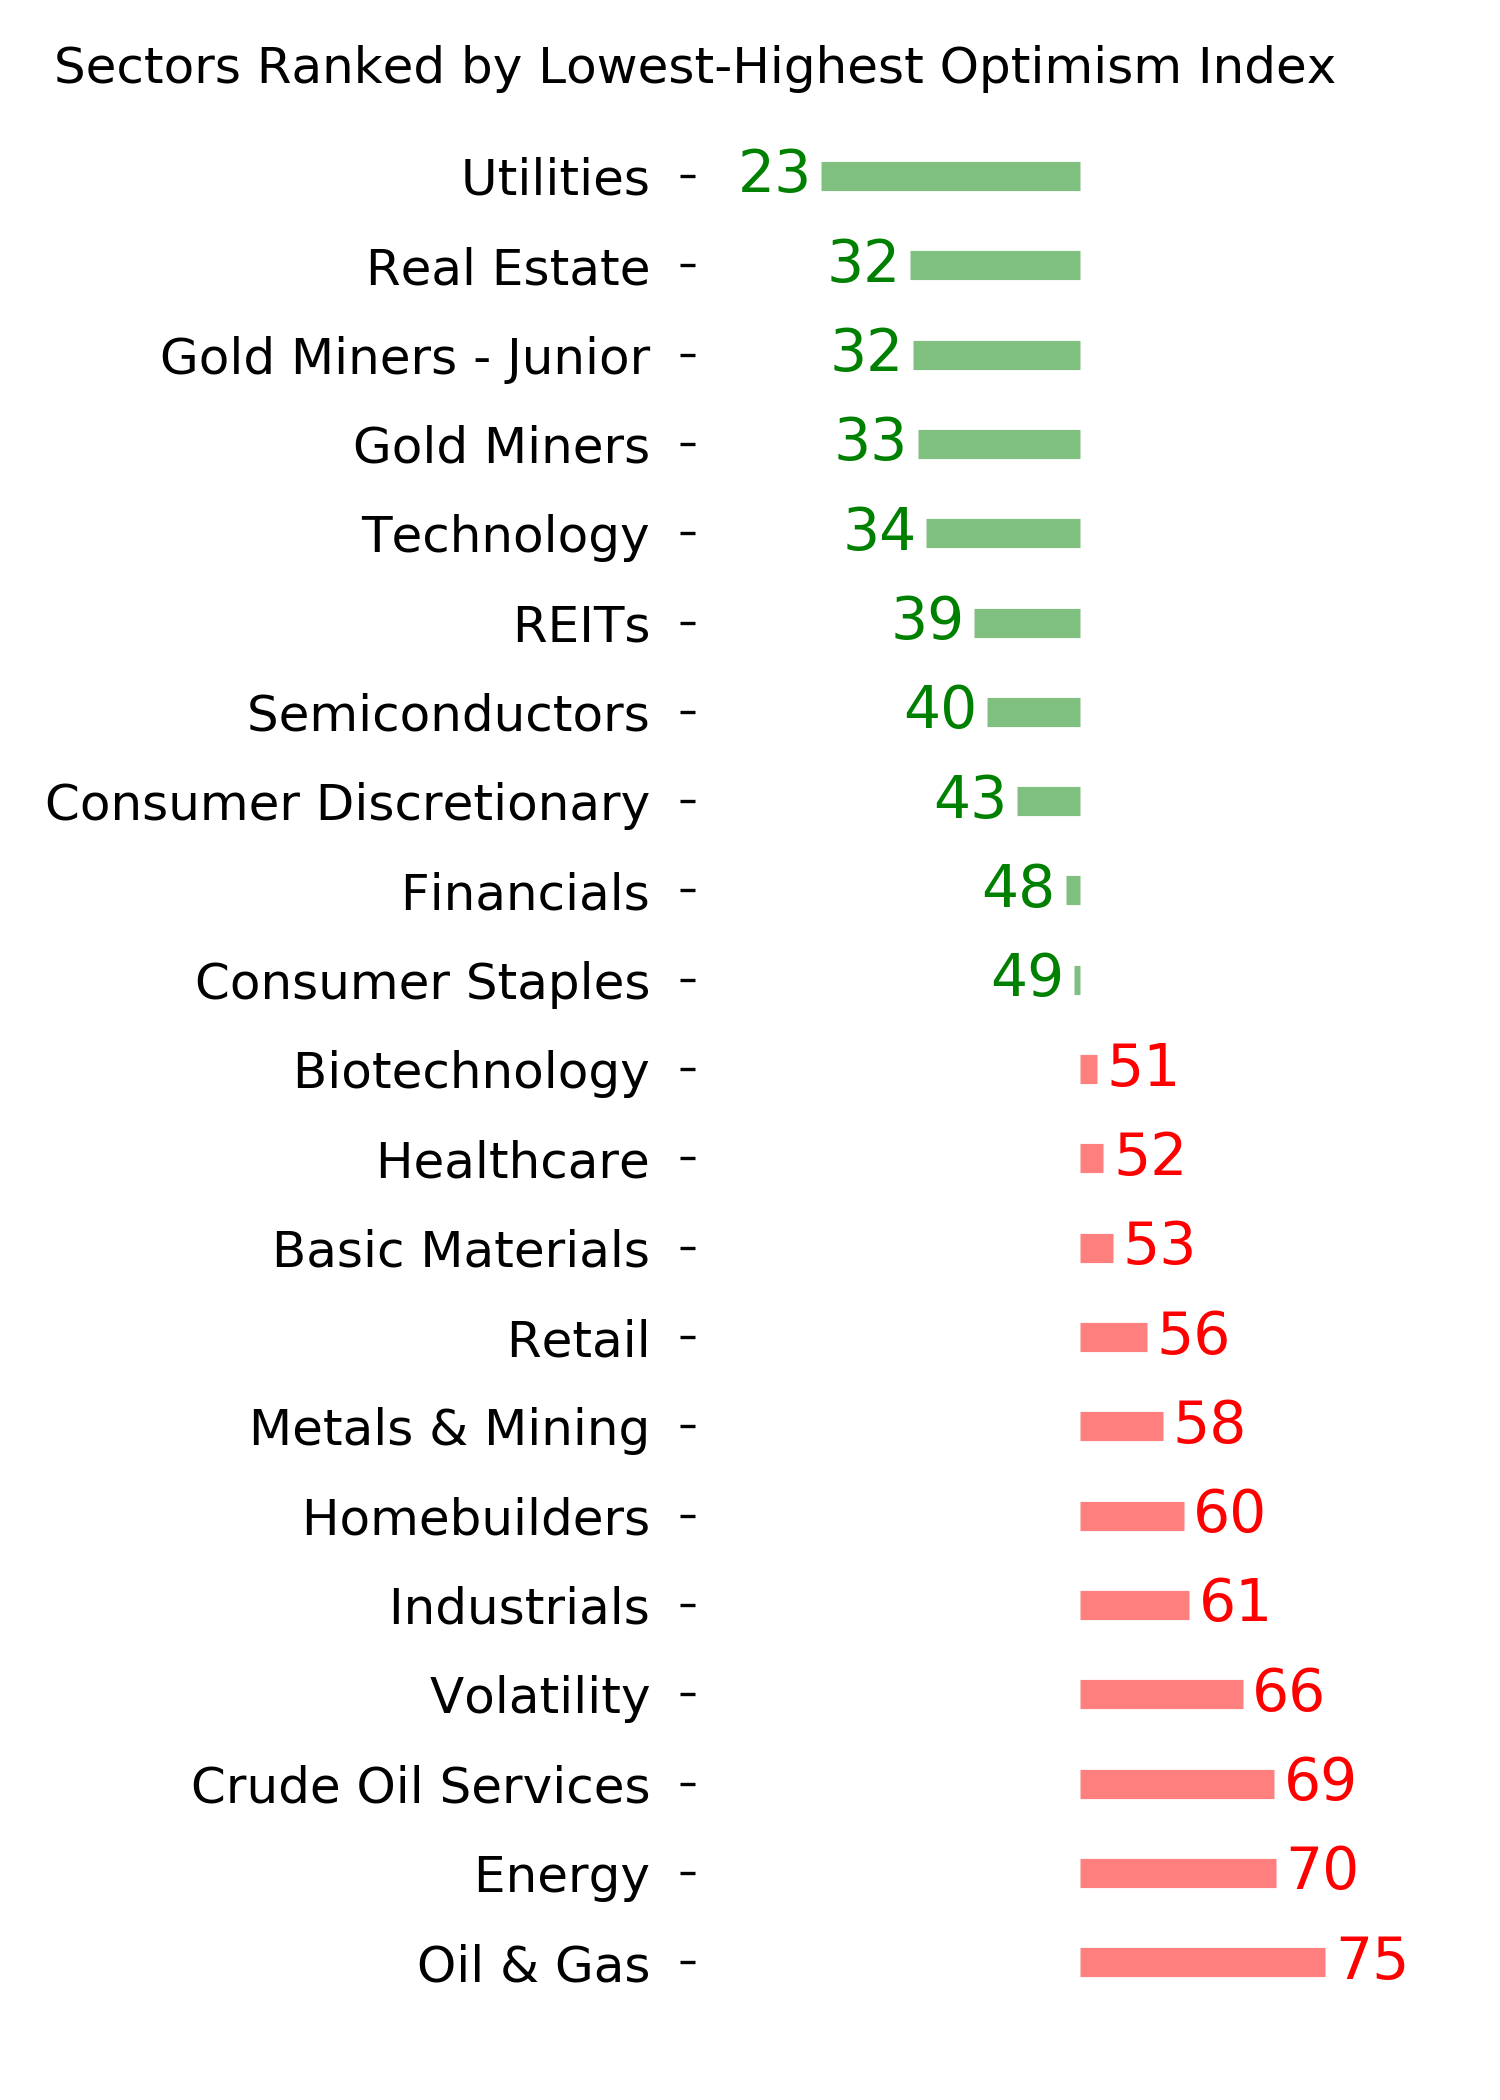
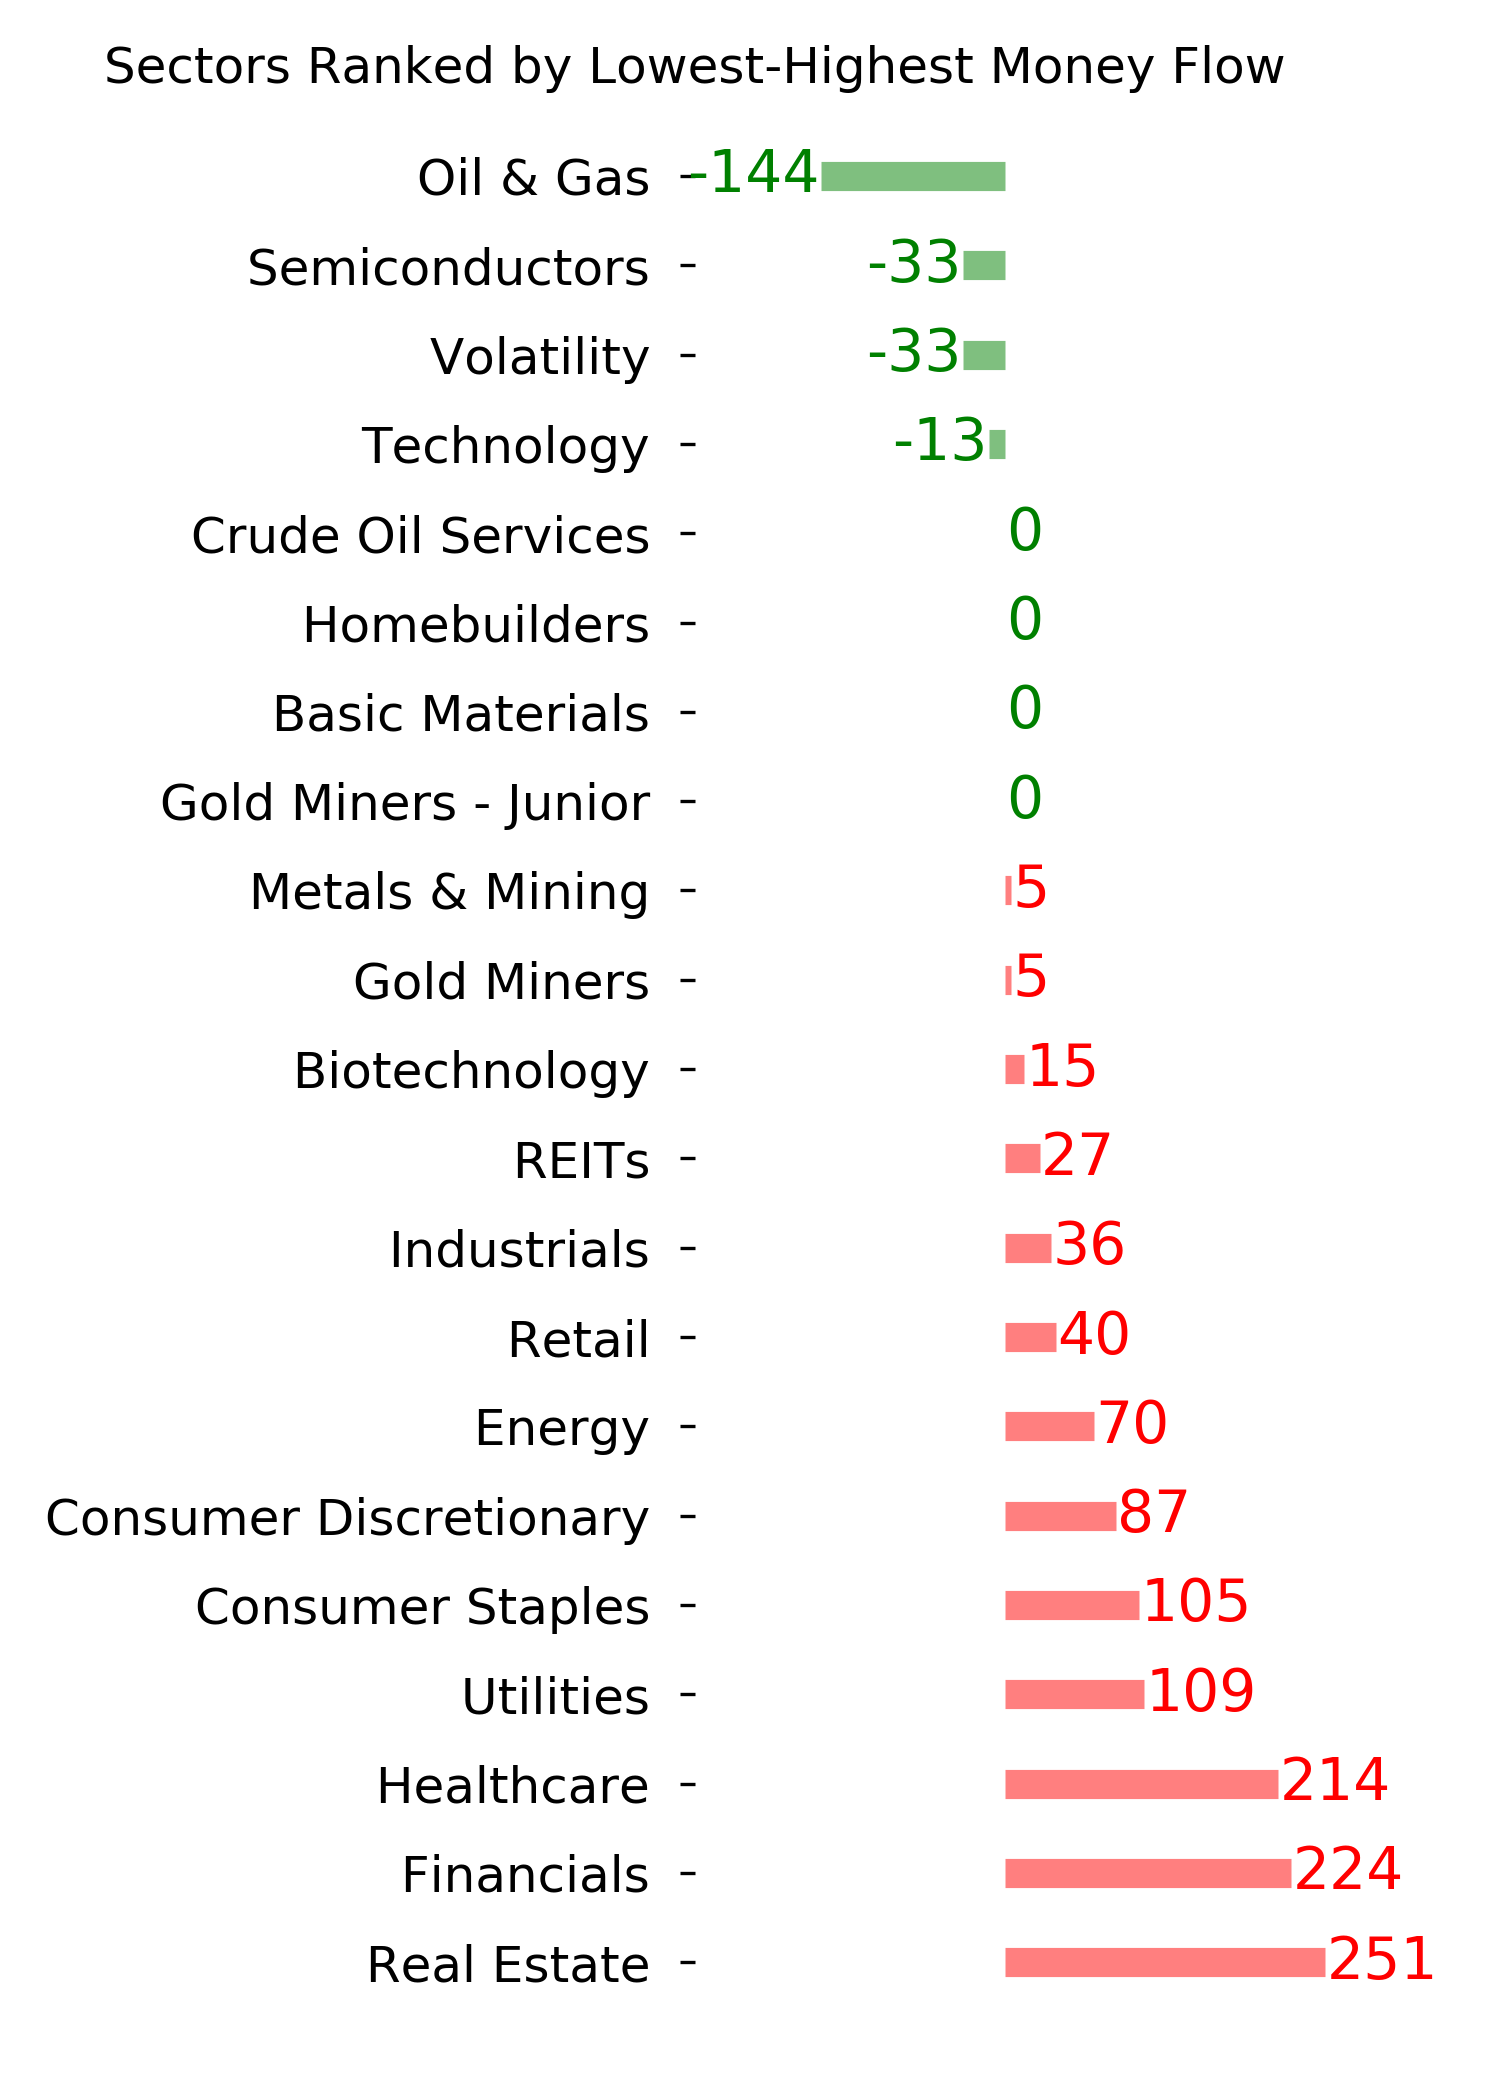
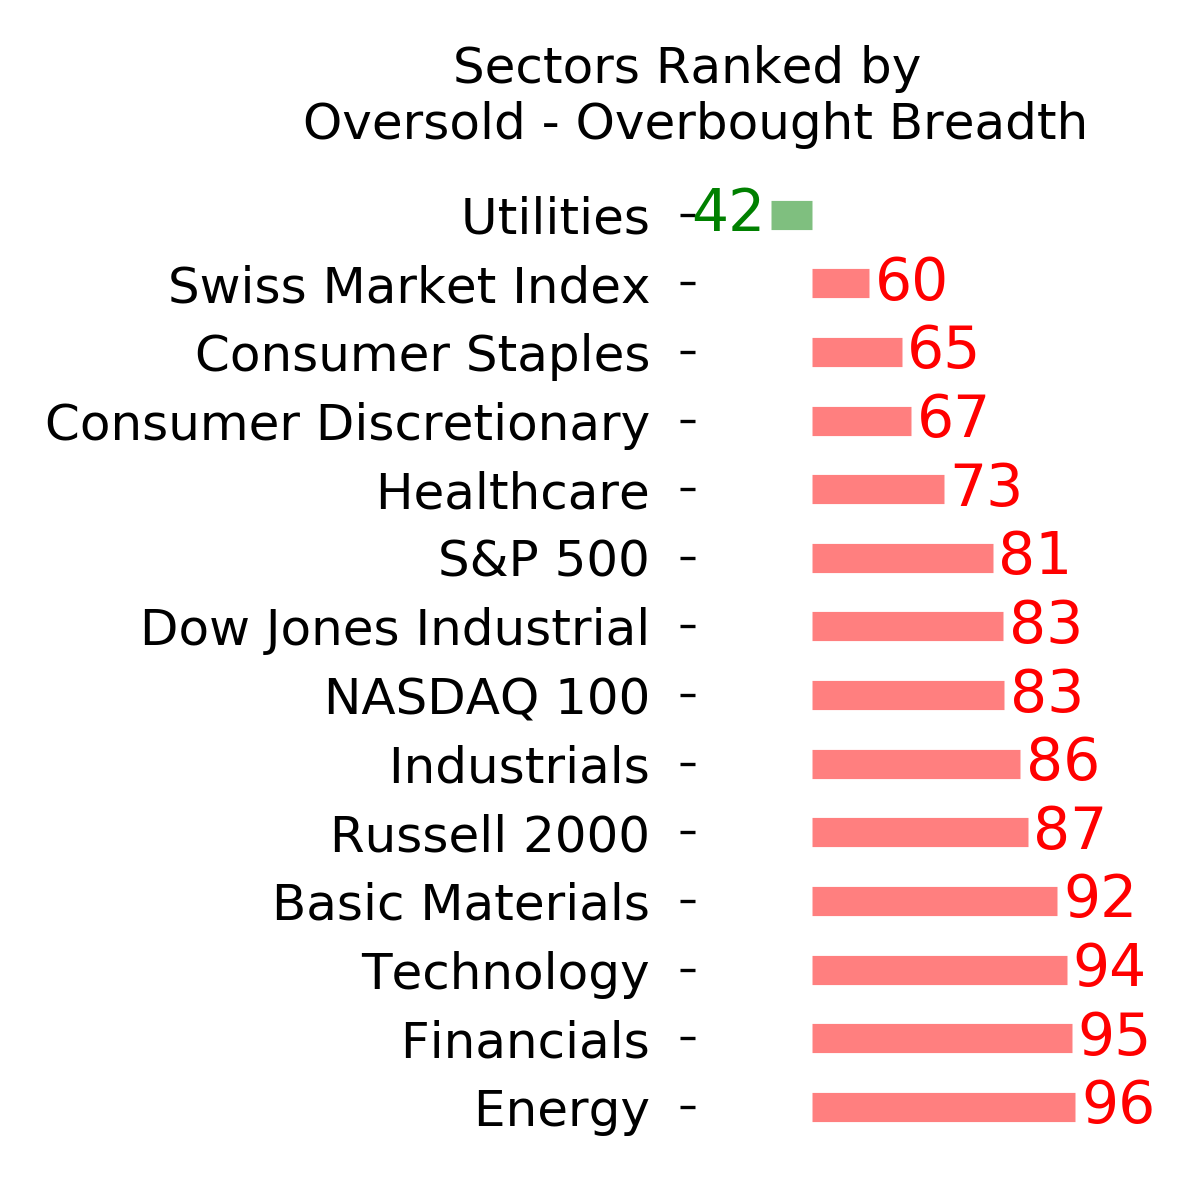
Ranks
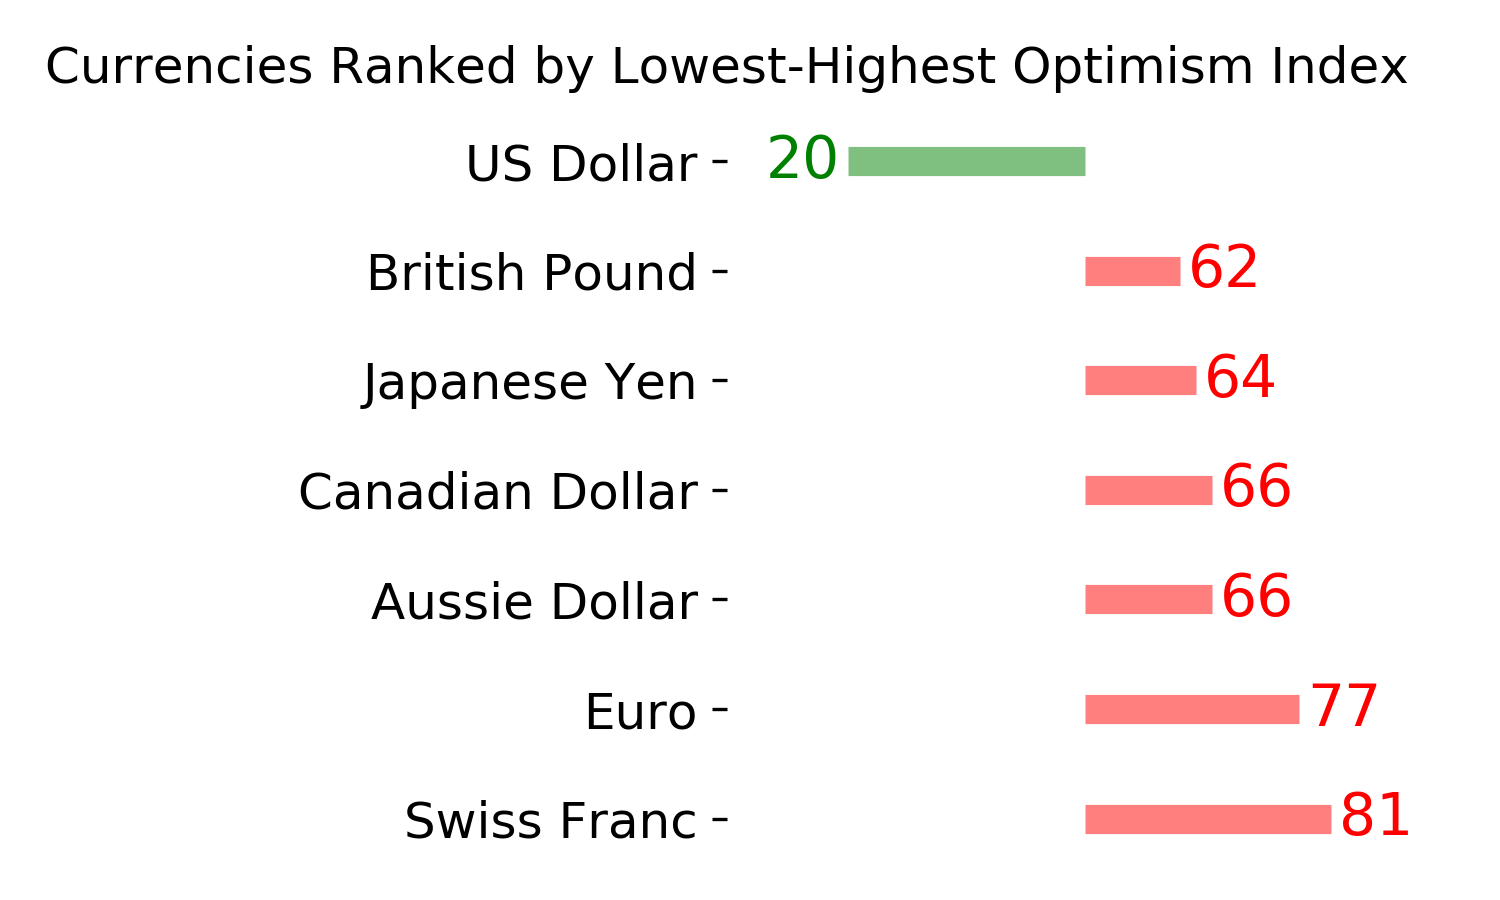
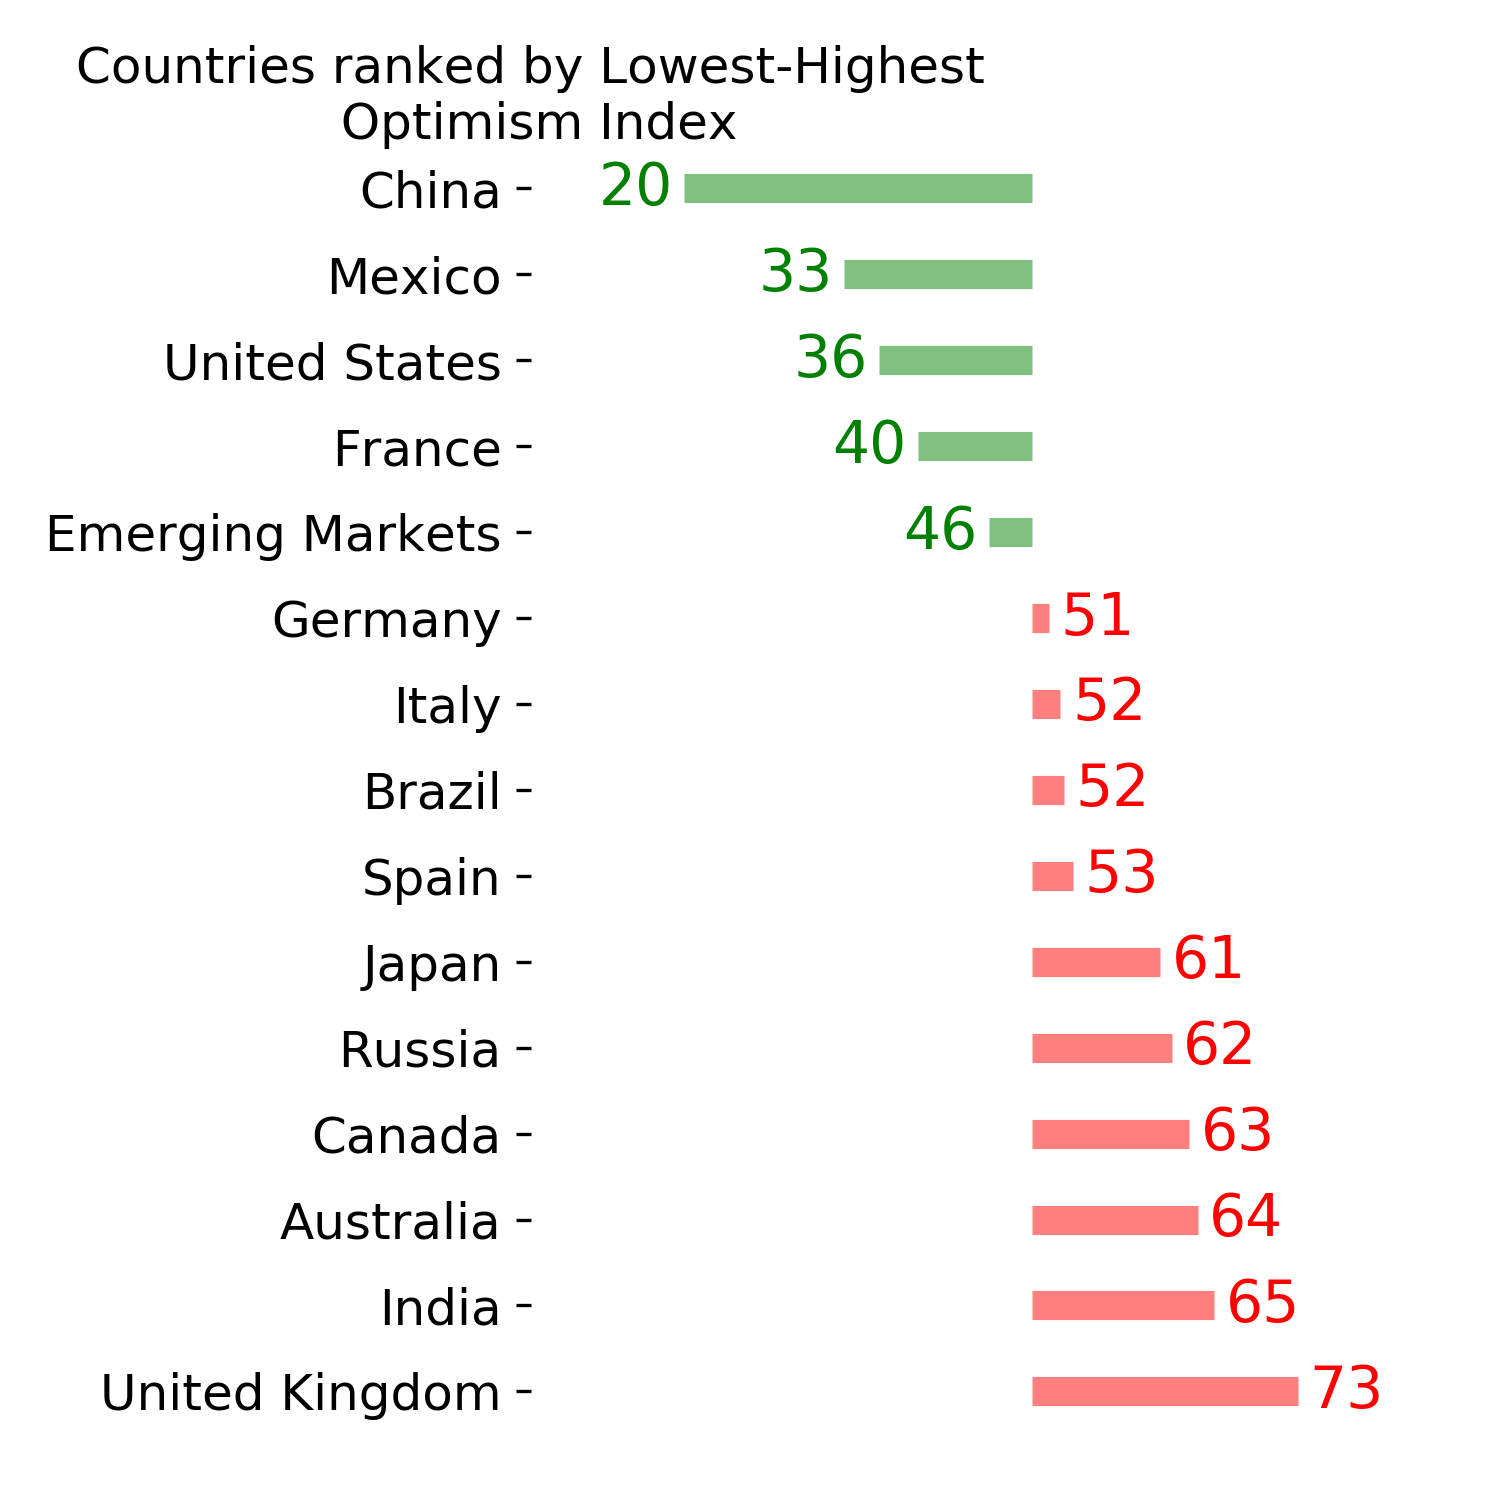
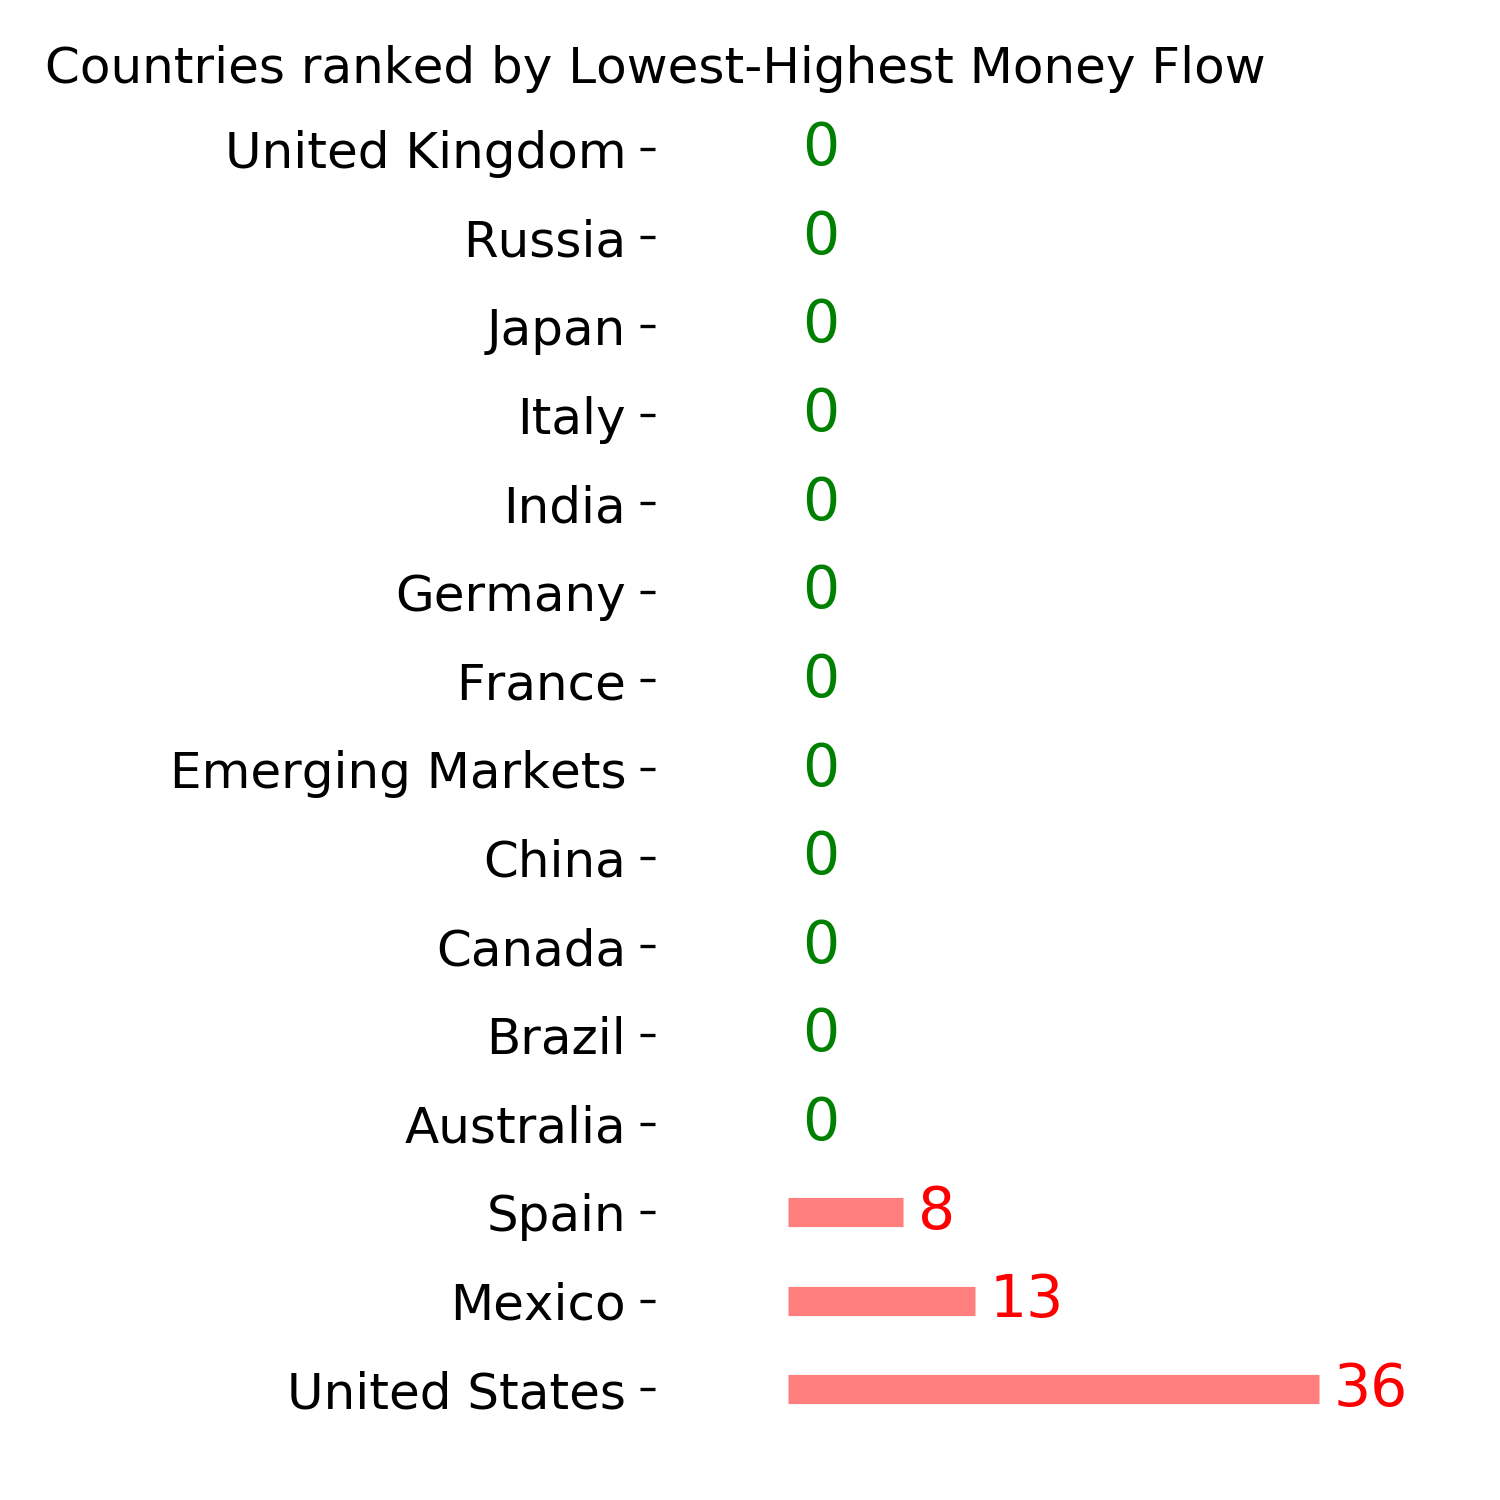
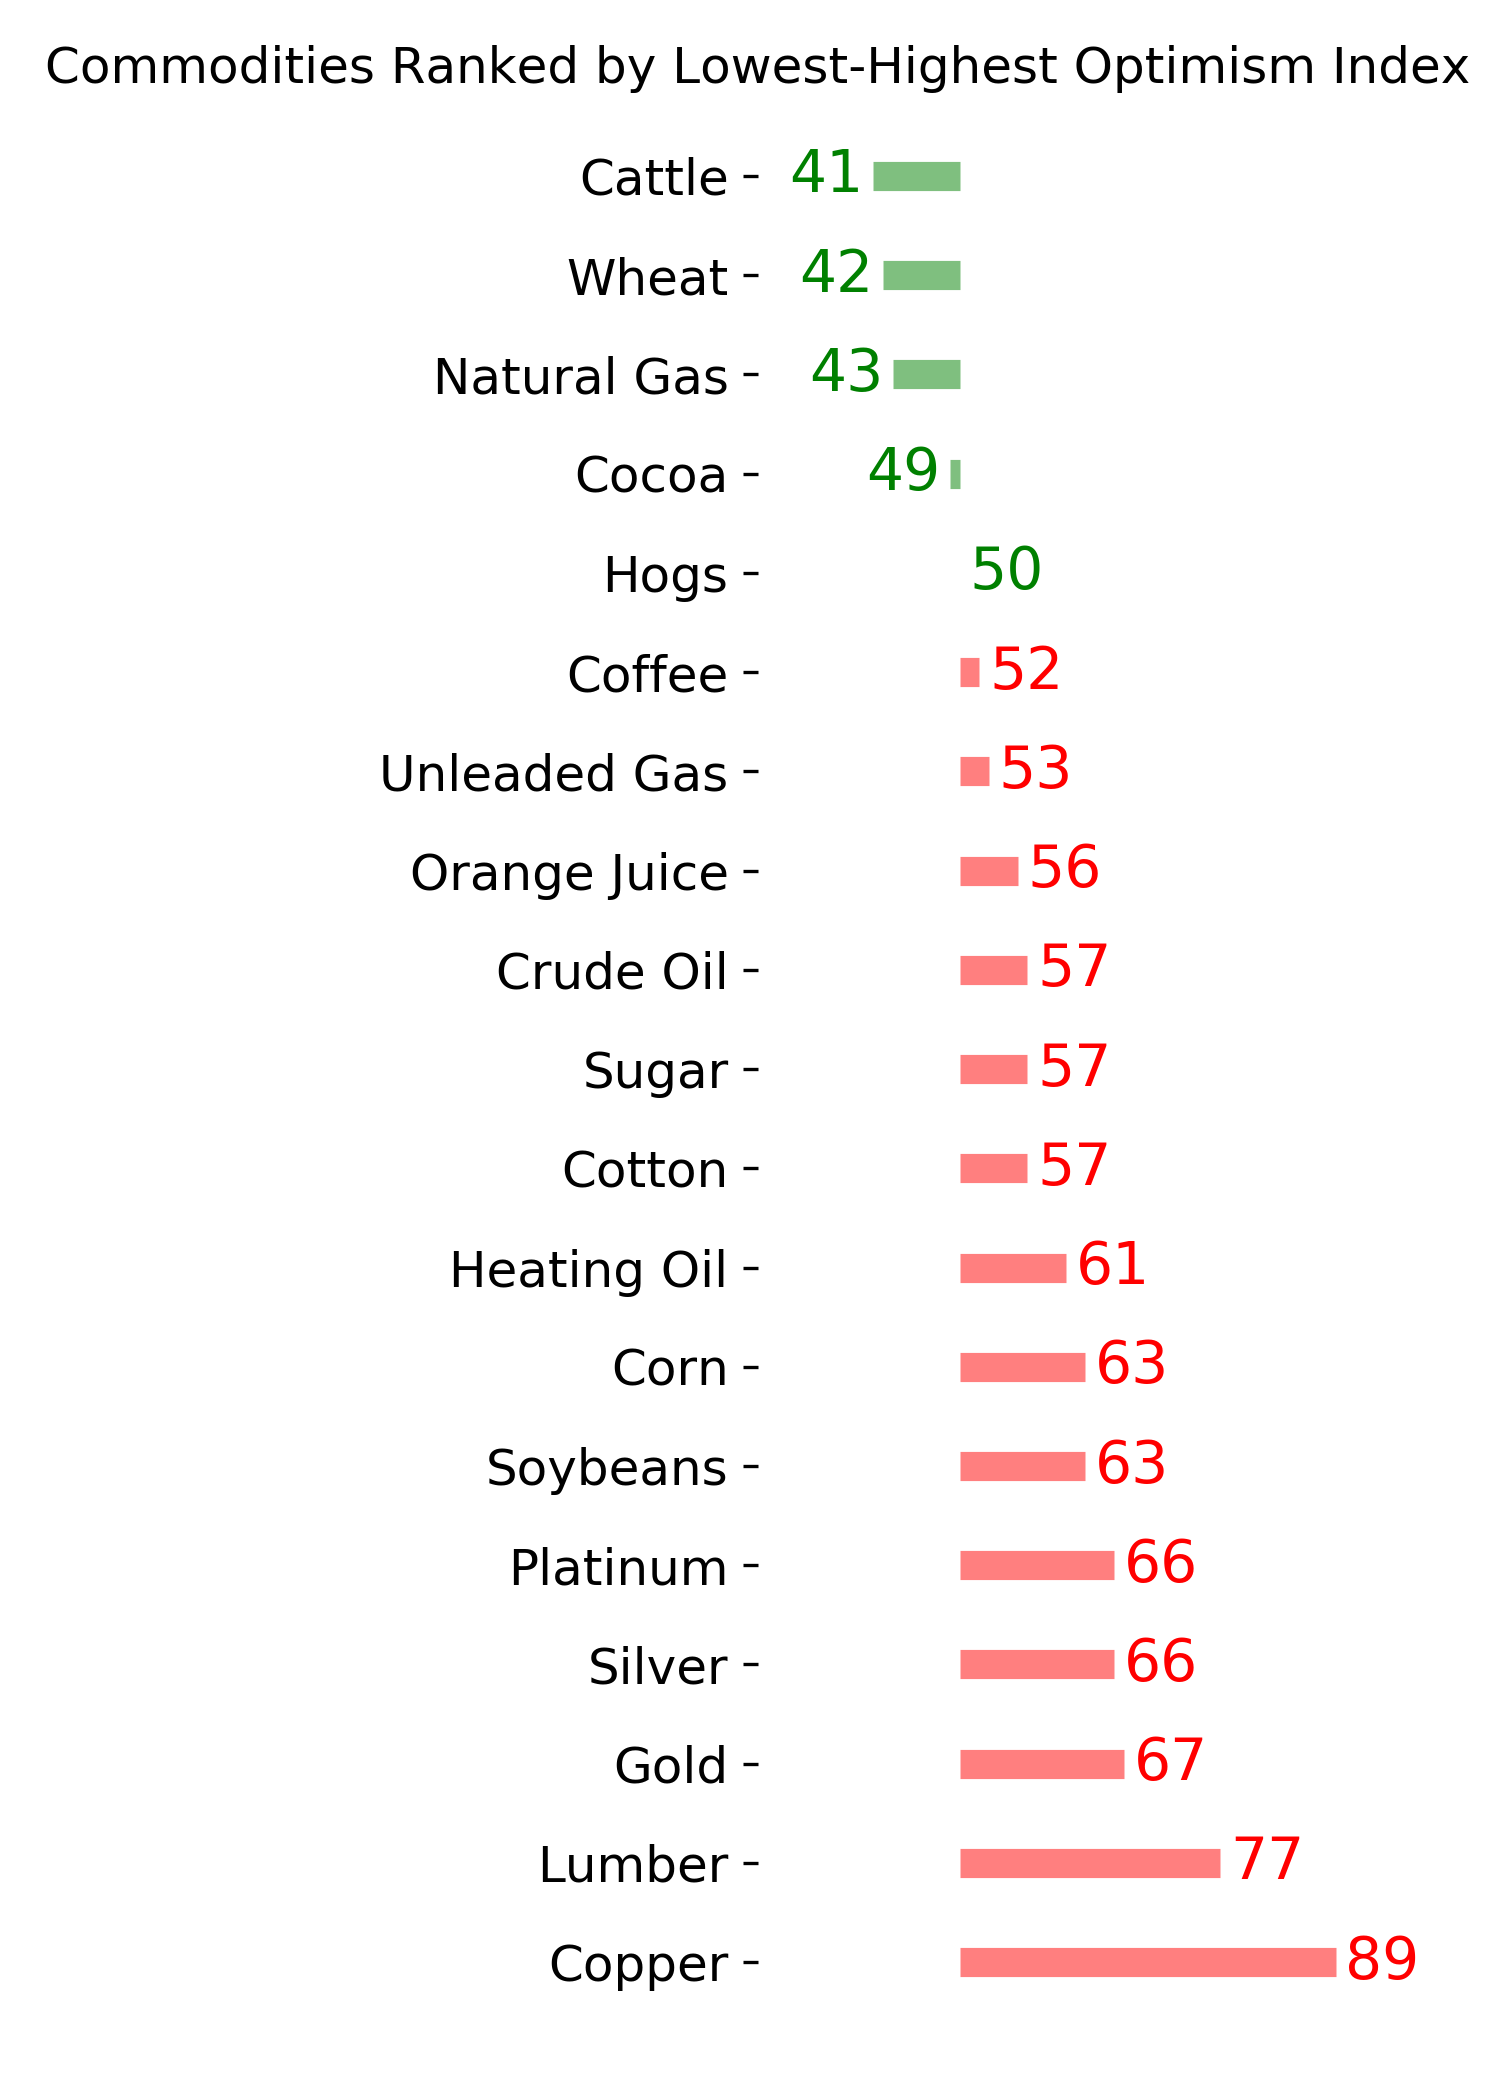
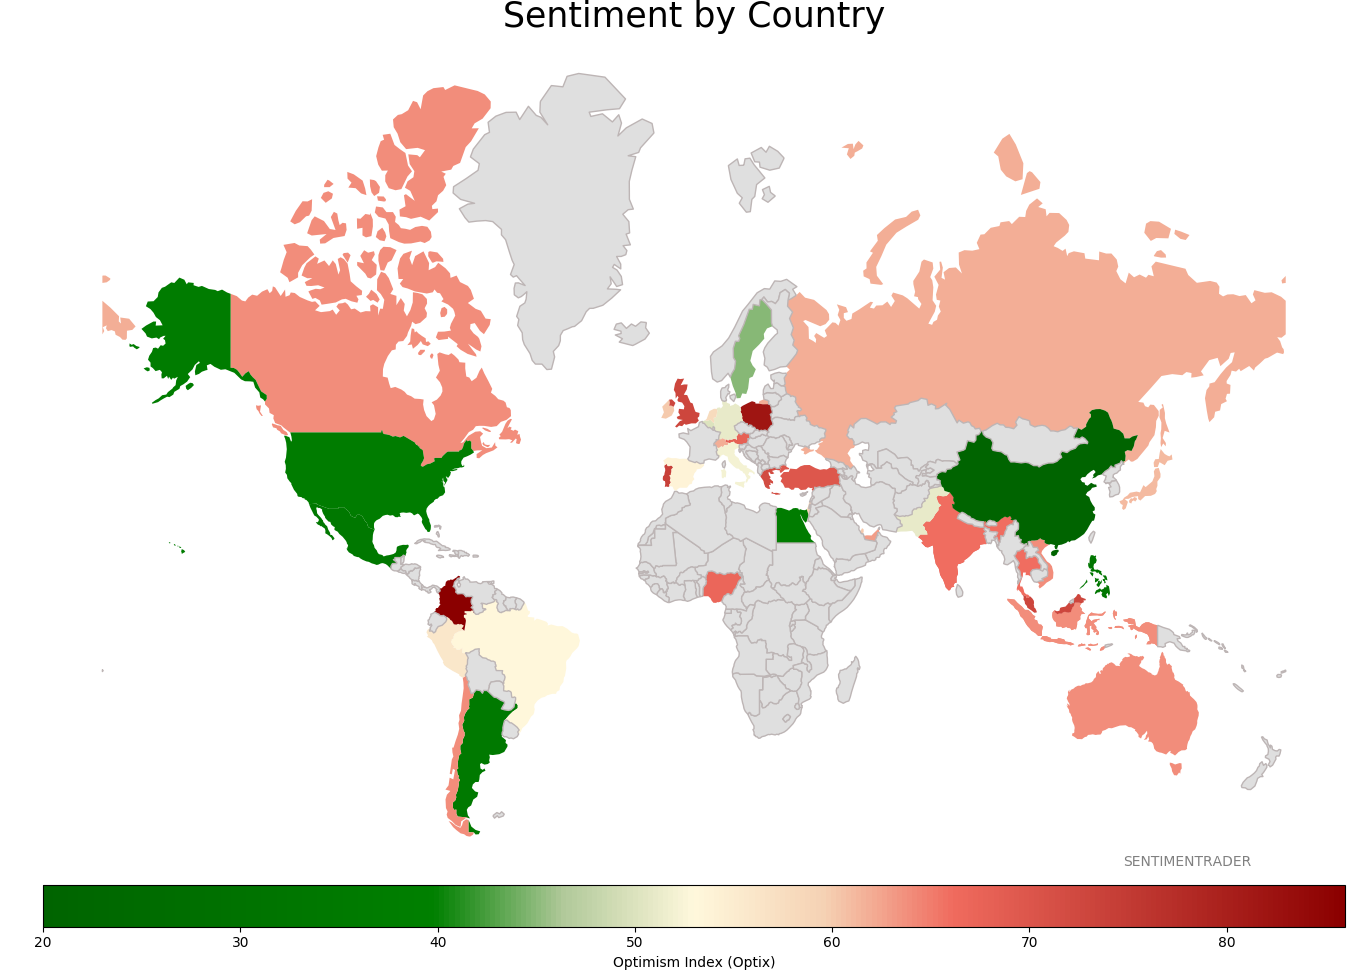
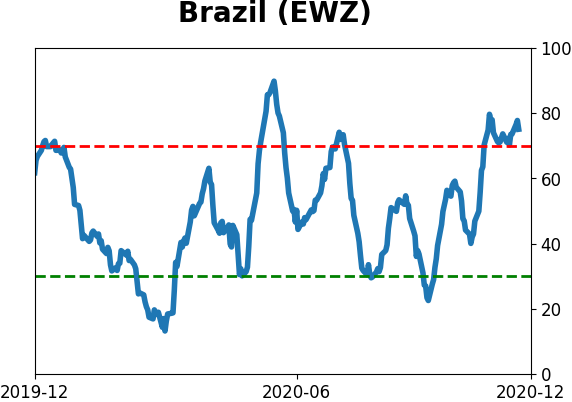
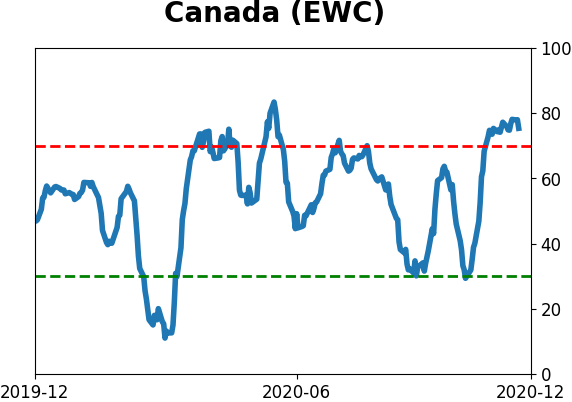
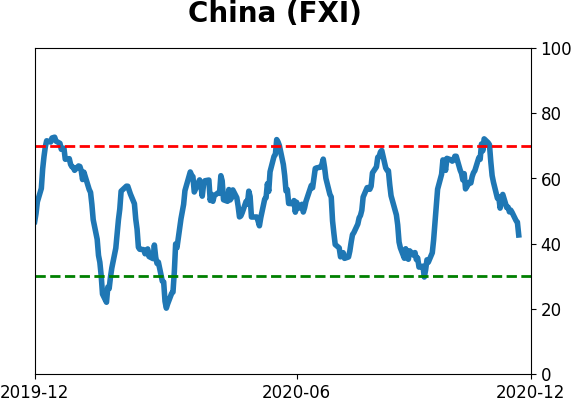
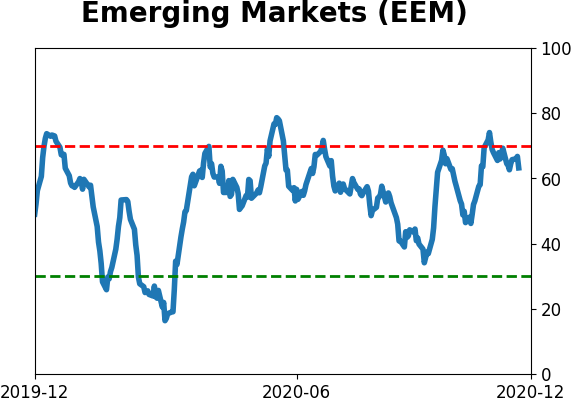
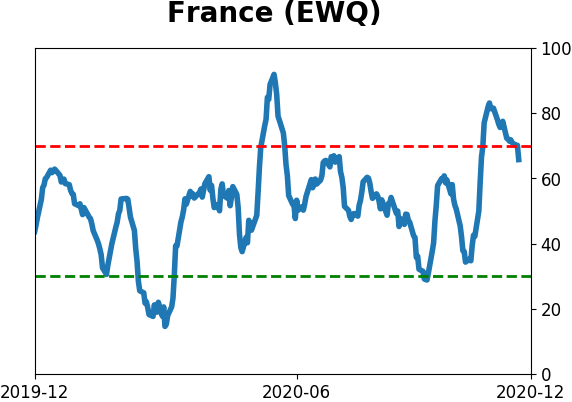
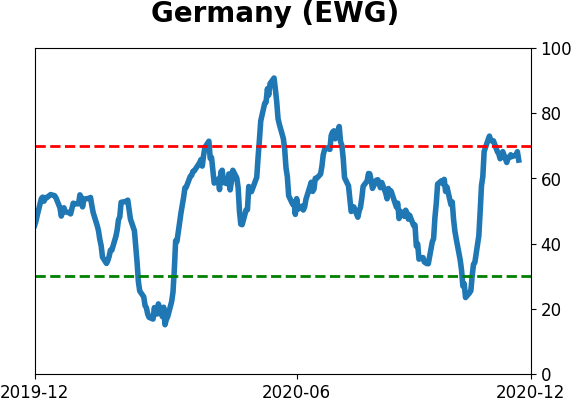
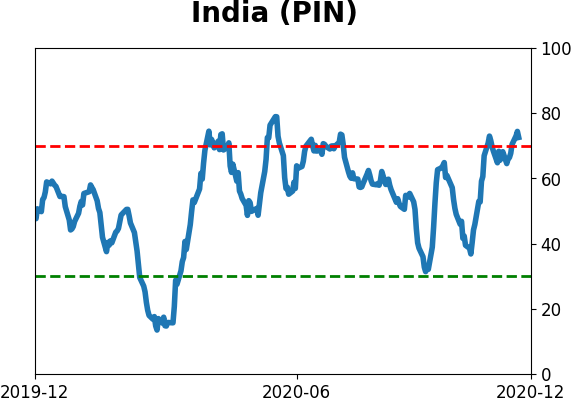
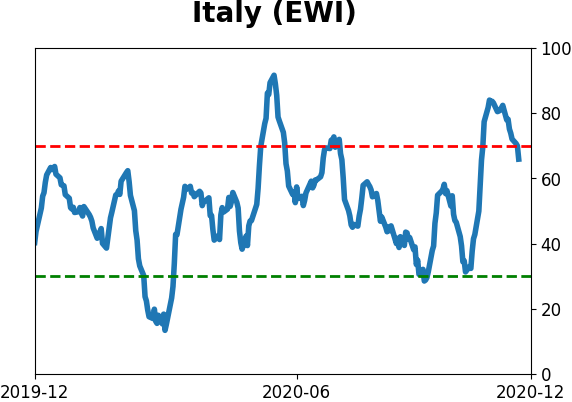
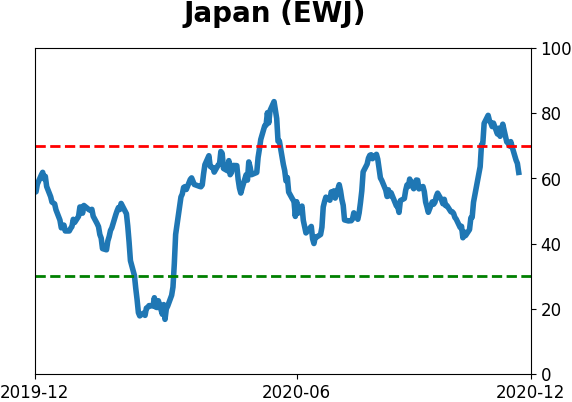
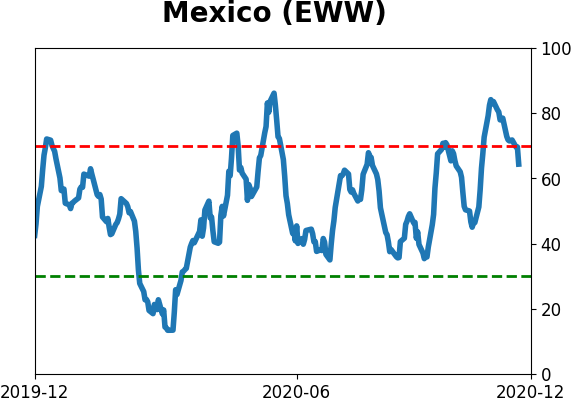
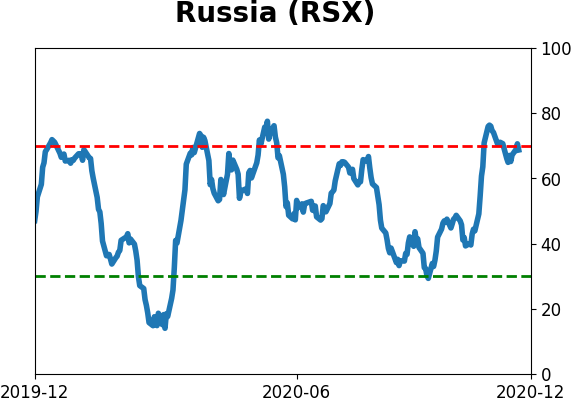
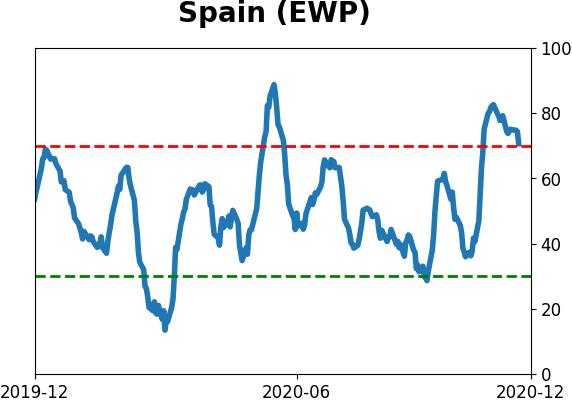
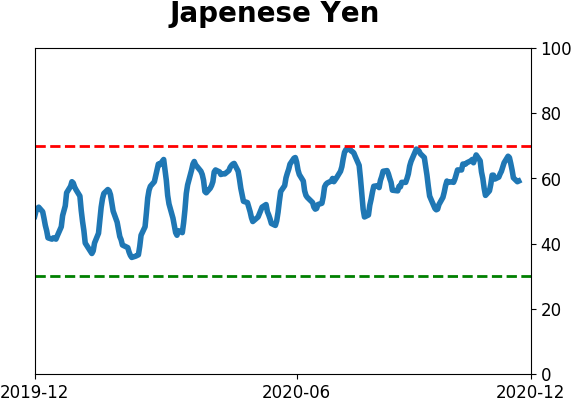
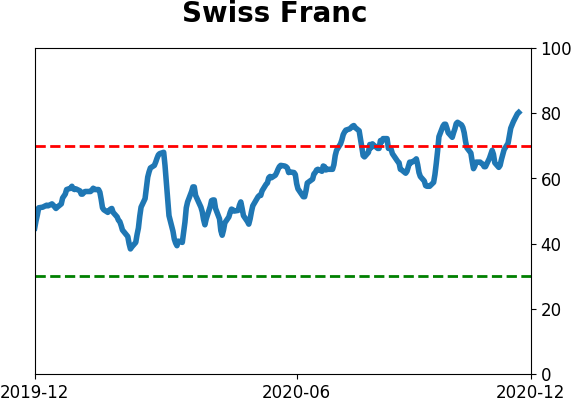
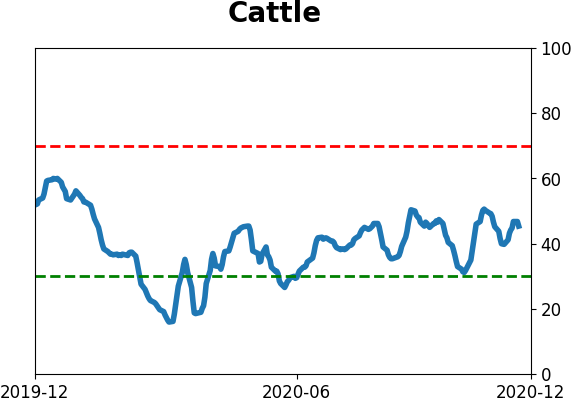
Sentiment Around The World
Optimism Index Thumbnails
|
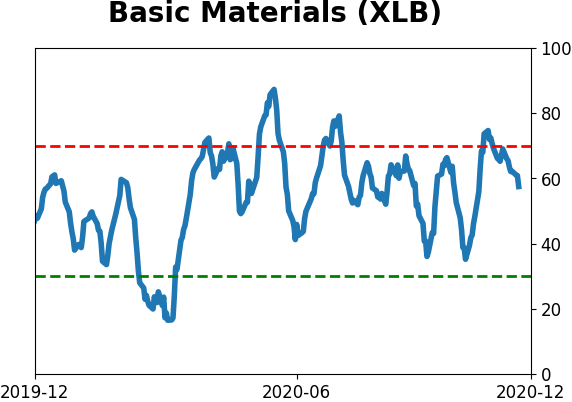
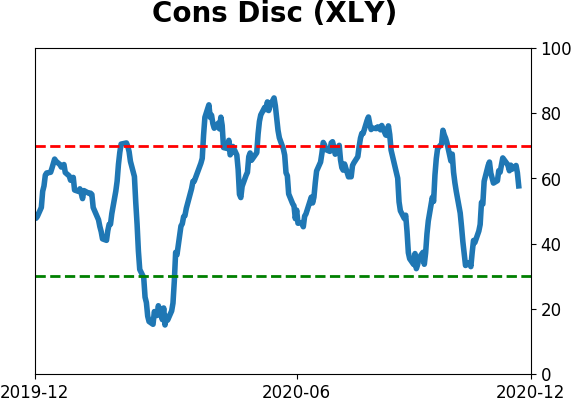
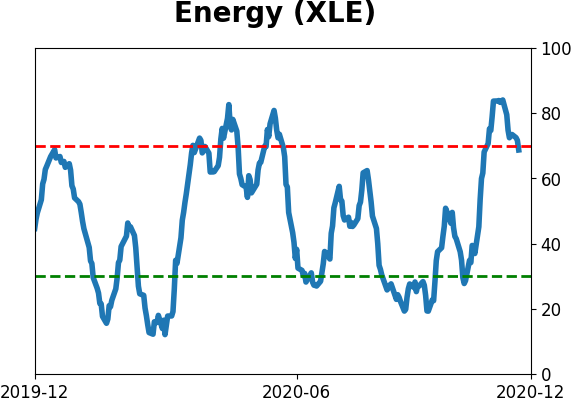
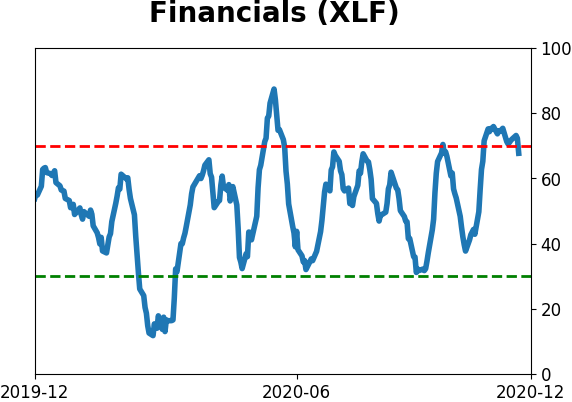
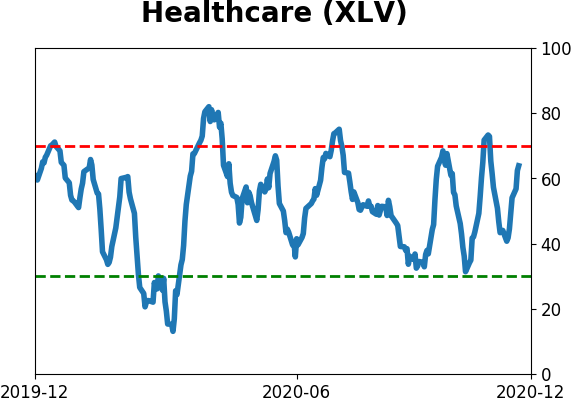
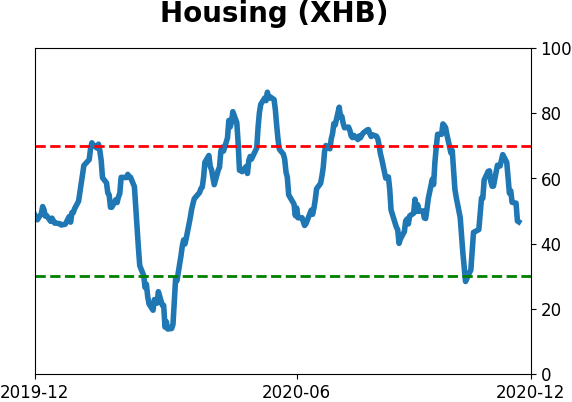
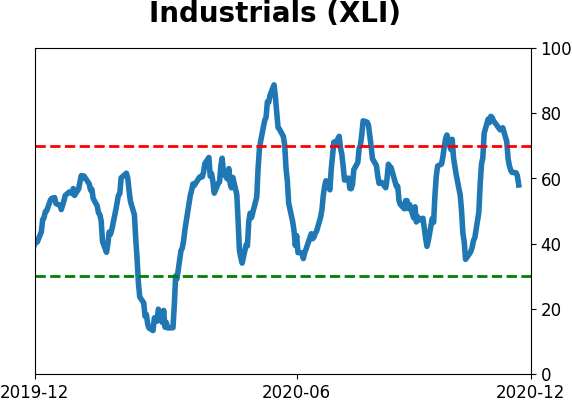
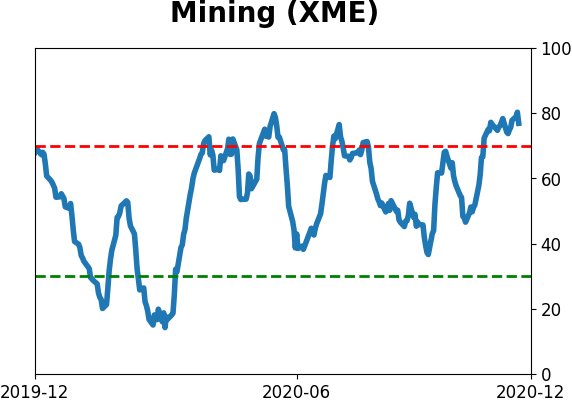
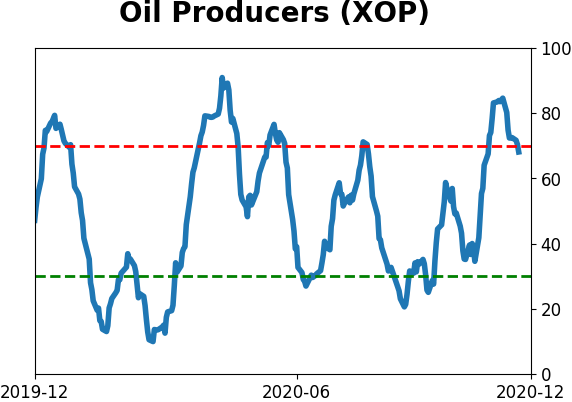
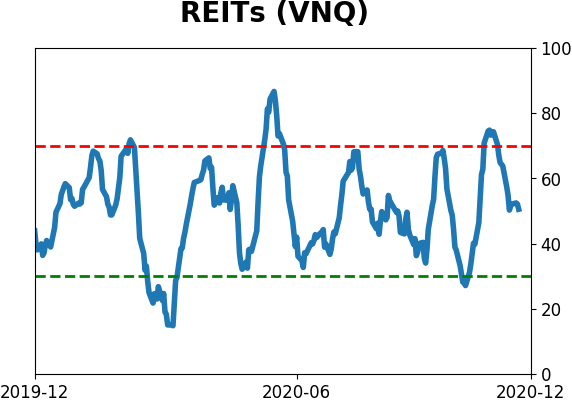
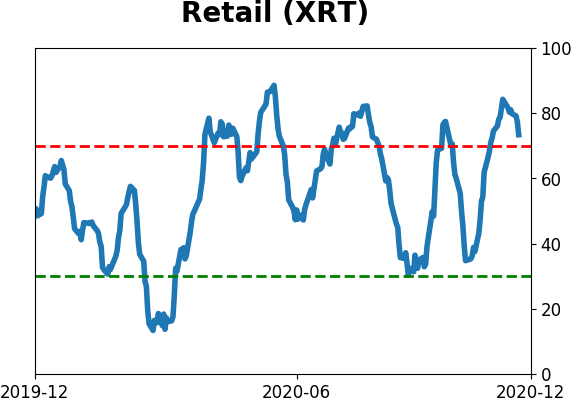
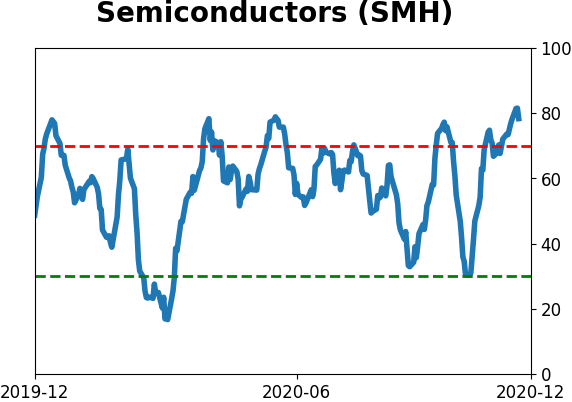
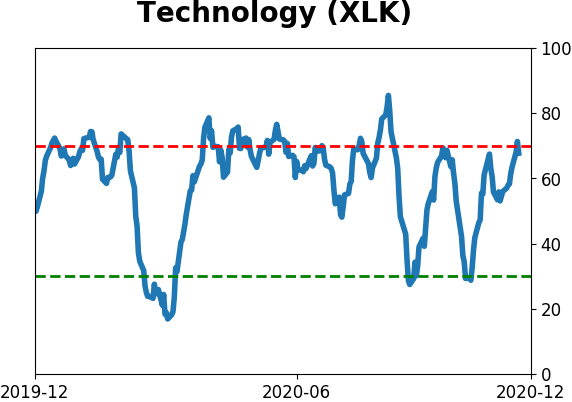
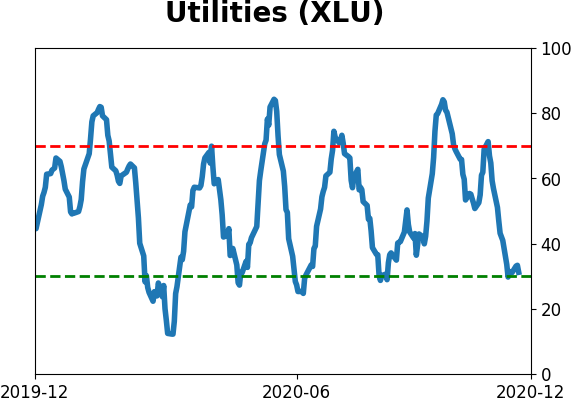
Sector ETF's - 10-Day Moving Average
|
|
|
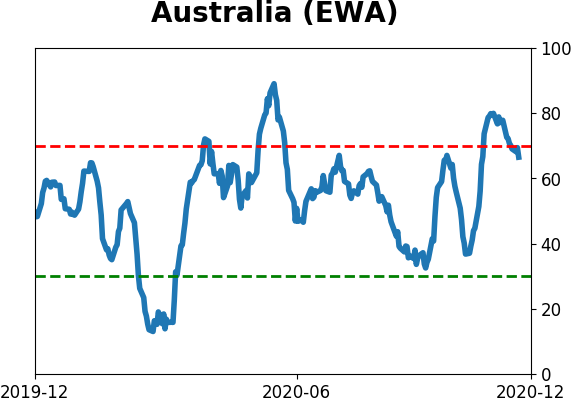
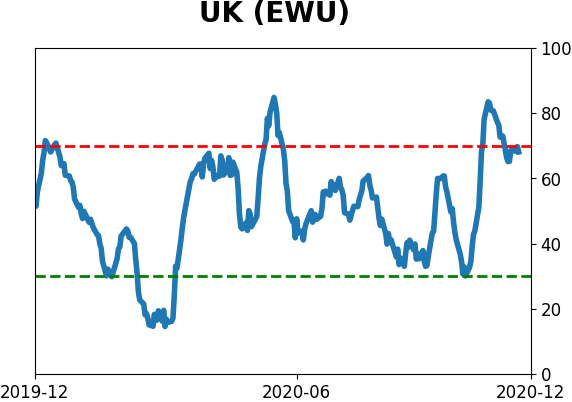
Country ETF's - 10-Day Moving Average
|
|
|
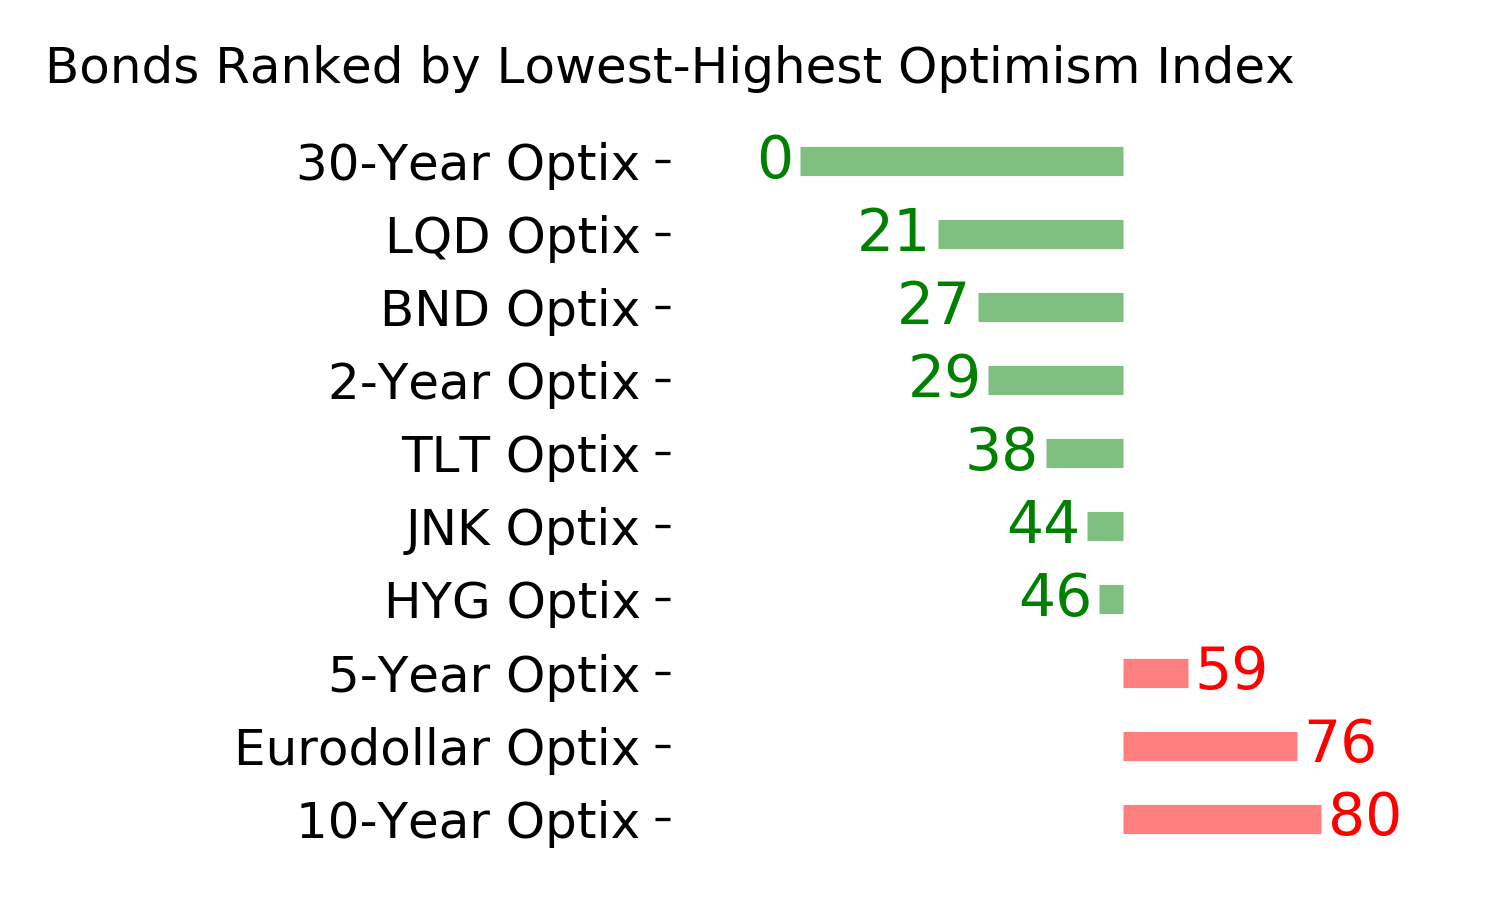
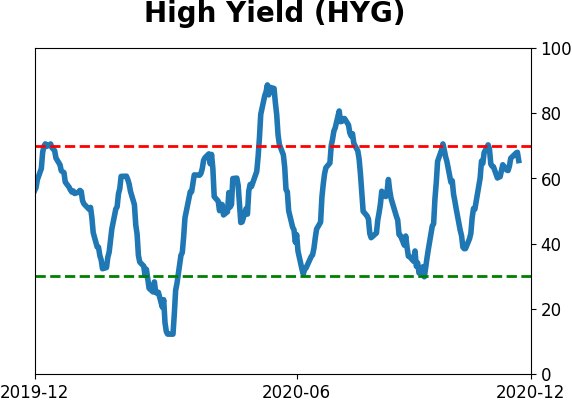
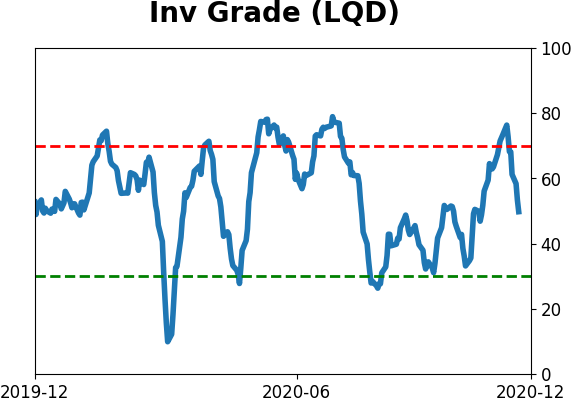
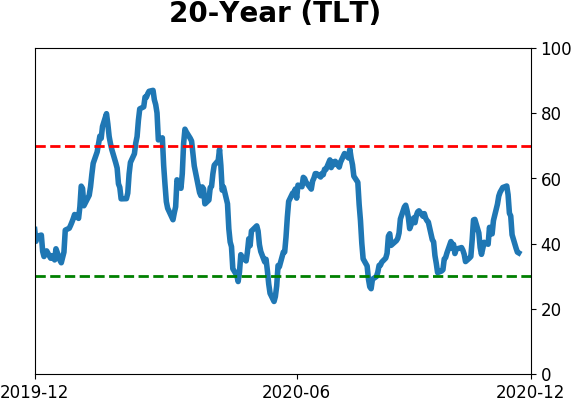
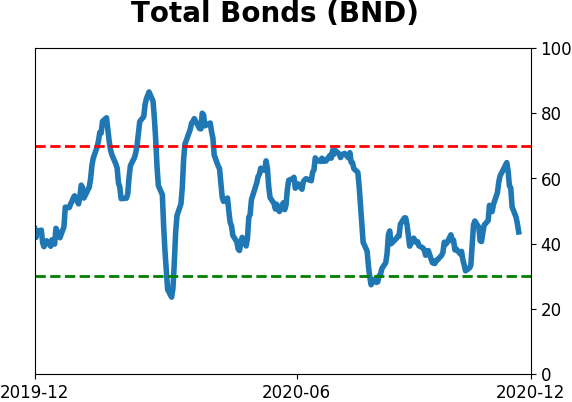
Bond ETF's - 10-Day Moving Average
|
|
|
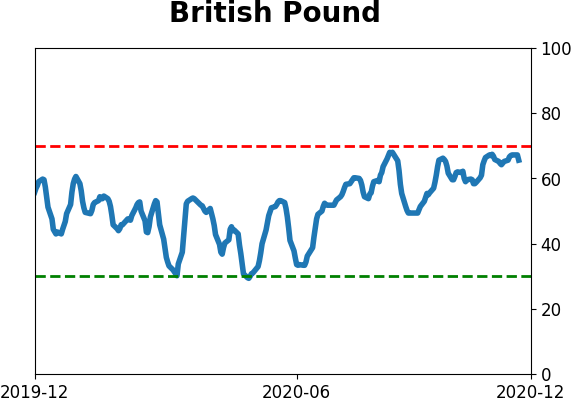
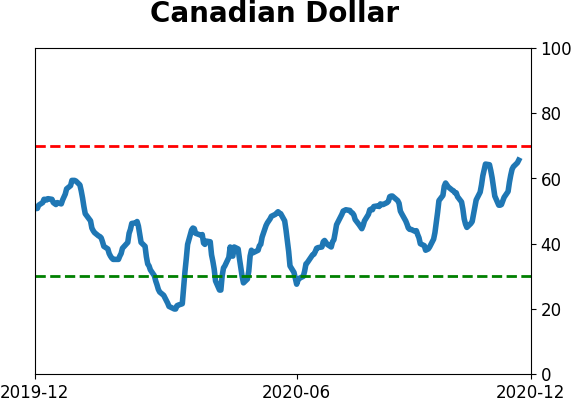
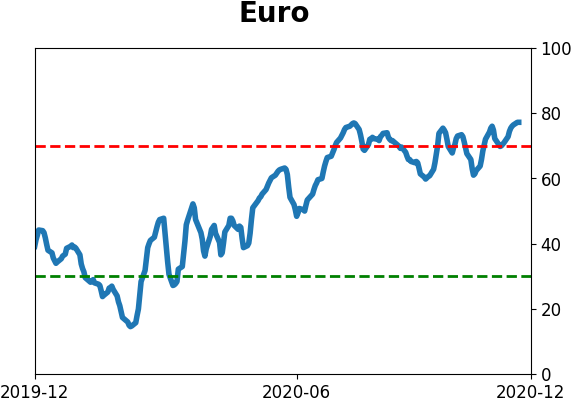
Currency ETF's - 5-Day Moving Average
|
|
|
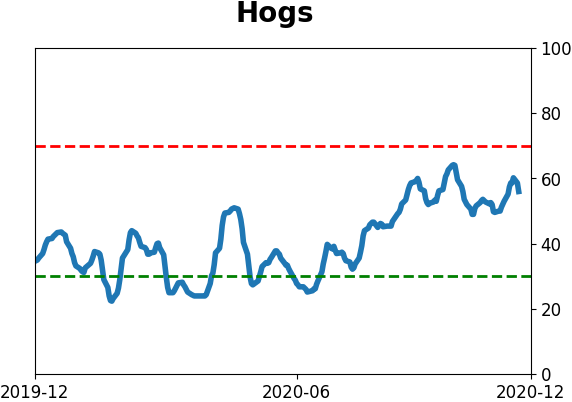
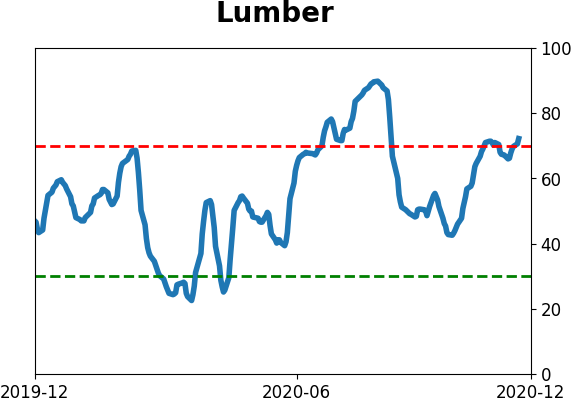
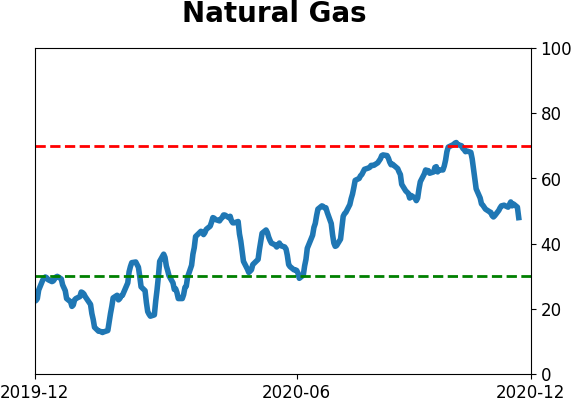
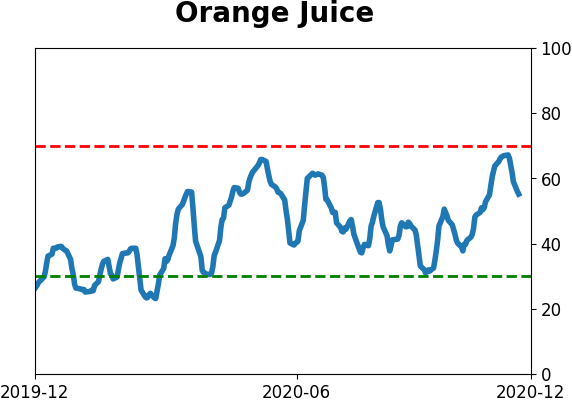
Commodity ETF's - 5-Day Moving Average
|
|