Headlines
|
|
Uptrends and records are the norm:
Almost all stocks in the S&P 500 are above their 200-day moving averages. All industries, sectors, and developed countries are, too. The index itself is historically stretched against its average, as all of the 'big four' indexes hit record highs together. This type of activity has usually preceded some short-term weakness.
Bottom Line:
- The market environment is pristine, but with near-historic optimism, gains tend to be muted, with a high probability of being reversed at some point over the ensuing weeks.
|
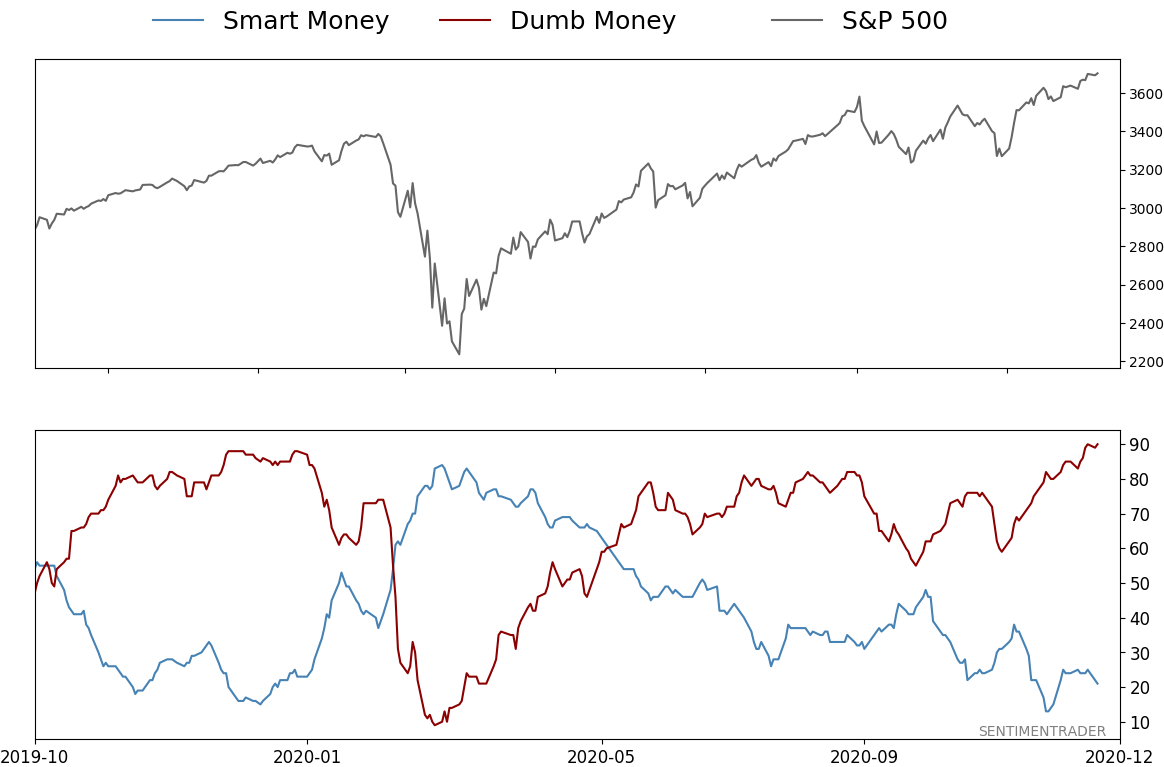
Smart / Dumb Money Confidence
|
Smart Money Confidence: 21%
Dumb Money Confidence: 90%
|
|
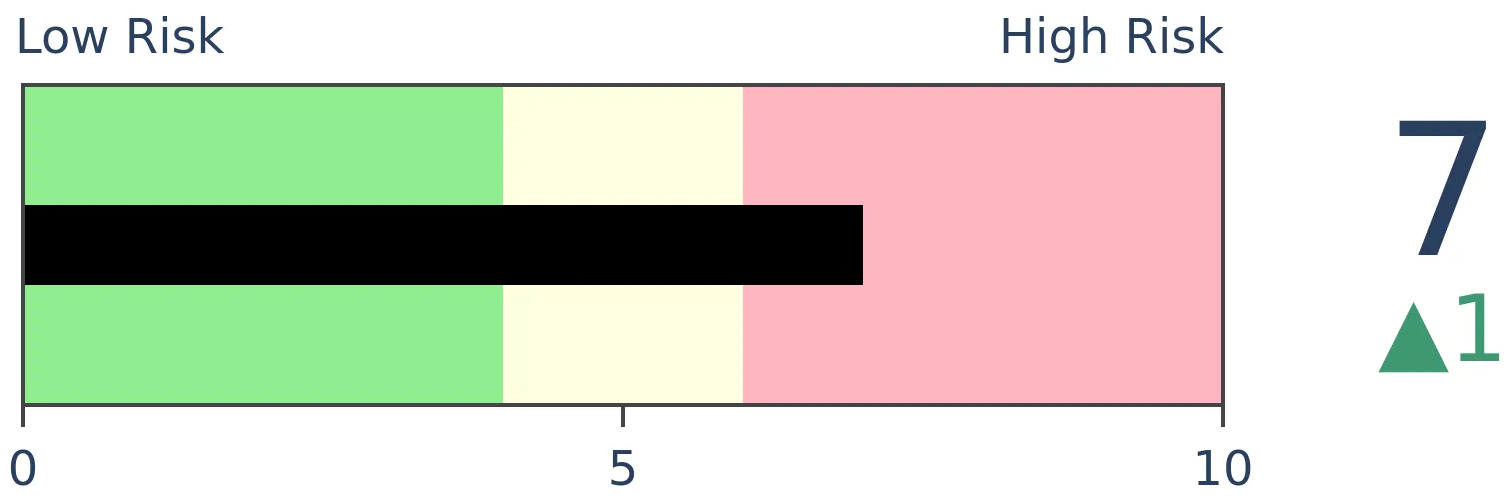
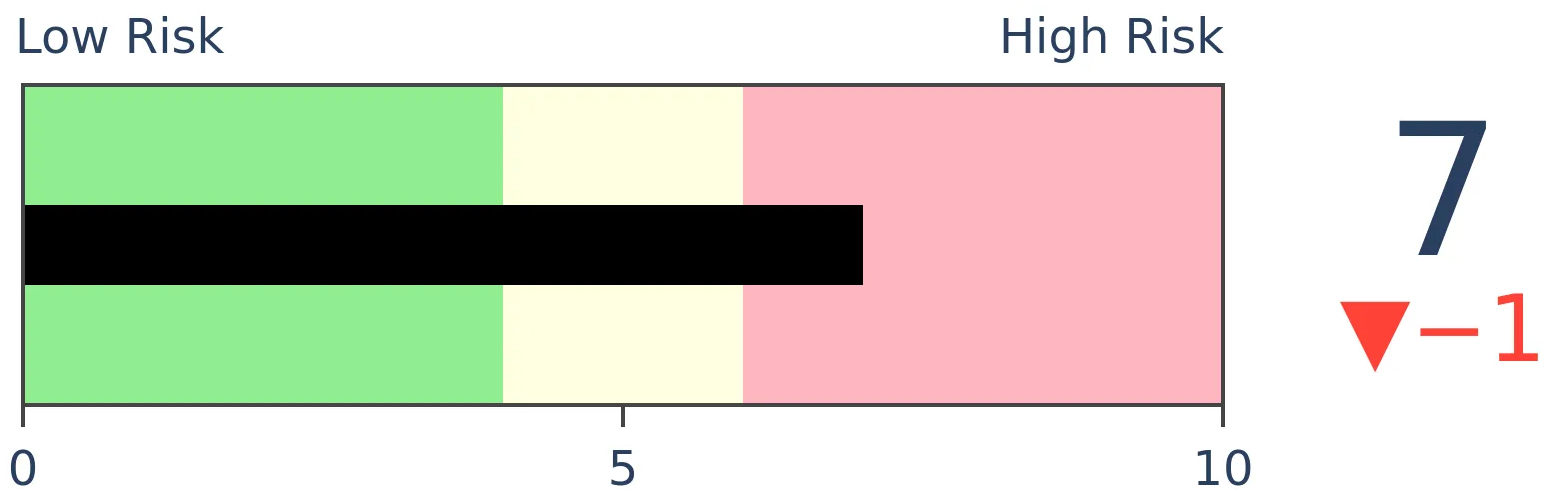
Risk Levels
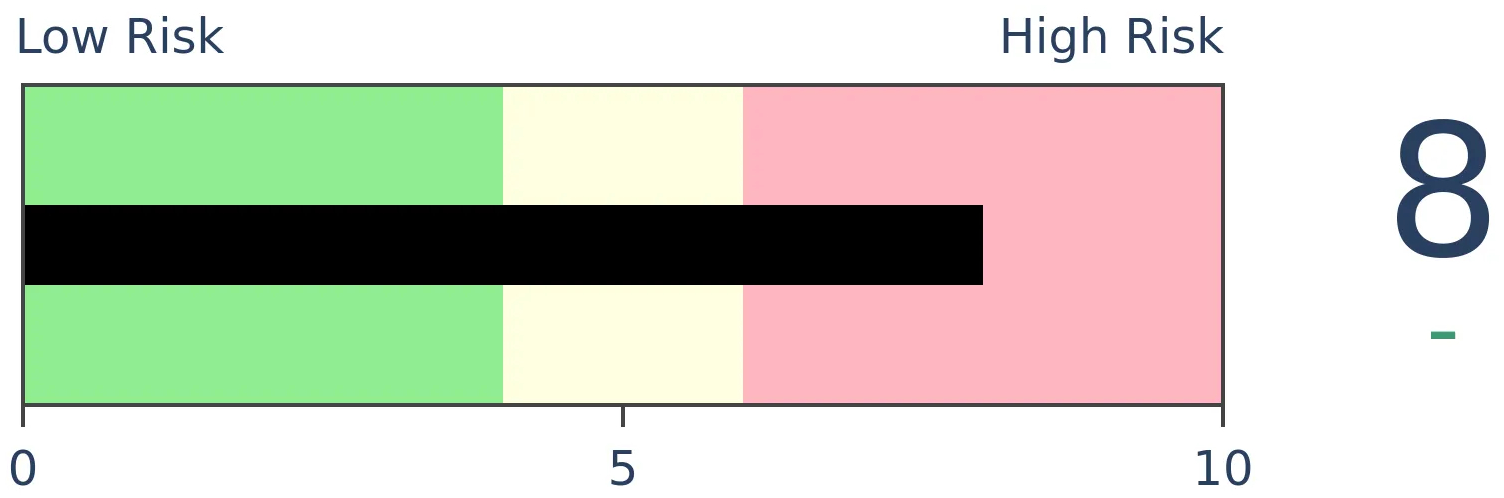
Stocks Short-Term
|
Stocks Medium-Term
|
|
Bonds
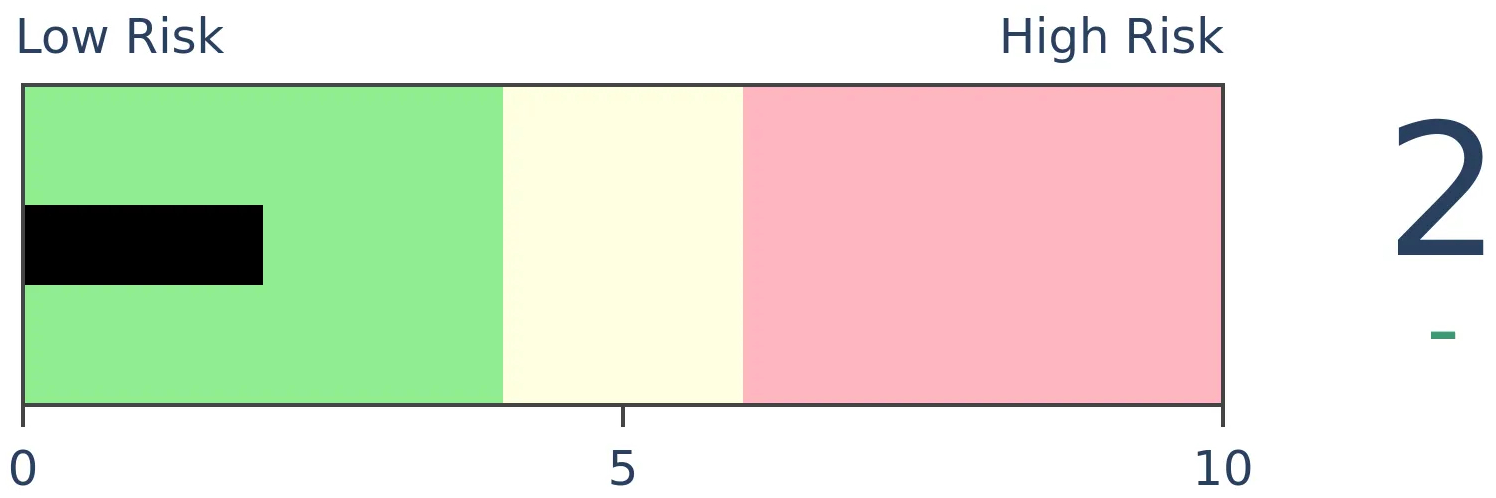
|
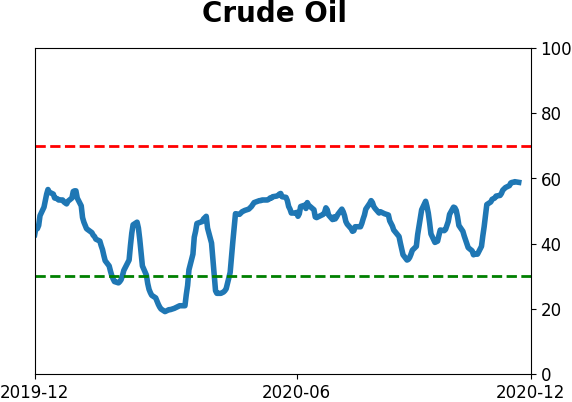
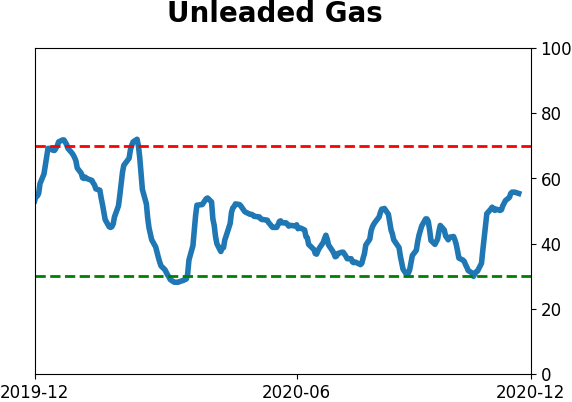
Crude Oil
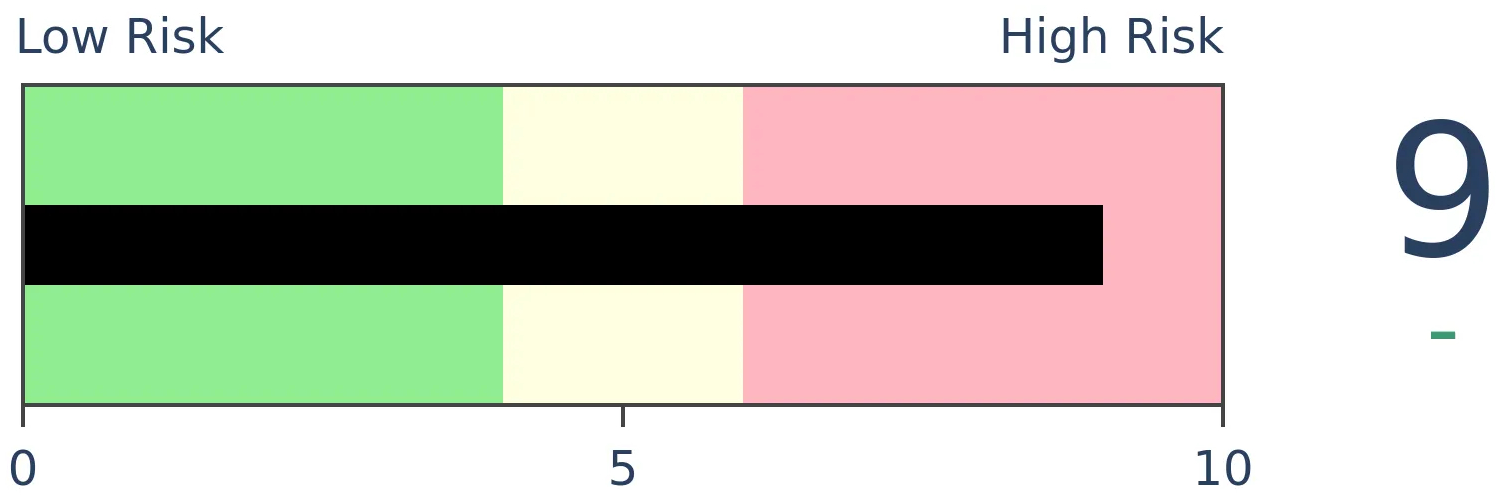
|
|
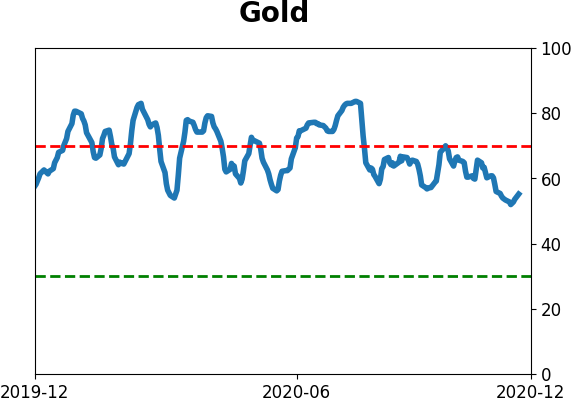
Gold
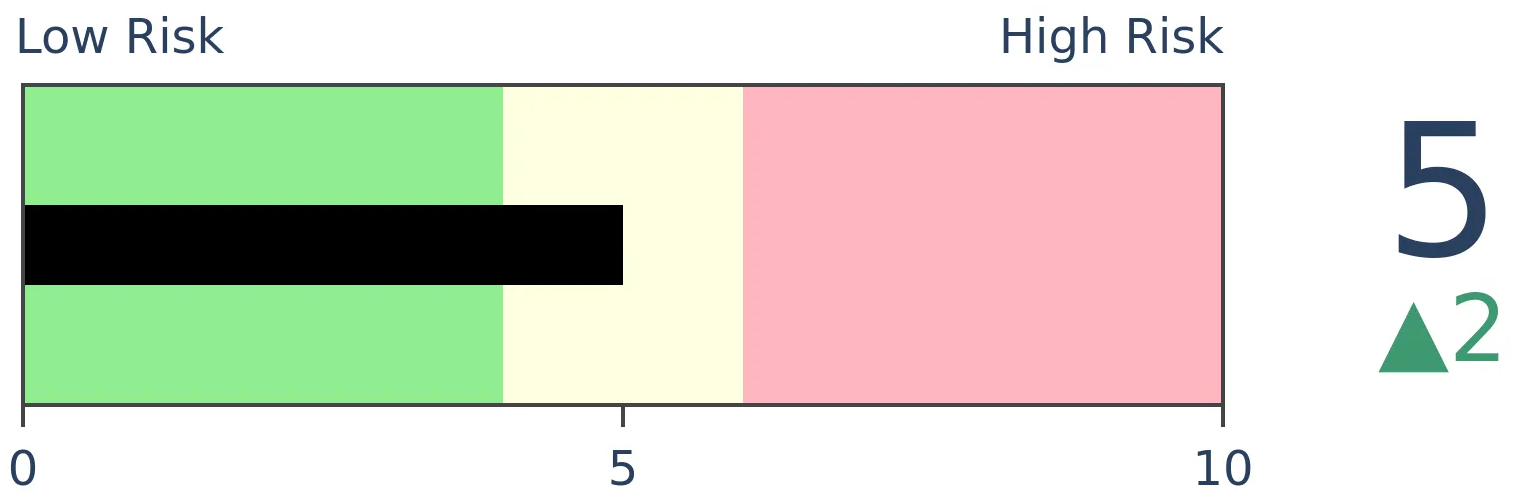
|
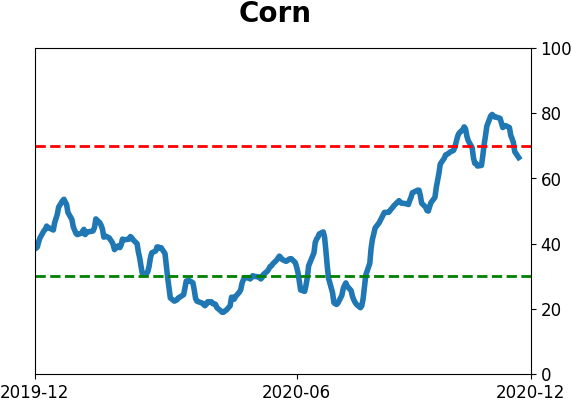
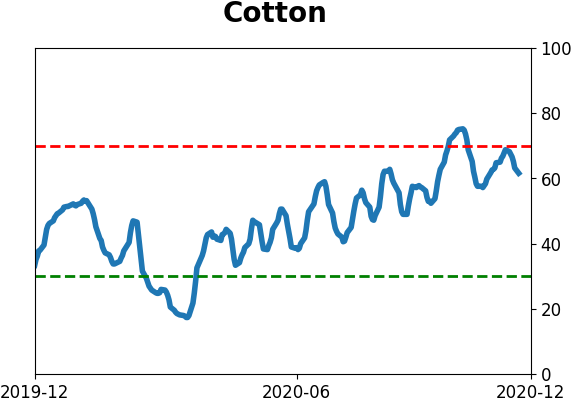
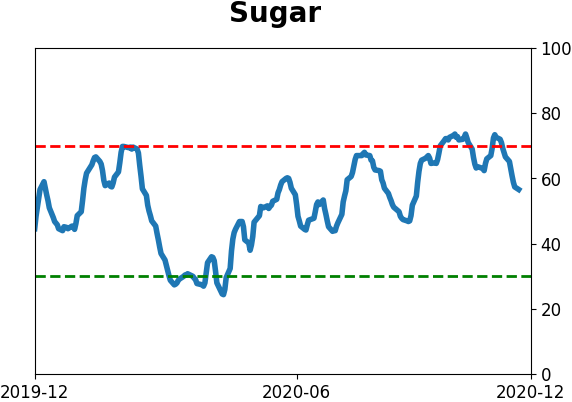
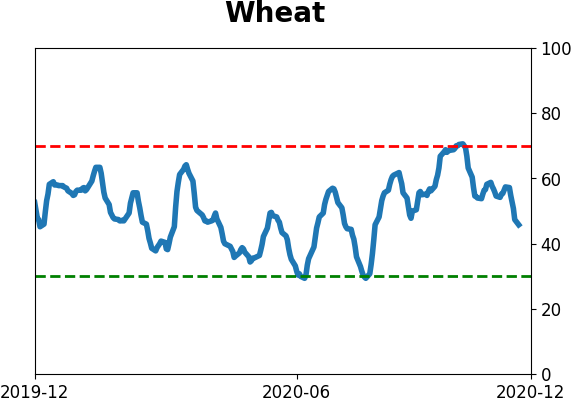
Agriculture
|
|
Research
BOTTOM LINE
Almost all stocks in the S&P 500 are above their 200-day moving averages. All industries, sectors, and developed countries are, too. The index itself is historically stretched against its average, as all of the 'big four' indexes hit record highs together. This type of activity has usually preceded some short-term weakness.
FORECAST / TIMEFRAME
SPY -- Down, Short-Term
|
Throughout October and into November, we looked at the thrusts and breadth of buying interest. It was some of the best we've ever seen, and that was on the heels of near record-shattering positive breadth in April and May. The past 8 months have witnessed arguably the most impressively broad - and intense - market rally in history.
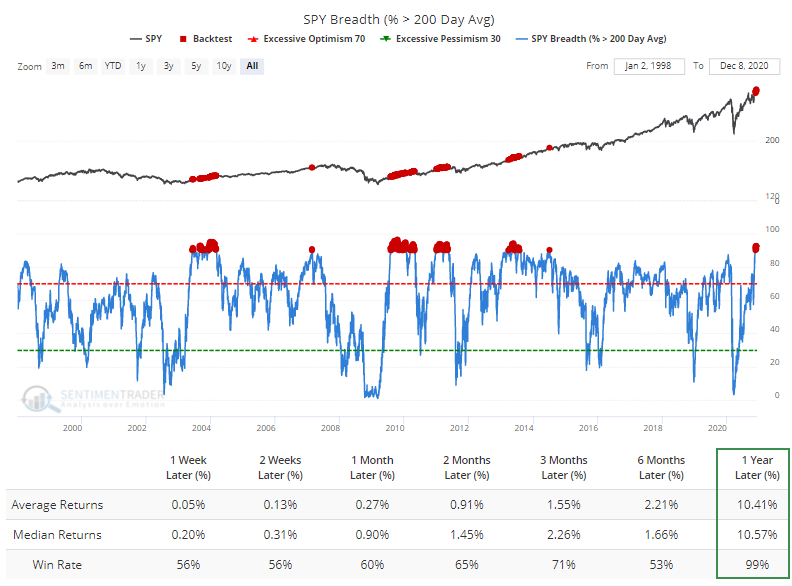
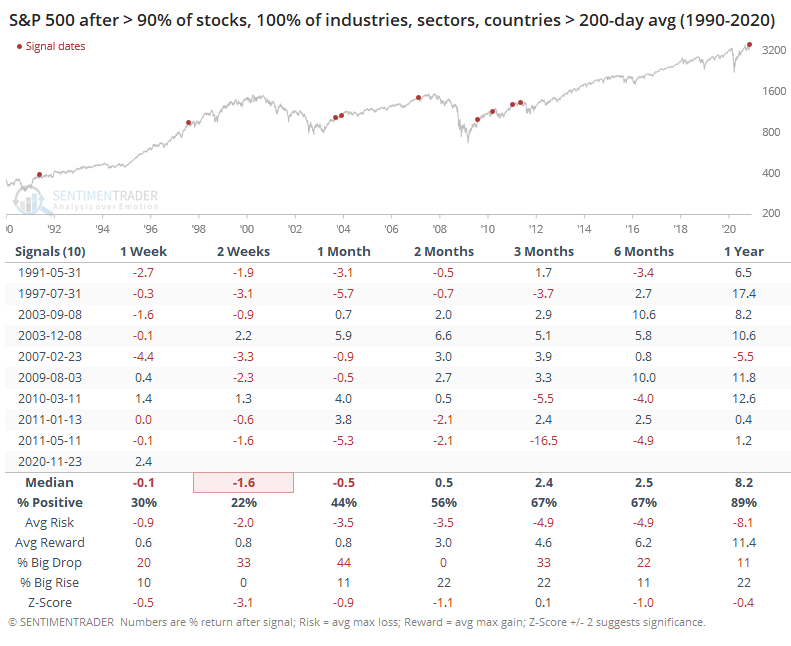
As a result of that and follow through into December, almost every stock in the S&P 500 is above its 200-day moving average. From the Backtest Engine, we can see that the S&P's shorter-term returns were mediocre when more than 90% of stocks were in uptrends, but a year later, 339 out of 341 days showed a positive return (the negative ones were both less than -3.75%).
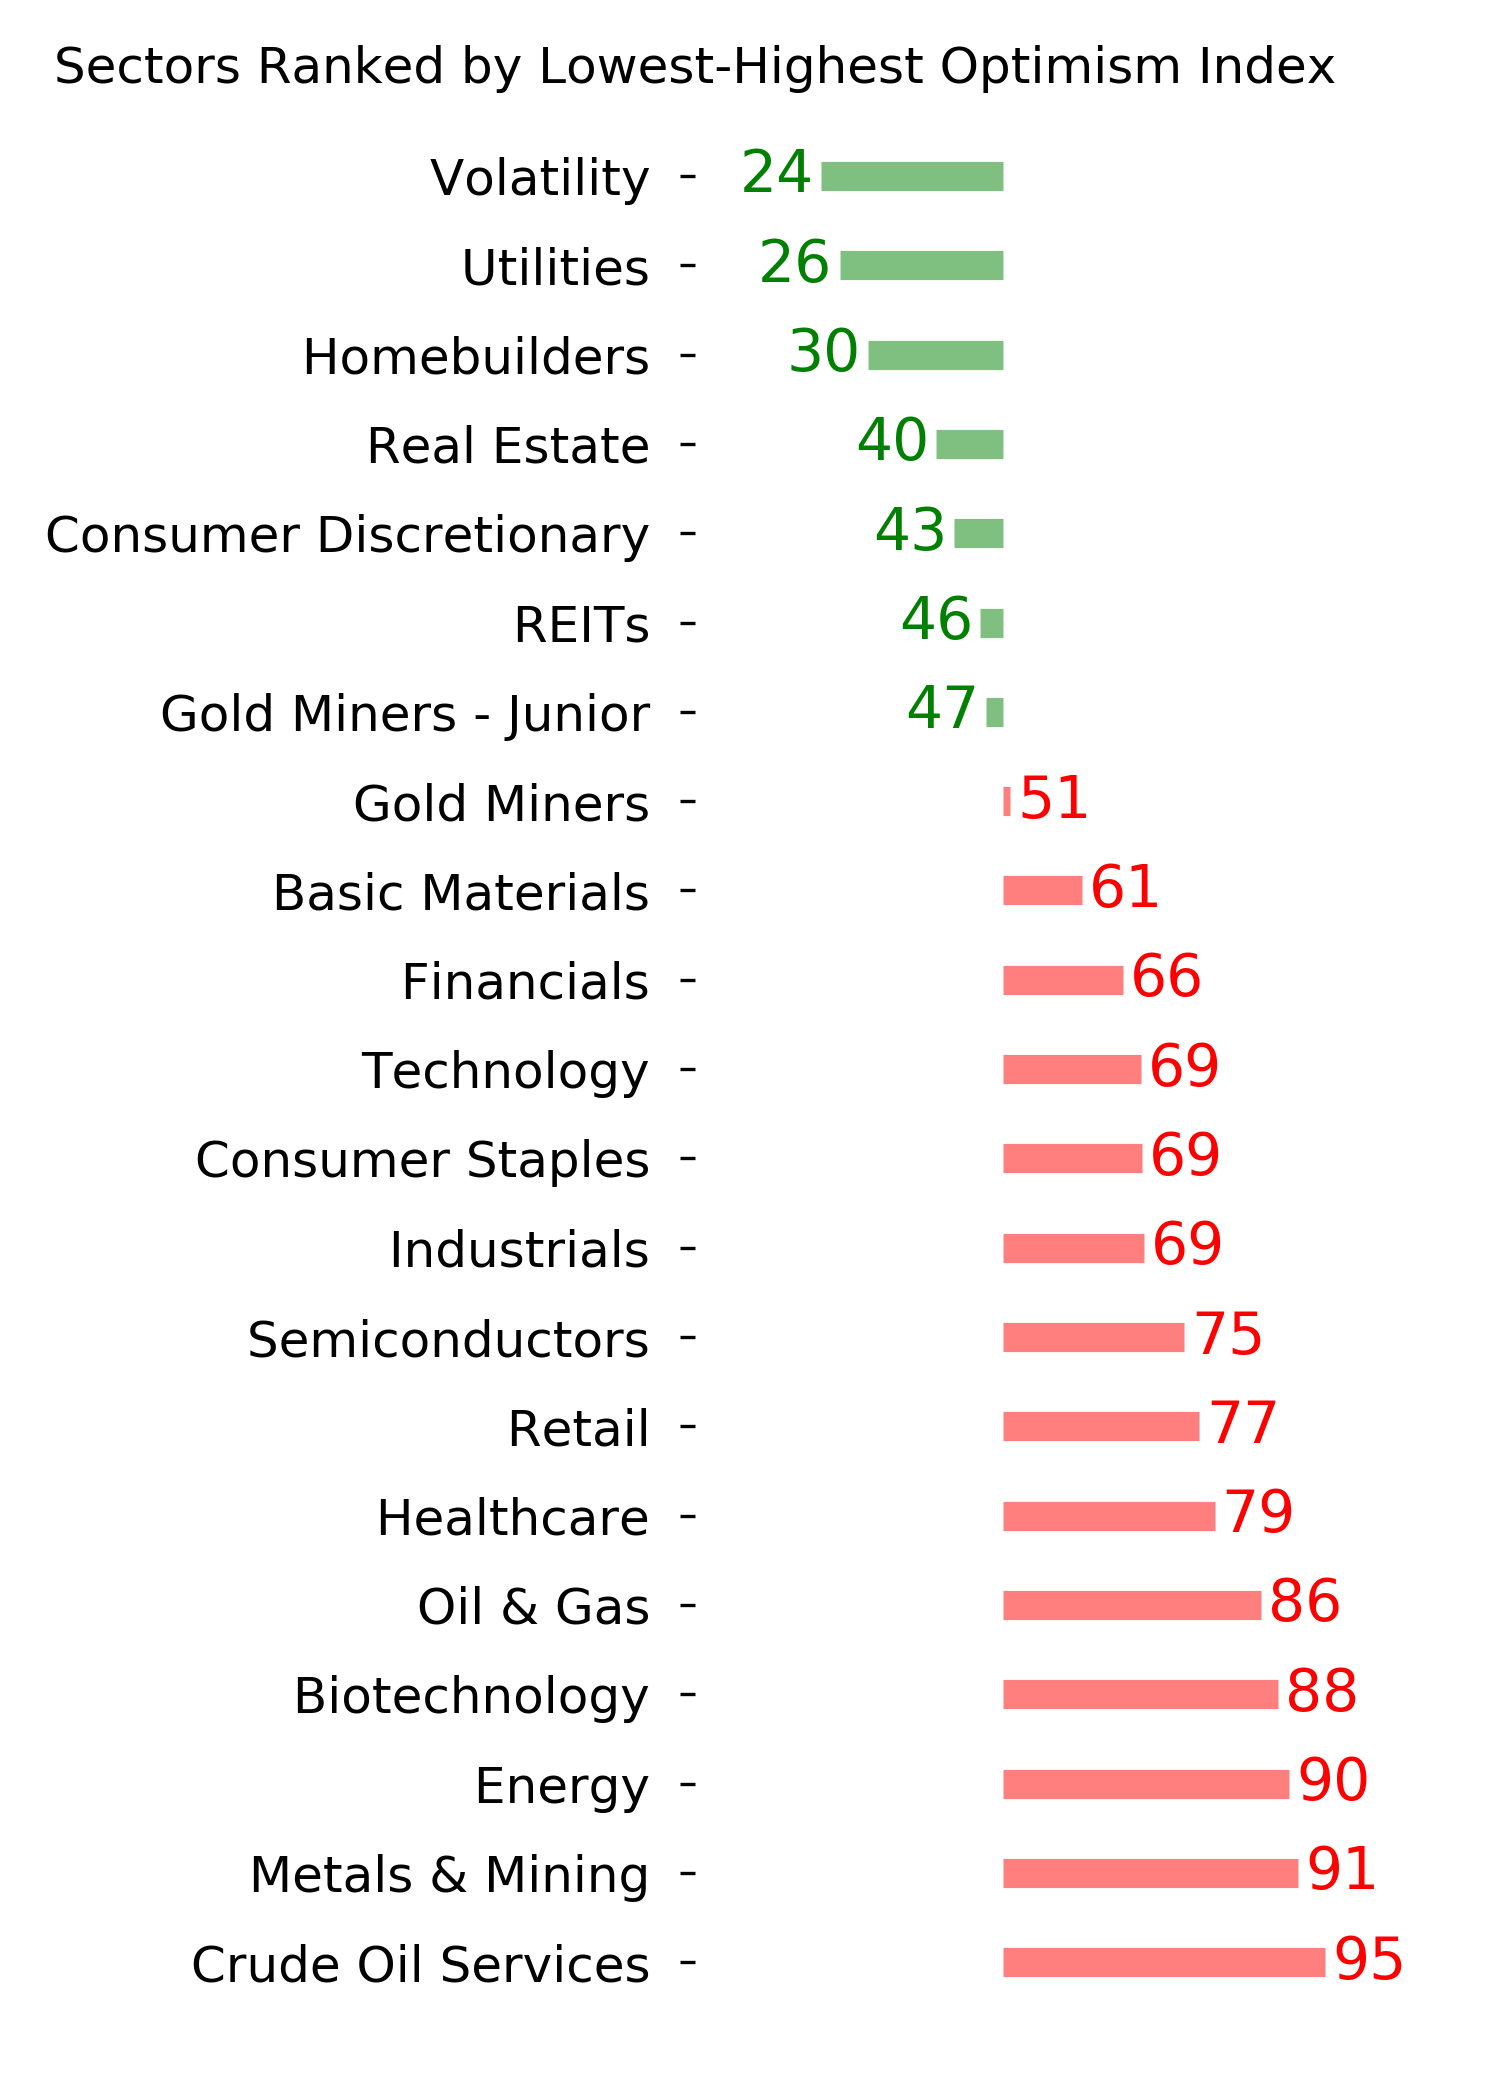
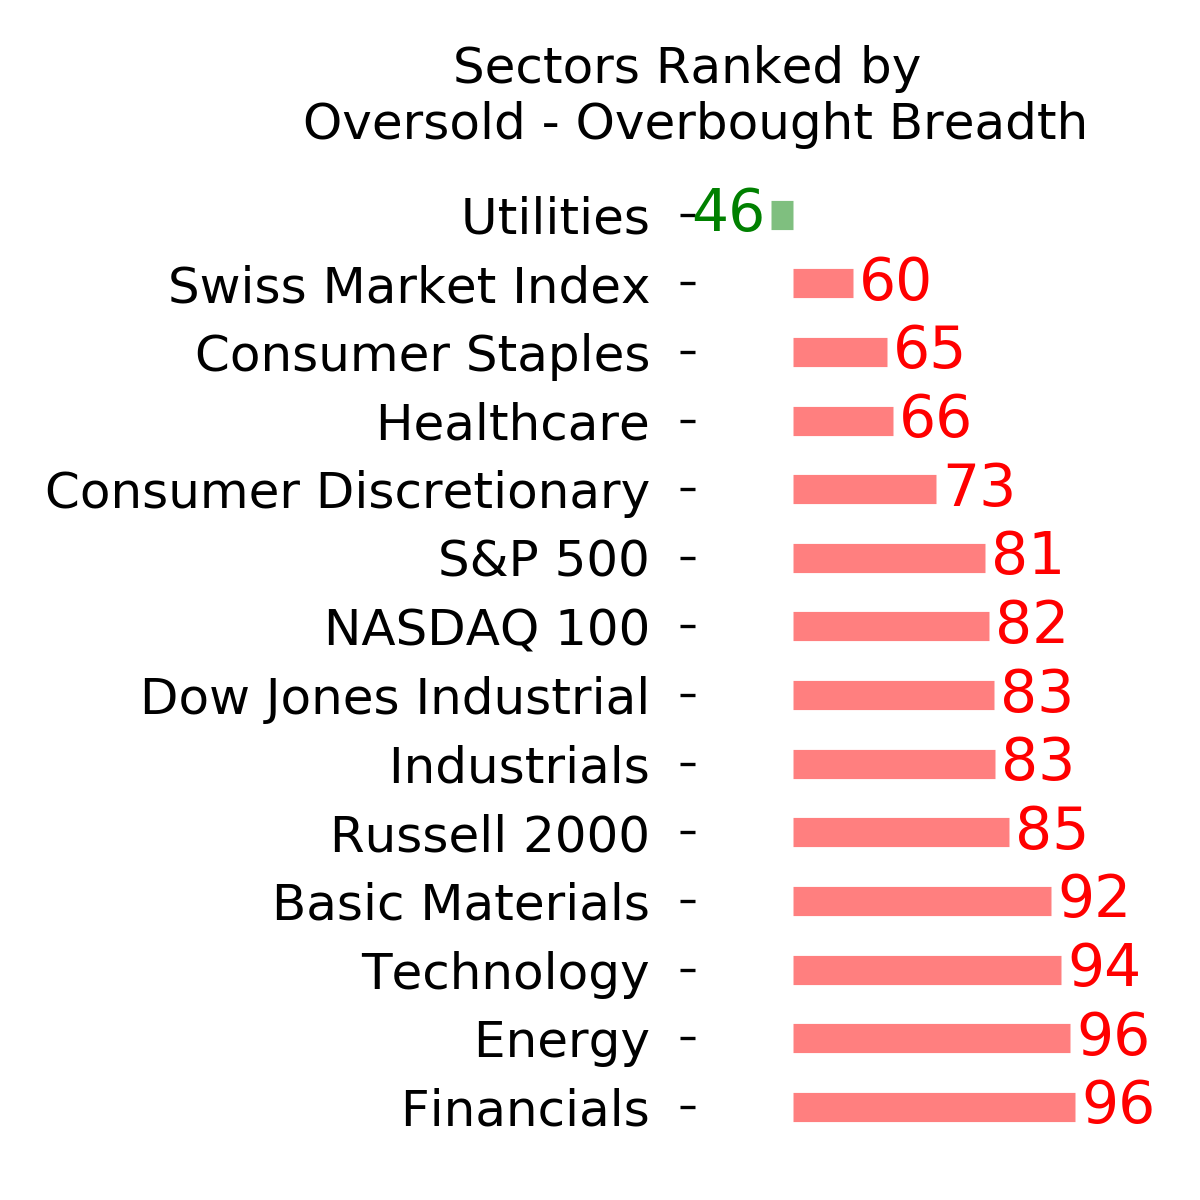
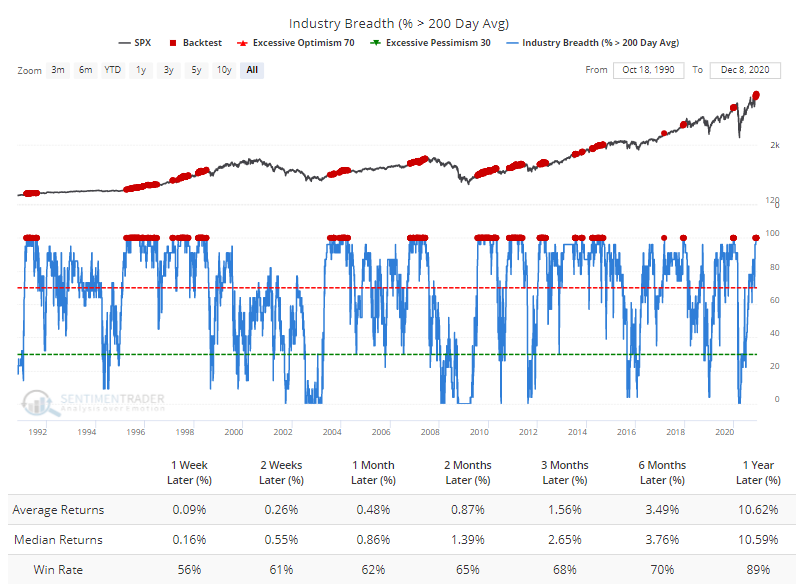
With so many stocks in uptrends, it stands to reason that most industries would be as well. And in recent weeks, that has been the case, with 100% of them above their 200-day averages, which has also led to mostly positive forward returns. The same goes for major sectors.
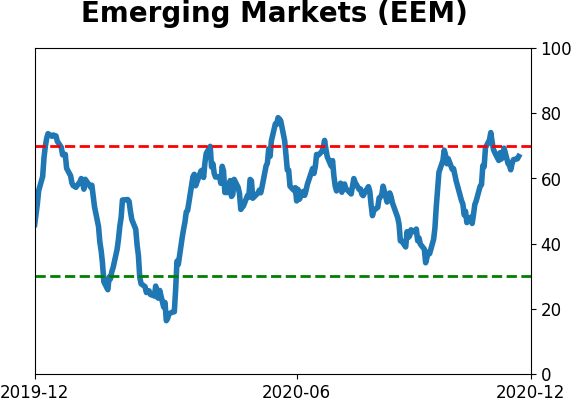
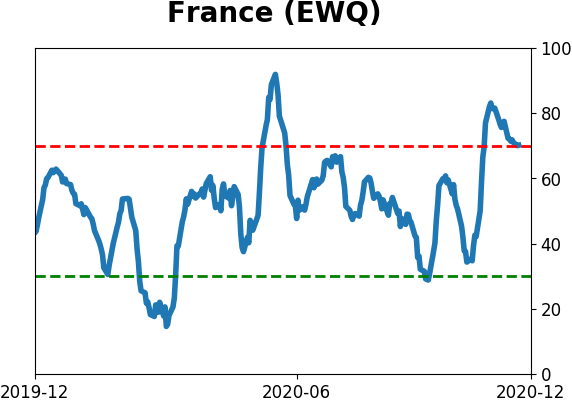
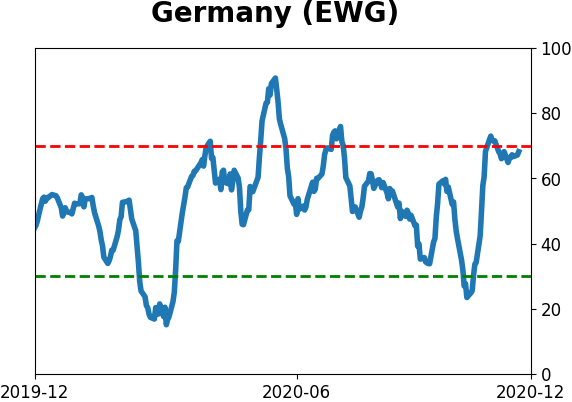
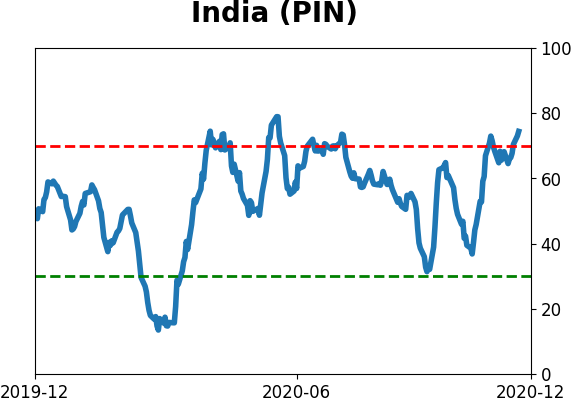
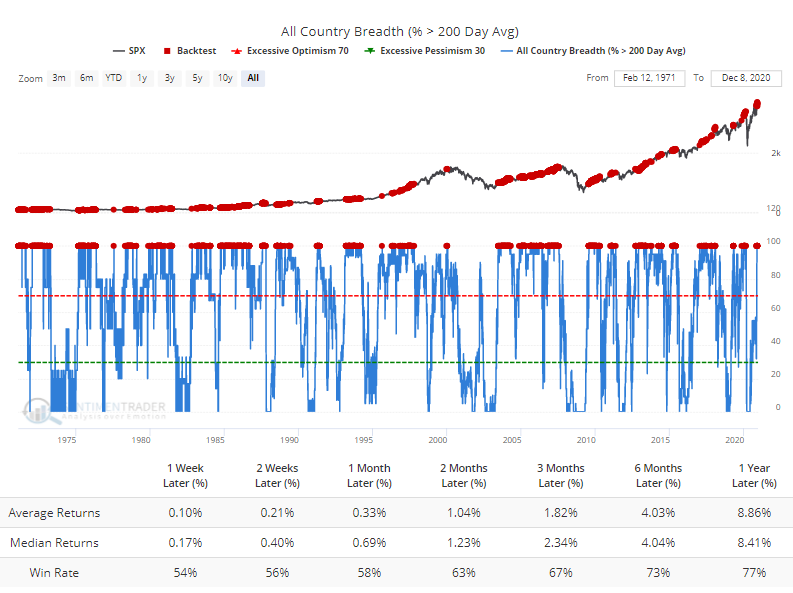
The rally has broadened out across the globe, with all major global equity indexes also in uptrends. Over the past 50 years, that's something we generally only see during sustainably healthy markets, though returns were only about in line with random.
Taken altogether, when we've seen this type of particpation before, stocks in the U.S. have stumbled over the short-term as overbought conditions wore off. Over the next year, however, the S&P 500 was higher after 9 out of 10 signals.
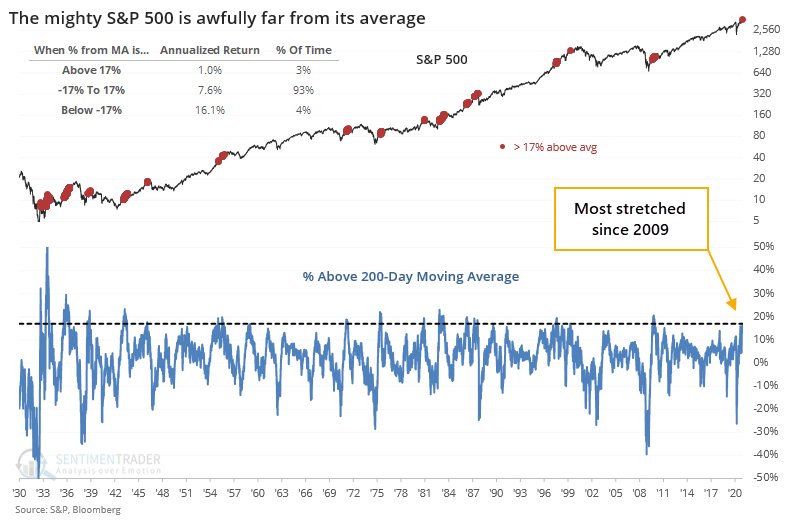
In terms of price action in the S&P 500 index itself, Urban Carmel and others have pointed out that the index is 17% above its 200-day moving average. That's one of its most historically stretched readings and has led to a poor annualized return of only +1.0%.
Below, we can see a signal-based approach, considering only the first time it exceeded its average by more than 17% for the first time in at least a year.
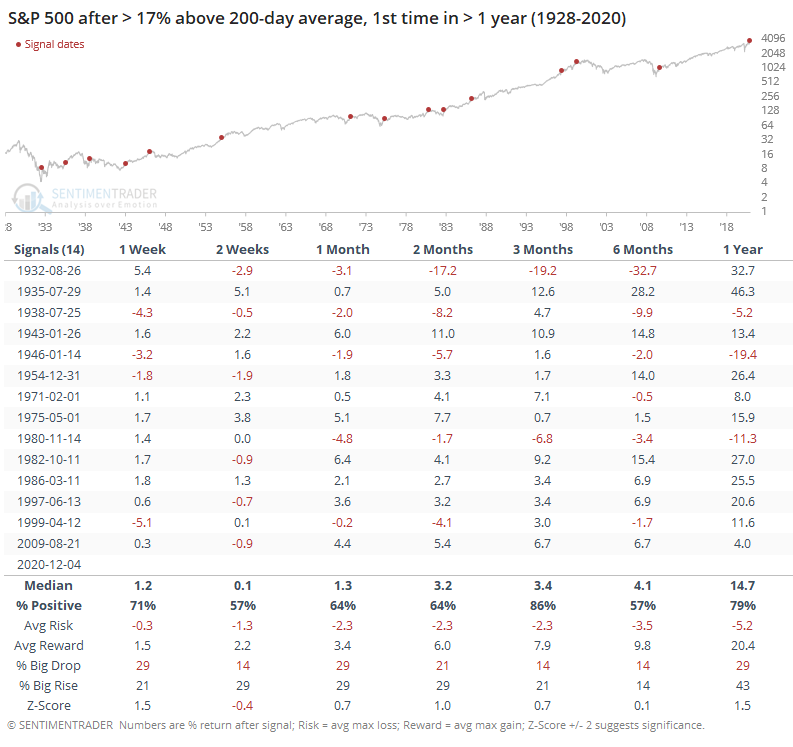
This led to an almost immediate and nasty decline in 1932. Other than that, it preceded mostly good returns over the medium- to long-term. Outside of that signal in '32, the S&P showed a positive return 3 months later after 12 out of 13 instances.
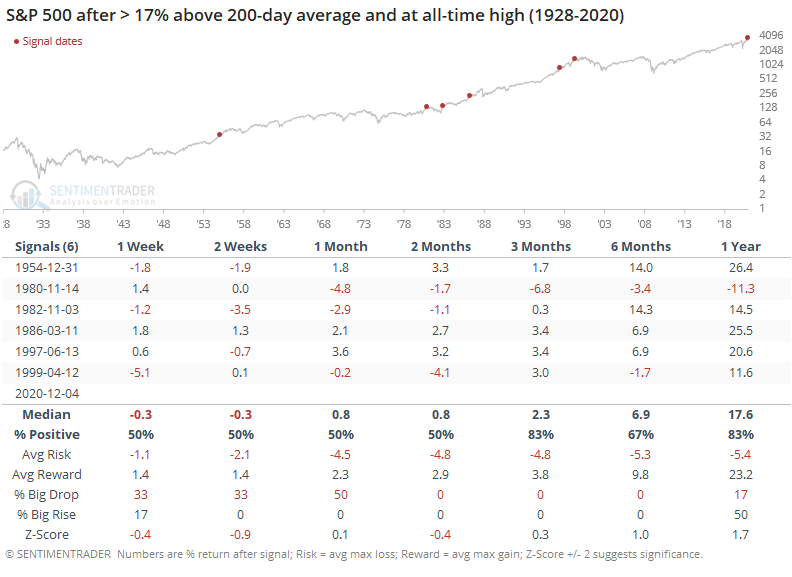
If the S&P was also at an all-time high when it became this stretched, then there was still some shorter-term sketchiness but almost all gains over the next 3-12 months. Overbought doesn't have to be a bad thing.
It's not just the S&P that's rallying, which we know from the broad improvement in breadth. All of the major indexes have been doing well.
In June, we saw that when the "big four" equity indexes (S&P 500, Dow Industrials, Nasdaq Composite, and Russell 2000) all recovered at least 75% of a decline, it has preceded higher prices over the next year every time. With the rally into last week's close, all four managed to also close at an all-time high. This is the first time in at least a year that all of them did so on the same day.
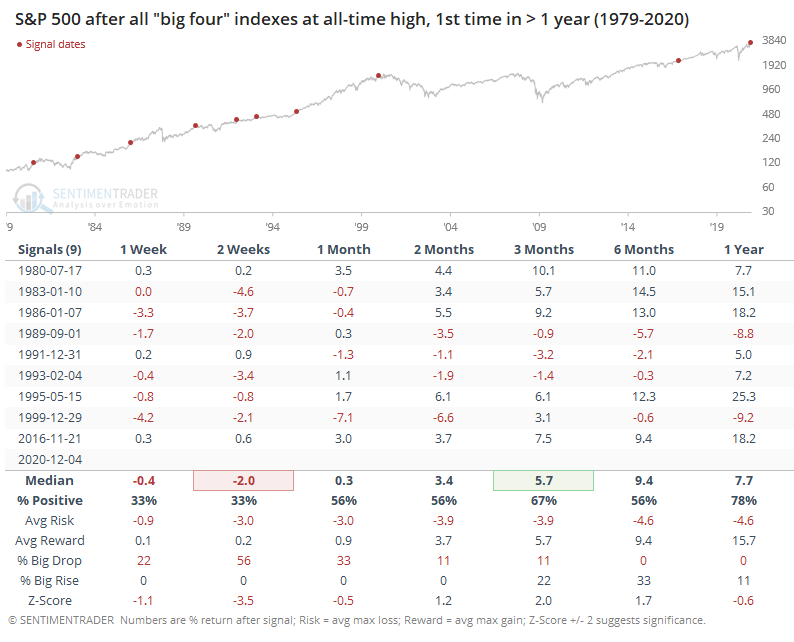
Again, this kind of behavior has typically led to weak returns over the next 1-2 weeks, and mostly strength in the months ahead. Over the next 3 months, the S&P was higher 6 out of 9 times, and the losses were relatively small. The probability of a big drop outweighed that of a big rise in the short-term, then that flipped over the medium- to long-term.
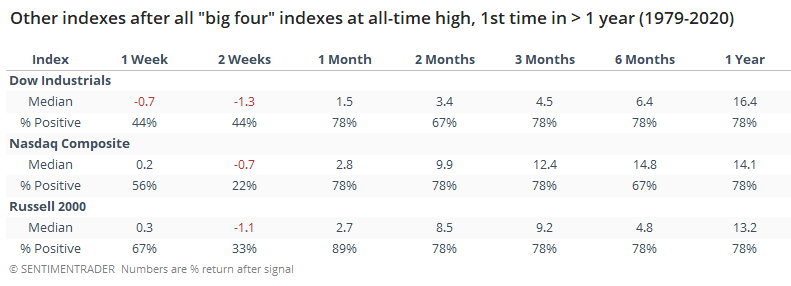
Among the other indexes, the Nasdaq suffered a bit more shorter-term, but also showed the largest medium- to long-term gains, as befits a higher-beta index.
The type of buying interest investors have shown in stocks since October has an impressive track record of showing upside follow-through over a time frame of 3 months and beyond. On a shorter-term basis, the "overbought" nature of the price action has typically been more of a factor. That's especially concerning now given the record-high confidence that investors are displaying. This suggests that the risks to investors is high over a multi-day to multi-week time frame.
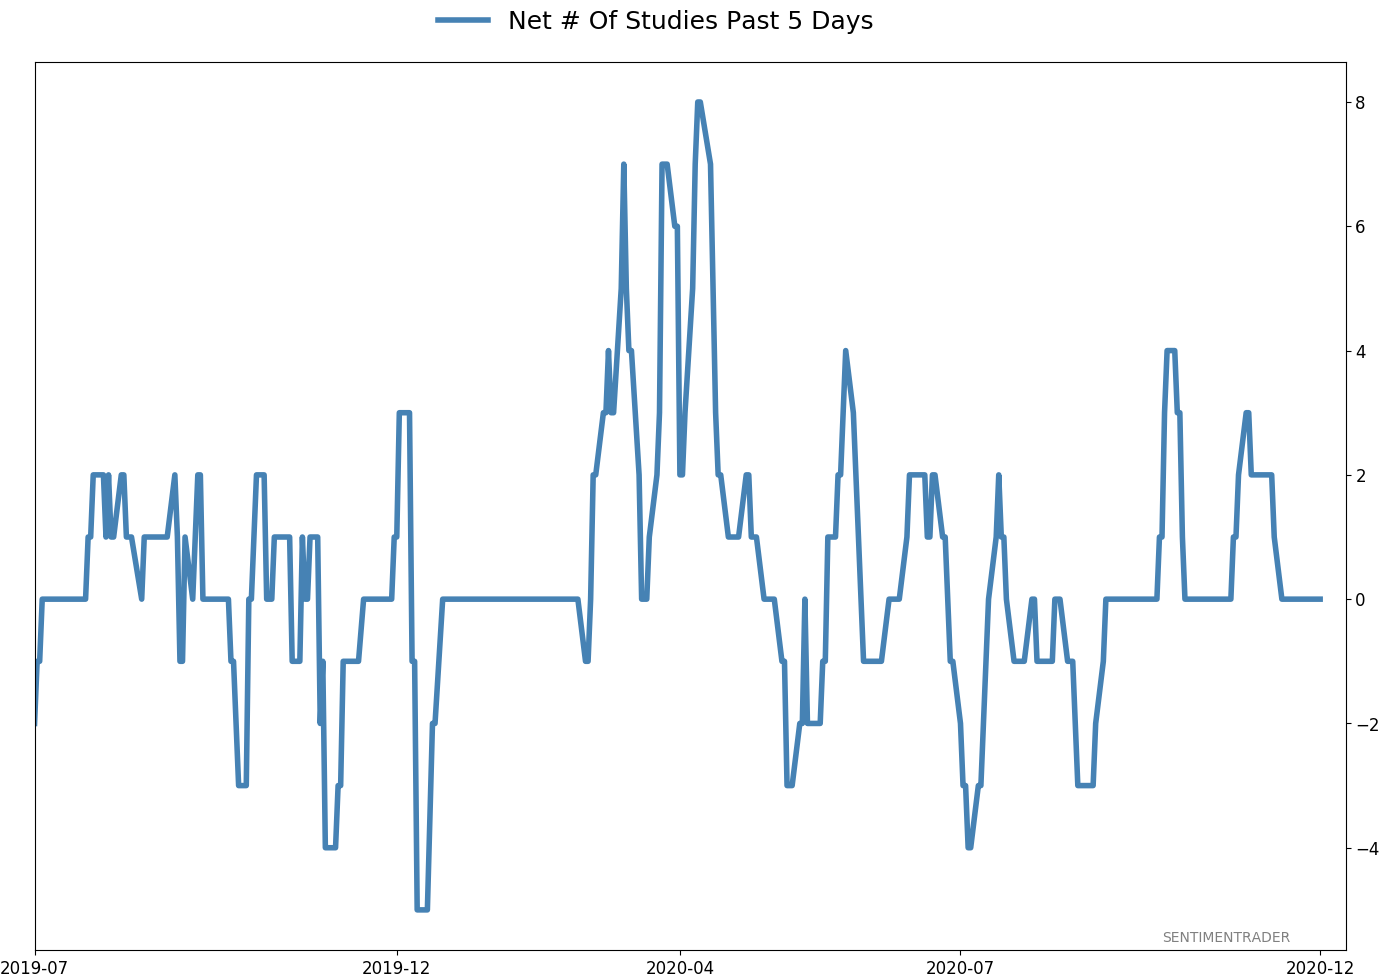
Active Studies
| Time Frame | Bullish | Bearish | | Short-Term | 0 | 1 | | Medium-Term | 5 | 8 | | Long-Term | 52 | 2 |
|
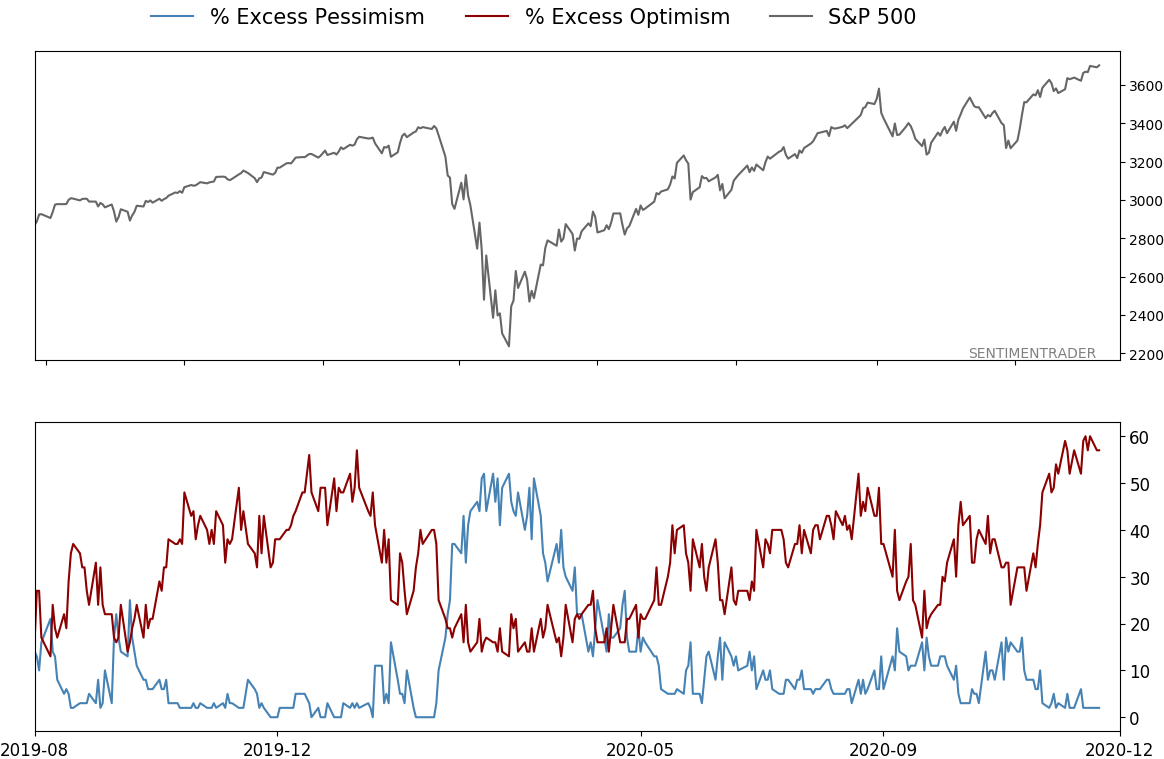
Indicators at Extremes
% Showing Pessimism: 2%
Bullish for Stocks
VIX
|
|
Portfolio
| Position | Description | Weight % | Added / Reduced | Date | | Stocks | 15.6% RSP, 10.1% VWO, 7.5% XLE, 5.1% PSCE | 41.2 | Added 5% | 2020-10-15 | | Bonds | 10% BND, 10% SCHP, 10% ANGL | 28.6 | Reduced 0.1% | 2020-10-02 | | Commodities | GCC | 2.4 | Reduced 2.1%
| 2020-09-04 | | Precious Metals | GDX | 9.5 | Added 4.8% | 2020-12-01 | | Special Situations | | 0.0 | Reduced 5% | 2020-10-02 | | Cash | | 18.3 | | |
|
Updates (Changes made today are underlined)
I've been quiet here because there hasn't been much to do. The things that were supposed to work have pretty much been doing so. With sentiment extremely stretched, I have no desire to add exposure there. About the only place I would add is energy, which has been following through exactly as it should. I did add back to my position in gold miners, due to the studies recently posted to the site. When gold (and miners) have pulled back after momentum like they enjoyed since March, the typical reaction is a resumption of the uptrend over the medium-term, and not a rollover into a bear phase. The continued weakness in the dollar certainly helps. RETURN YTD: 7.7% 2019: 12.6%, 2018: 0.6%, 2017: 3.8%, 2016: 17.1%, 2015: 9.2%, 2014: 14.5%, 2013: 2.2%, 2012: 10.8%, 2011: 16.5%, 2010: 15.3%, 2009: 23.9%, 2008: 16.2%, 2007: 7.8%
|
|
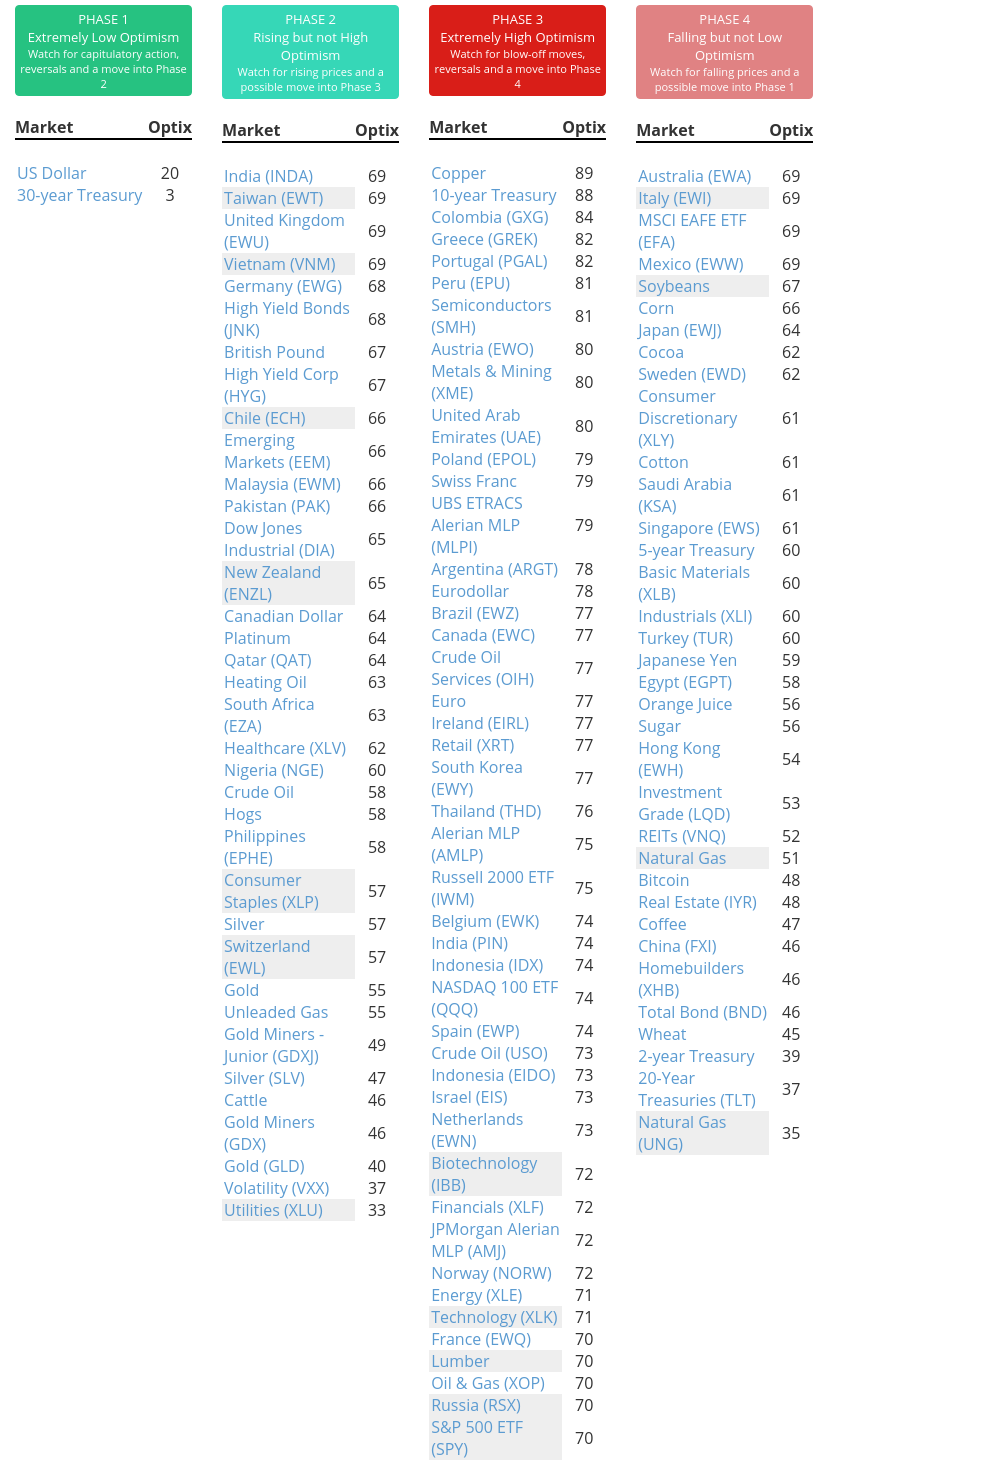
Phase Table
Ranks
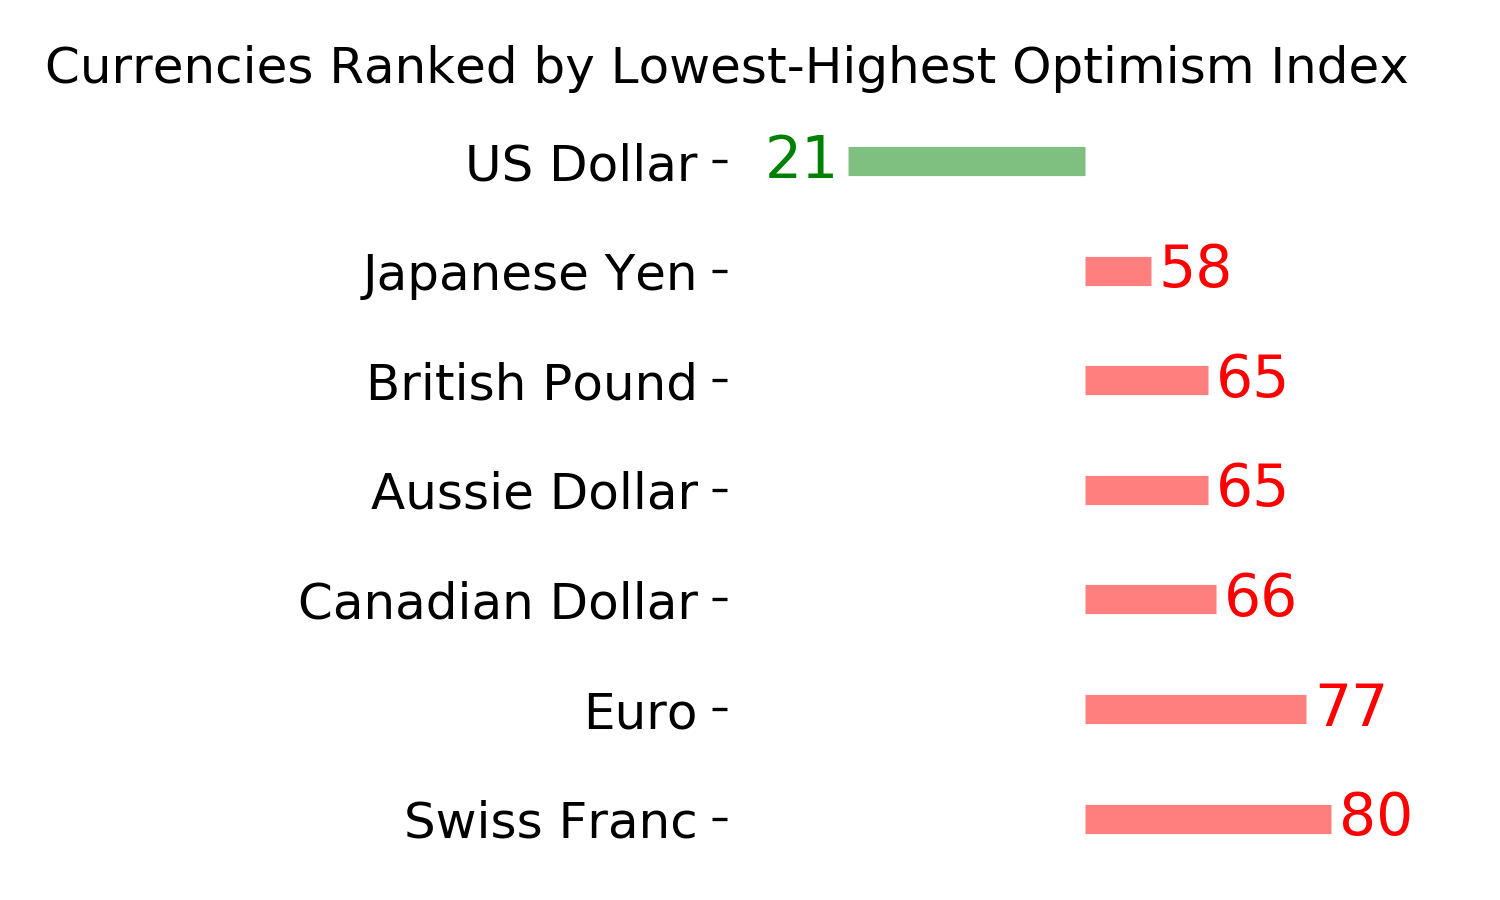
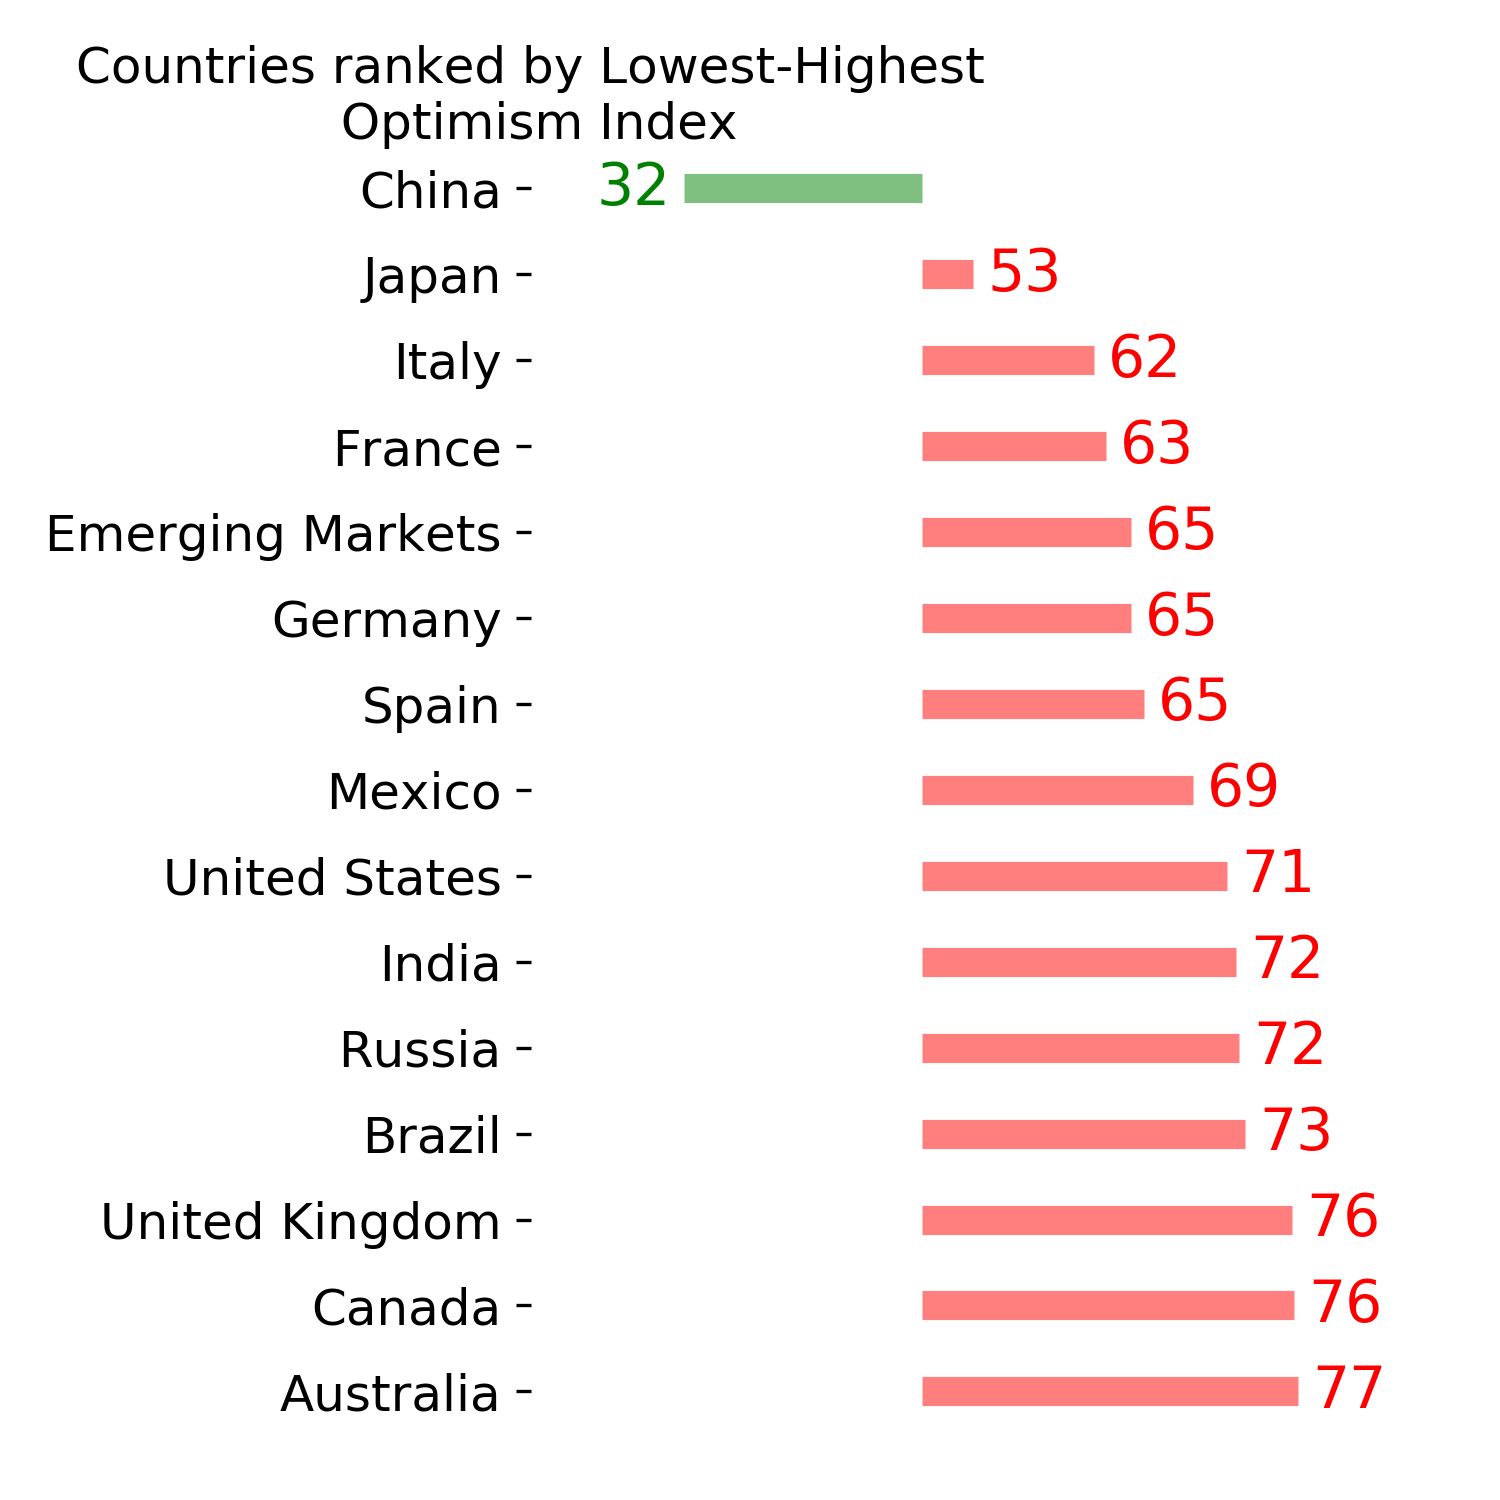
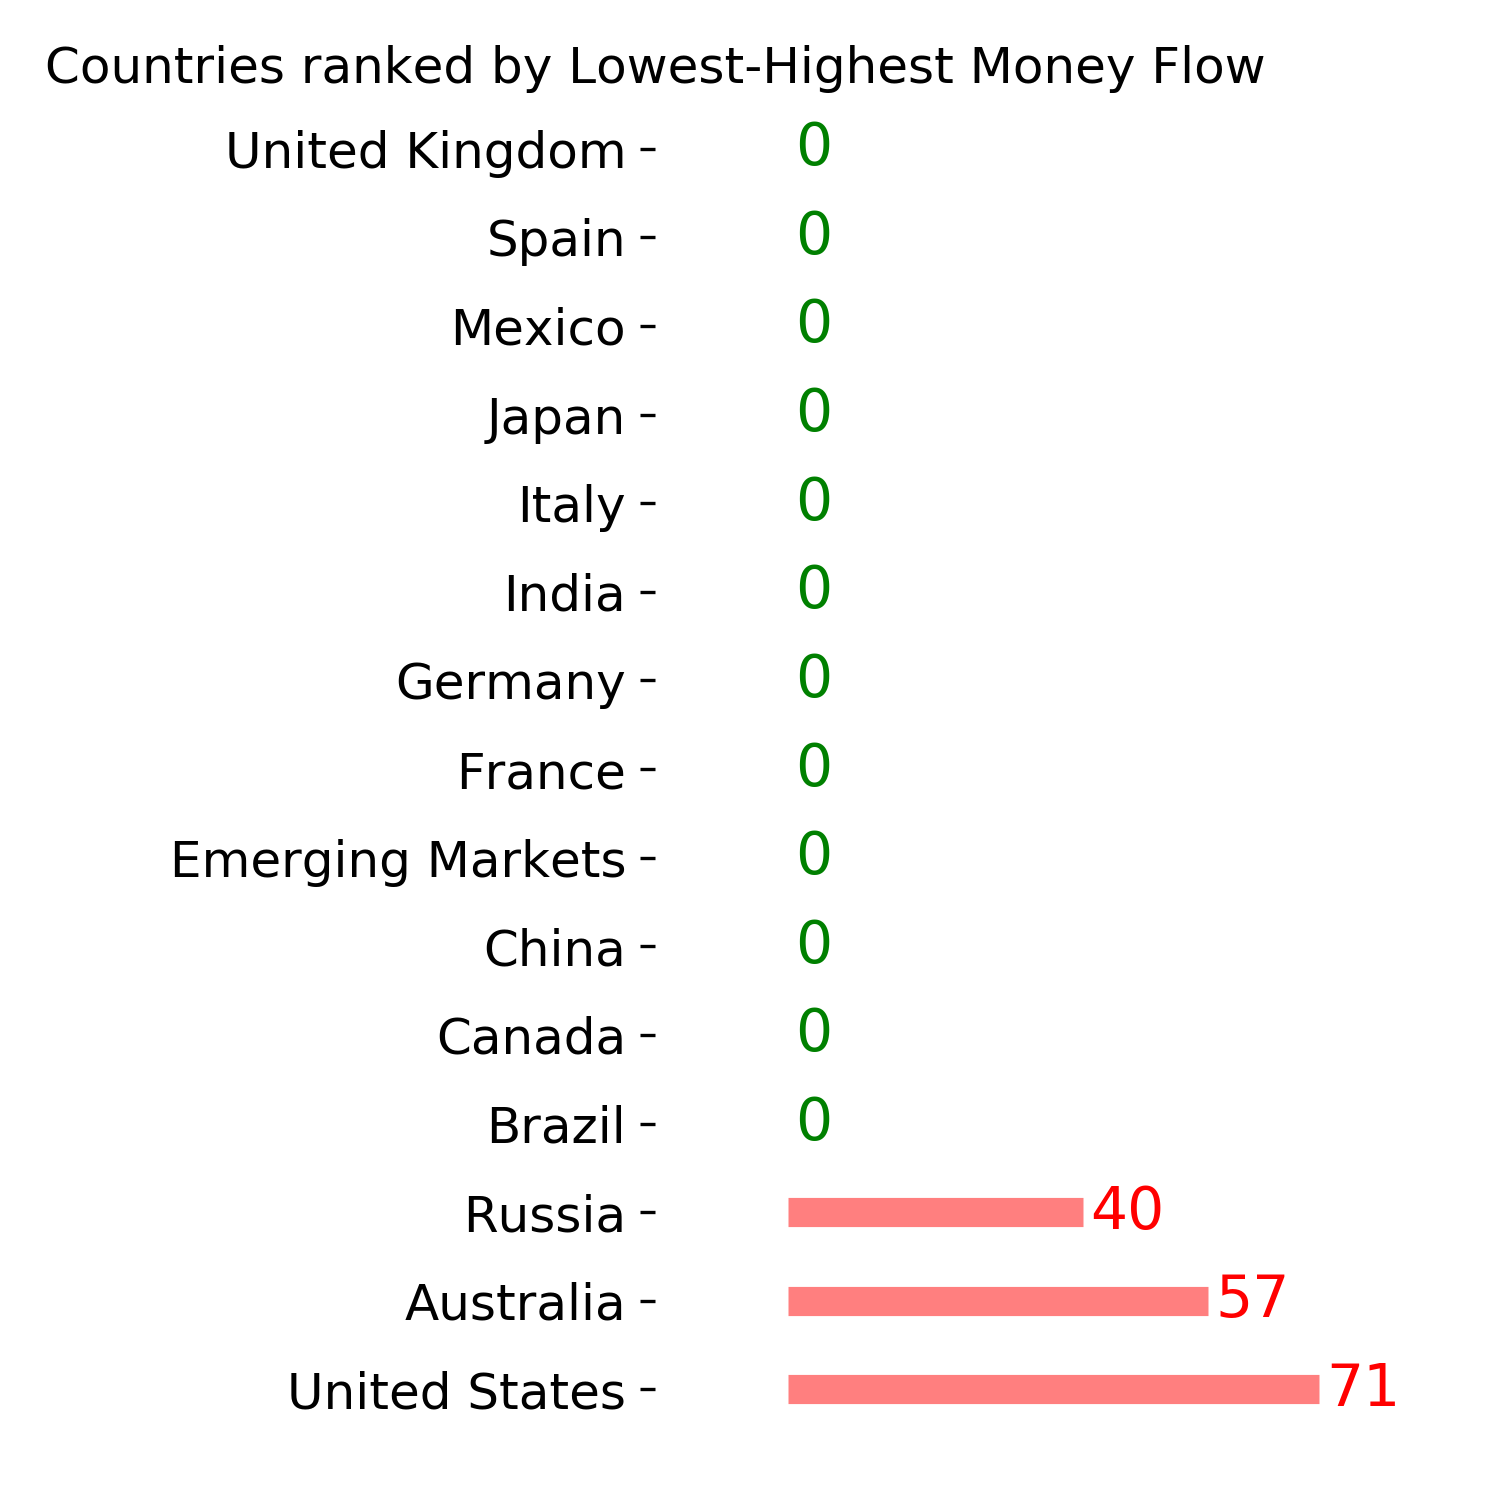
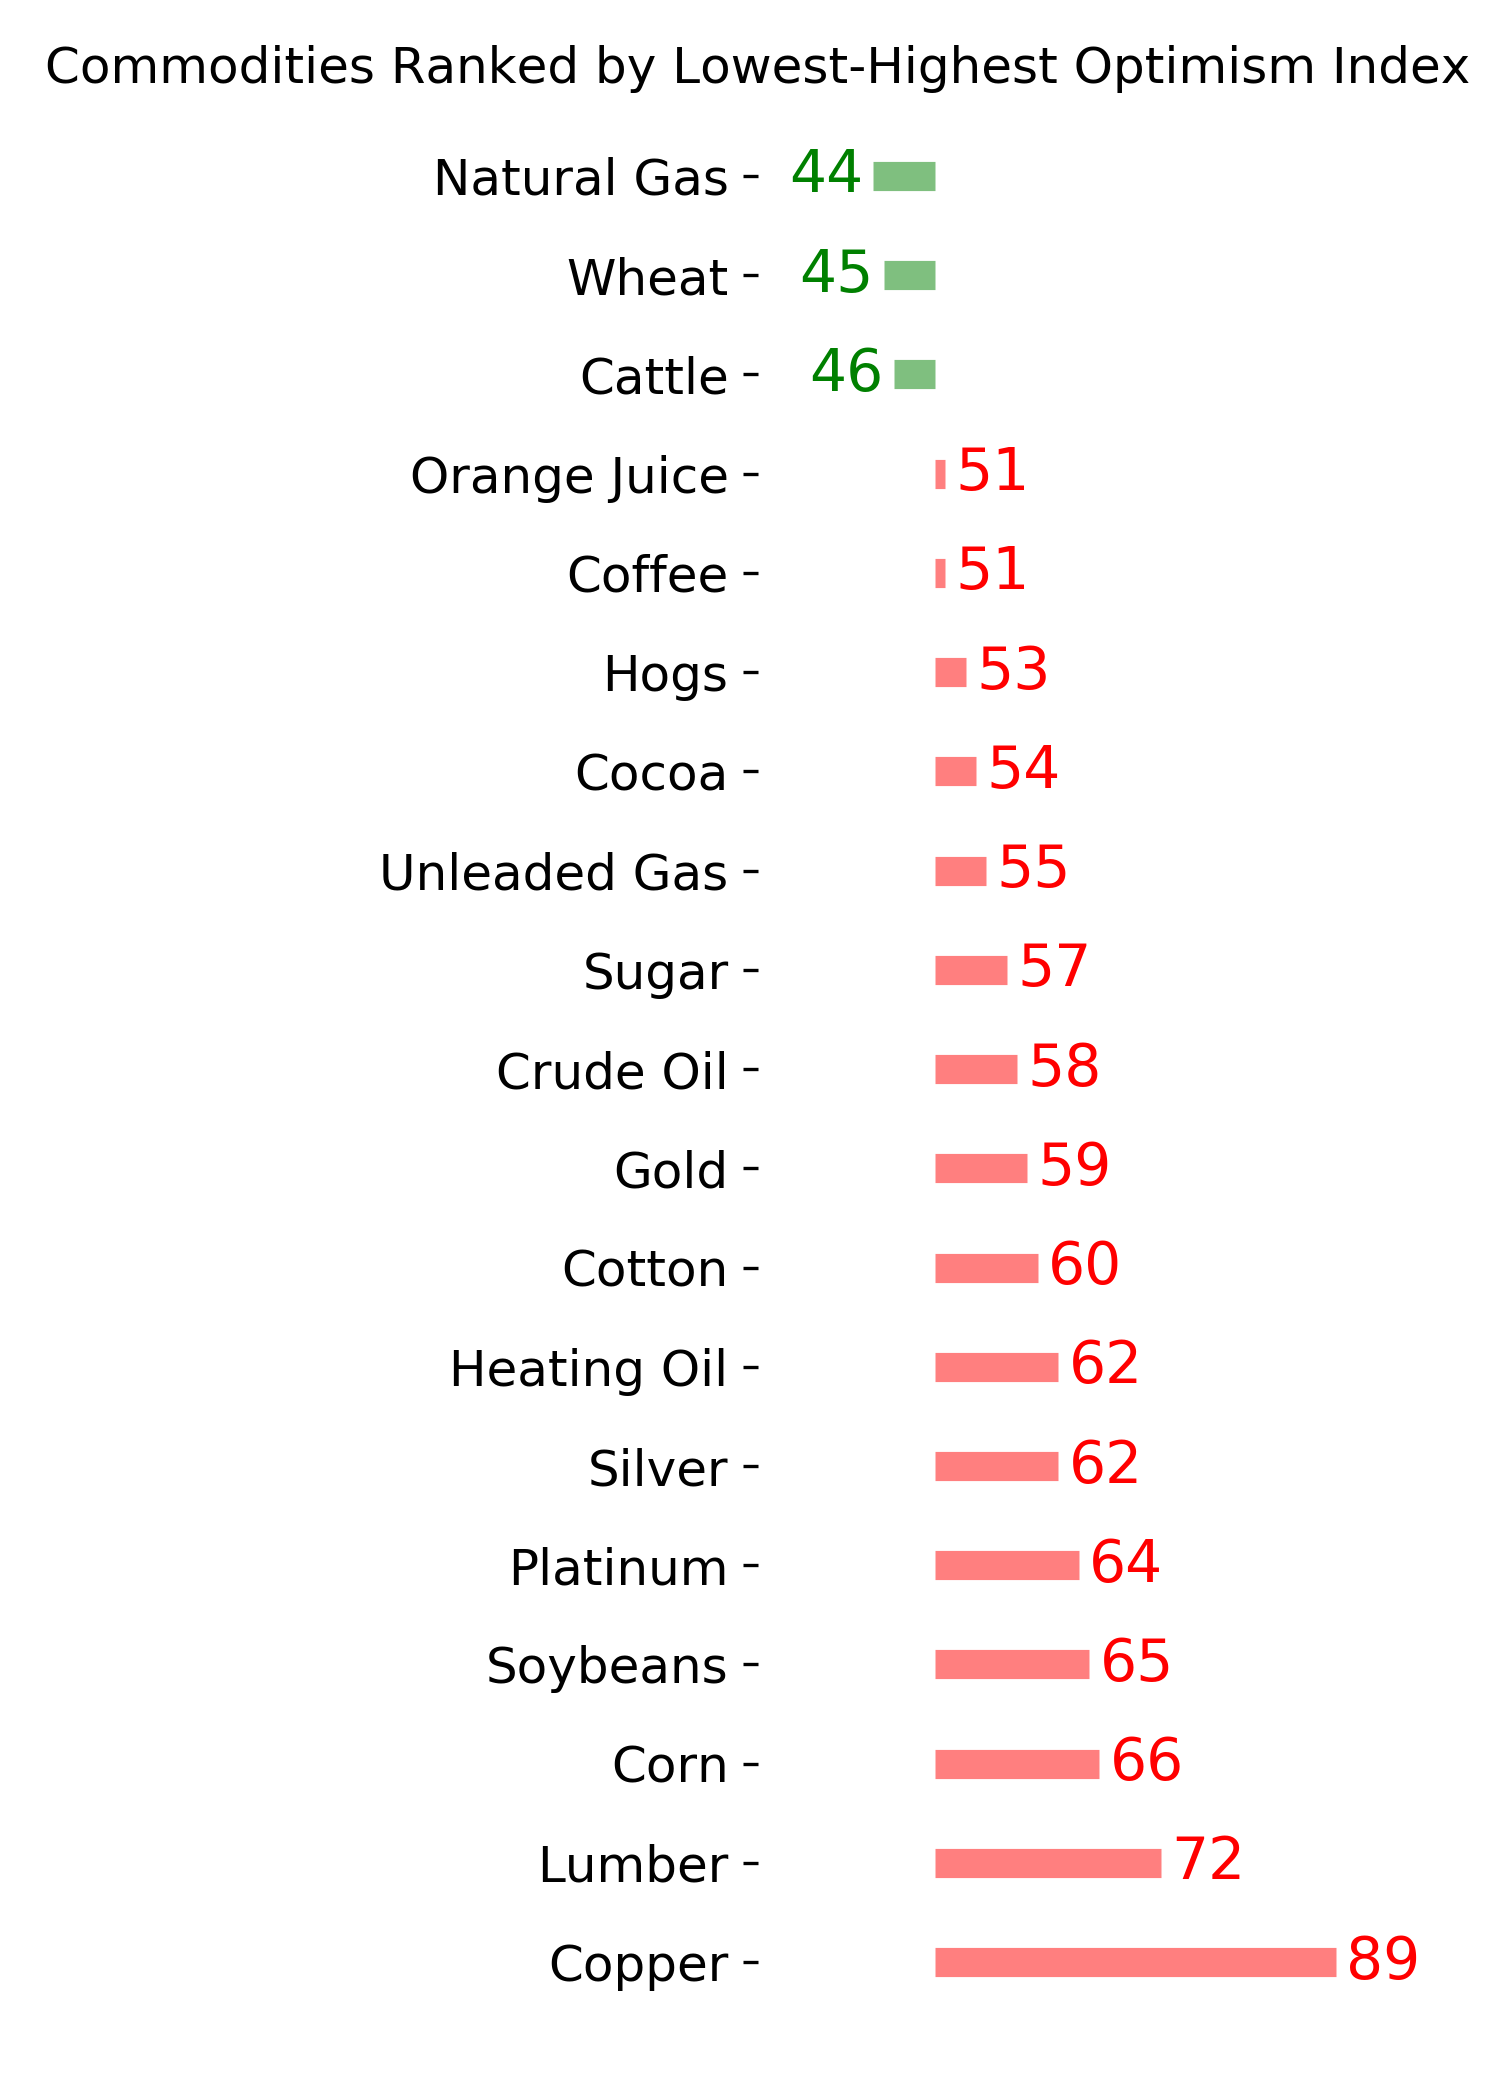
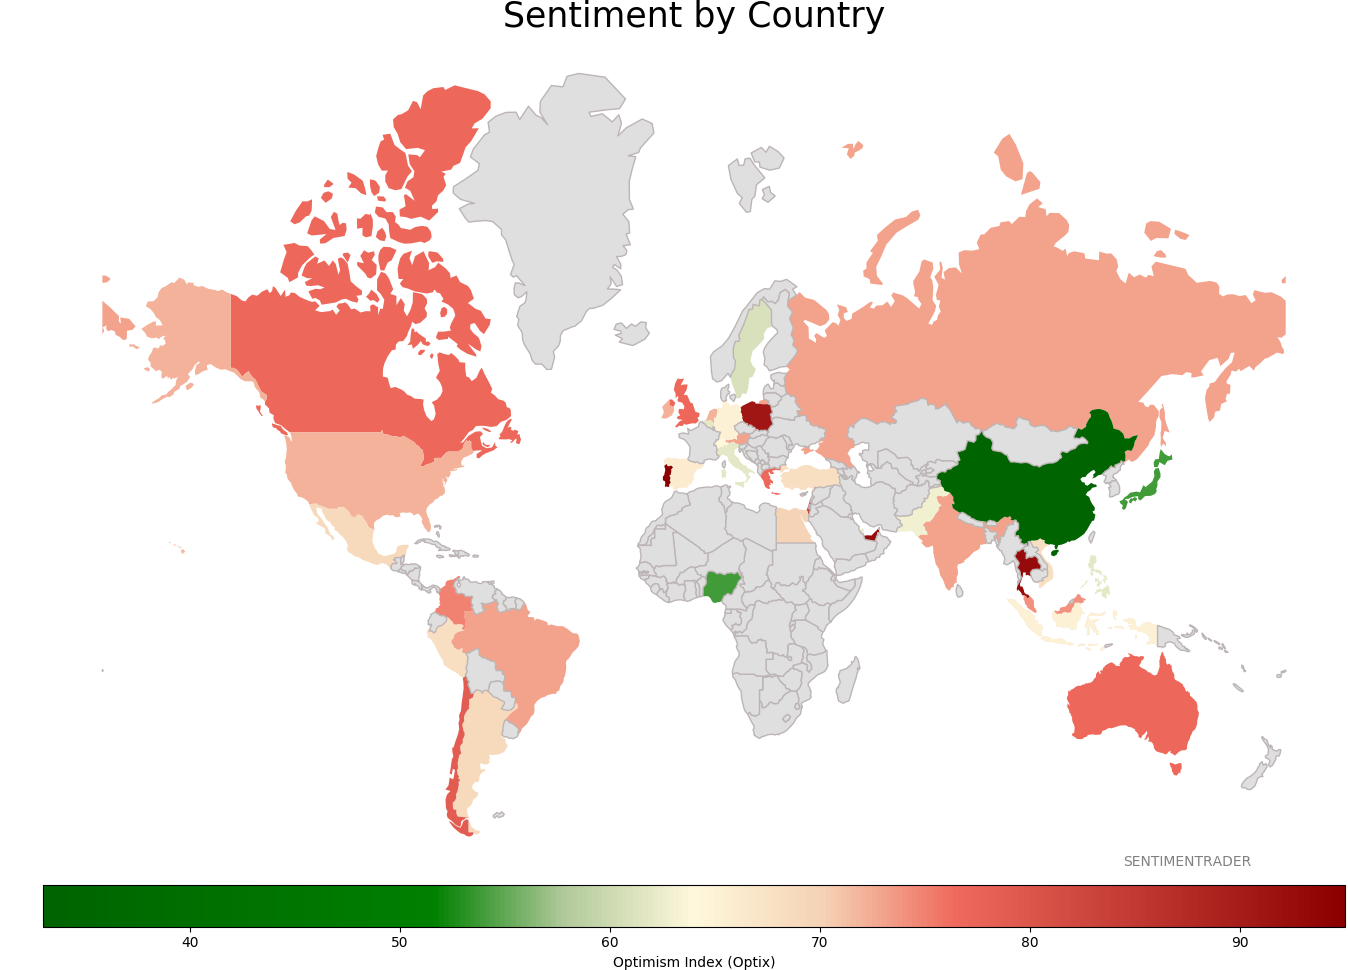
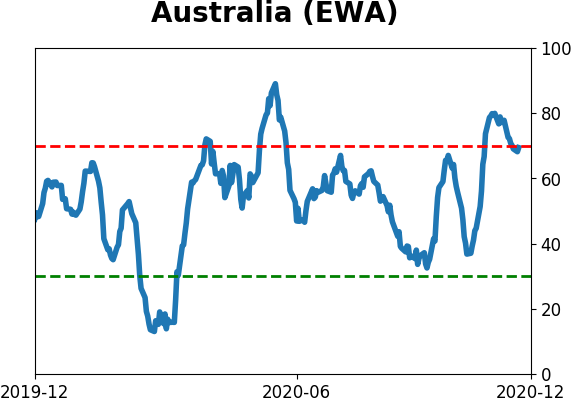
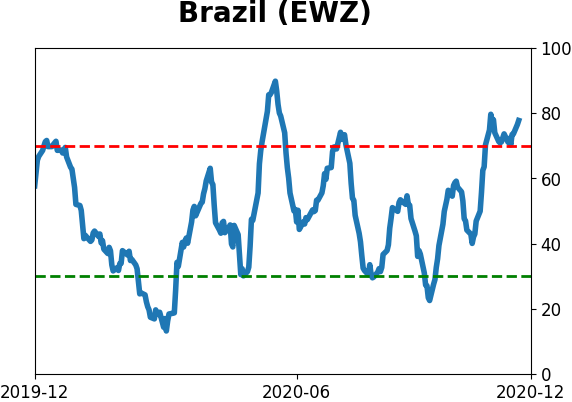
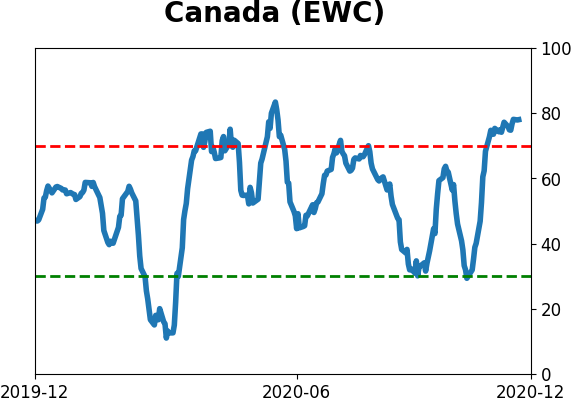
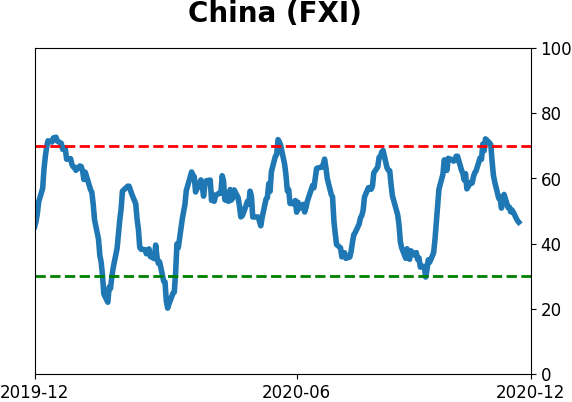
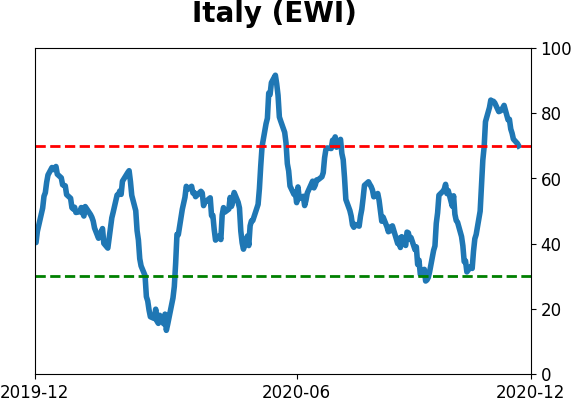
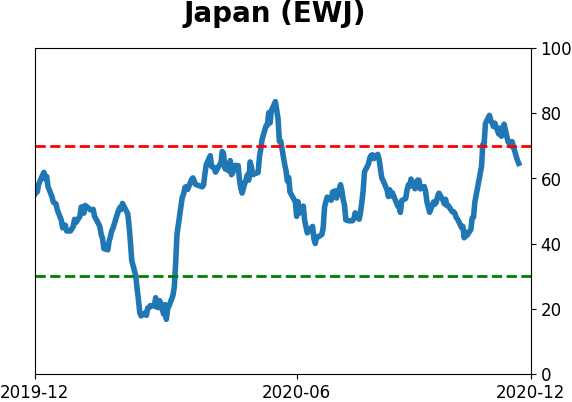
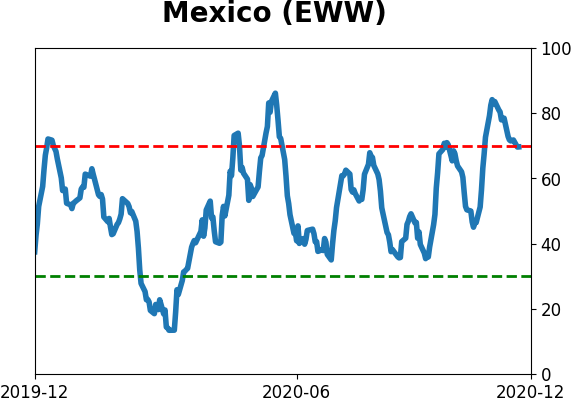
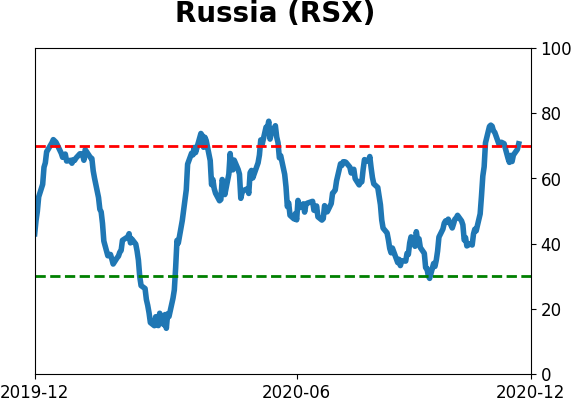
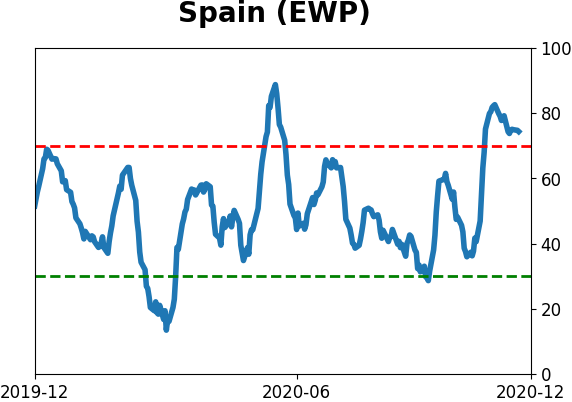
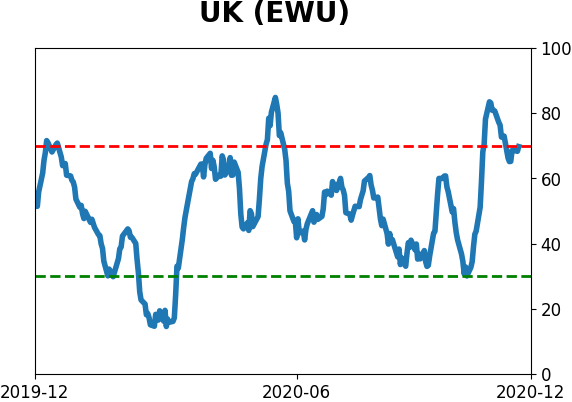
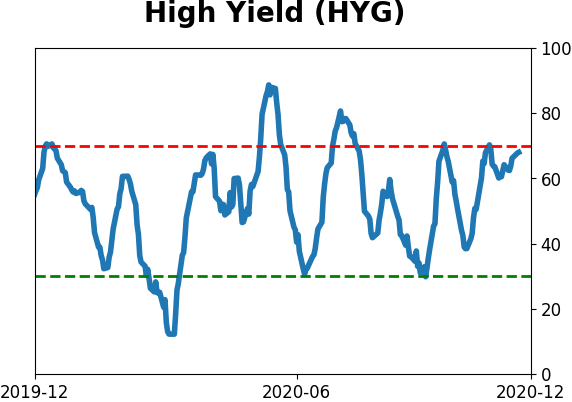
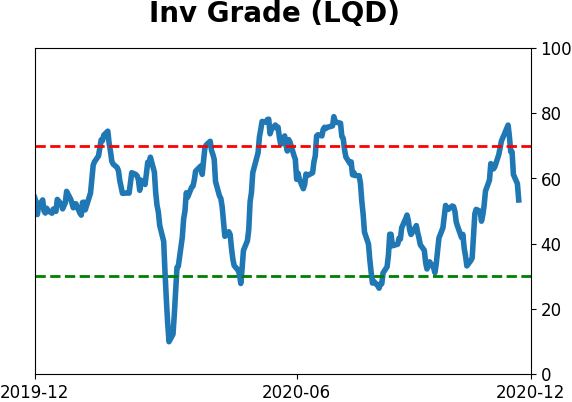
Sentiment Around The World
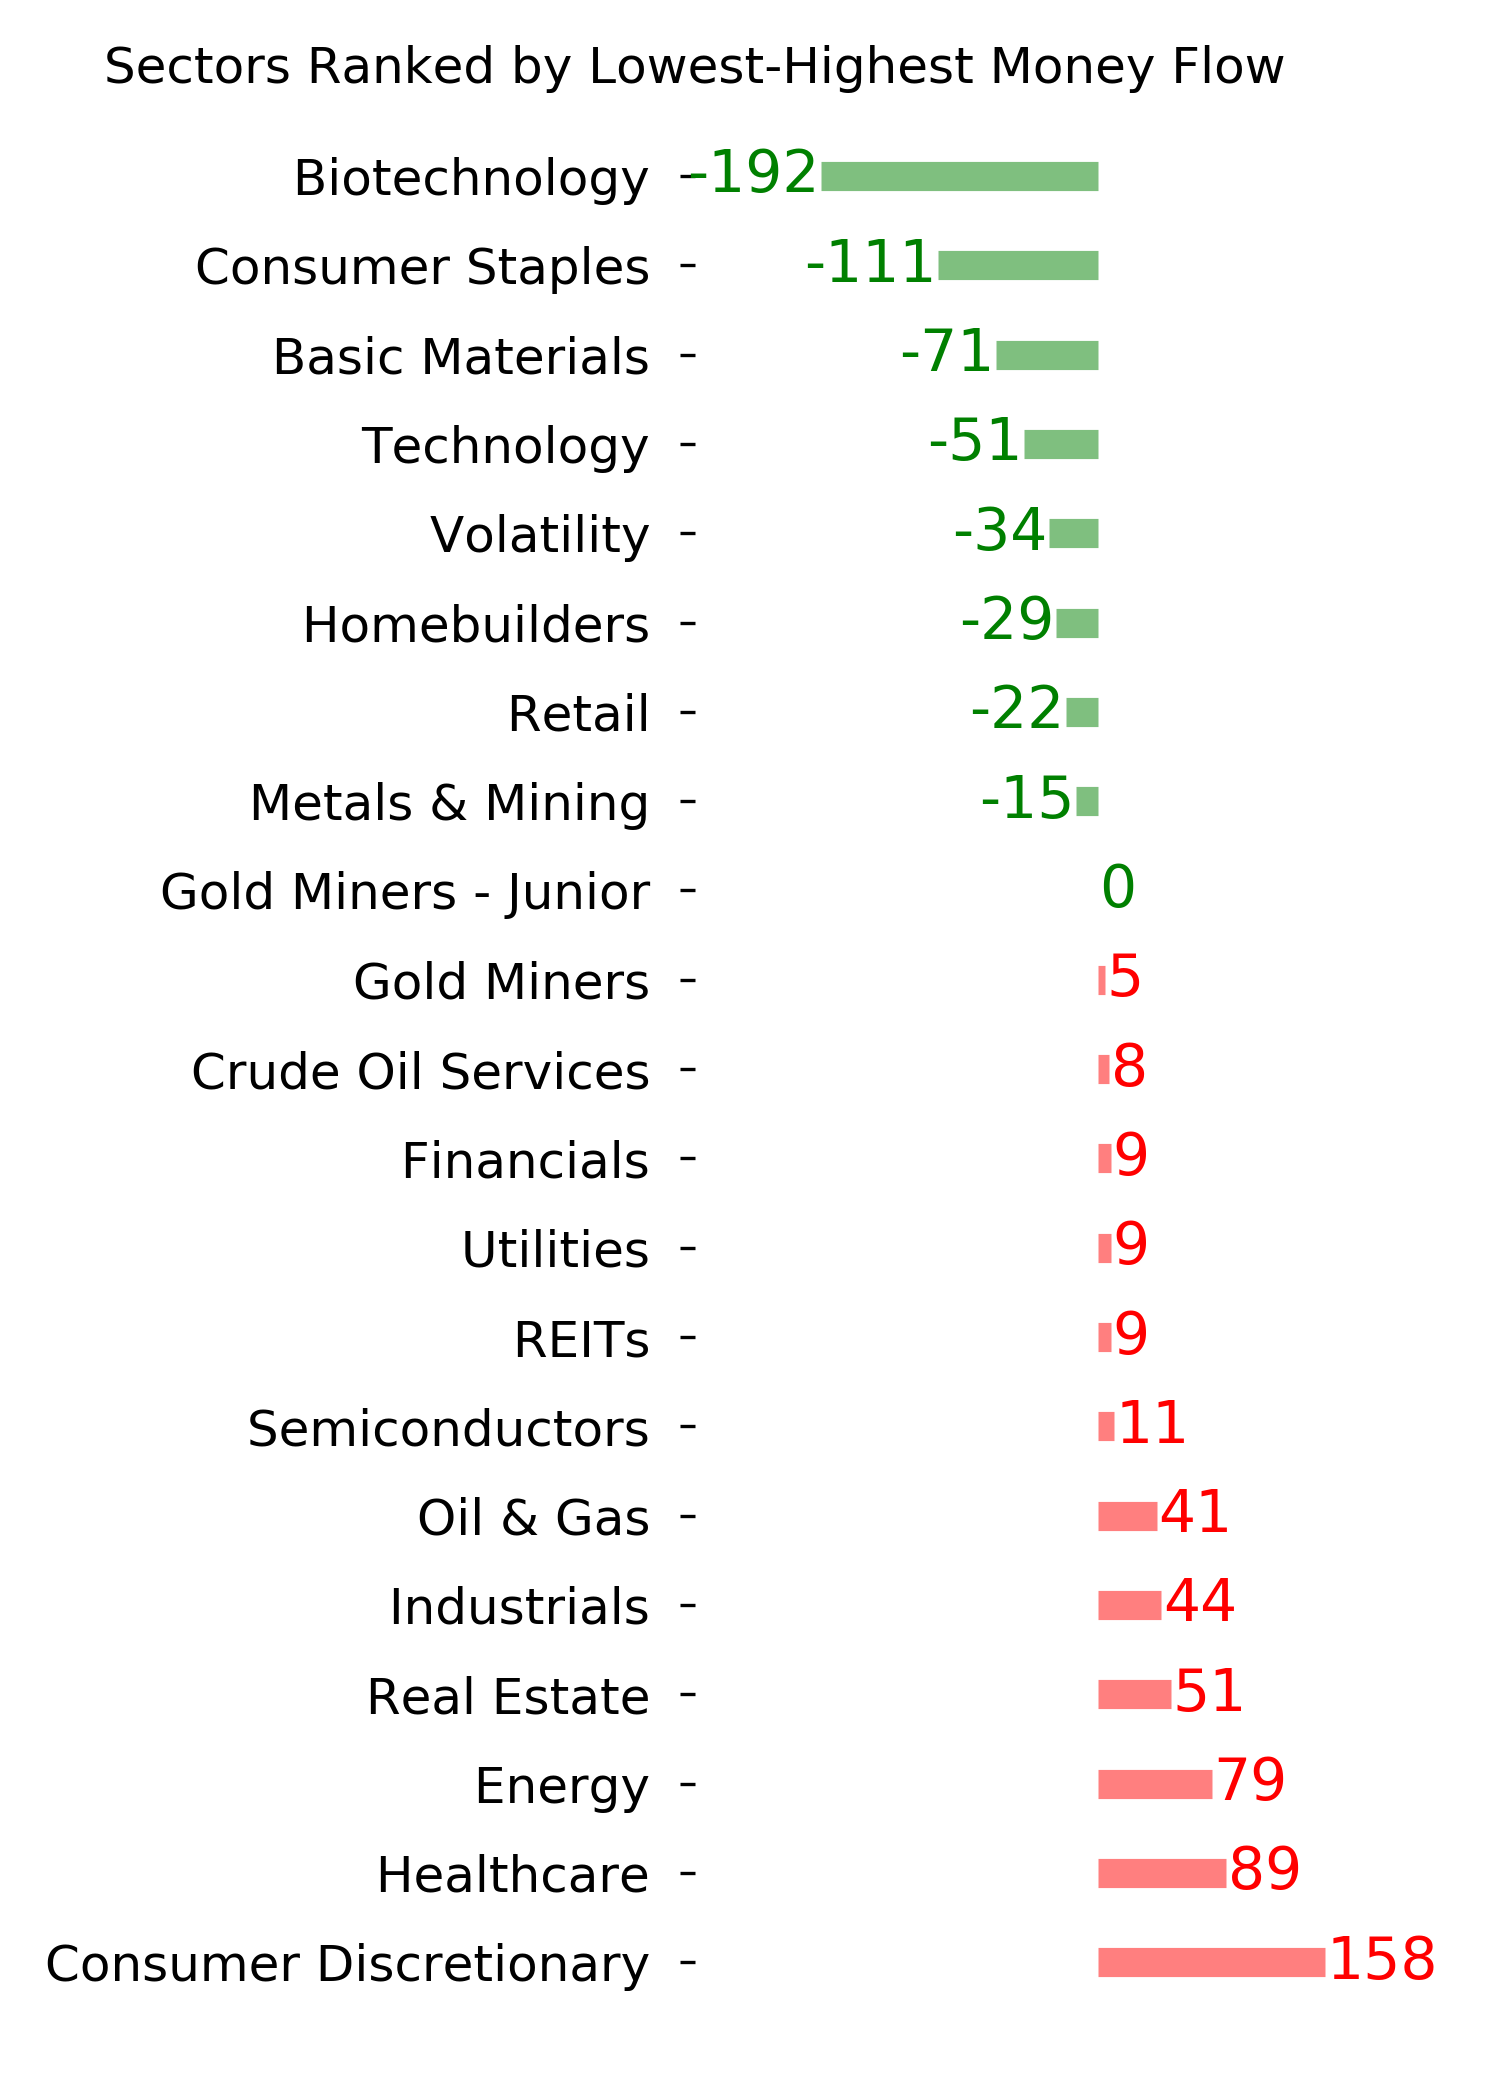
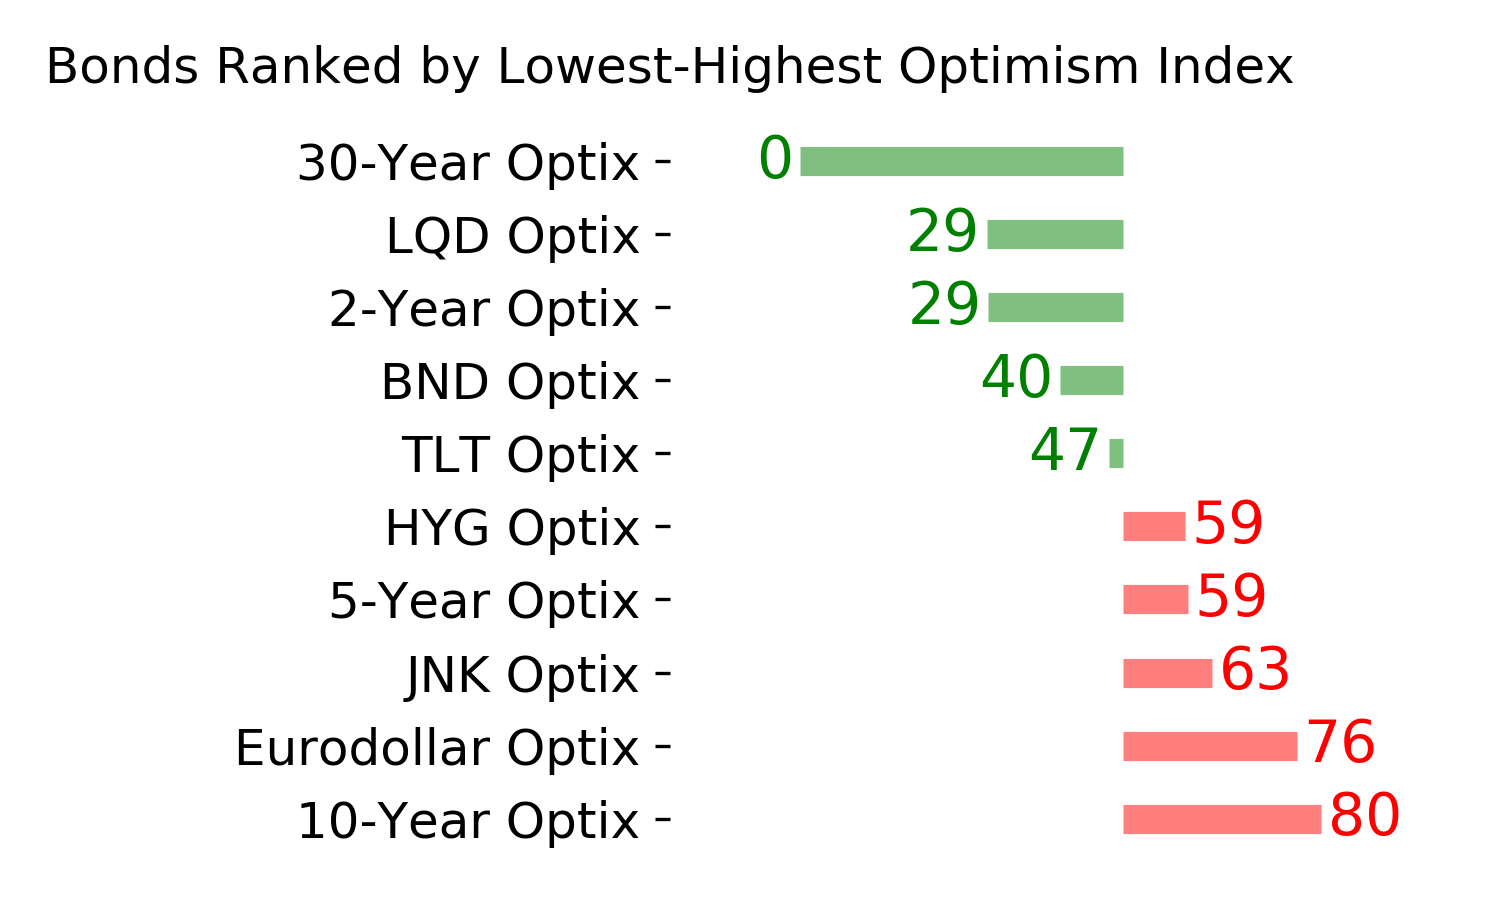
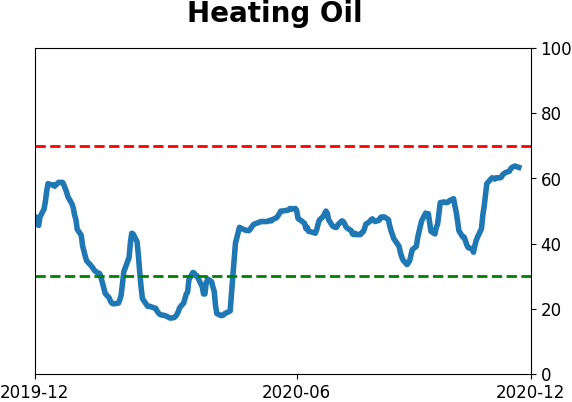
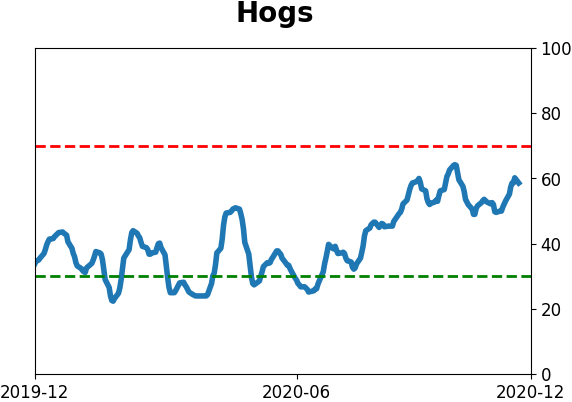
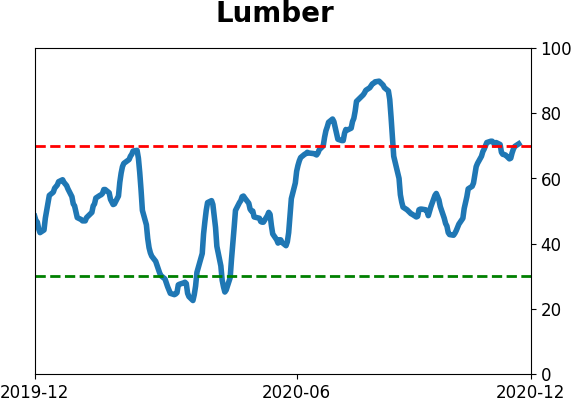
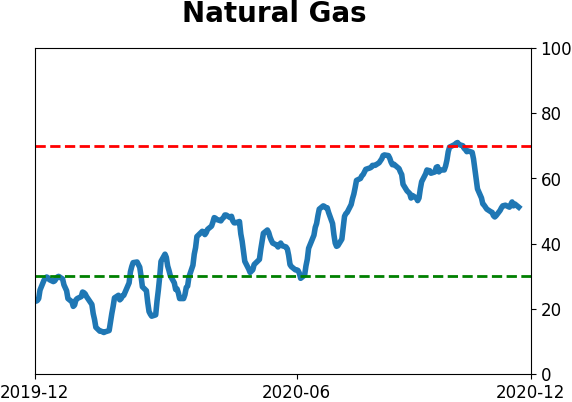
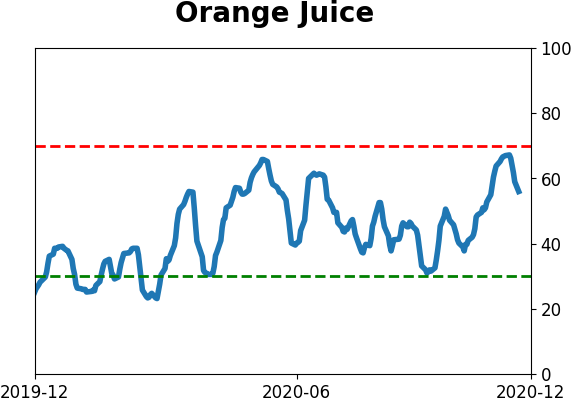
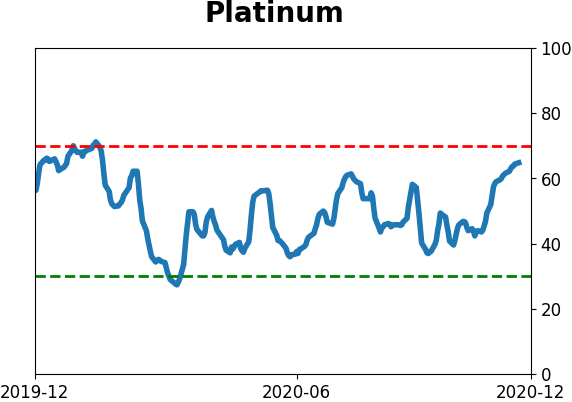
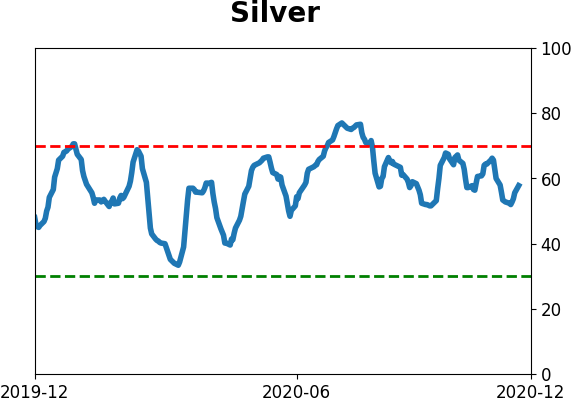
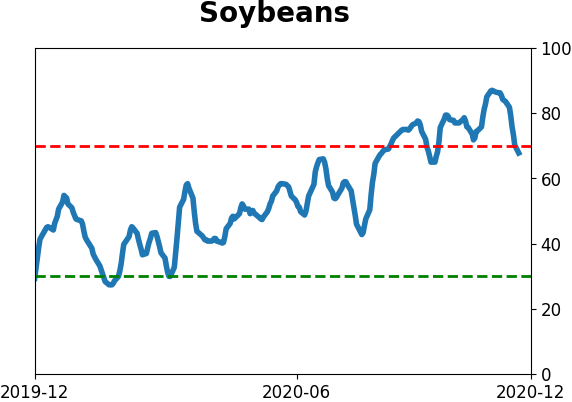
Optimism Index Thumbnails
|
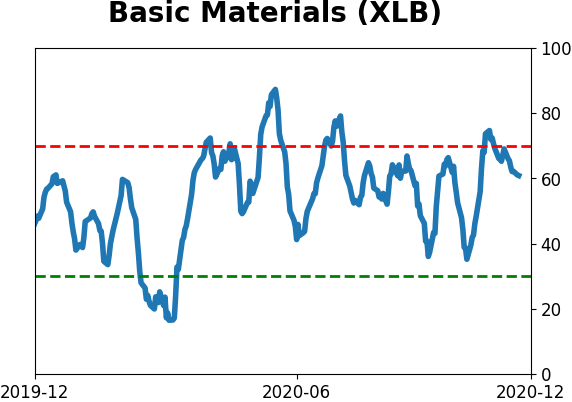
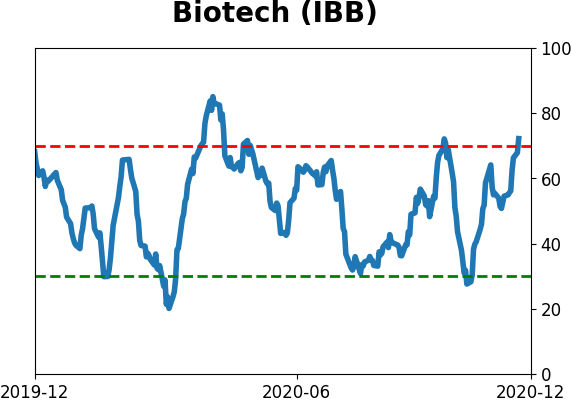
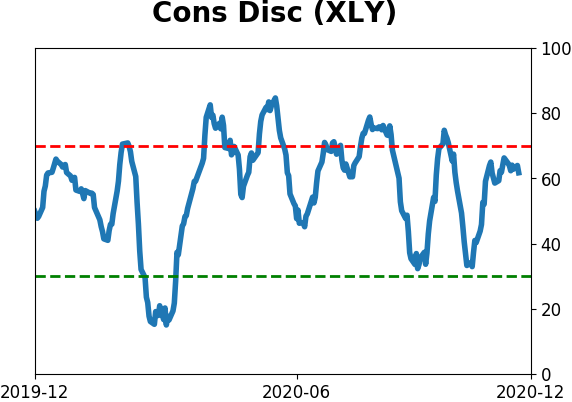
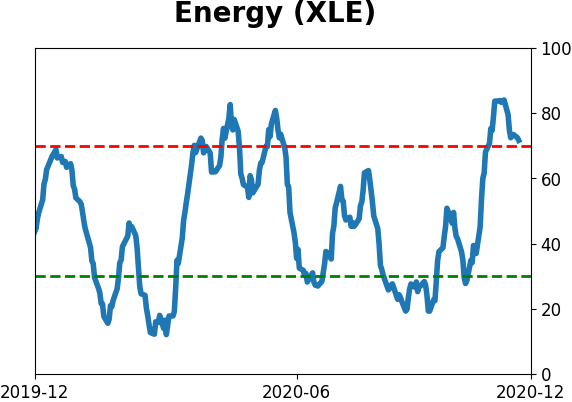
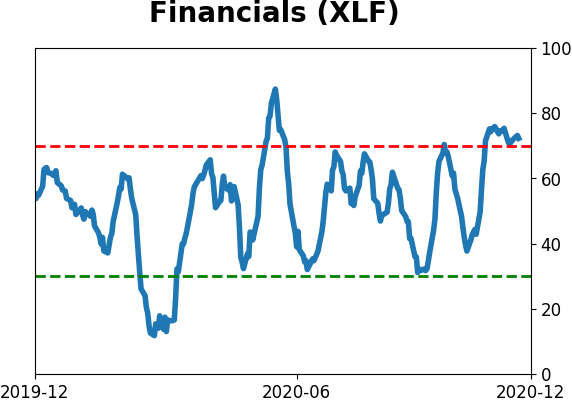
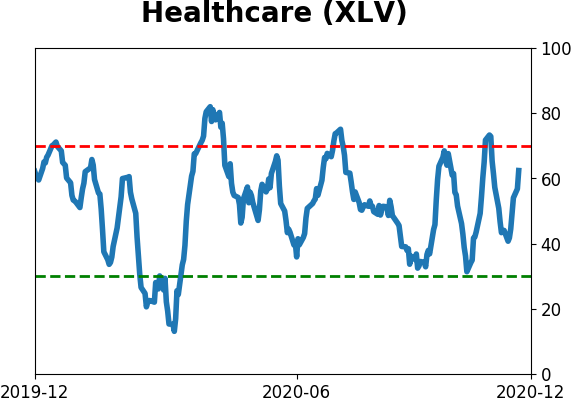
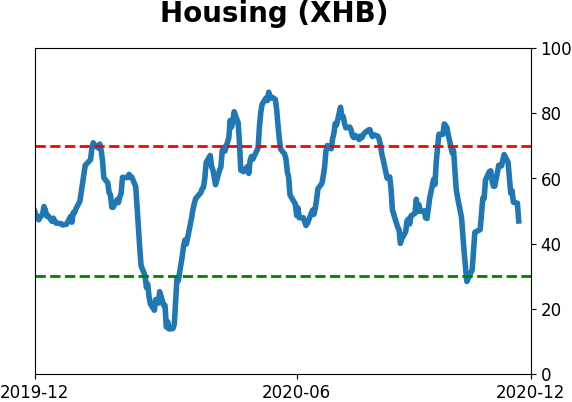
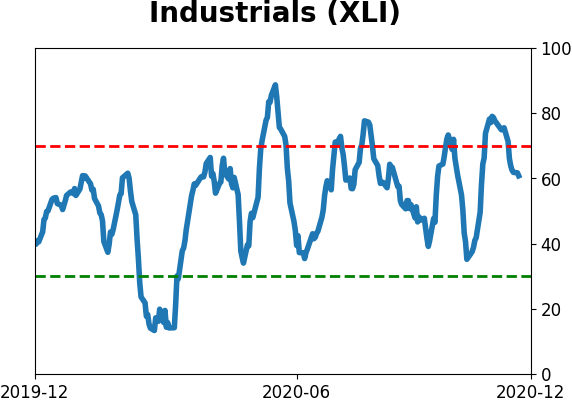
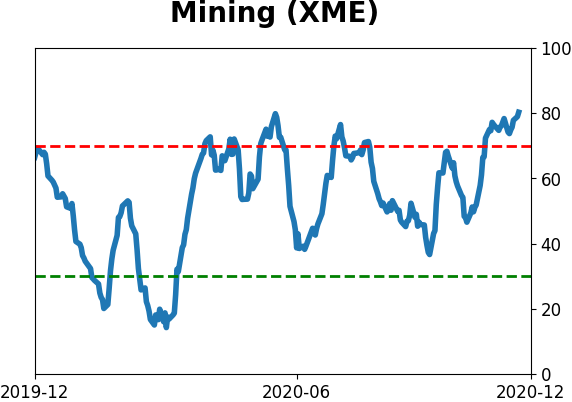
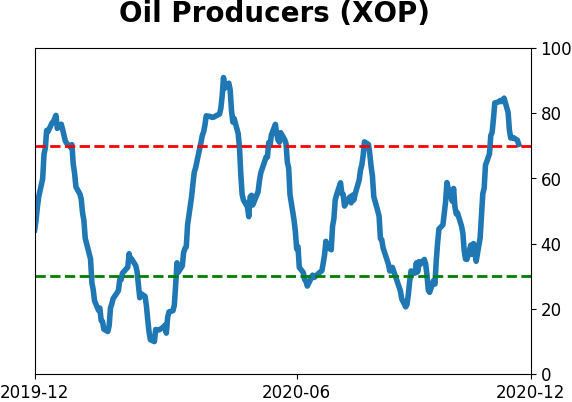
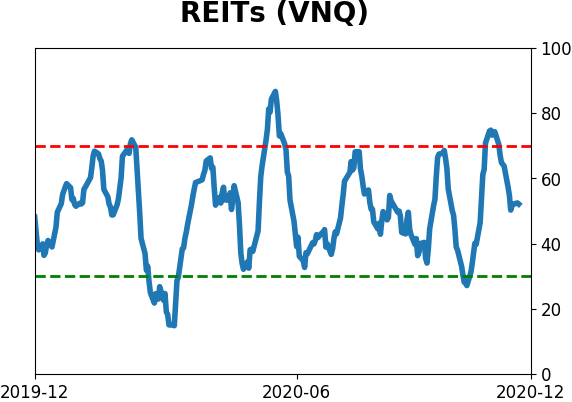
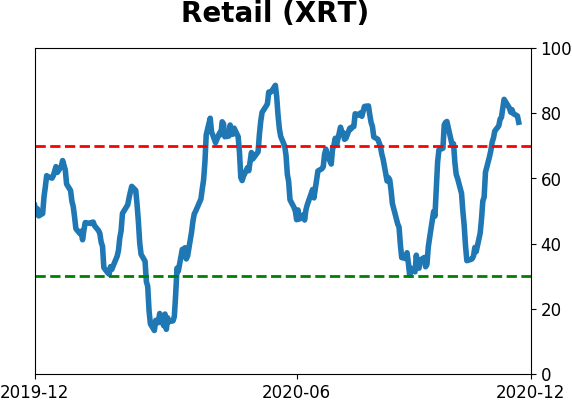
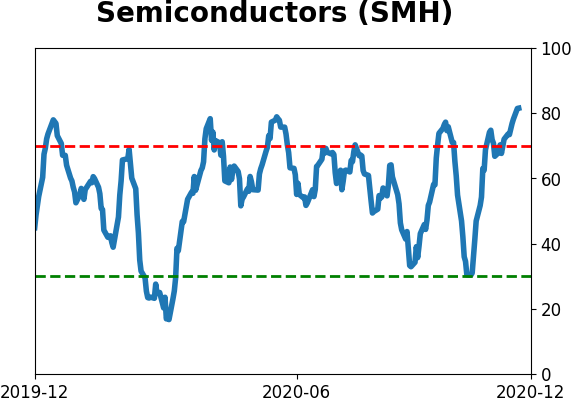
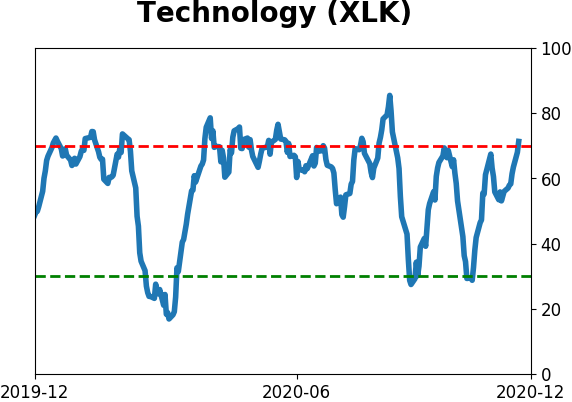
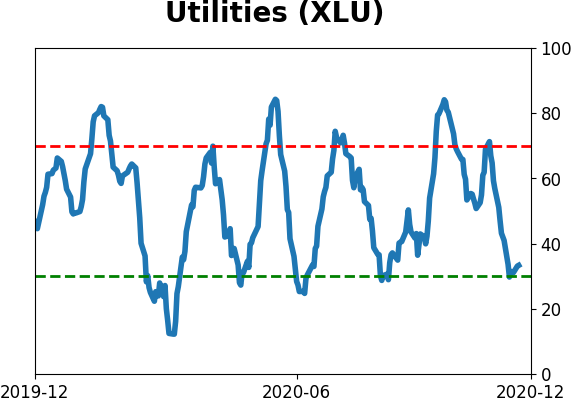
Sector ETF's - 10-Day Moving Average
|
|
|
Country ETF's - 10-Day Moving Average
|
|
|
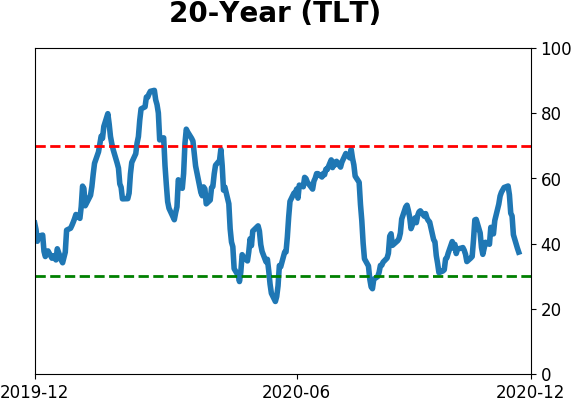
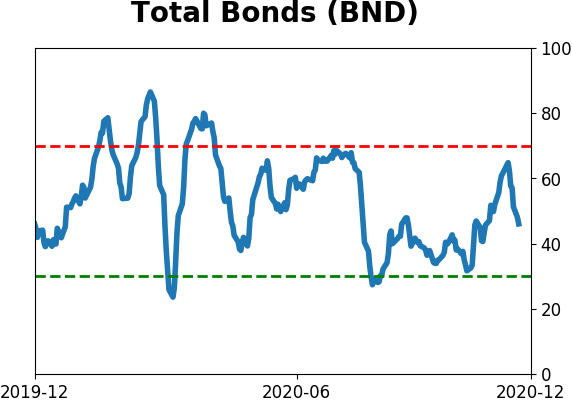
Bond ETF's - 10-Day Moving Average
|
|
|
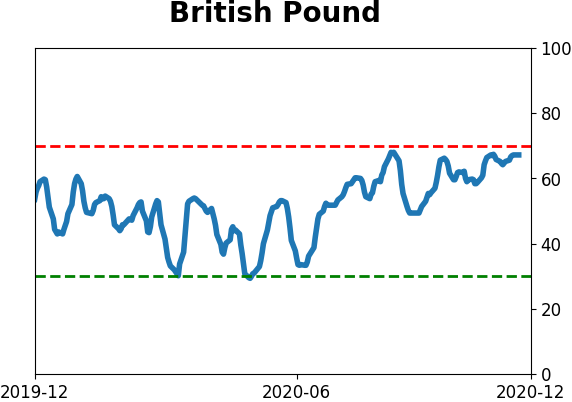
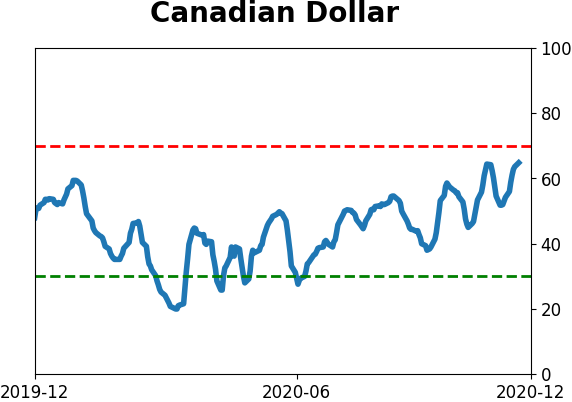
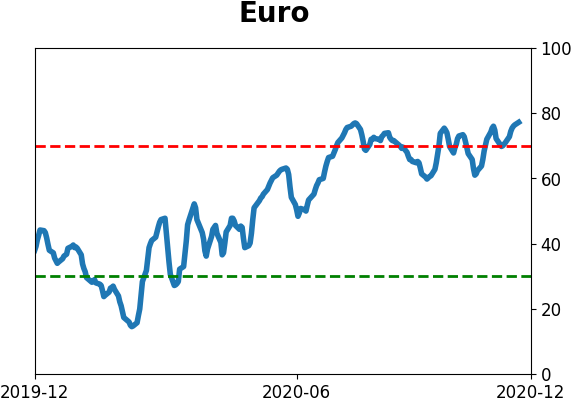
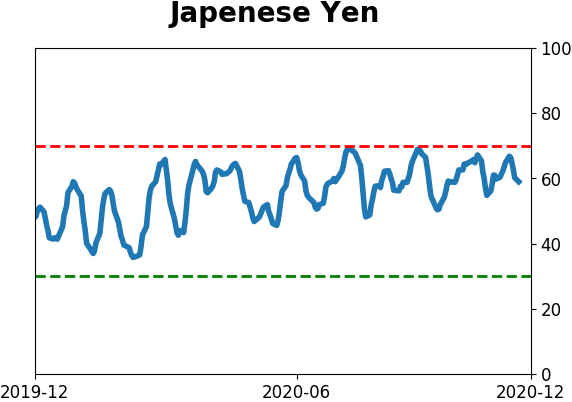
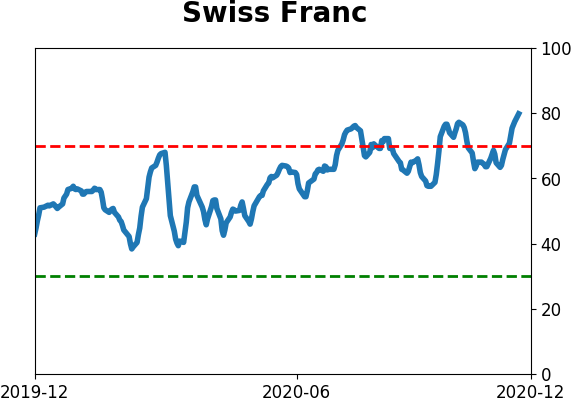
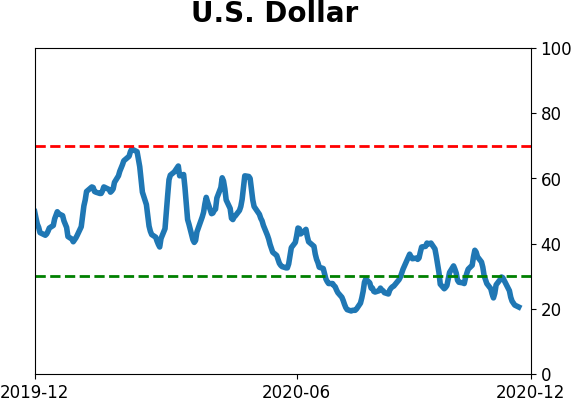
Currency ETF's - 5-Day Moving Average
|
|
|
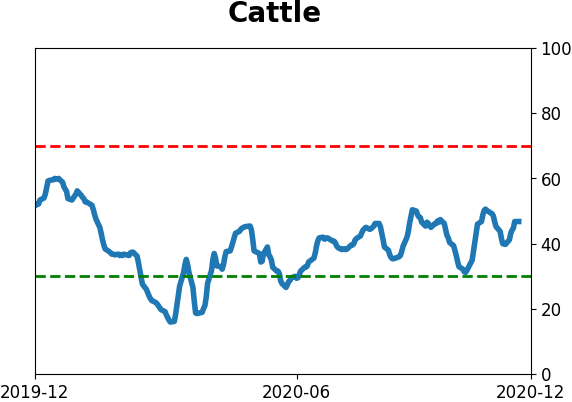
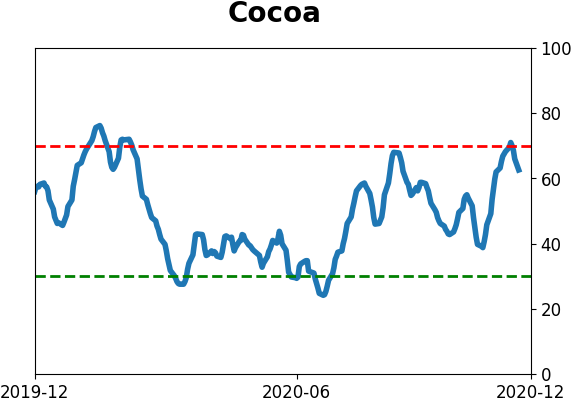
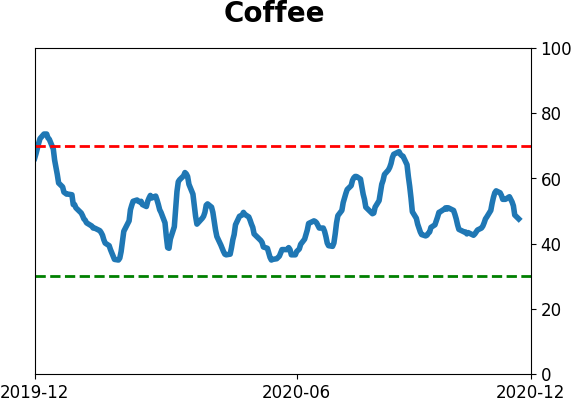
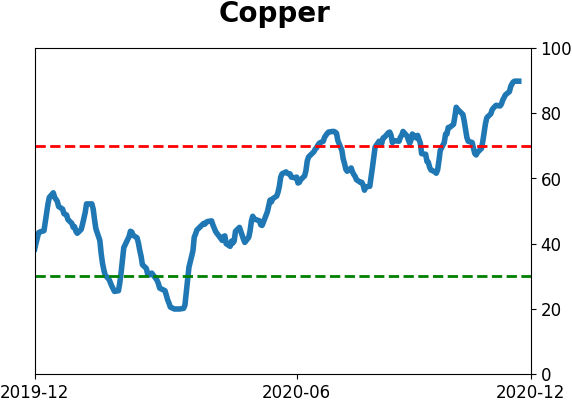
Commodity ETF's - 5-Day Moving Average
|
|