Headlines
|
|
Internal momentum shows good gains:
In recent days, internal momentum as measured by the McClellan Summation Index has improved for small-caps and energy, as well as non-U.S. markets in Brazil and Mexico. Some shorter-term weakness wasn't unusual following these signals, but longer-term gains were more common.
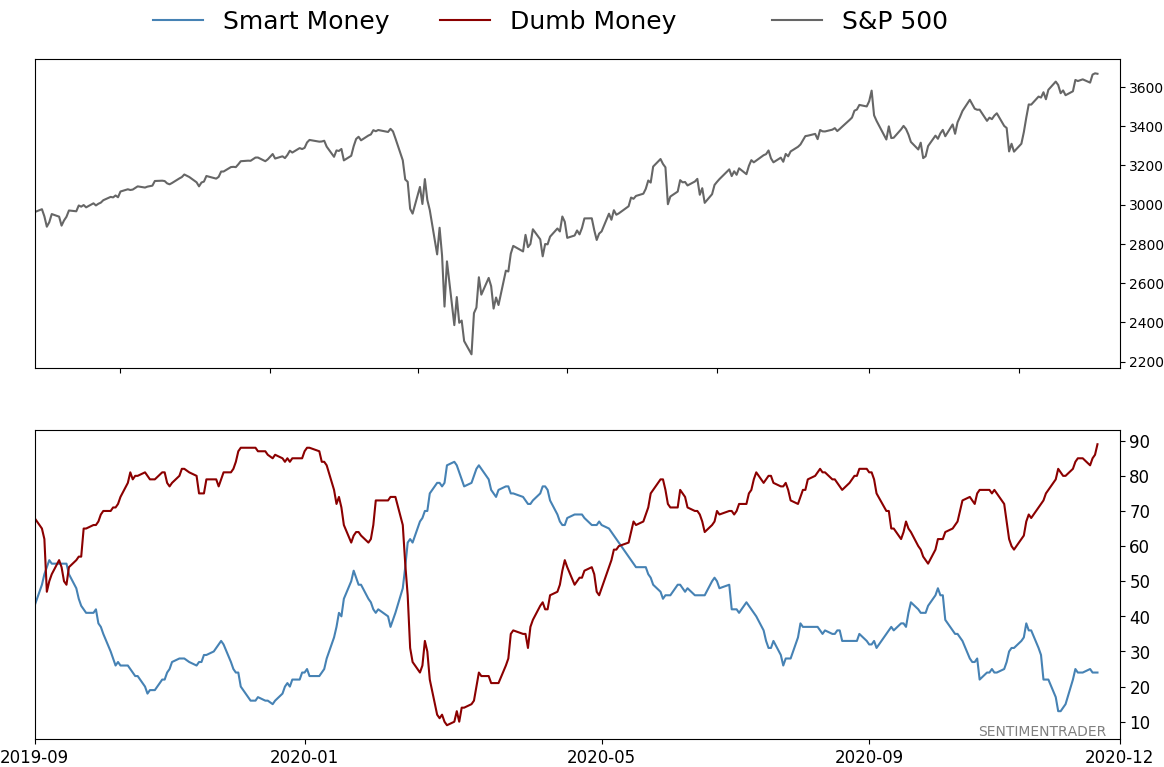
Confidence has never been higher: It's official - we just reached a record high level of optimism. Dumb Money Confidence closed Thursday at a level of 89%, exceeding all other days since we began computing this on December 1, 1998. The Backtest Engine tells us that there have been 8 days with a reading of 88%, clustered in April 2010 and December 2019 - January 2020. Over the next 3 months, all 8 days showed a negative return in the S&P 500 of -9% or worse. While momentum has been impressive enough to suggest that any potential weakness should be temporary, sentiment has now reached critical levels that almost universally leads to limited upside that has a strong tendency to reverse over a multi-week to multi-month time frame.
Bottom Line:
- The market environment is pristine, but with near-historic optimism, gains tend to be muted, with a high probability of being reversed at some point over the ensuing weeks.
|
Smart / Dumb Money Confidence
|
Smart Money Confidence: 24%
Dumb Money Confidence: 89%
|
|
Risk Levels
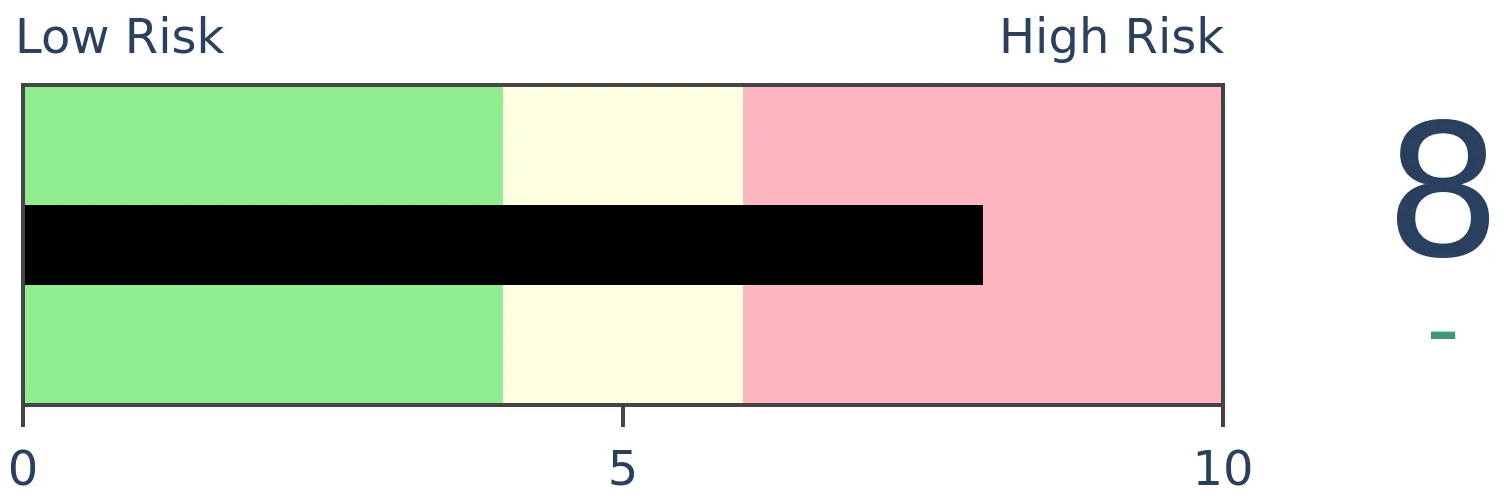
Stocks Short-Term
|
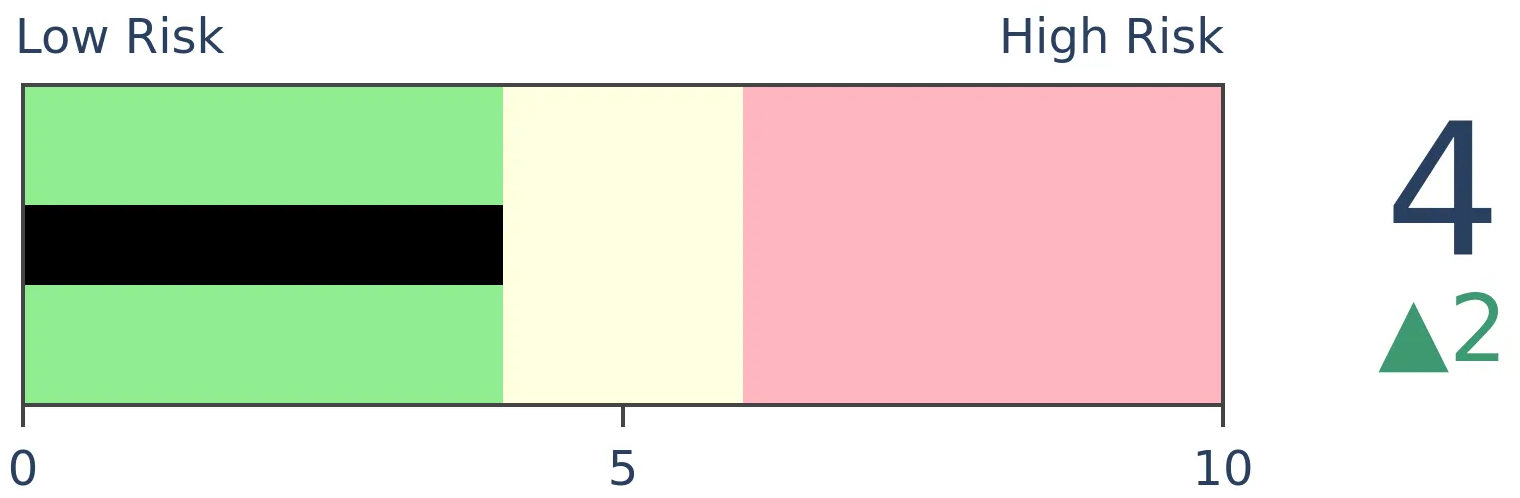
Stocks Medium-Term
|
|
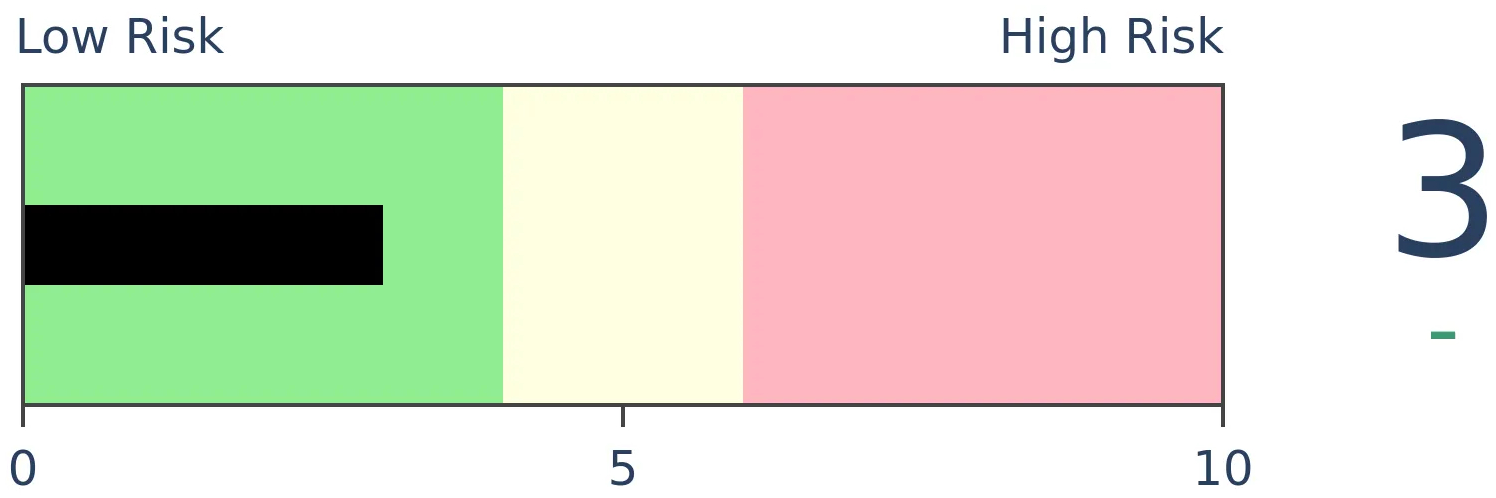
Bonds
|
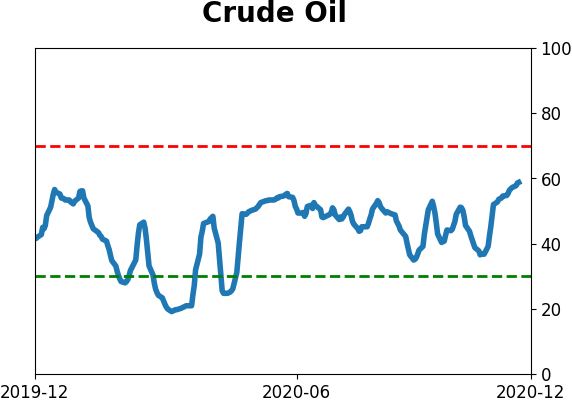
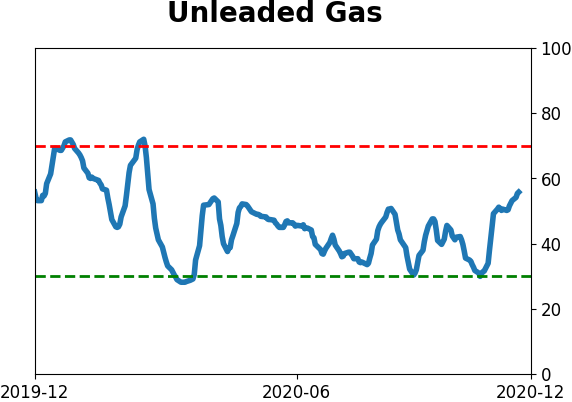
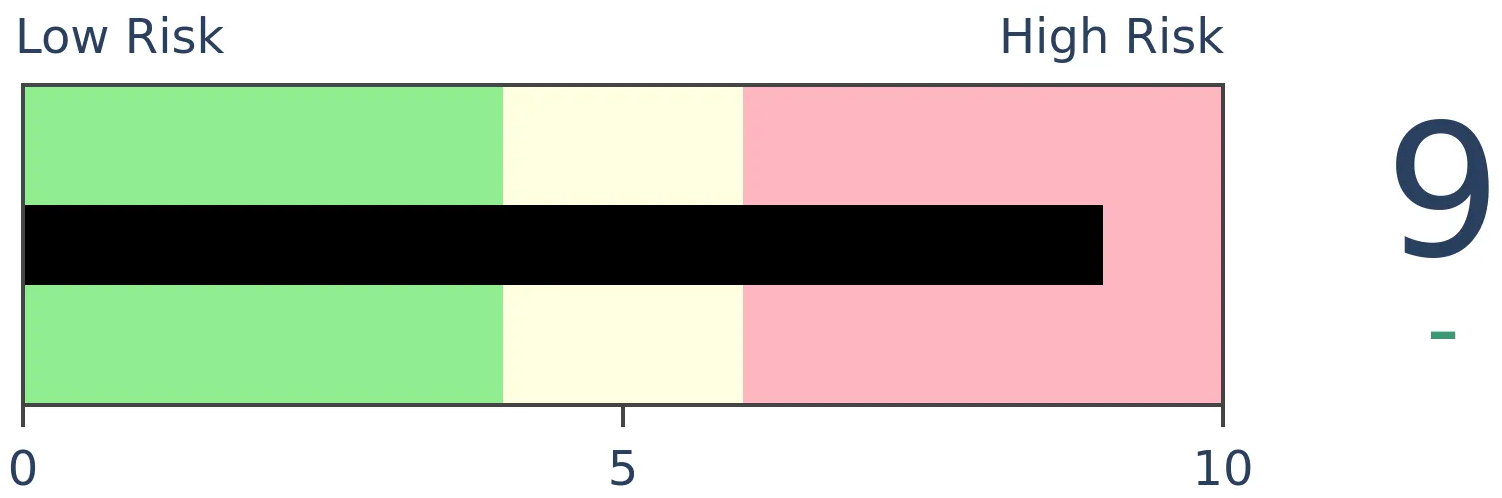
Crude Oil

|
|
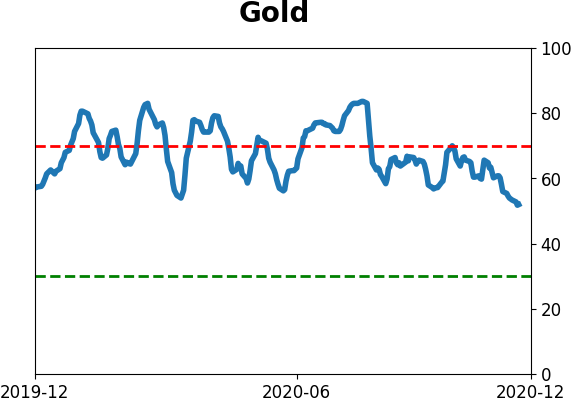
Gold
|
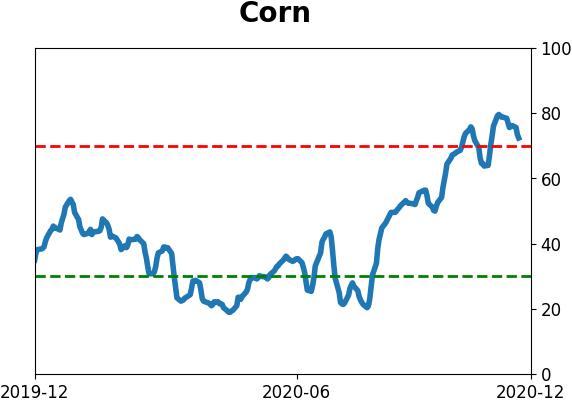
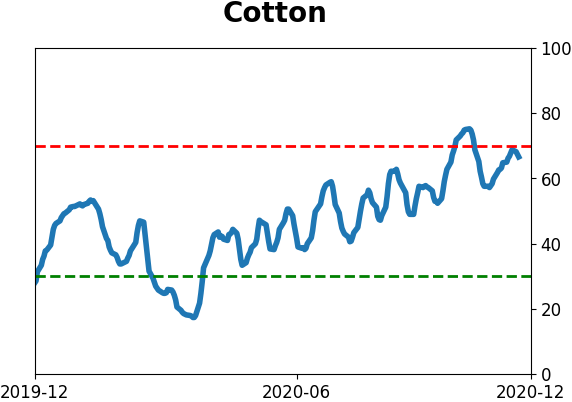
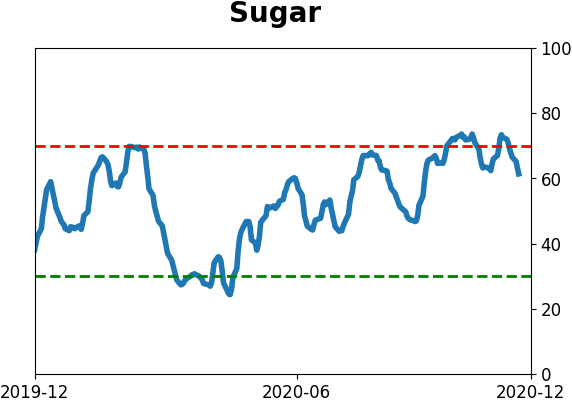
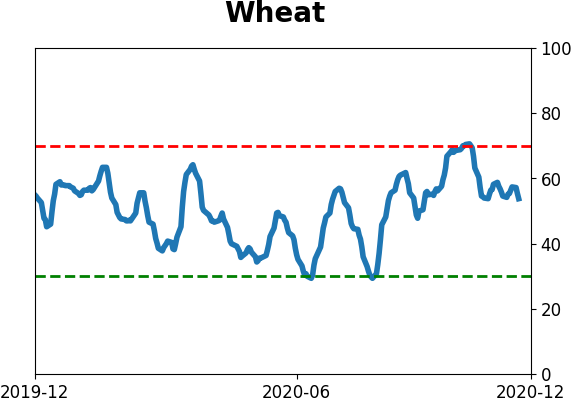
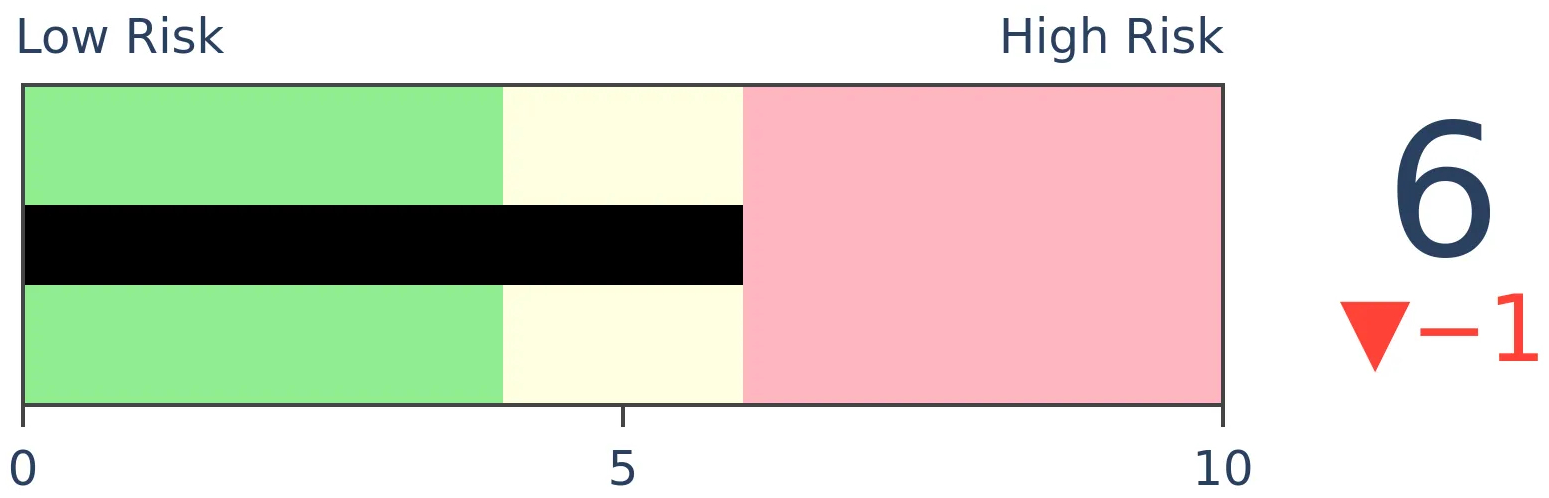
Agriculture
|
|
Research
BOTTOM LINE
In recent days, internal momentum as measured by the McClellan Summation Index has improved for small-caps and energy, as well as non-U.S. markets in Brazil and Mexico. Some shorter-term weakness wasn't unusual following these signals, but longer-term gains were more common.
FORECAST / TIMEFRAME
None
|
During October and November, we looked multiple times at the broadening of the rally, including historic thrusts of overwhelming buying interest. Those are the kinds of readings that can overwhelm sentiment extremes like we've recorded in recent weeks.
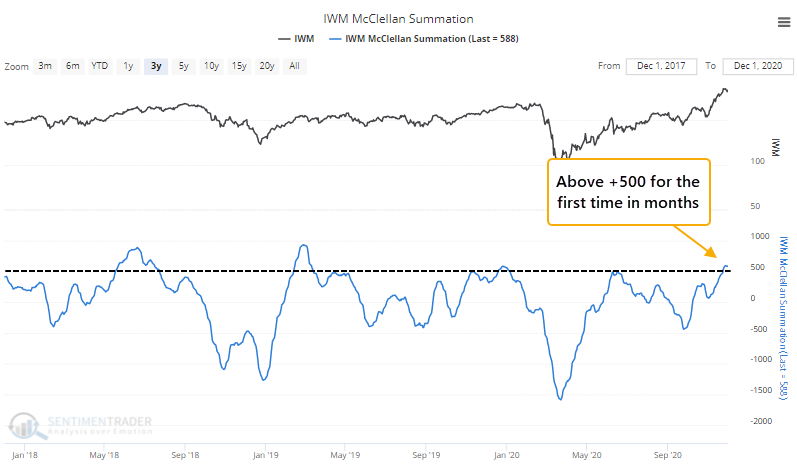
The improvement in some of these figures was due in large part to a renewal of interest in smaller stocks. The Cumulative Advance/Decline Line for the Russell 2000 is near a decade-long high thanks to the recent surge that also pushed its McClellan Summation Index above +500 for the first time since the beginning of the year.
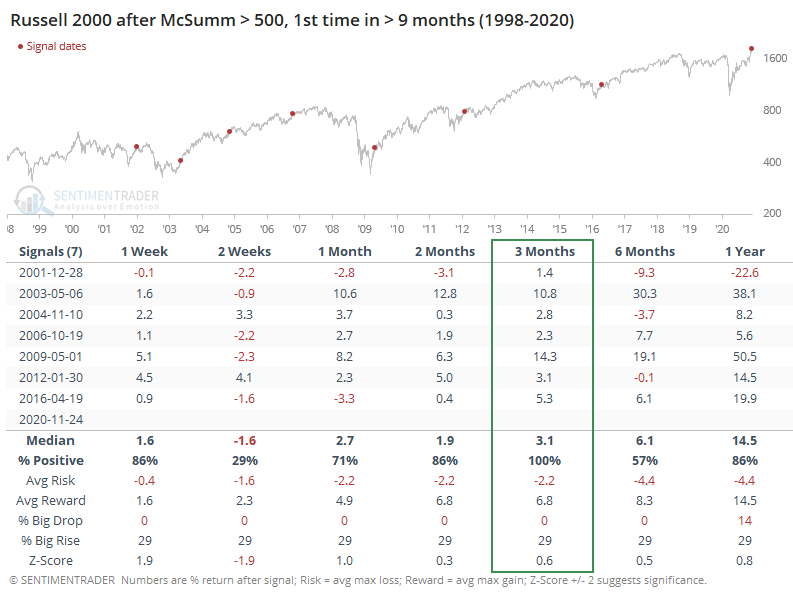
When its Summation Index moved above this threshold for the first time in more than 9 months, the Russell continued to gain every time over the ensuing 3 months, even after accounting for frequent shorter-term weakness.
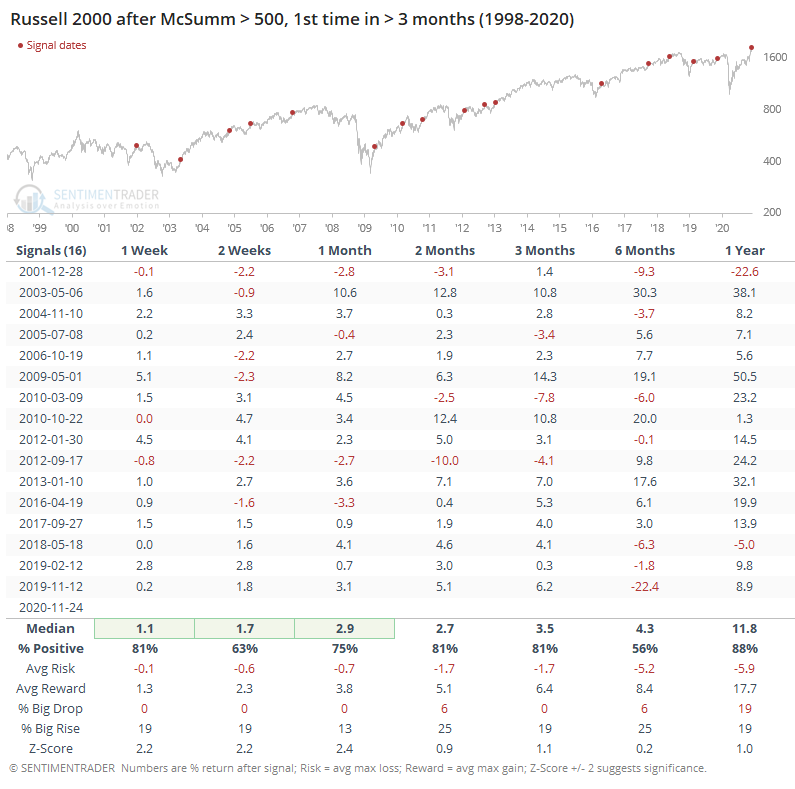
If we look at lesser extremes in order to generate a larger sample size, it was still quite positive.
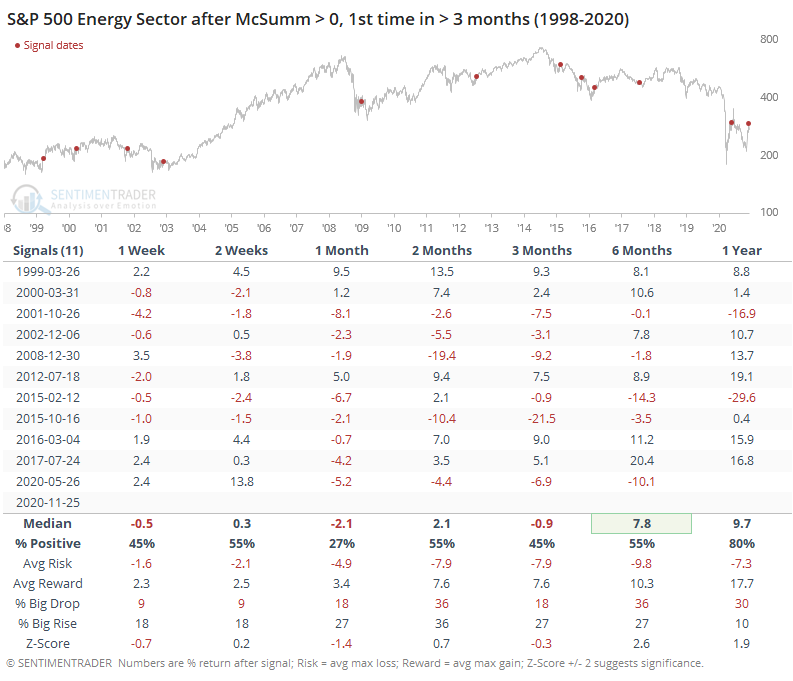
The snapback in smaller stocks happened along with rebounds in many beaten-down sectors like energy. The Summation Index for that sector finally managed to poke above the zero line.
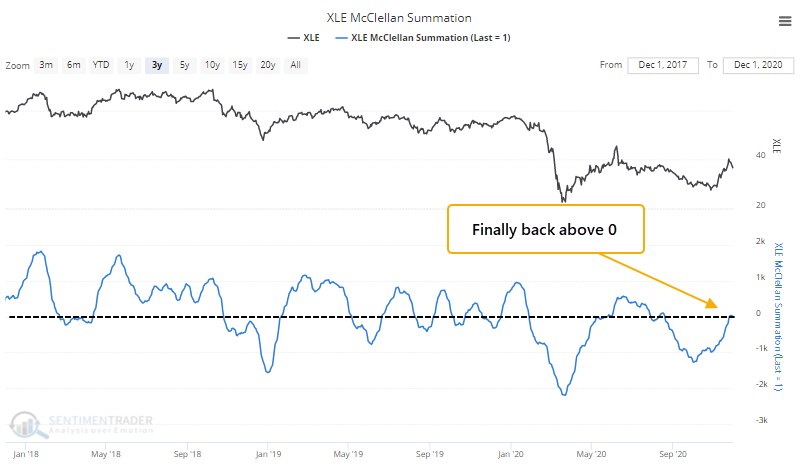
It has not been easy for energy shares to maintain any positive momentum in recent decades. When internal momentum finally recovered after months of negativity, selling pressure has usually followed, but with better-than-random results over the next 6-12 months.
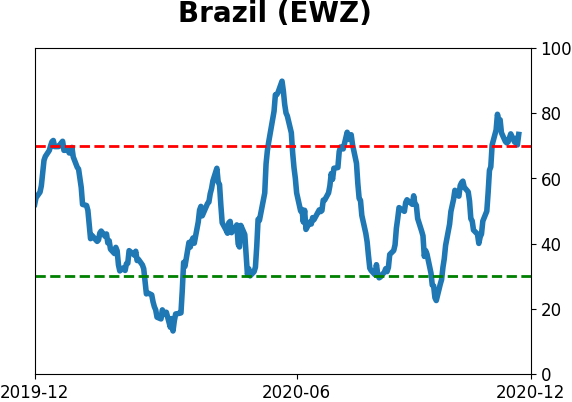
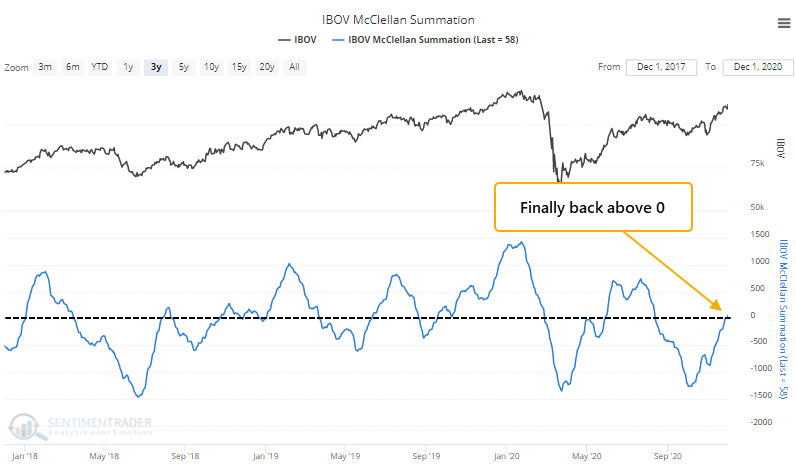
Some non-U.S. markets are closely tied to commodity markets and have a relatively high correlation to sectors like energy. As that sector has tried a recovery, so has Brazil's Ibovespa index, whose Summation Index also just climbed above zero.
These stocks have had great difficulty holding onto this momentum in the short-term, but it was a good medium- to long-term sign.
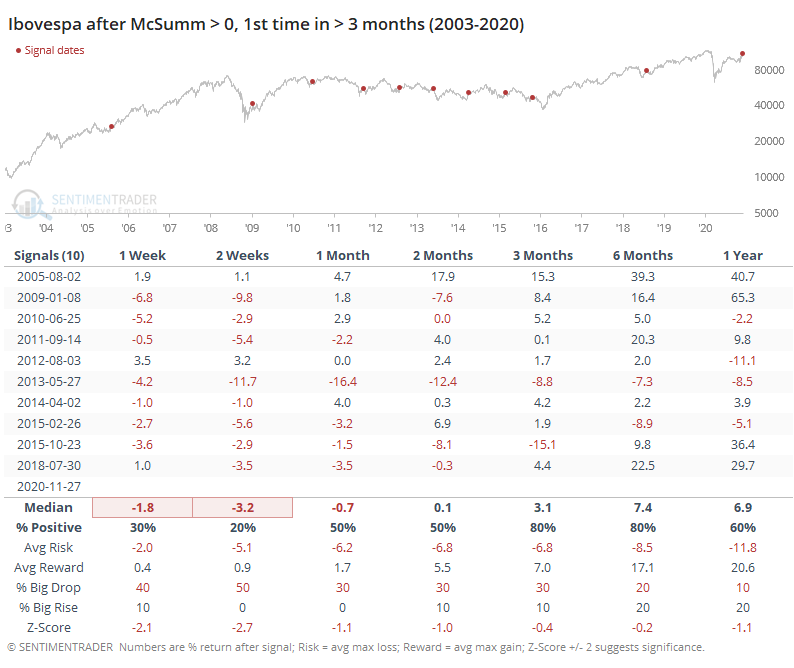
All but 2 of the signals showed losses during the next 2 weeks, but also all but 2 of them showed gains over the next 3-6 months.
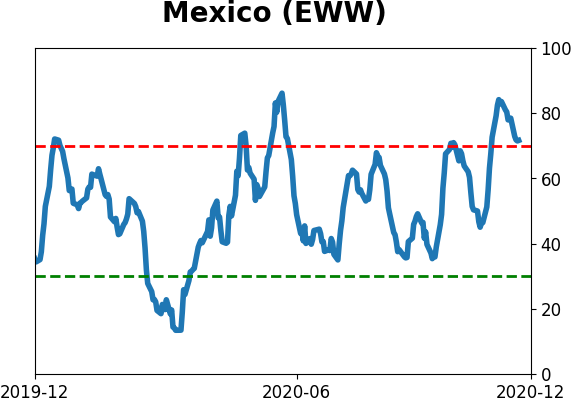
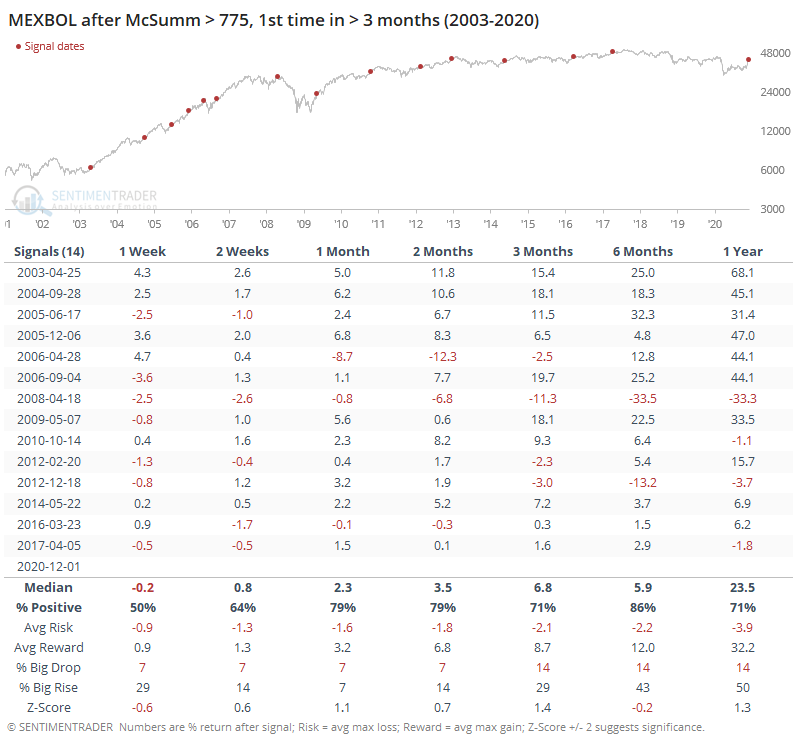
Some of the strongest internal momentum is in the Mexican MEXBOL index, where the Summation Index has moved above +775, its highest level in years.
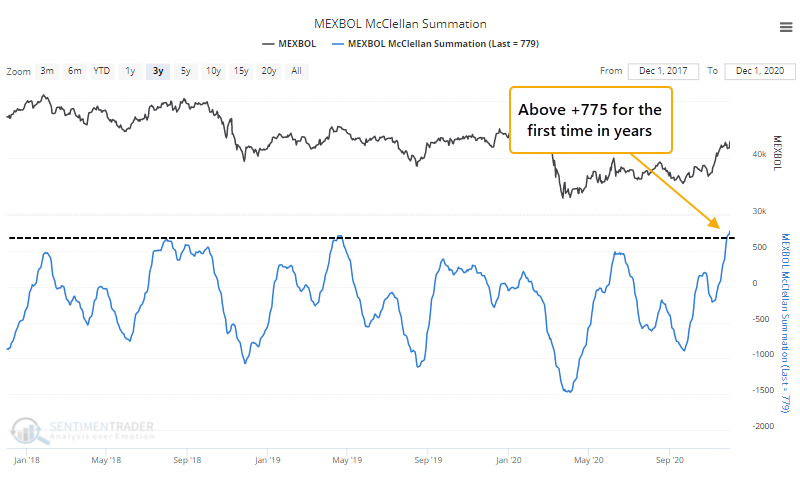
Here, too, we saw some short-term weakness but it was a good medium- to long-term sign.
The recovery in some of these markets is the most impressive in months, or even years. While some weakness was common, it was generally confined to the first month or so after the recovery reached its current level. On a medium- to long-term basis, most of these showed strong results.
Active Studies
| Time Frame | Bullish | Bearish | | Short-Term | 0 | 0 | | Medium-Term | 5 | 8 | | Long-Term | 51 | 2 |
|
Indicators at Extremes
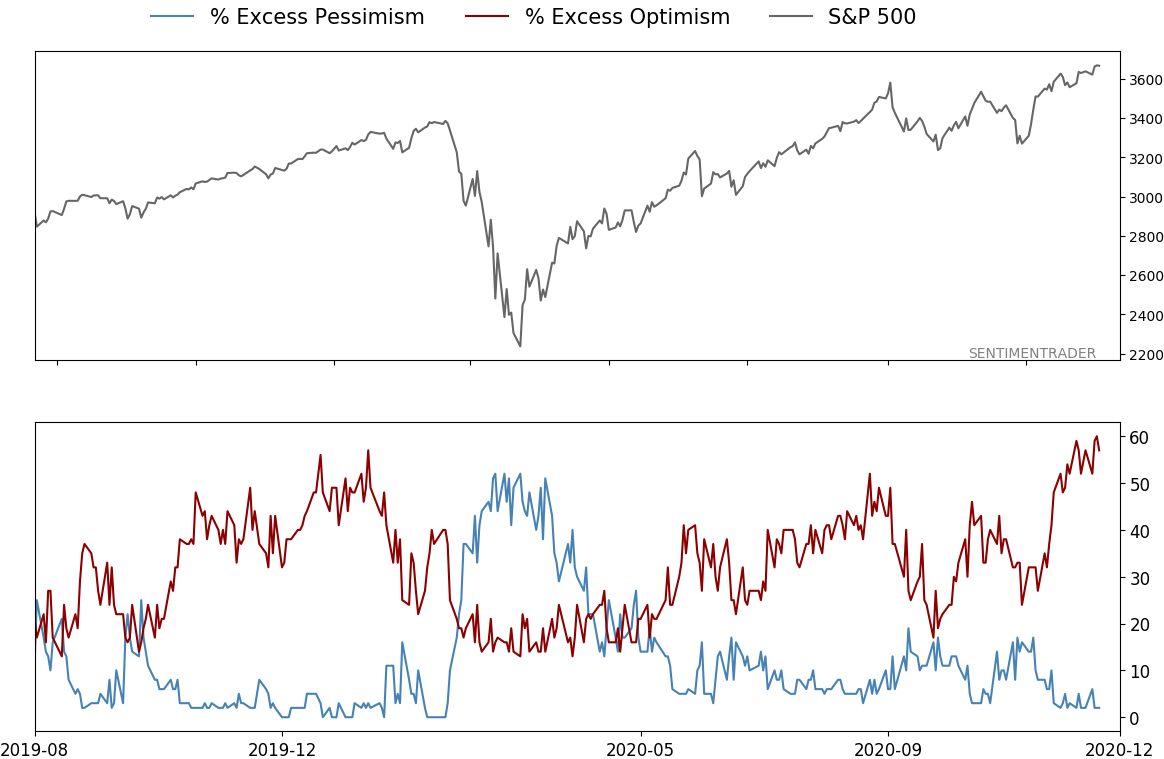
% Showing Pessimism: 2%
Bullish for Stocks
VIX
|
|
Portfolio
| Position | Description | Weight % | Added / Reduced | Date | | Stocks | 15.6% RSP, 10.1% VWO, 7.5% XLE, 5.1% PSCE | 41.2 | Added 5% | 2020-10-15 | | Bonds | 10% BND, 10% SCHP, 10% ANGL | 28.6 | Reduced 0.1% | 2020-10-02 | | Commodities | GCC | 2.4 | Reduced 2.1%
| 2020-09-04 | | Precious Metals | GDX | 9.5 | Added 4.8% | 2020-12-01 | | Special Situations | | 0.0 | Reduced 5% | 2020-10-02 | | Cash | | 18.3 | | |
|
Updates (Changes made today are underlined)
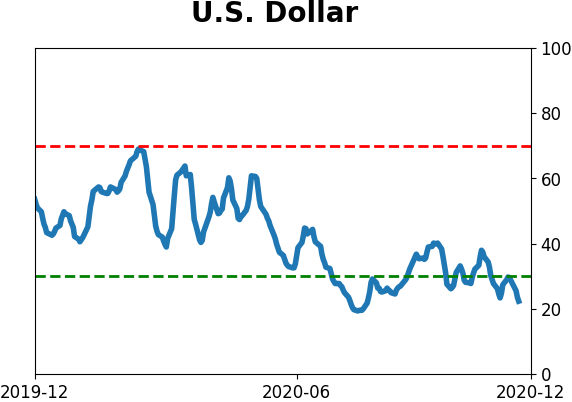
I've been quiet here because there hasn't been much to do. The things that were supposed to work have pretty much been doing so. With sentiment extremely stretched, I have no desire to add exposure there. About the only place I would add is energy, which has been following through exactly as it should. I did add back to my position in gold miners, due to the studies recently posted to the site. When gold (and miners) have pulled back after momentum like they enjoyed since March, the typical reaction is a resumption of the uptrend over the medium-term, and not a rollover into a bear phase. The continued weakness in the dollar certainly helps. RETURN YTD: 6.3% 2019: 12.6%, 2018: 0.6%, 2017: 3.8%, 2016: 17.1%, 2015: 9.2%, 2014: 14.5%, 2013: 2.2%, 2012: 10.8%, 2011: 16.5%, 2010: 15.3%, 2009: 23.9%, 2008: 16.2%, 2007: 7.8%
|
|
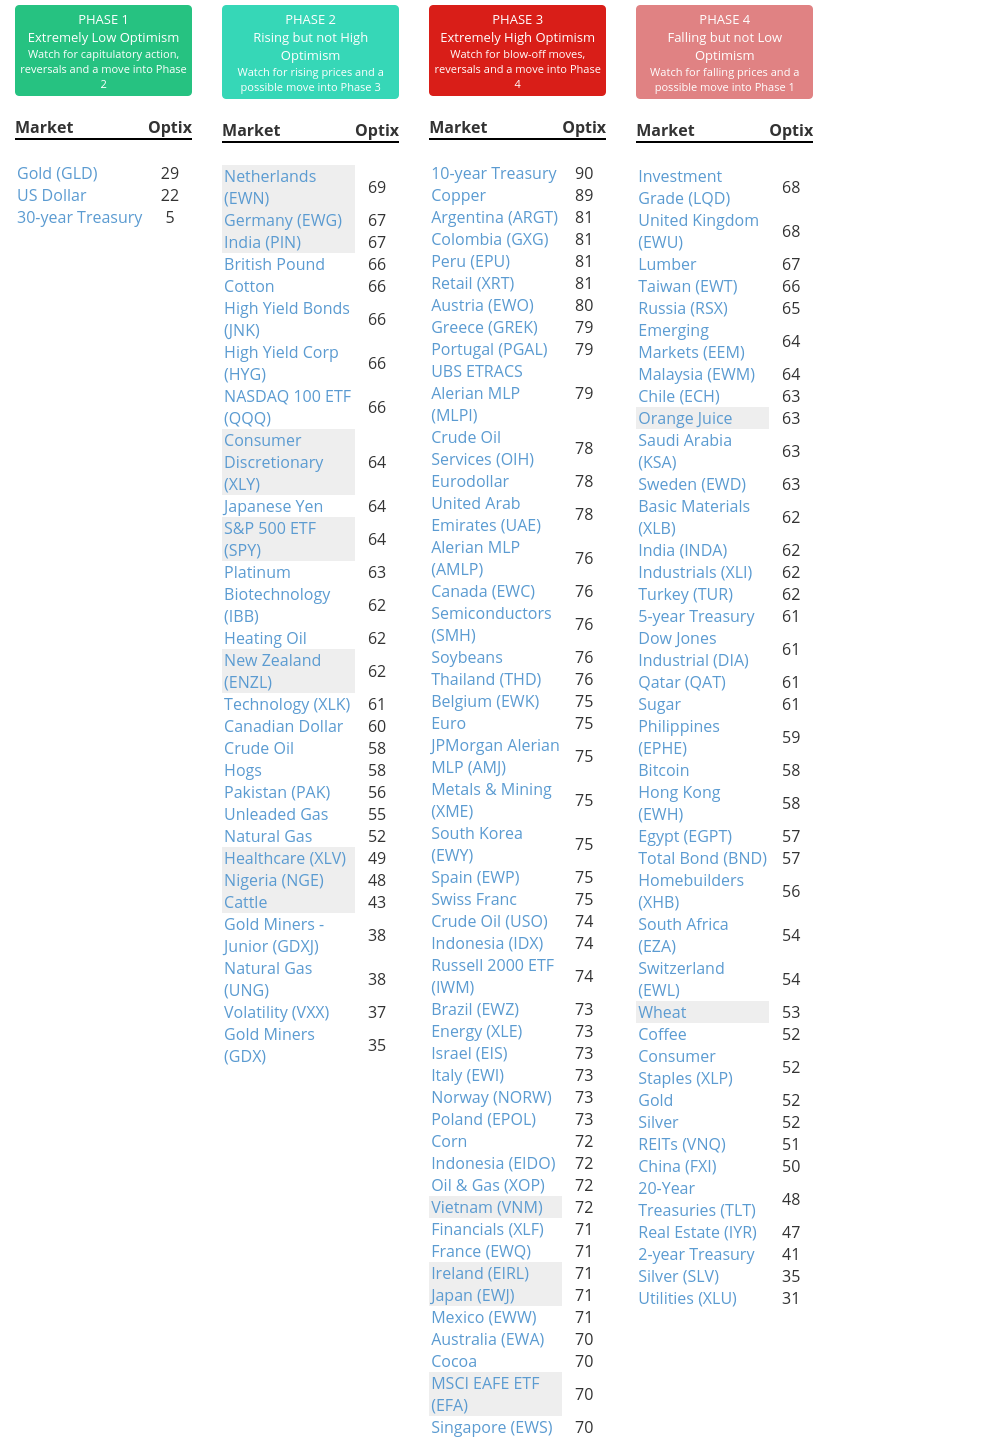
Phase Table
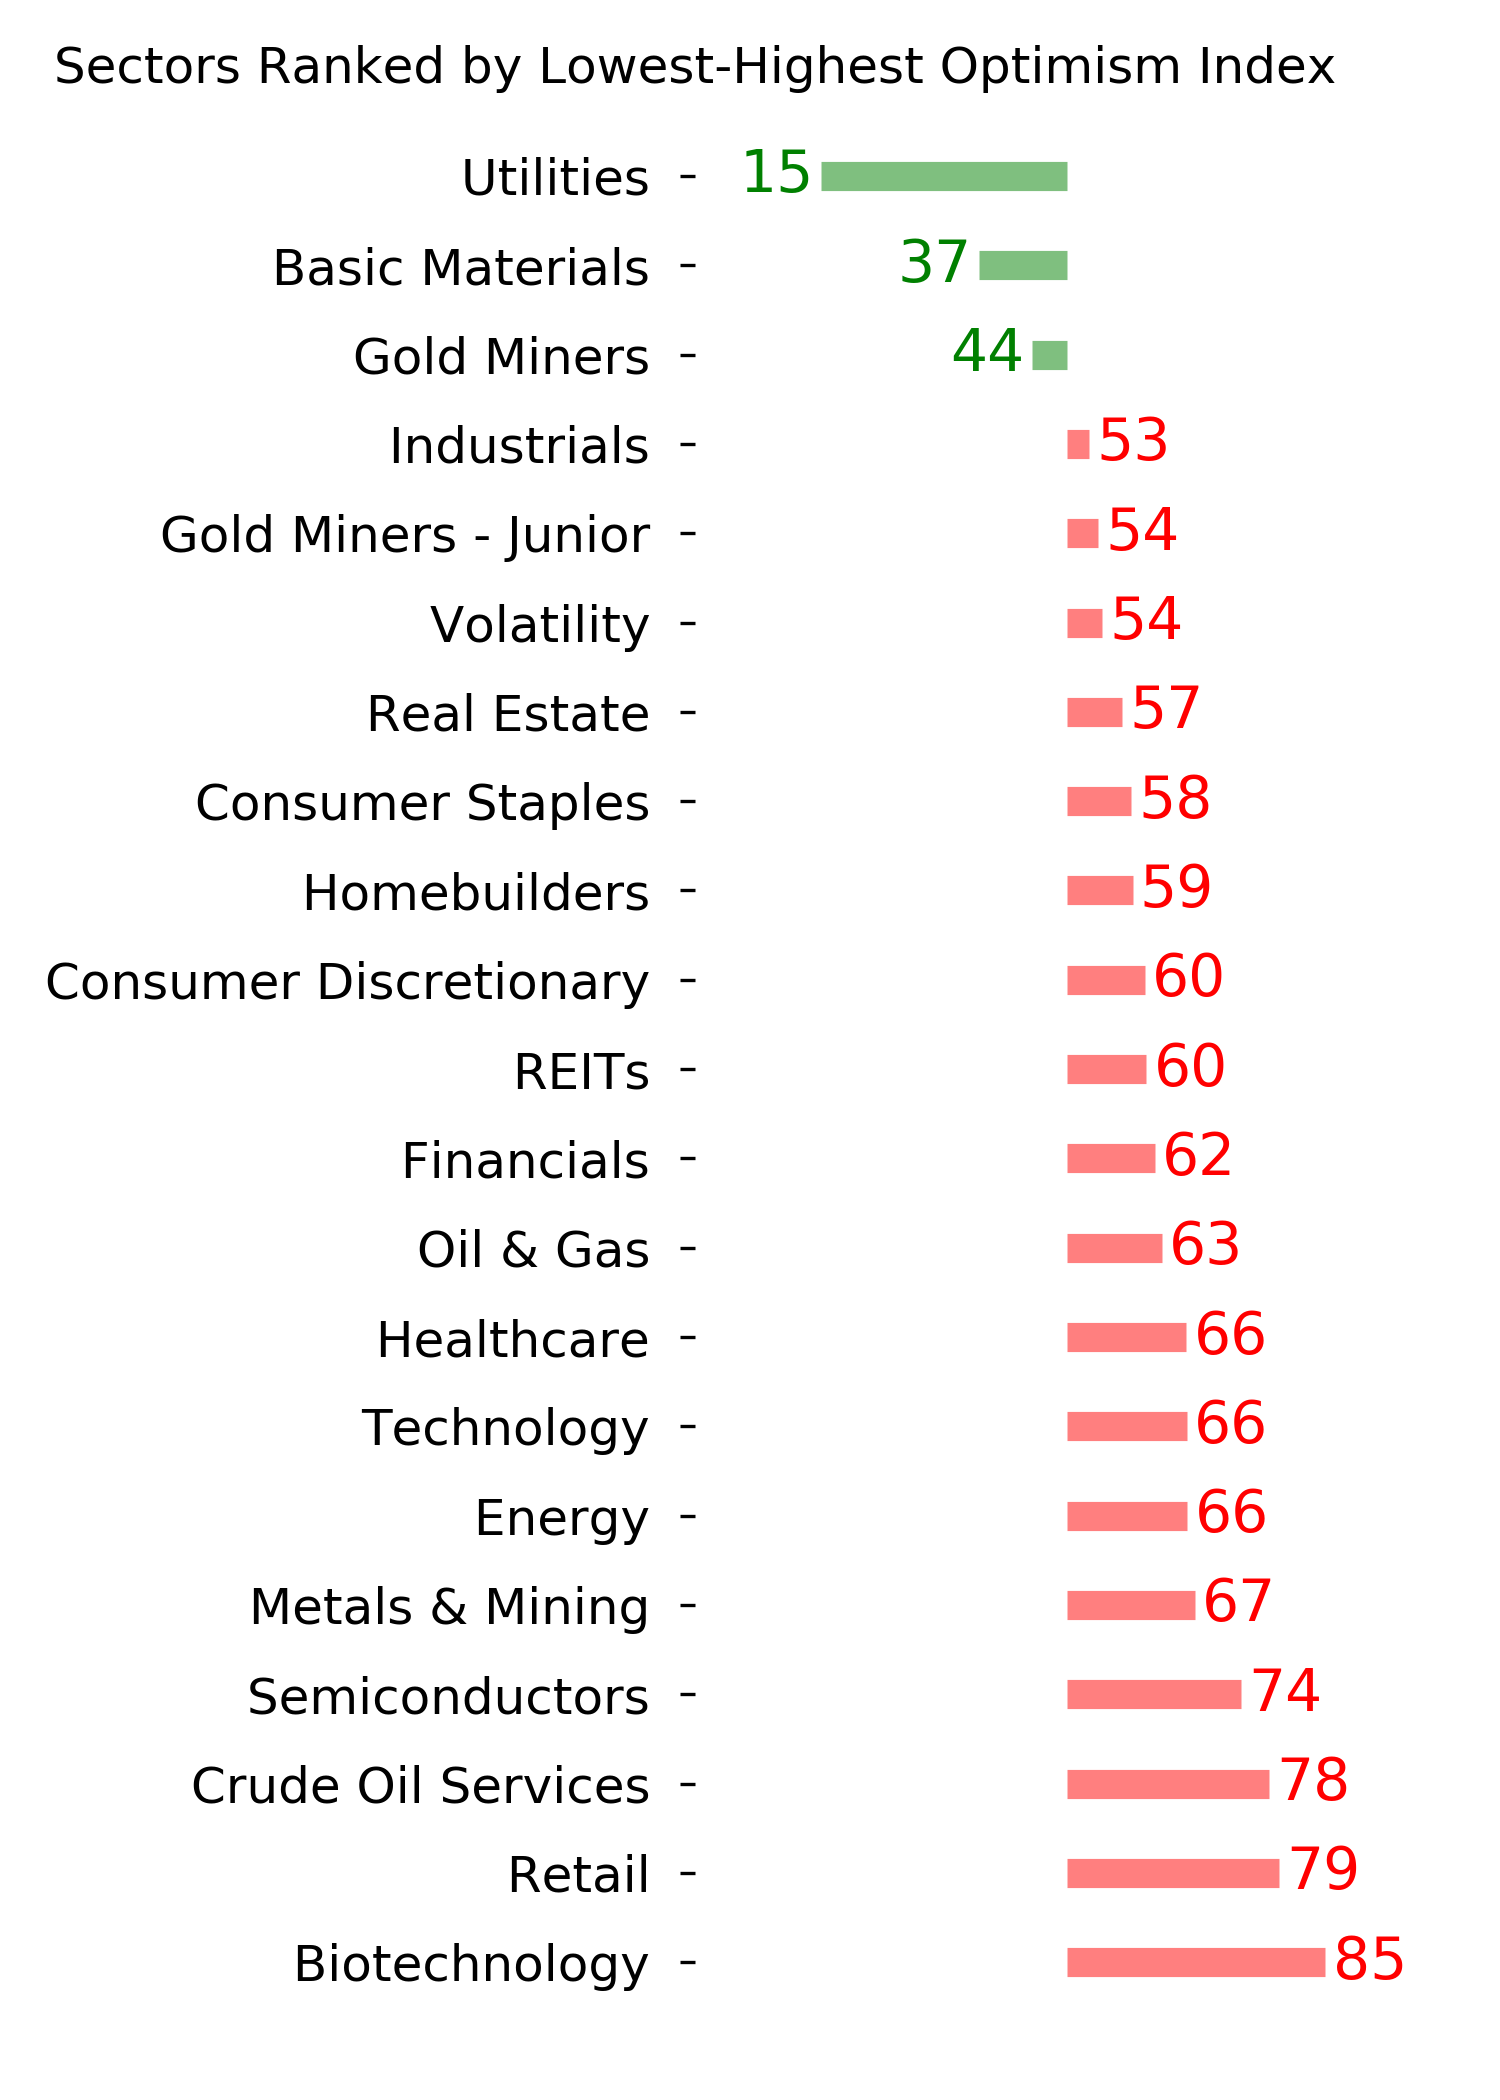
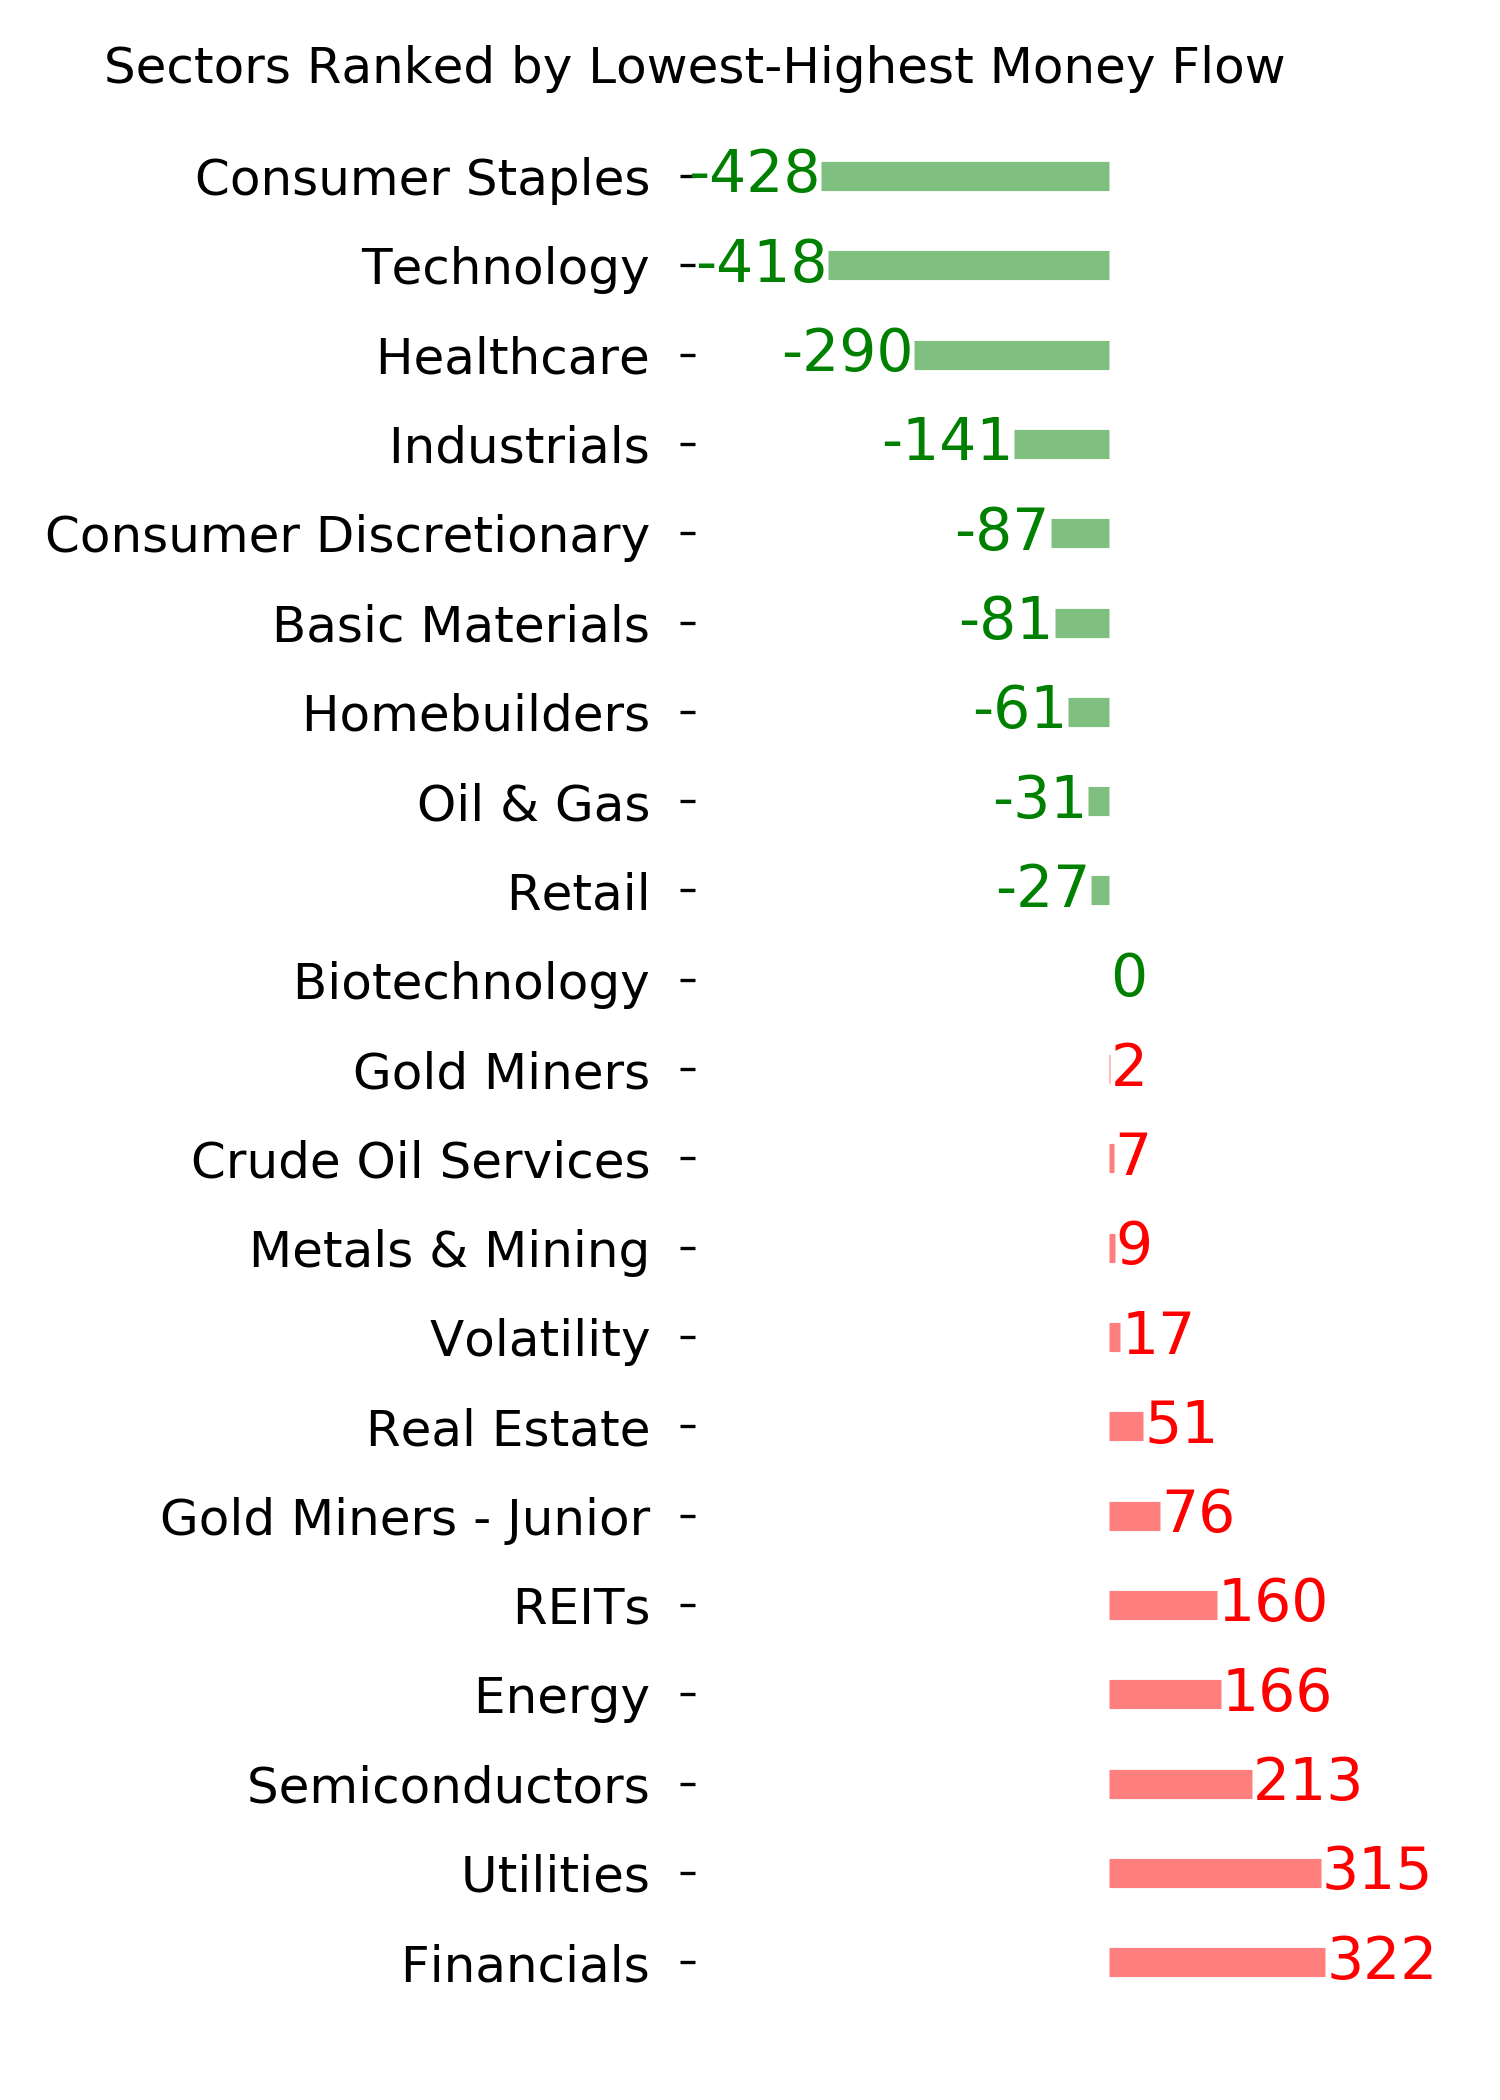
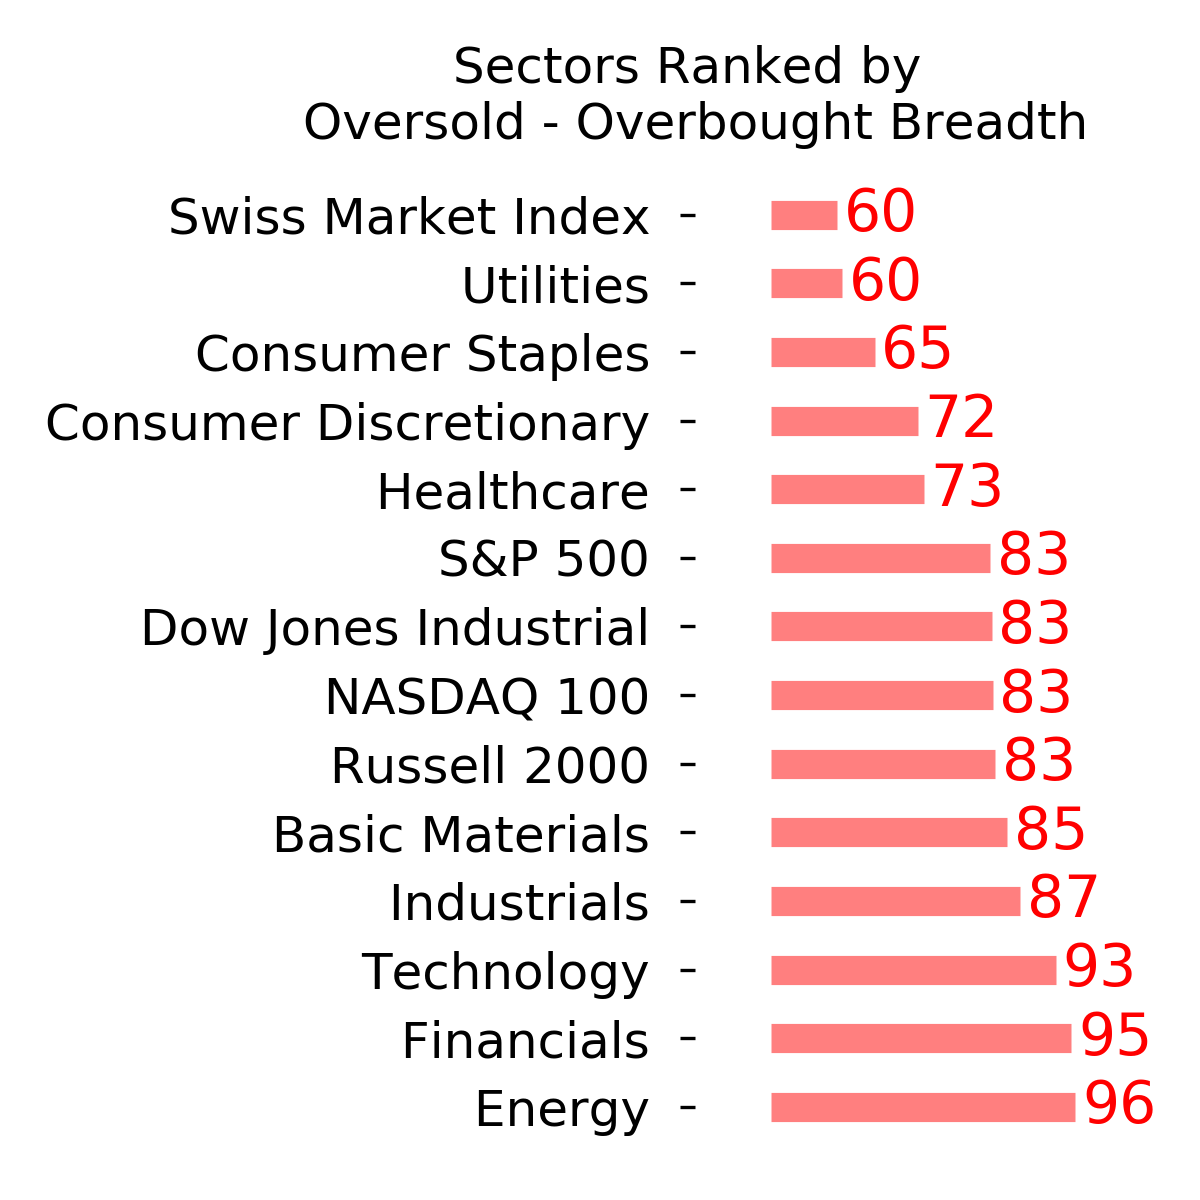
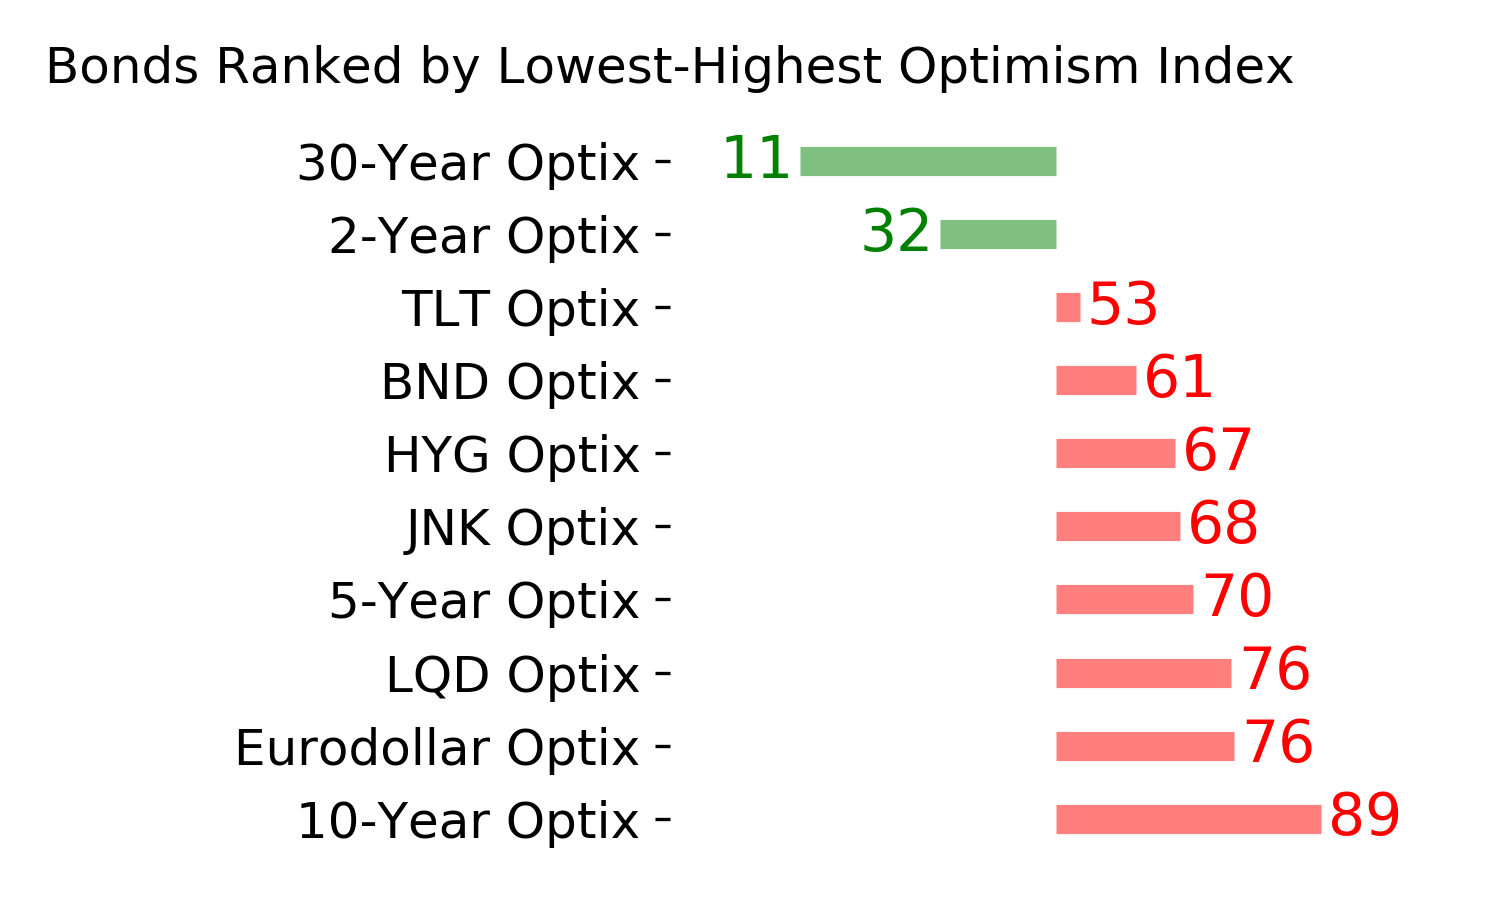
Ranks
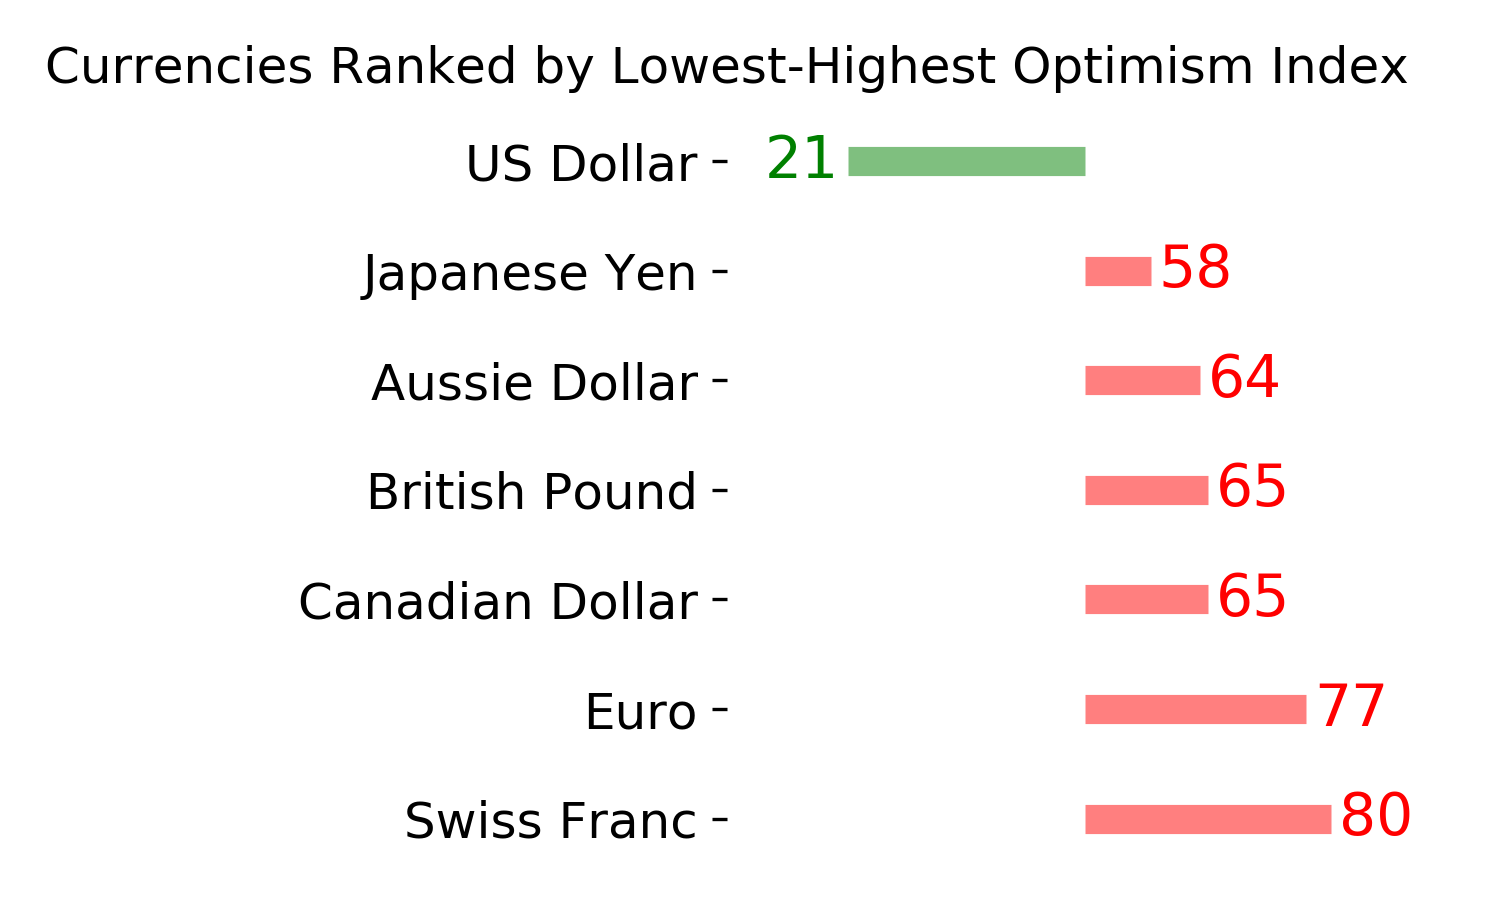
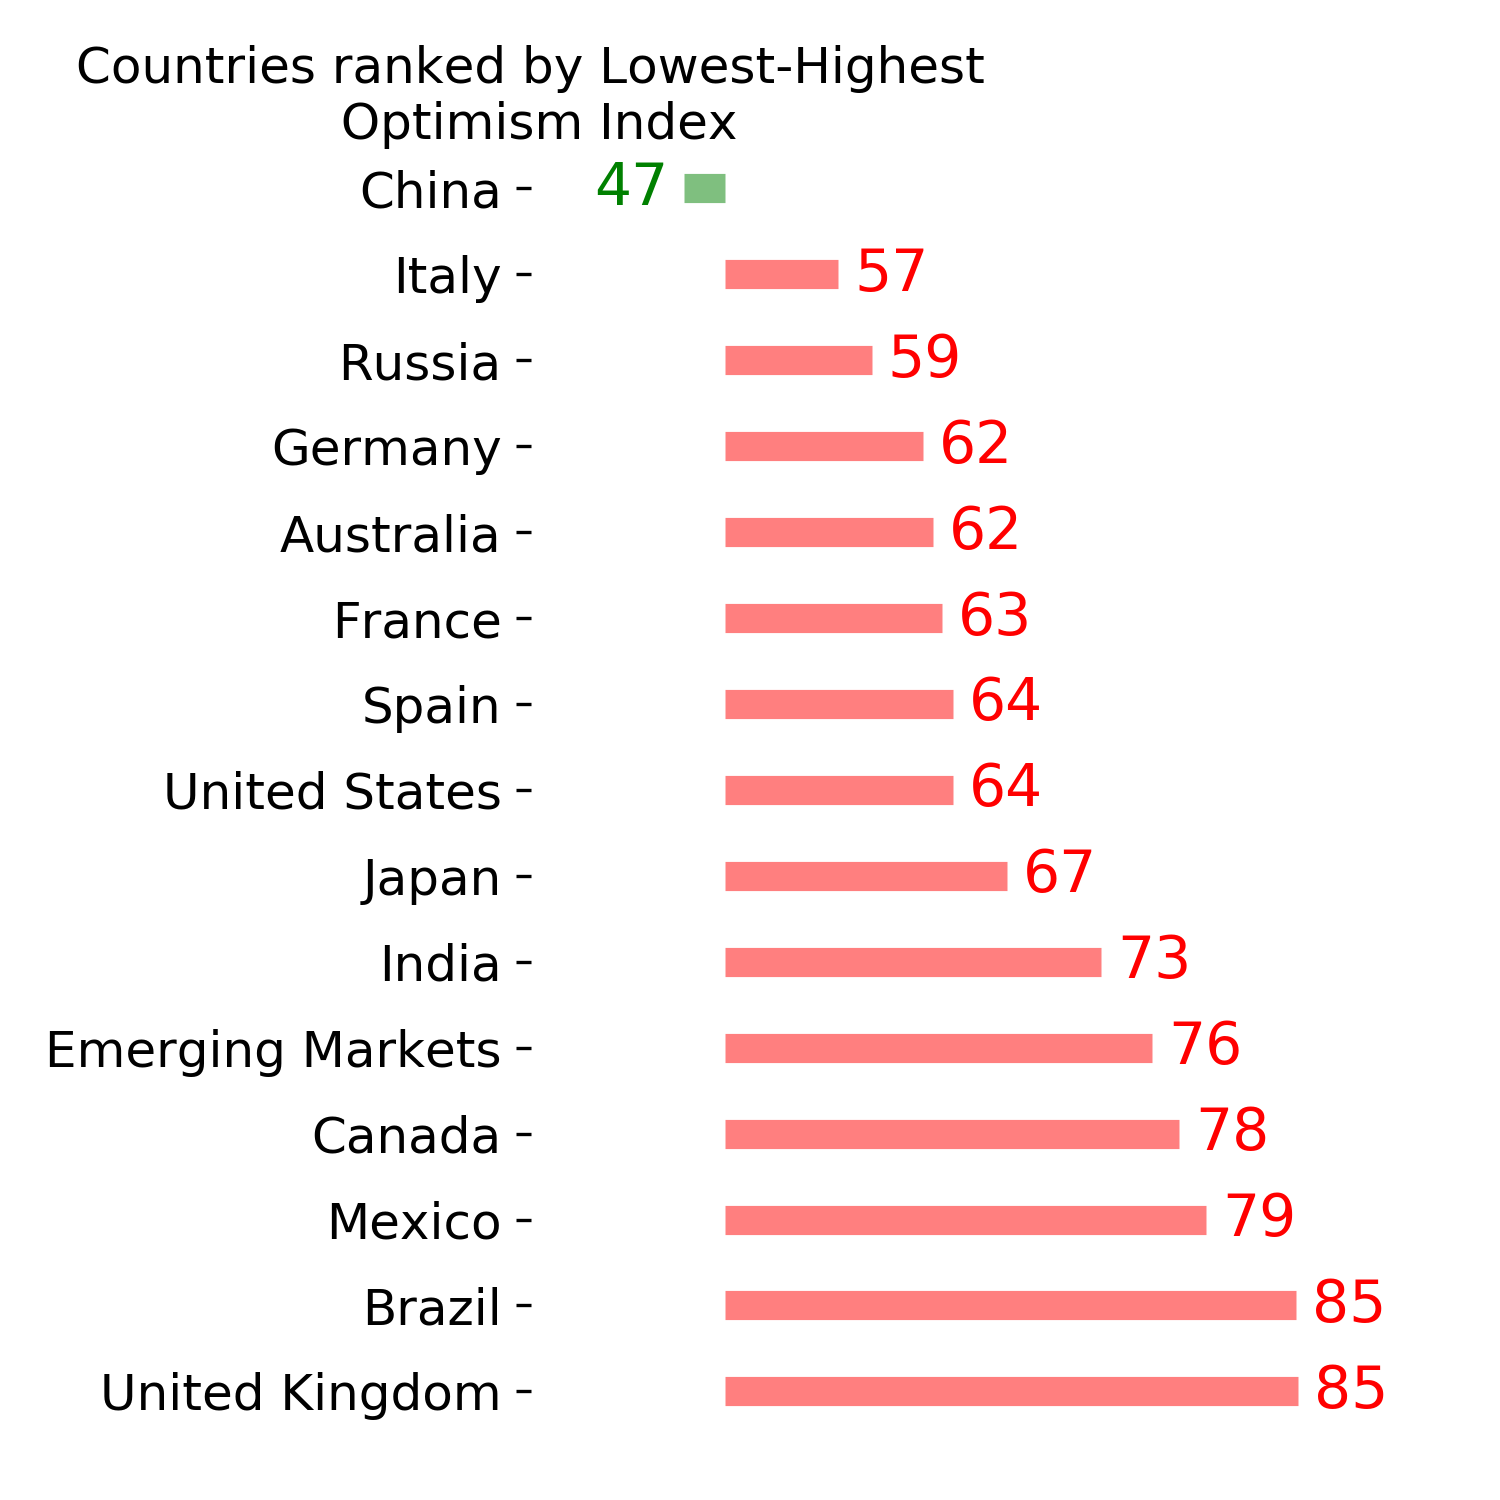
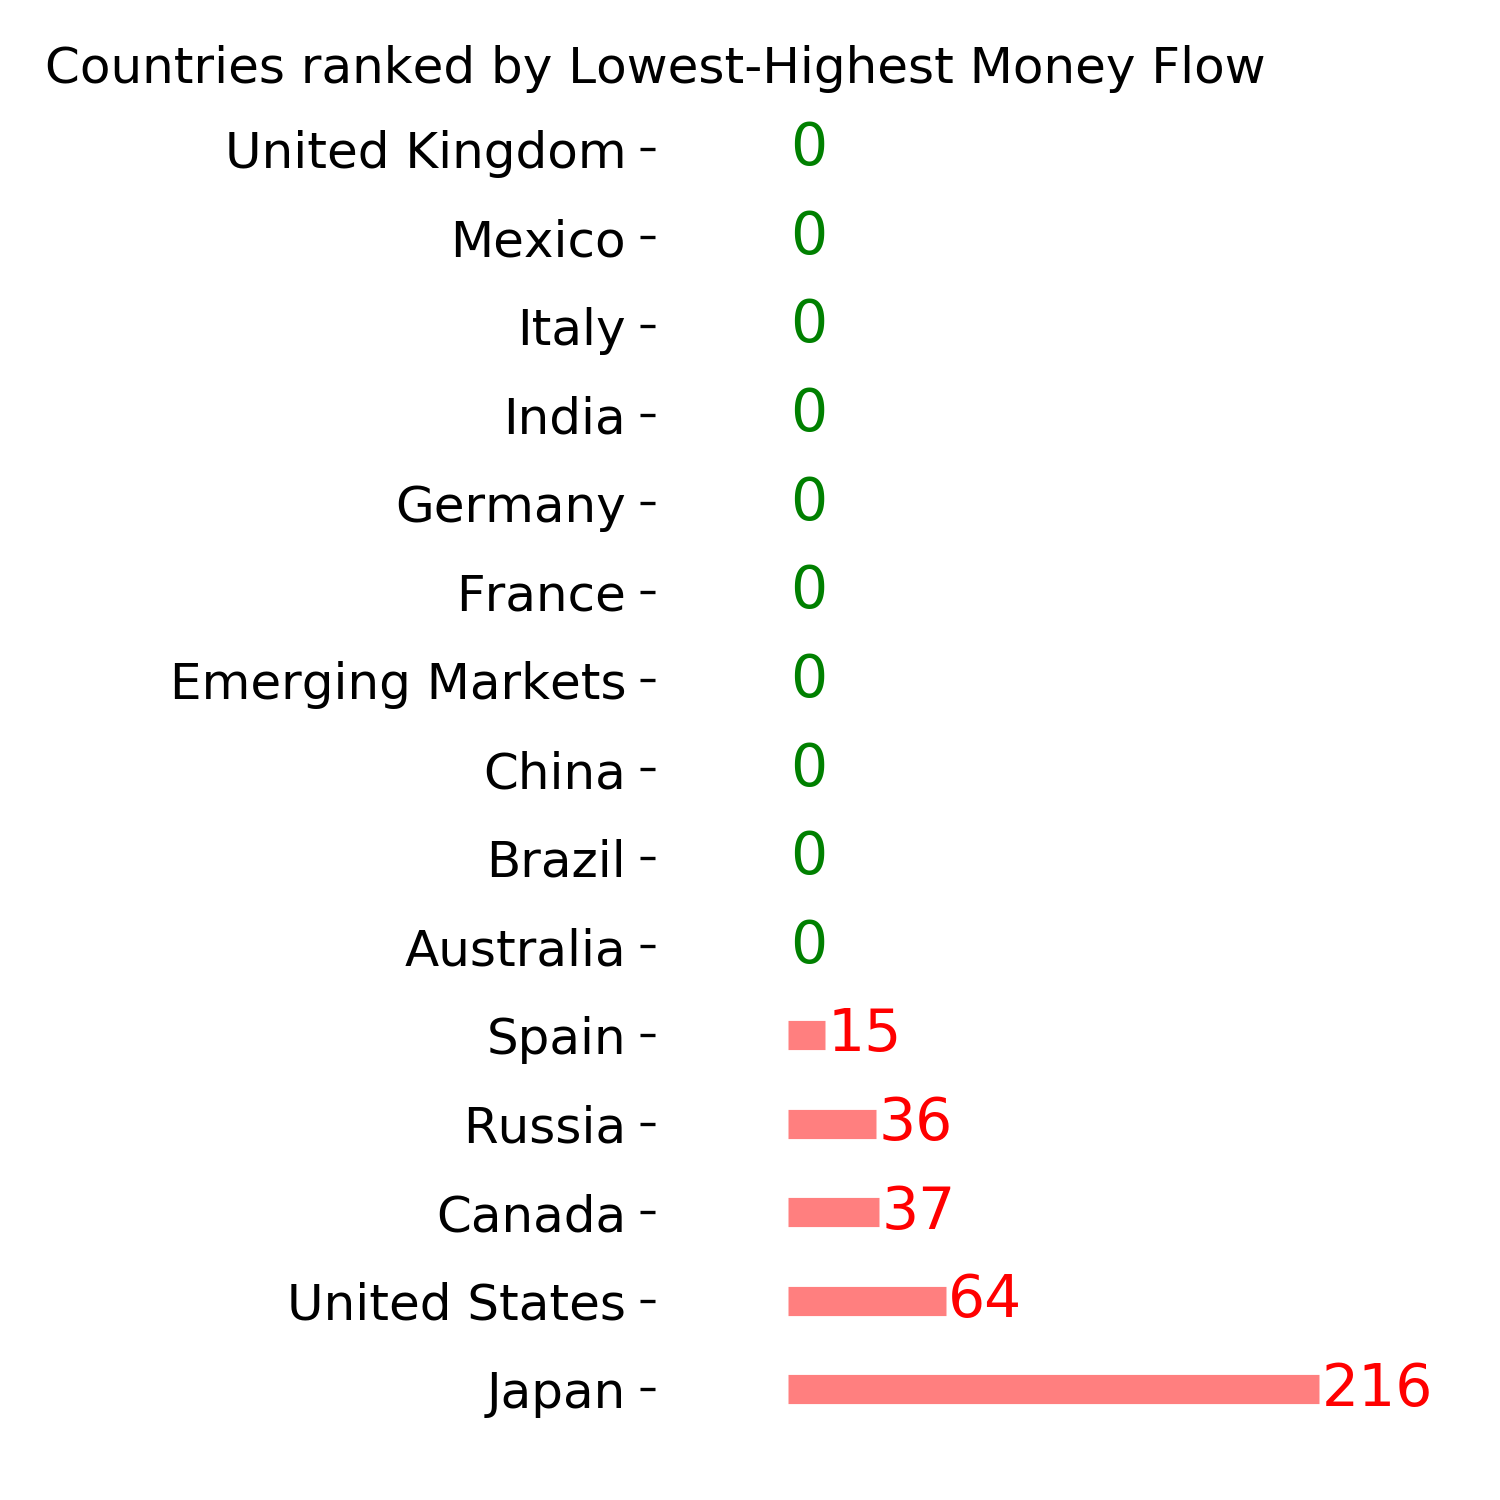
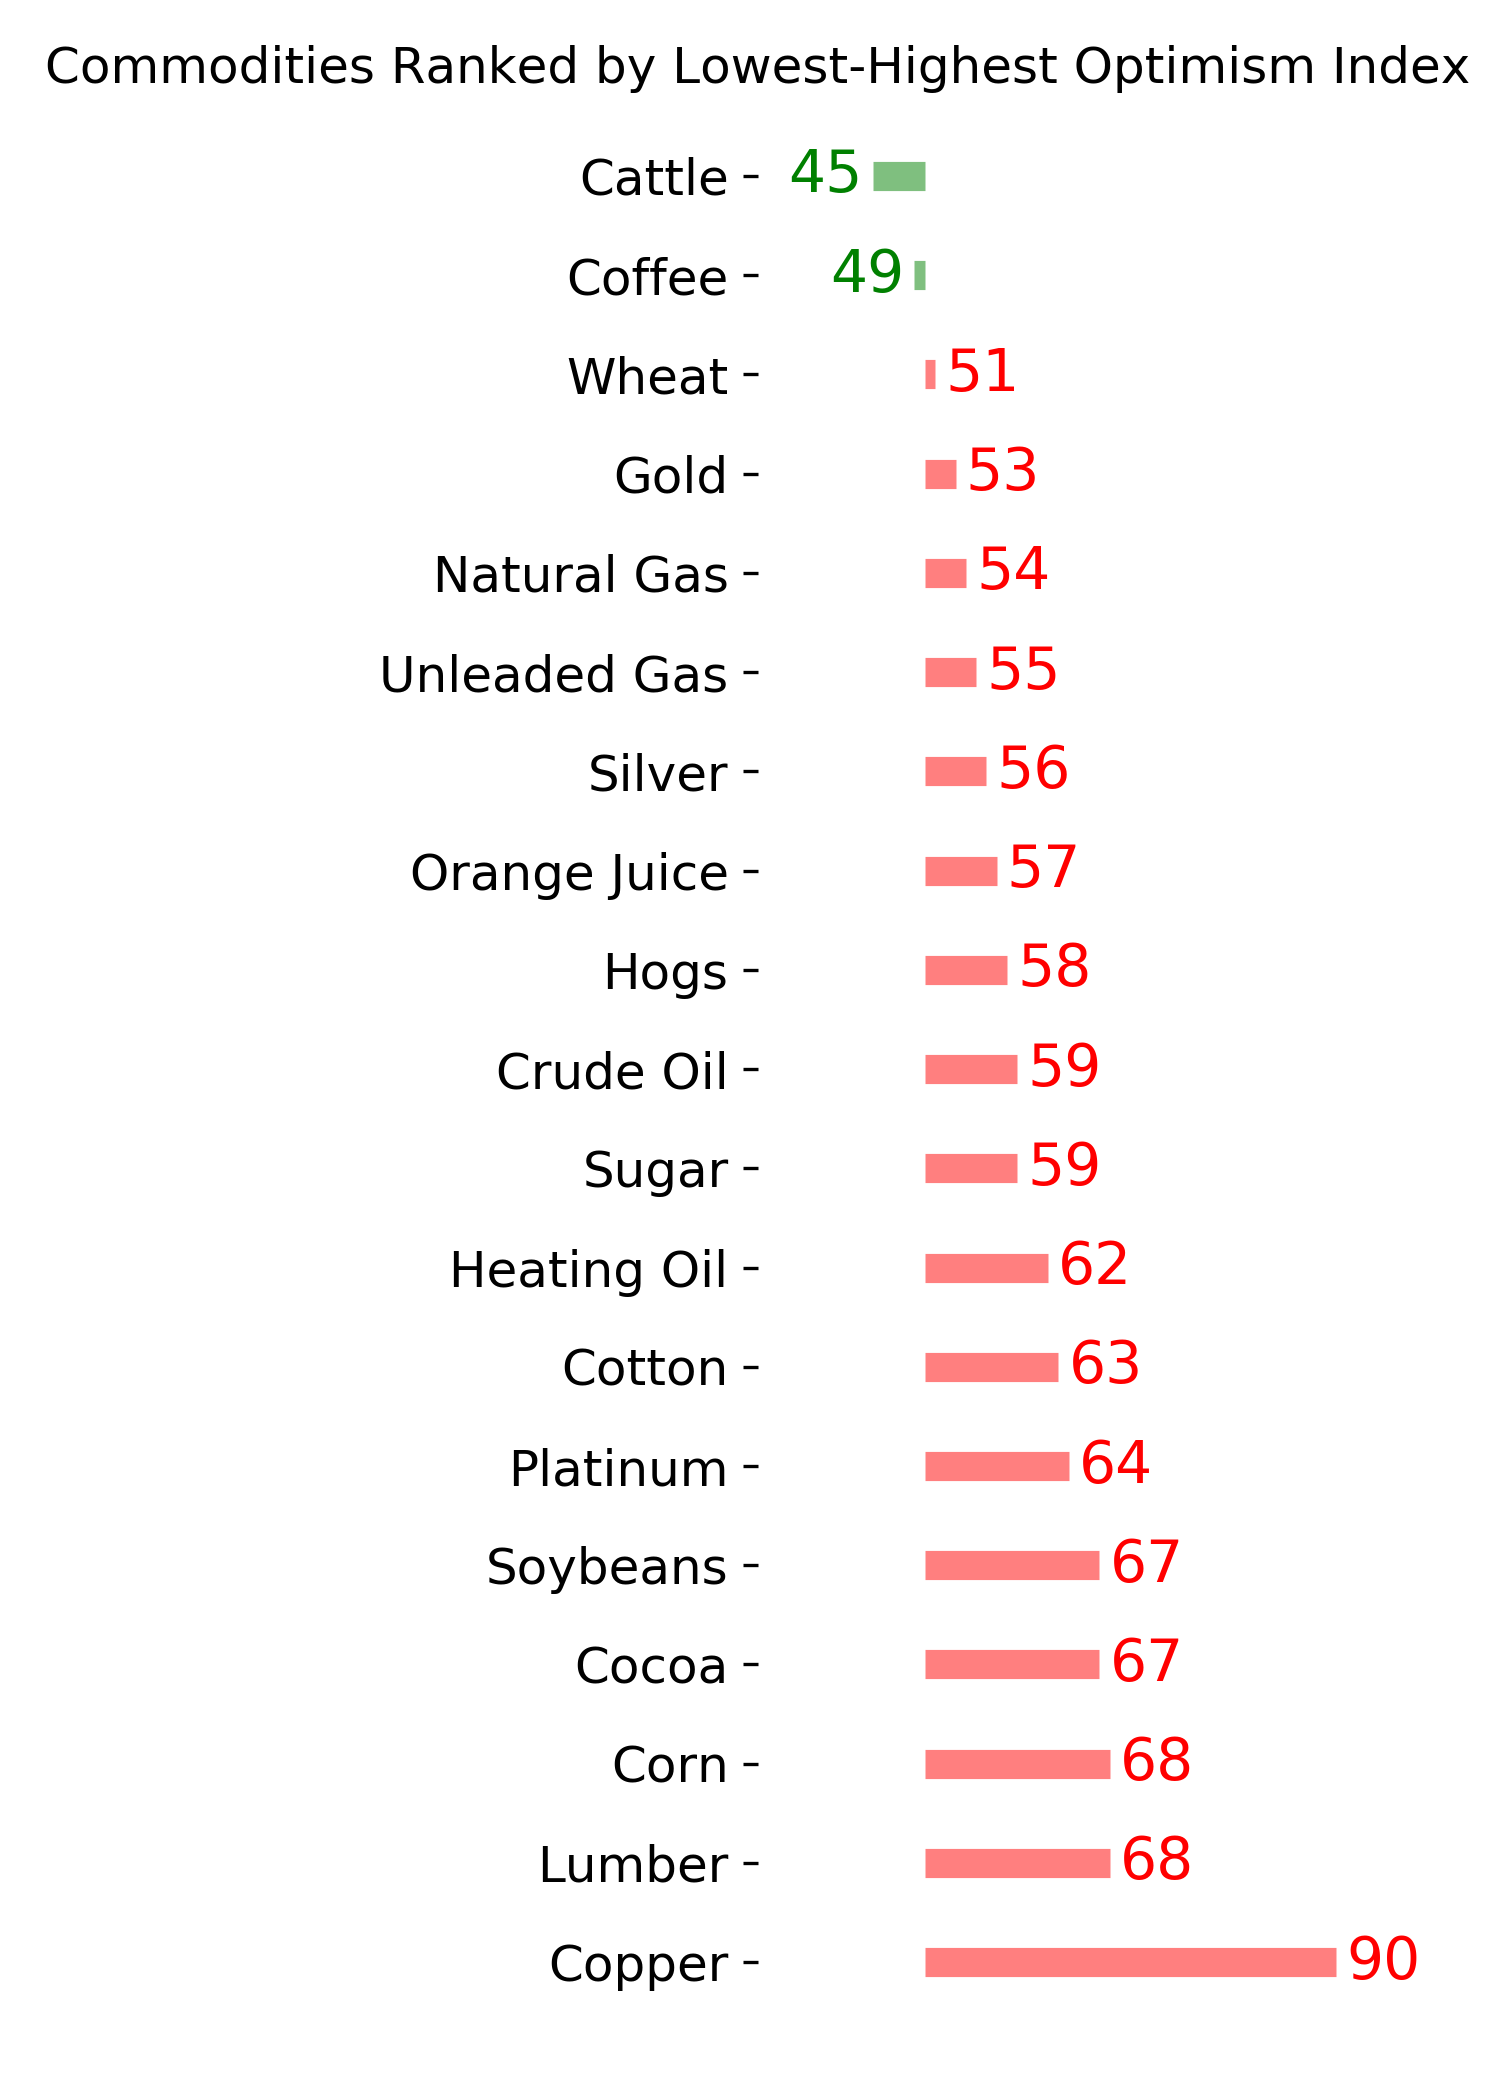
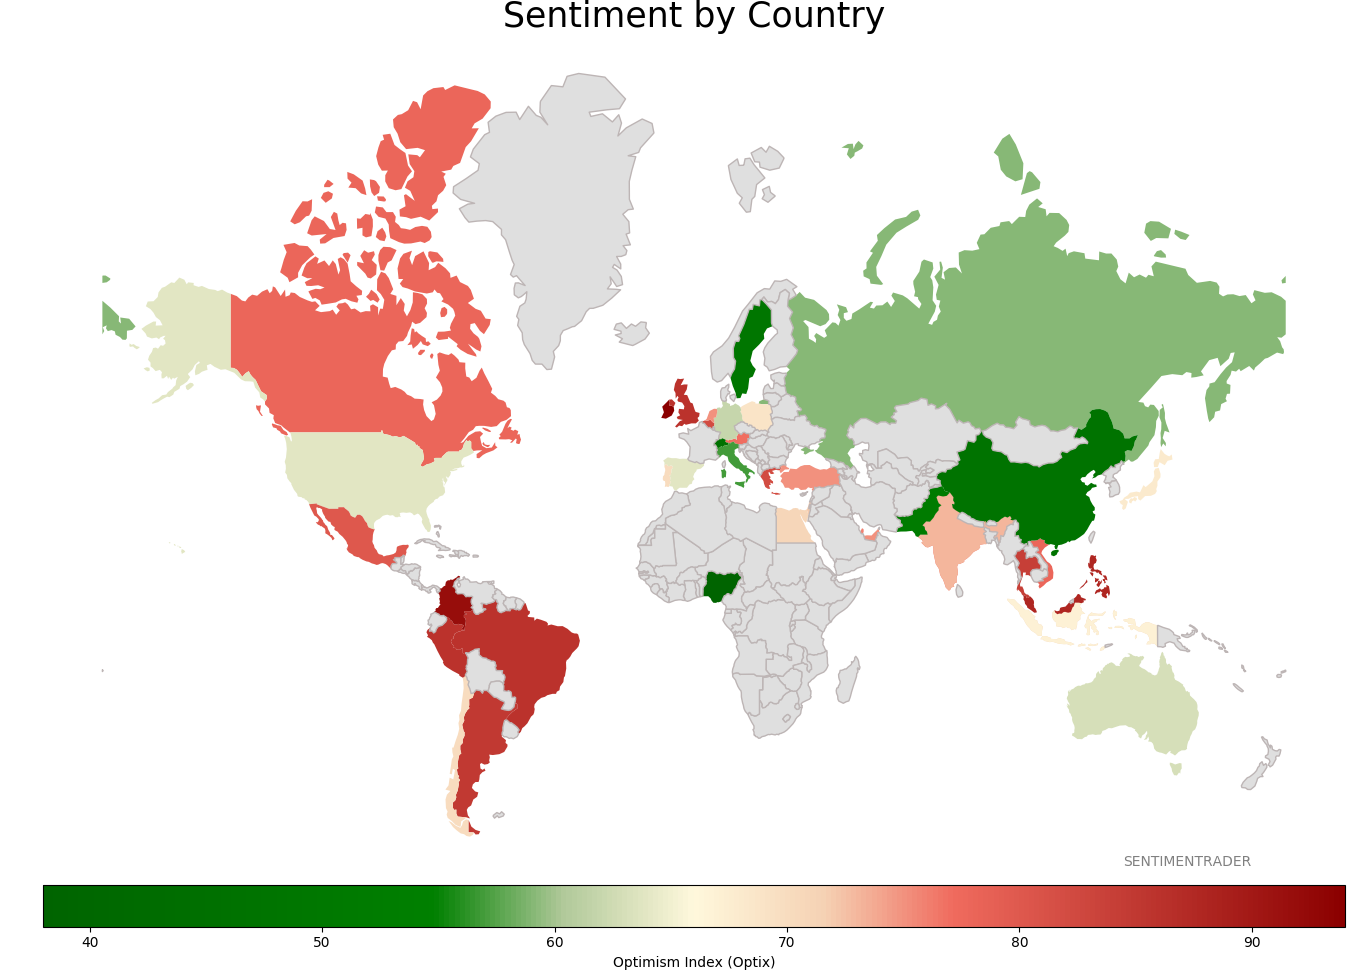
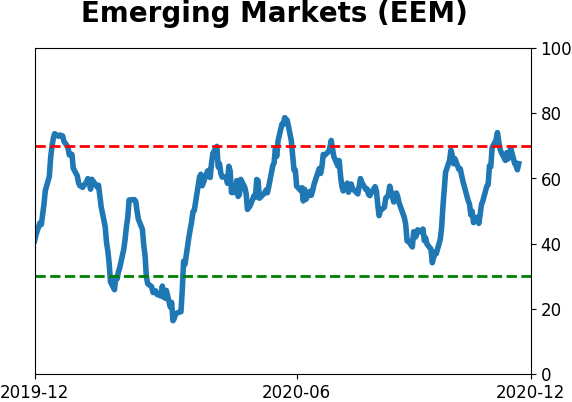
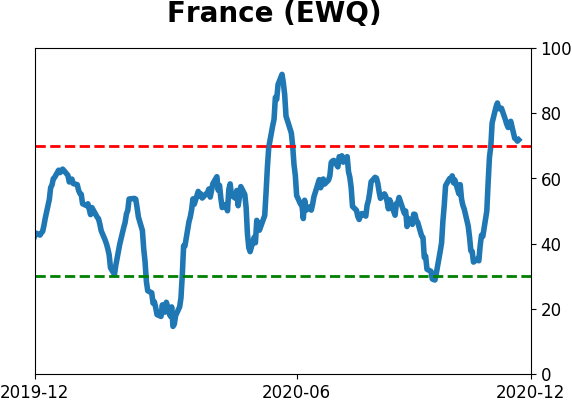
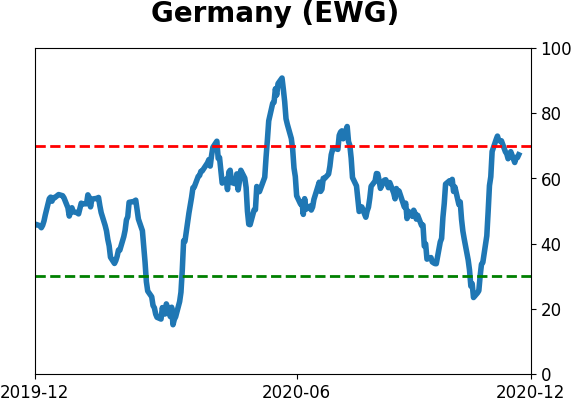
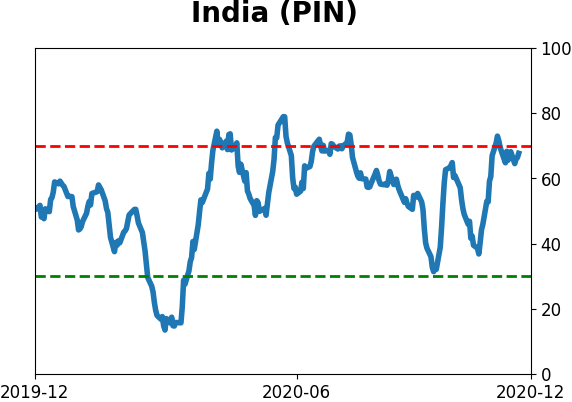
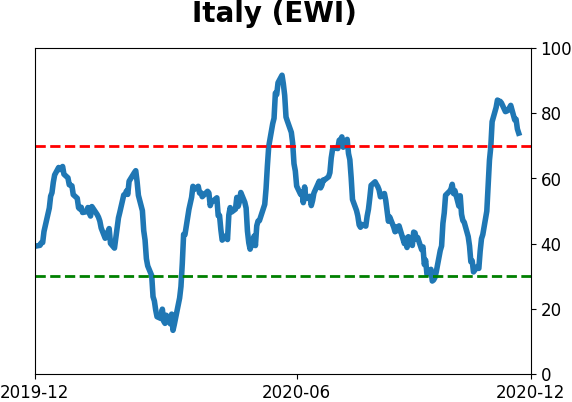
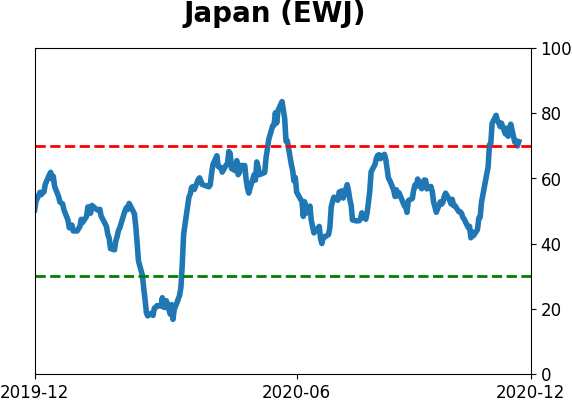
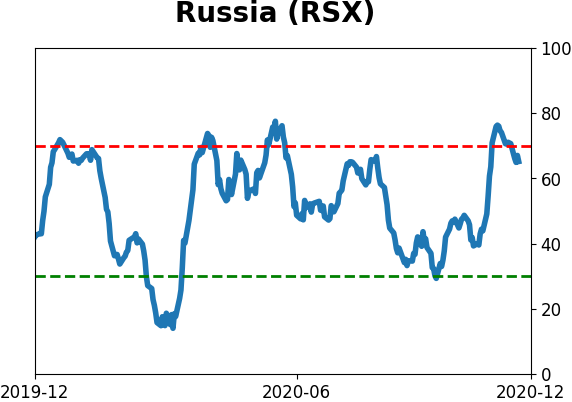
Sentiment Around The World
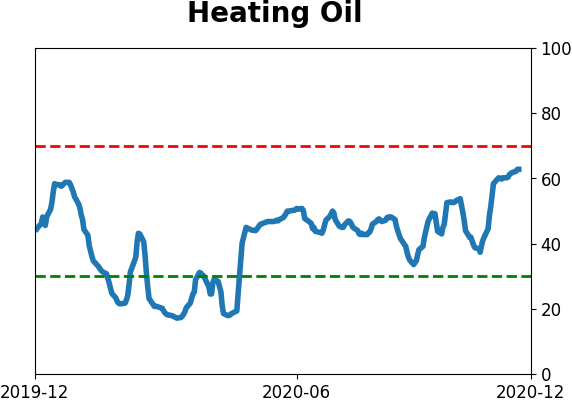
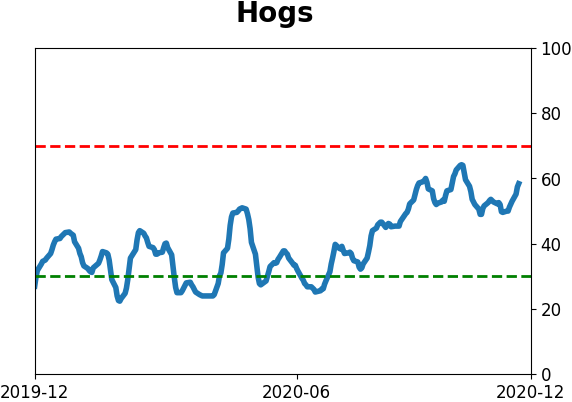
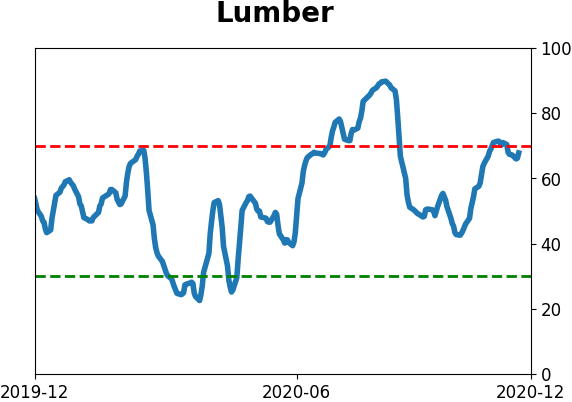
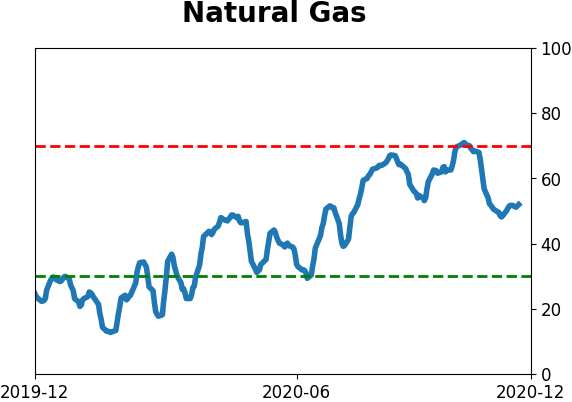
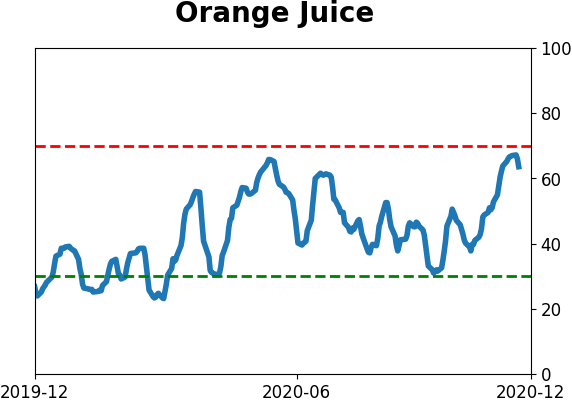
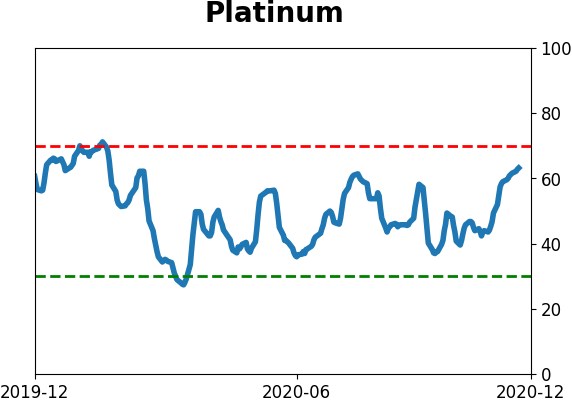
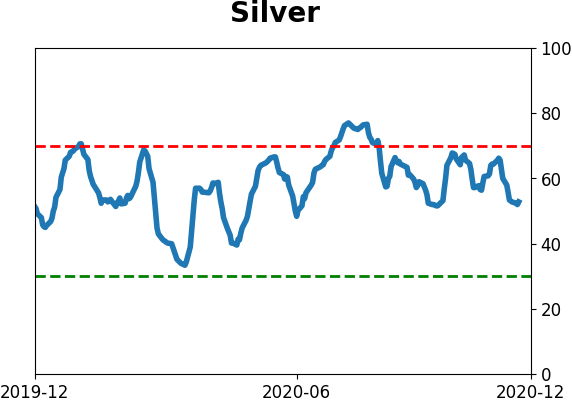
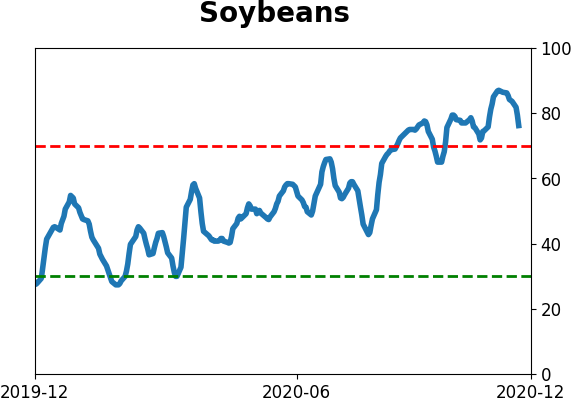
Optimism Index Thumbnails
|
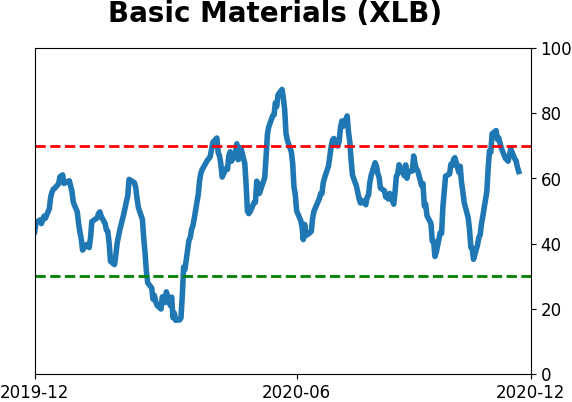
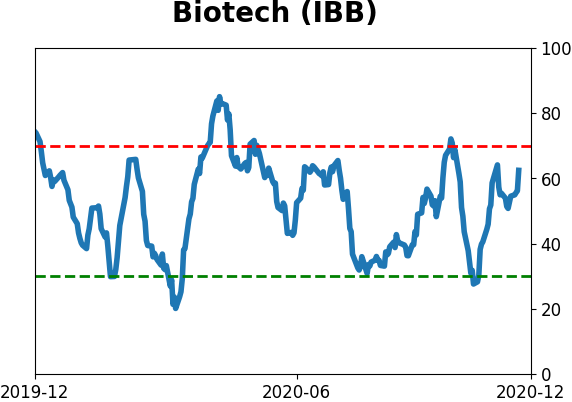
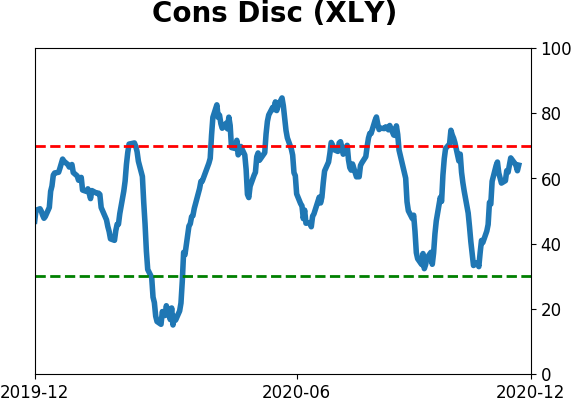
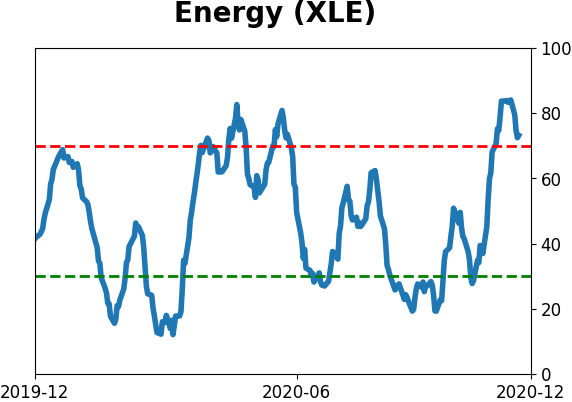
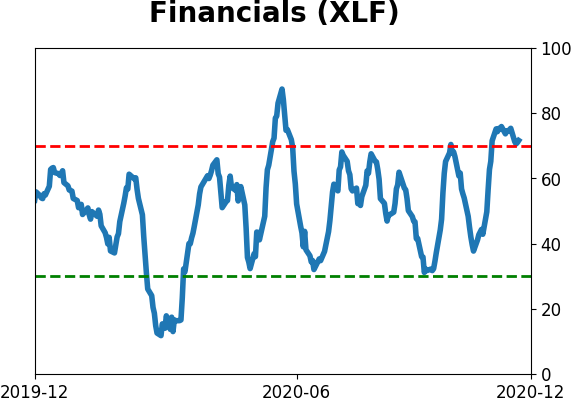
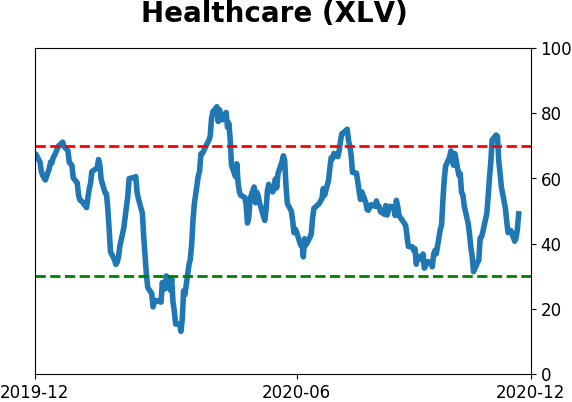
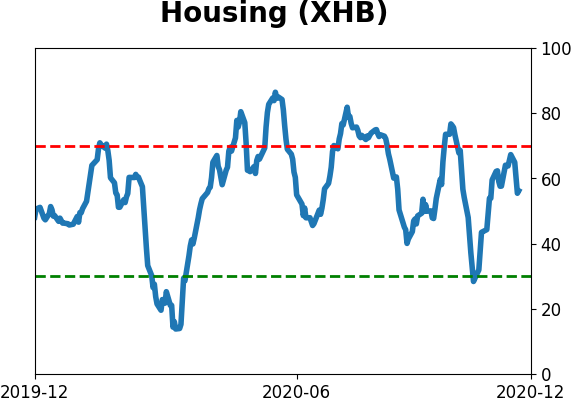
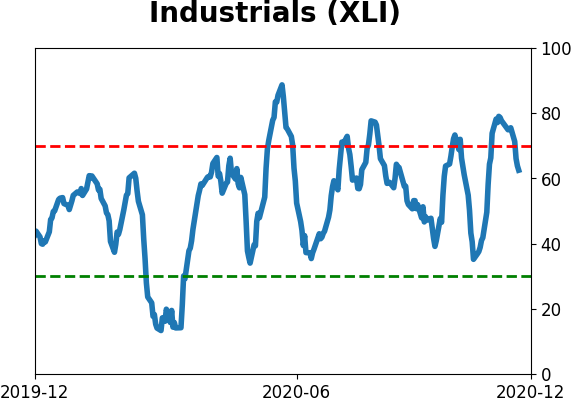
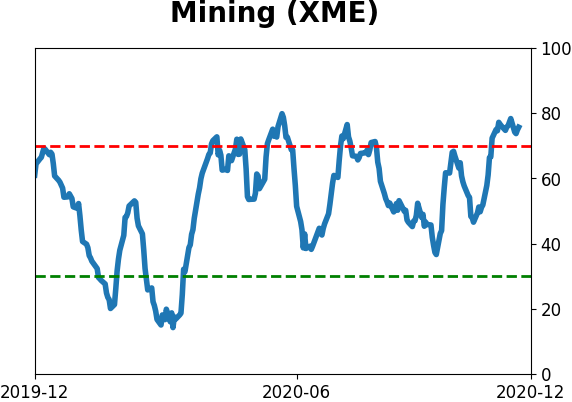
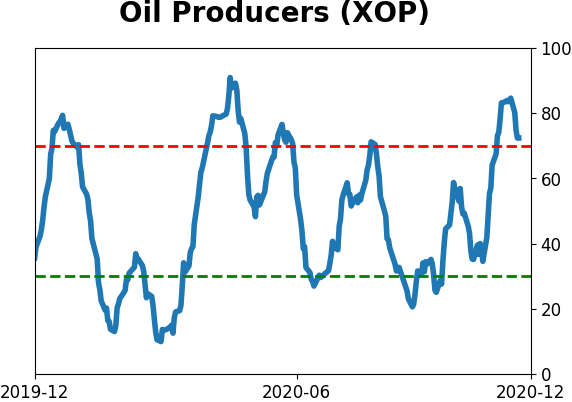
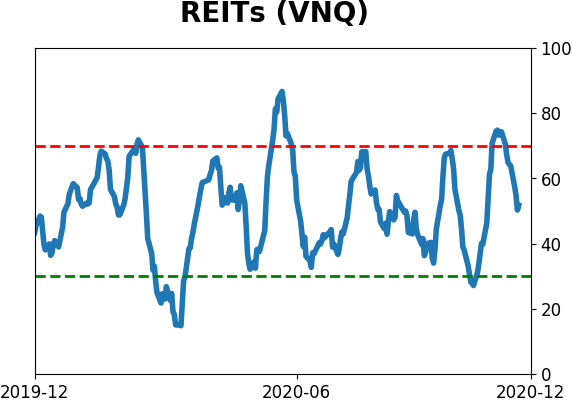
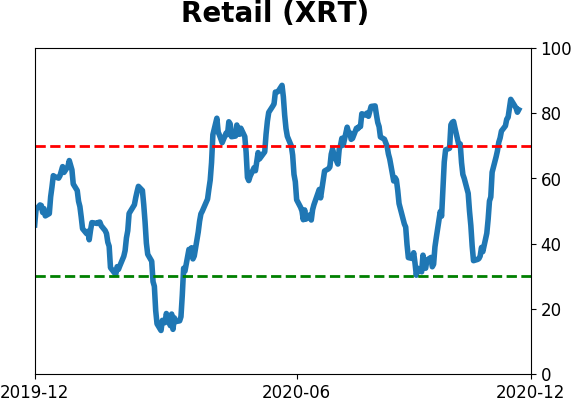
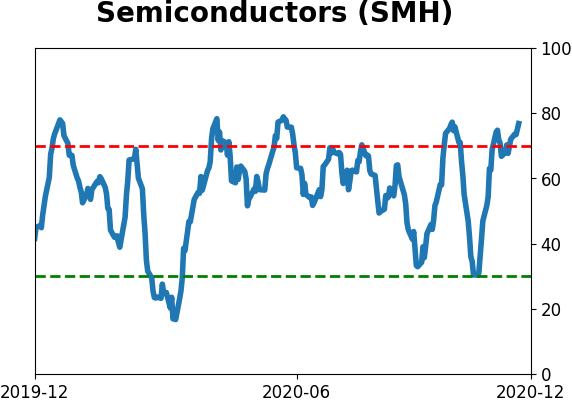
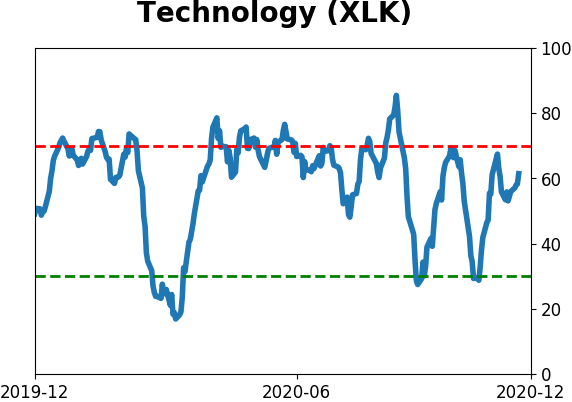
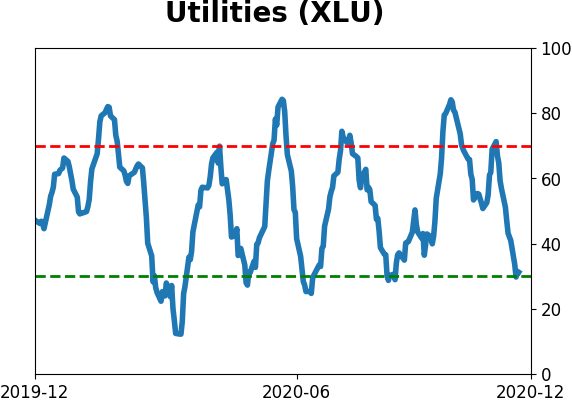
Sector ETF's - 10-Day Moving Average
|
|
|
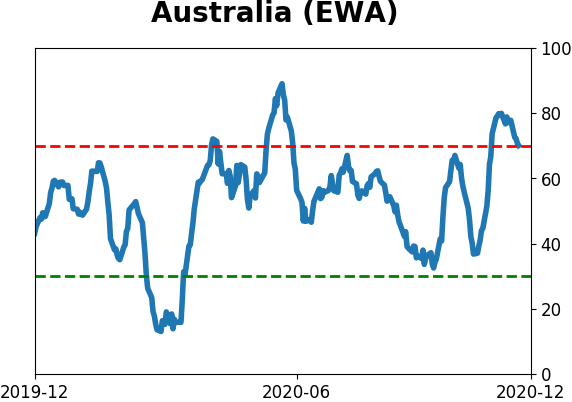
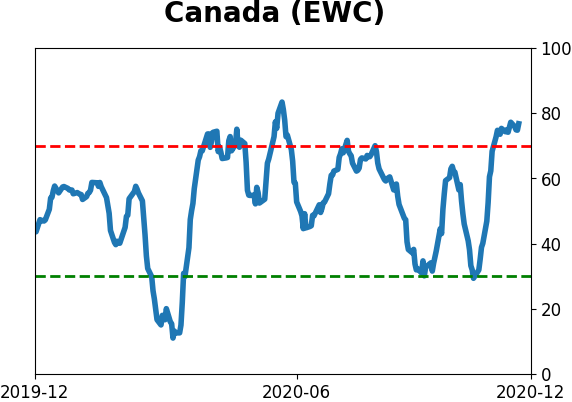
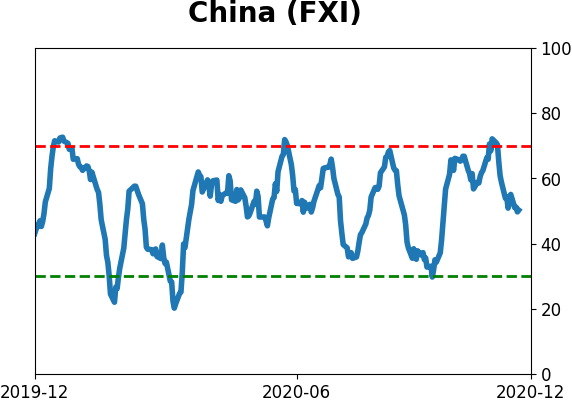
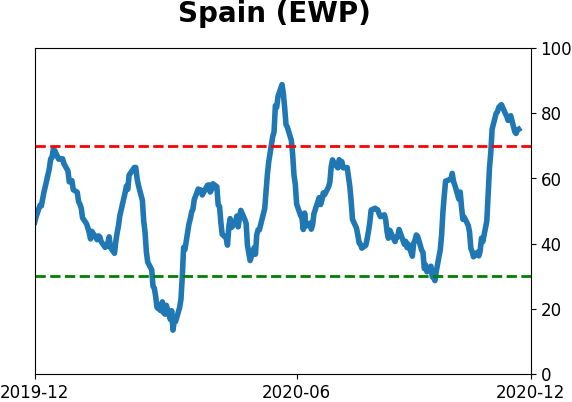
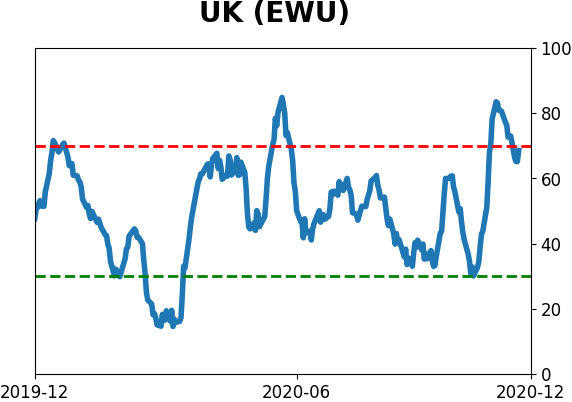
Country ETF's - 10-Day Moving Average
|
|
|
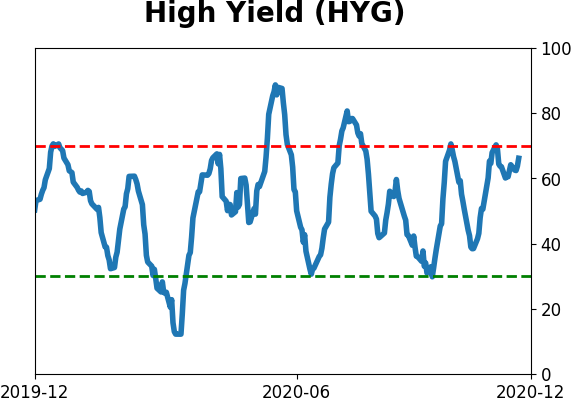
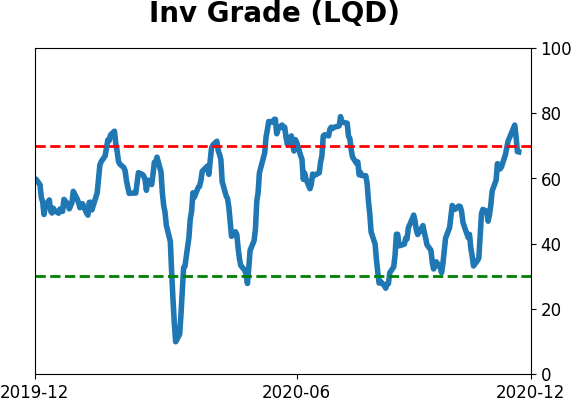
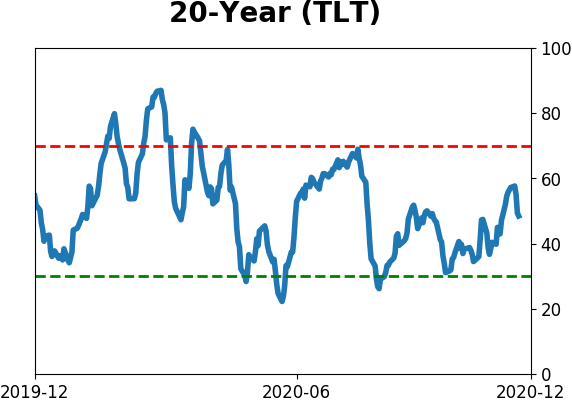
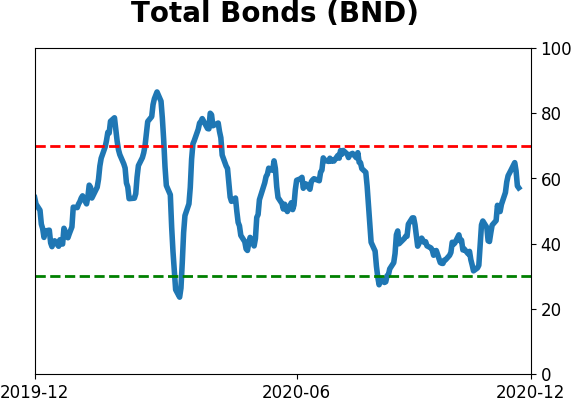
Bond ETF's - 10-Day Moving Average
|
|
|
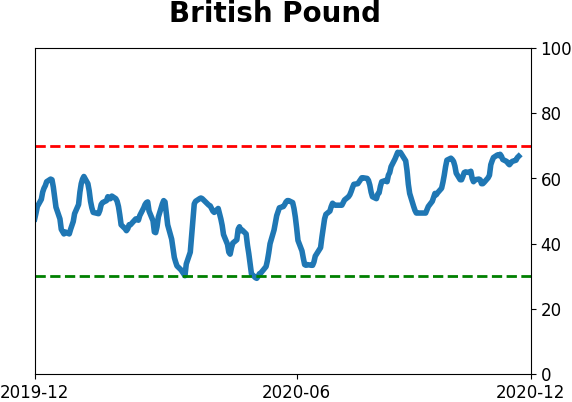
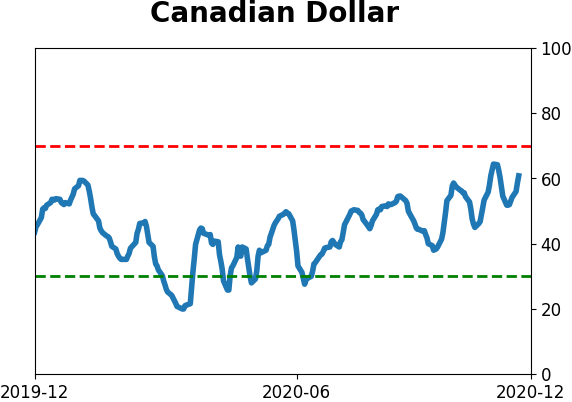
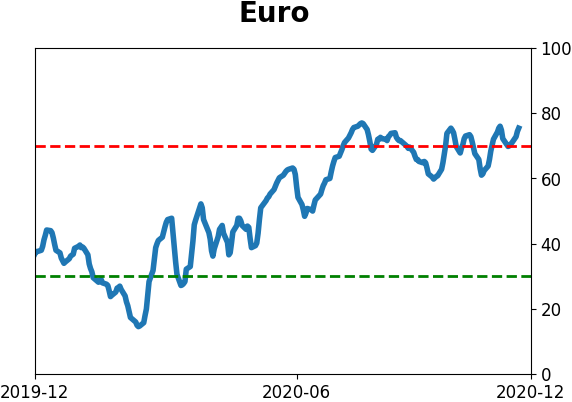
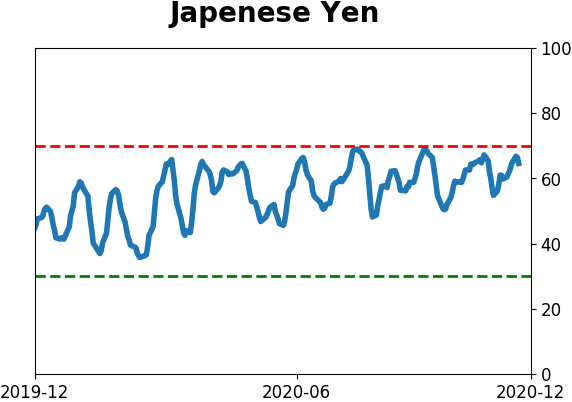
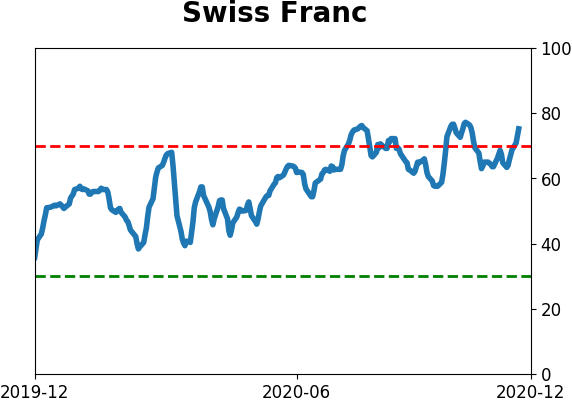
Currency ETF's - 5-Day Moving Average
|
|
|
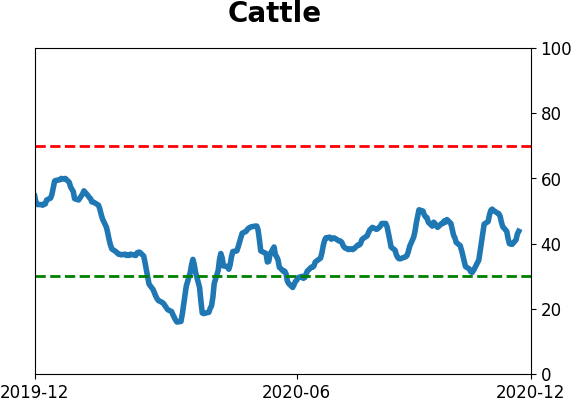
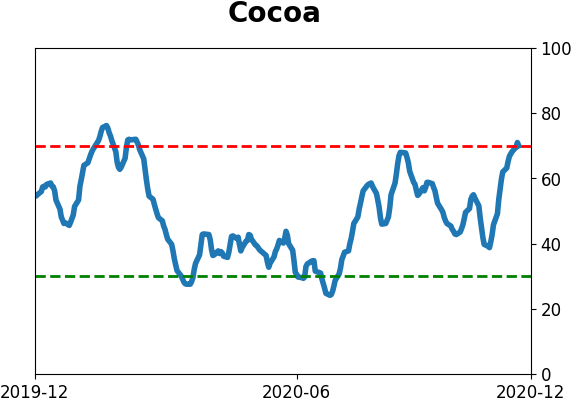
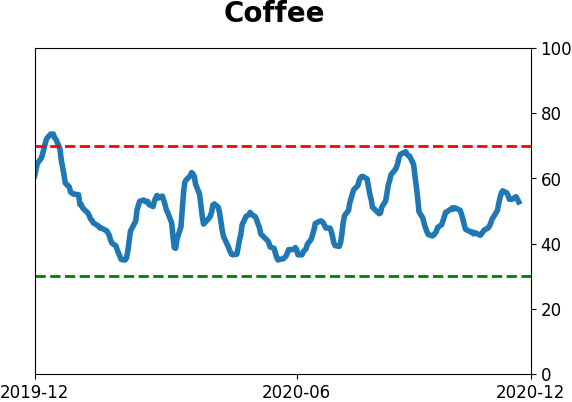
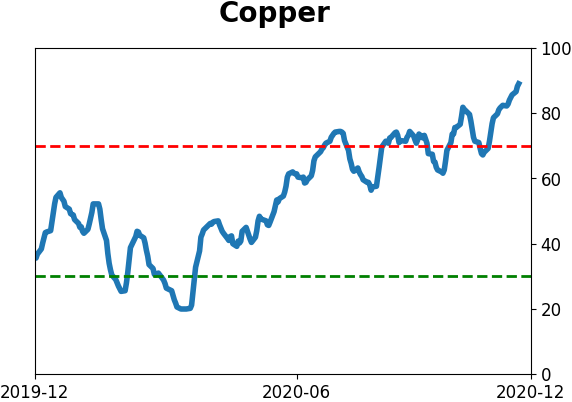
Commodity ETF's - 5-Day Moving Average
|
|