Headlines
|
|
Newsletter writers are fully risk-on:
The latest Investor's Intelligence survey shows that the Bull Ratio among newsletter writers is above 80% for the first time since early 2018. After the ends of other long streaks with "not euphoria," stocks continued to rise over the next 2-4 weeks.
A month when it was tough to lose money:
In November, almost everything rallied. Indexes covering stocks, bonds, commodities, and real estate all showed at least 1% gains. That kind of investor nirvana can make contrarians nervous, but in general it was more of a good sign than bad.
Bottom Line:
- The market environment is pristine, but with near-historic optimism, gains tend to be muted, with a high probability of being reversed at some point over the ensuing weeks.
|
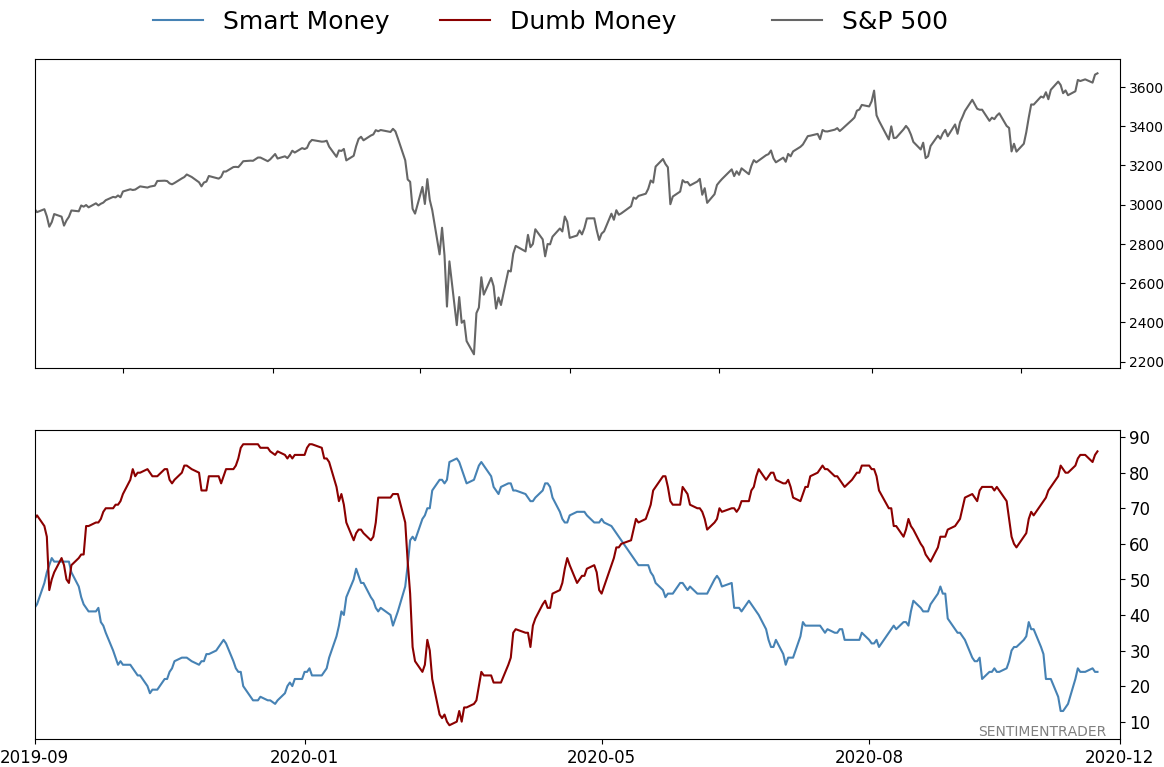
Smart / Dumb Money Confidence
|
Smart Money Confidence: 24%
Dumb Money Confidence: 86%
|
|
Risk Levels
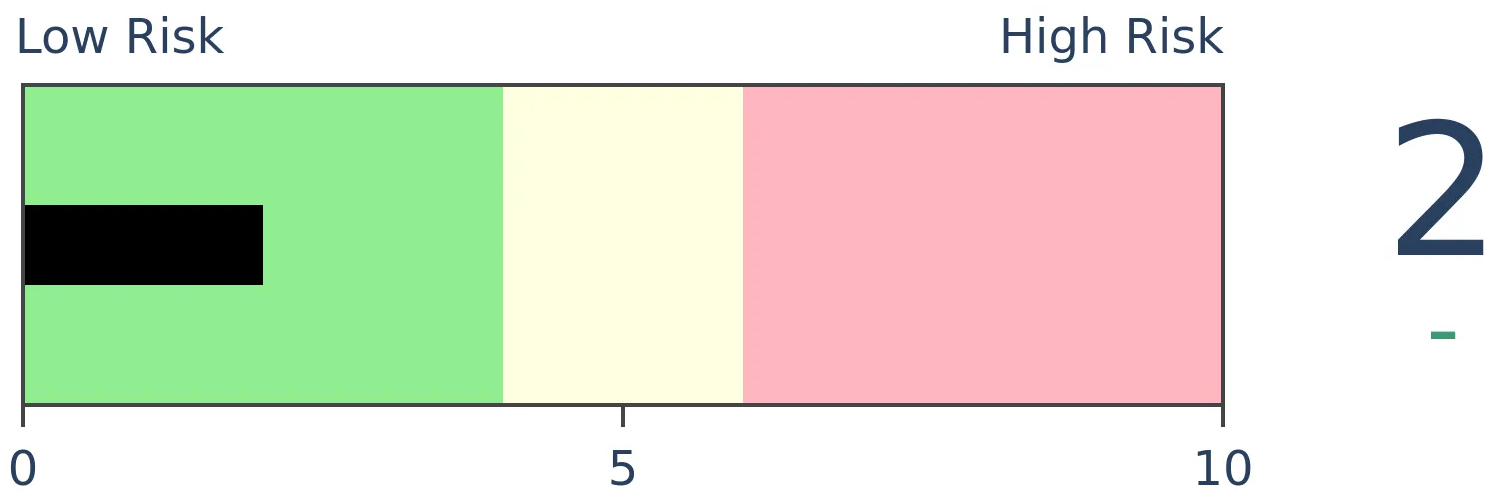
Stocks Short-Term
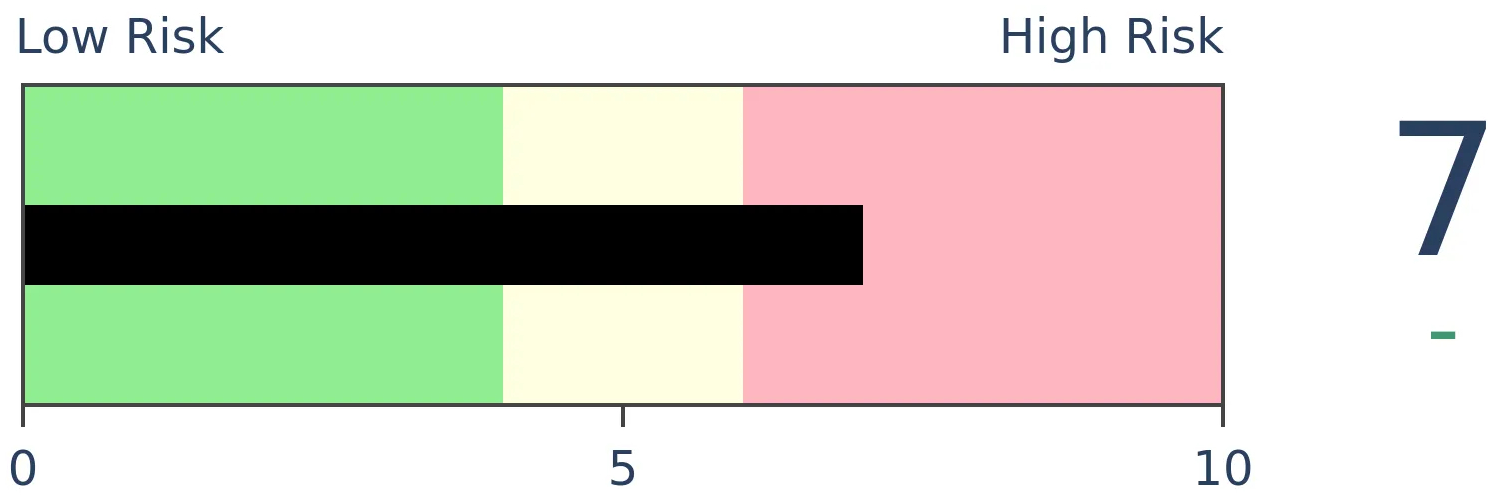
|
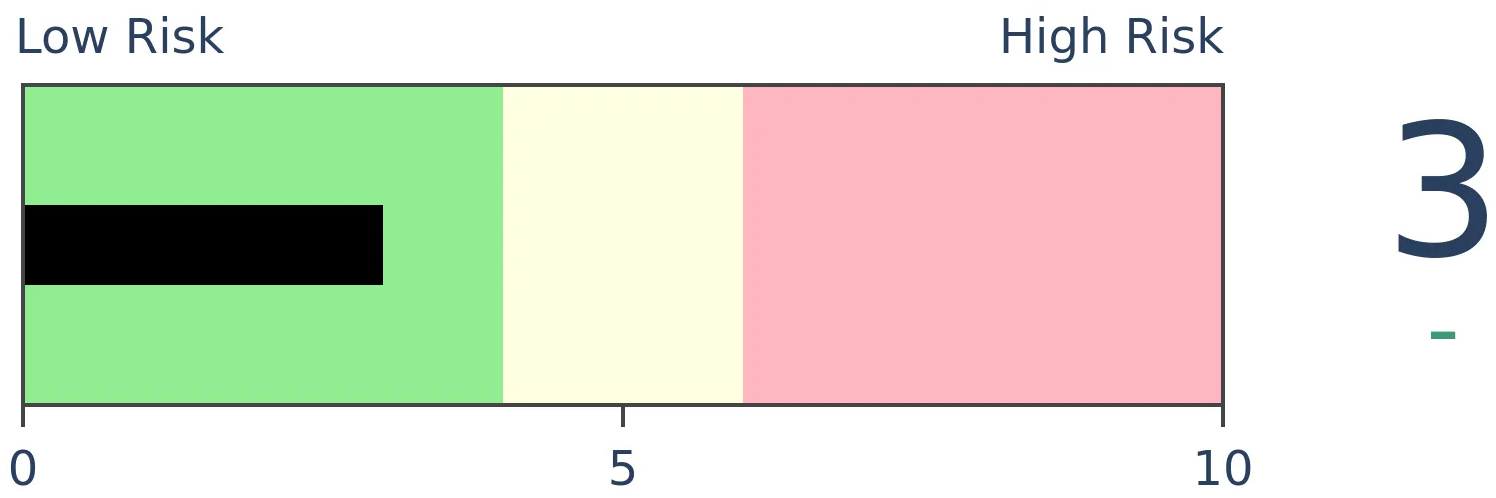
Stocks Medium-Term
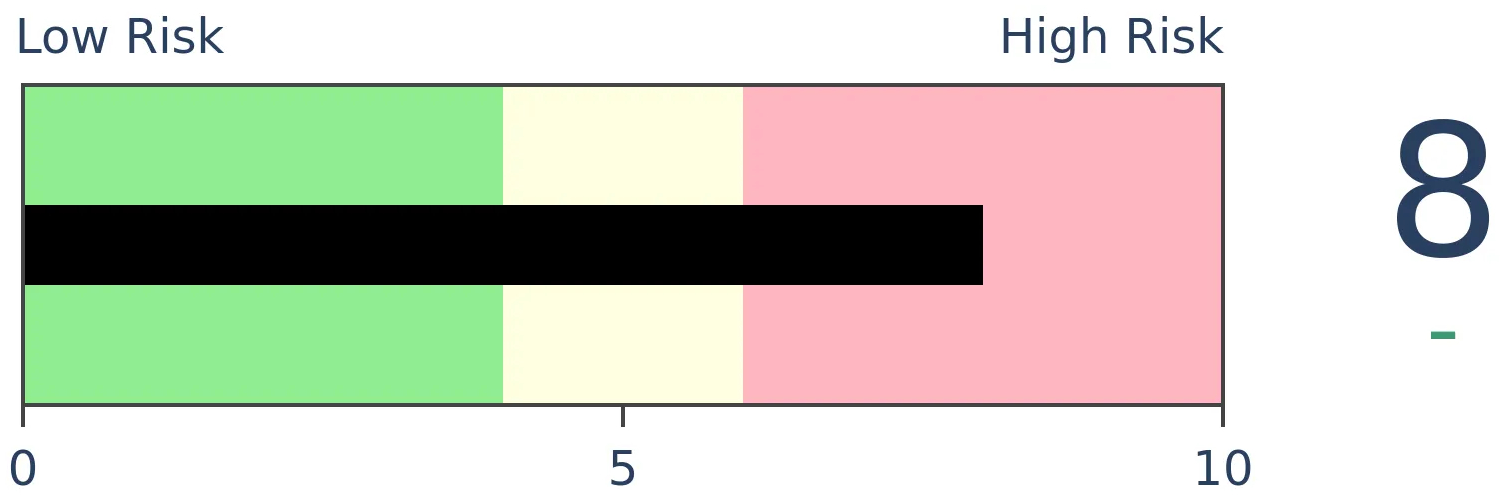
|
|
Bonds
|
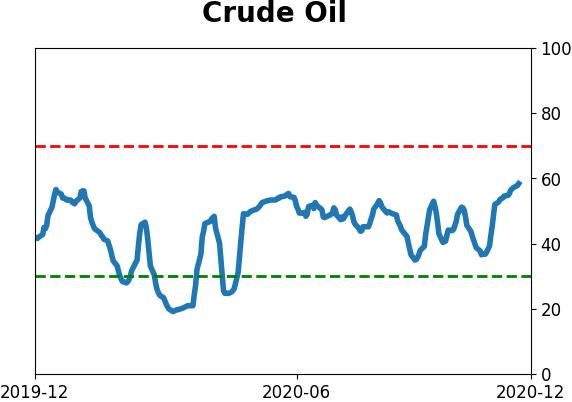
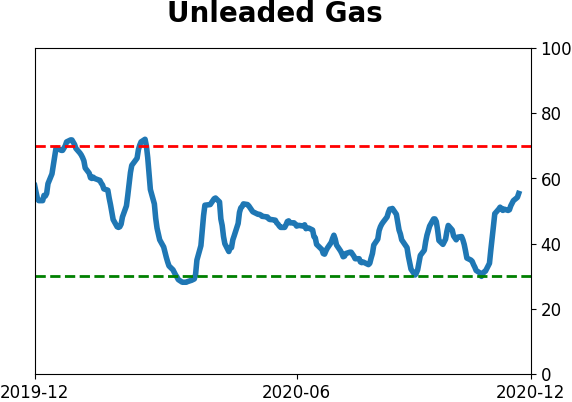
Crude Oil

|
|
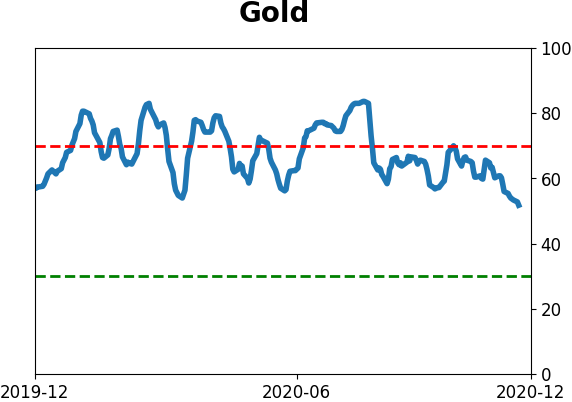
Gold
|
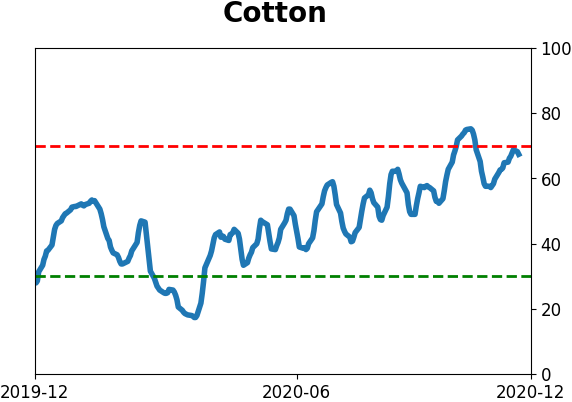
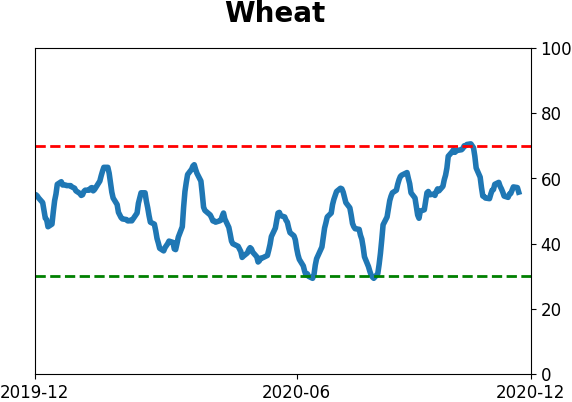
Agriculture
|
|
Research
BOTTOM LINE
The latest Investor's Intelligence survey shows that the Bull Ratio among newsletter writers is above 80% for the first time since early 2018. After the ends of other long streaks with "not euphoria," stocks continued to rise over the next 2-4 weeks.
FORECAST / TIMEFRAME
None
|
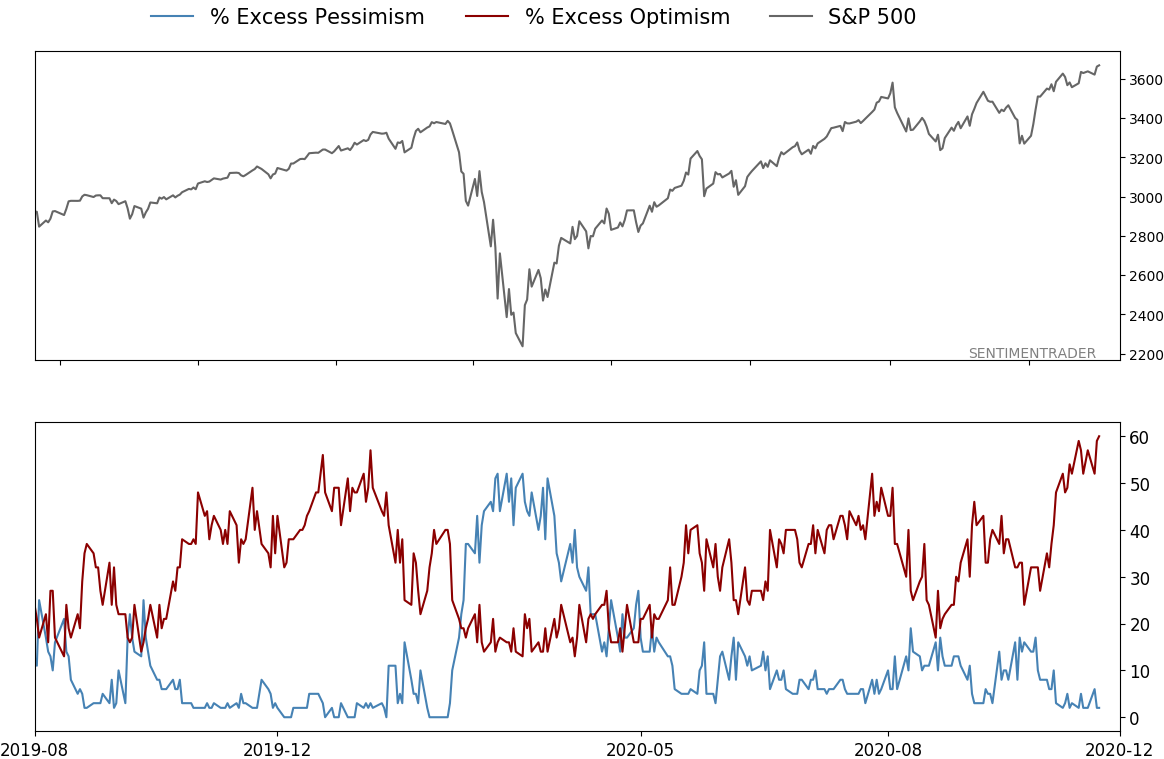
As markets started to recover from the September swoon, optimism bounced back from almost-neutral levels. By mid-November, it climbed into excessive territory. Now there are signs it's reached a euphoric stage.
Among many examples, the latest survey of newsletter writer recommendations from Investor's Intelligence shows a Bull Ratio that's above 80% (rounded). The Bull Ratio is simply the percentage of those expecting higher prices relative to all of them that expressed an opinion either way.
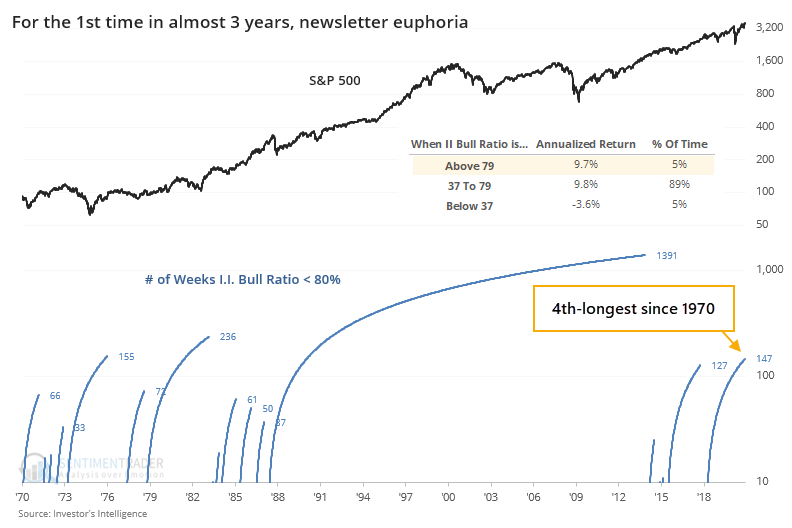
This is the first time it's at 80% or above since January 2018, ending the 4th-longest streak of "not euphoria." That long streak without euphoria starting in the late 1980s was such an outlier that we had to use a log chart to show the streaks.
One of the biggest stumbling blocks with contrary analysis is the tendency to think that everything is contrarian, all the time. But we can see from the chart above that when the Bull Ratio is above 79%, where it has been on about 5% of the weeks since 1970, the S&P 500's forward return was an annualized +9.7%. When the Bull Ratio was below 37%, that return dropped to -3.6%. That's the opposite of what we should expect with a consistent contrarian indicator.
We can also see that below, looking at the S&P 500's performance after the I.I. survey reached the euphoria stage for the 1st time in at least 6 months.
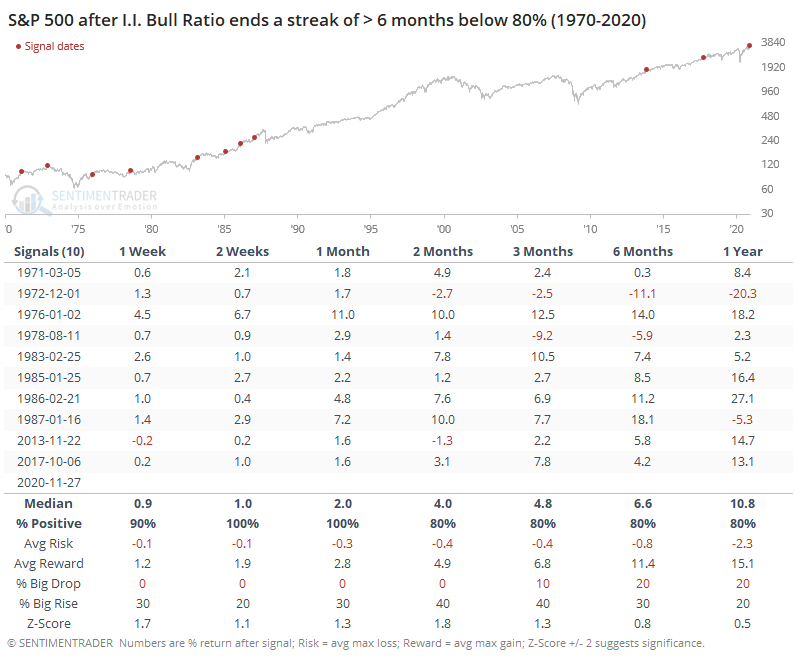
Far from being a signal to sell stocks, it was actually a decent buy signal. Once newsletters went all-in on the market, it led to further gains over the next 2-4 weeks every time, with a positively skewed risk/reward ratio and probability of a big rise vs. big drop.
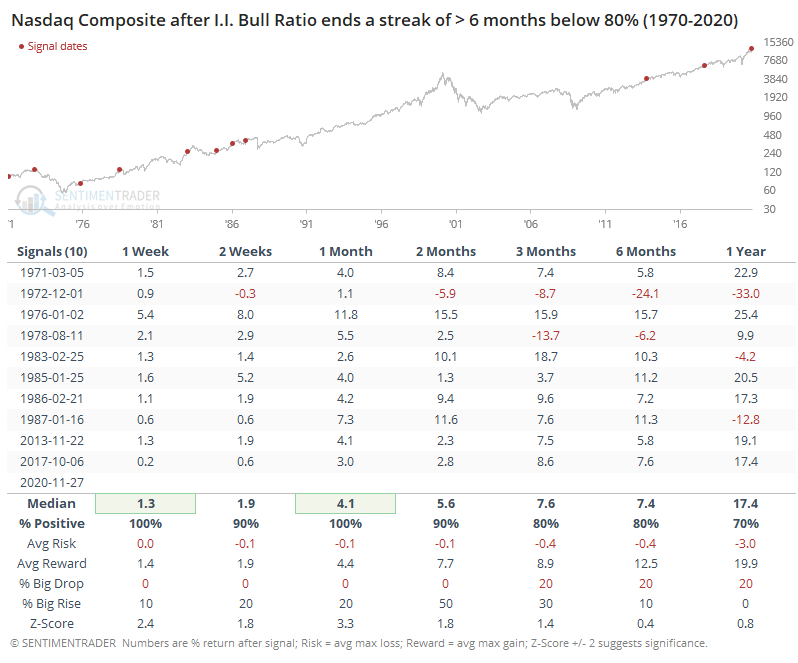
Returns in a higher-beta index like the Nasdaq Composite were even better.
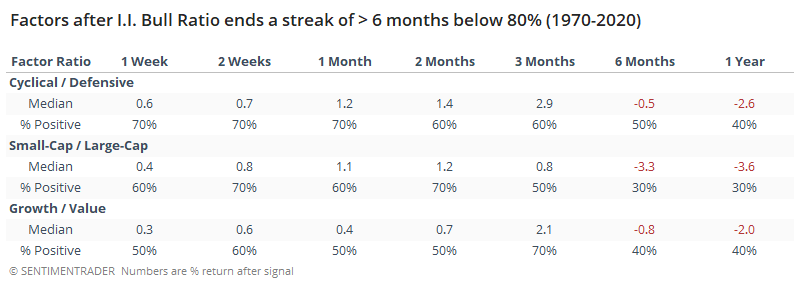
If we look at ratios of major factors, then we can also see that a risk-on attitude paid off more often than not over the short- to medium-term. By 6 months later, however, the high optimism weighed on riskier stocks relative to safer ones.
The highly optimistic results of this survey will probably trigger a lot of attention, as it's a widely-followed measure of sentiment. We can certainly cherry-pick some instances when a high level of optimism immediately preceded a big decline in stocks. Objectively, however, it has not been helpful to expect an imminent decline. And when newsletters get all bulled up like they are now, it has more consistently led to further gains over the short- to medium-term.
BOTTOM LINE
In November, almost everything rallied. Indexes covering stocks, bonds, commodities, and real estate all showed at least 1% gains. That kind of investor nirvana can make contrarians nervous, but in general it was more of a good sign than bad.
FORECAST / TIMEFRAME
None
|
The Capital Spectator blog noted something interesting on Tuesday - in November, everything rallied.
Looking at November returns across a broad spectrum of assets, it was impossible to find anything with a negative return. Among the indexes with the longest history, all of them even showing a gain of at least 1%. That includes stocks, bonds, commodities, and real estate.
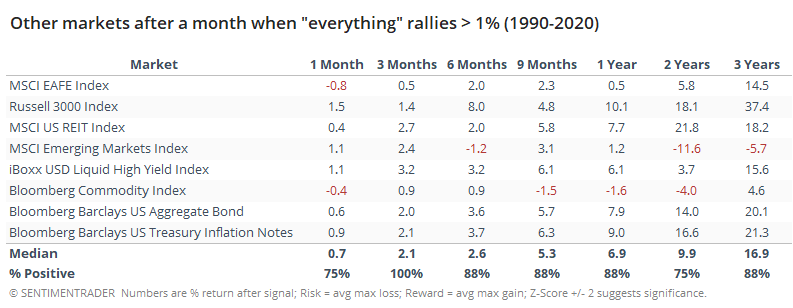
To see if that's a sign of investor nirvana that might lead to at least a temporary reality check, the table below shows returns in the S&P 500 after any month when every index showed at least a 1% gain.
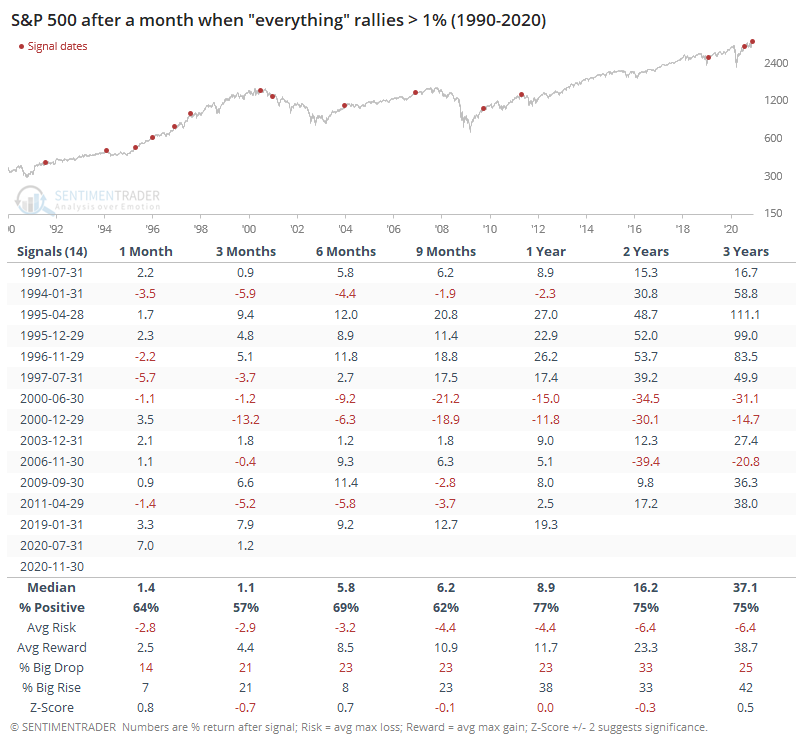
It didn't prove to be a consistent warning sign, but it wasn't exactly a buy signal, either. The S&P rose consistently going forward, though its average returns were only about in line with random.
For other markets, they all showed a positive average return over the next 3 months. Stocks and high-yield bonds tended to show the best relative returns. We eliminated those markets that had only a limited history.
When it seems like everything is working, it tends to make contrarians nervous, and sometimes for good reason. After other months when it was hard to lose money, it was a good sign when coming out of a severe decline, but less so when triggering at all-time highs.
The tough part about our current situation is that we check both of those boxes right now. About the only precedents are 1991, 1995, and in July of this year. For what it's worth, those precedents showed further gains.
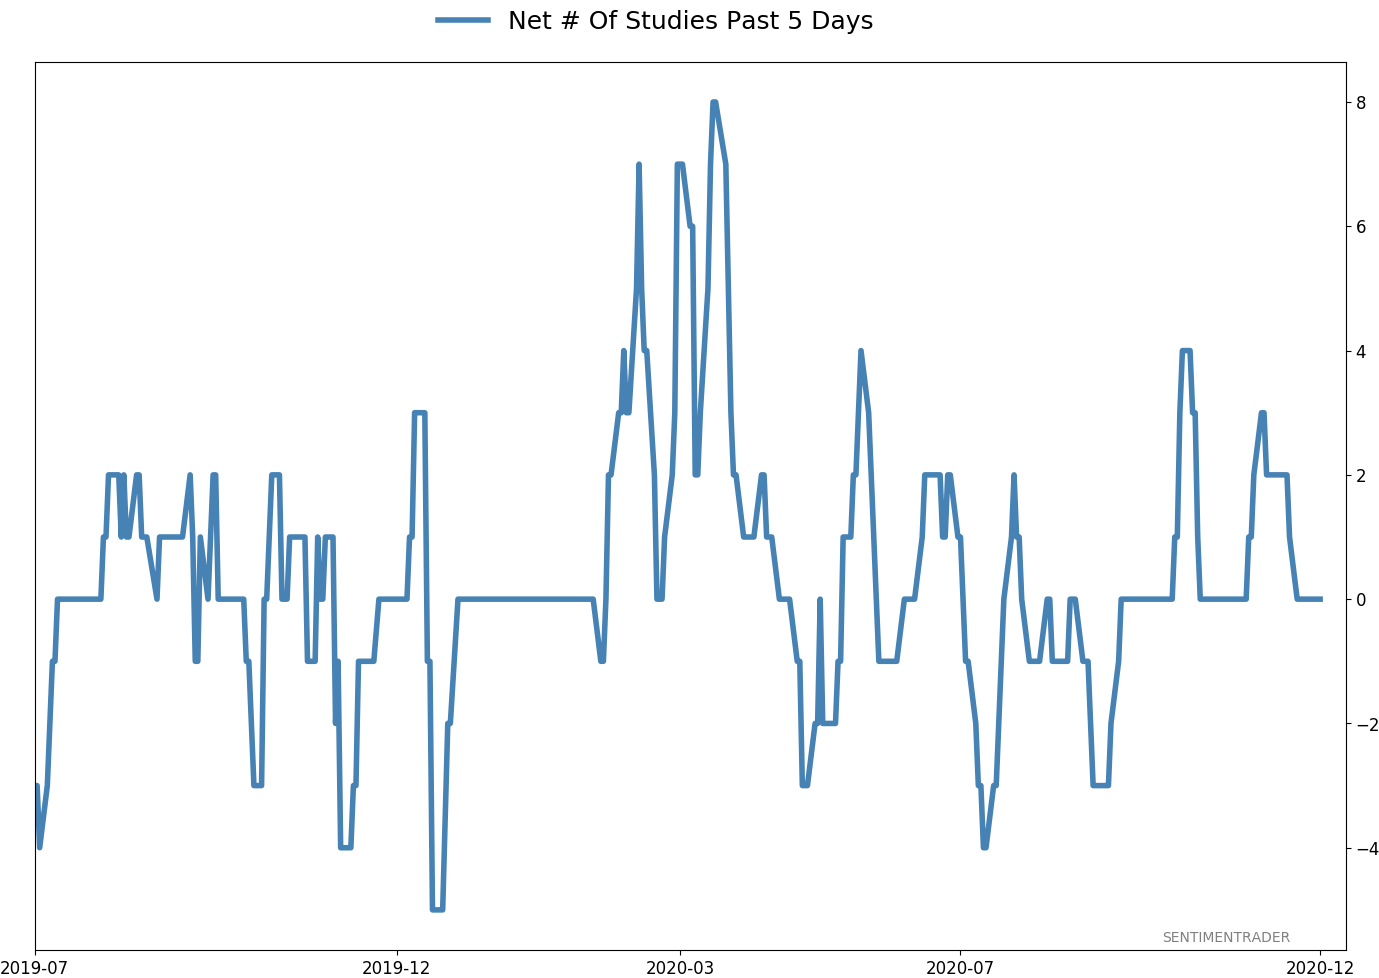
Active Studies
| Time Frame | Bullish | Bearish | | Short-Term | 0 | 0 | | Medium-Term | 5 | 8 | | Long-Term | 51 | 2 |
|
Indicators at Extremes
% Showing Pessimism: 2%
Bullish for Stocks
VIX
|
|
Portfolio
| Position | Description | Weight % | Added / Reduced | Date | | Stocks | 15.6% RSP, 10.1% VWO, 7.5% XLE, 5.1% PSCE | 41.2 | Added 5% | 2020-10-15 | | Bonds | 10% BND, 10% SCHP, 10% ANGL | 28.6 | Reduced 0.1% | 2020-10-02 | | Commodities | GCC | 2.4 | Reduced 2.1%
| 2020-09-04 | | Precious Metals | GDX | 9.5 | Added 4.8% | 2020-12-01 | | Special Situations | | 0.0 | Reduced 5% | 2020-10-02 | | Cash | | 18.3 | | |
|
Updates (Changes made today are underlined)
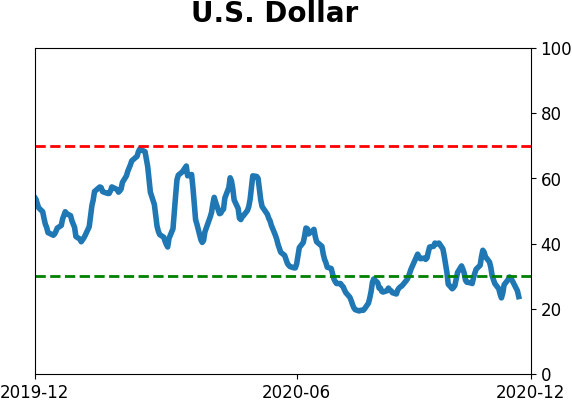
I've been quiet here because there hasn't been much to do. The things that were supposed to work have pretty much been doing so. With sentiment extremely stretched, I have no desire to add exposure there. About the only place I would add is energy, which has been following through exactly as it should. I did add back to my position in gold miners, due to the studies recently posted to the site. When gold (and miners) have pulled back after momentum like they enjoyed since March, the typical reaction is a resumption of the uptrend over the medium-term, and not a rollover into a bear phase. The continued weakness in the dollar certainly helps. RETURN YTD: 6.0% 2019: 12.6%, 2018: 0.6%, 2017: 3.8%, 2016: 17.1%, 2015: 9.2%, 2014: 14.5%, 2013: 2.2%, 2012: 10.8%, 2011: 16.5%, 2010: 15.3%, 2009: 23.9%, 2008: 16.2%, 2007: 7.8%
|
|
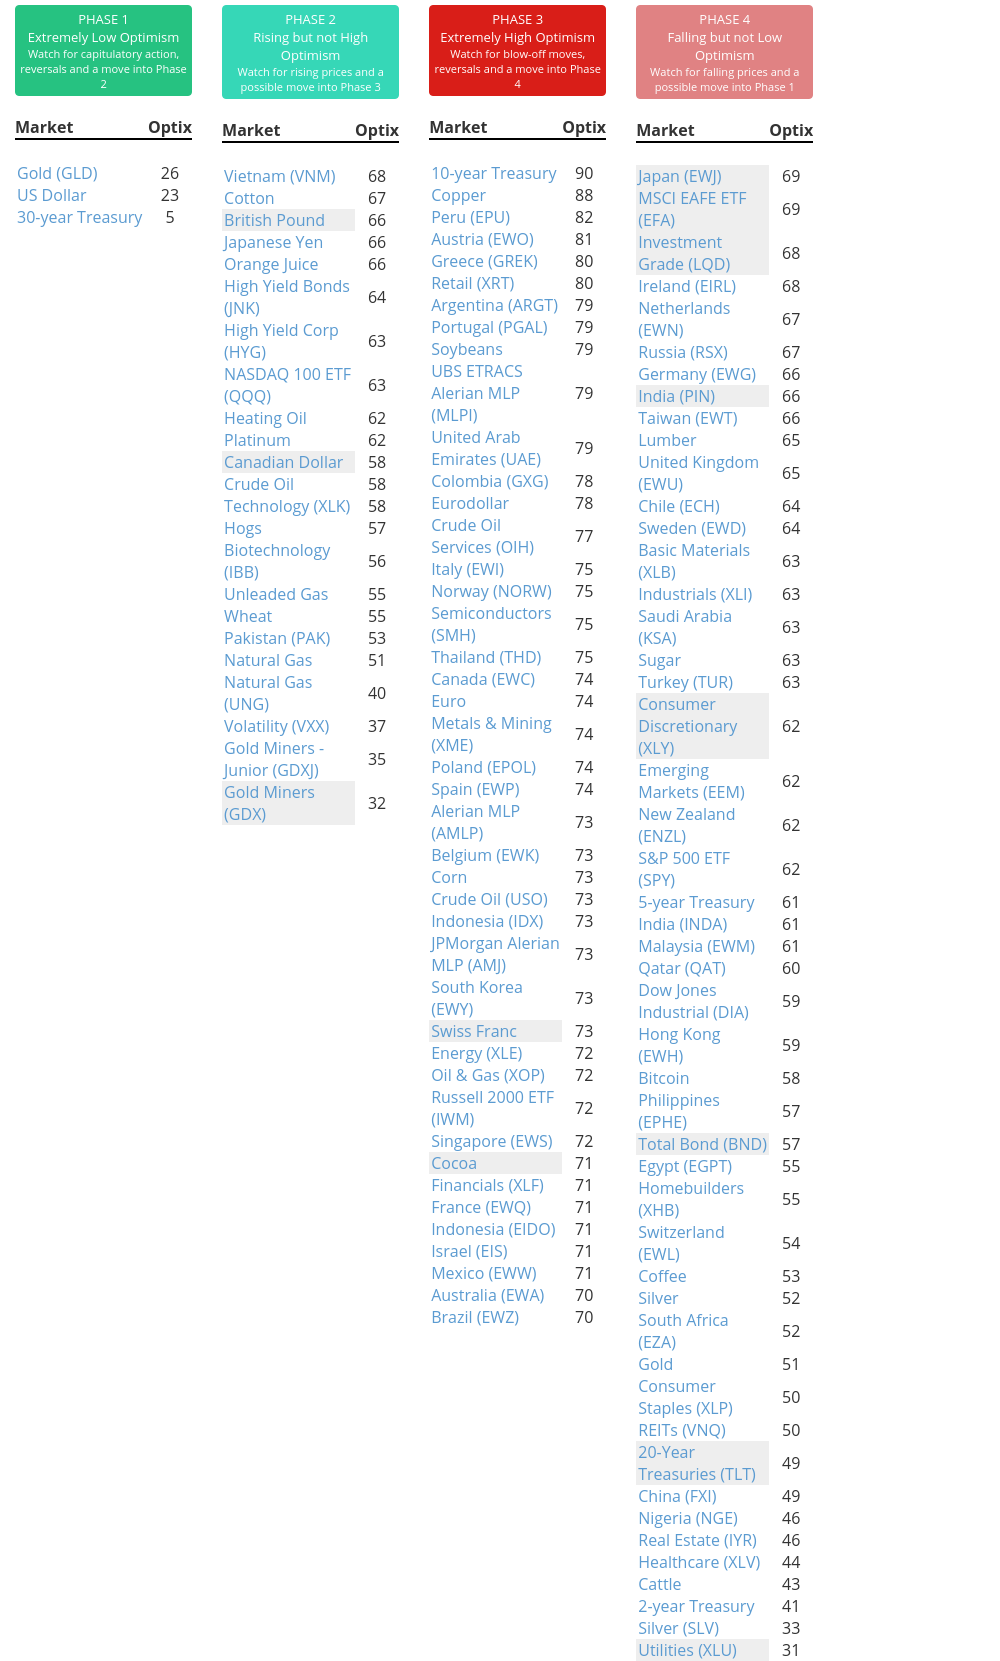
Phase Table
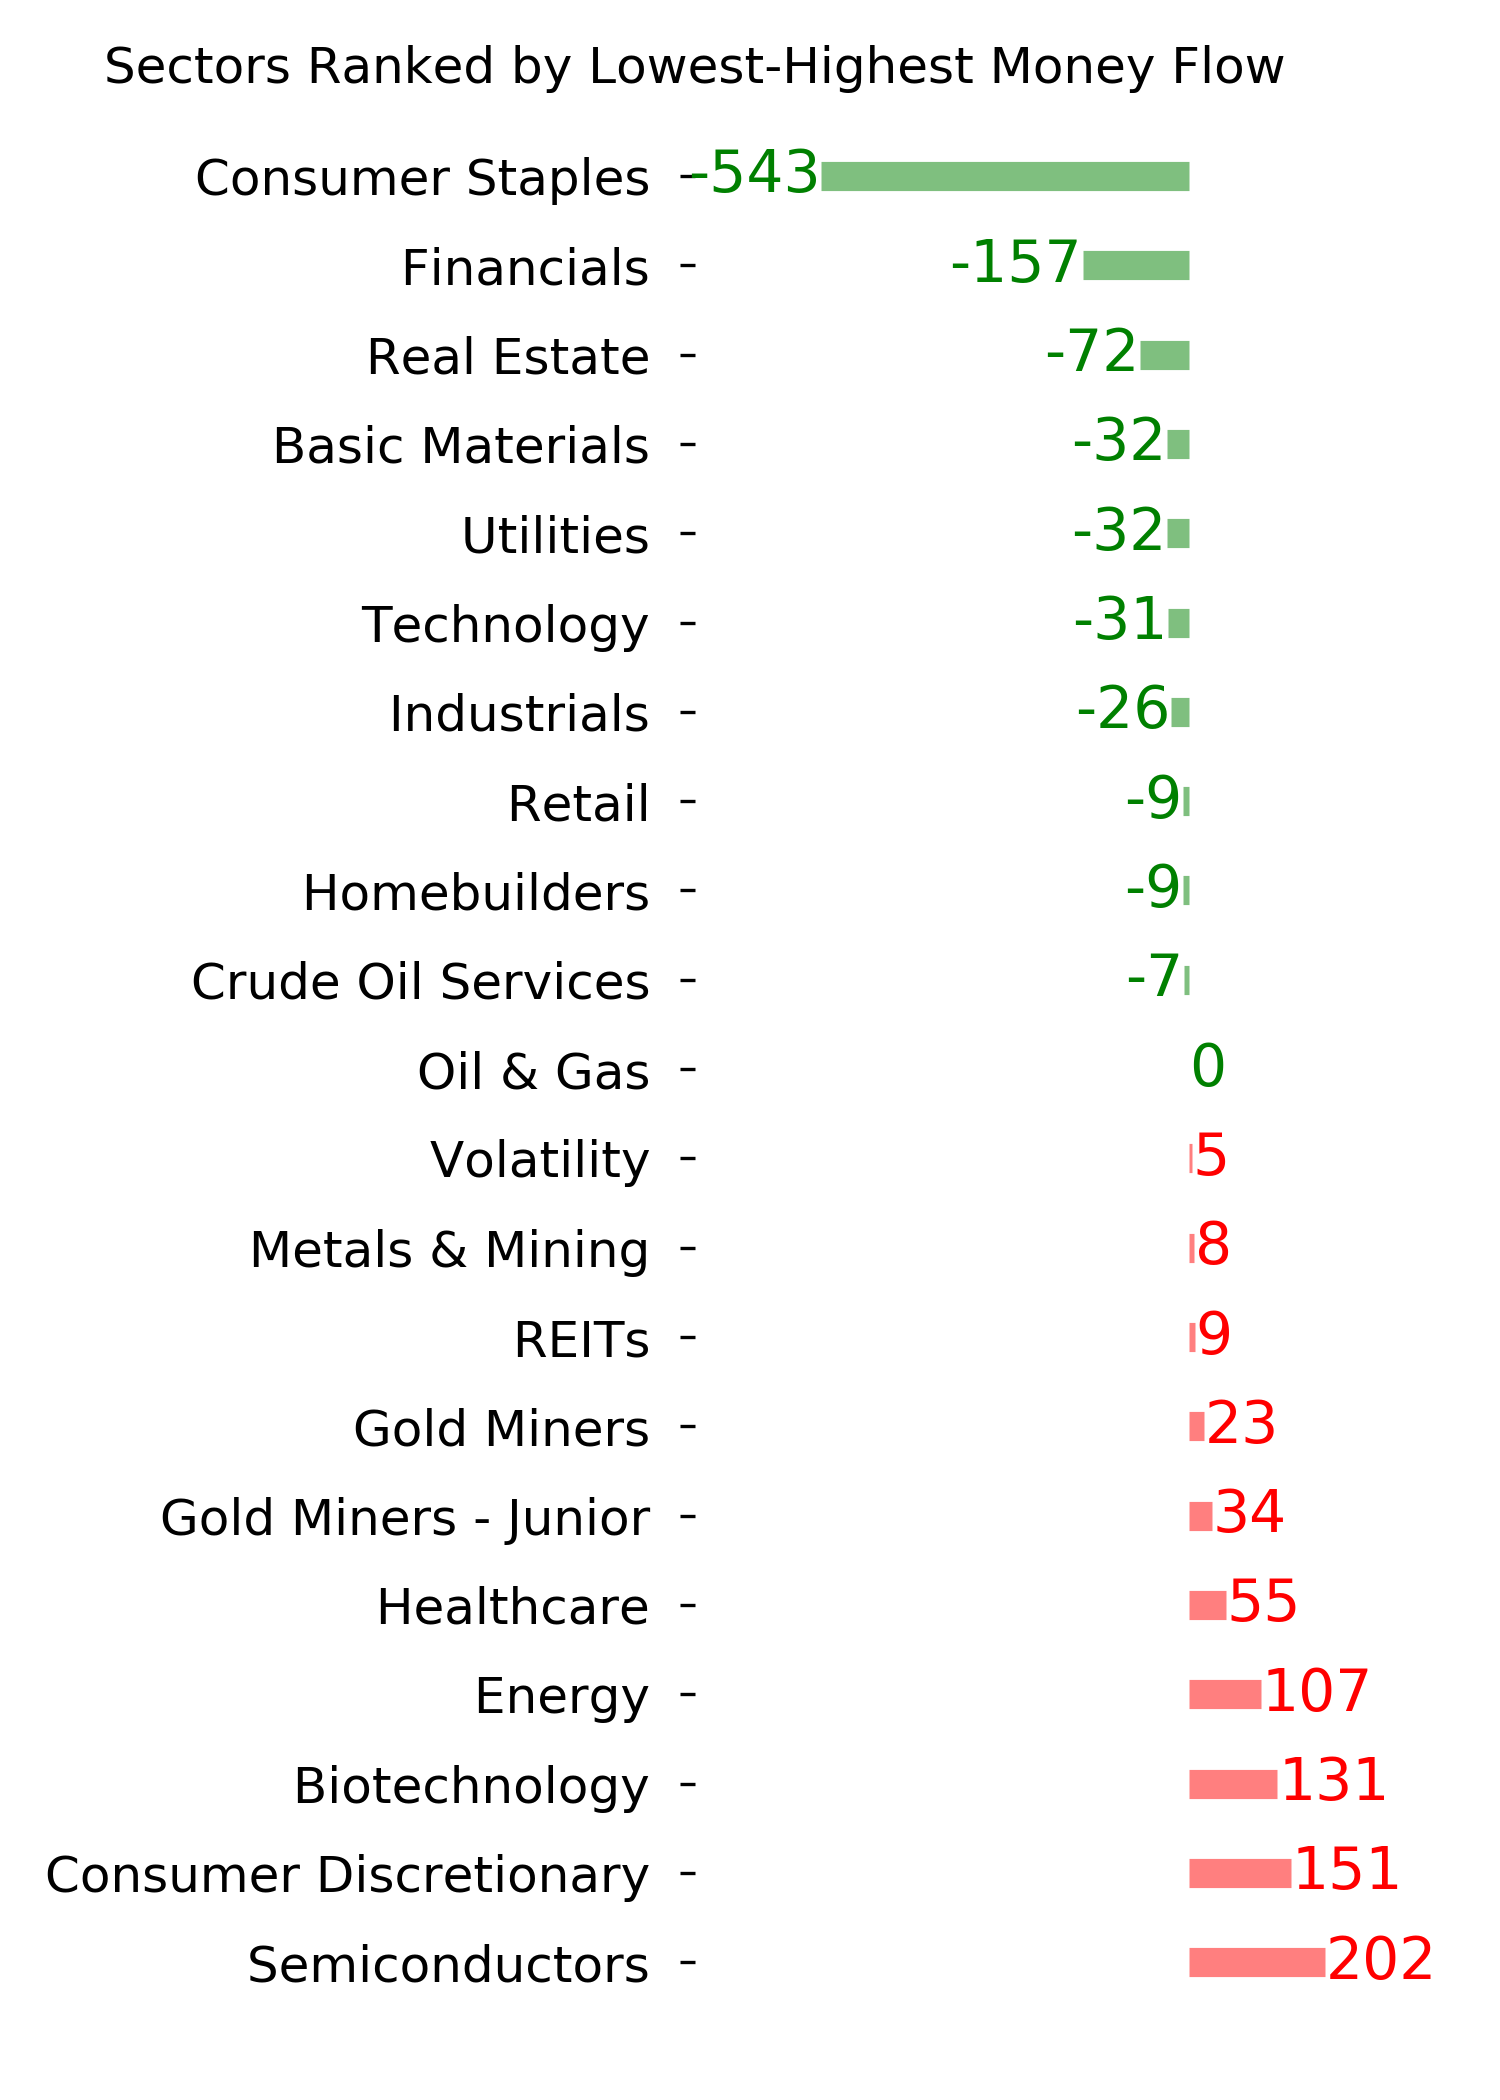
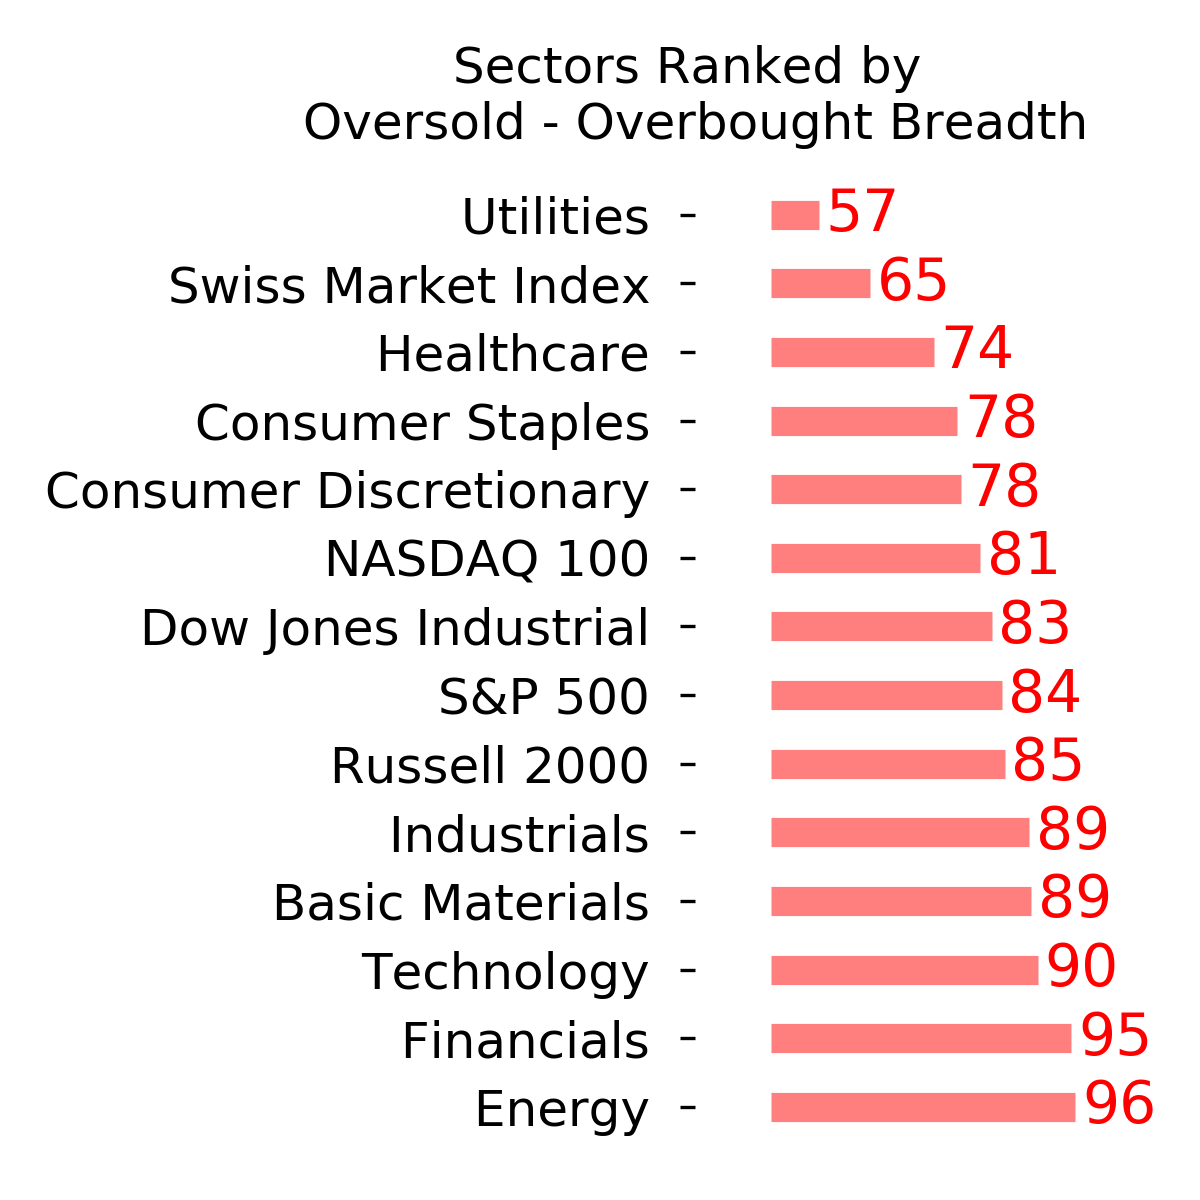
Ranks
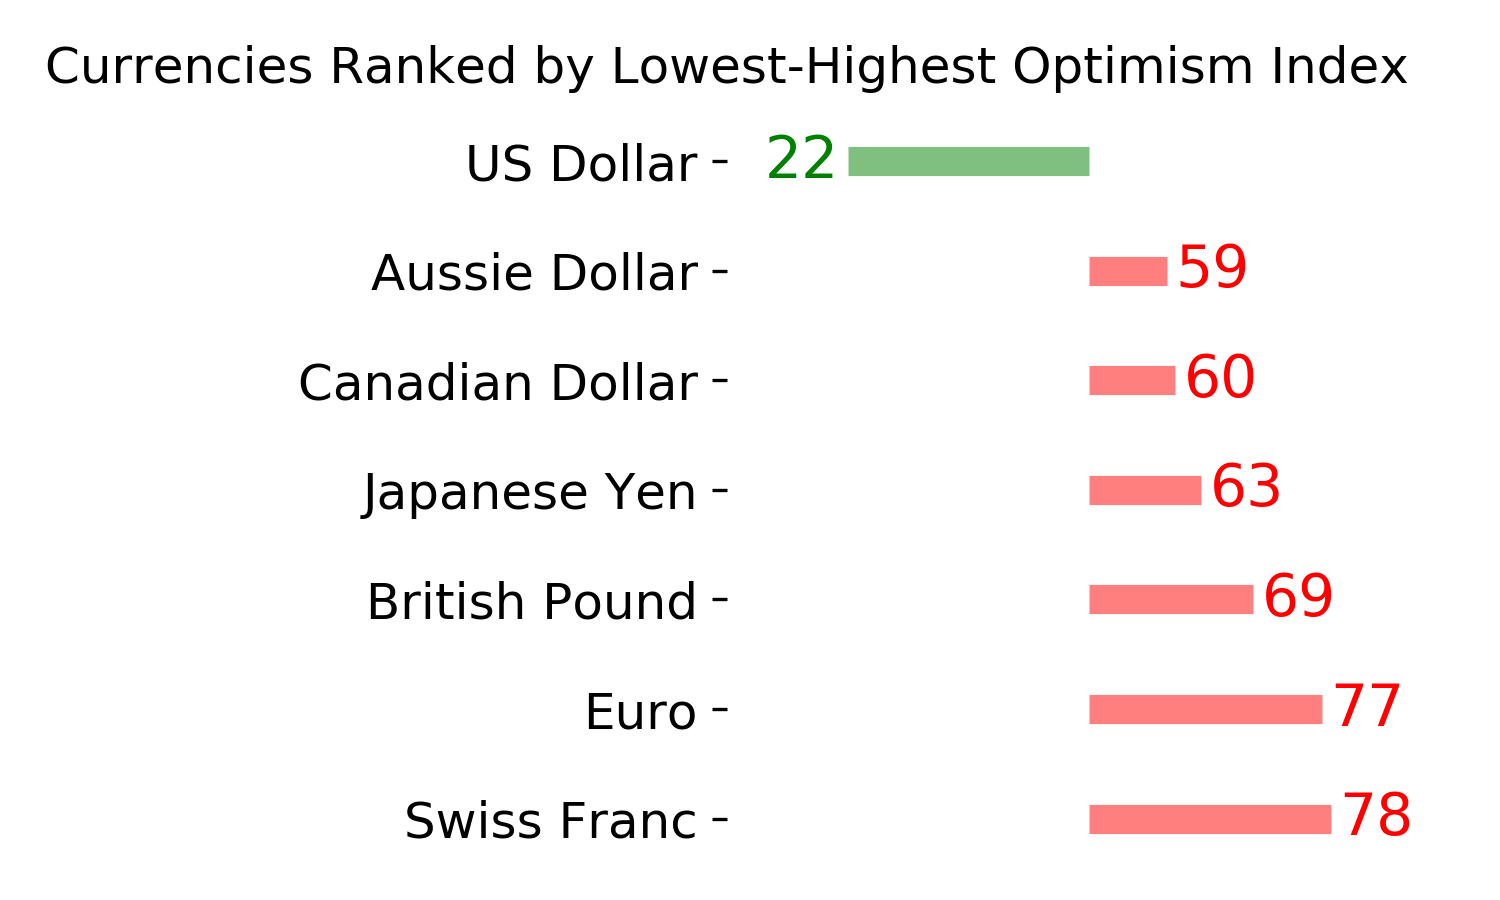
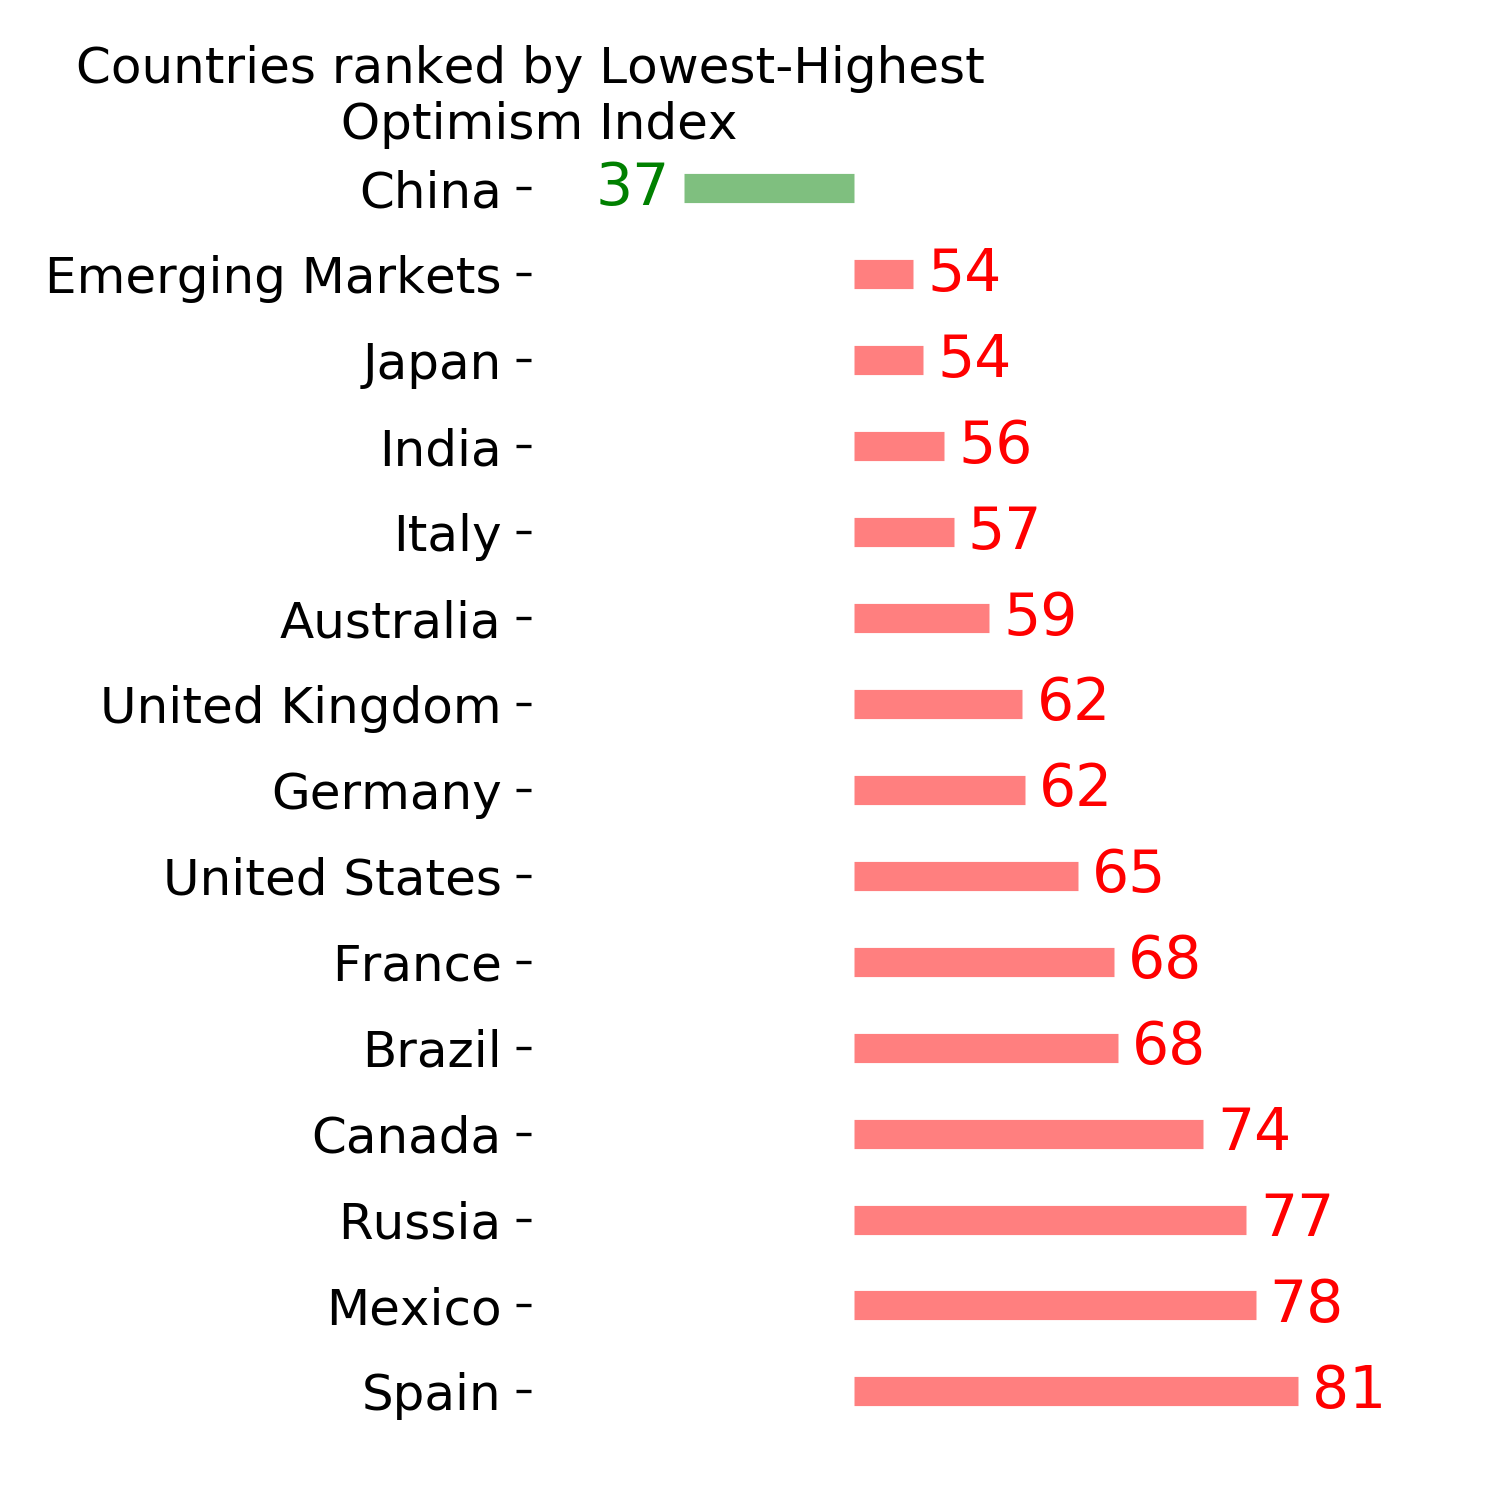
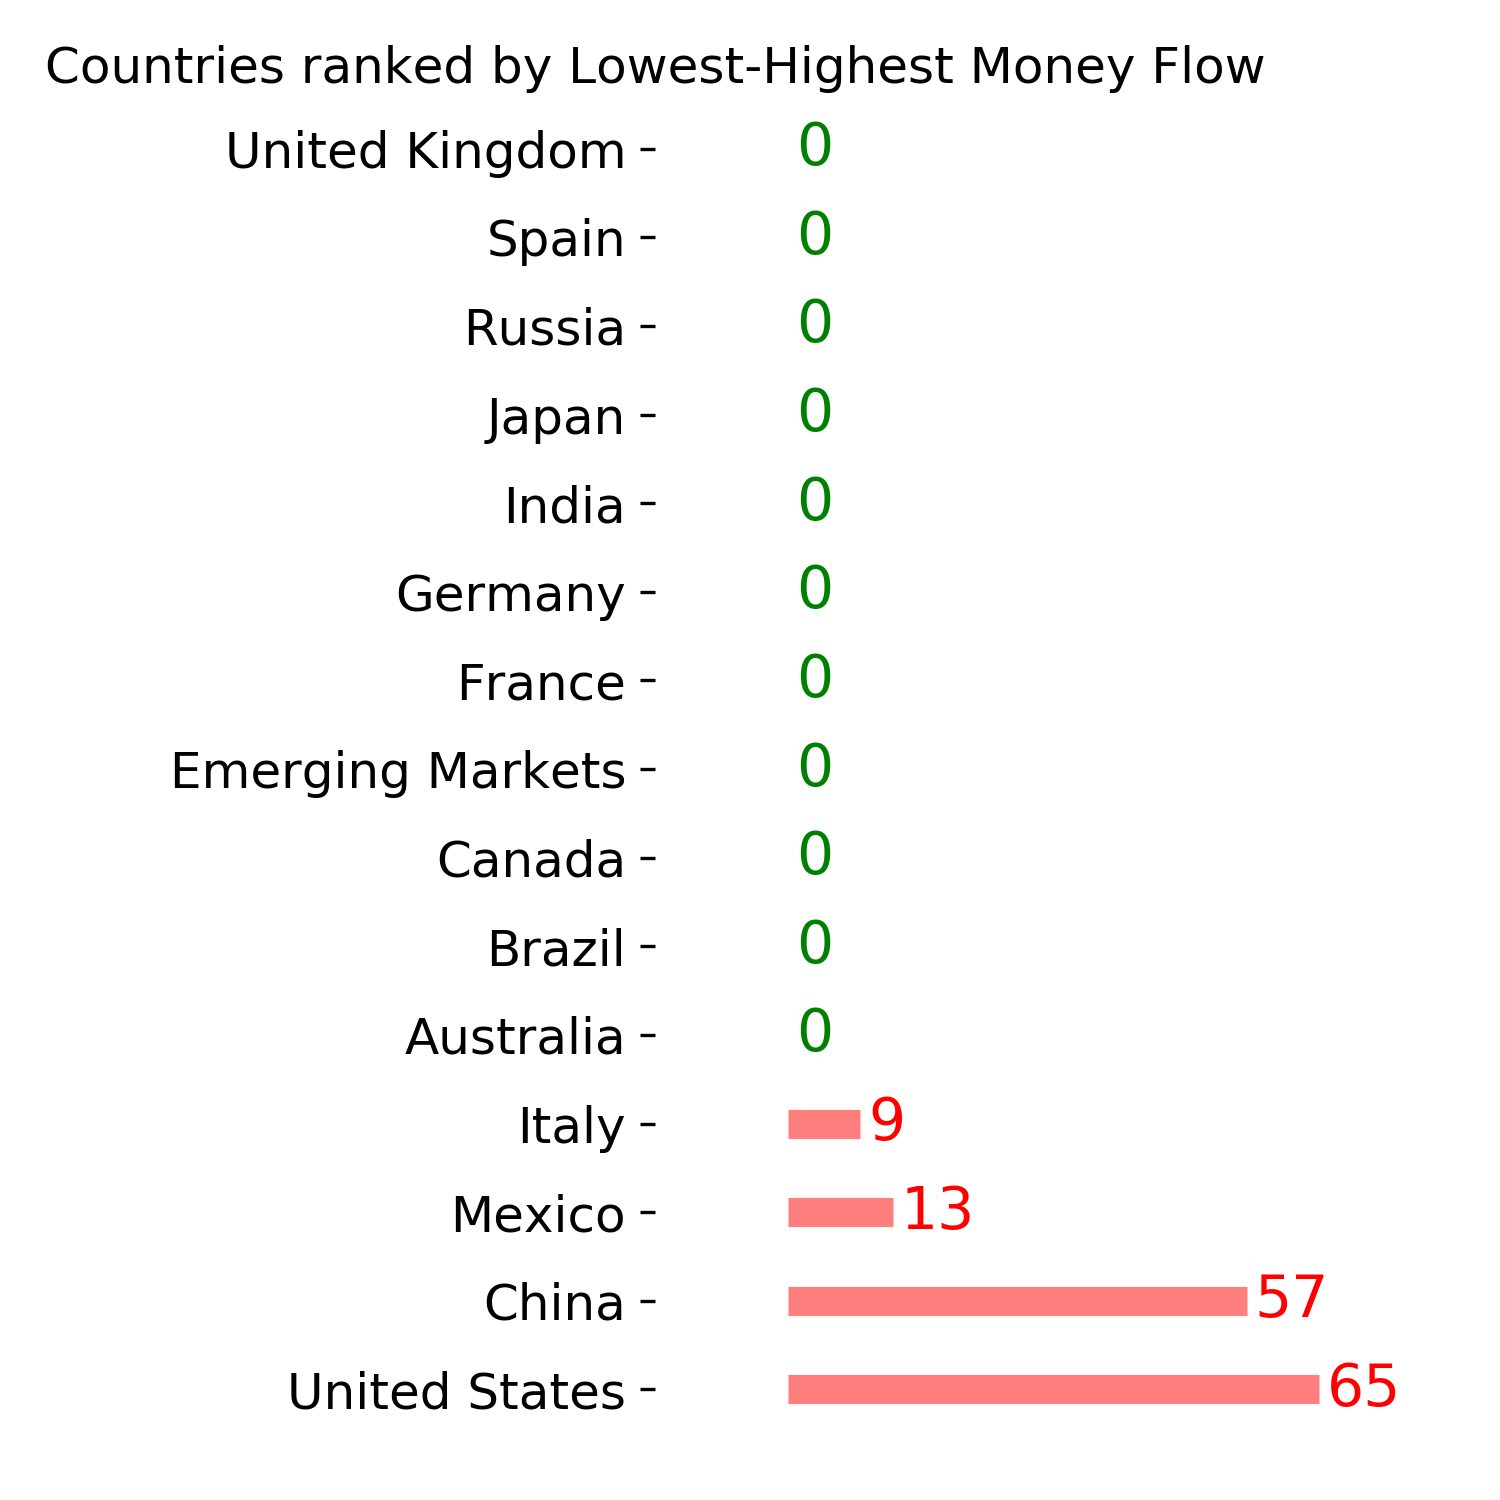
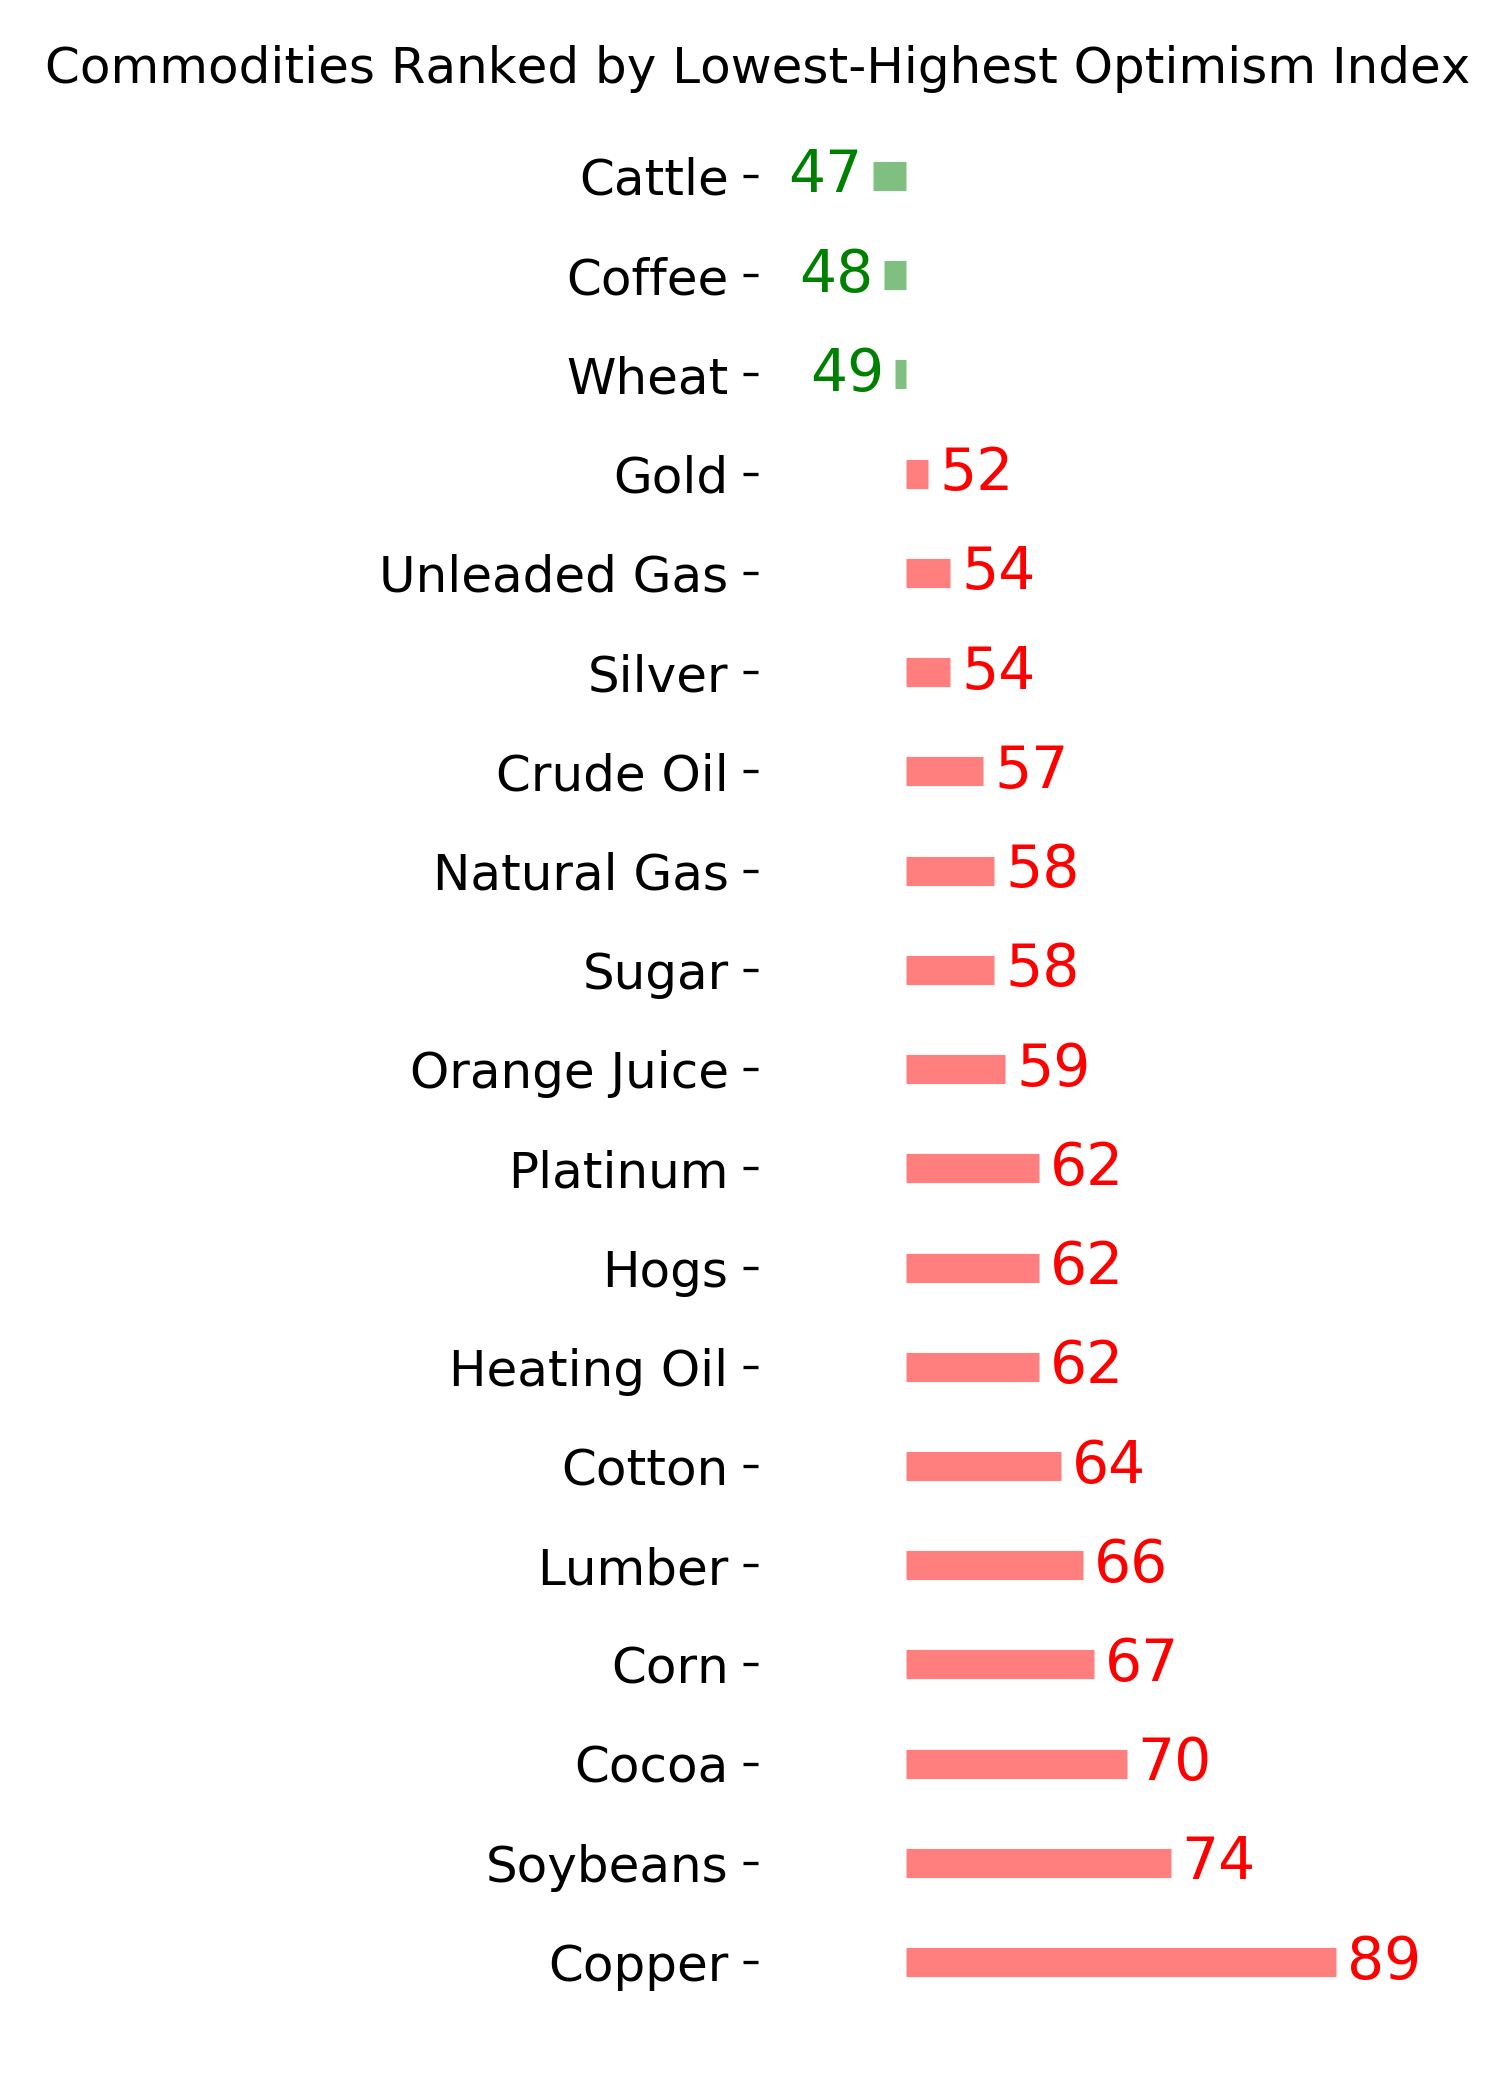
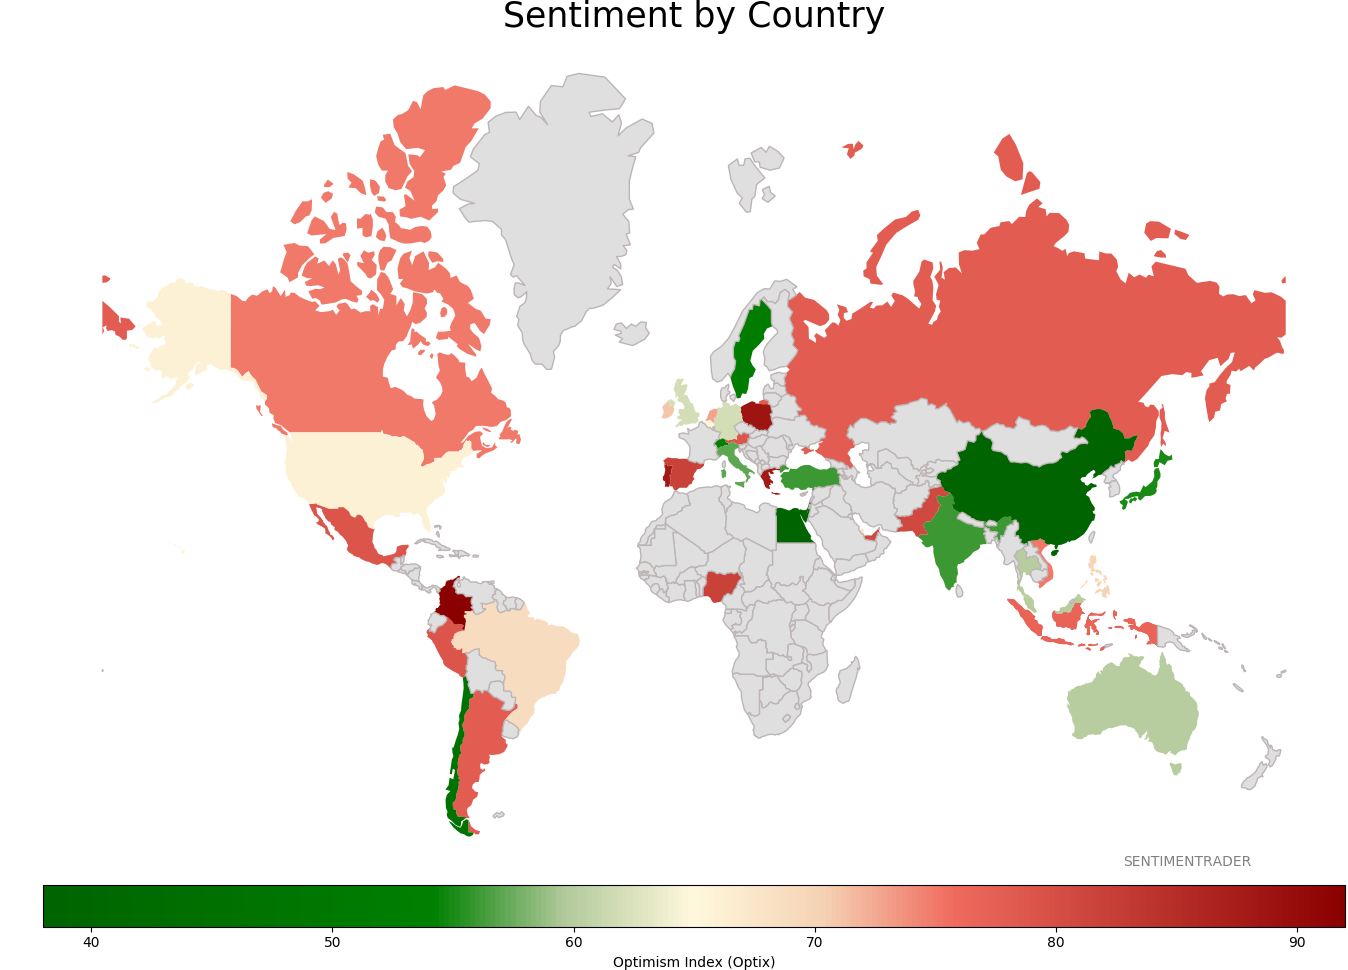
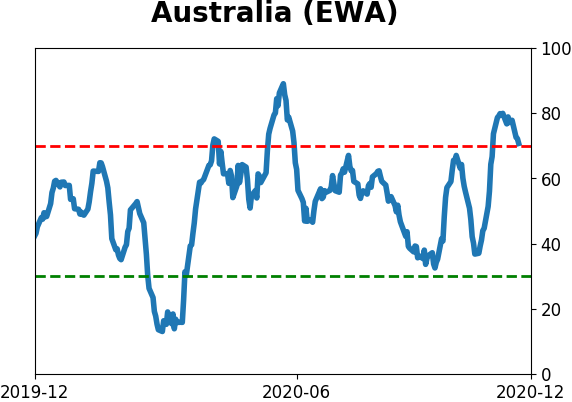
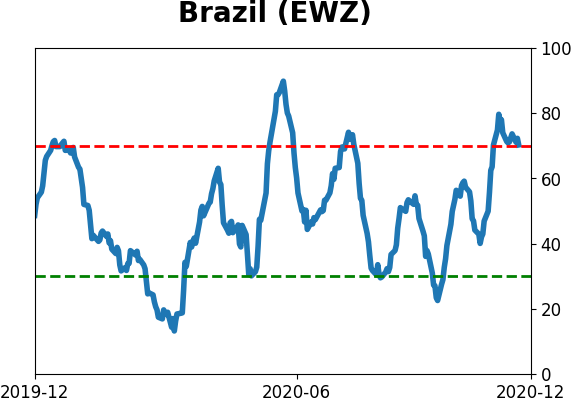
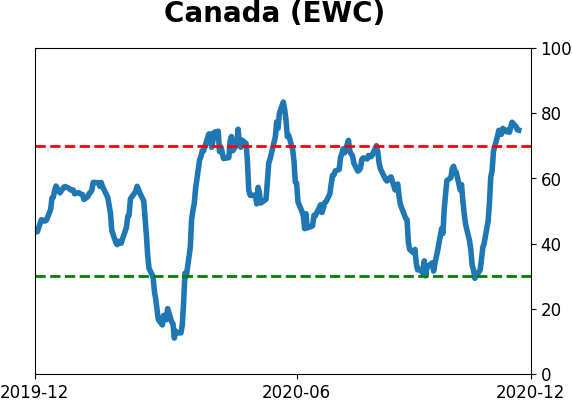
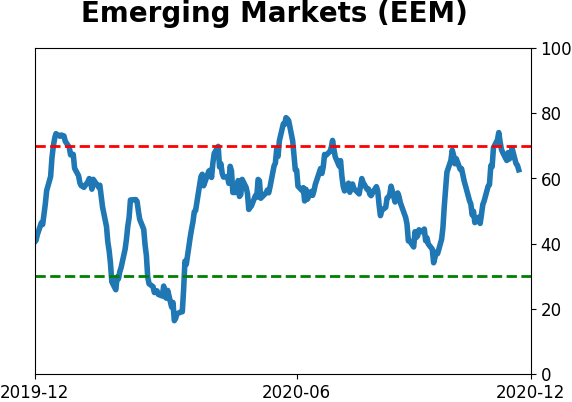
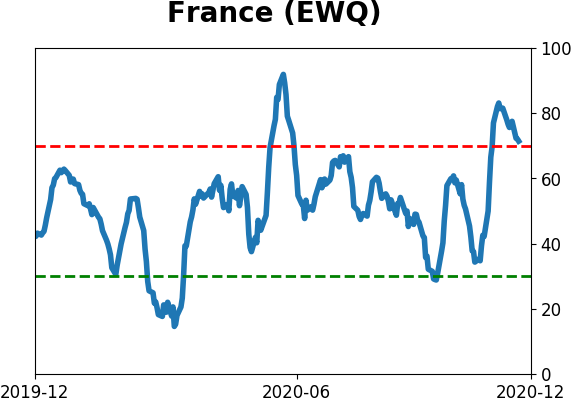
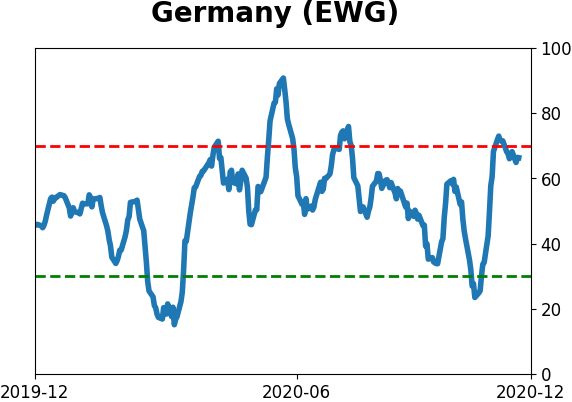
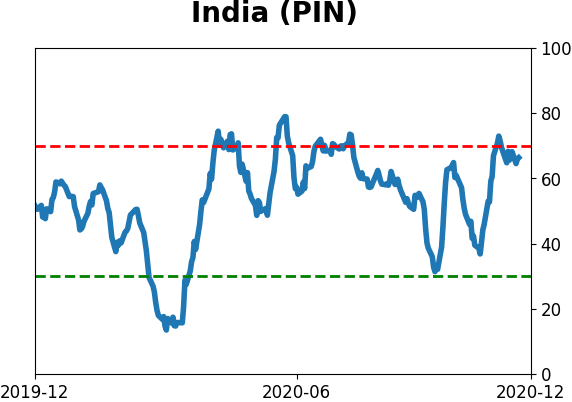
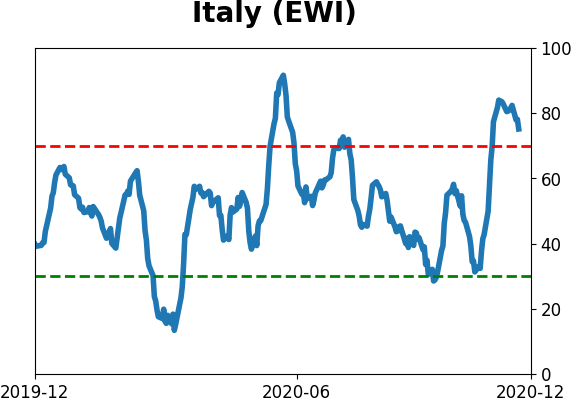
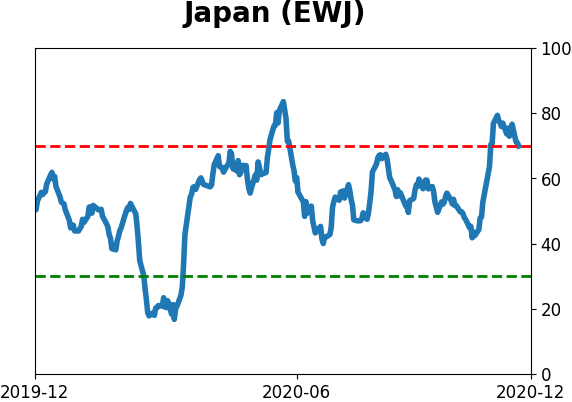
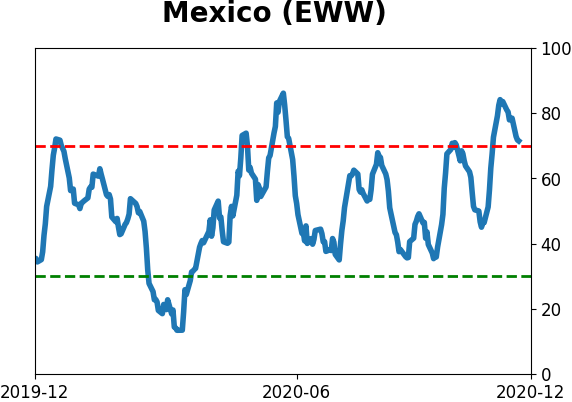
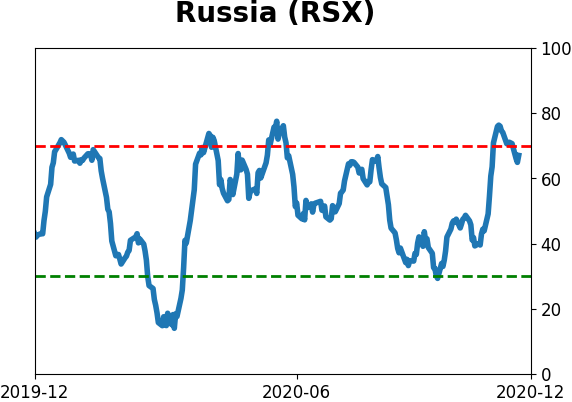
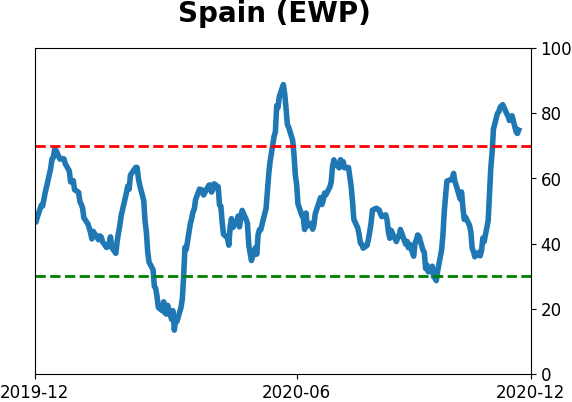
Sentiment Around The World
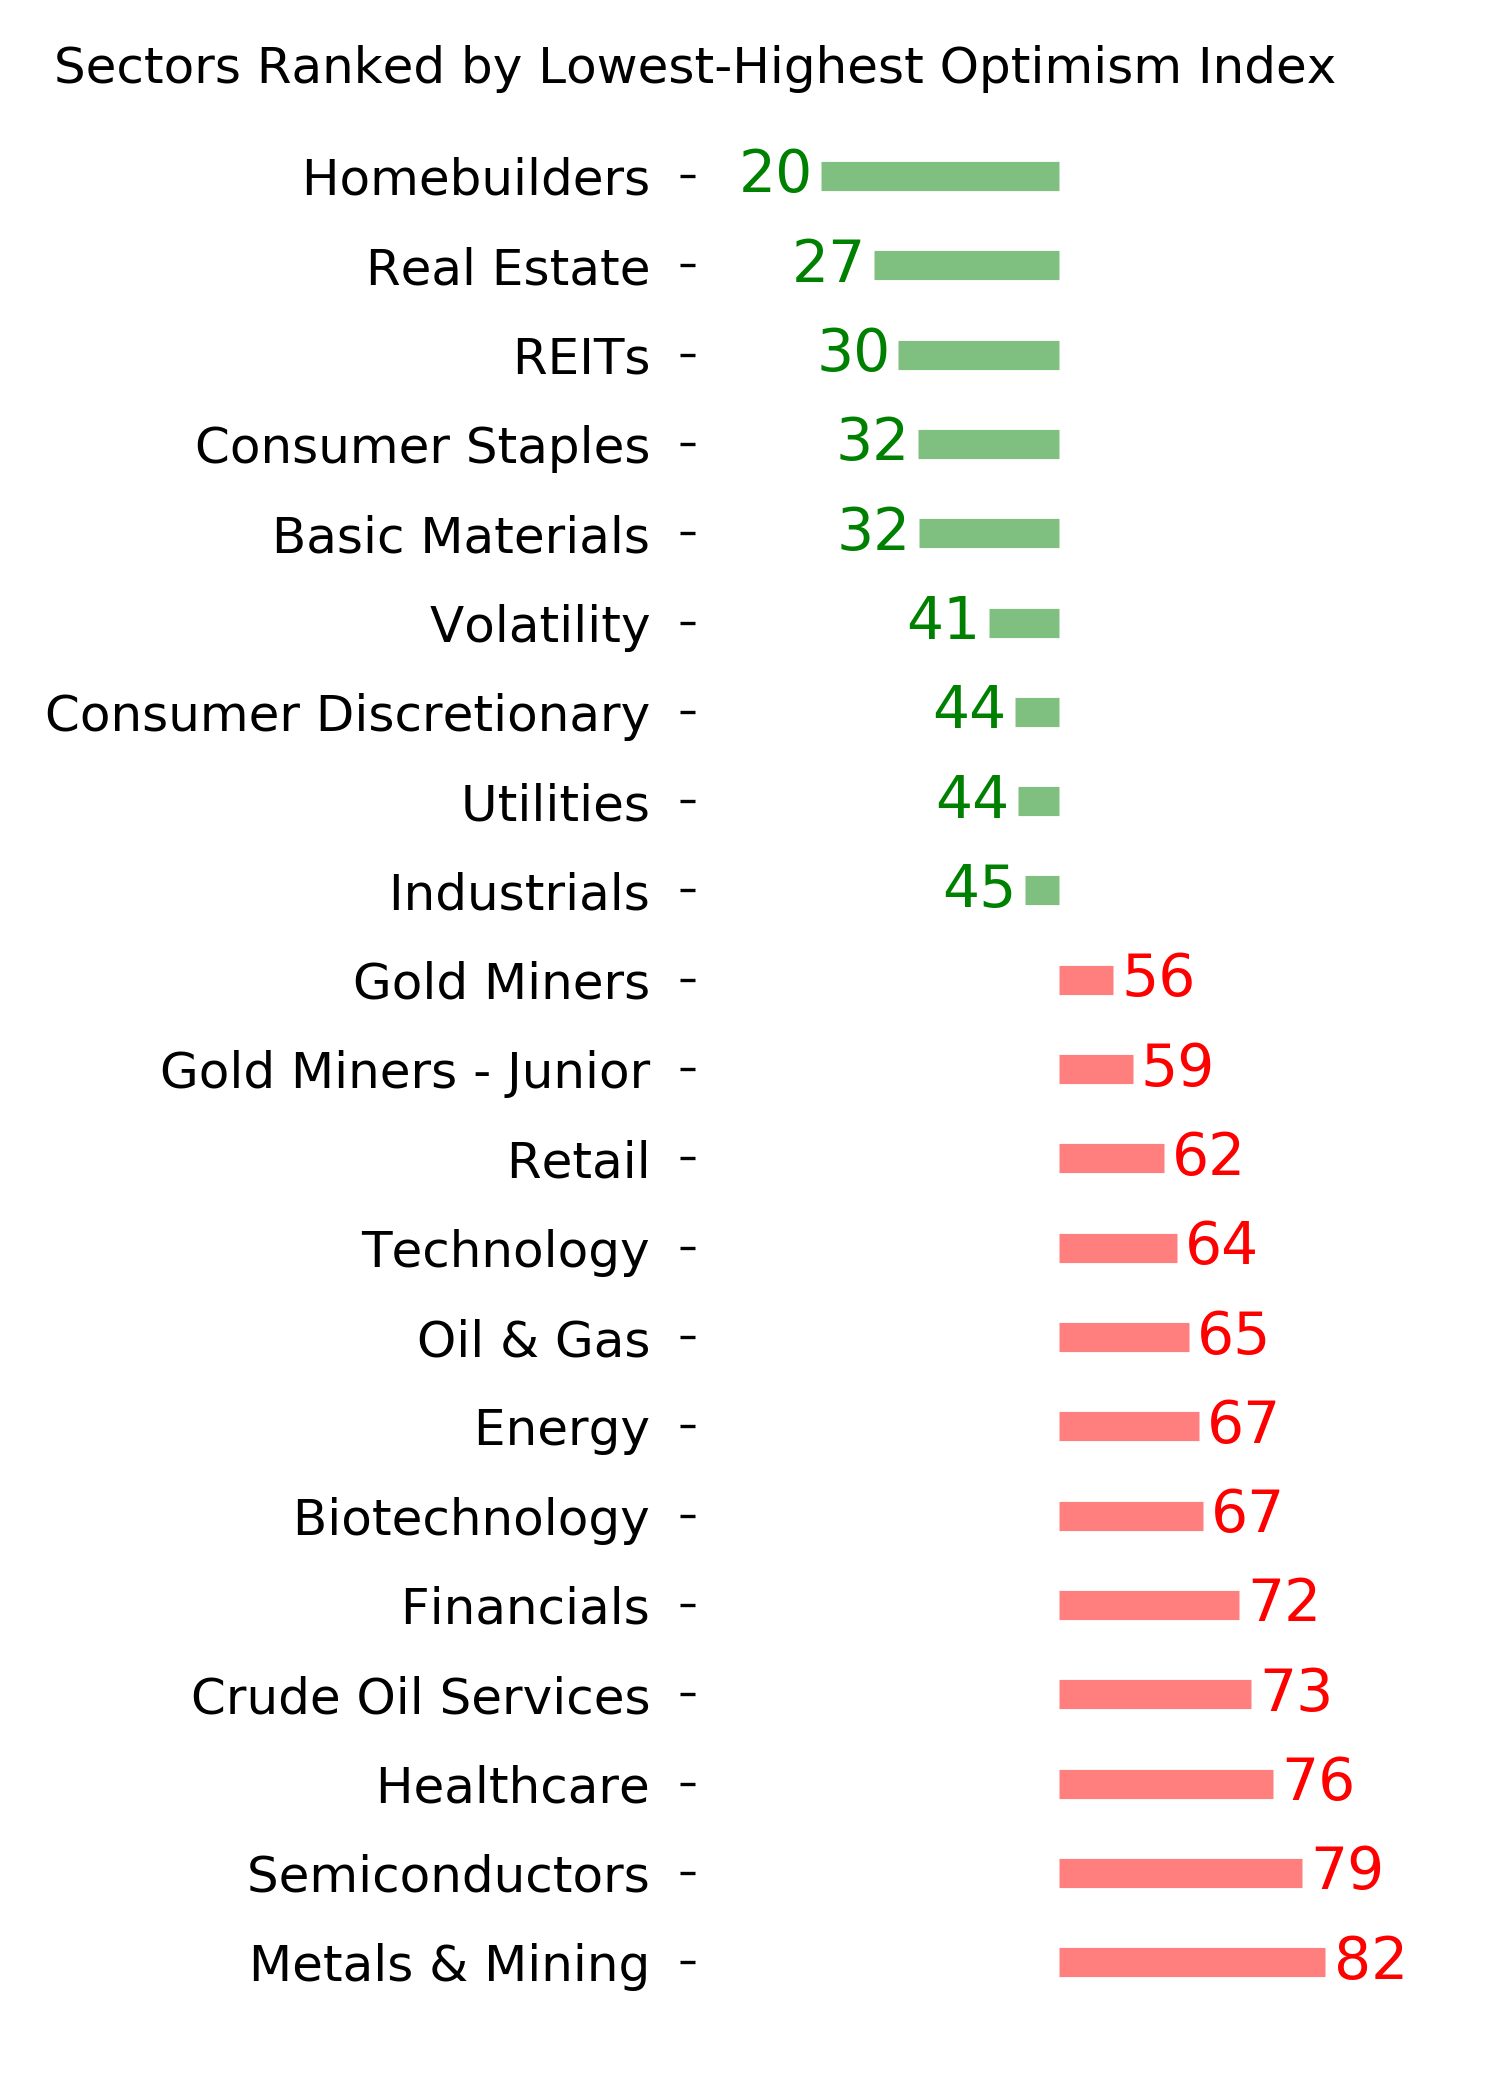
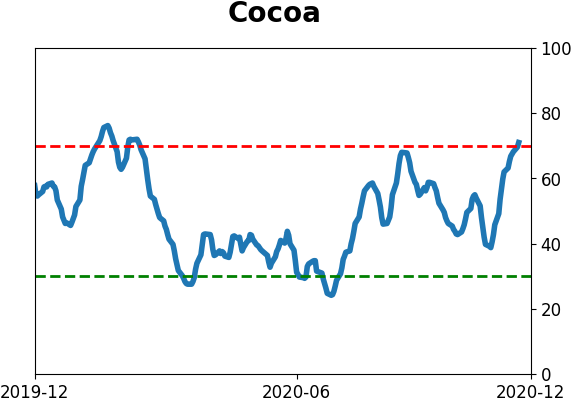
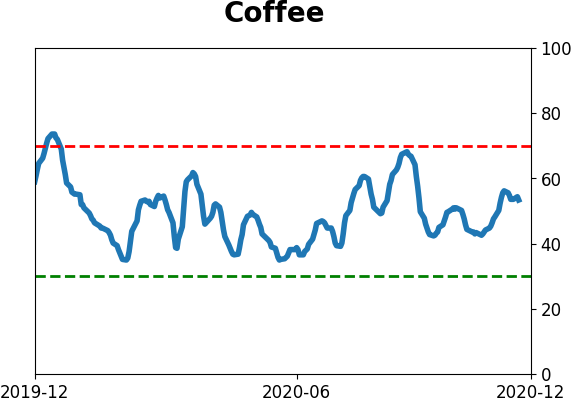
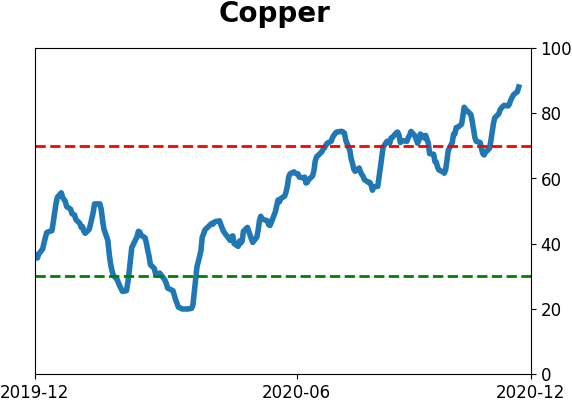
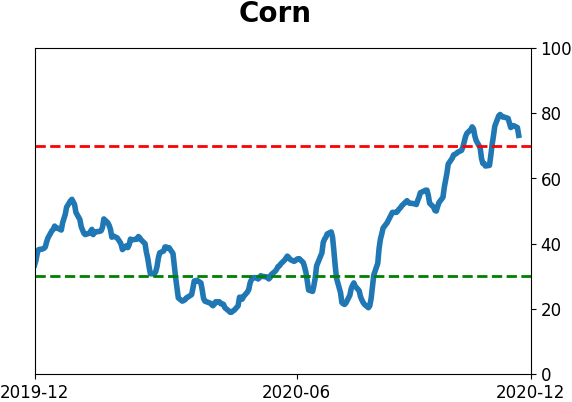
Optimism Index Thumbnails
|
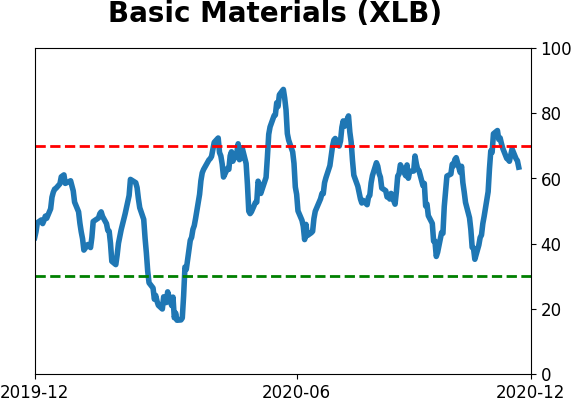
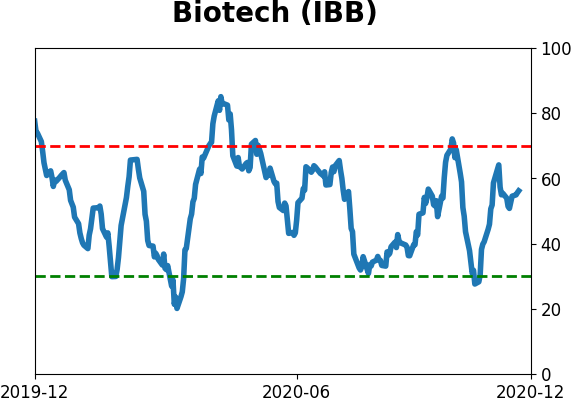
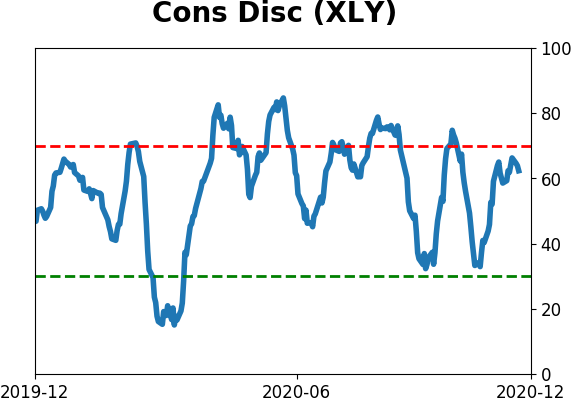
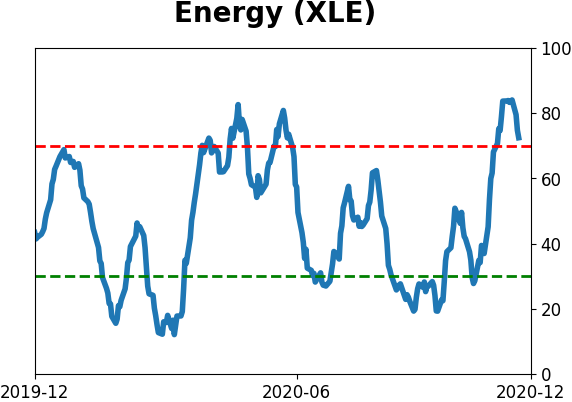
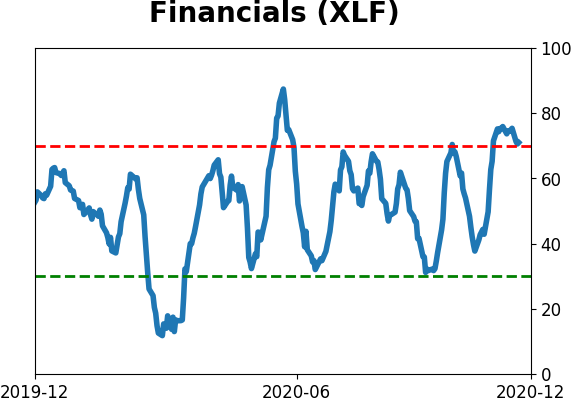
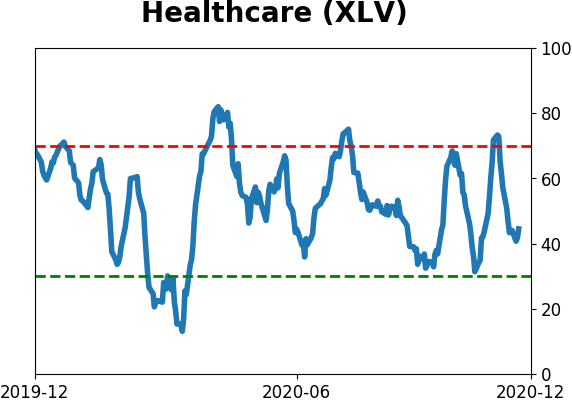
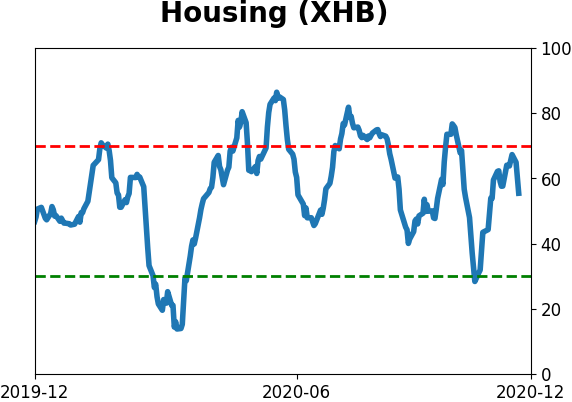
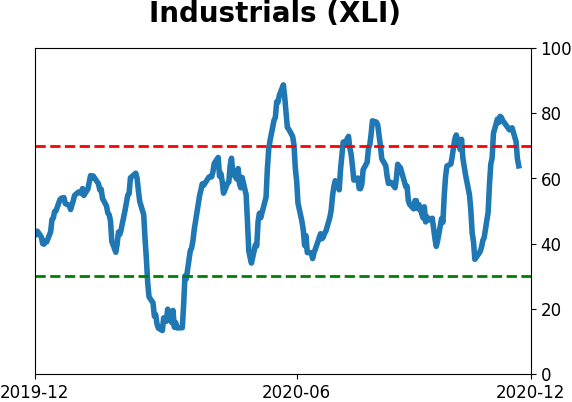
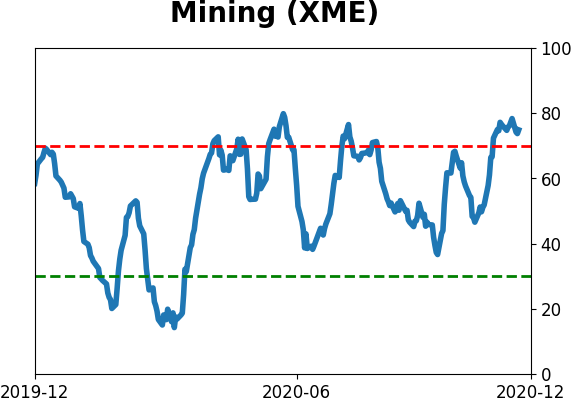
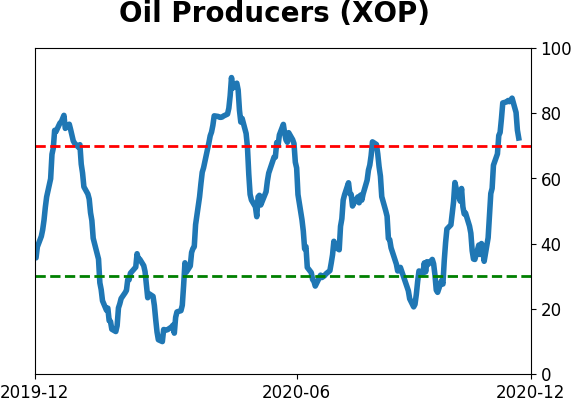
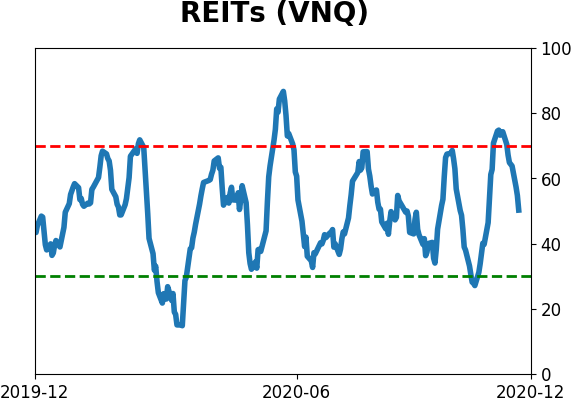
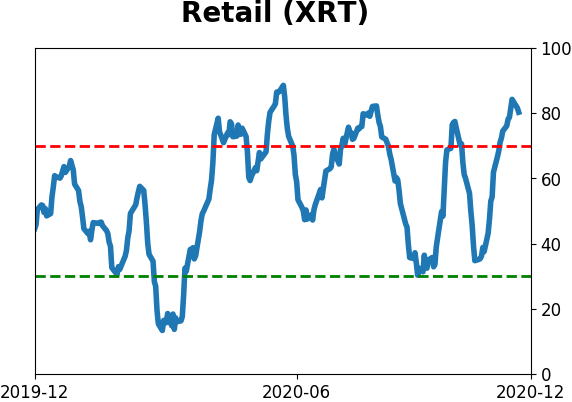
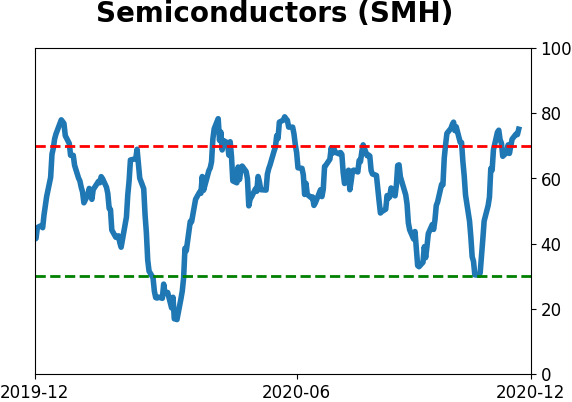
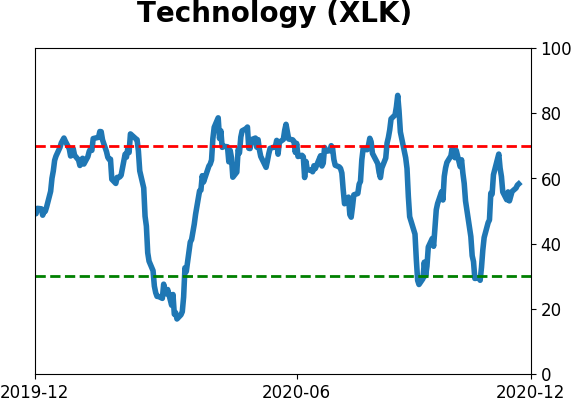
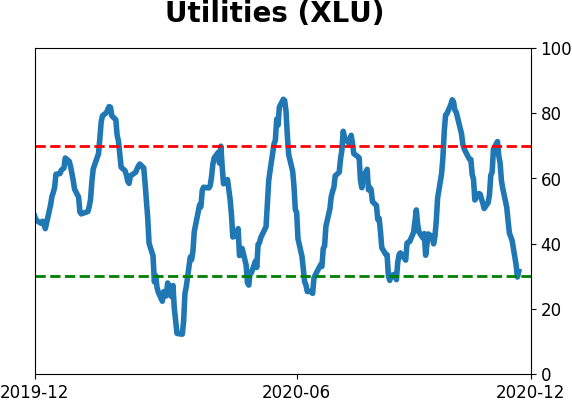
Sector ETF's - 10-Day Moving Average
|
|
|
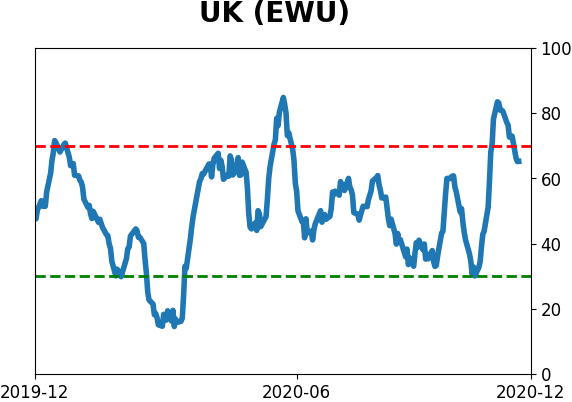
Country ETF's - 10-Day Moving Average
|
|
|
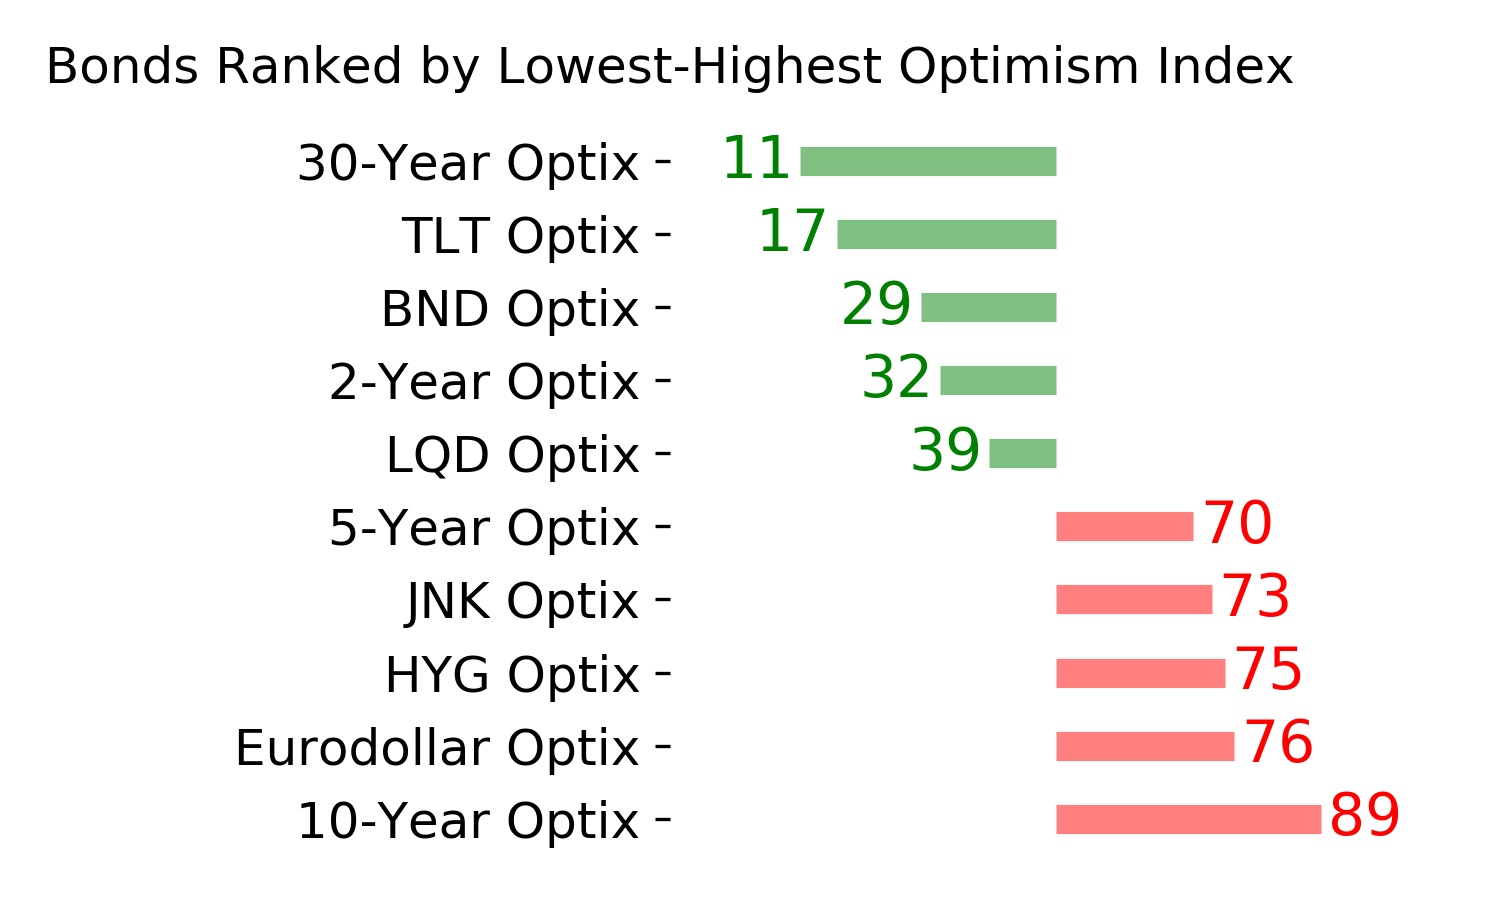
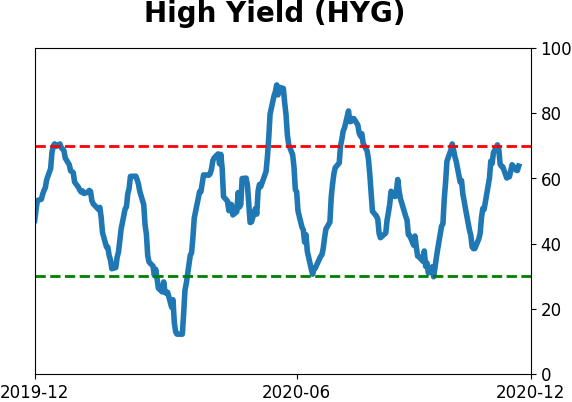
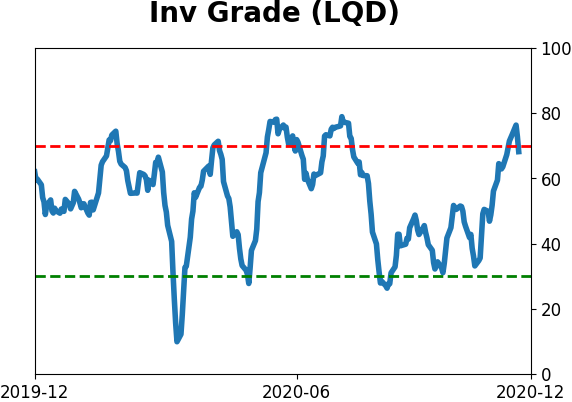
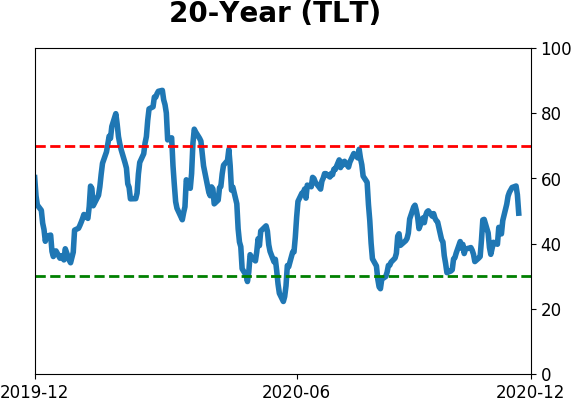
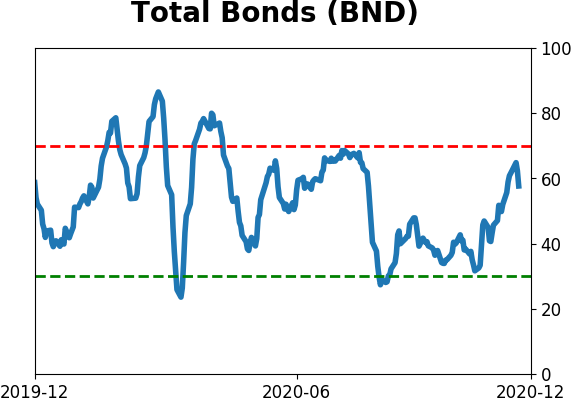
Bond ETF's - 10-Day Moving Average
|
|
|
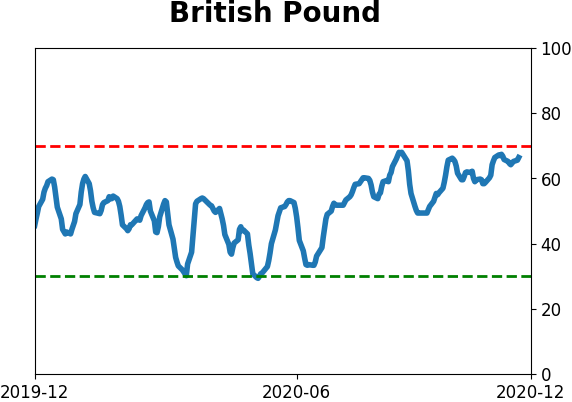
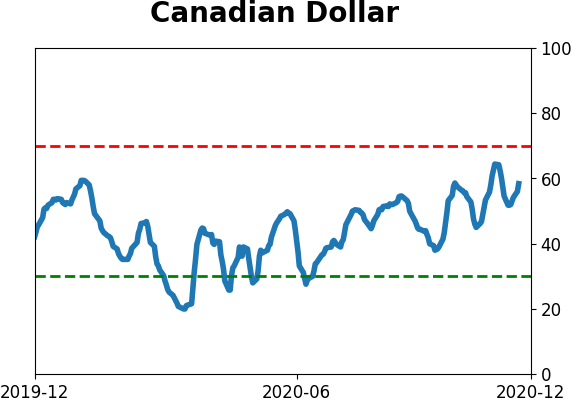
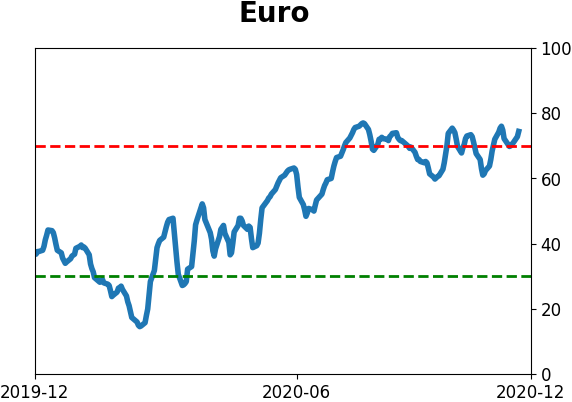
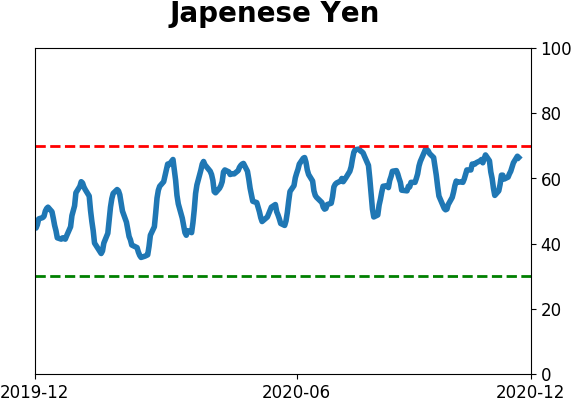
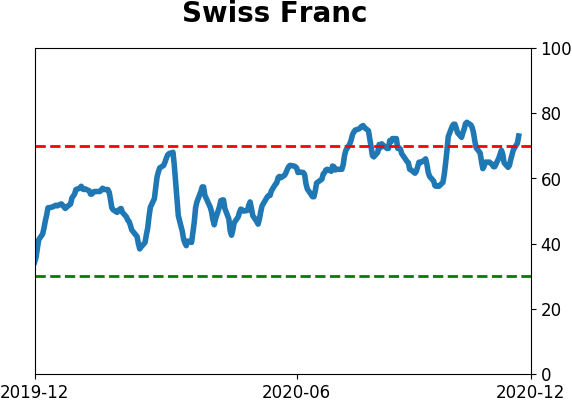
Currency ETF's - 5-Day Moving Average
|
|
|
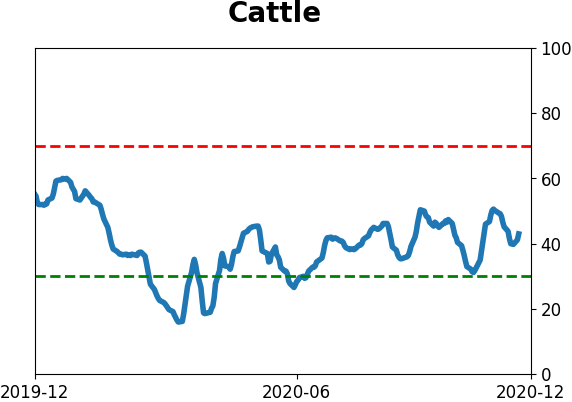
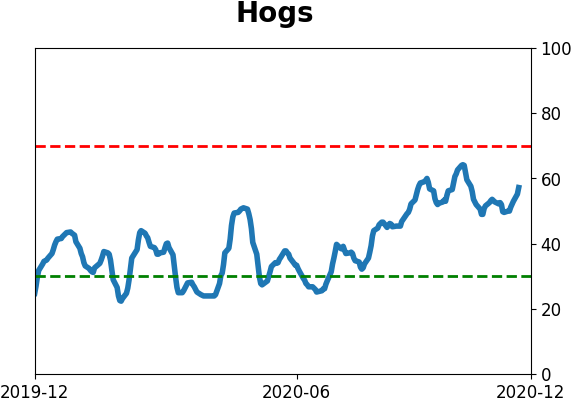
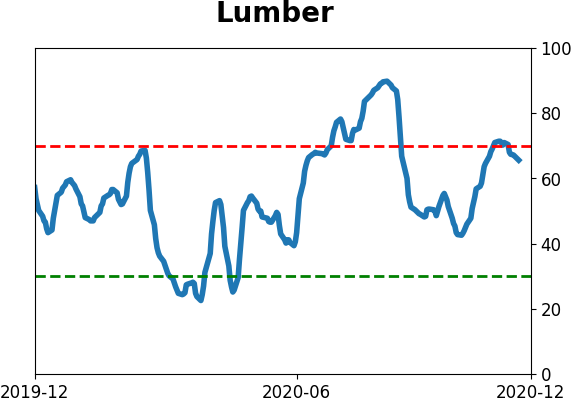
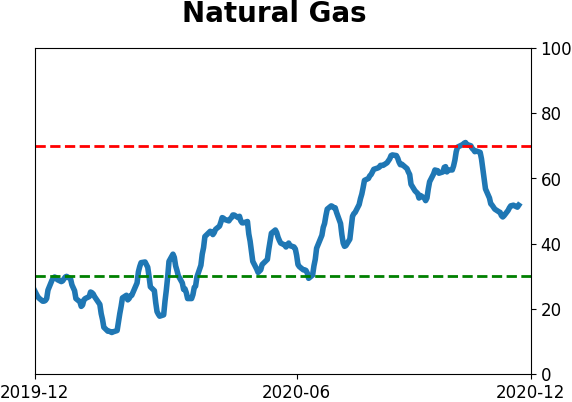
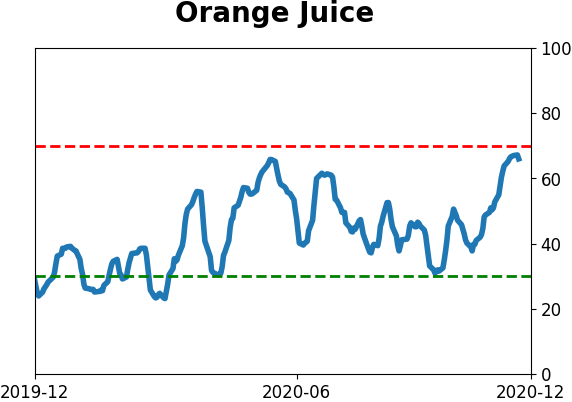
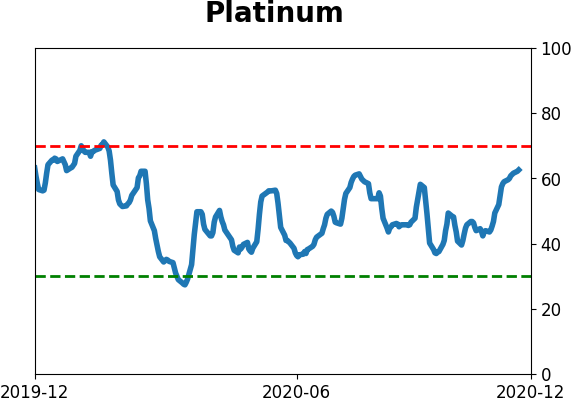
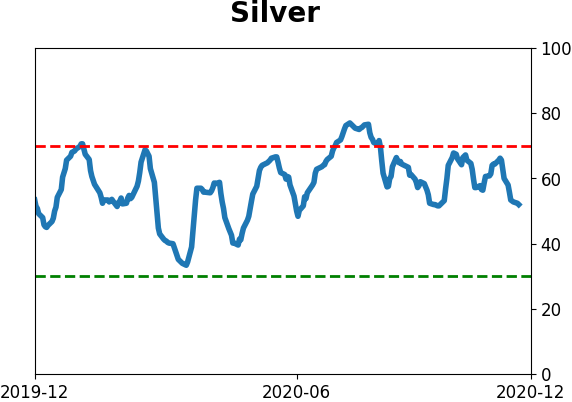
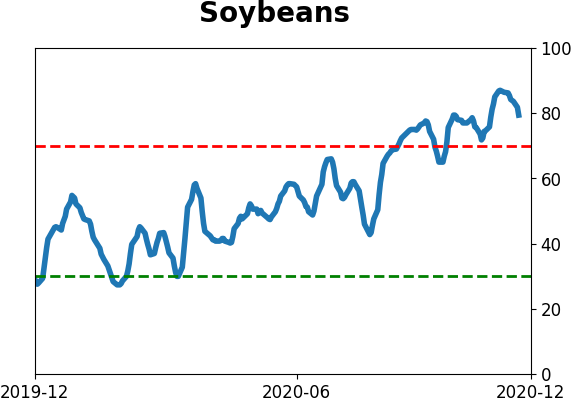
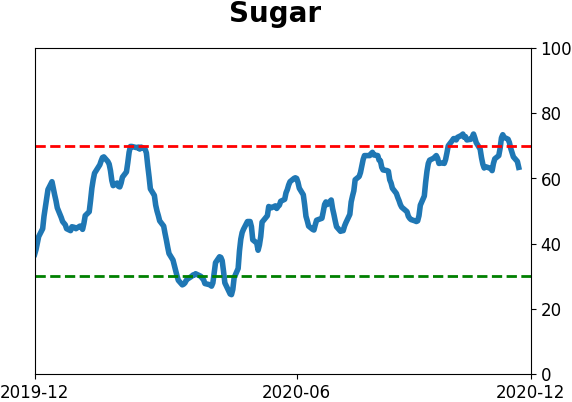
Commodity ETF's - 5-Day Moving Average
|
|