Headlines
|
|
Energy and small cap reversals:
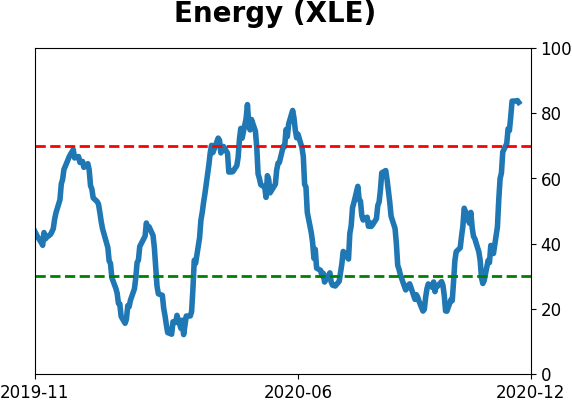
A few months ago energy stocks were extremely hated. But with markets rotating towards companies that should recover when a vaccine is released, energy stocks (XLE) have jumped 45% in the past month alone!
Bottom Line:
- The market environment is pristine, but with near-historic optimism, gains tend to be muted, with a high probability of being reversed at some point over the ensuing weeks.
|
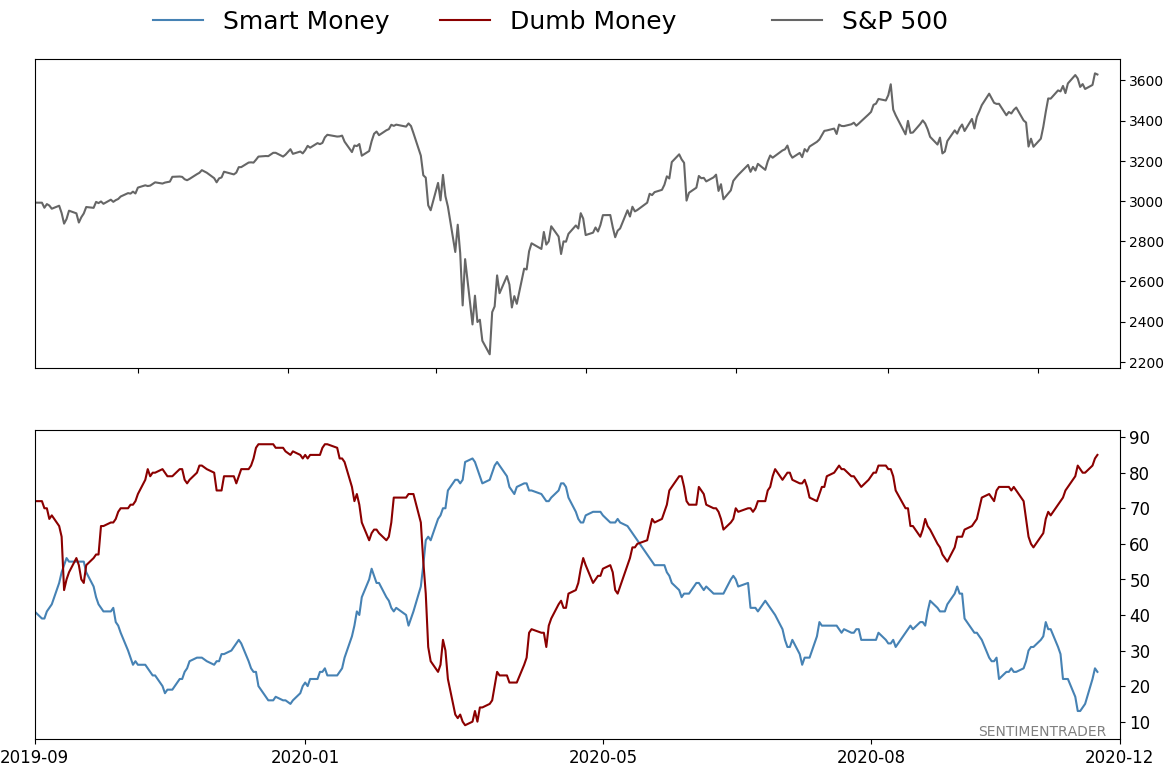
Smart / Dumb Money Confidence
|
Smart Money Confidence: 24%
Dumb Money Confidence: 85%
|
|
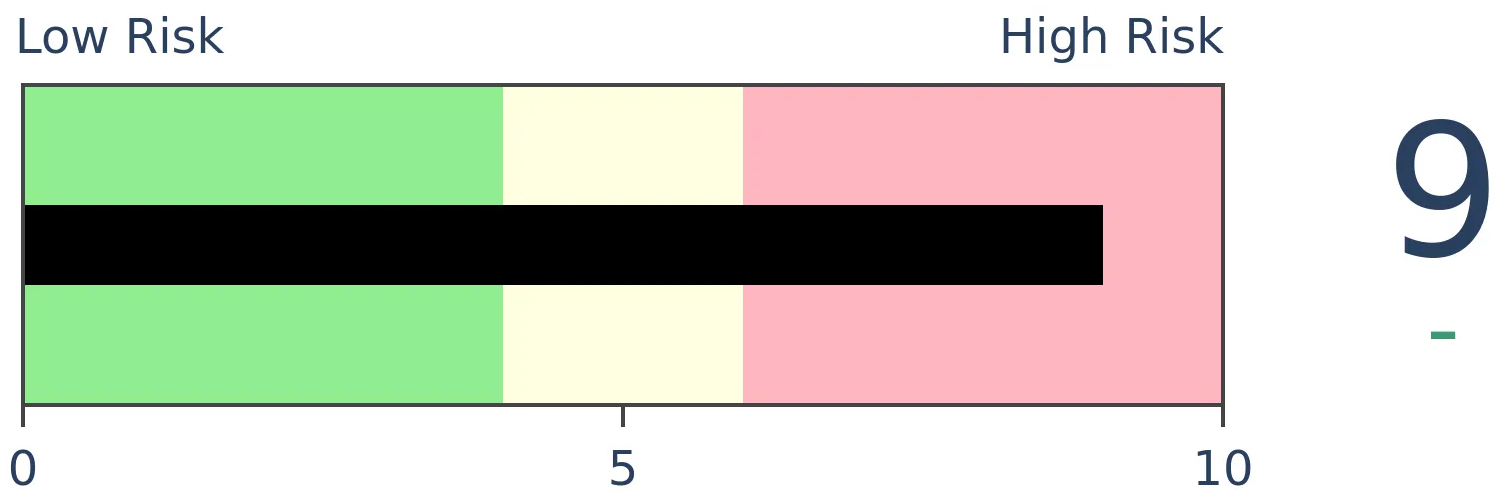
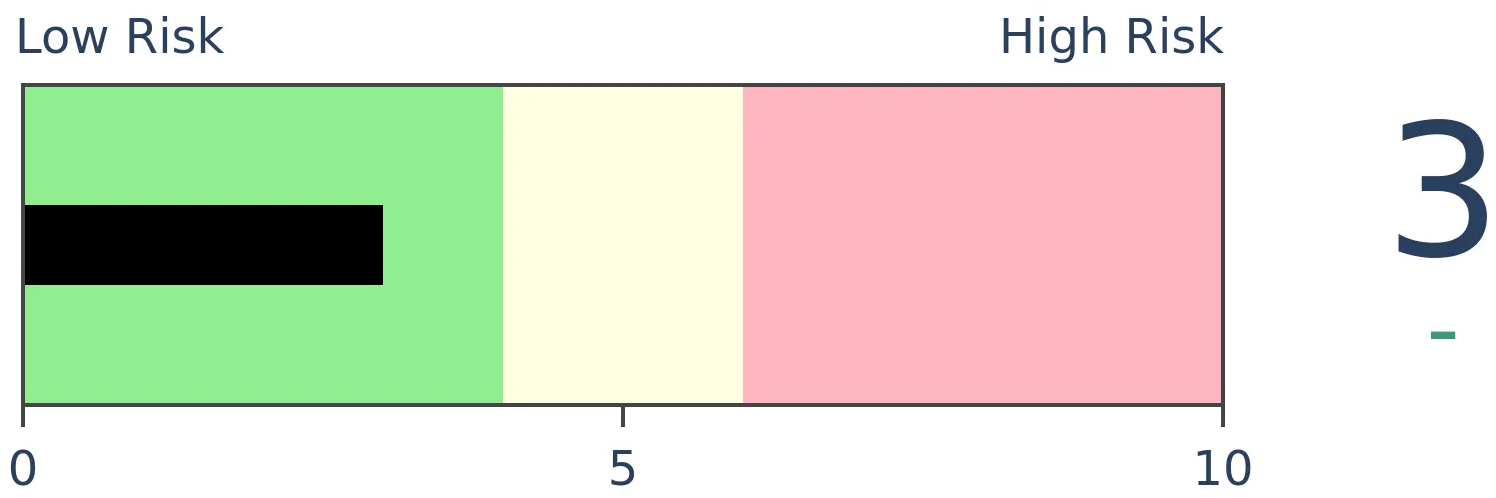
Risk Levels
Stocks Short-Term
|
Stocks Medium-Term
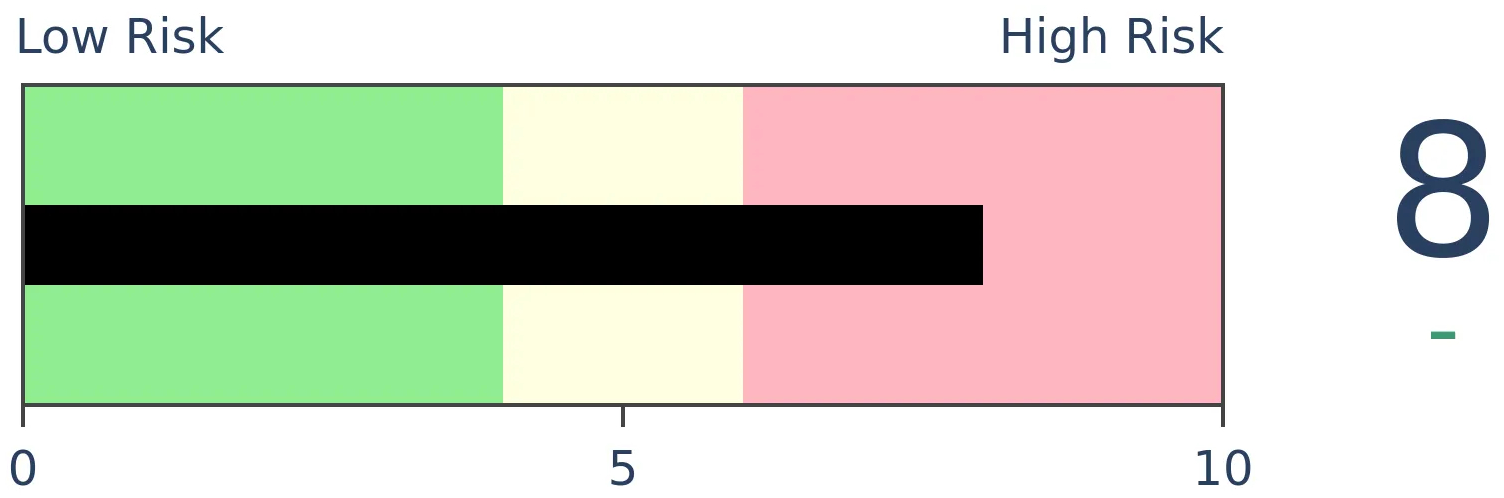
|
|
Bonds

|
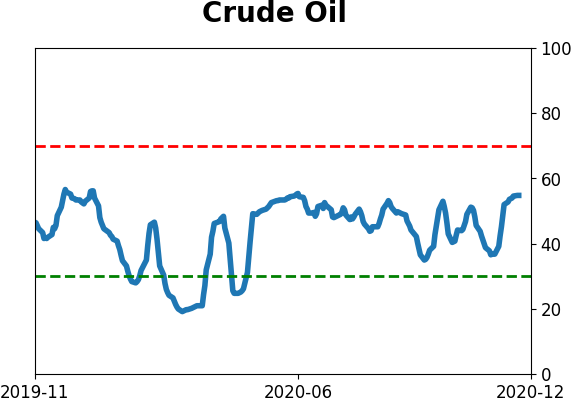
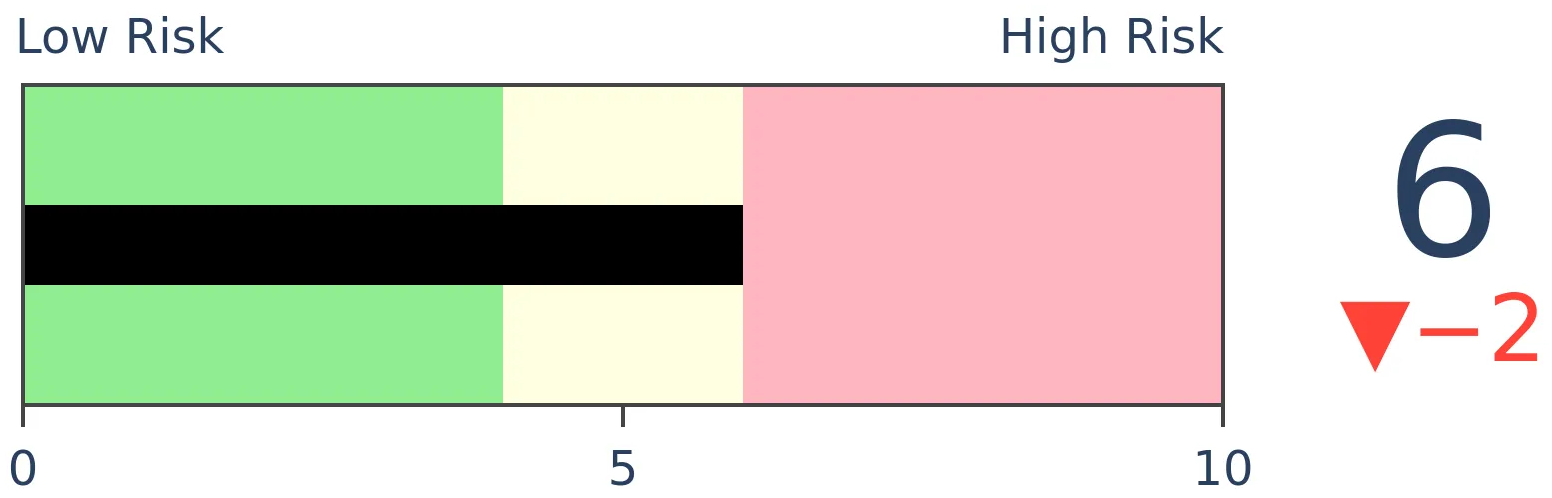
Crude Oil
|
|
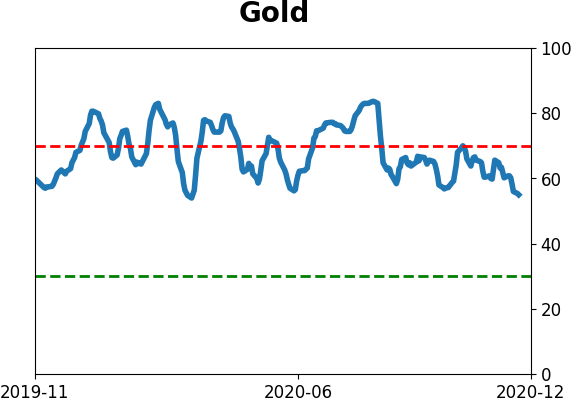
Gold
|
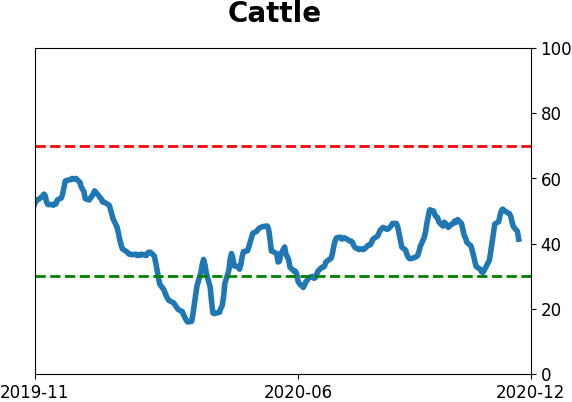
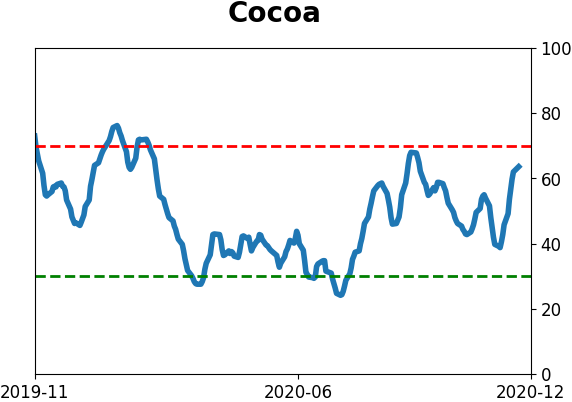
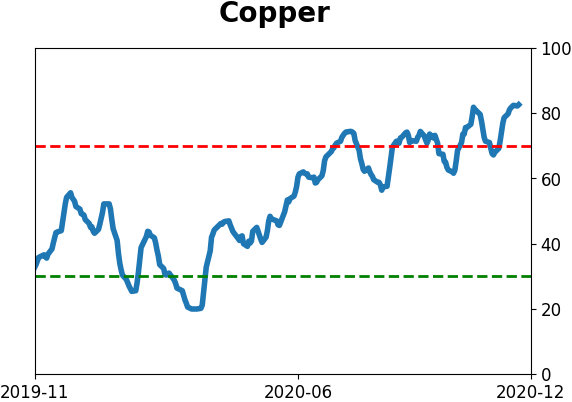
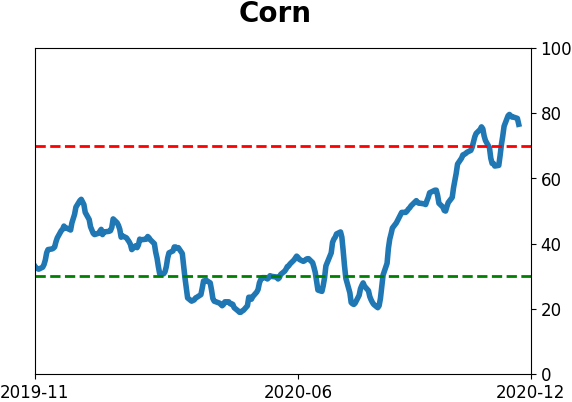
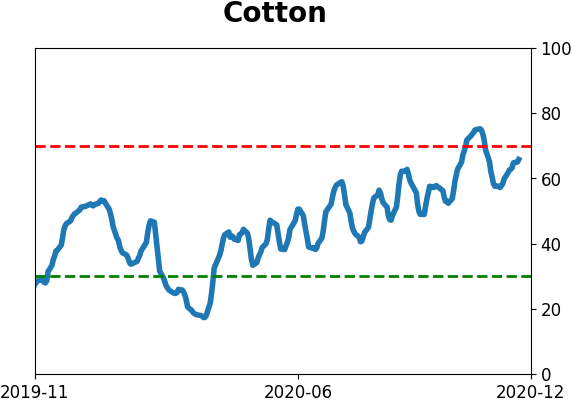
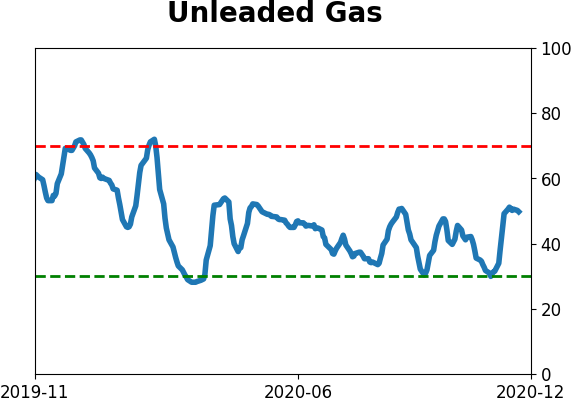
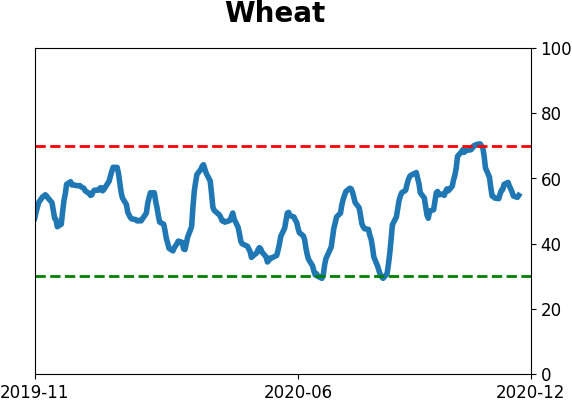
Agriculture

|
|
Research
BOTTOM LINE
A few months ago energy stocks were extremely hated. But with markets rotating towards companies that should recover when a vaccine is released, energy stocks (XLE) have jumped 45% in the past month alone!
FORECAST / TIMEFRAME
None
|
I'm taking a few days away to spend some socially-distanced time with family, so I'm including this premium note published this morning from Troy. Have a safe, healthy, and relaxing break! - Jason
A few months ago energy stocks were extremely hated. But with markets rotating towards companies that should recover when a vaccine is released, energy stocks (XLE) have jumped 45% in the past month alone!
That is quite the reversal in sentiment, with everyone jumping on board the sector rotation train all at once.
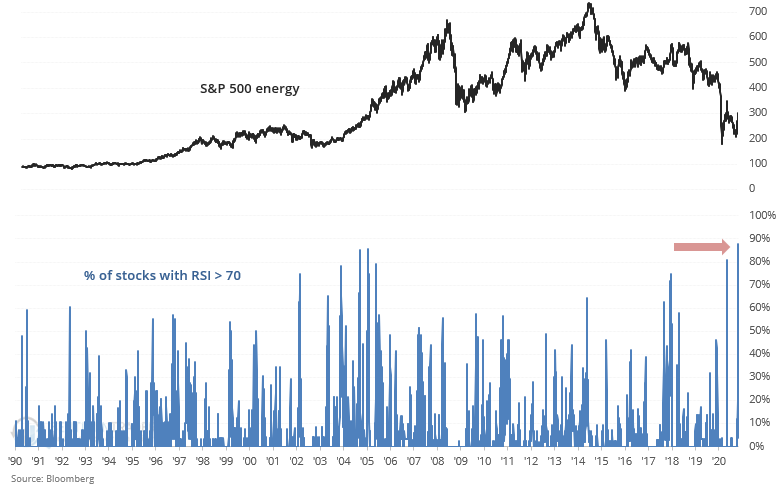
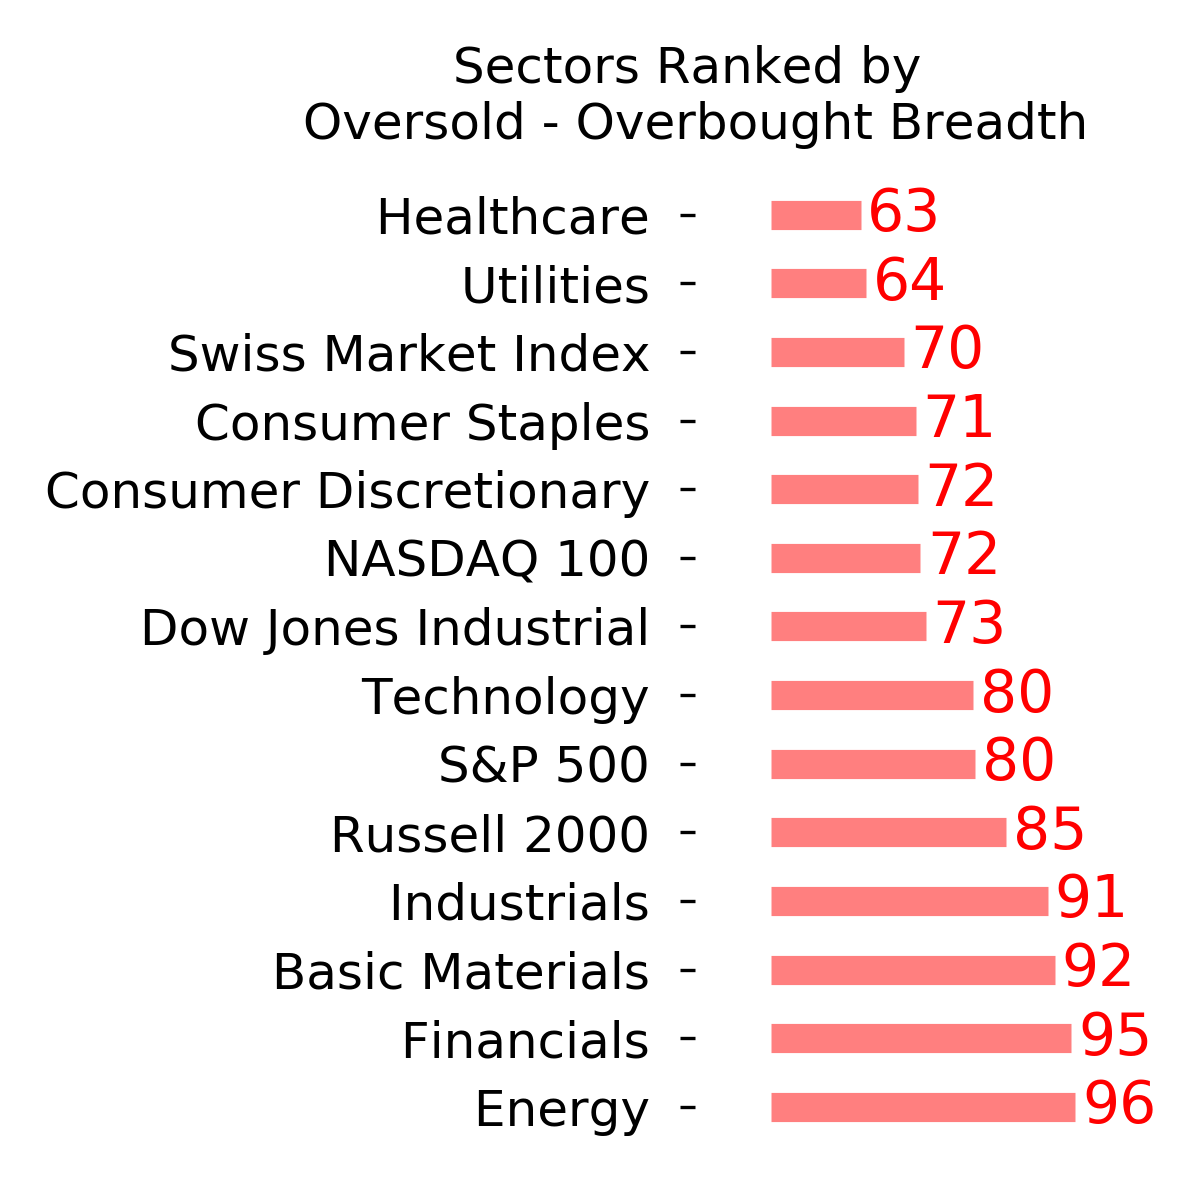
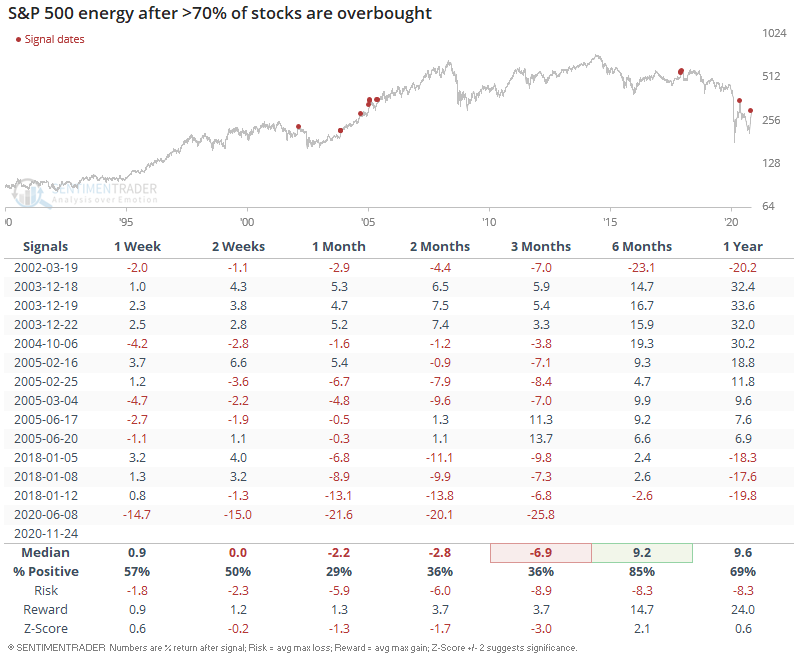
A record % of S&P 500 energy stocks are overbought (RSI > 70). Less extreme readings usually saw losses for the energy sector over the next 1-2 months:
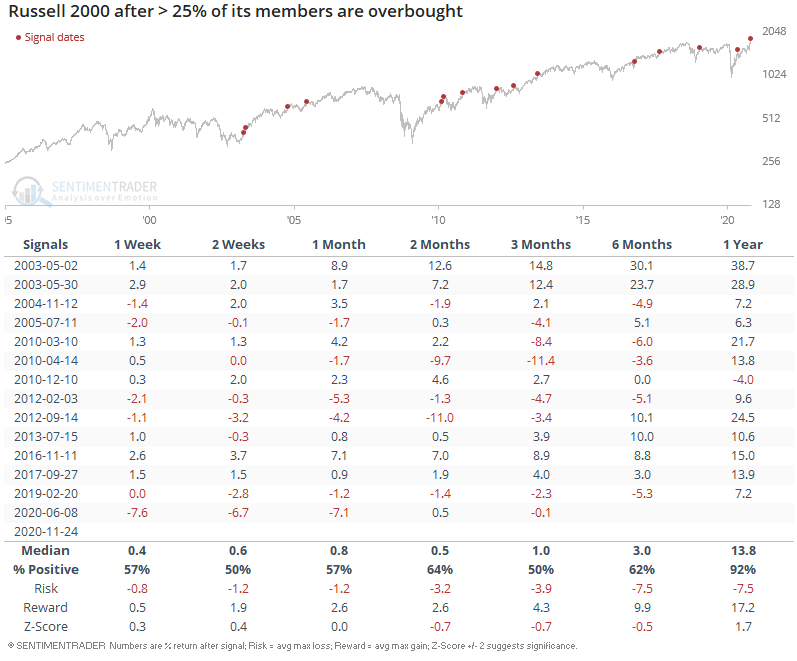
Sector rotation towards small caps is just as powerful. More than a quarter of Russell 2000 stocks are overbought.
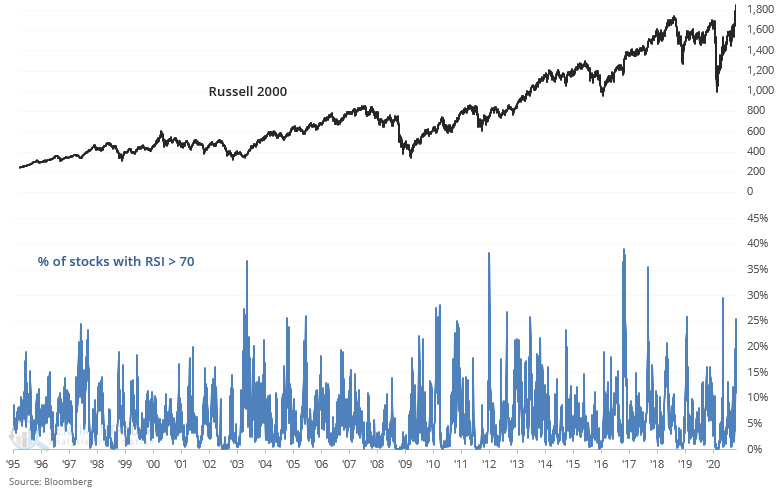
When this happened in the past, the Russell 2000's performance over the next few months was mixed.
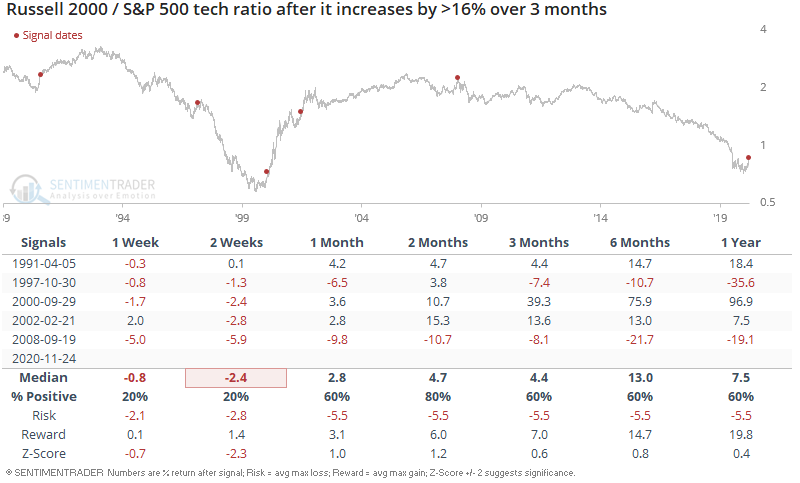
For years value investors and small-cap investors hoped that their beloved factors would turn around. And for years they waited in dismay as growth & tech stocks continuously outperformed. That trend may be turning around, with the Russell 2000 / S&P 500 technology sector ratio surging at its fastest pace in 2 decades:
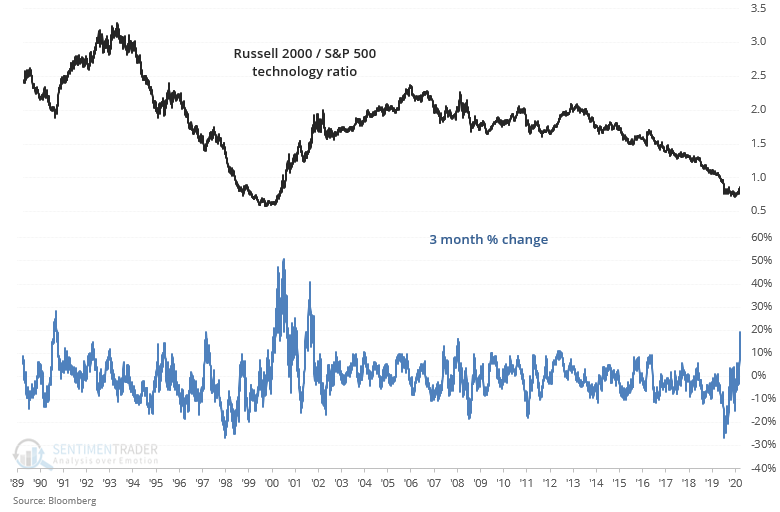
When small-cap stocks surged so quickly relative to tech stocks, the small-cap/tech ratio usually pulled back in the short term:
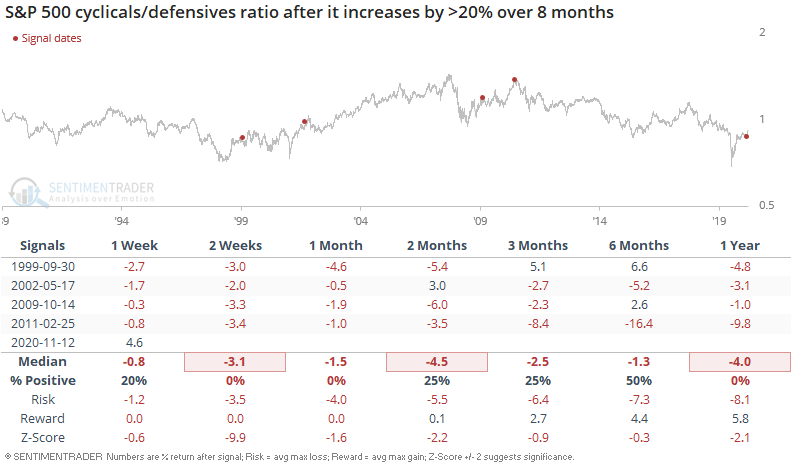
Similarly, the S&P 500 cyclicals/defensives ratio surged since March:
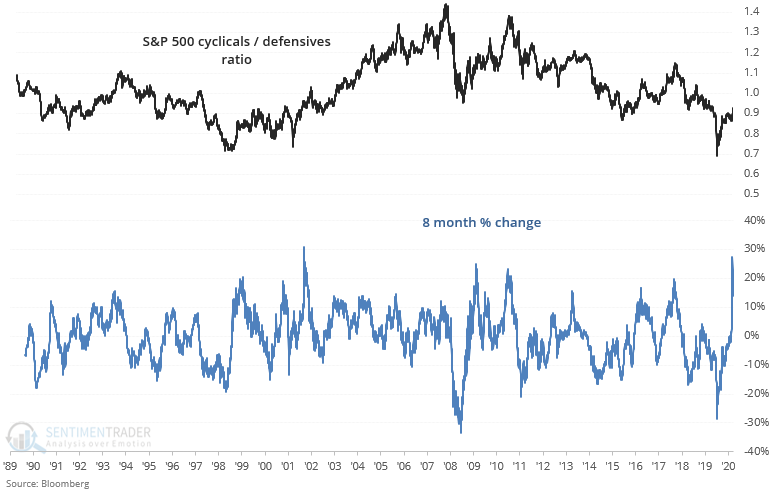
Sector outperformance doesn't last forever, and cyclicals typically underperformed defensives going forward:
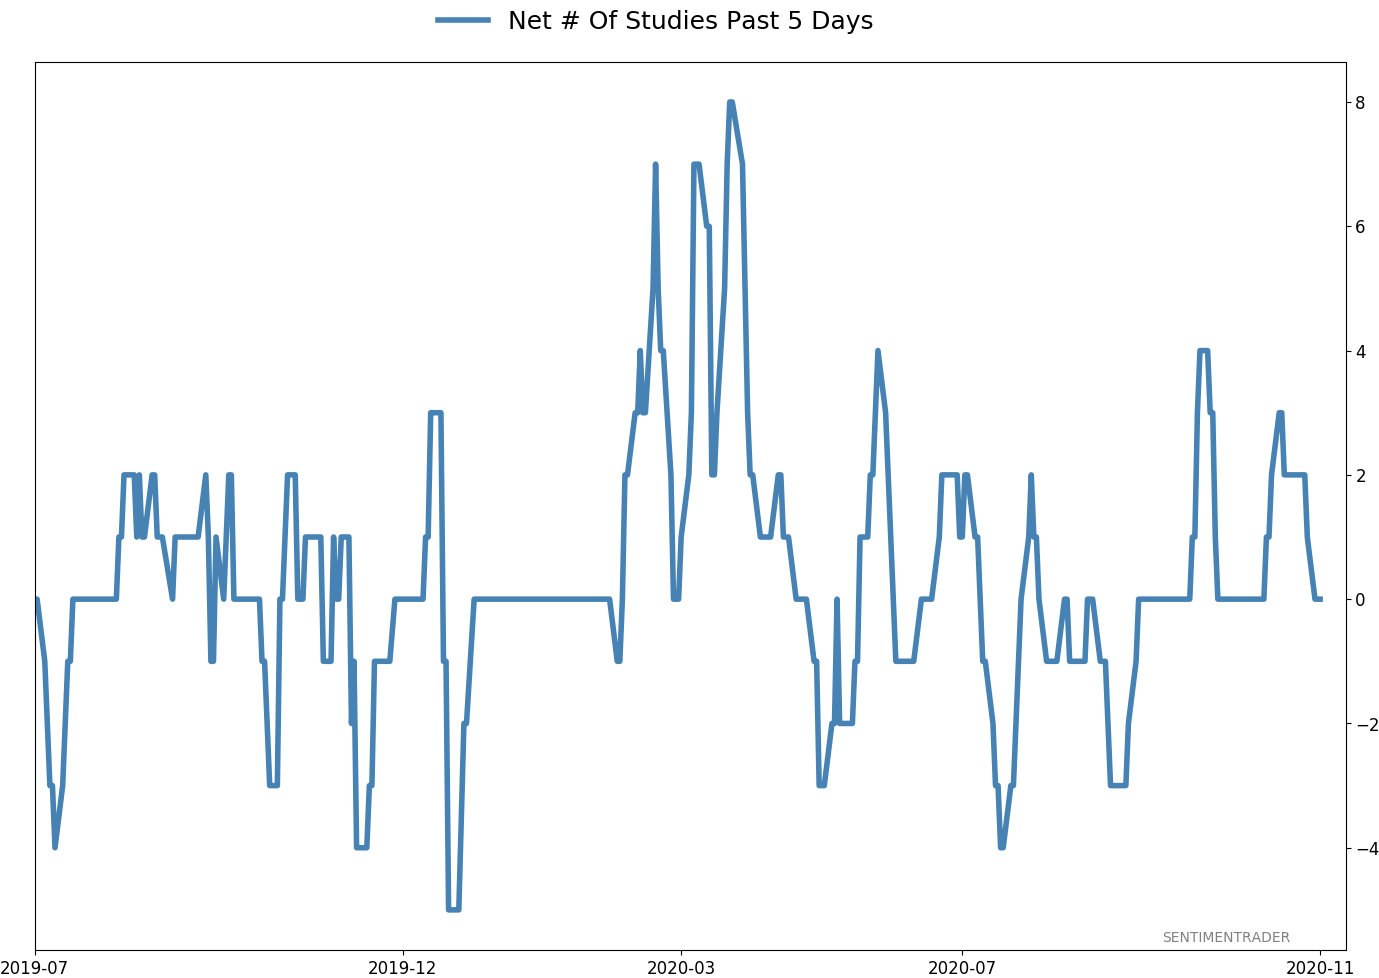
Active Studies
| Time Frame | Bullish | Bearish | | Short-Term | 0 | 0 | | Medium-Term | 5 | 8 | | Long-Term | 51 | 2 |
|
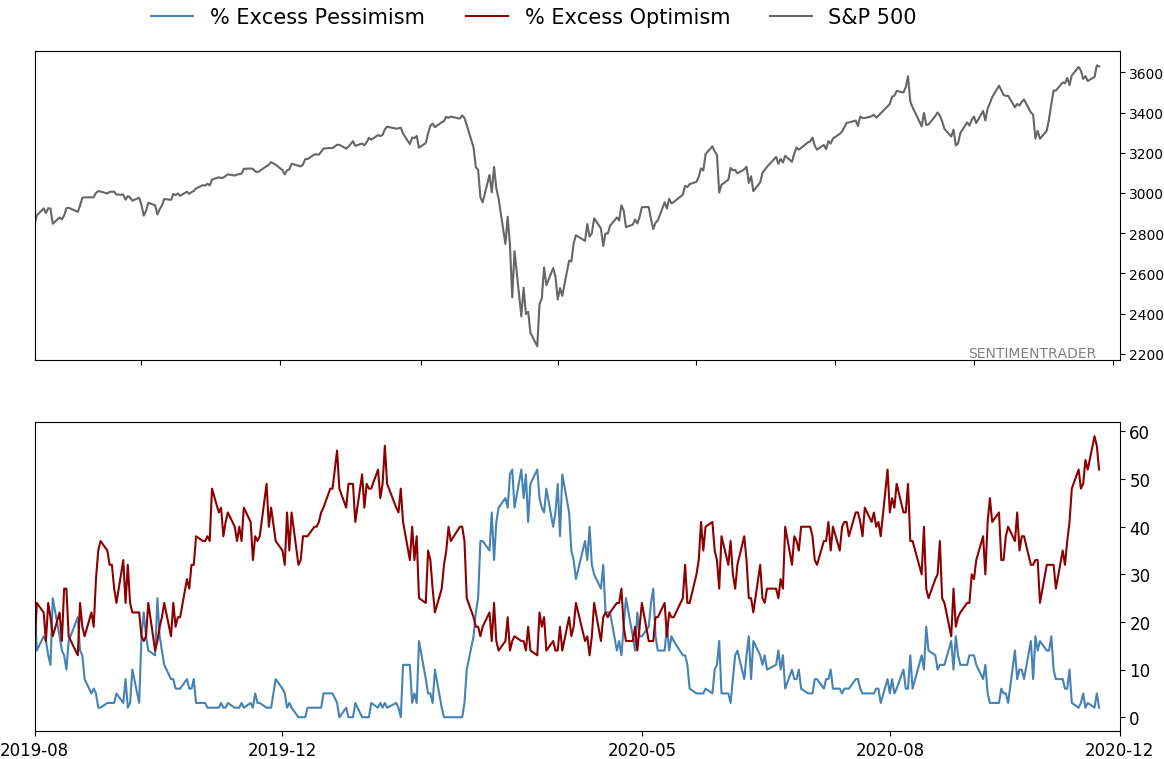
Indicators at Extremes
% Showing Pessimism: 2%
Bullish for Stocks
VIX
|
|
Portfolio
| Position | Description | Weight % | Added / Reduced | Date | | Stocks | 15.6% RSP, 10.1% VWO, 7.5% XLE, 5.1% PSCE | 38.2 | Added 5% | 2020-10-15 | | Bonds | 10% BND, 10% SCHP, 10% ANGL | 29.7 | Reduced 0.1% | 2020-10-02 | | Commodities | GCC | 2.4 | Reduced 2.1%
| 2020-09-04 | | Precious Metals | GDX | 4.7 | Added 5% | 2020-09-09 | | Special Situations | | 0.0 | Reduced 5% | 2020-10-02 | | Cash | | 25.0 | | |
|
Updates (Changes made today are underlined)
After the September swoon wrung some of the worst of the speculation out of stocks, there are some signs that it's returning, especially in the options market. It's helped to push Dumb Money Confidence above 70%. A big difference between now and August is that in August, there was a multitude of days with exceptionally odd breadth readings. Some of the biggest stocks were masking underlying weakness. Combined with heavy speculative activity, it was a dangerous setup. Now, we've seen very strong internal strength, in the broad market, as well as tech and small-cap stocks. Prior signals almost invariably led to higher prices. That's hard to square with the idea that forward returns tend to be subdued when Confidence is high, but that's less reliable during healthy market conditions, which we're seeing now (for the most part). I added some risk with small-cap energy stocks, due to an increasing number of positive signs in both small-caps and energy. This is intended as a long-term position.
RETURN YTD: 5.9% 2019: 12.6%, 2018: 0.6%, 2017: 3.8%, 2016: 17.1%, 2015: 9.2%, 2014: 14.5%, 2013: 2.2%, 2012: 10.8%, 2011: 16.5%, 2010: 15.3%, 2009: 23.9%, 2008: 16.2%, 2007: 7.8%
|
|
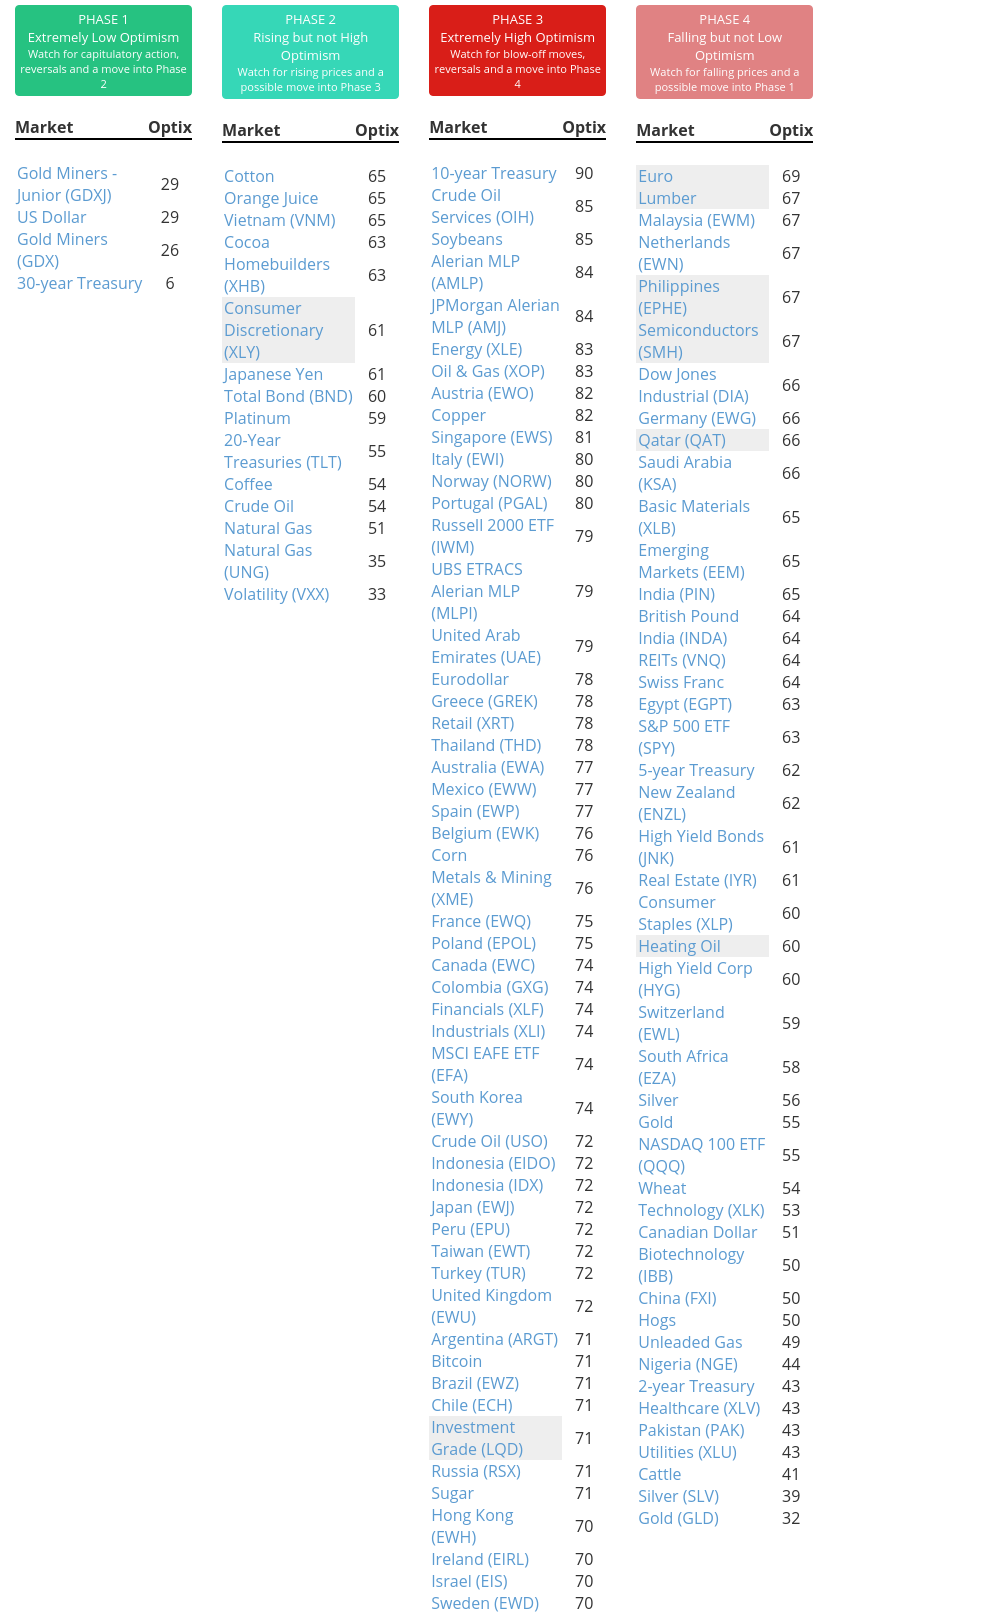
Phase Table
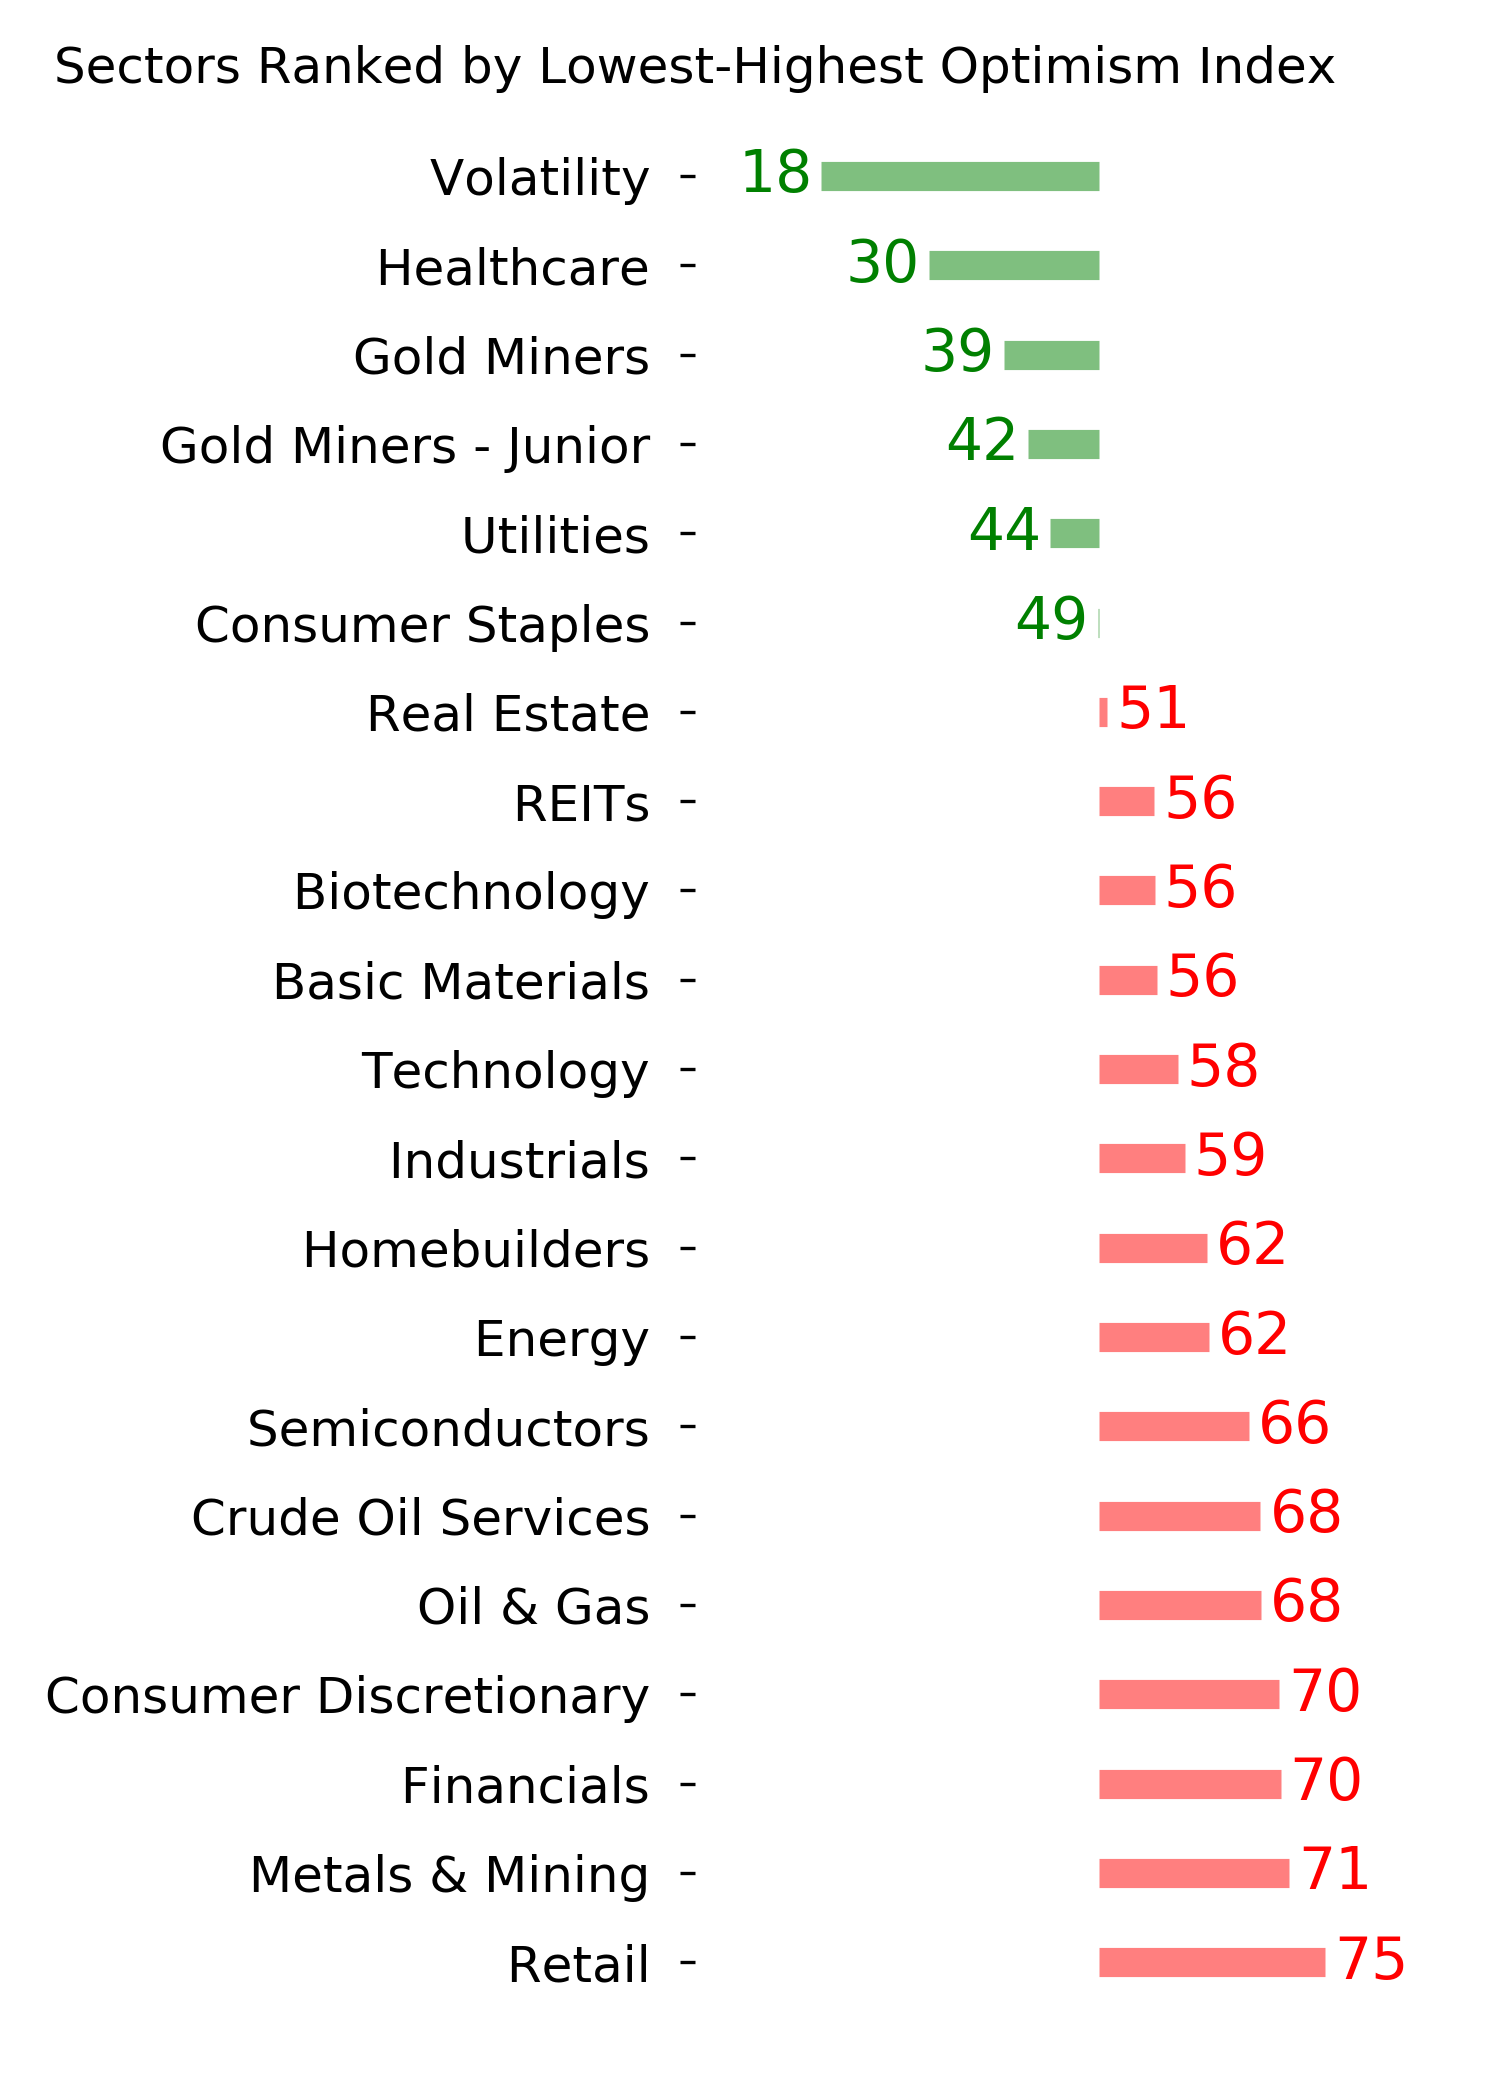
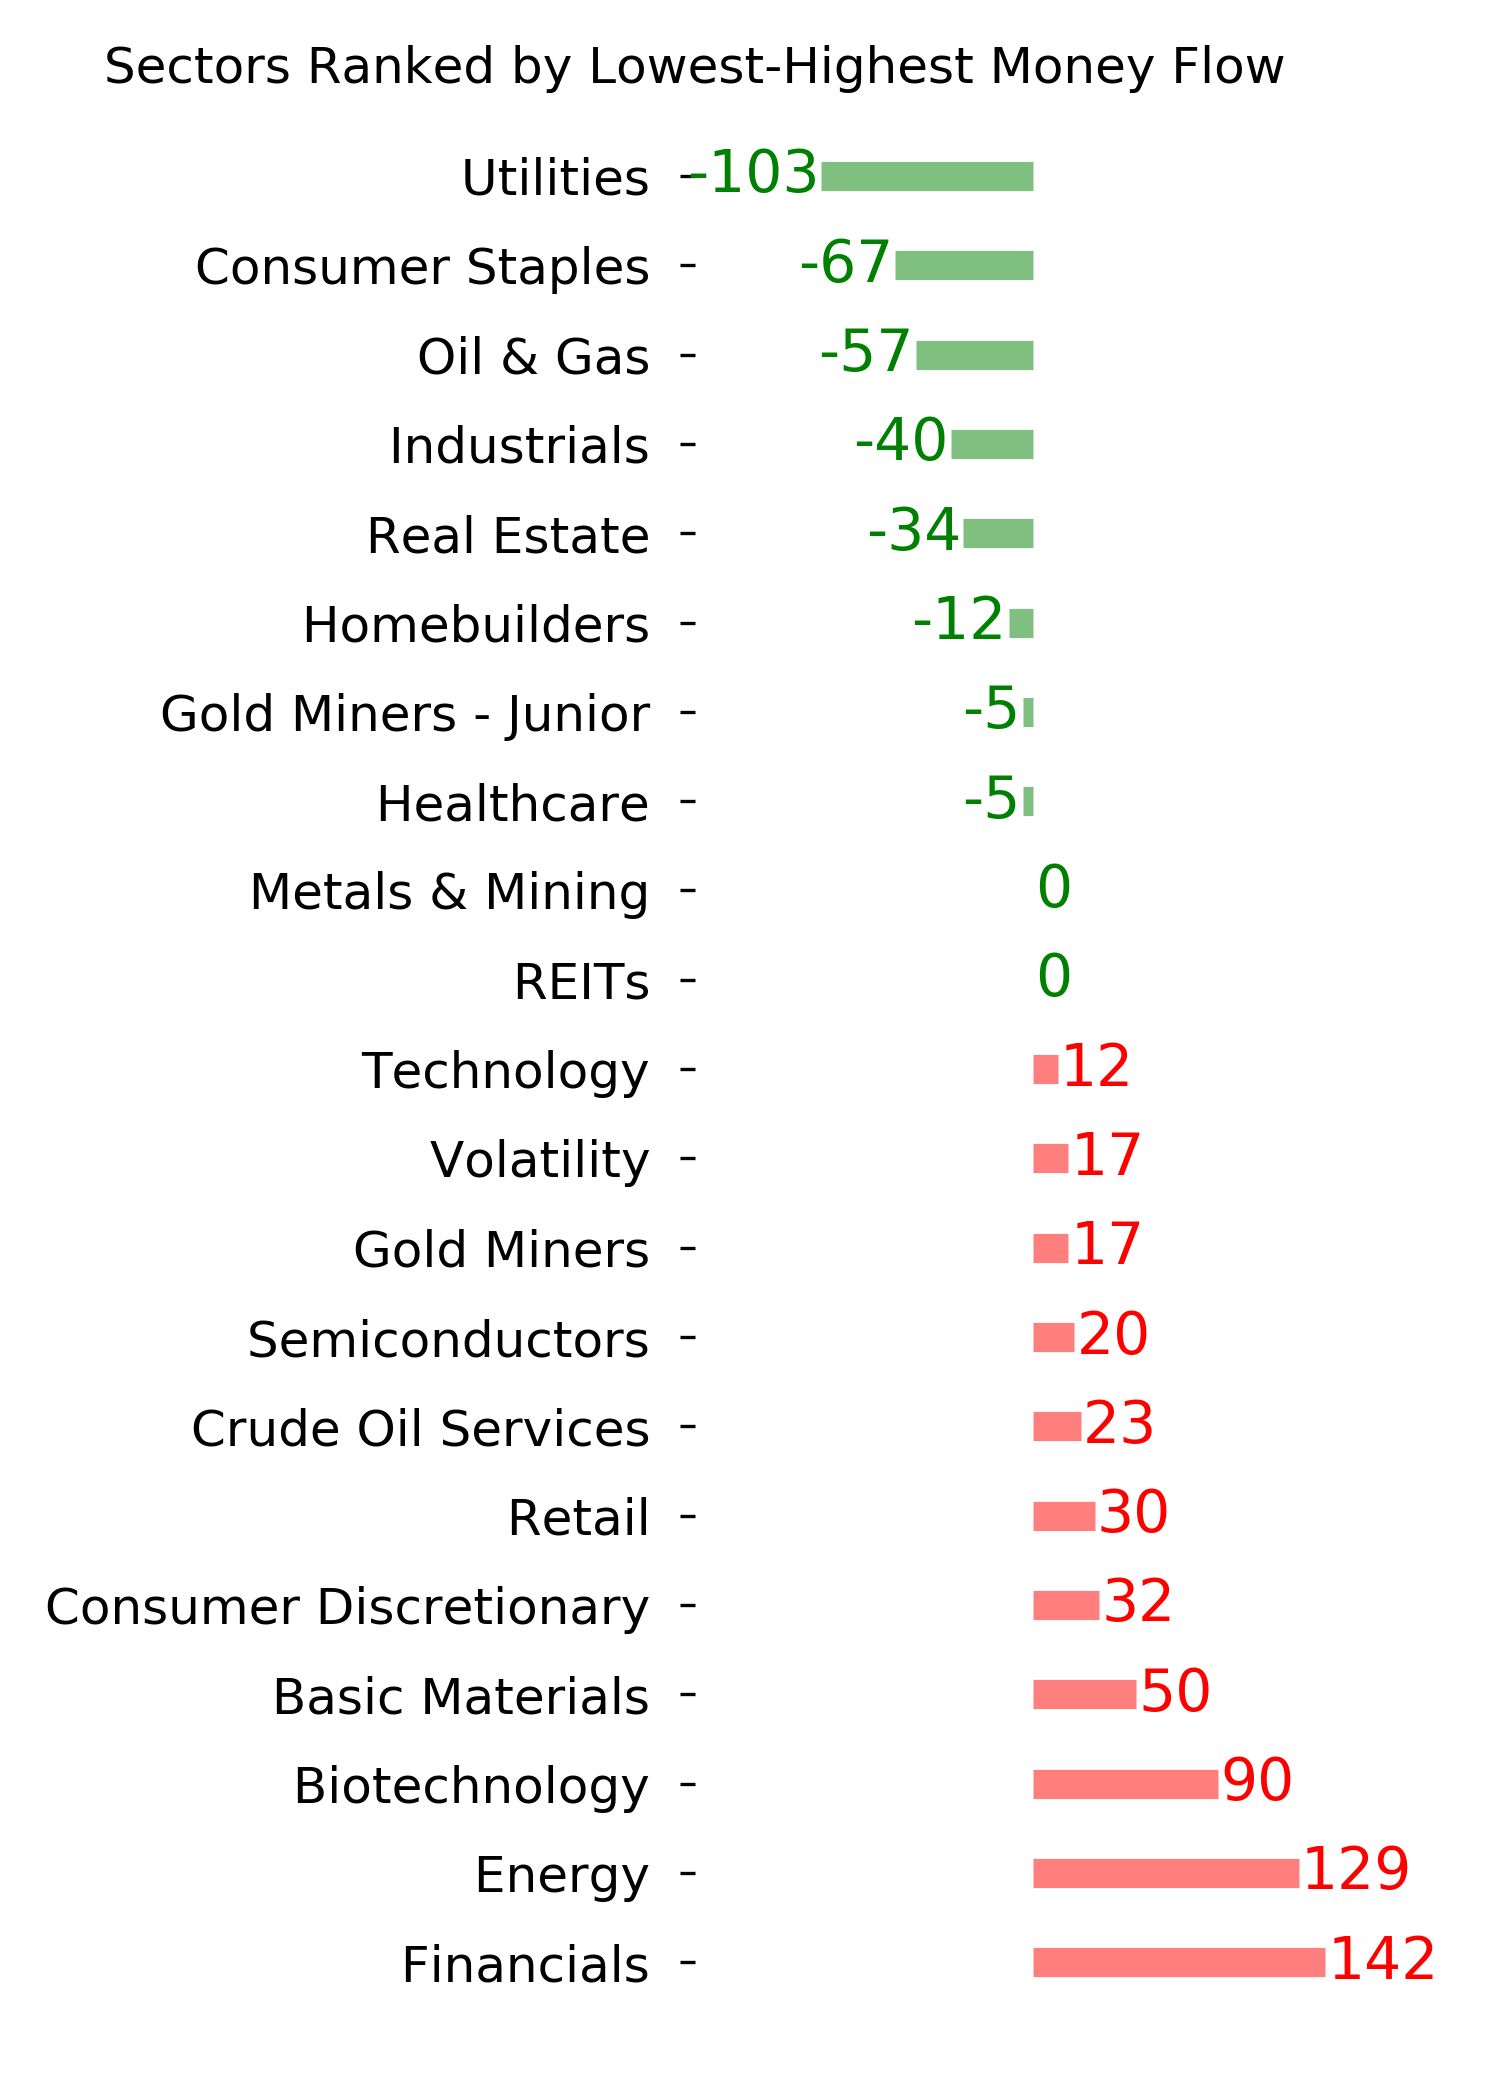
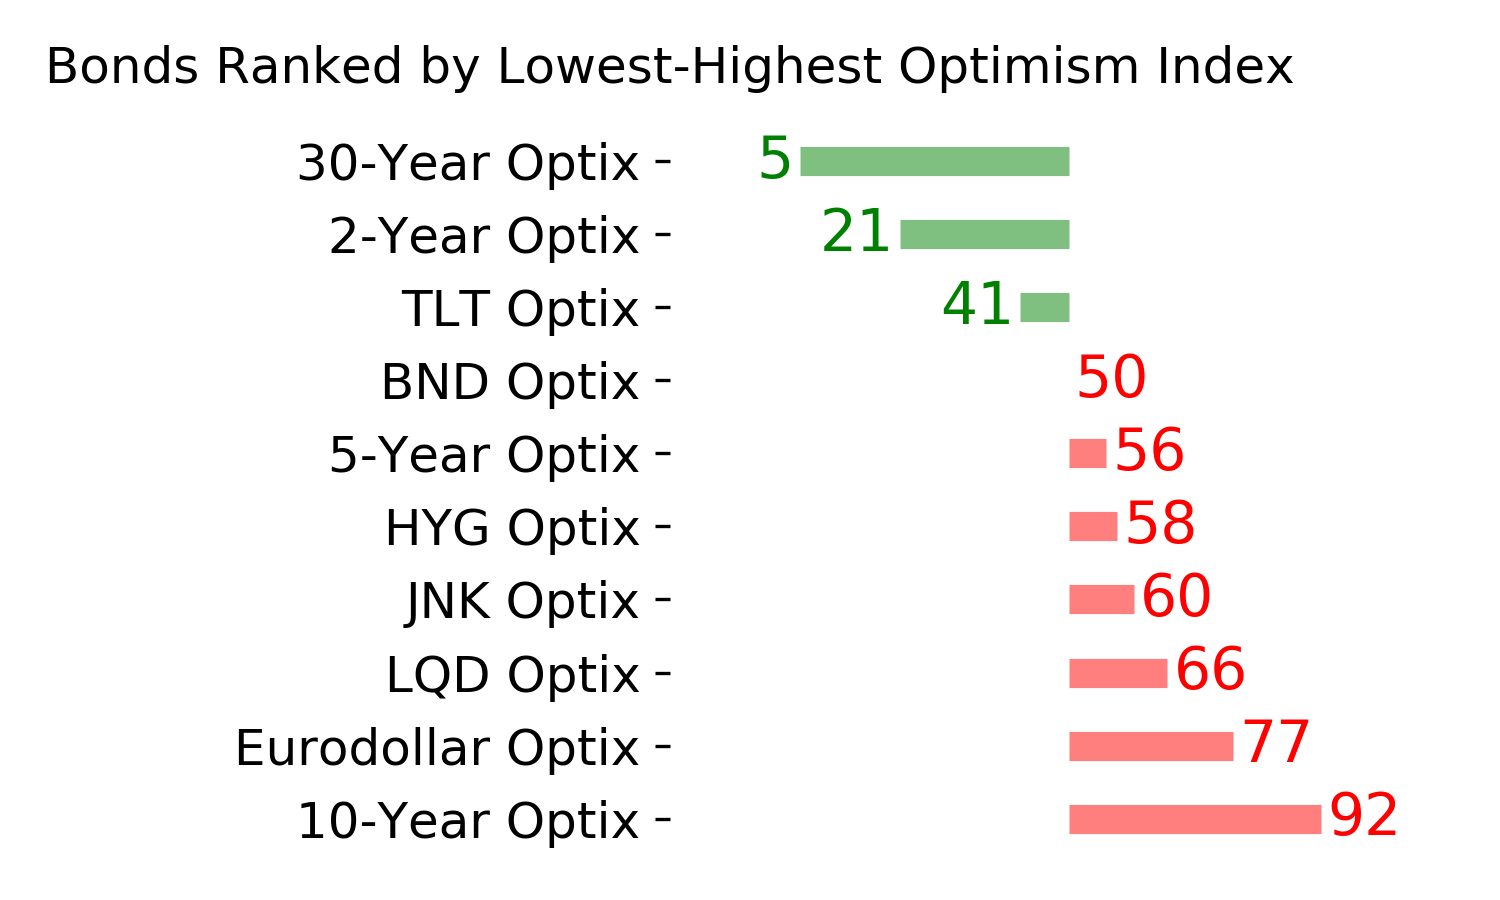
Ranks
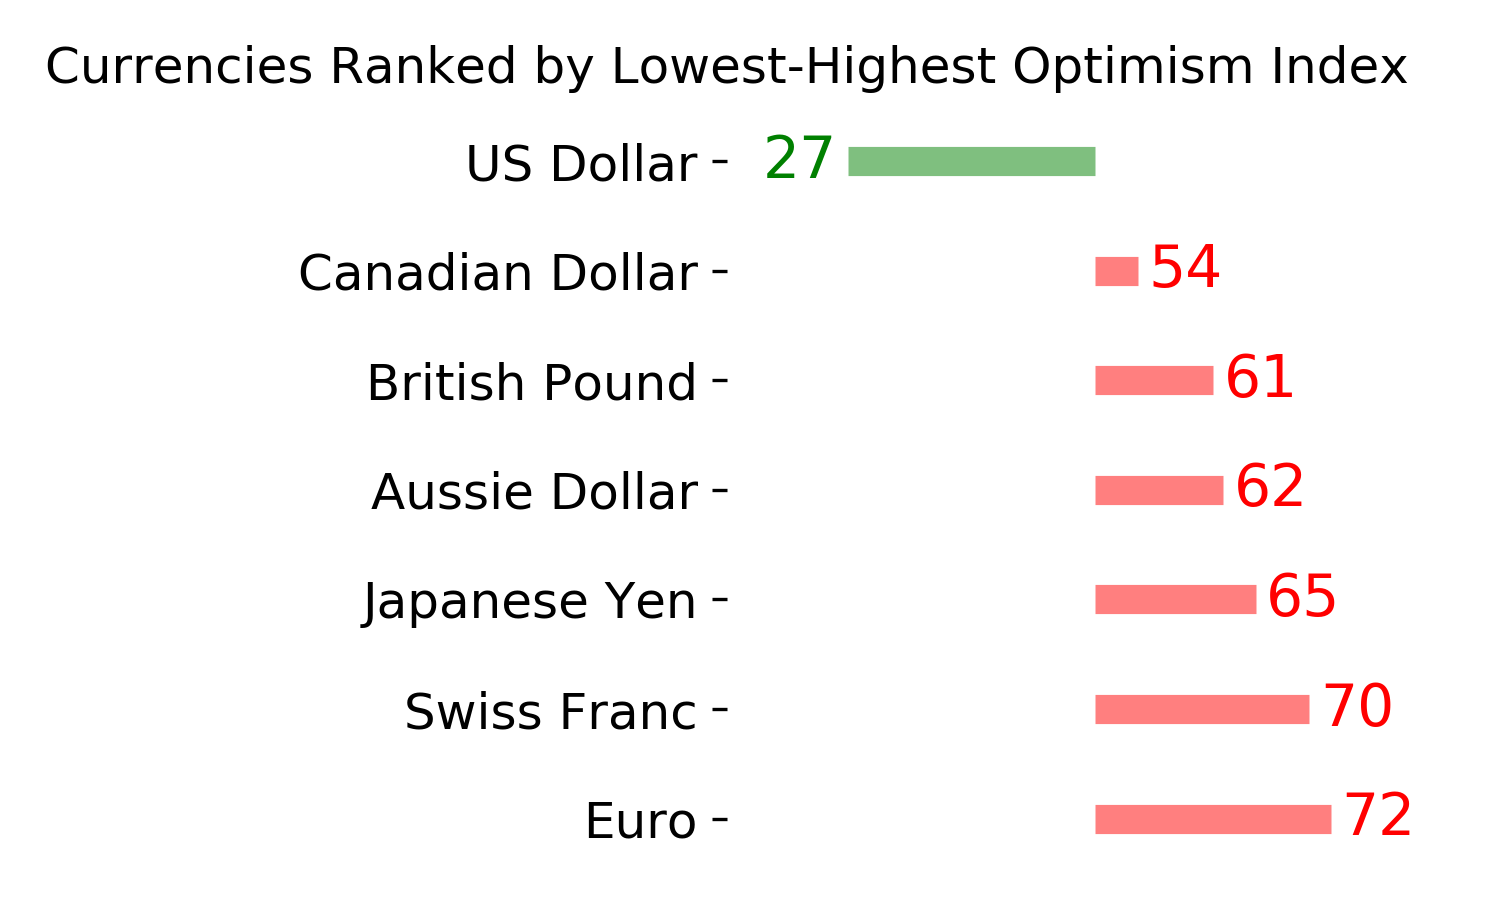
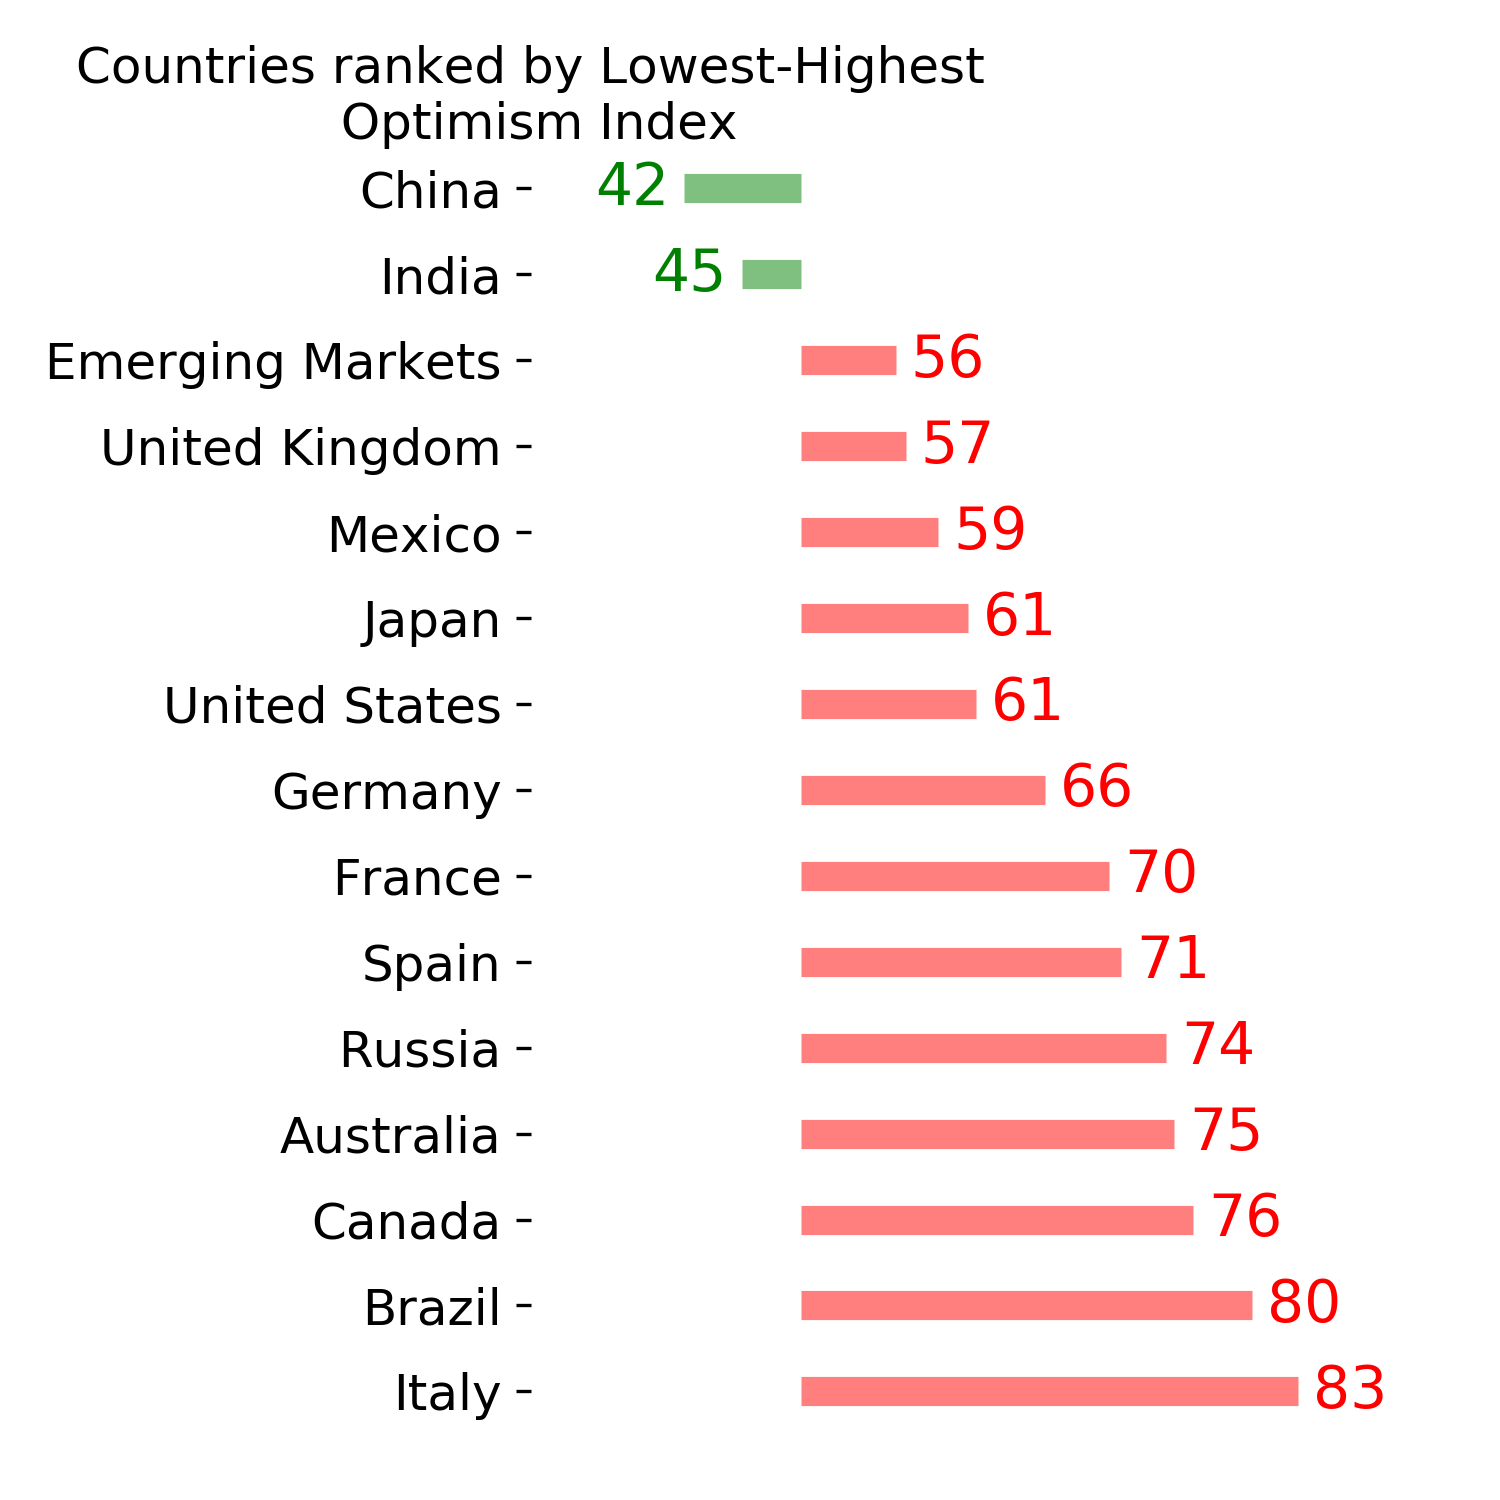
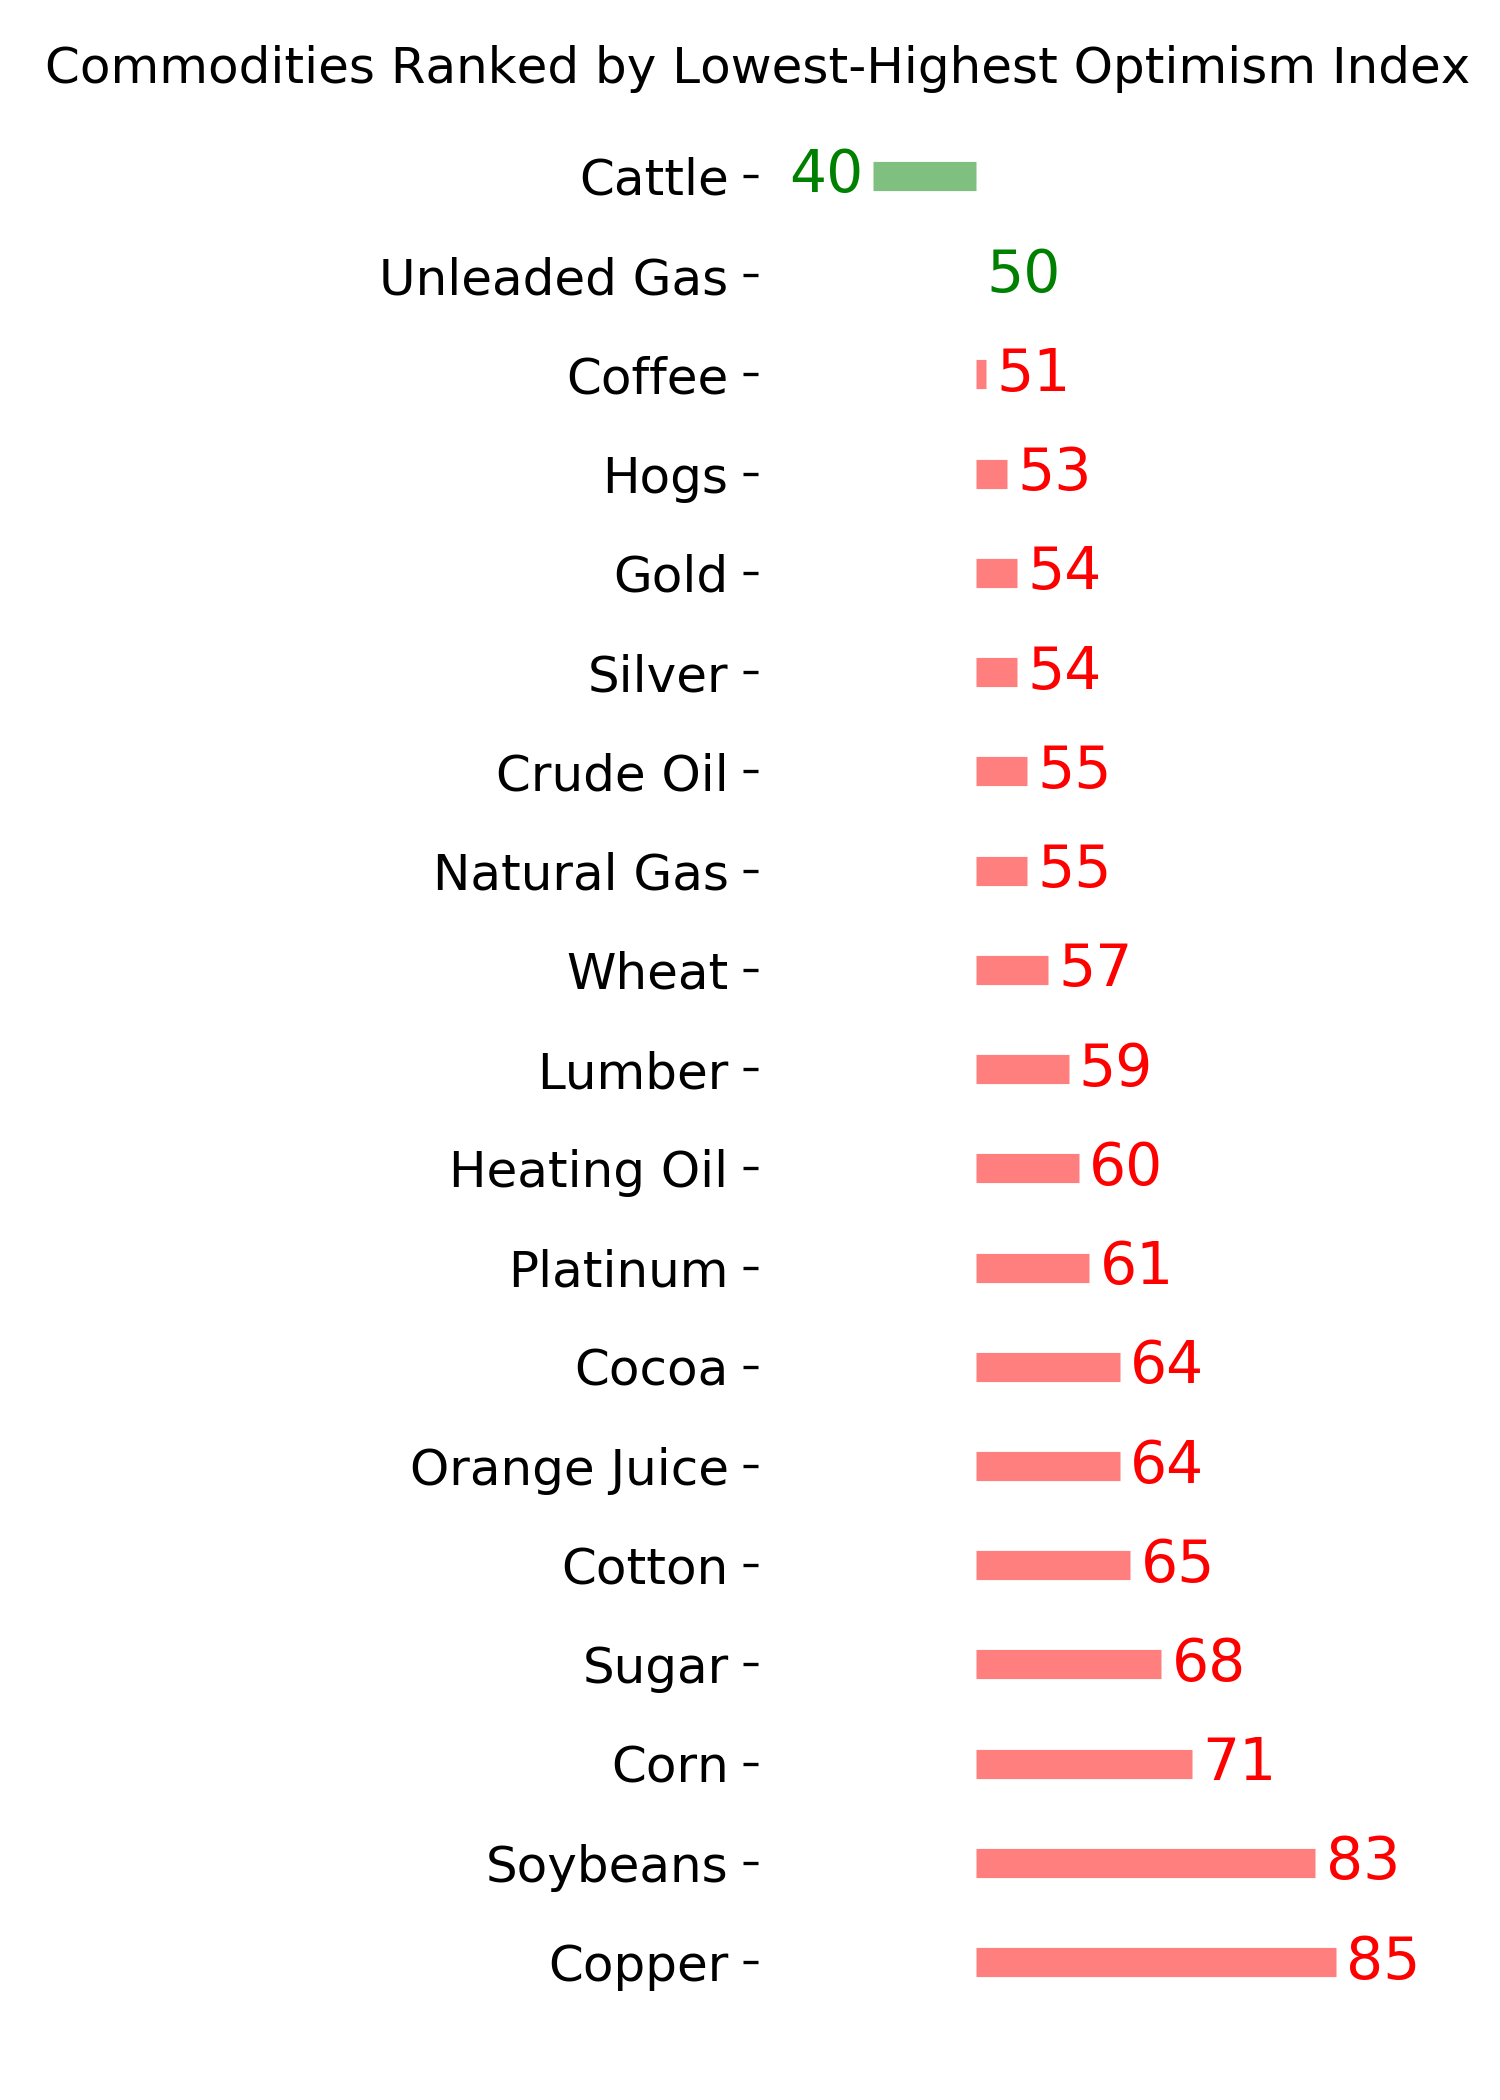
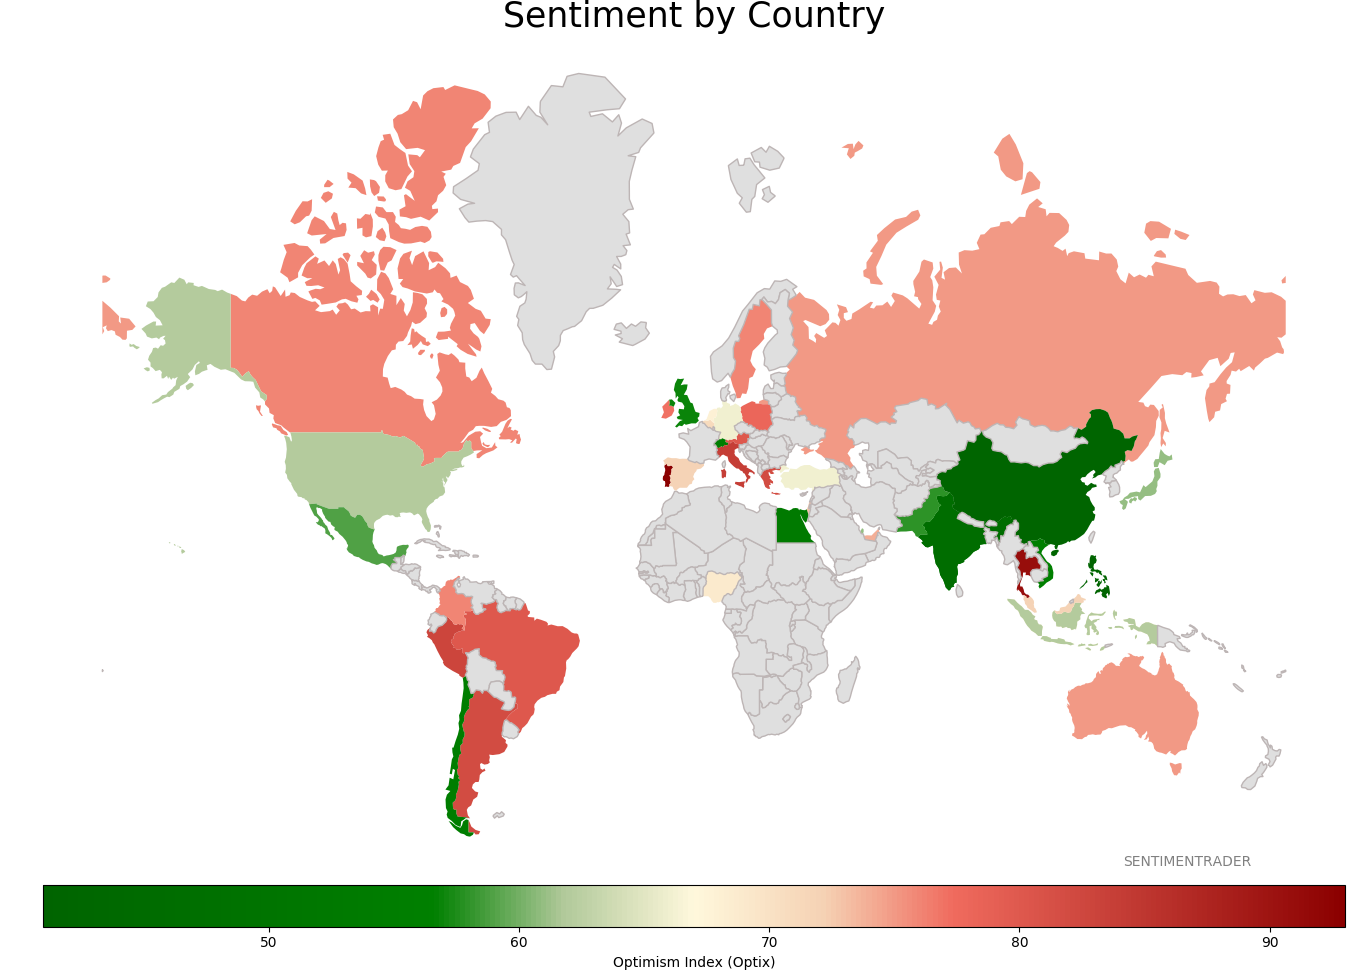
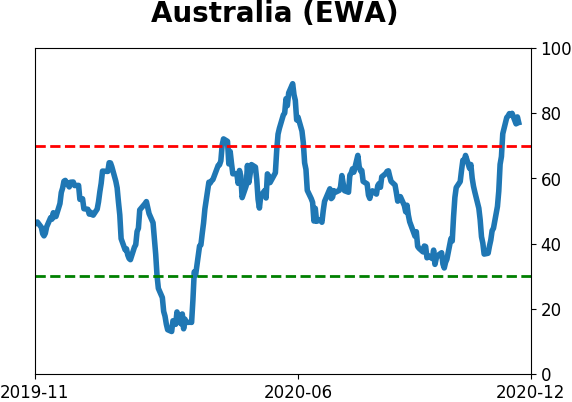
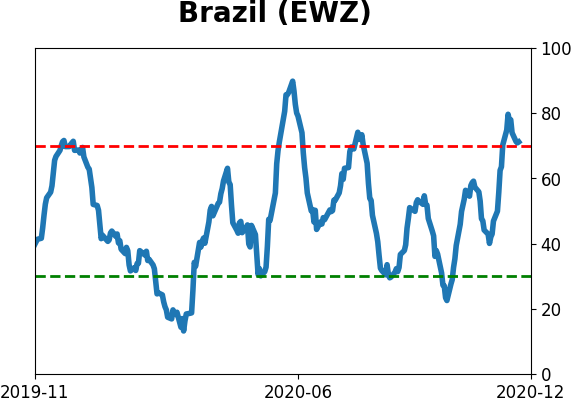
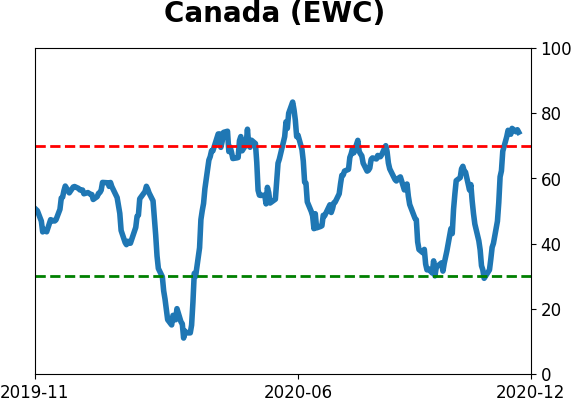
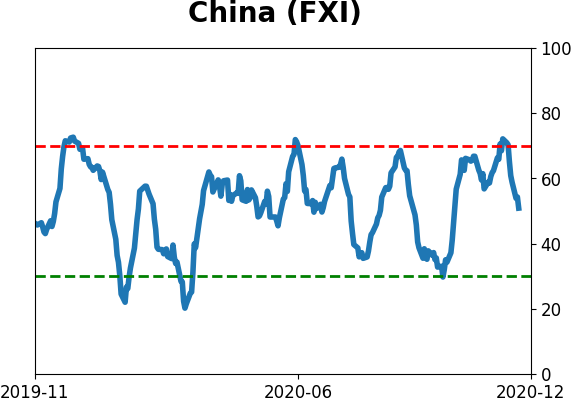
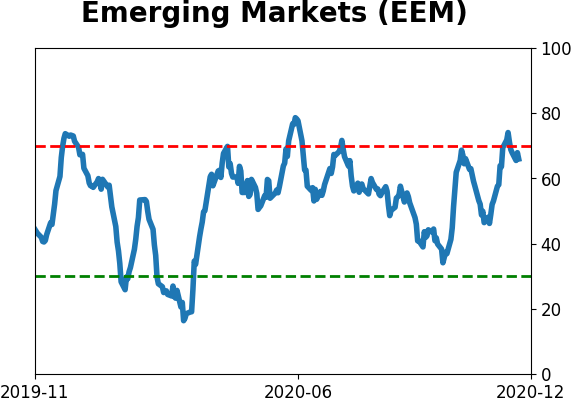
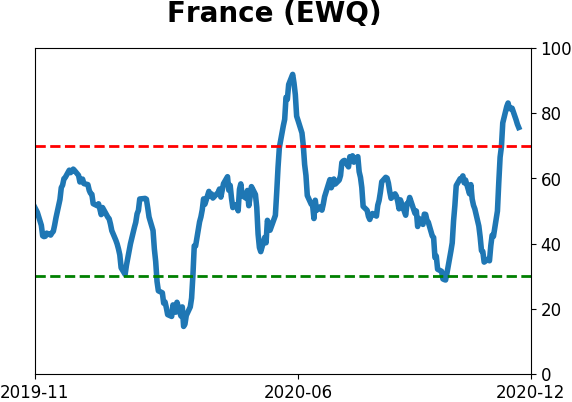
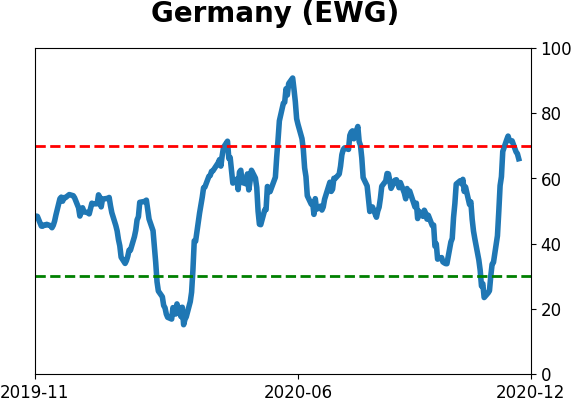
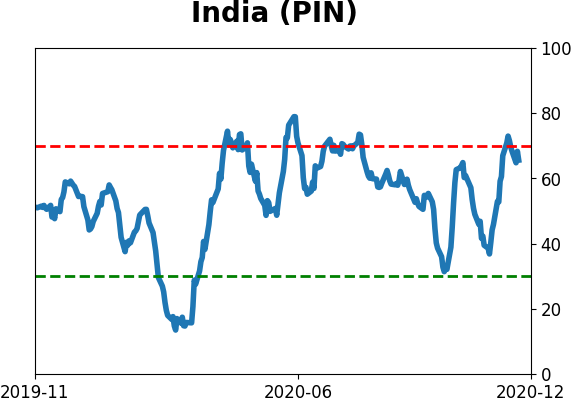
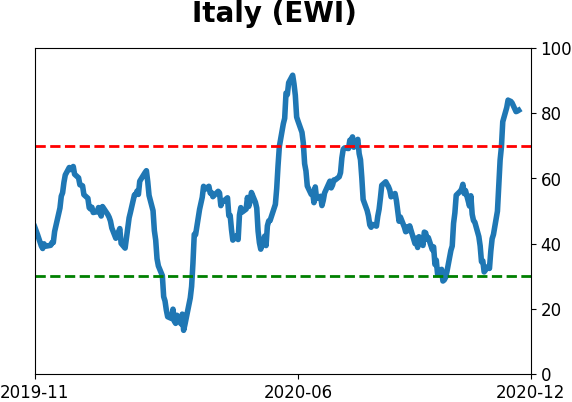
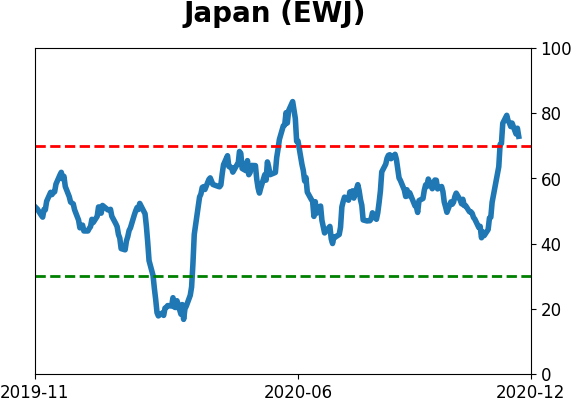
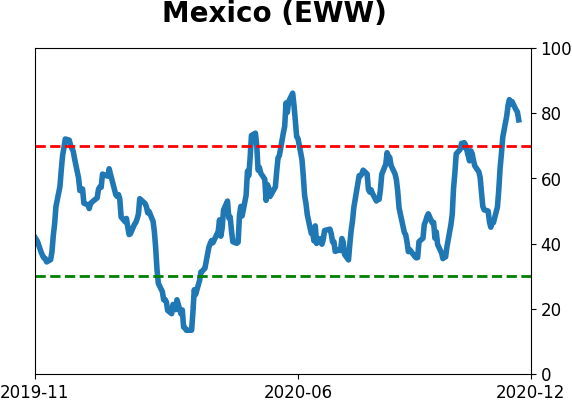
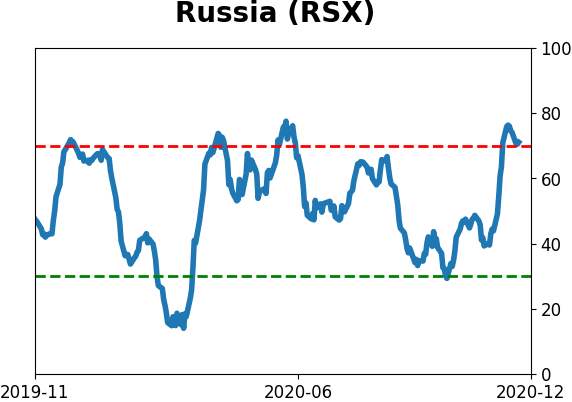
Sentiment Around The World
Optimism Index Thumbnails
|
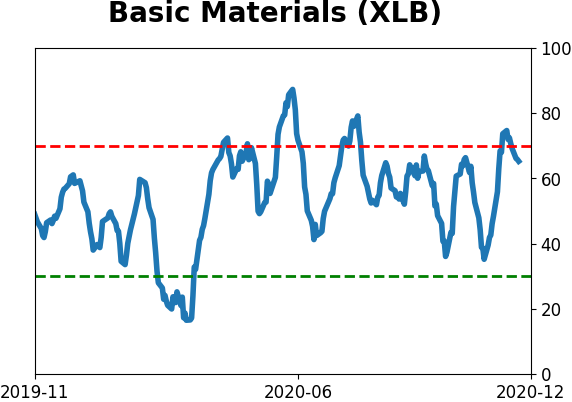
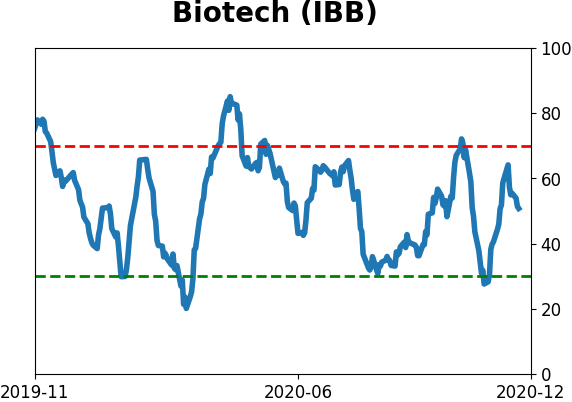
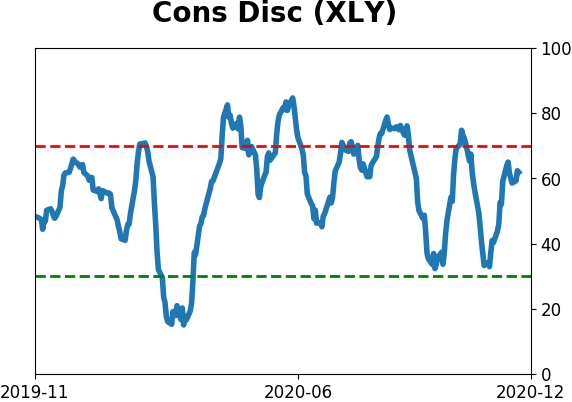
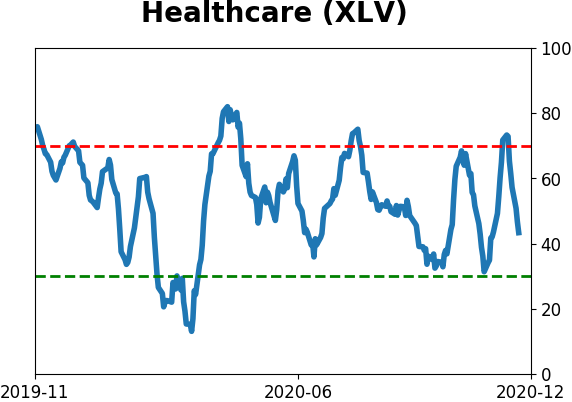
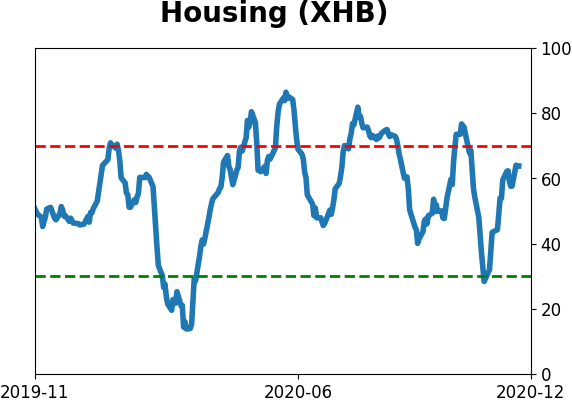
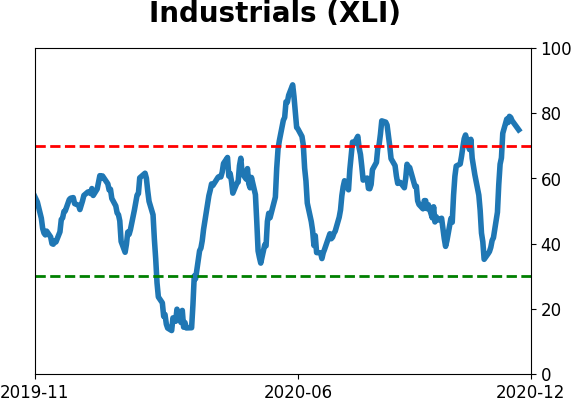
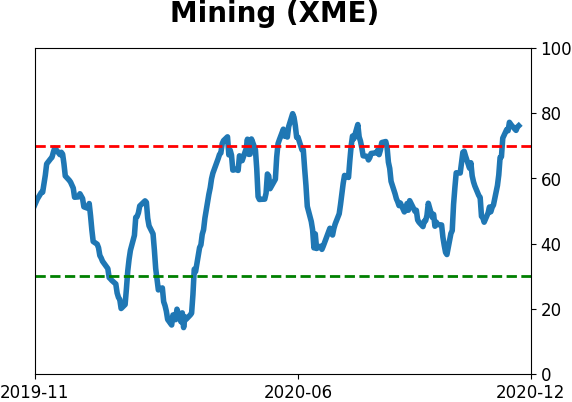
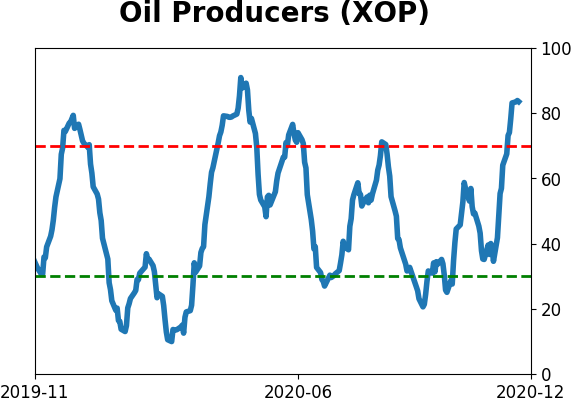
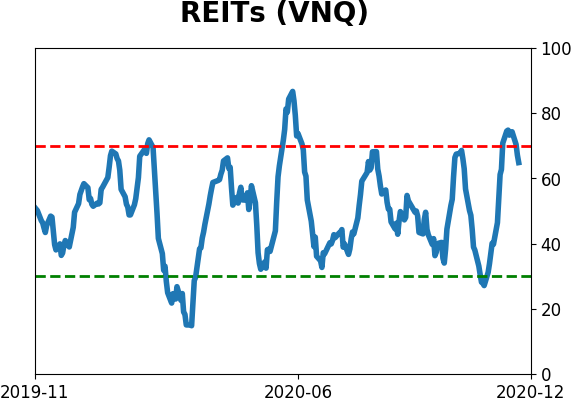
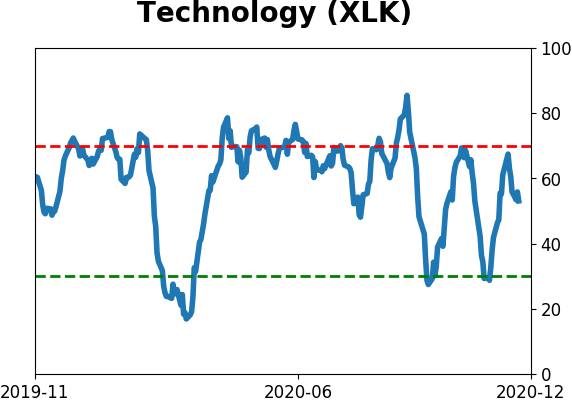
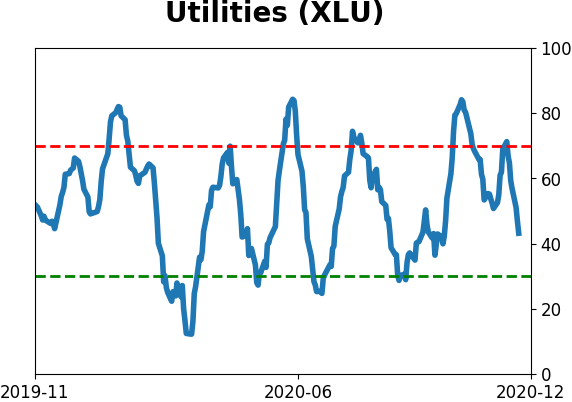
Sector ETF's - 10-Day Moving Average
|
|
|
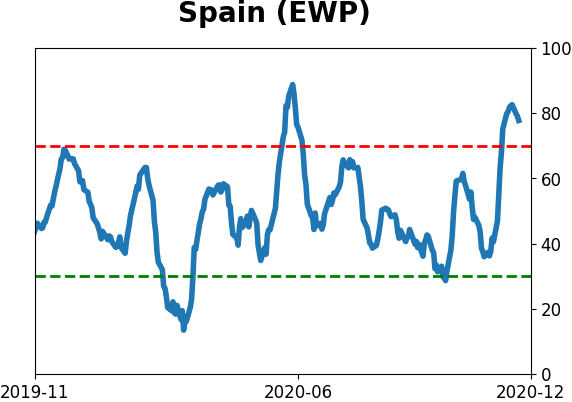
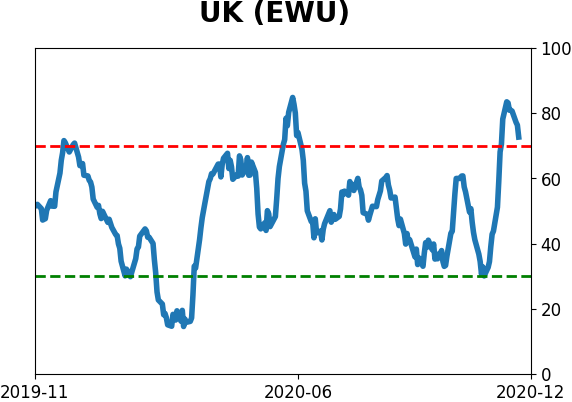
Country ETF's - 10-Day Moving Average
|
|
|
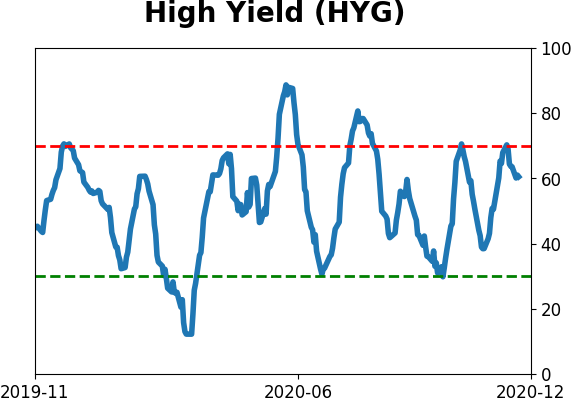
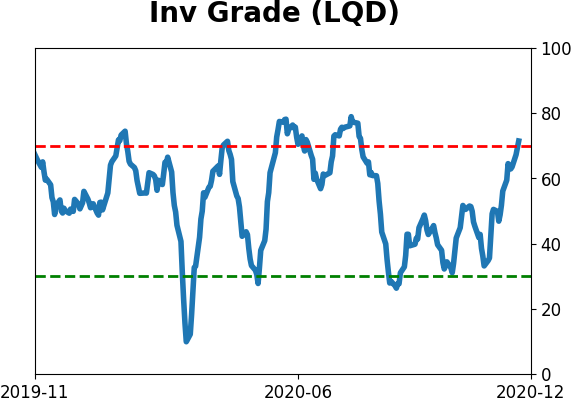
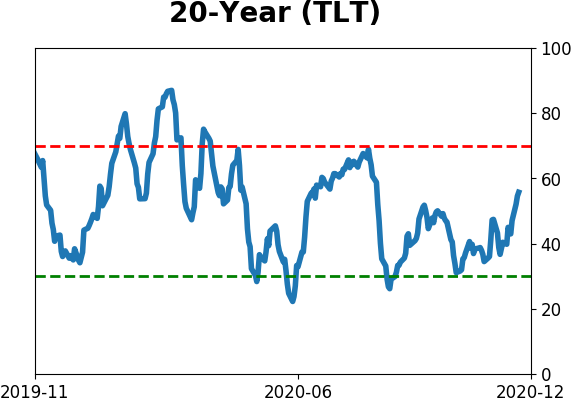
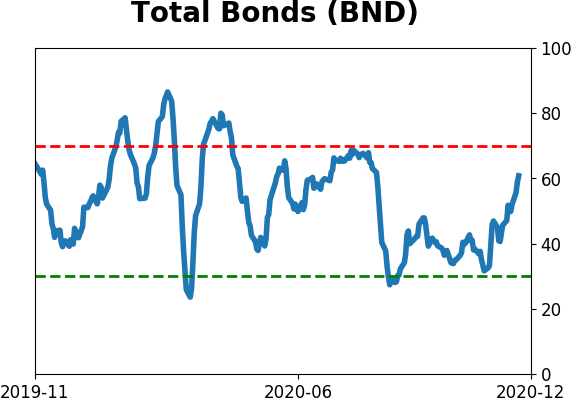
Bond ETF's - 10-Day Moving Average
|
|
|
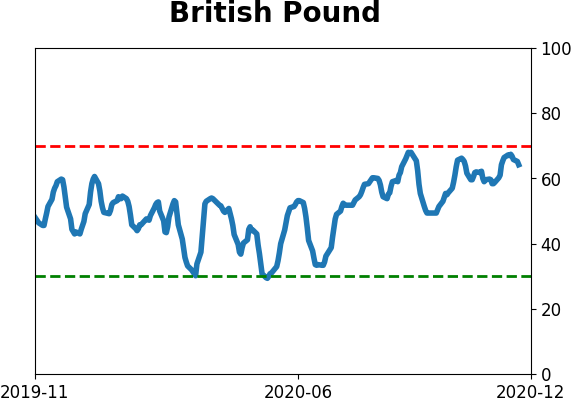
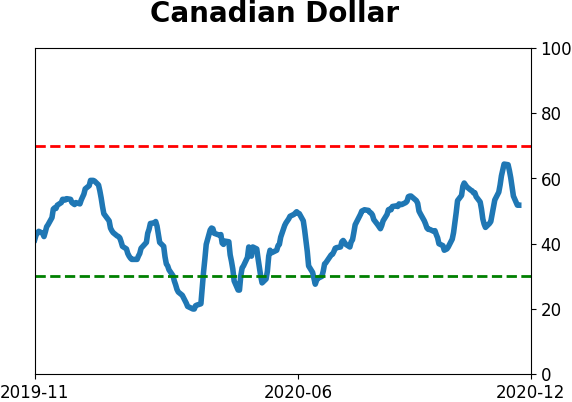
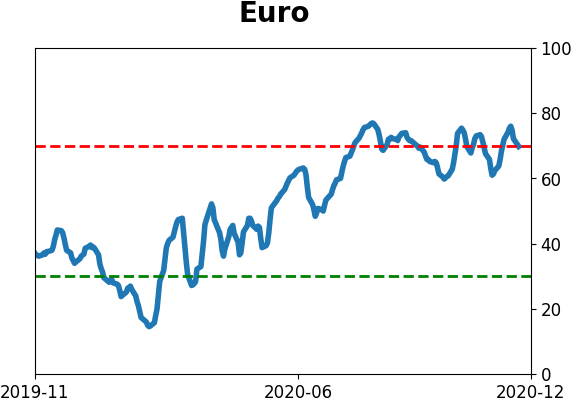
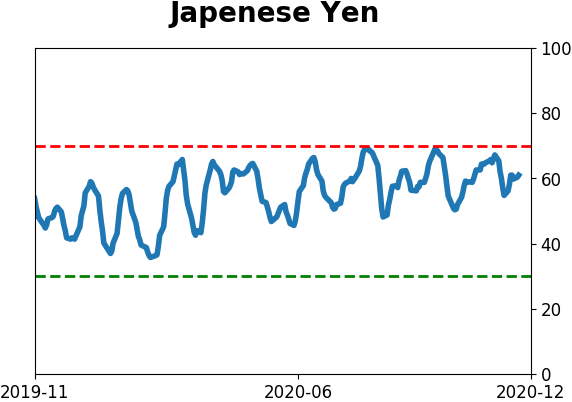
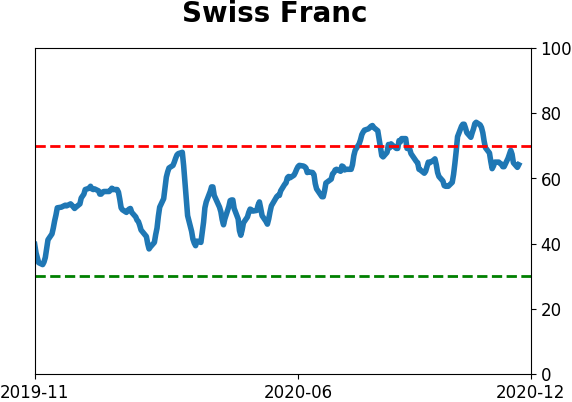
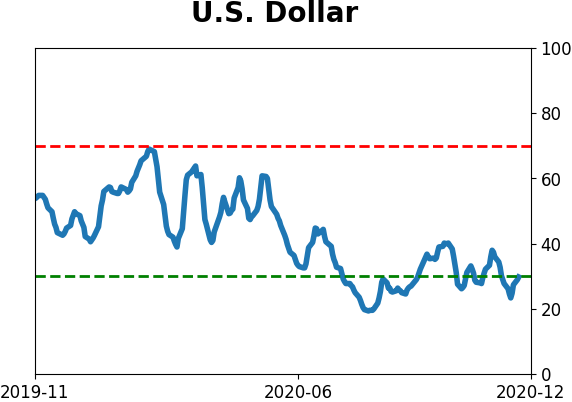
Currency ETF's - 5-Day Moving Average
|
|
|
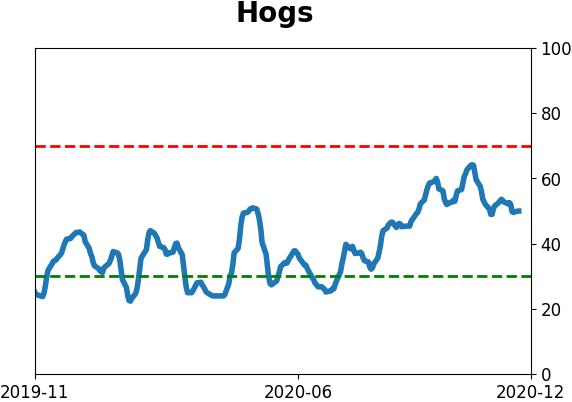
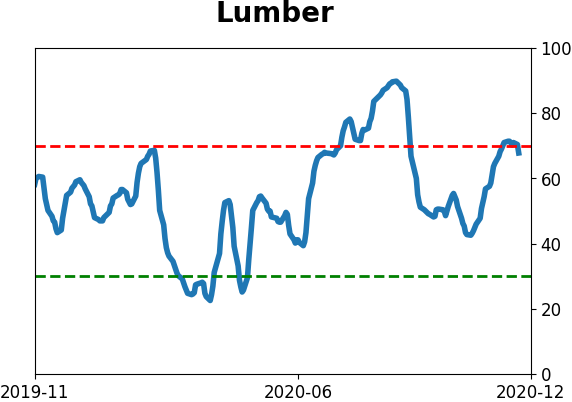
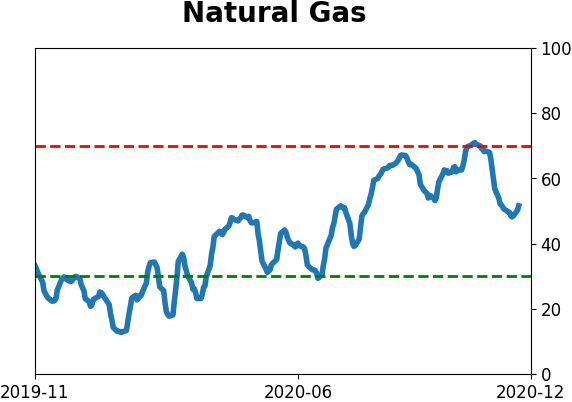
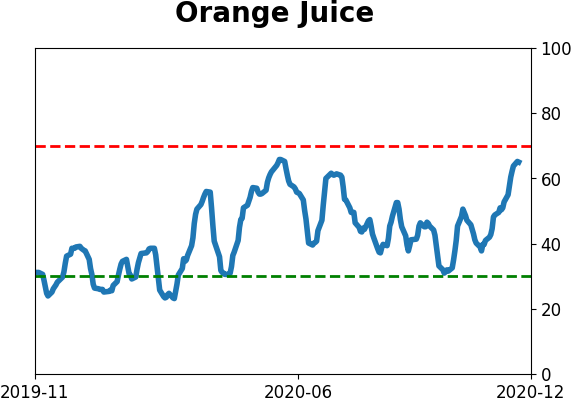
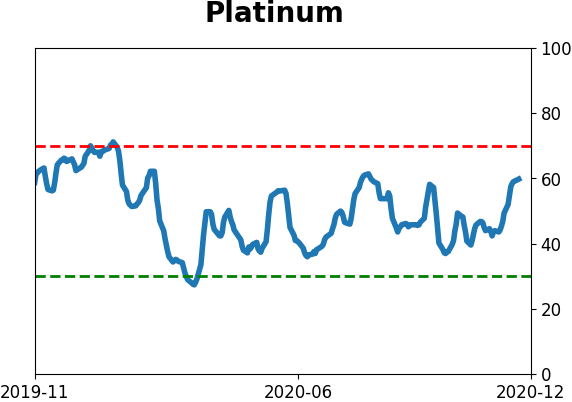
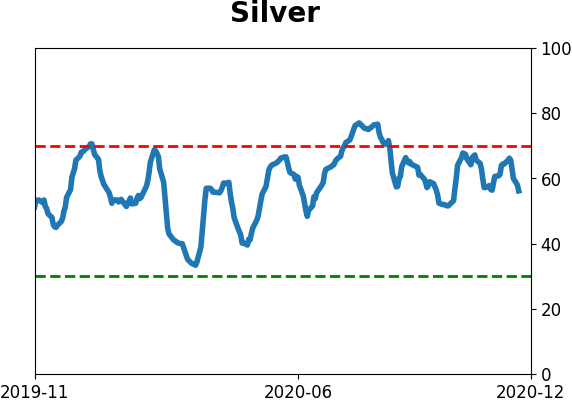
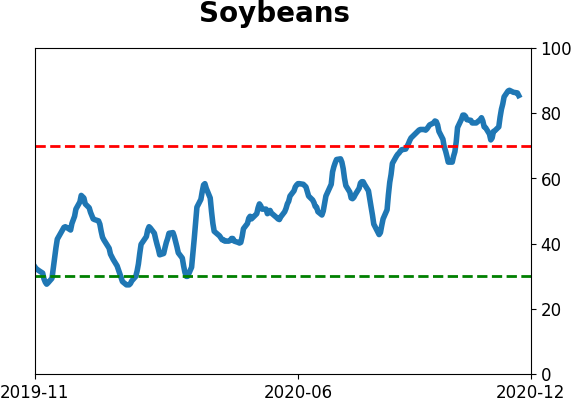
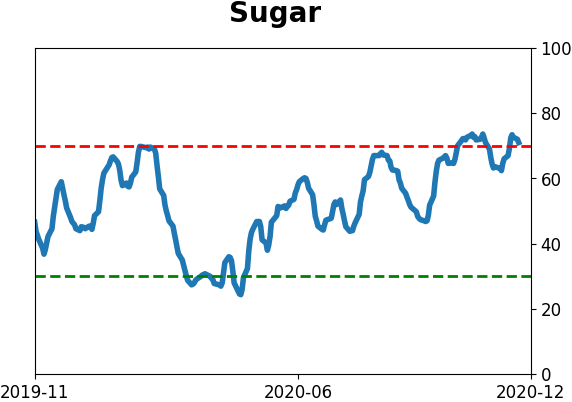
Commodity ETF's - 5-Day Moving Average
|
|