Headlines
|
|
ETF traders leave gold, pushing miners into bear markets:
The amount of gold held by ETF traders has dropped more than 1.5% from the October peak, leading to fears they will leave the market and pressure gold prices lower. At the same time, more than 95% of gold mining stocks have moved into correction and more than 75% into a bear market.
AIM Model:
The AIM Model of sentiment surveys is showing extreme optimism for the first time in more than 9 months. After a prolonged bout of "not optimism" we've usually seen buyers continue to push over the short-term, but with some soft spots over a medium-term time frame.
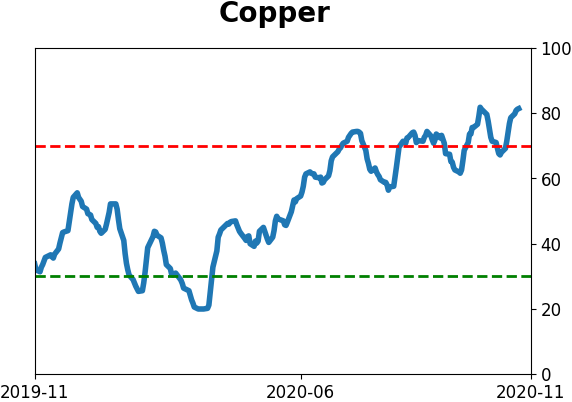
The latest Commitments of Traders report was released, covering positions through Tuesday: The 3-Year Min/Max Screen shows that "smart money" commercial hedgers established new multi-year short exposure to copper, further pushing their commodity exposure to a record low. In copper, hedgers are now holding more than 30% of the open interest net short, the most since 2005. Prior to then, it didn't work as well as a contrary indicator. Since then, the Backtest Engine shows that whenever they held more than 25% net short, copper copped out and retreated in the weeks ahead. In stocks, hedgers reduced their shorts further. It's highly unusual to see this during a rallying market, but then again their behavior was odd for much of June - September. It's possible that something has changed in this data compared to the past decade, perhaps the sustained and record-breaking option volume. Other markets showed mostly modest changes, usually in slight reversals to recent trends.
Bottom Line:
- The market environment is pristine, but with near-historic optimism, gains tend to be muted, with a high probability of being reversed at some point over the ensuing weeks.
|
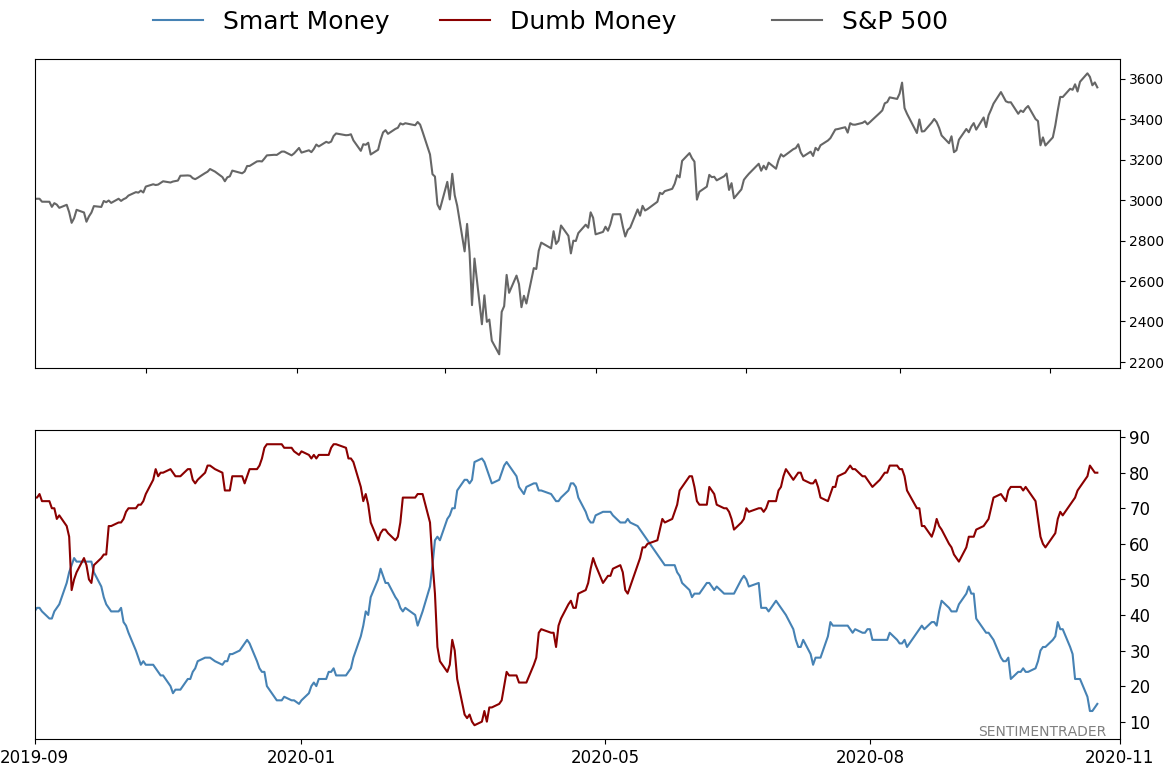
Smart / Dumb Money Confidence
|
Smart Money Confidence: 15%
Dumb Money Confidence: 80%
|
|
Risk Levels
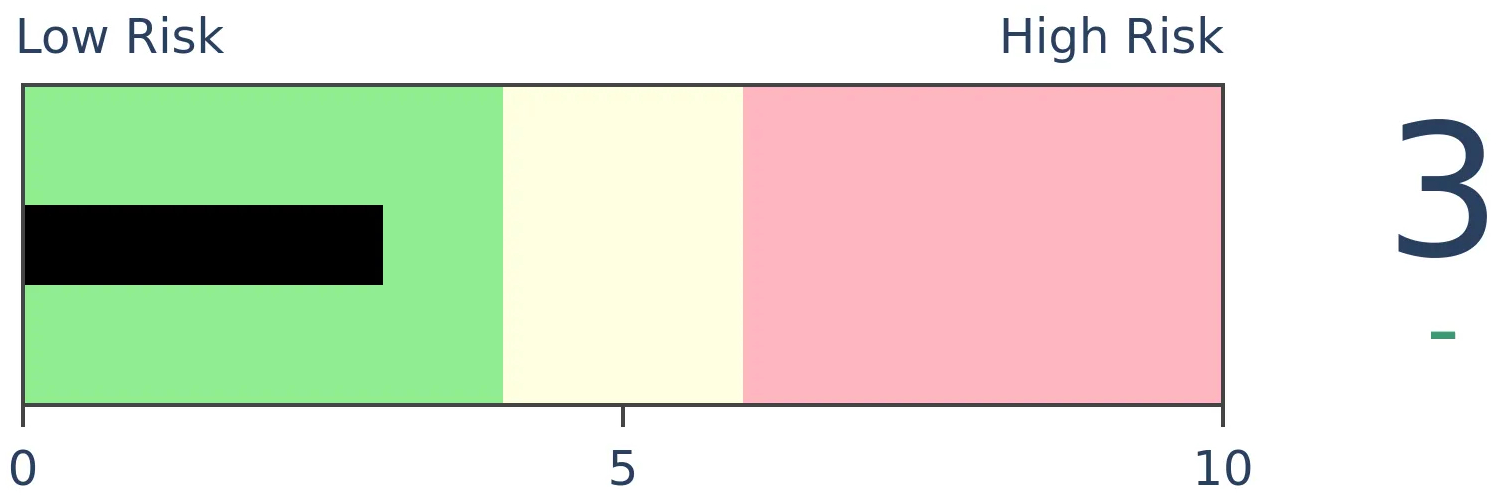
Stocks Short-Term
|
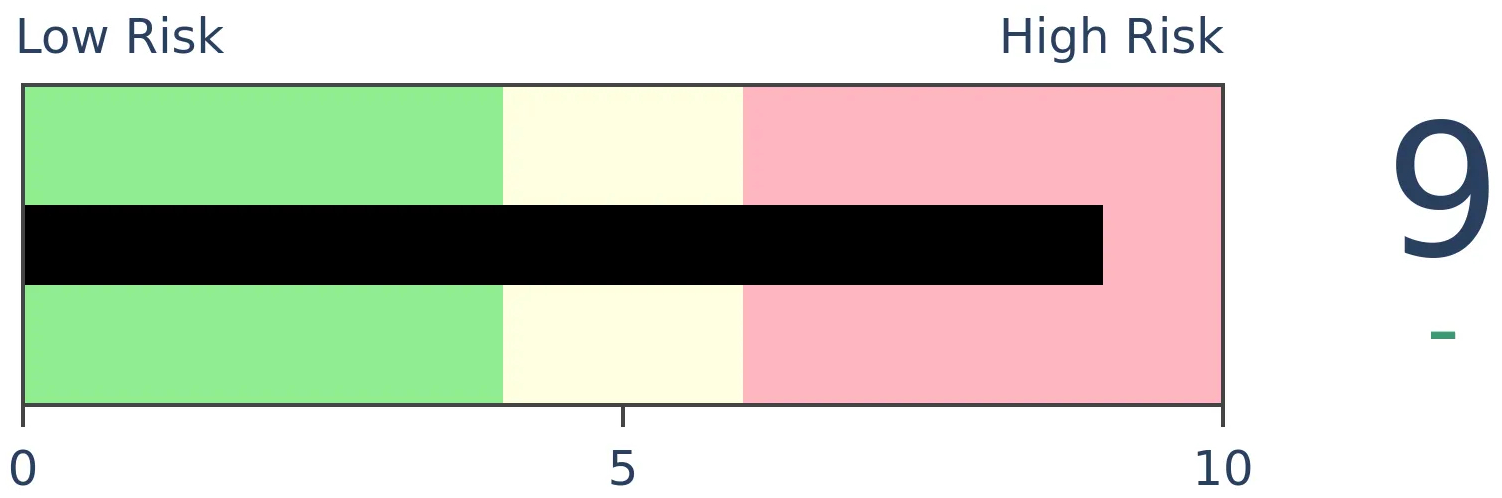
Stocks Medium-Term

|
|
Bonds
|
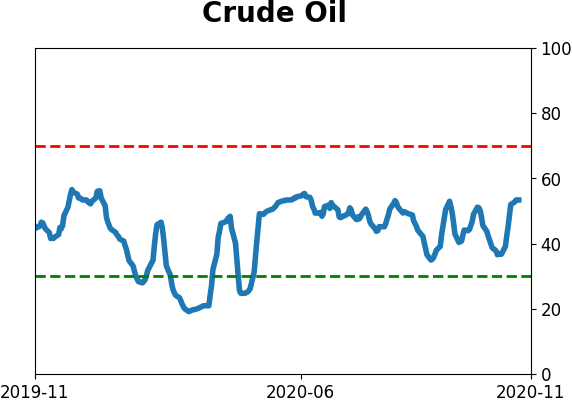
Crude Oil

|
|
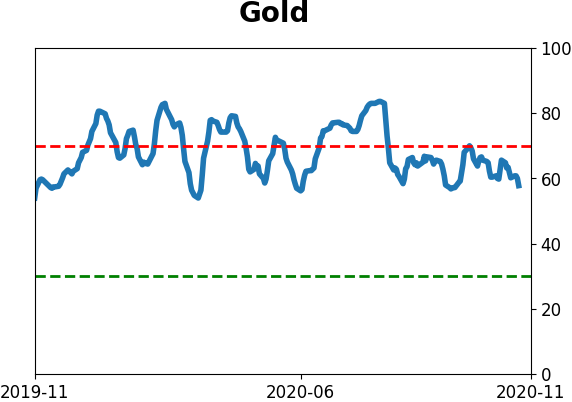
Gold
|
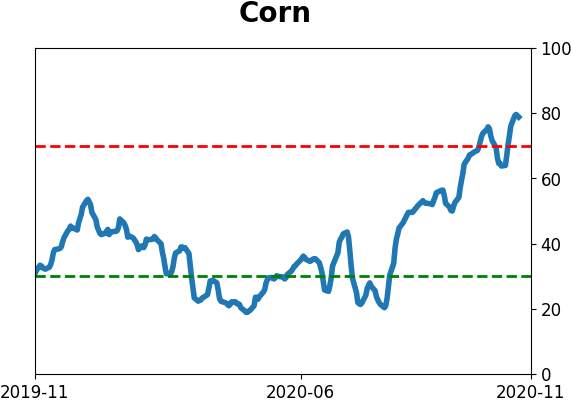
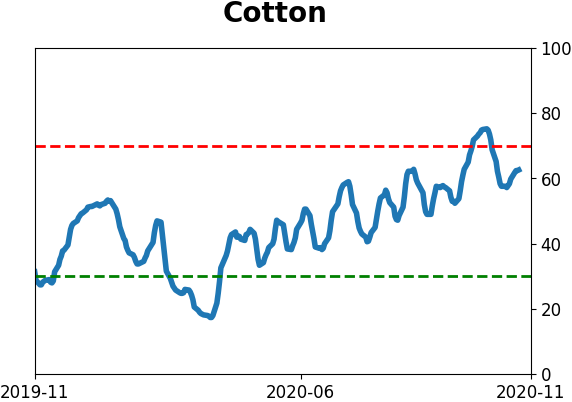
Agriculture
|
|
Research
BOTTOM LINE
The amount of gold held by ETF traders has dropped more than 1.5% from the October peak, leading to fears they will leave the market and pressure gold prices lower. At the same time, more than 95% of gold mining stocks have moved into correction and more than 75% into a bear market.
FORECAST / TIMEFRAME
None
|
Gold has been struggling as stocks soar, and ETF traders have decided that they're not going to stick around.
According to Bloomberg calculations, the total number of ounces known to be held by ETFs has declined by 2 million ounces since it peaked in October. The worry is that ETF traders are one of the main factors driving the price of gold, and if they leave en masse, then it will push gold prices lower like it did in 2016.
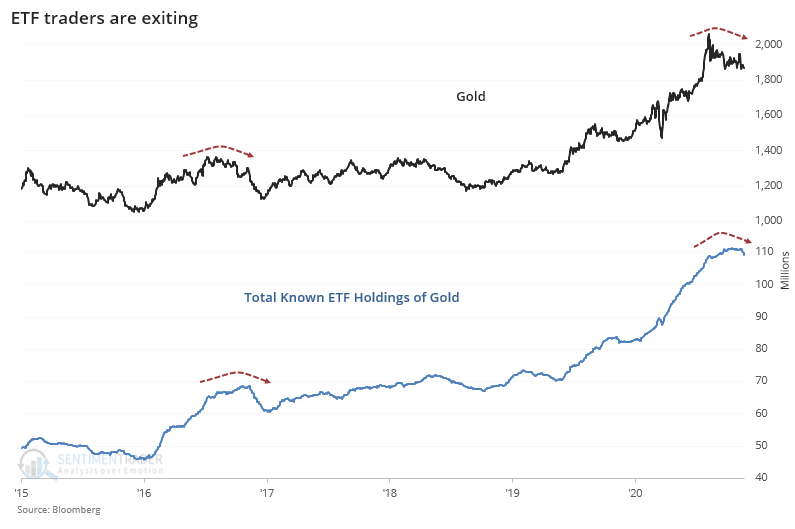
That worry is a bit premature. So far, gold ETF holdings have only declined by a little more than 1.5% from their peak. We don't know yet if it will turn into a flood; all we know right now that it's a trickle, and there have been plenty of trickles over the past 7 years.
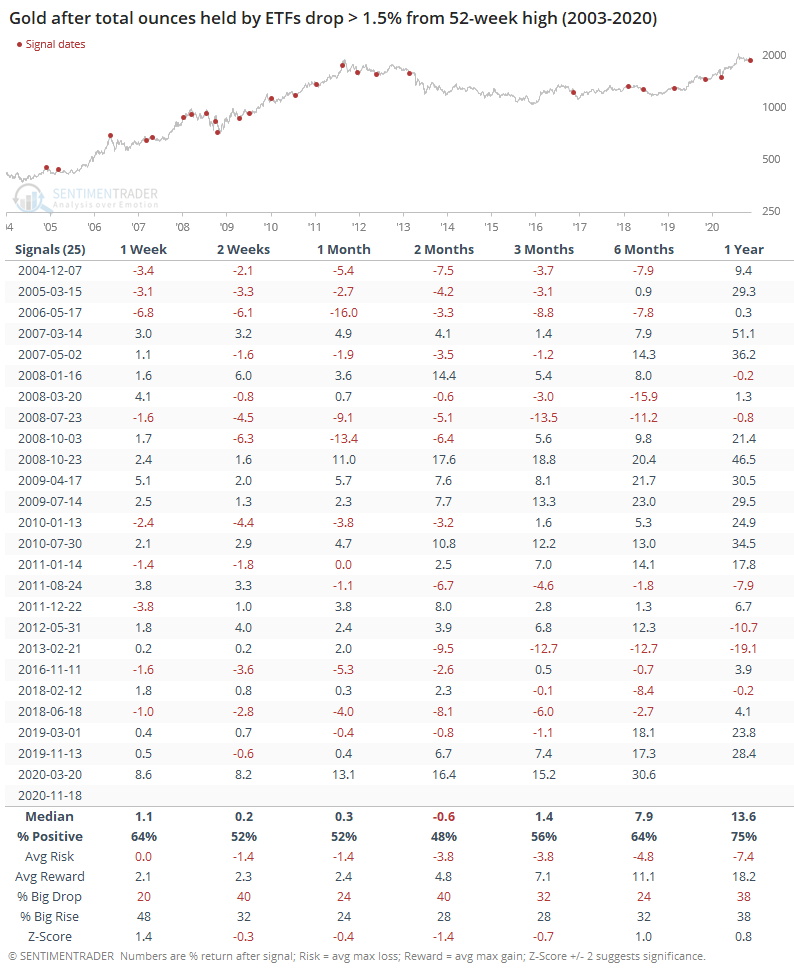
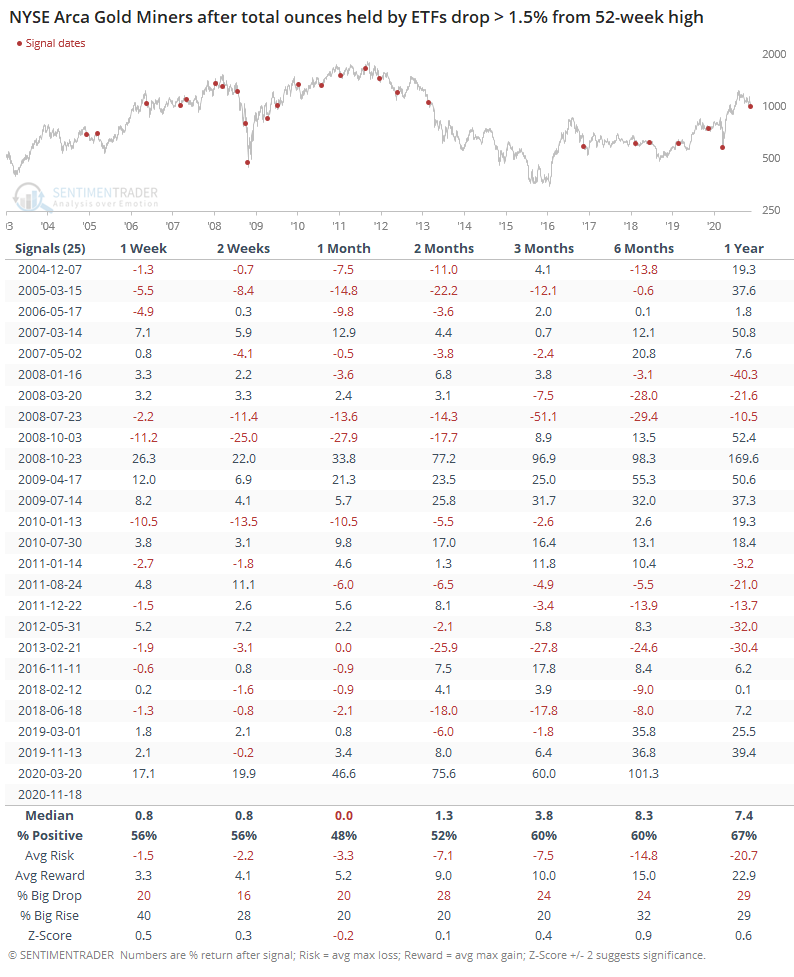
The other times gold holdings dropped by 1.5% from a 52-week high, gold did tend to struggle over the next 2 months, with a poor average return, win rate, and risk/reward skew. But after that, returns were quite good.
Because gold mining stocks tend to correlate highly with the price of gold, miners also showed weak returns but the time frame was pushed up a bit. Despite the poor overall trend in this group, forward returns were decent following these signals, though with a smattering of large losses.
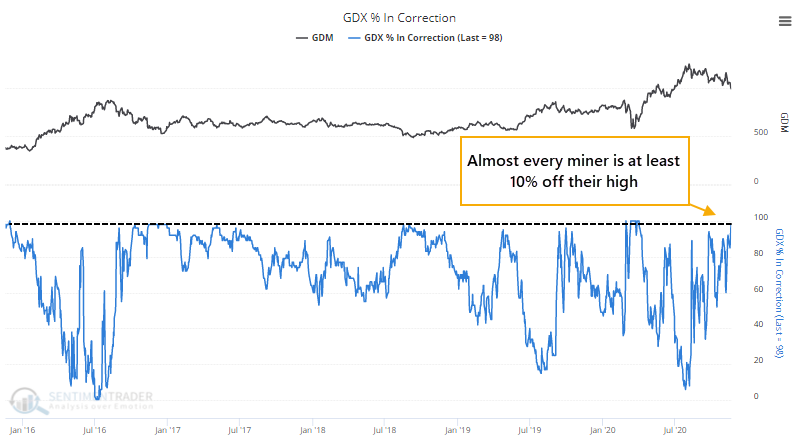
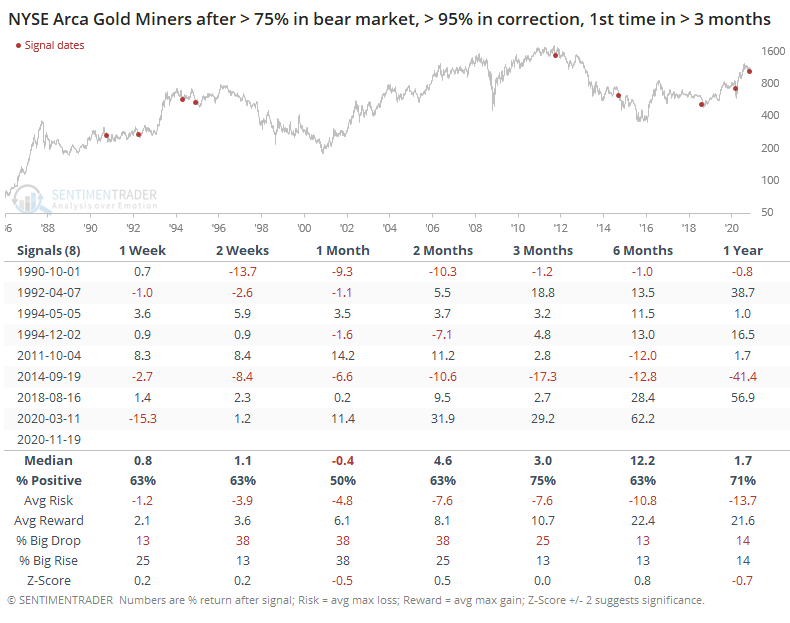
On November 11, we saw that gold mining stocks were starting to crack, with the fewest uptrends in months. As they've sold off even further, more than 95% of gold mining stocks are now down at least 10% from their highs.
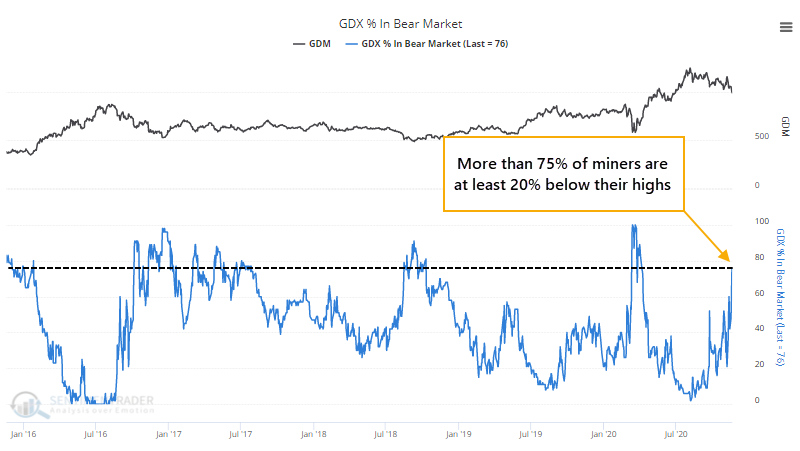
Even more notably, more than 75% of them are at least 20% off their highs.
This ends a streak of more than 6 months with fewer than 95% miners in corrections and fewer than 75% in bear markets.
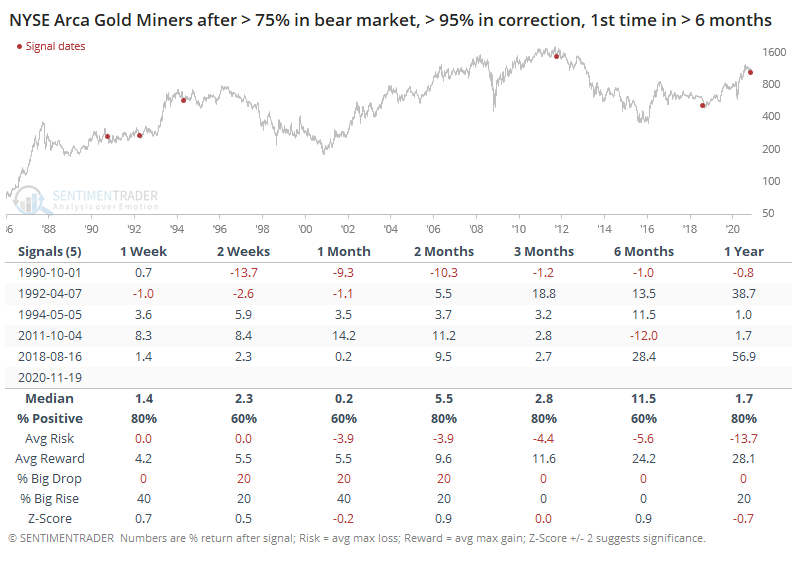
After the other streaks ended, only one ended up leading to a big drop right away, and that one saw the losses made up in the months ahead. The signal in 2011 did end up morphing into a new bear market, but not before miners jumped double-digits in the interim.
If we relax the parameters to get a larger sample, then it didn't help too much as it only added 3 signals, 2 winners and a loser.
If ETF traders do decide to exit the market, then it seems clear that it will be a drag on the price of gold, and almost certainly the share prices of gold mining stocks. So far, there isn't enough evidence to suggest that they're likely to do so. And when gold mining stocks see the ends of this kind of momentum, they've typically been able to recover.
BOTTOM LINE
The AIM Model of sentiment surveys is showing extreme optimism for the first time in more than 9 months. After a prolonged bout of "not optimism" we've usually seen buyers continue to push over the short-term, but with some soft spots over a medium-term time frame.
FORECAST / TIMEFRAME
None
|
For the first time in 9 months, surveys of investor attitudes are broadly showing evidence of optimism.
We've already seen that in mom-and-pop surveys like the one from AAII. While it's a favorite of knee-jerk contrarians, in practice it hasn't worked out so well that way.
That was one of the few holdout surveys to show persistent pessimism in the face of rising prices. Now, most surveys are showing more or less the same thing, pushing our AIM Model above 80%.
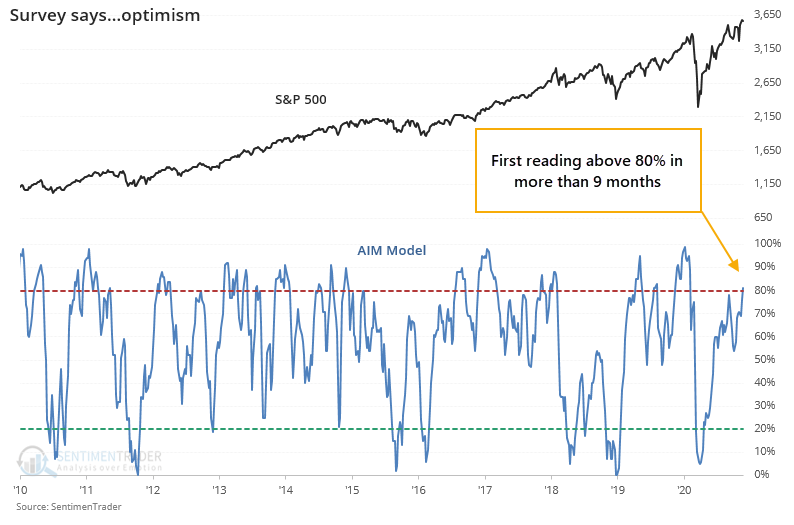
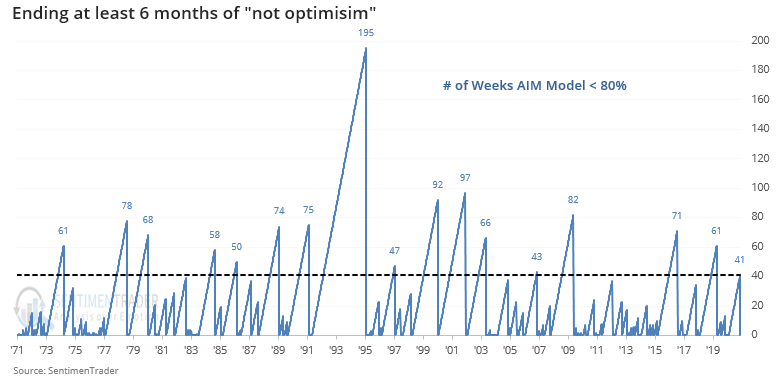
This ends a streak of 41 weeks, more than 9 months, with the model showing "not optimism," which is among the longest streaks since 1970.
At the same time the survey is ending a long streak without showing extreme optimism, stocks have performed very well. The table below shows every time in the past 50 years when the model finally record optimism for the first time in more than 6 months and the S&P was at least within 5% of a multi-year high at the time.
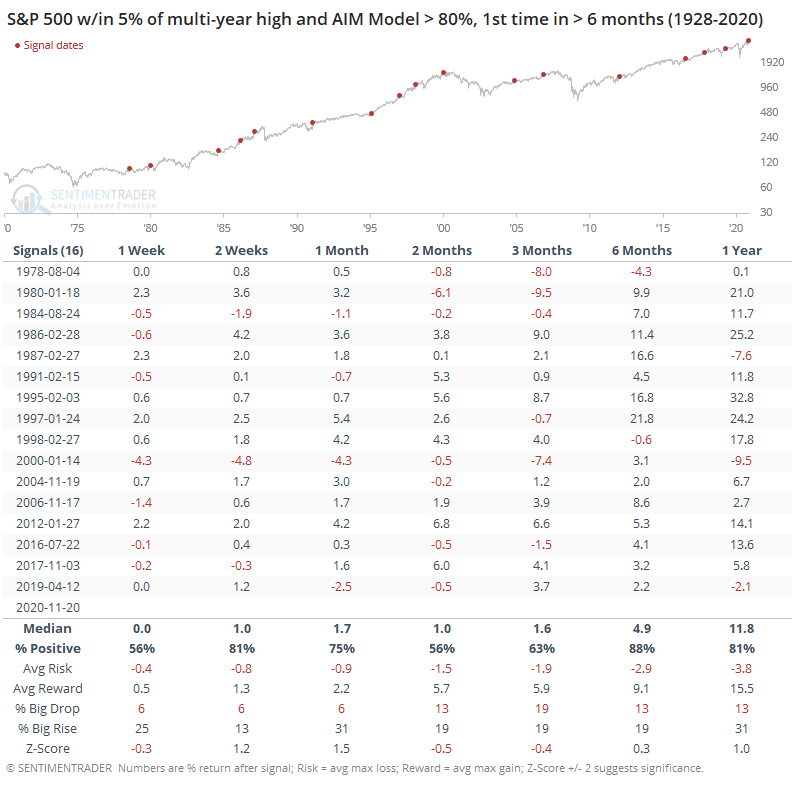
This was not a good reason to immediately turn defensive. Over the next couple of weeks, the S&P added to its gains 81% of the time. Even over the next month, the risk/reward was favorable, and with a much better probability of showing a big rise versus a big fall (see this Knowledge Base article for more detail about how to read the tables).
The biggest negative was over the next 2-3 months, when some of the initial gains got erased. We see this quite often with displays of high optimism and momentum - shorter-term returns tend to skew to the positive side as more buyers are sucked in, but then they hit a more medium-term soft spot due to simple exhaustion. Longer-term returns were consistently positive, as the soft spot allowed buying interest to build up again.
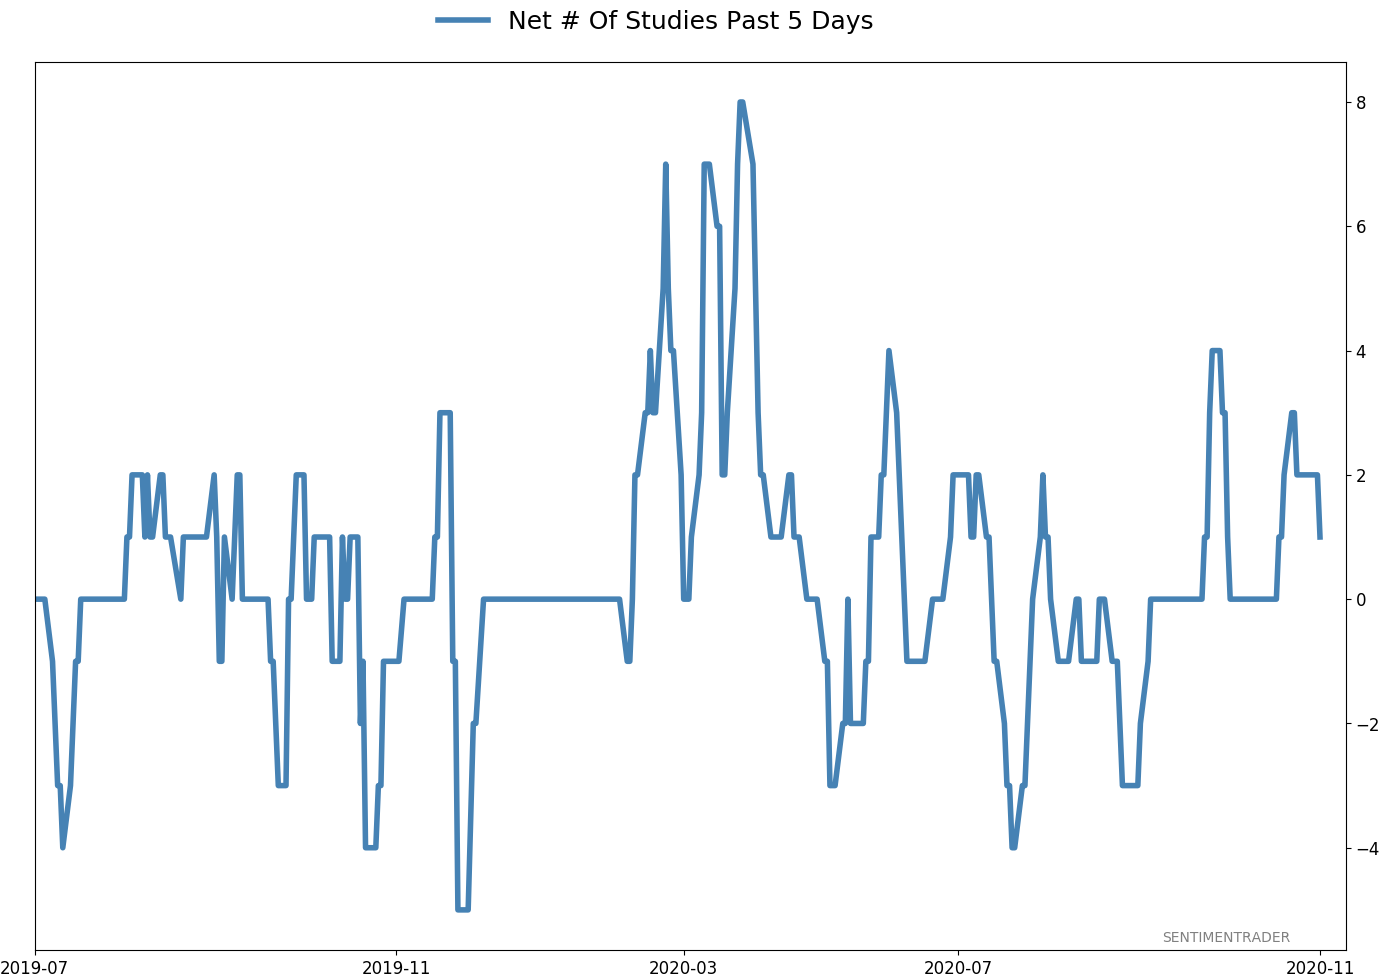
Active Studies
| Time Frame | Bullish | Bearish | | Short-Term | 0 | 0 | | Medium-Term | 5 | 8 | | Long-Term | 51 | 2 |
|
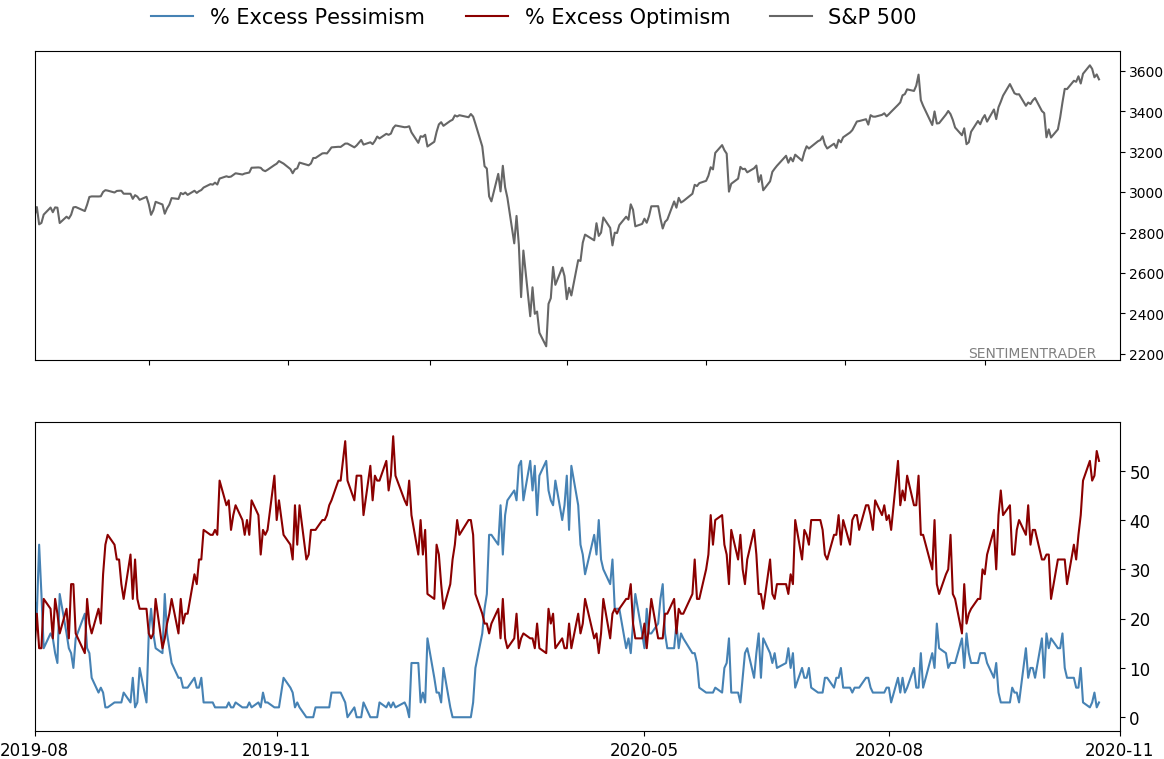
Indicators at Extremes
% Showing Pessimism: 3%
Bullish for Stocks
VIX
|
|
Portfolio
| Position | Description | Weight % | Added / Reduced | Date | | Stocks | 15.6% RSP, 10.1% VWO, 7.5% XLE, 5.1% PSCE | 38.2 | Added 5% | 2020-10-15 | | Bonds | 10% BND, 10% SCHP, 10% ANGL | 29.7 | Reduced 0.1% | 2020-10-02 | | Commodities | GCC | 2.4 | Reduced 2.1%
| 2020-09-04 | | Precious Metals | GDX | 4.7 | Added 5% | 2020-09-09 | | Special Situations | | 0.0 | Reduced 5% | 2020-10-02 | | Cash | | 25.0 | | |
|
Updates (Changes made today are underlined)
After the September swoon wrung some of the worst of the speculation out of stocks, there are some signs that it's returning, especially in the options market. It's helped to push Dumb Money Confidence above 70%. A big difference between now and August is that in August, there was a multitude of days with exceptionally odd breadth readings. Some of the biggest stocks were masking underlying weakness. Combined with heavy speculative activity, it was a dangerous setup. Now, we've seen very strong internal strength, in the broad market, as well as tech and small-cap stocks. Prior signals almost invariably led to higher prices. That's hard to square with the idea that forward returns tend to be subdued when Confidence is high, but that's less reliable during healthy market conditions, which we're seeing now (for the most part). I added some risk with small-cap energy stocks, due to an increasing number of positive signs in both small-caps and energy. This is intended as a long-term position.
RETURN YTD: 3.9% 2019: 12.6%, 2018: 0.6%, 2017: 3.8%, 2016: 17.1%, 2015: 9.2%, 2014: 14.5%, 2013: 2.2%, 2012: 10.8%, 2011: 16.5%, 2010: 15.3%, 2009: 23.9%, 2008: 16.2%, 2007: 7.8%
|
|
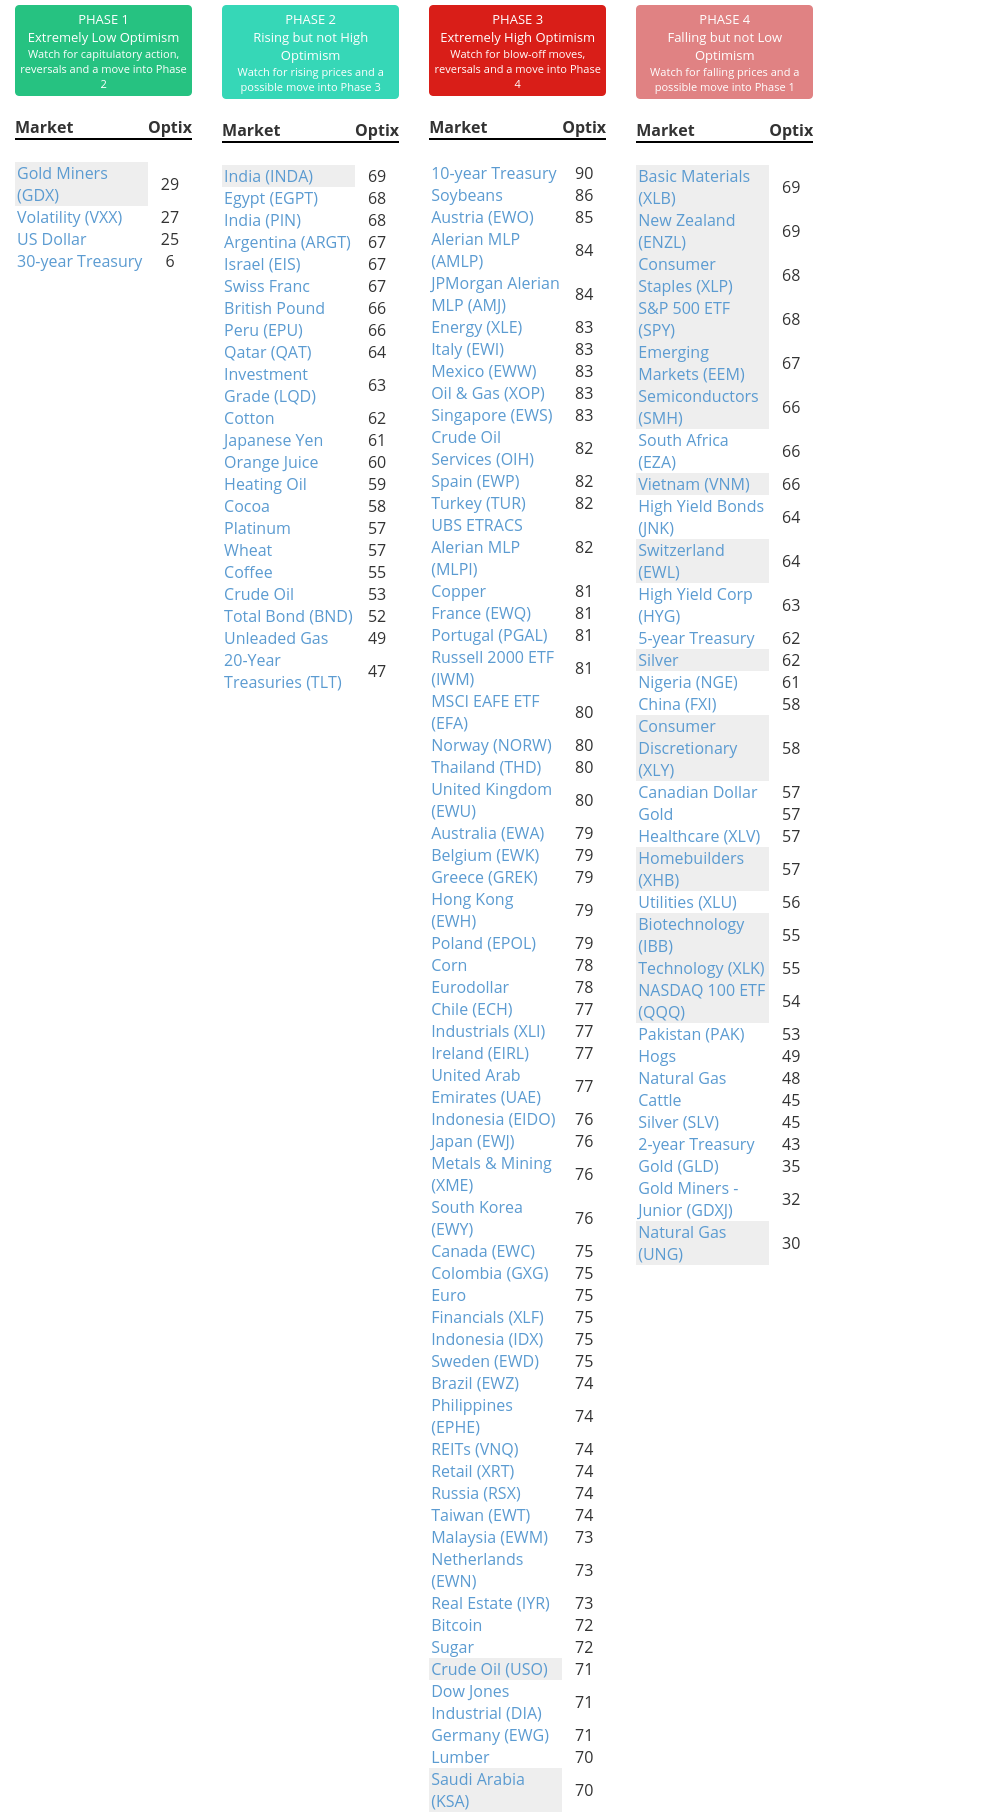
Phase Table
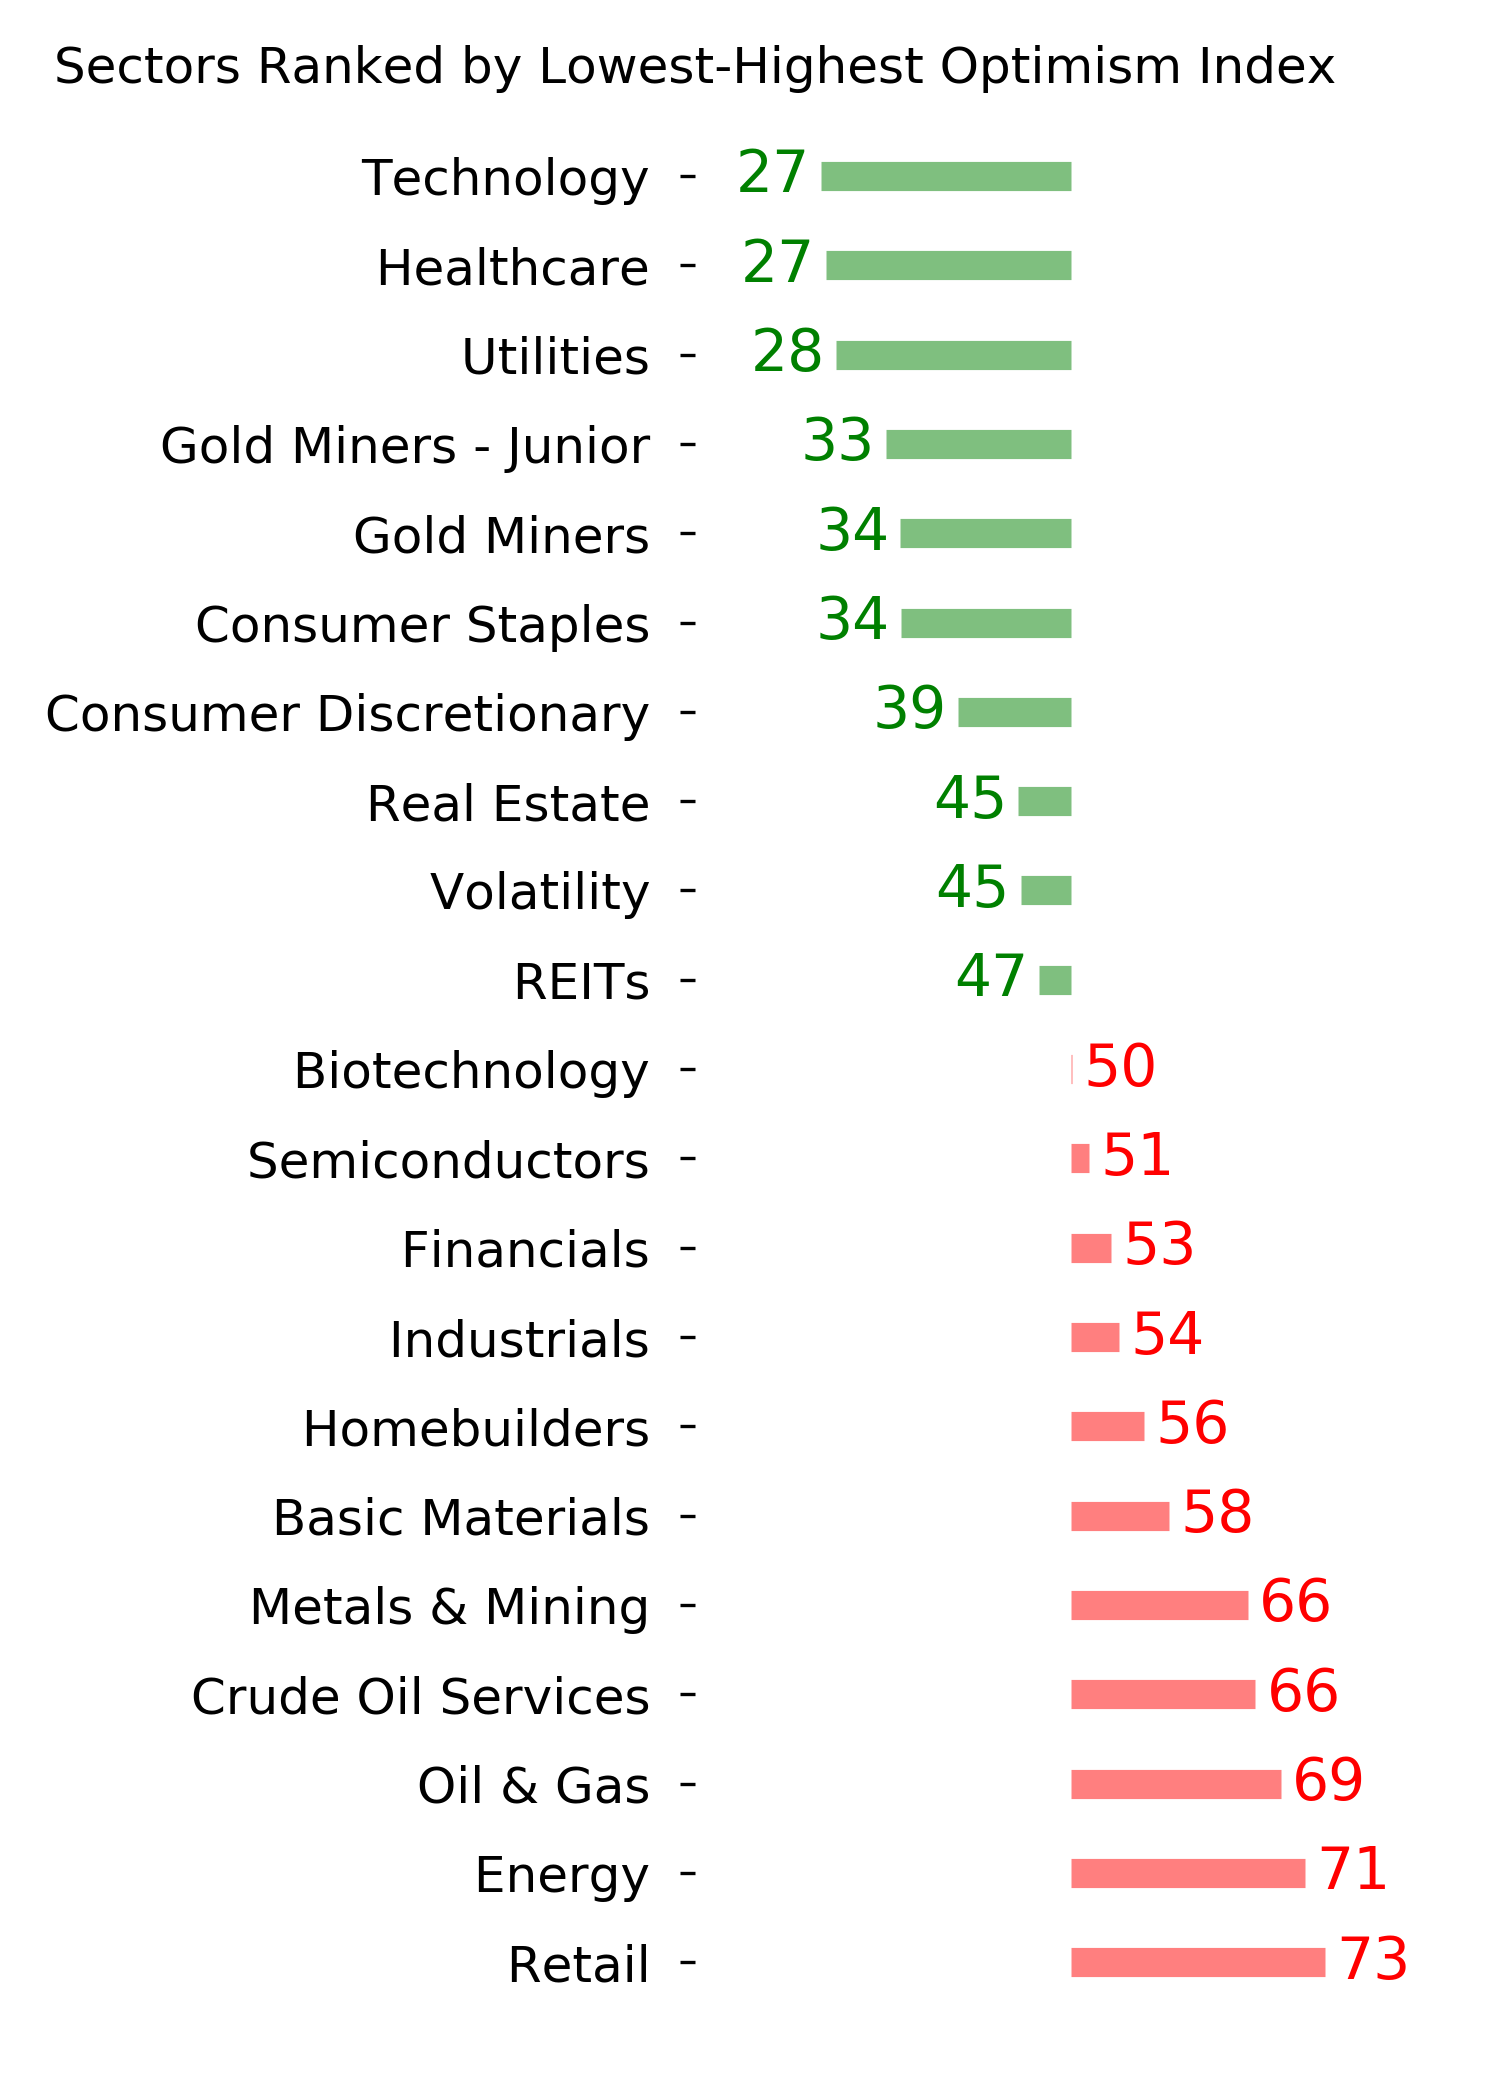
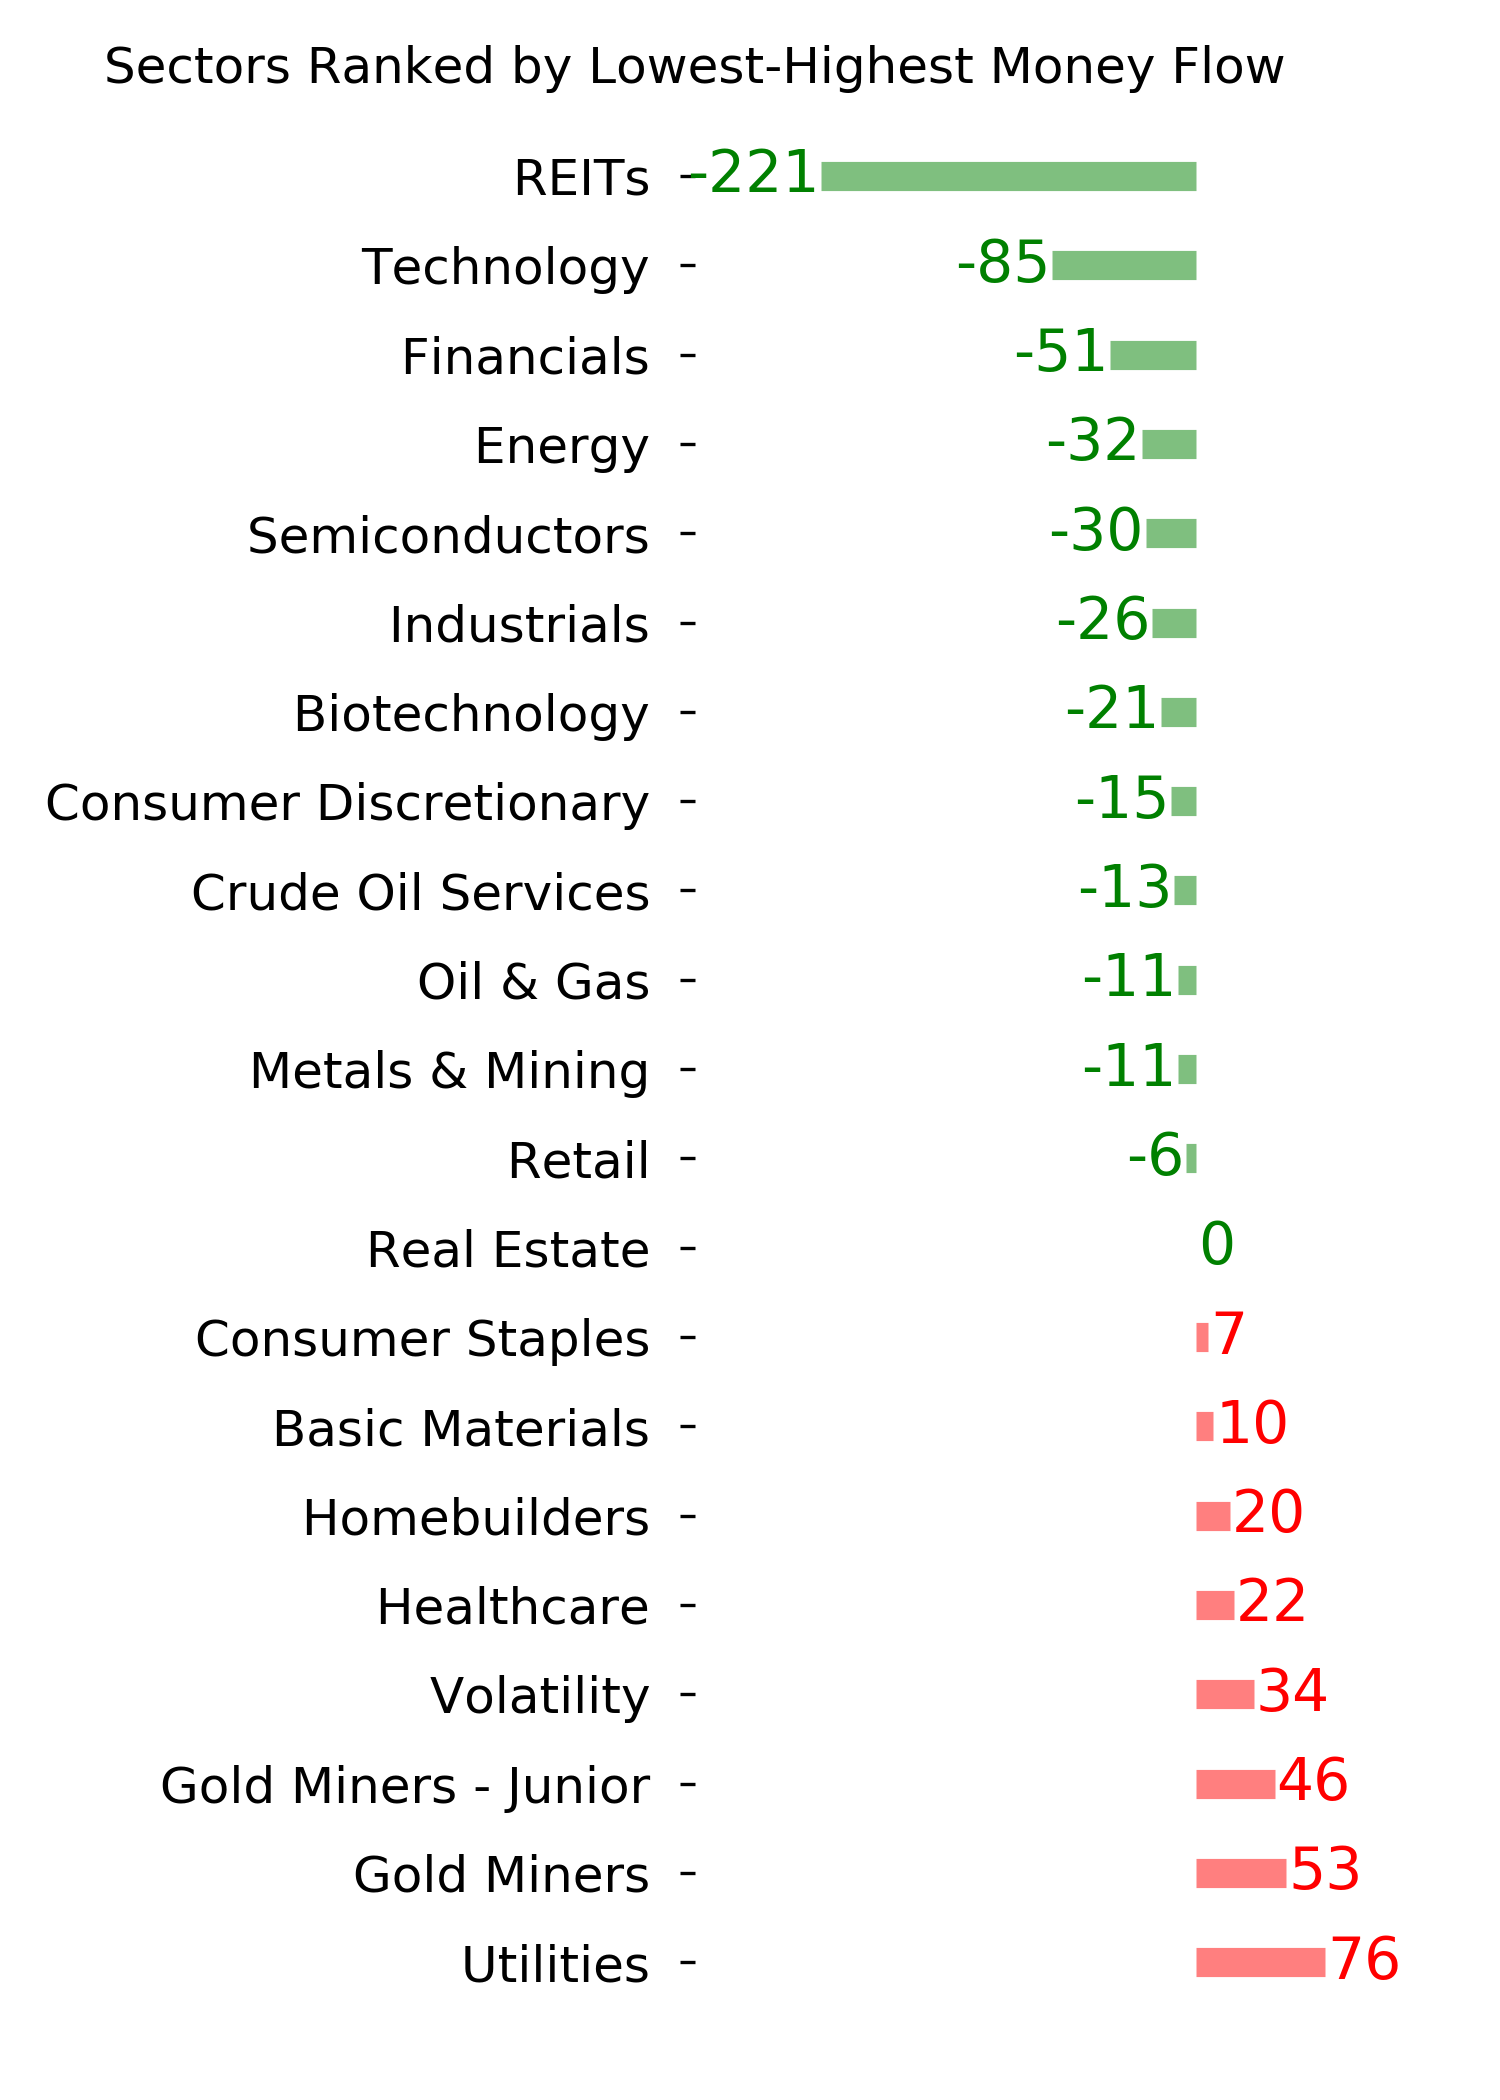
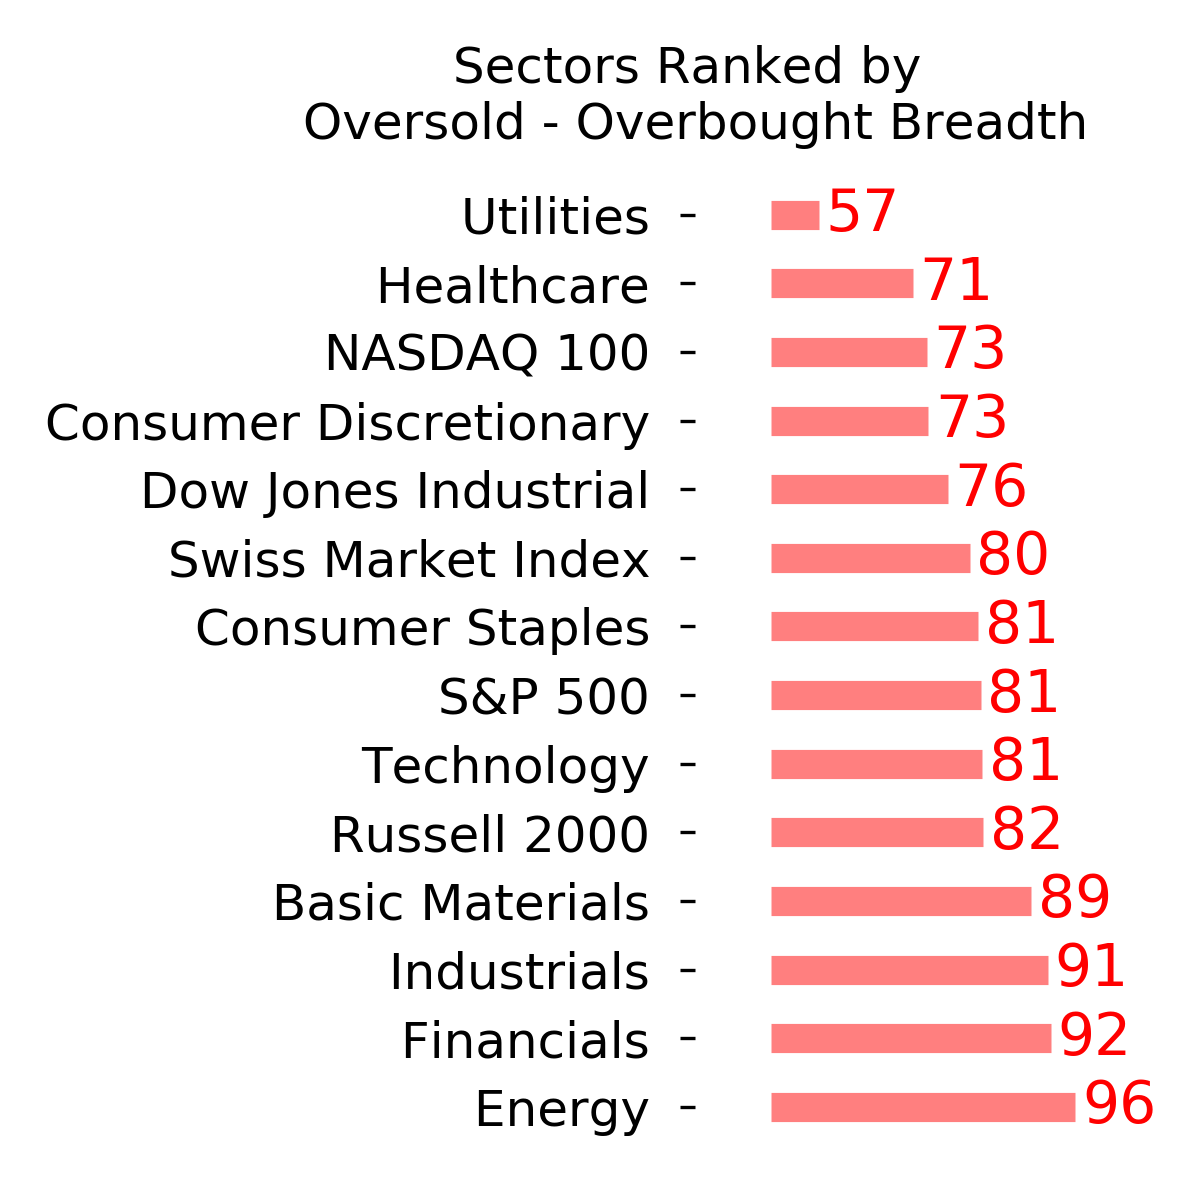
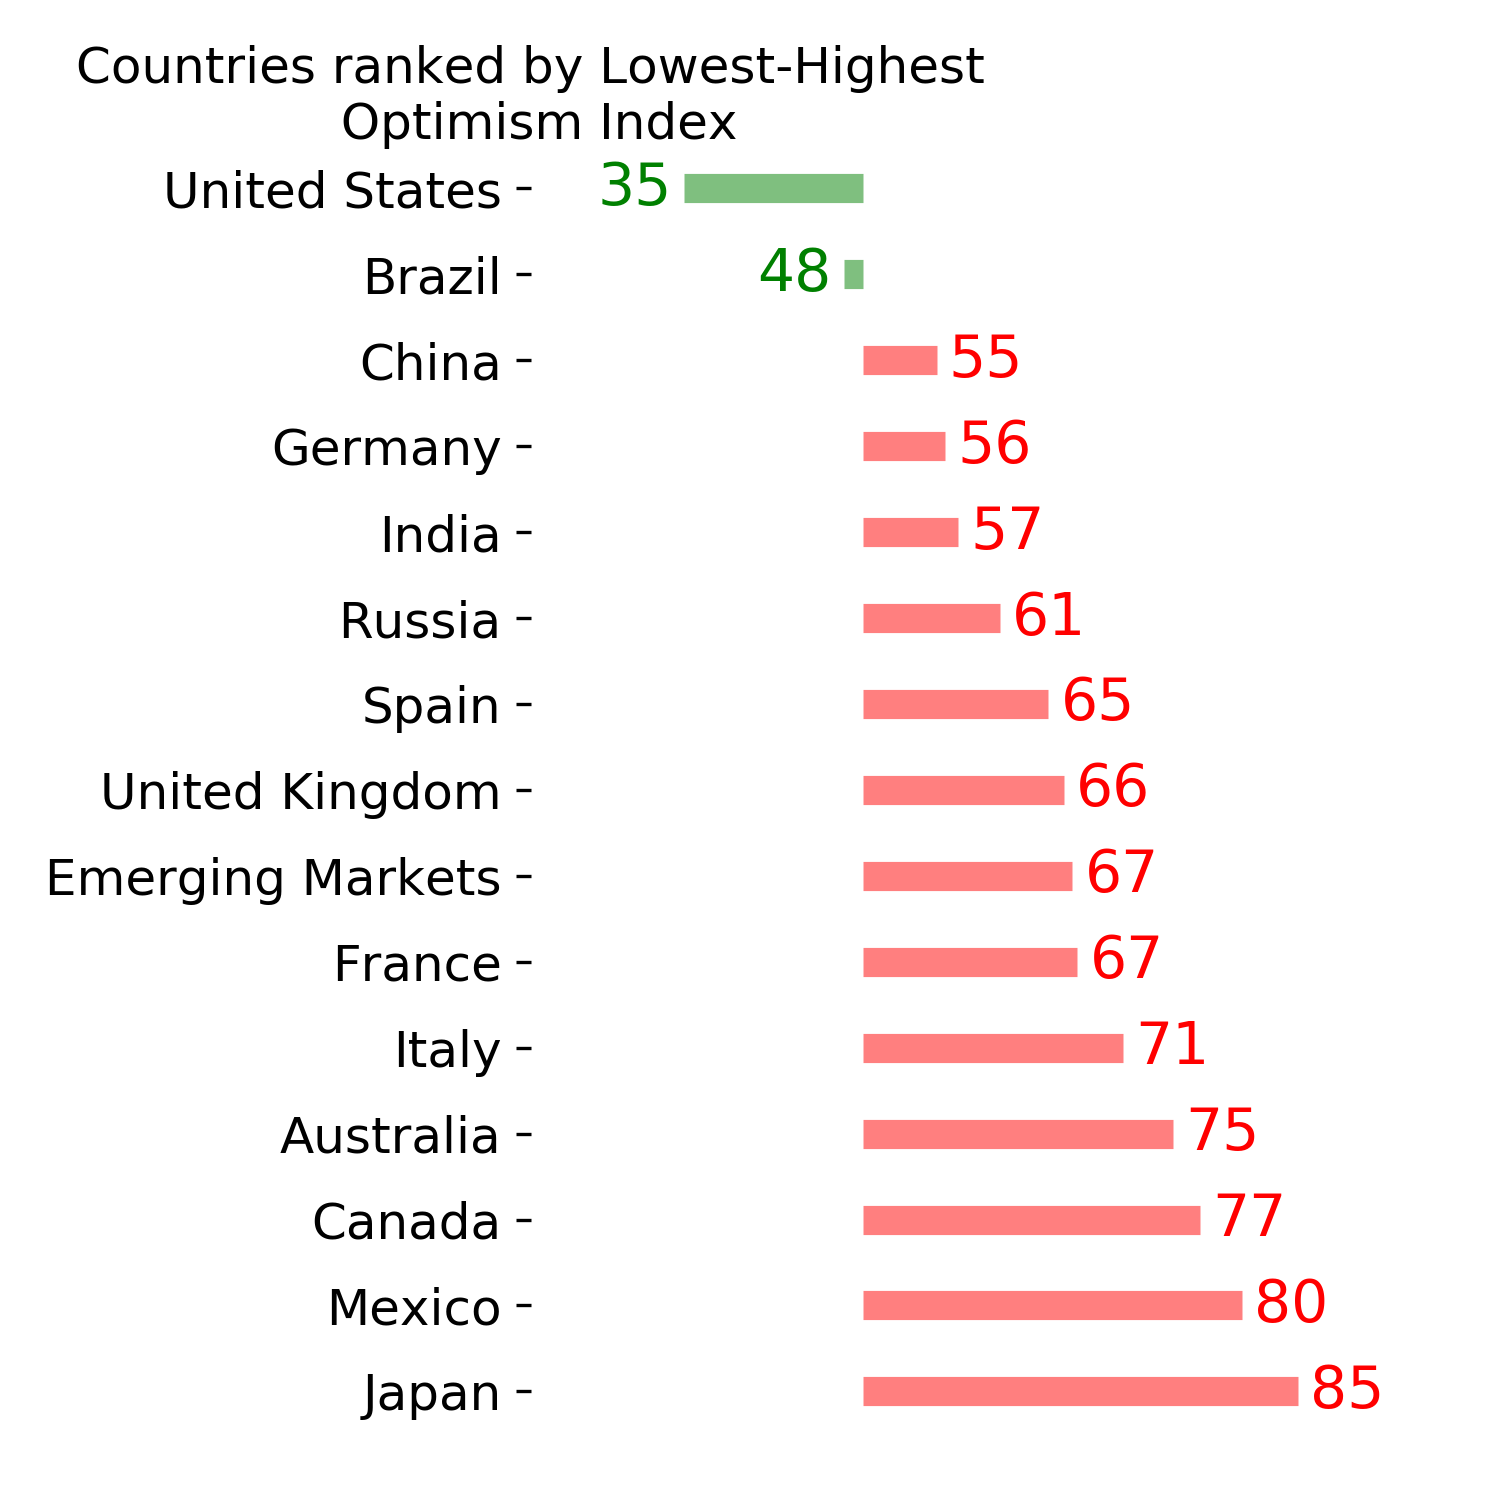
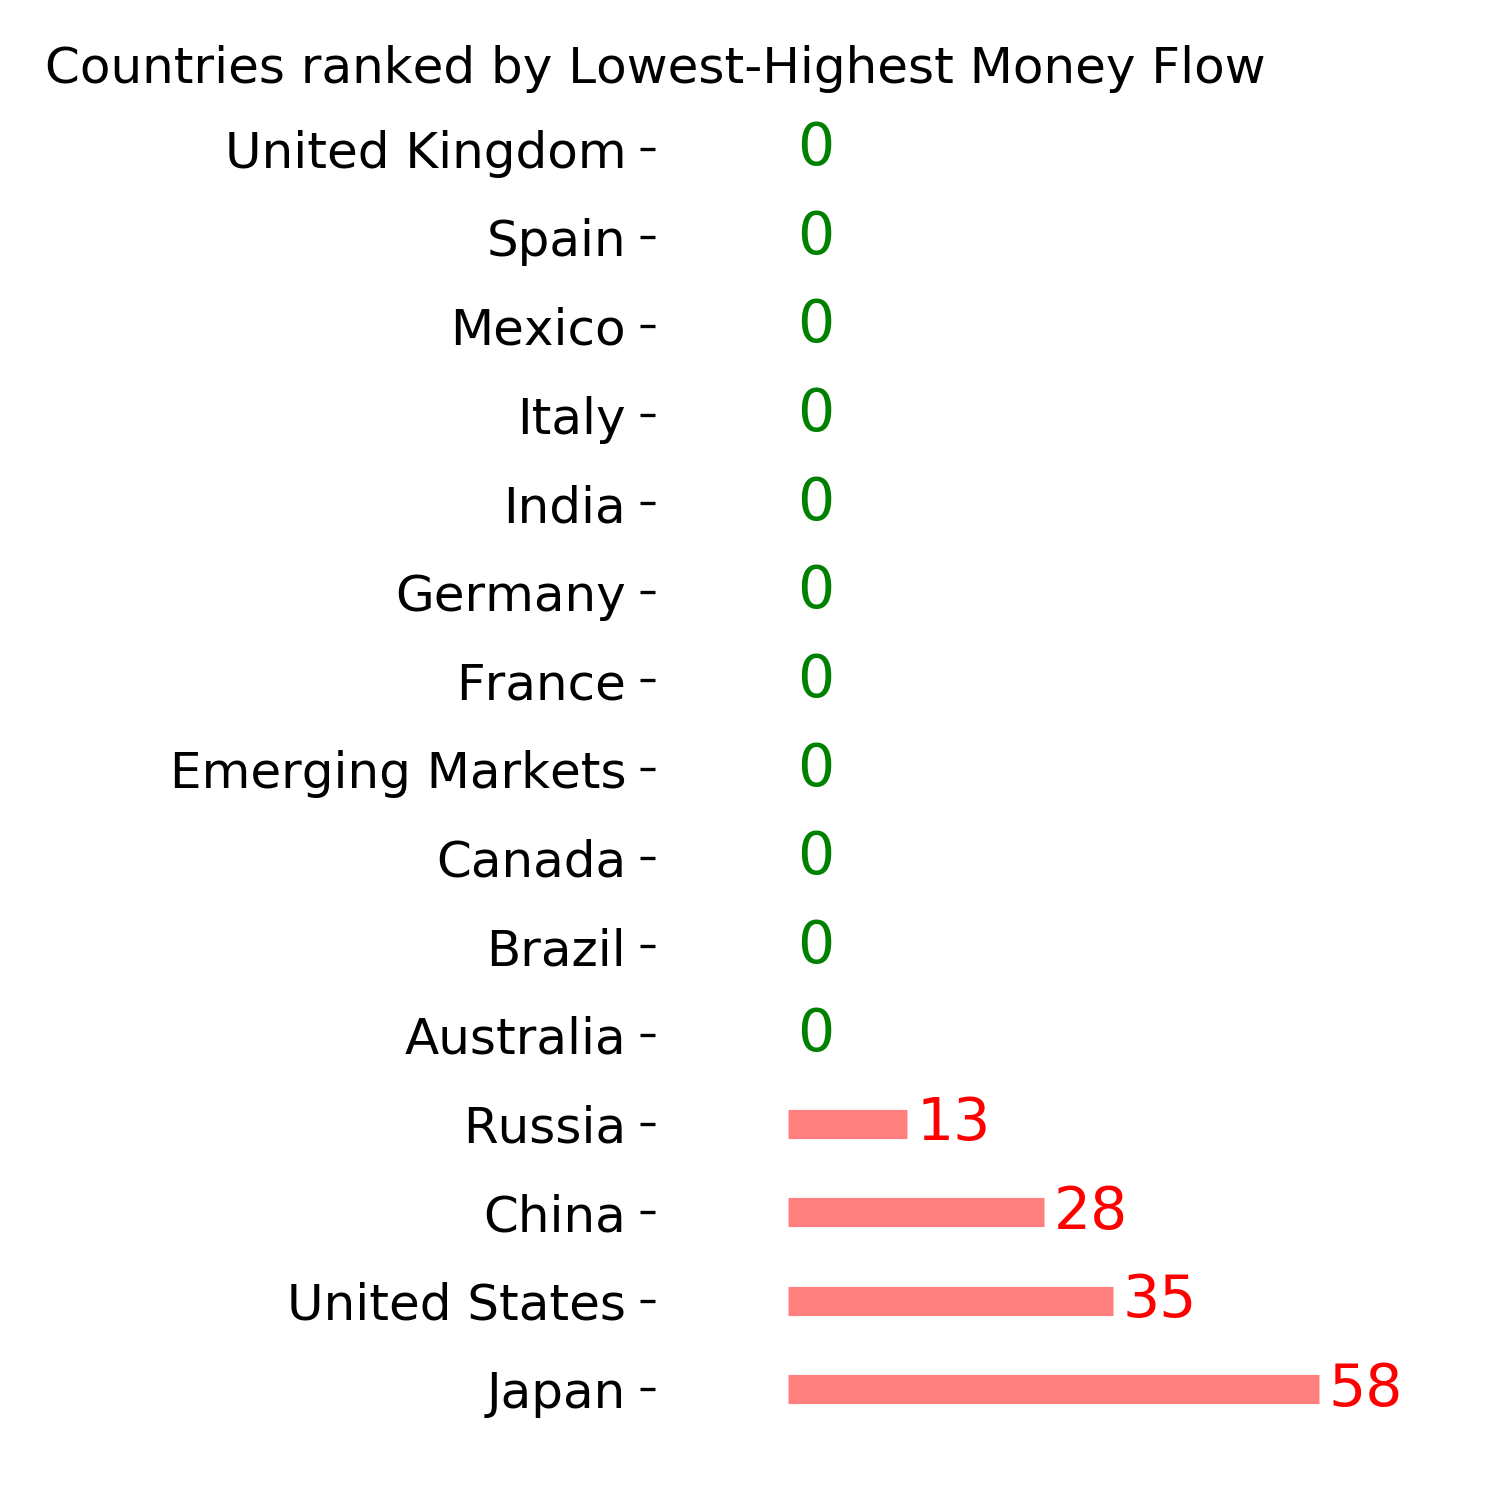
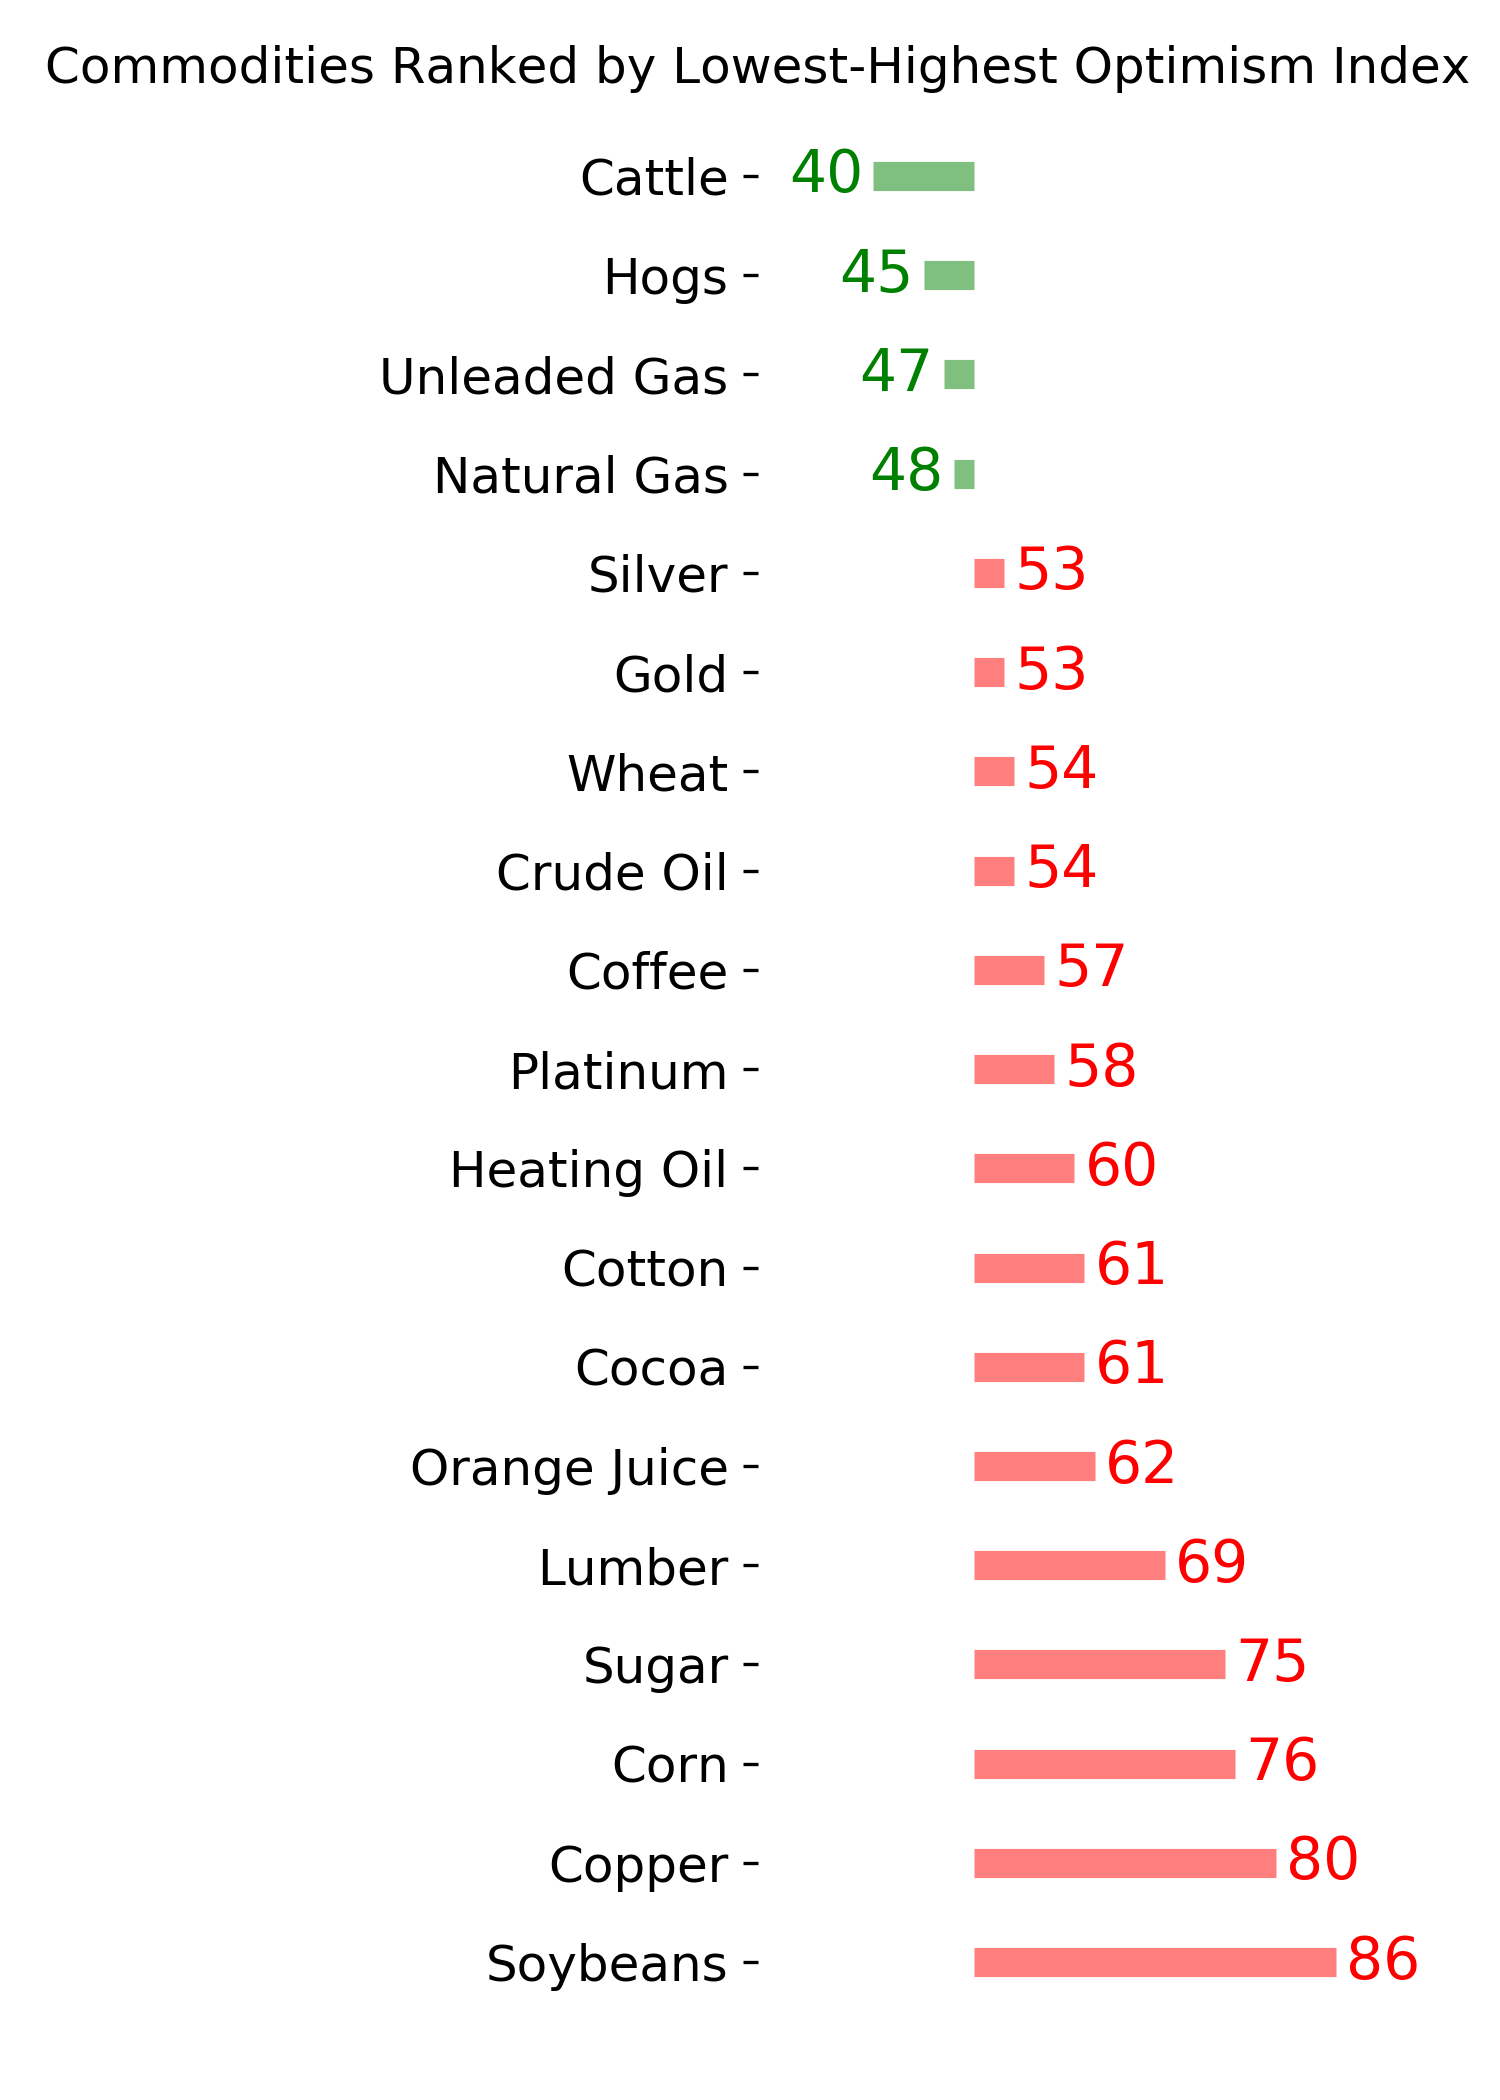
Ranks
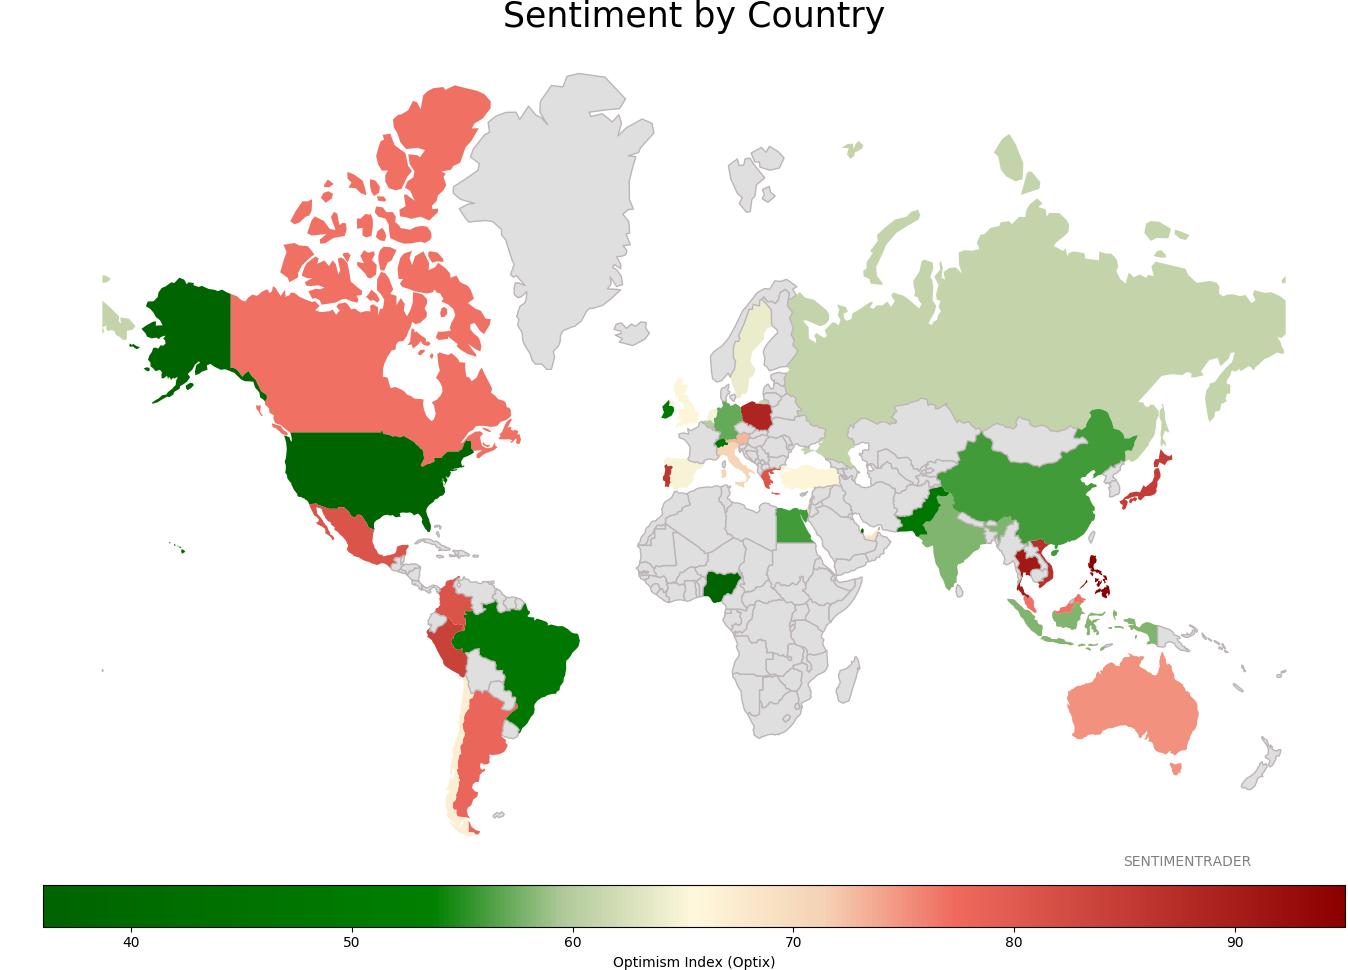
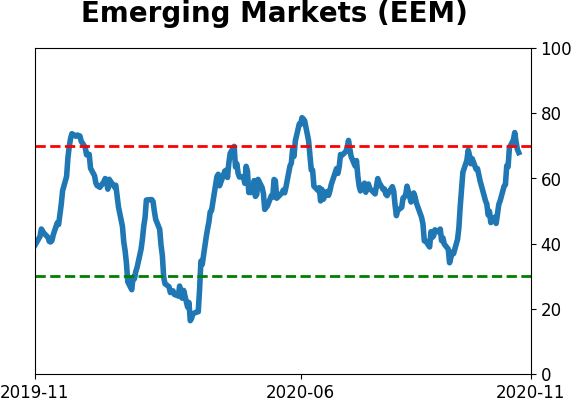
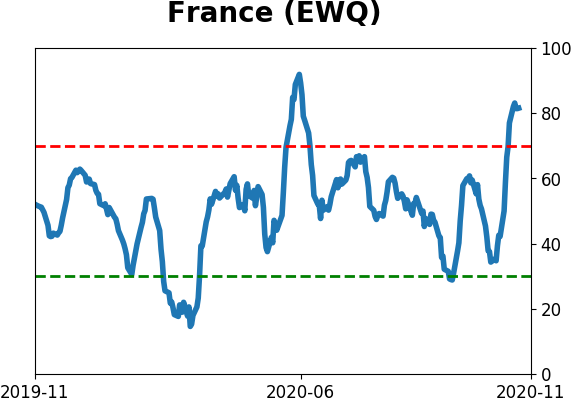
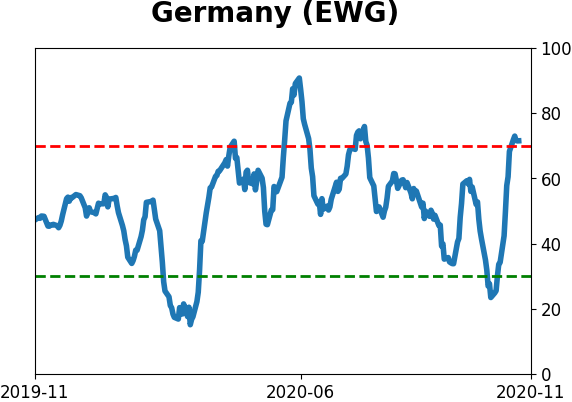
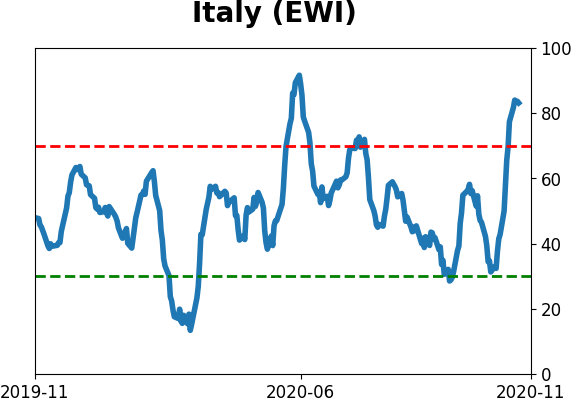
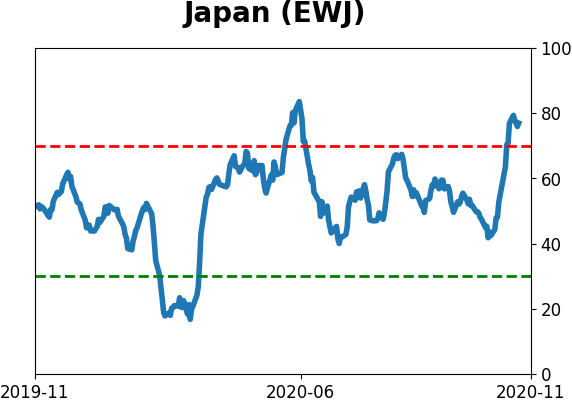
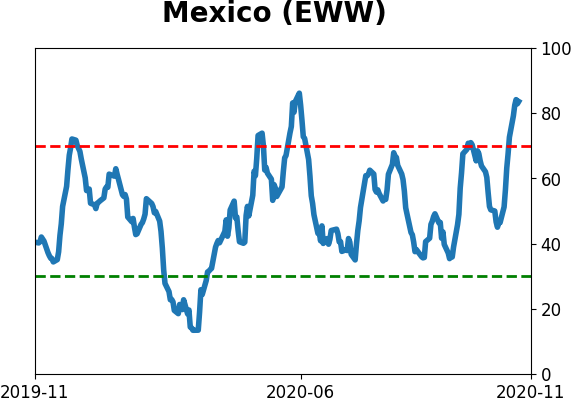
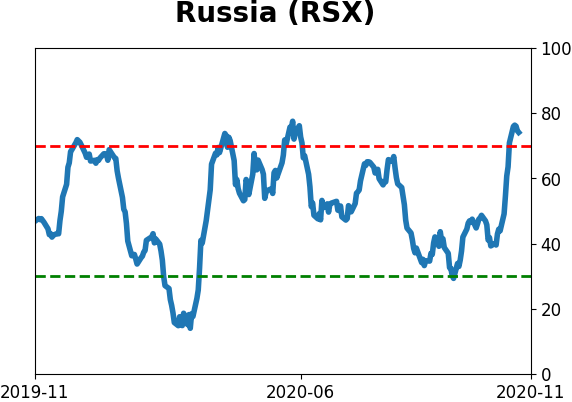
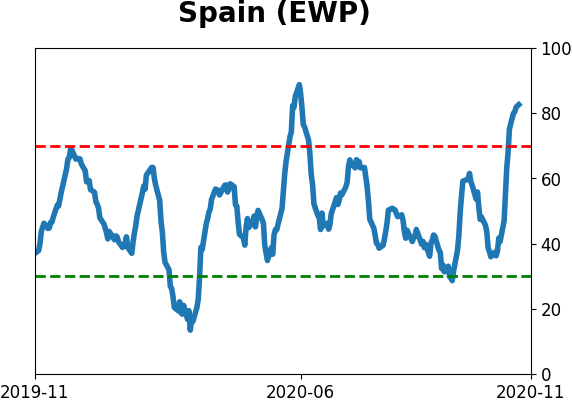
Sentiment Around The World
Optimism Index Thumbnails
|
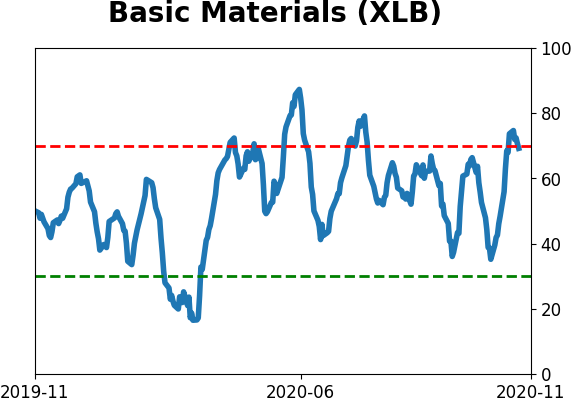
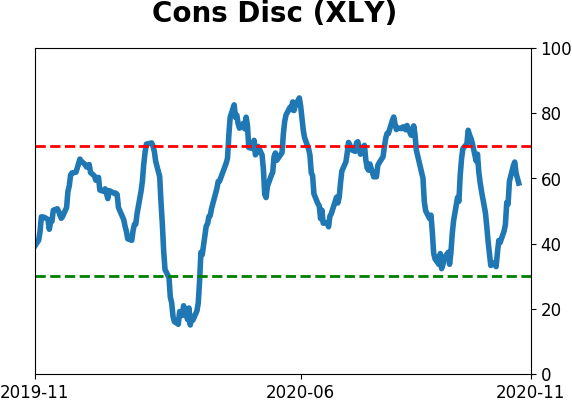
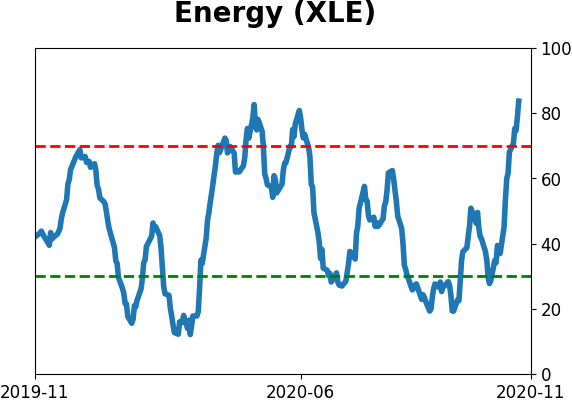
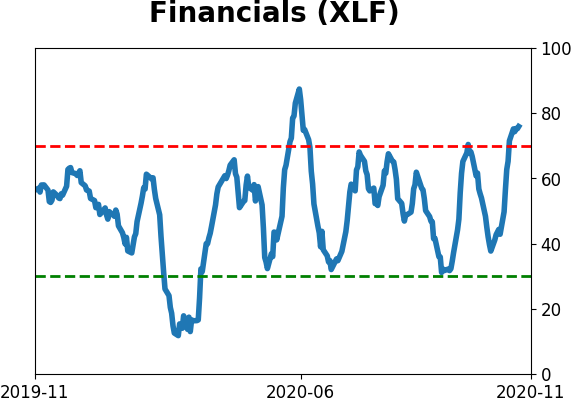
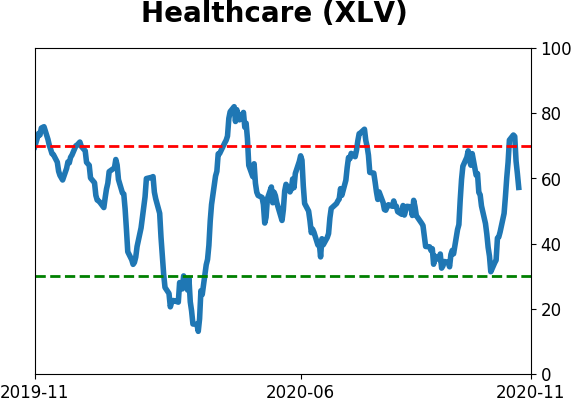
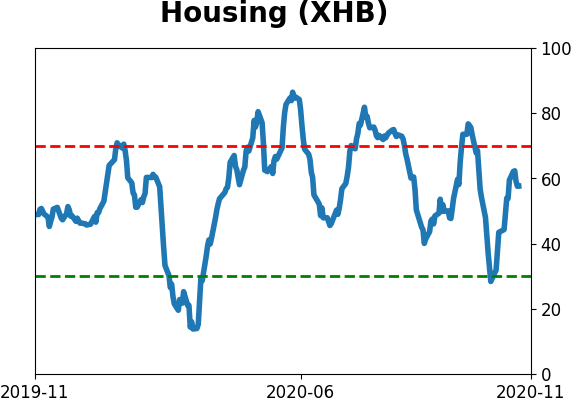
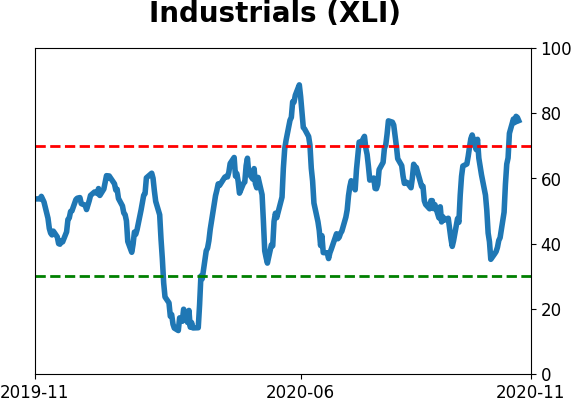
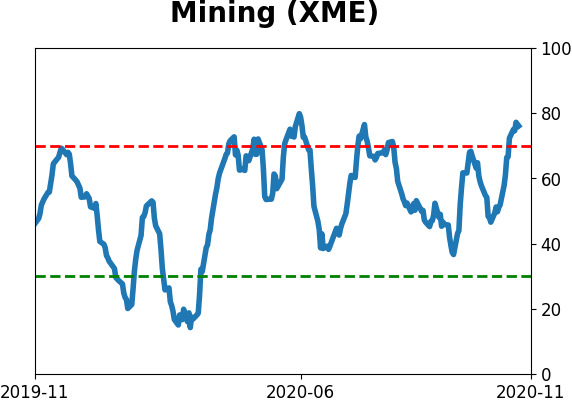
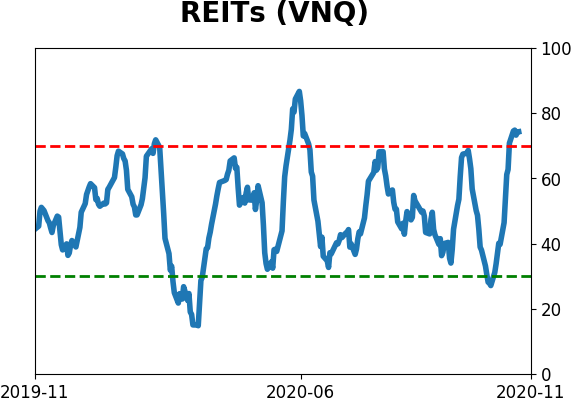
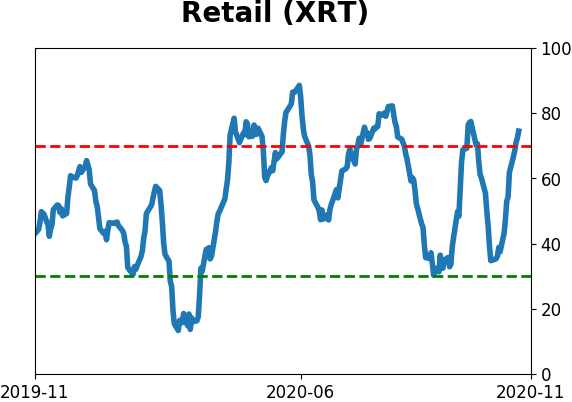
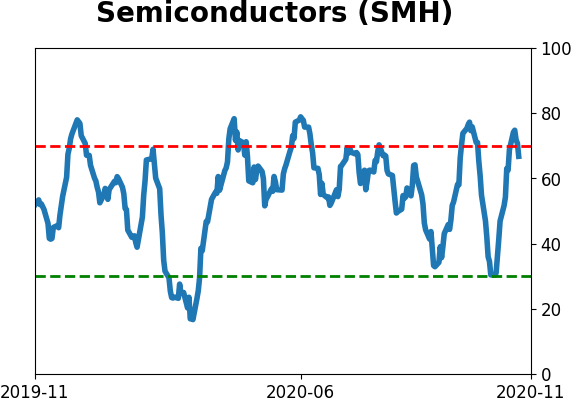
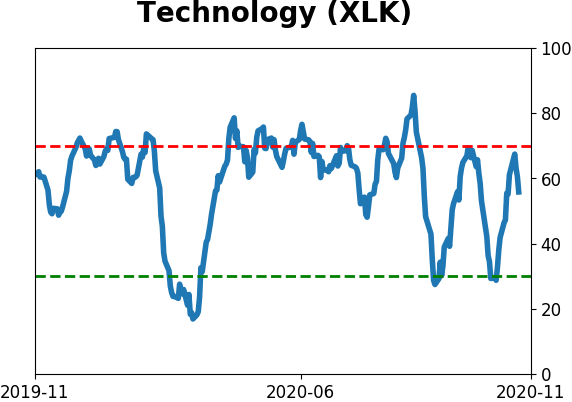
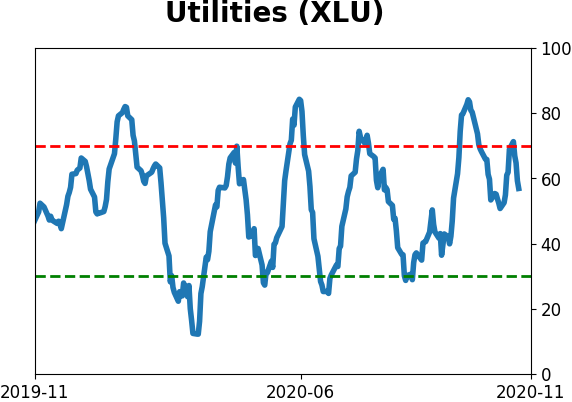
Sector ETF's - 10-Day Moving Average
|
|
|
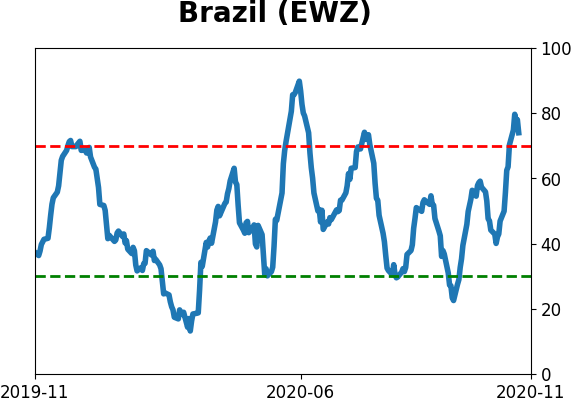
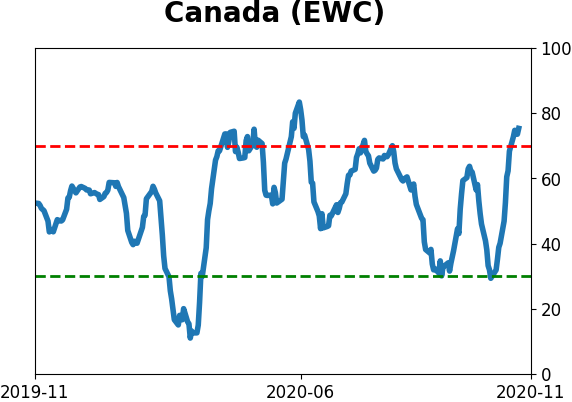
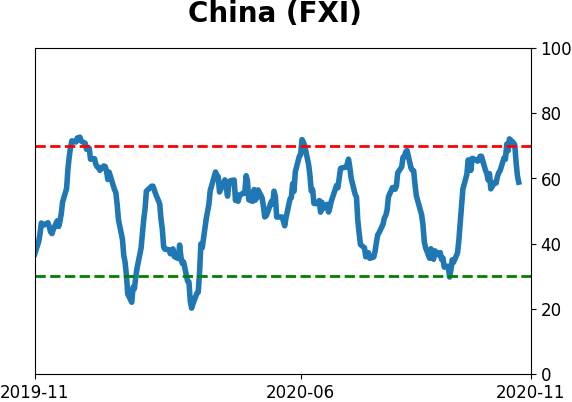
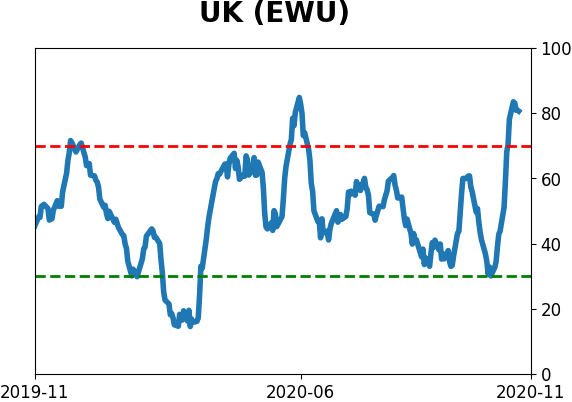
Country ETF's - 10-Day Moving Average
|
|
|
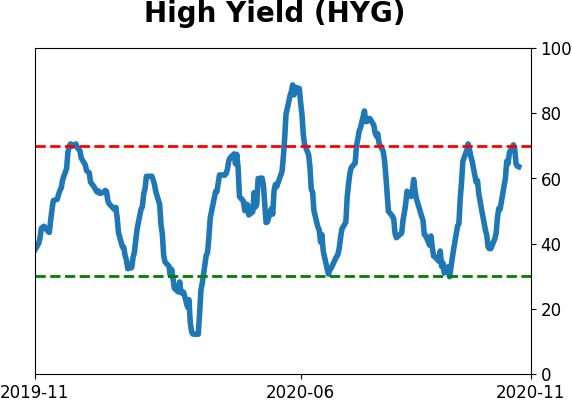
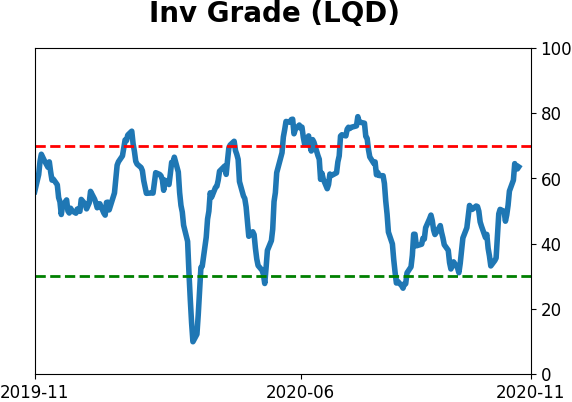
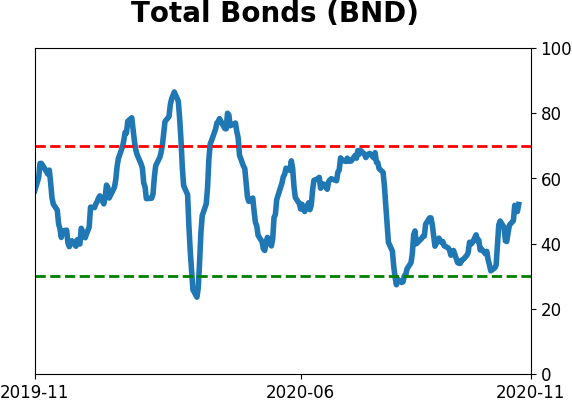
Bond ETF's - 10-Day Moving Average
|
|
|
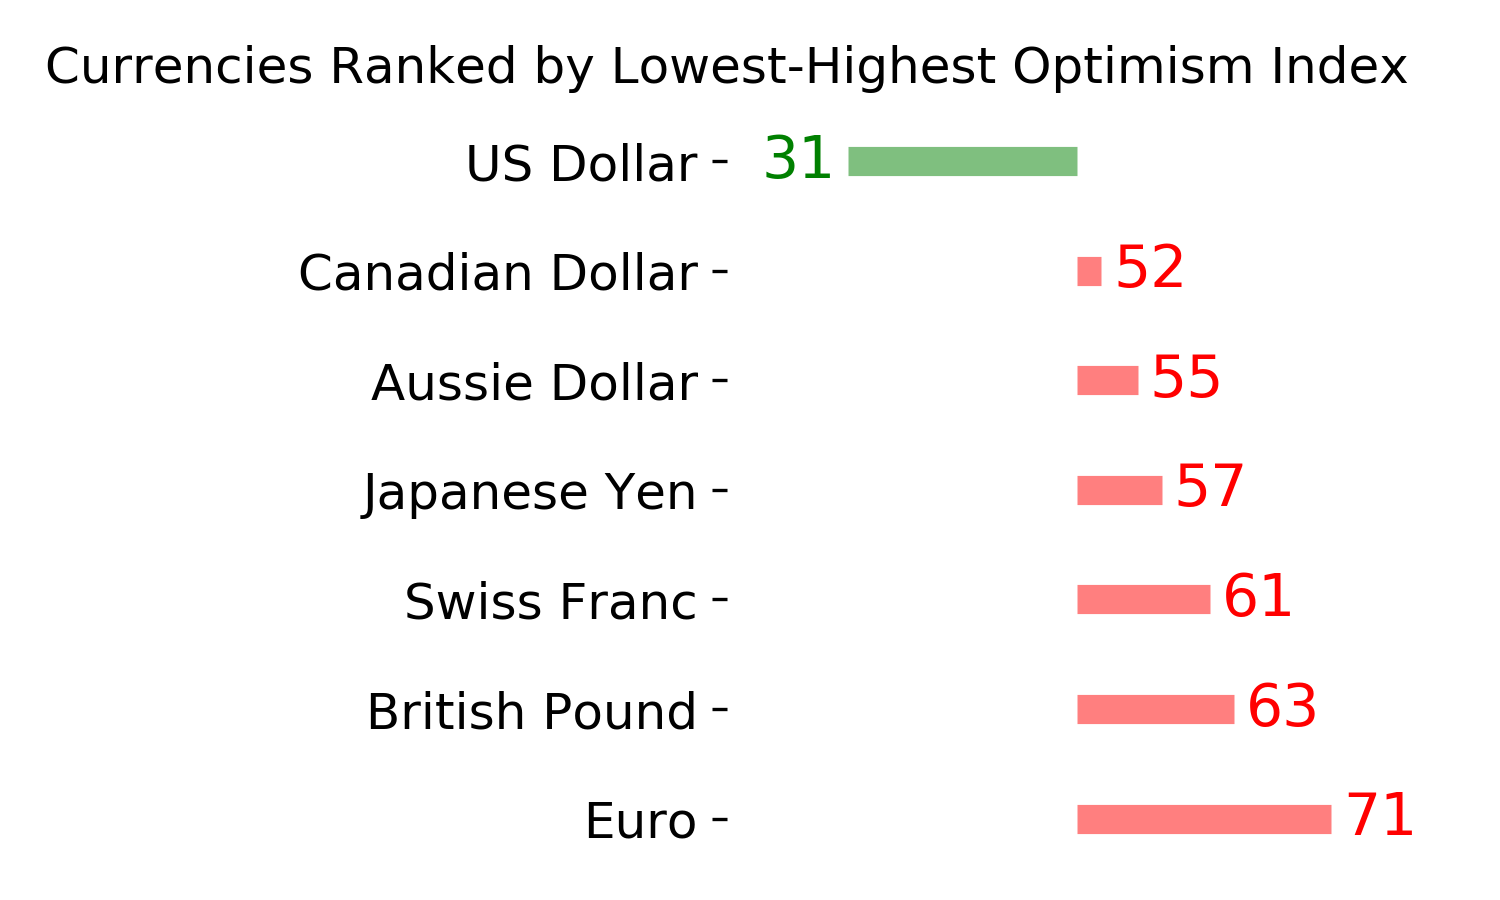
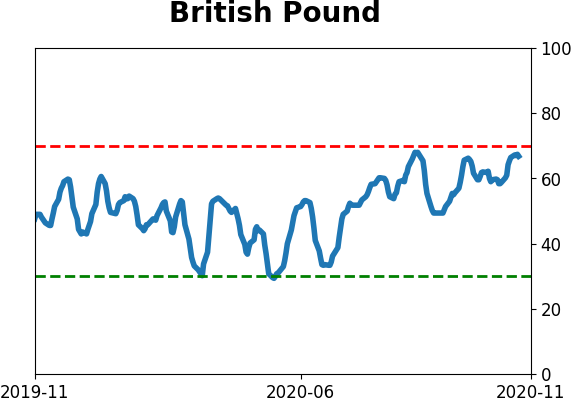
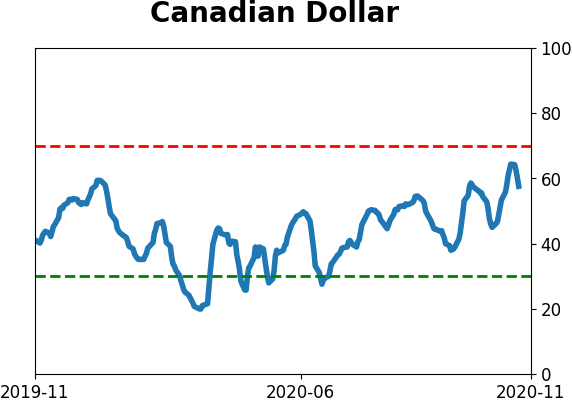
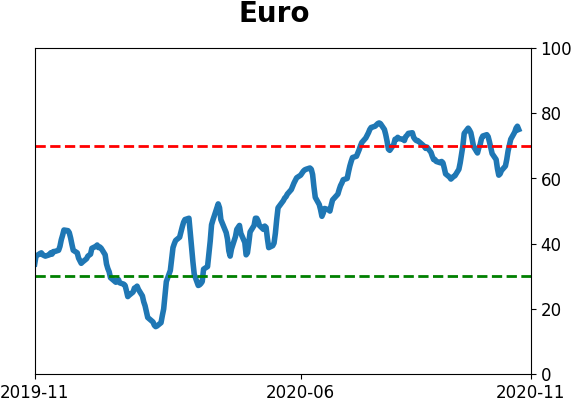
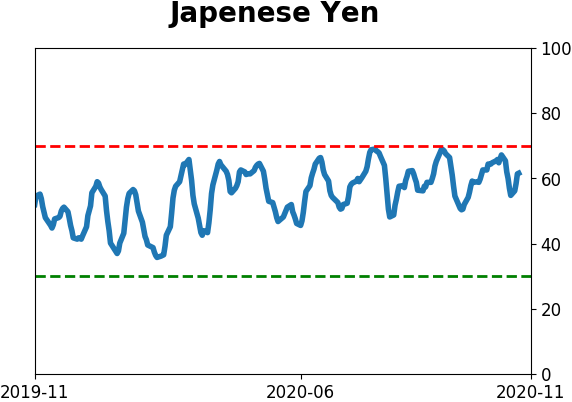
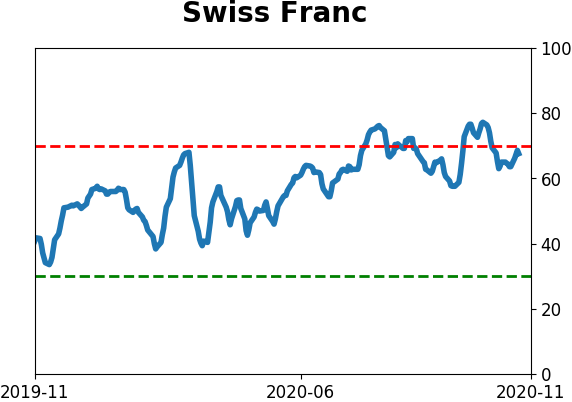
Currency ETF's - 5-Day Moving Average
|
|
|
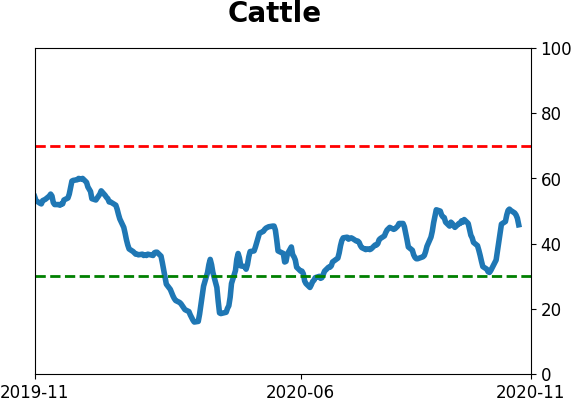
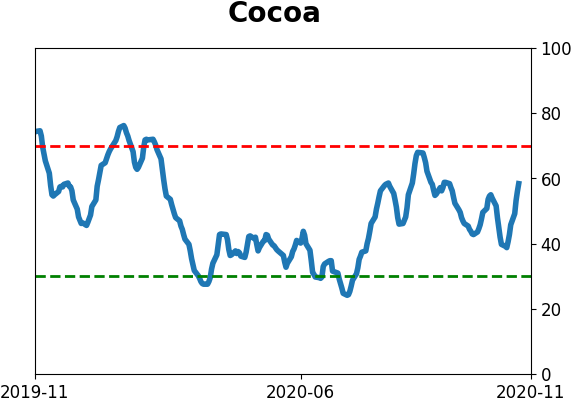
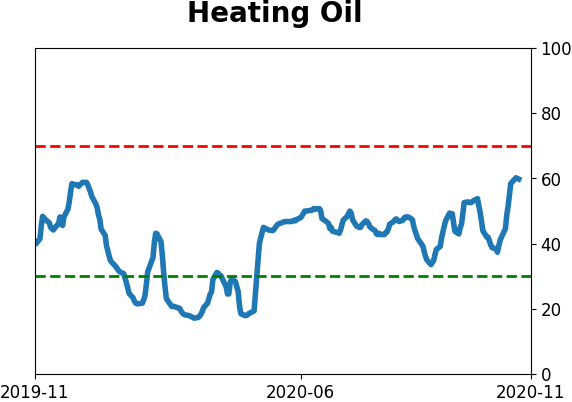
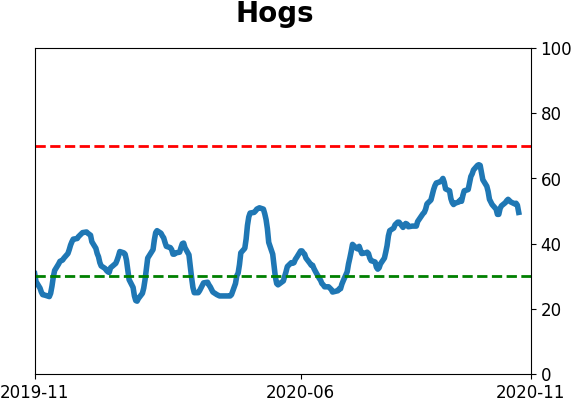
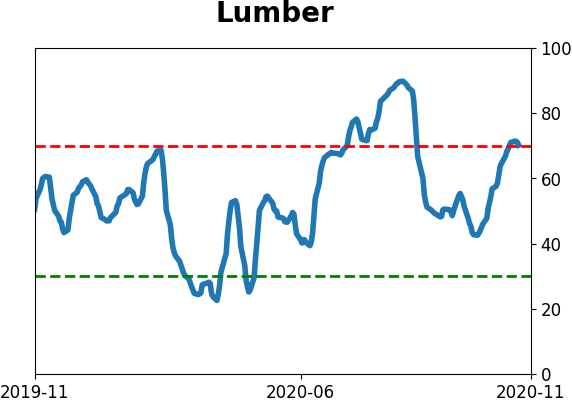
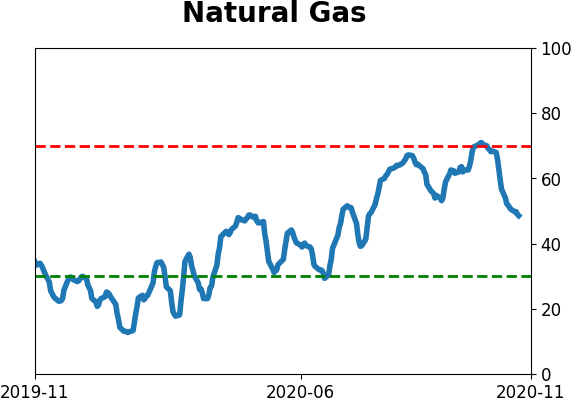
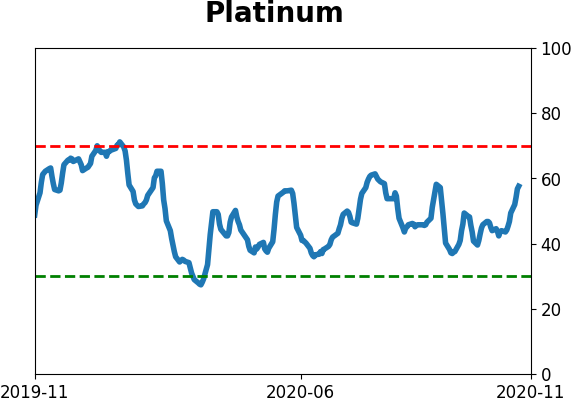
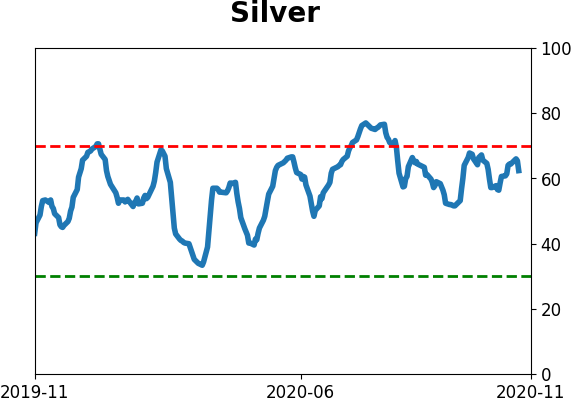
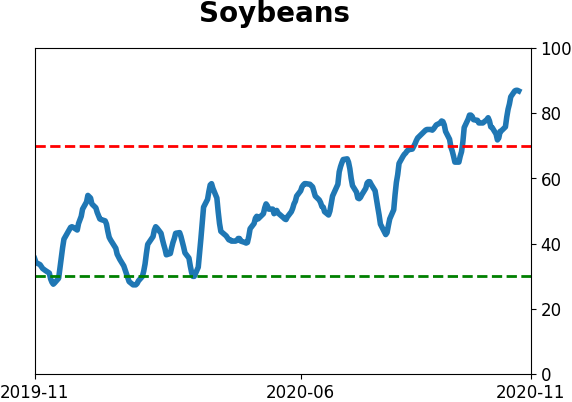
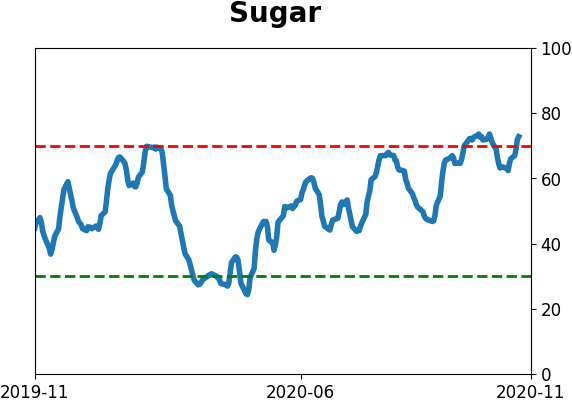
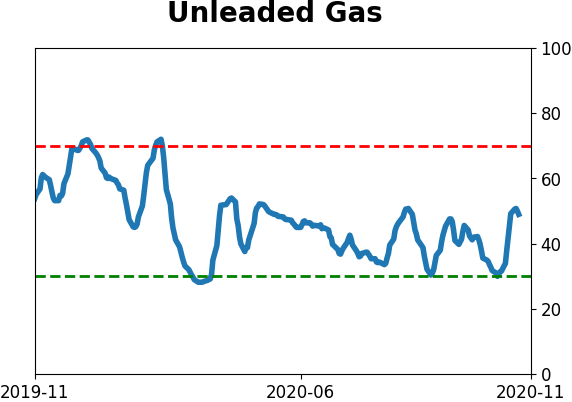
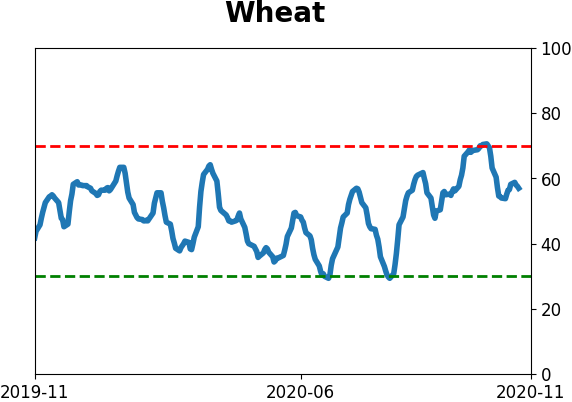
Commodity ETF's - 5-Day Moving Average
|
|