Headlines
|
|
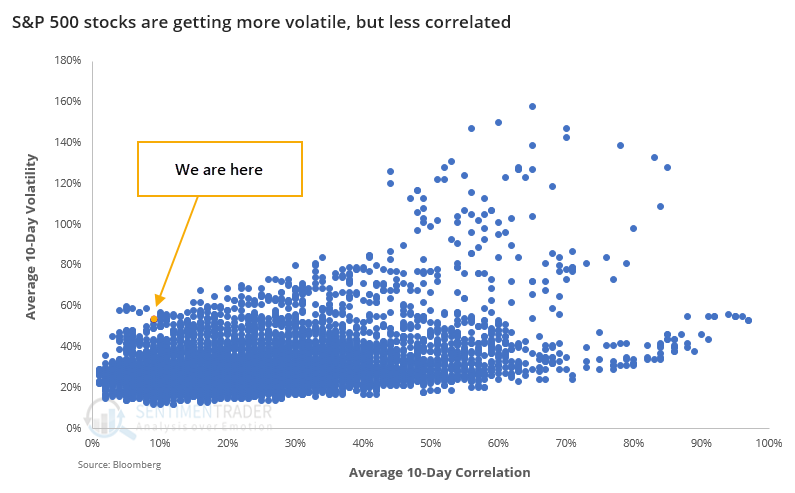
Even as stocks become more volatile, they're less correlated:
Over the past 10 days, the average stock in the S&P 500 has undergone increased volatility. At the same time, the correlation among stocks in the index has declined. This is highly unusual. Likely due to a rotation into smaller stocks, similar behavior has led to further gains in smaller stocks.
Energy sector tries to reclaim its long-term average:
The energy sector is trying to change it long-term trend, with the S&P 500 Energy index closing in on its 200-day average for the first time in almost a year, and after suffering its worst-ever spread against that average.
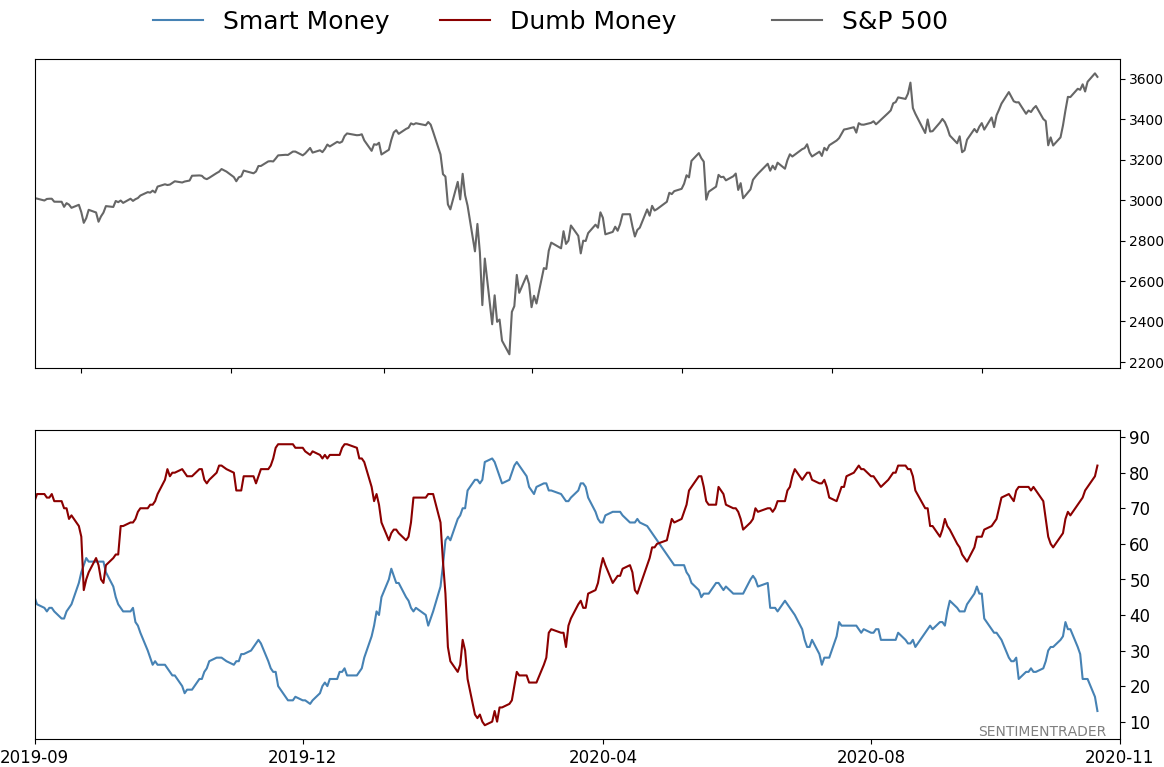
Sentiment is waving the yellow flag: A further rise in Dumb Money Confidence and rapid deterioration in Smart Money Confidence has pushed the spread between them close to -70%, one of the widest in 20 years. The Backtest Engine shows that after 32 out of 33 days with this wide of a spread, the S&P suffered a negative return at some point between 1-8 weeks later. Similarly, more than 50% of our core indicators are showing excessive optimism than are showing pessimism, an extreme spread which has led to a negative expectancy going forward. While breadth and momentum strongly argue for higher prices over a medium- to long-term time frame, when sentiment becomes this eager, shorter-term returns tend to be muted and prone to reversals.
Bottom Line:
- The market environment is pristine, but with near-historic optimism, gains tend to be muted, with a high probability of being reversed at some point over the ensuing weeks.
|
Smart / Dumb Money Confidence
|
Smart Money Confidence: 13%
Dumb Money Confidence: 82%
|
|
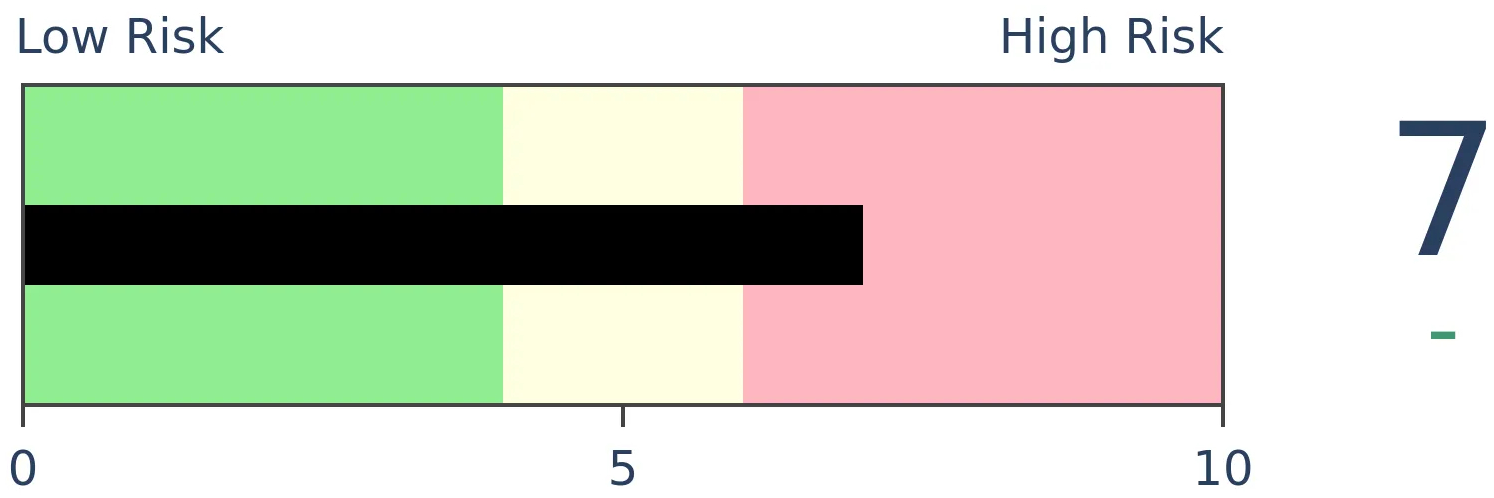
Risk Levels
Stocks Short-Term
|
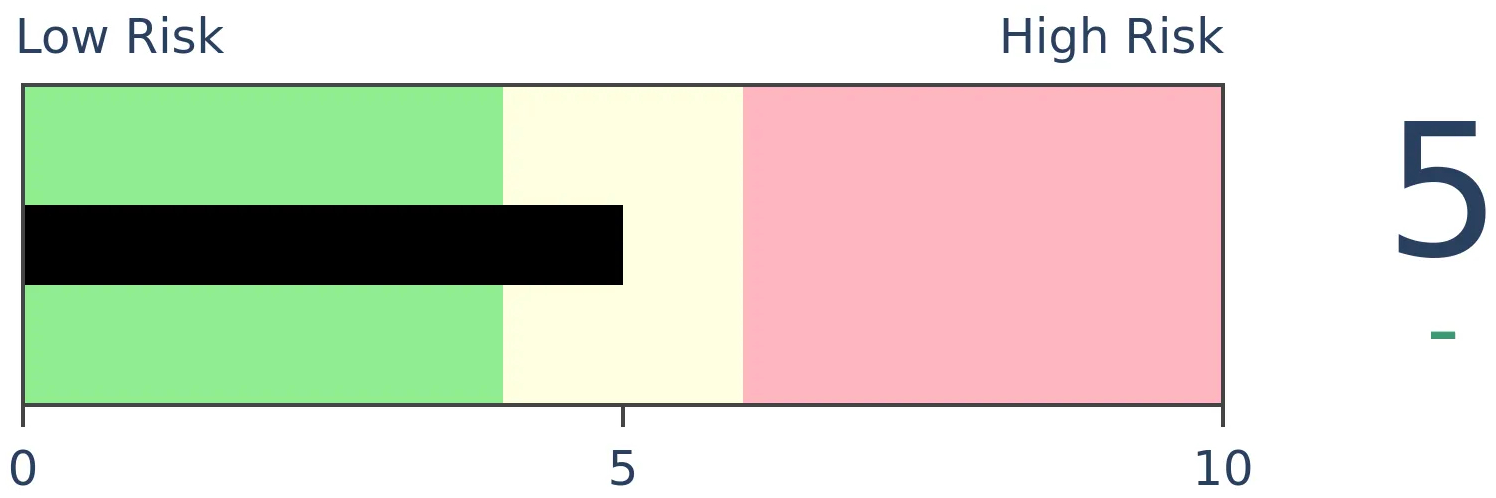
Stocks Medium-Term
|
|
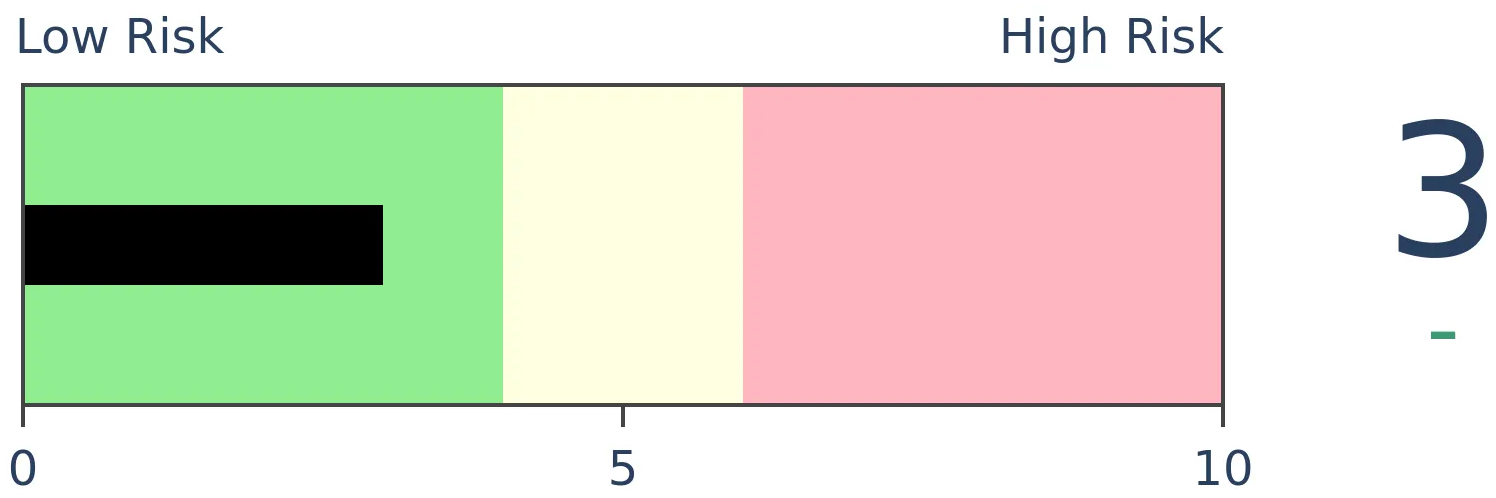
Bonds
|
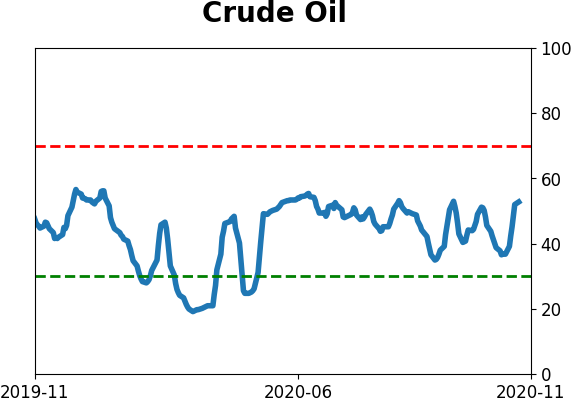
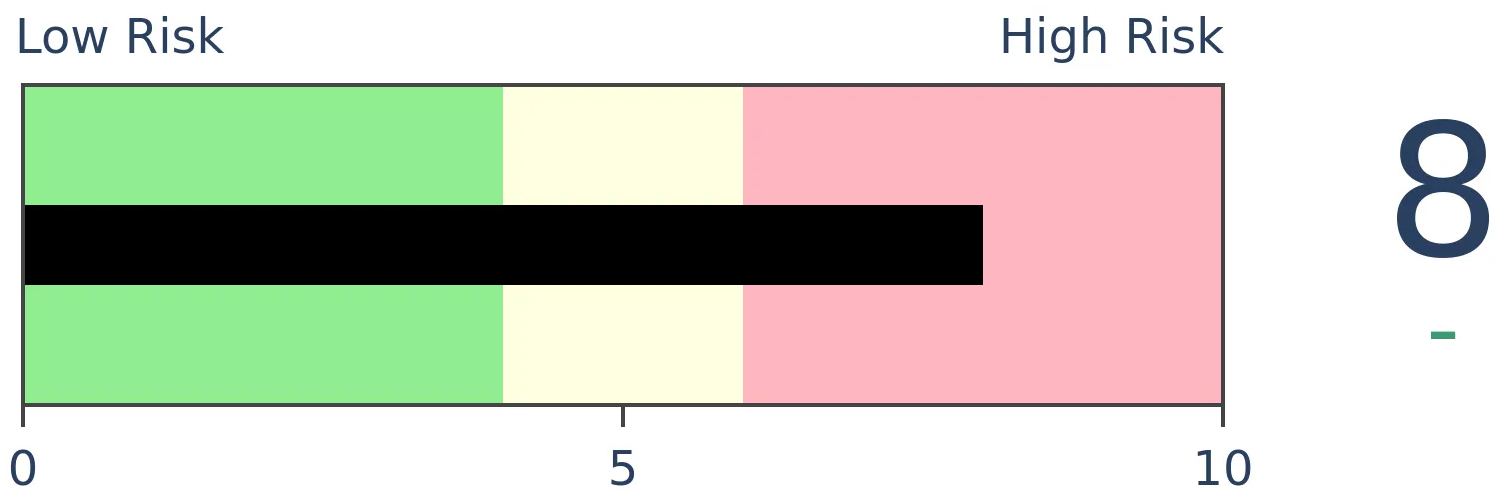
Crude Oil
|
|
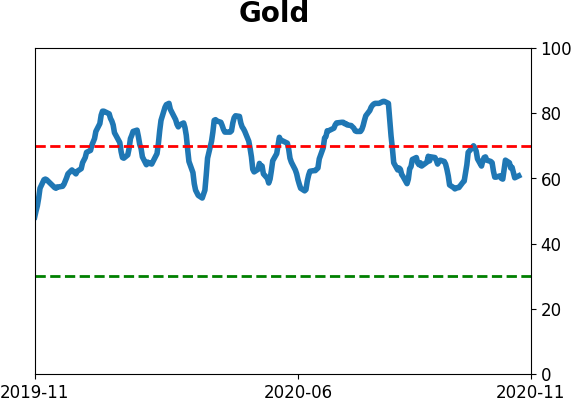
Gold
|
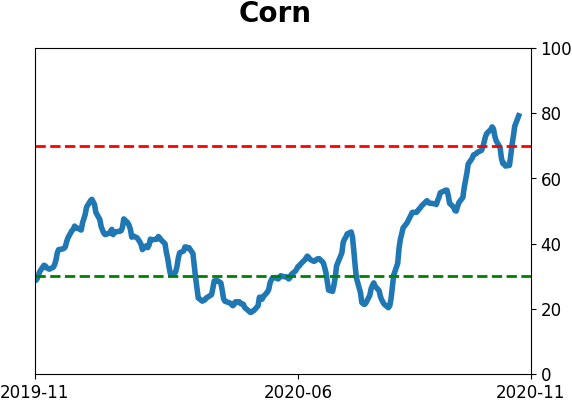
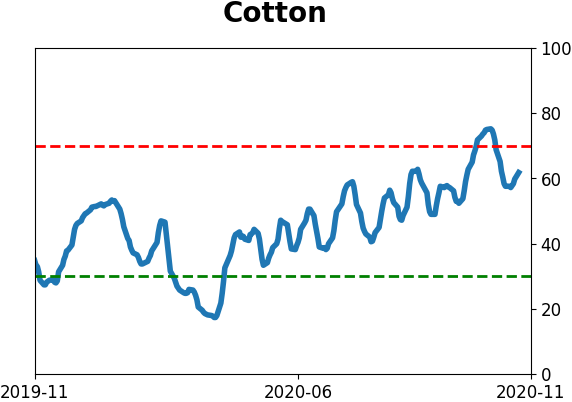
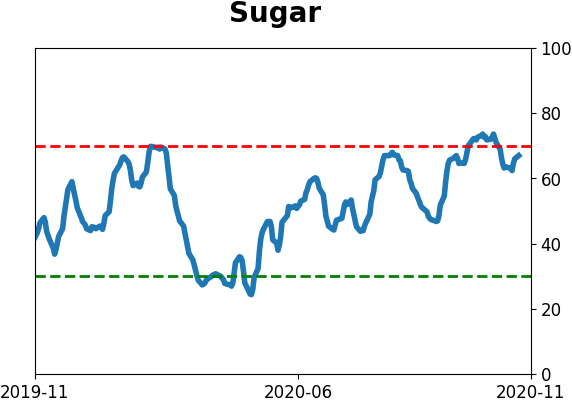
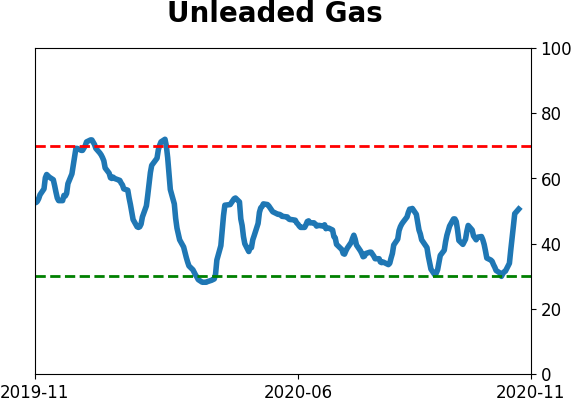
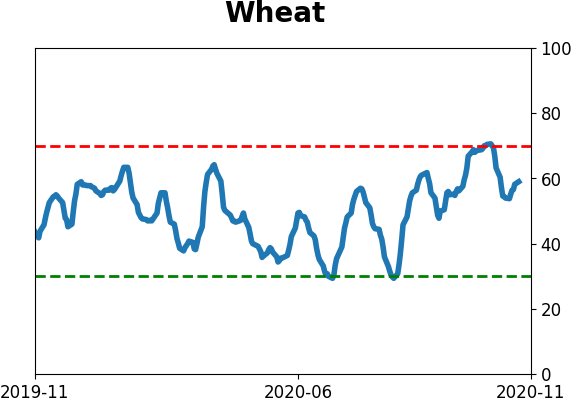
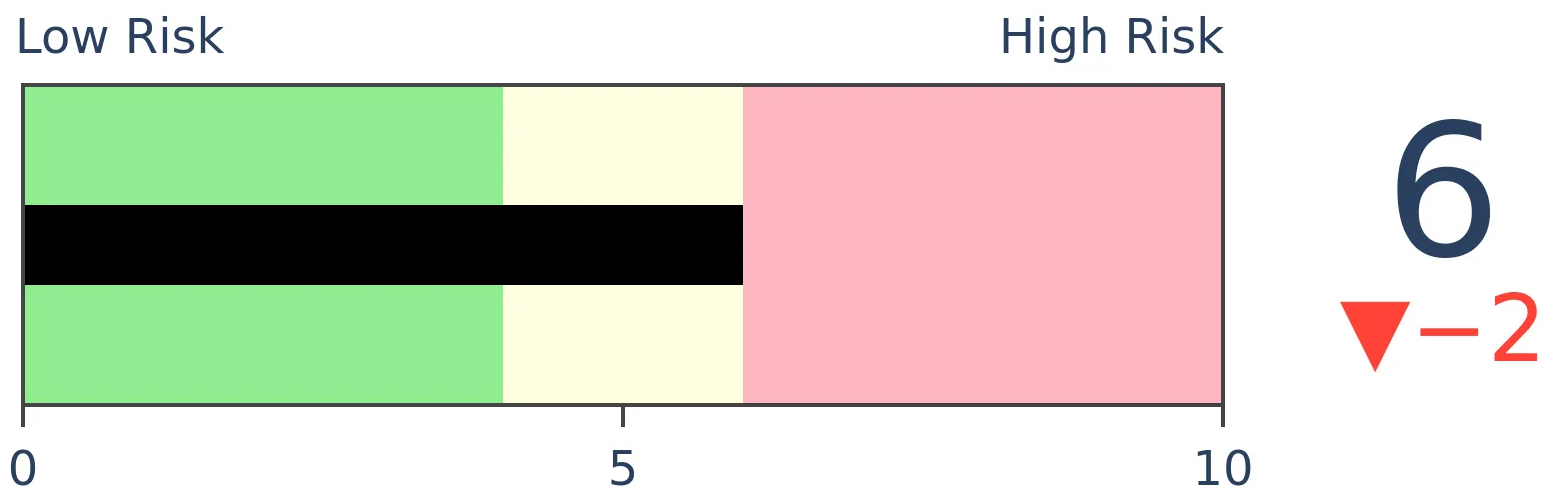
Agriculture
|
|
Research
BOTTOM LINE
Over the past 10 days, the average stock in the S&P 500 has undergone increased volatility. At the same time, the correlation among stocks in the index has declined. This is highly unusual. Likely due to a rotation into smaller stocks, similar behavior has led to further gains in smaller stocks.
FORECAST / TIMEFRAME
None
|
The historic shift between factors hasn't really let up since they were jolted out of a slumber last week. The continued outperformance in small-cap stocks is triggering some other oddities, as well.
Bloomberg notes that while the average 10-day volatility among stocks in the S&P 500 has jumped along with big price moves over the past two weeks, the average 10-day correlation among stocks in the index has plunged.
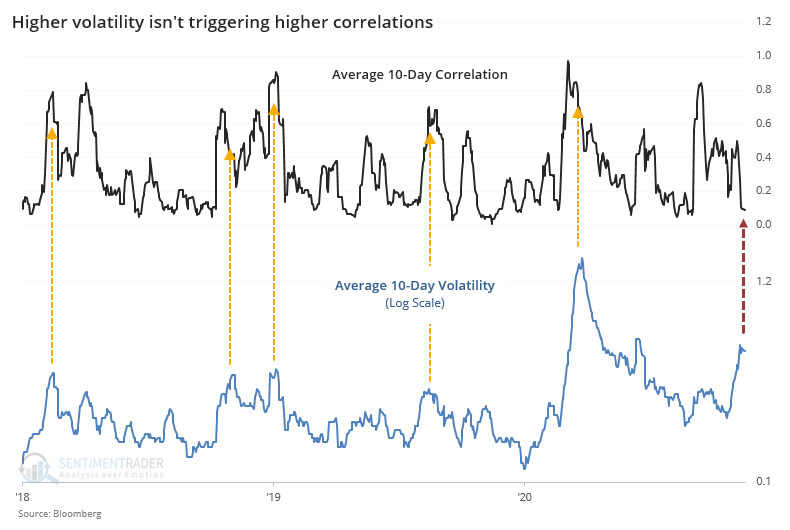
This is extremely unusual. Most of the time, higher volatility means higher correlation and vice-versa.
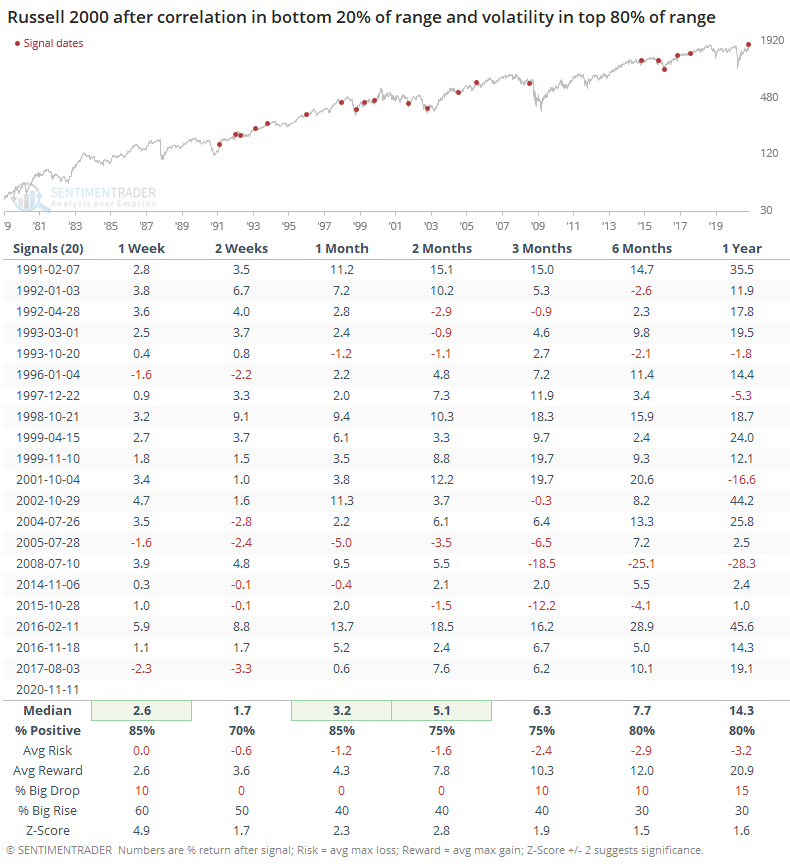
For the S&P 500, this was a mixed-to-positive sign, with gains over the next month and longer-term, but less-positive performance over the next 2 months.
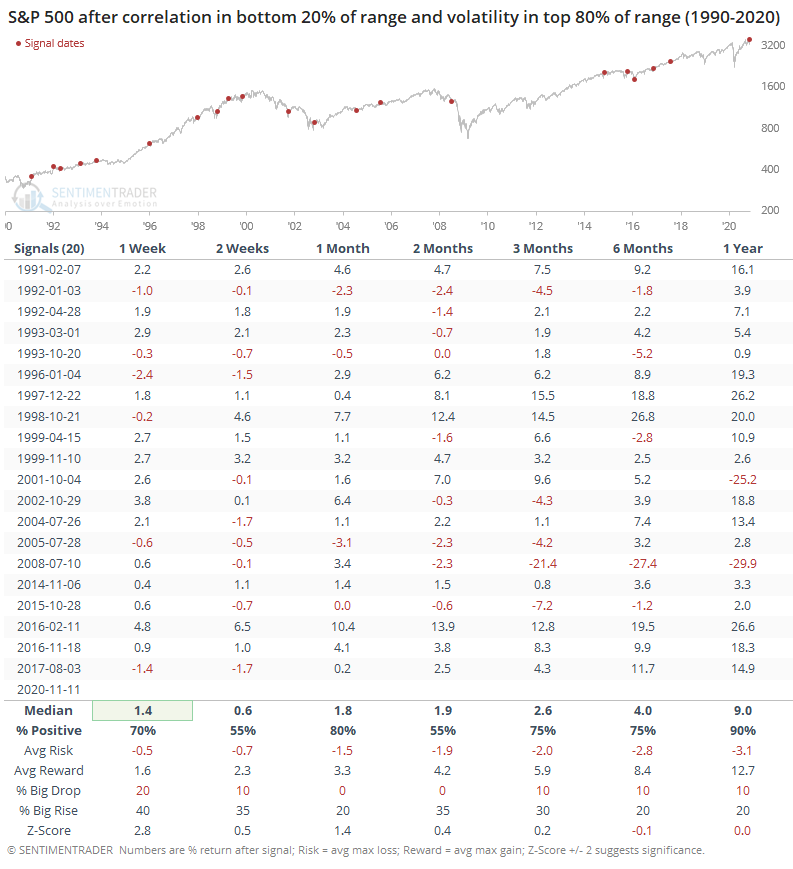
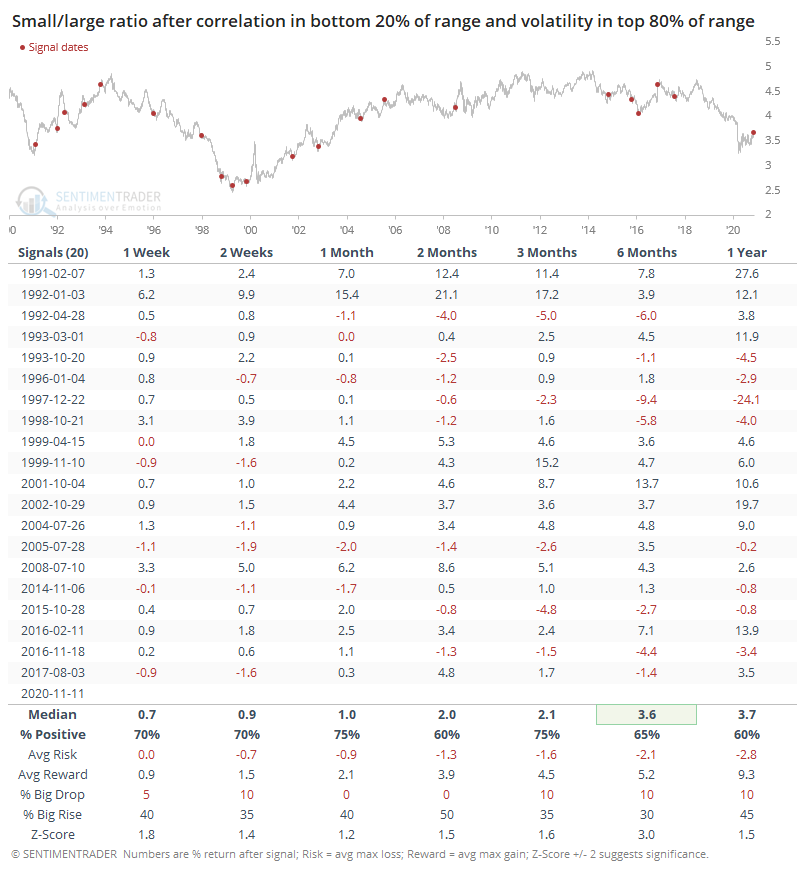
This phenomenon is likely mostly triggered by smaller stocks within the index suddenly becoming more volatile. And, for the most part, that was a good sign for those smaller stocks. Look at the Russell 2000's returns after those same signals.
This means the ratio of small to large stocks typically rose.
The thrusts in breadth and violent rotation in left-behind sectors over the past 1-2 weeks has been historic, and that has preceded even-higher prices over the medium- to long-term with consistency, especially for many of those formerly left-behind factors. This drop in correlation even with increased volatility is another modest sign that perhaps this rotation is more likely to stick around.
BOTTOM LINE
The energy sector is trying to change it long-term trend, with the S&P 500 Energy index closing in on its 200-day average for the first time in almost a year, and after suffering its worst-ever spread against that average.
FORECAST / TIMEFRAME
None
|
During September and October, we looked at several ways in which the energy sector was perhaps the most-hated out of all sectors of all time (here, here, and here).
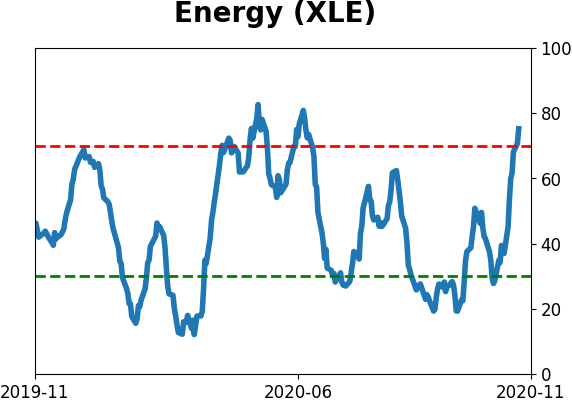
They've benefitted from the relief rally over the past two weeks and the S&P 500 Energy Sector index is even on the cusp of rising above its 200-day average. It's not *quite* there, and the previous attempt in June was handily rejected, but some popular funds like XLE have already moved above their average.
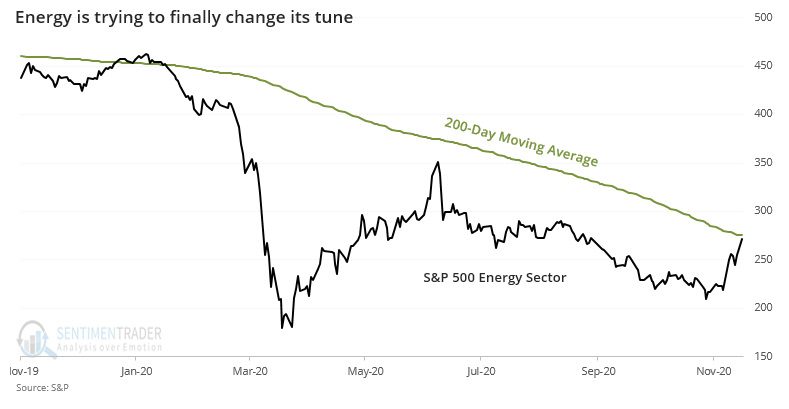
For the S&P 500 Energy Sector index, if it's able to follow through like XLE, then this would end one of the longest periods below its 200-day average in history. And it would completely retrace its worst-ever spread against its average. At its worst point, the sector was nearly 60% below its 200-day average, worse even than the drubbings in the 1930s.
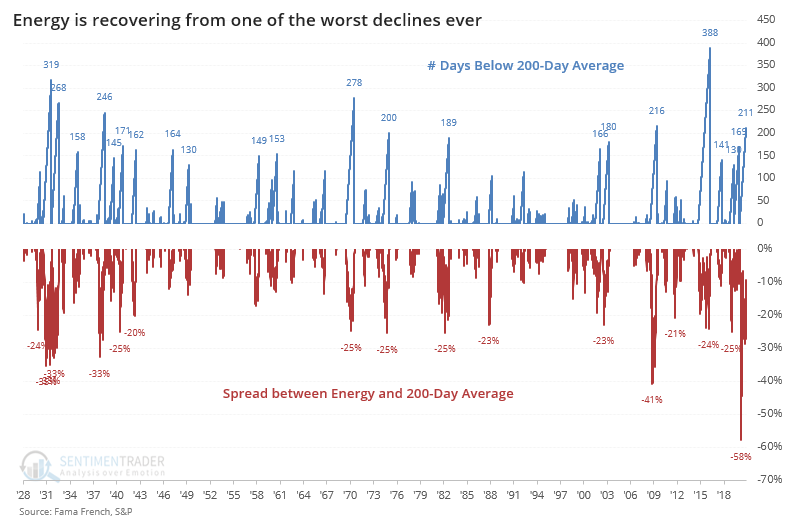
Other times it recovered like this proved to be a good sign going forward. The only real failure was the last signal in April 2019, which was rejected immediately.
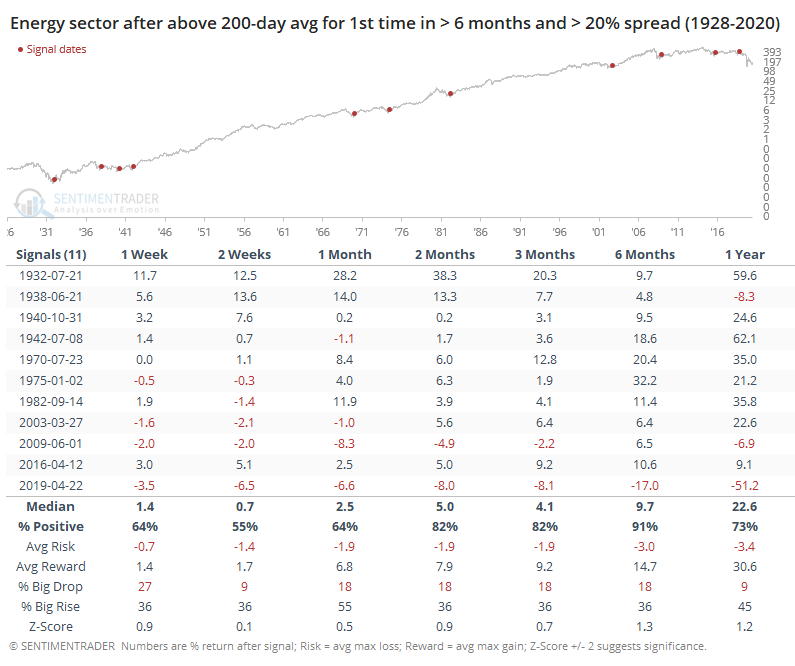
Investors have been looking for a long time for signs of capitulation and then recovery in some of these stocks. There is a compelling argument to be made that the former was achieved, and the latter is showing impressive progress. While there have been many fakeouts over the years, the depths of the latest decline and magnitude of the most recent recovery suggest that the probability is higher that this one should stick. If the energy index can reclaim its 200-day average in the coming days, and especially if buyers show enough interest to allow some upside follow-though, it bodes very well for further medium- to long-term gains.
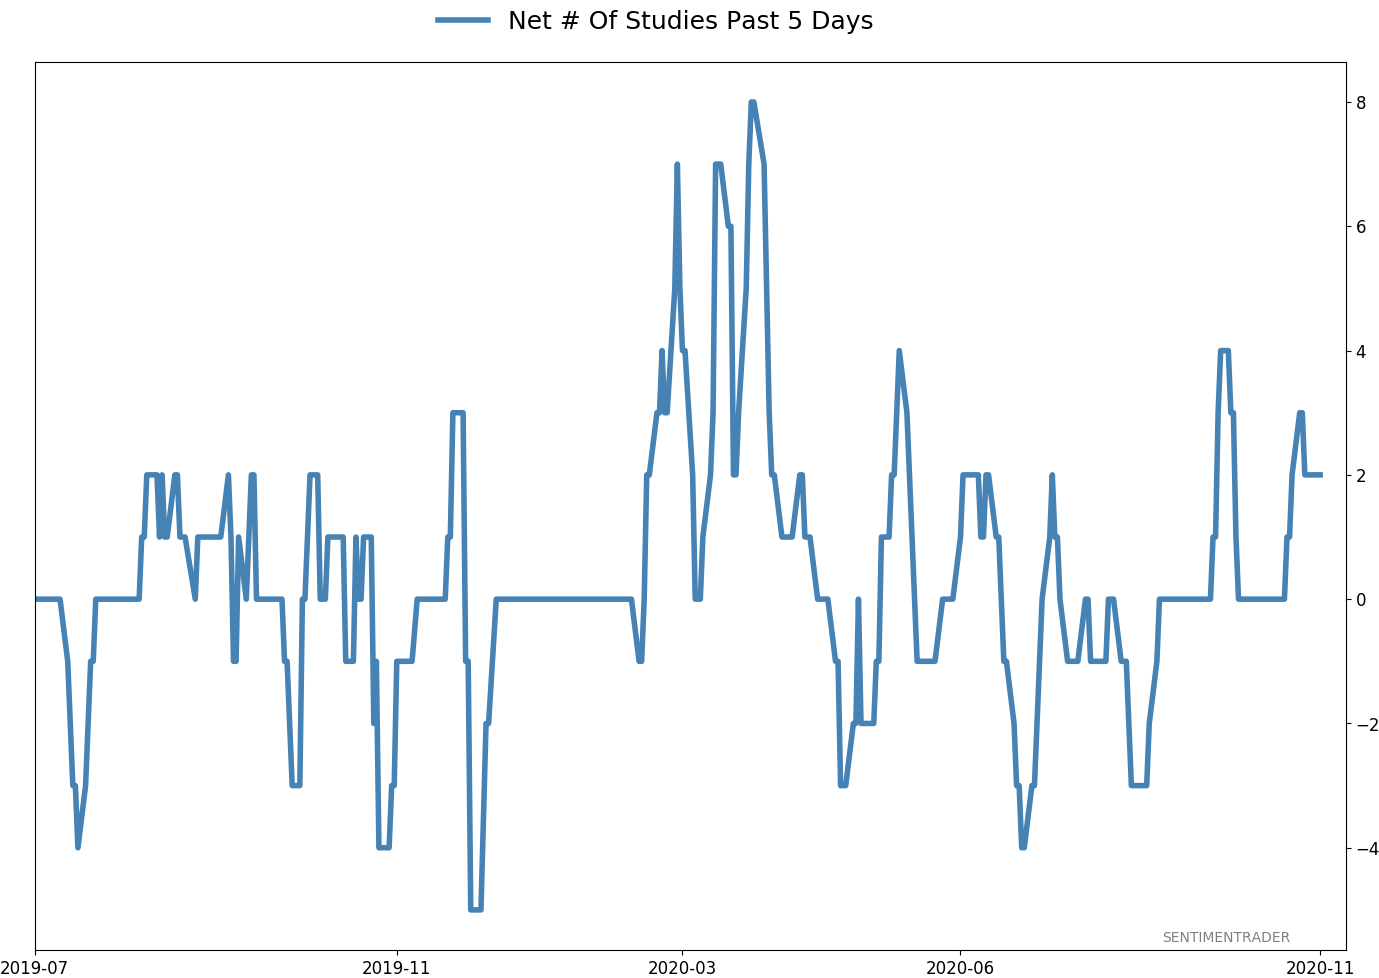
Active Studies
| Time Frame | Bullish | Bearish | | Short-Term | 0 | 0 | | Medium-Term | 5 | 8 | | Long-Term | 51 | 2 |
|
Indicators at Extremes
% Showing Pessimism: 3%
Bullish for Stocks
VIX
|
|
Portfolio
| Position | Description | Weight % | Added / Reduced | Date | | Stocks | 15.6% RSP, 10.1% VWO, 7.5% XLE, 5.1% PSCE | 38.2 | Added 5% | 2020-10-15 | | Bonds | 10% BND, 10% SCHP, 10% ANGL | 29.7 | Reduced 0.1% | 2020-10-02 | | Commodities | GCC | 2.4 | Reduced 2.1%
| 2020-09-04 | | Precious Metals | GDX | 4.7 | Added 5% | 2020-09-09 | | Special Situations | | 0.0 | Reduced 5% | 2020-10-02 | | Cash | | 25.0 | | |
|
Updates (Changes made today are underlined)
After the September swoon wrung some of the worst of the speculation out of stocks, there are some signs that it's returning, especially in the options market. It's helped to push Dumb Money Confidence above 70%. A big difference between now and August is that in August, there was a multitude of days with exceptionally odd breadth readings. Some of the biggest stocks were masking underlying weakness. Combined with heavy speculative activity, it was a dangerous setup. Now, we've seen very strong internal strength, in the broad market, as well as tech and small-cap stocks. Prior signals almost invariably led to higher prices. That's hard to square with the idea that forward returns tend to be subdued when Confidence is high, but that's less reliable during healthy market conditions, which we're seeing now (for the most part). I added some risk with small-cap energy stocks, due to an increasing number of positive signs in both small-caps and energy. This is intended as a long-term position.
RETURN YTD: 4.1% 2019: 12.6%, 2018: 0.6%, 2017: 3.8%, 2016: 17.1%, 2015: 9.2%, 2014: 14.5%, 2013: 2.2%, 2012: 10.8%, 2011: 16.5%, 2010: 15.3%, 2009: 23.9%, 2008: 16.2%, 2007: 7.8%
|
|
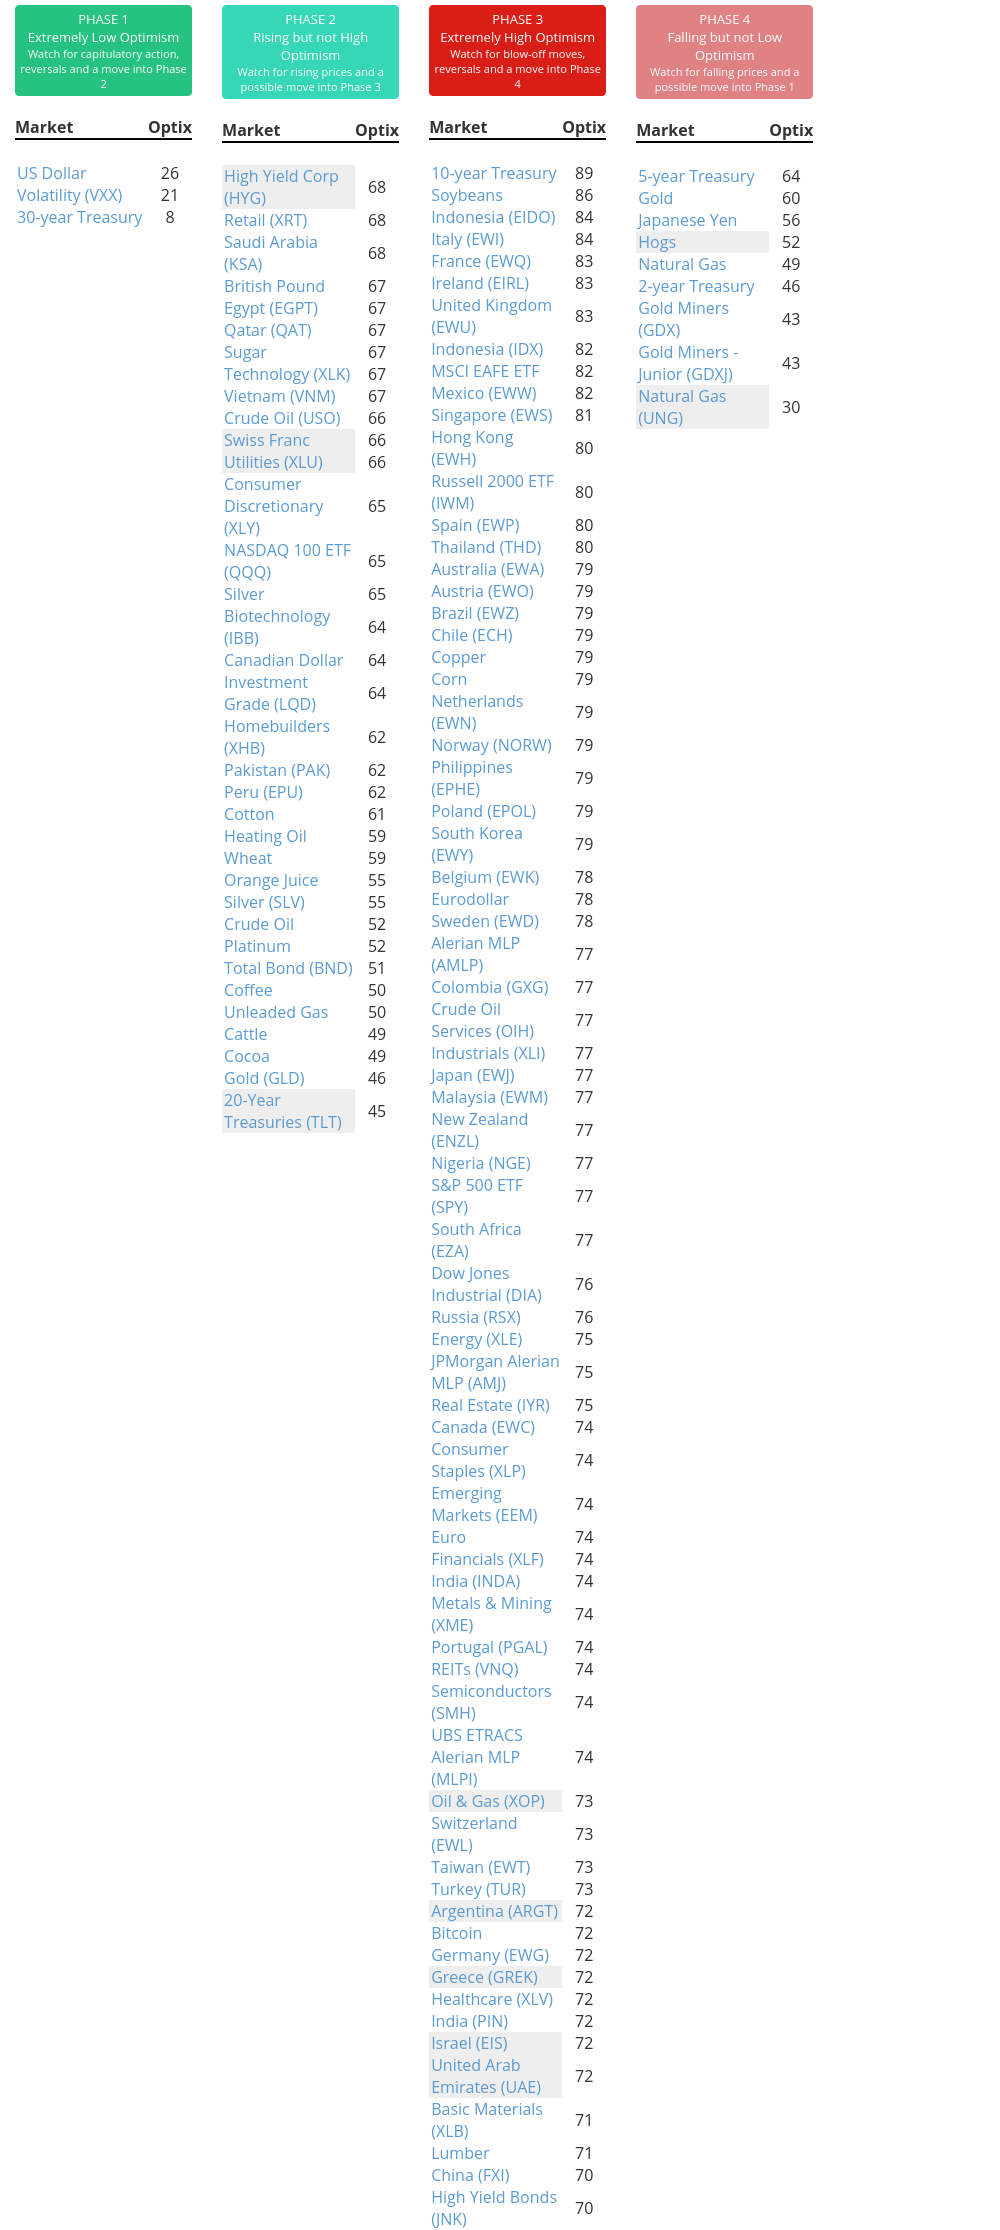
Phase Table
Ranks
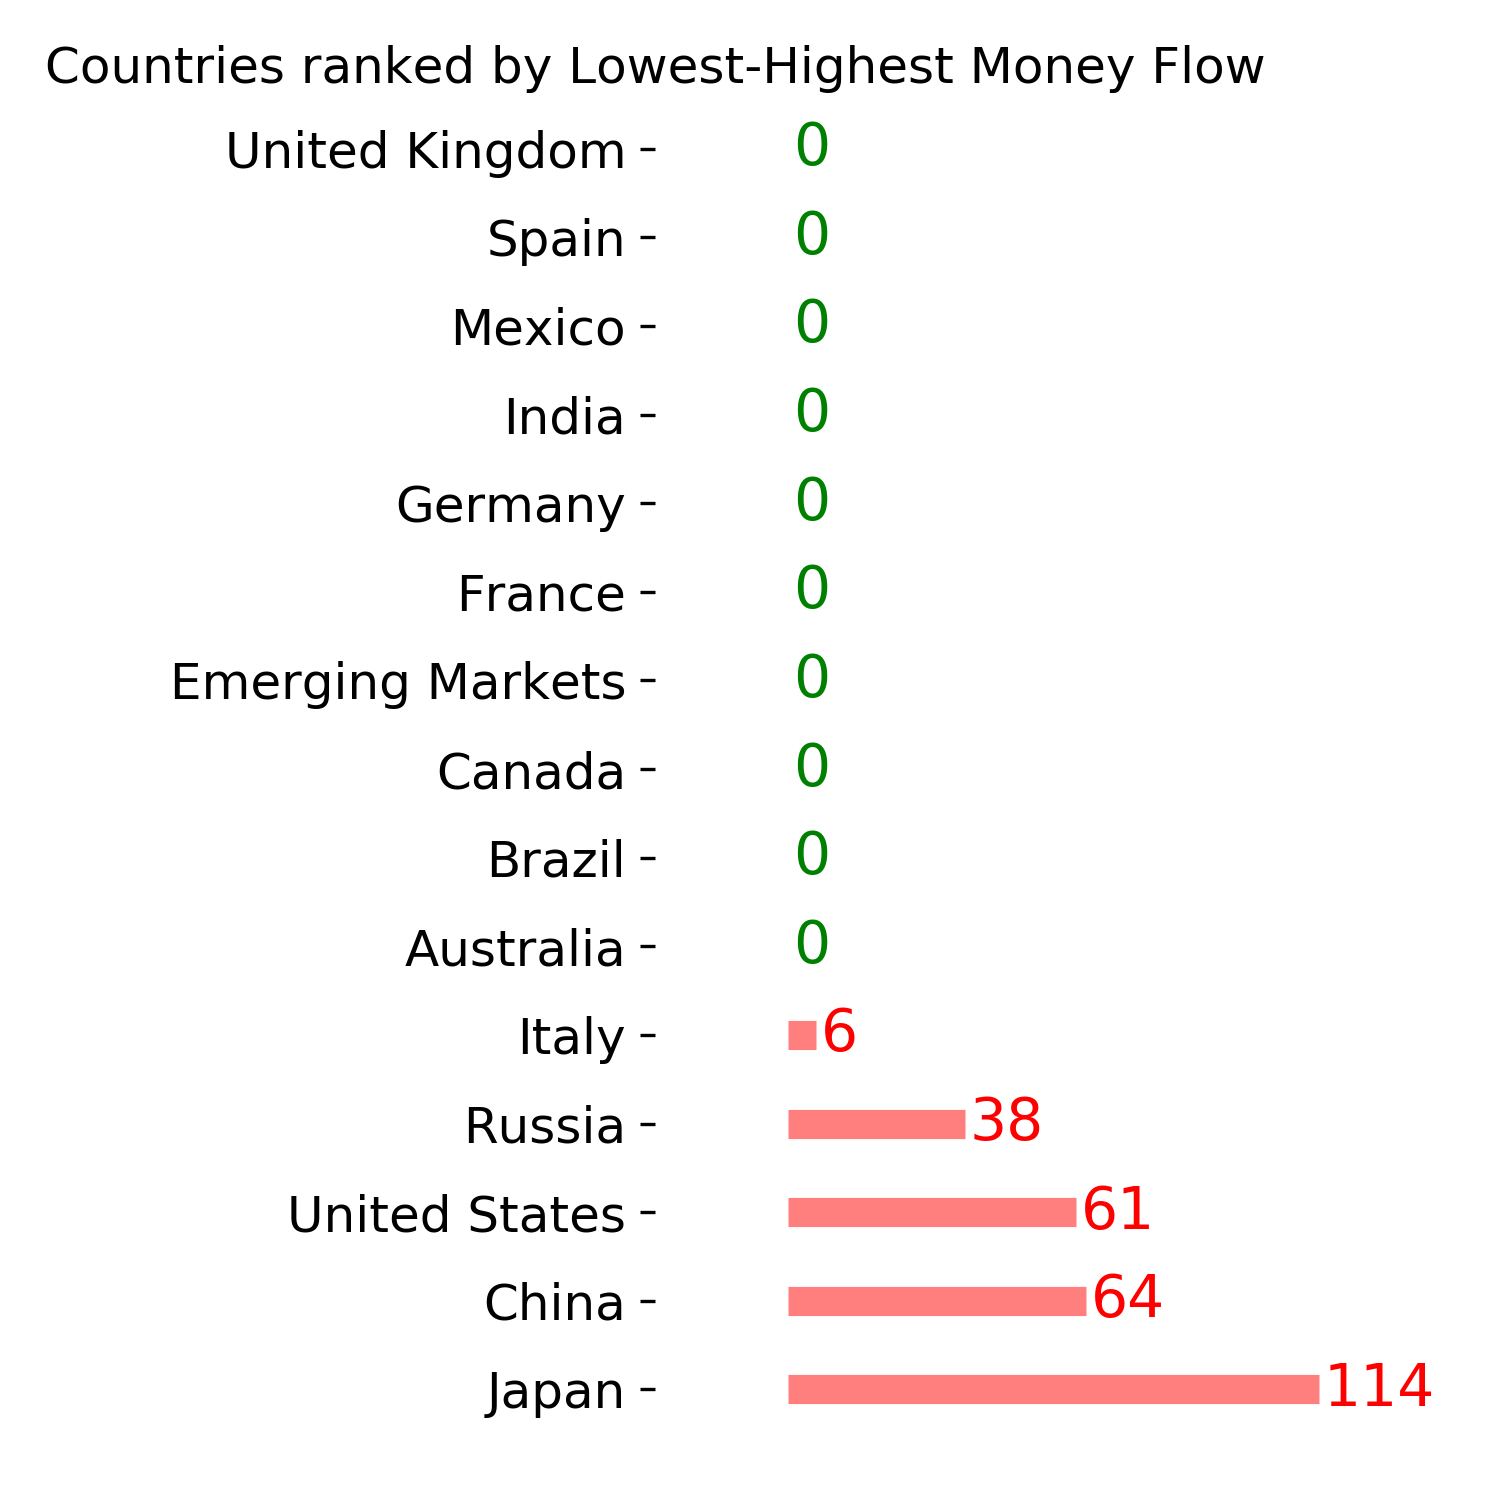
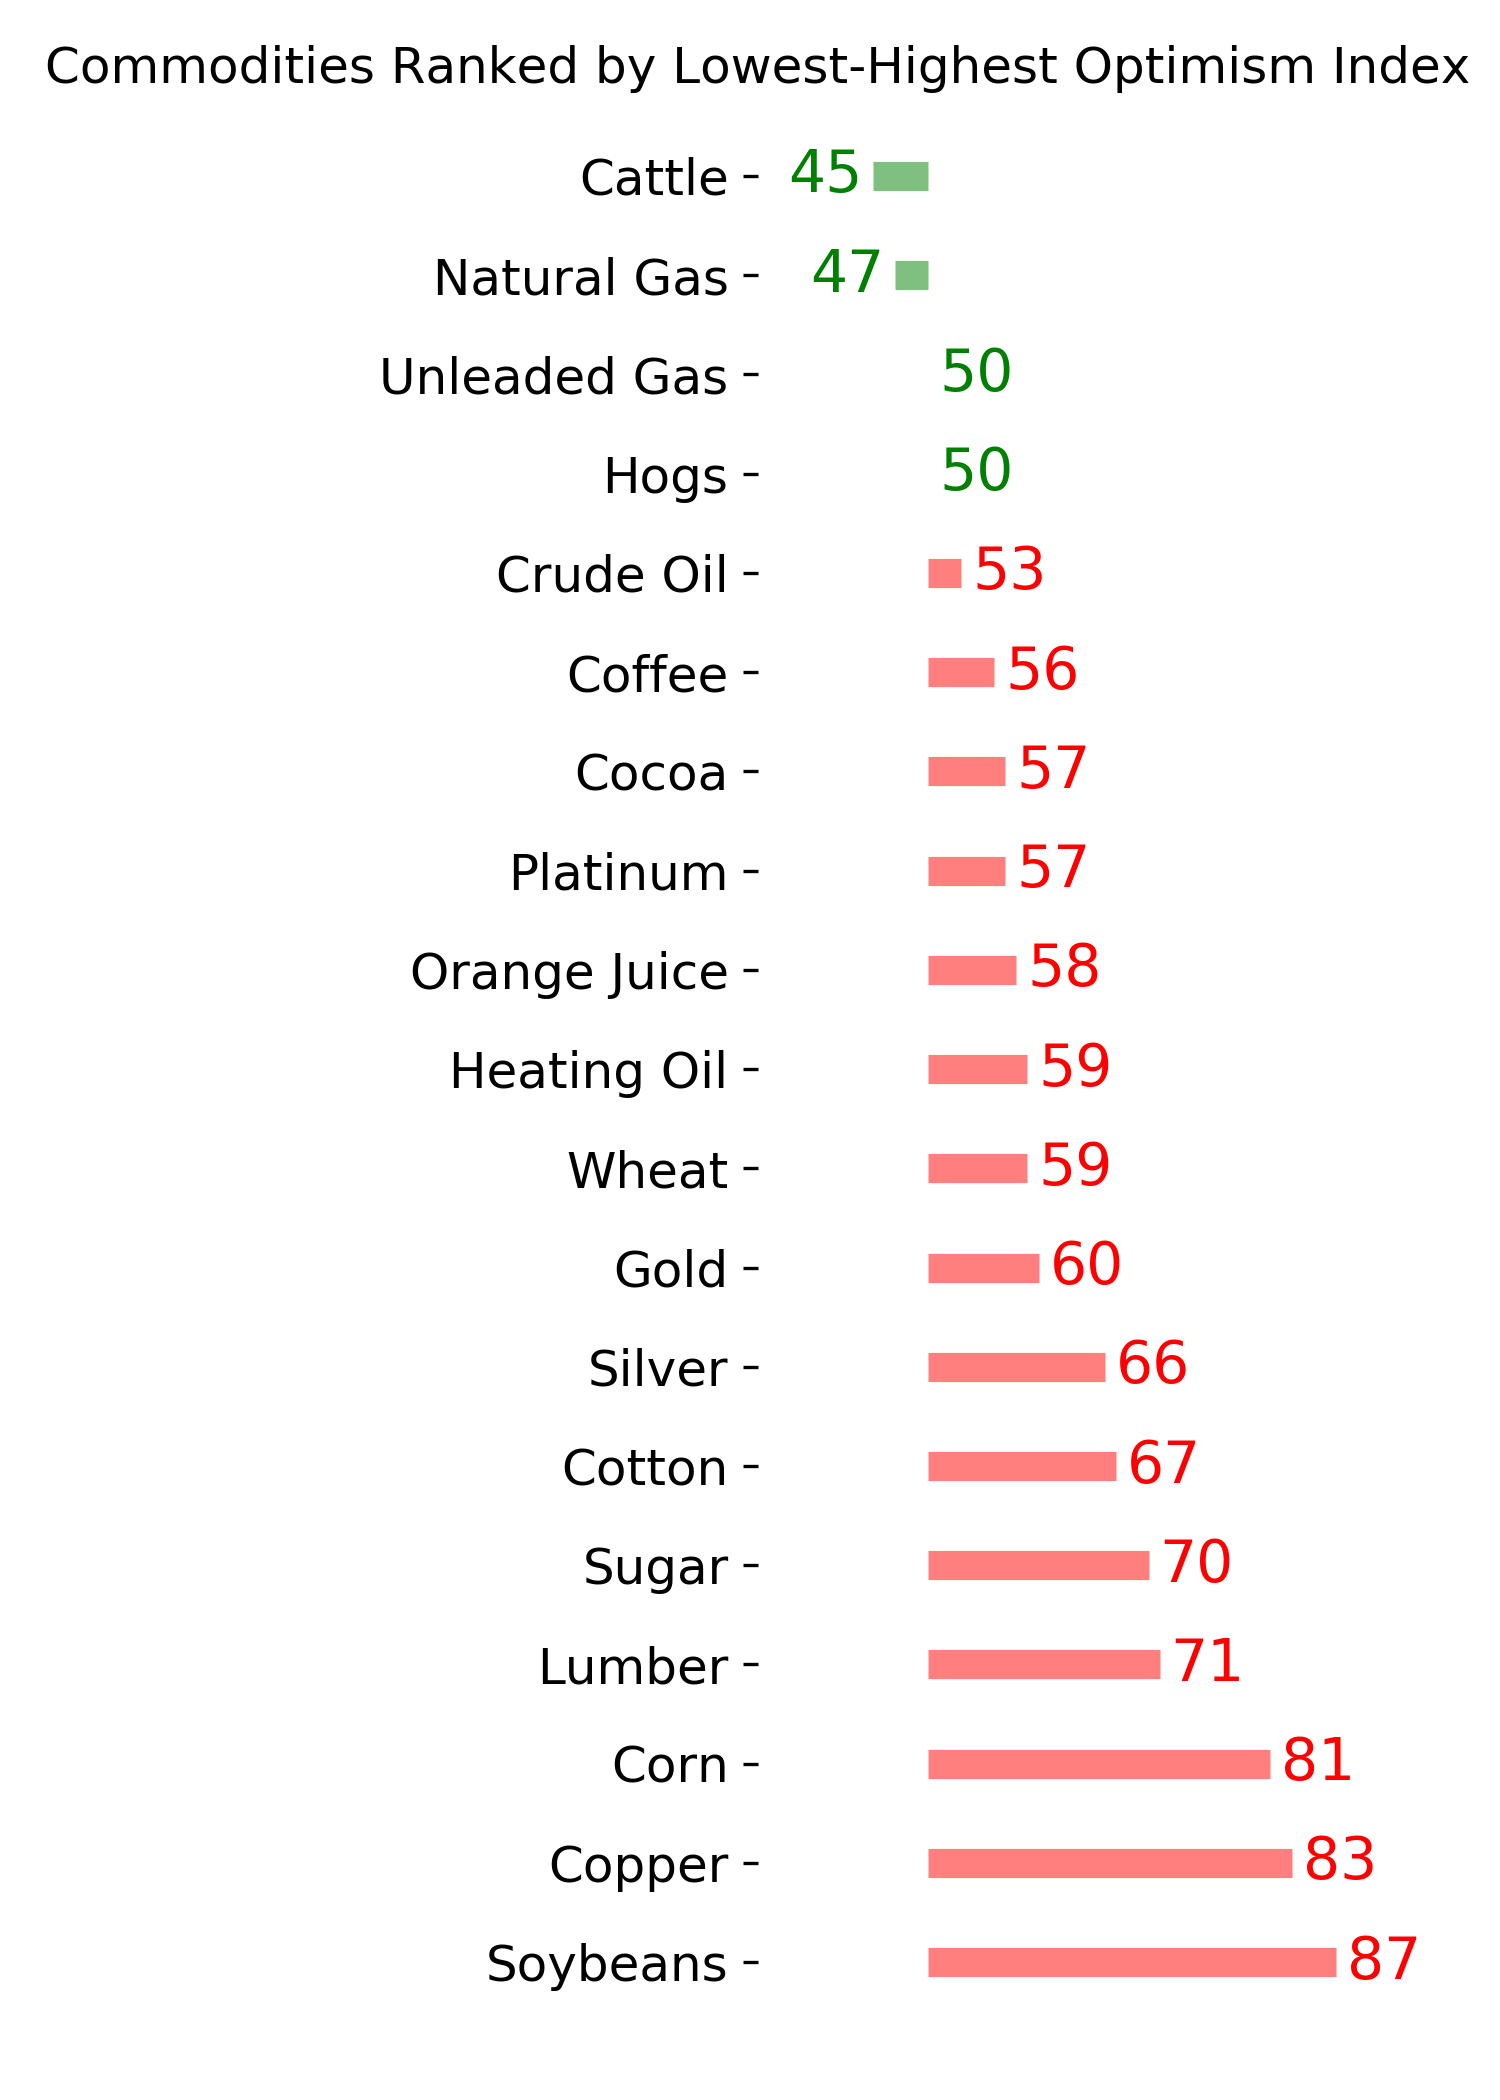
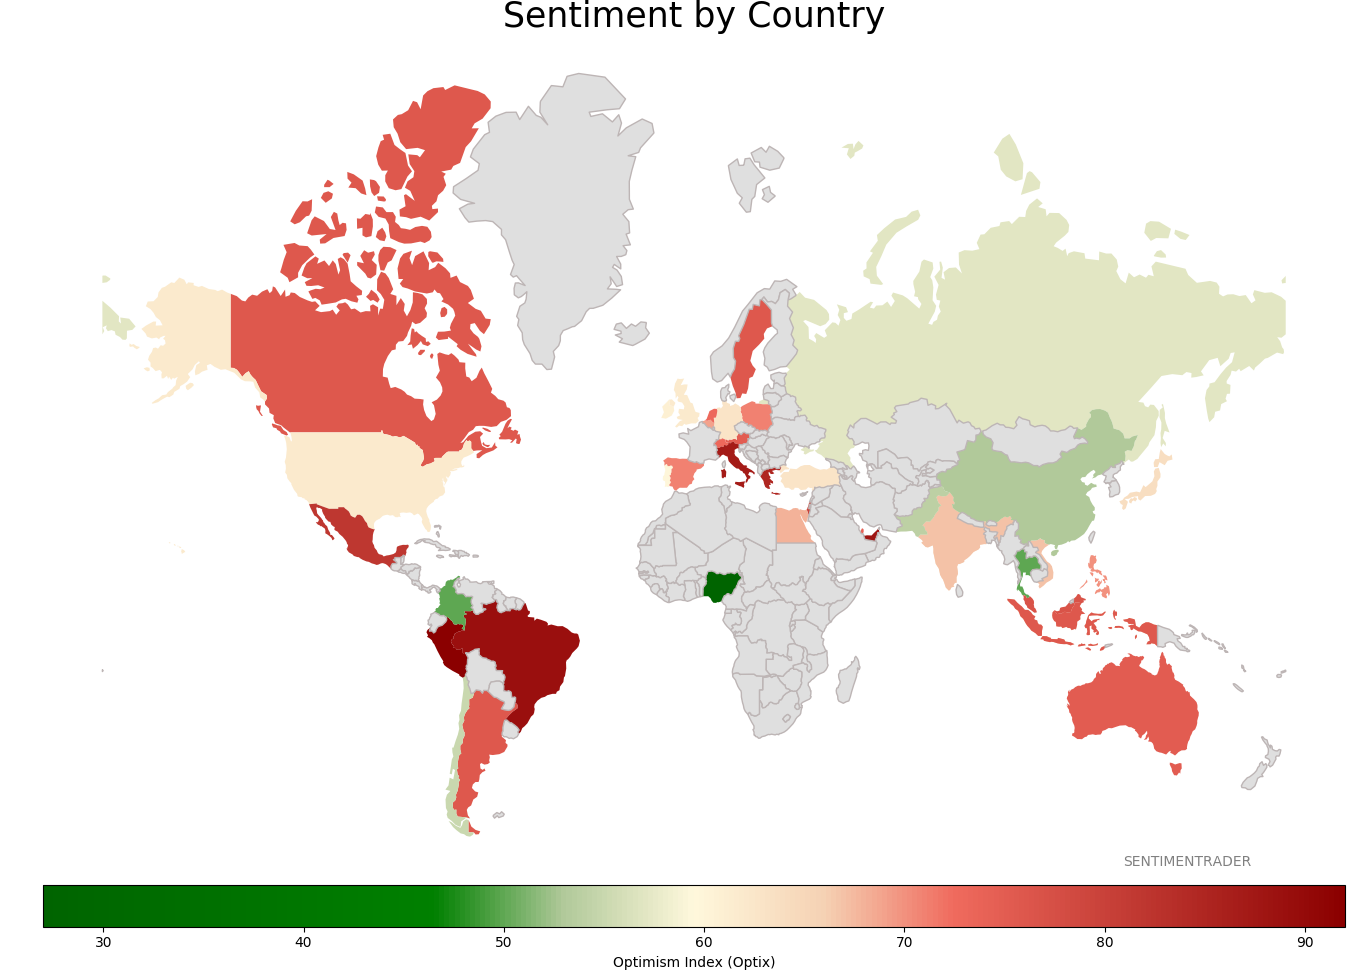
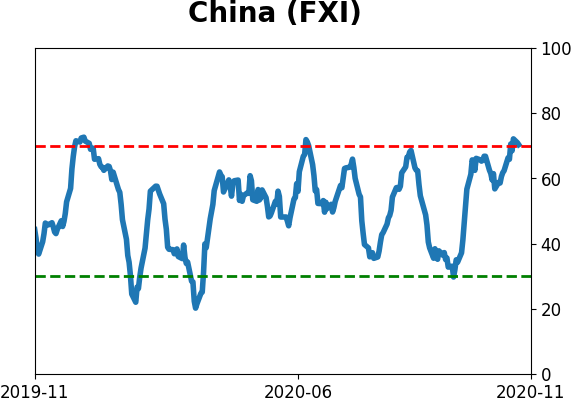
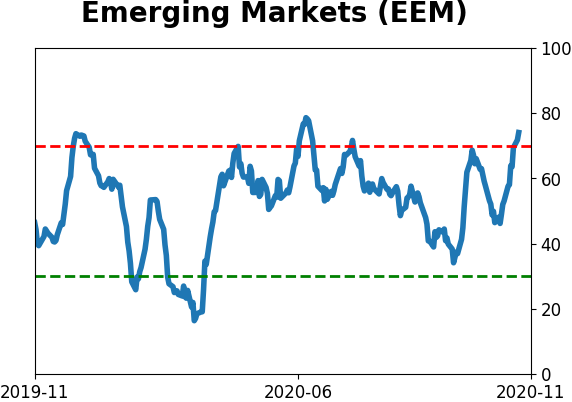
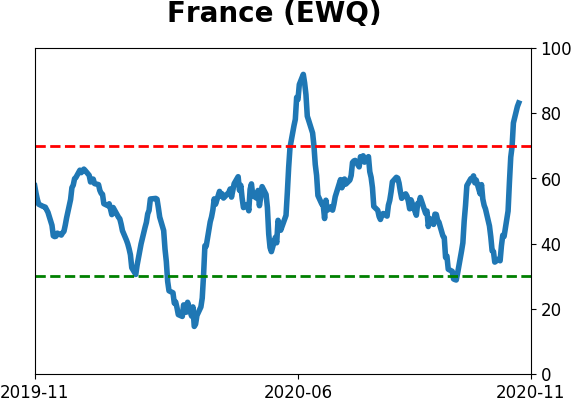
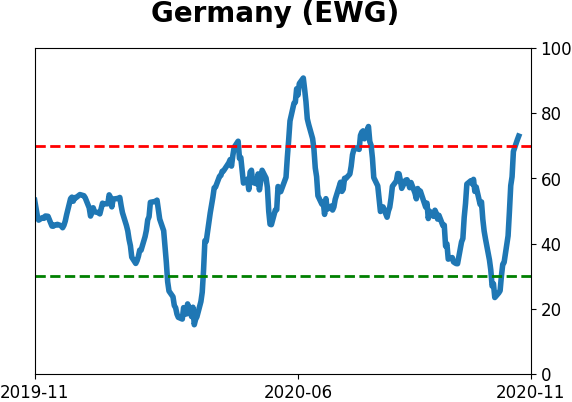
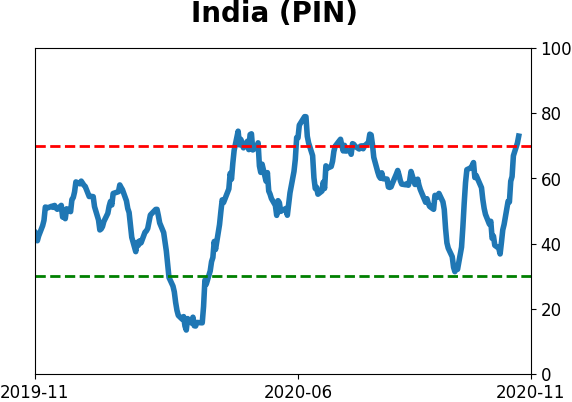
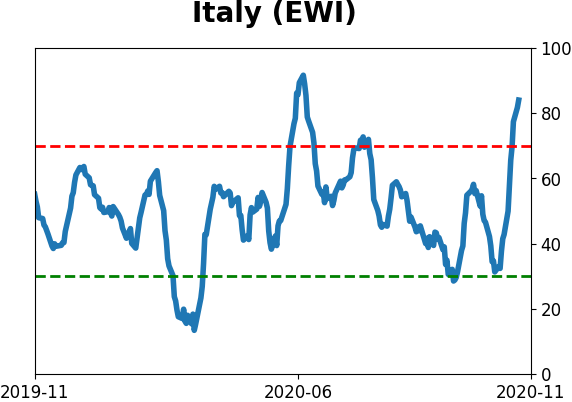
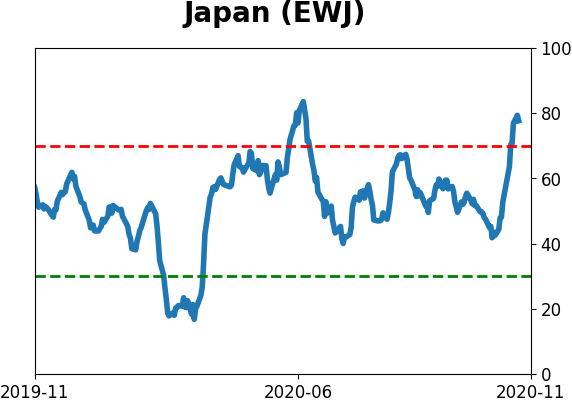
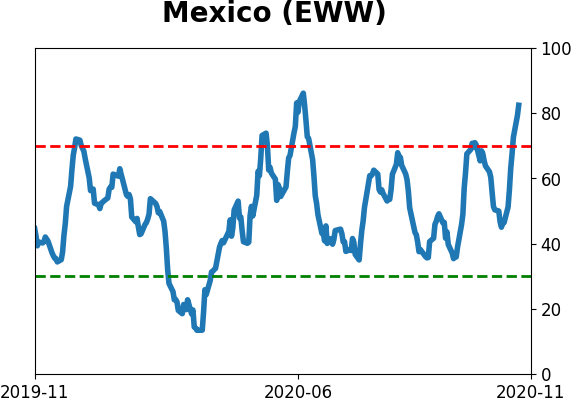
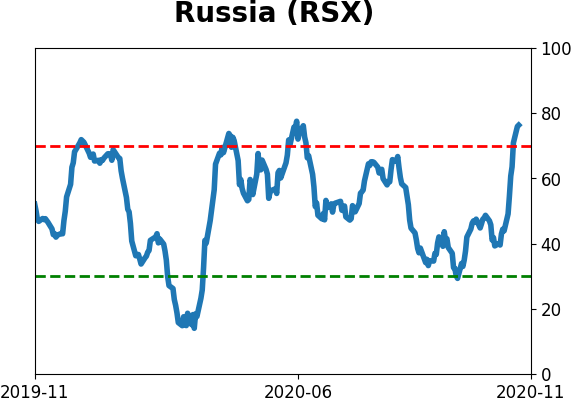
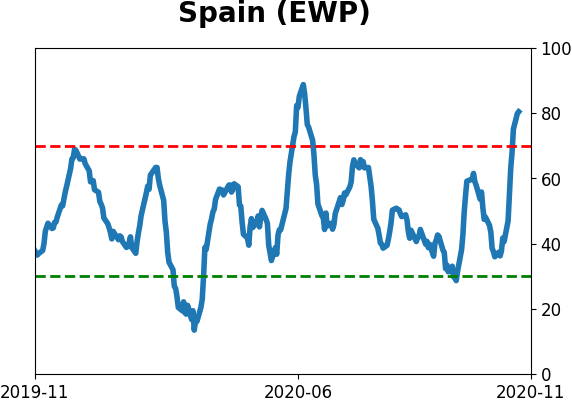
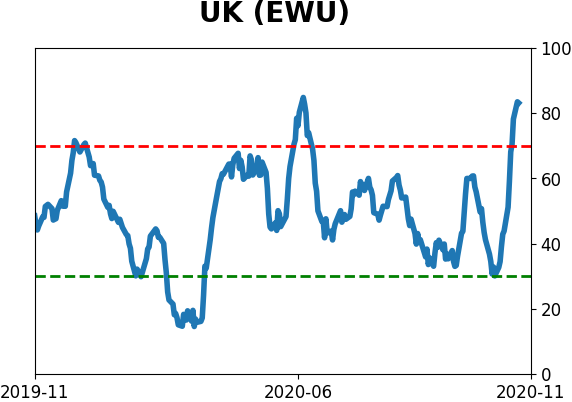
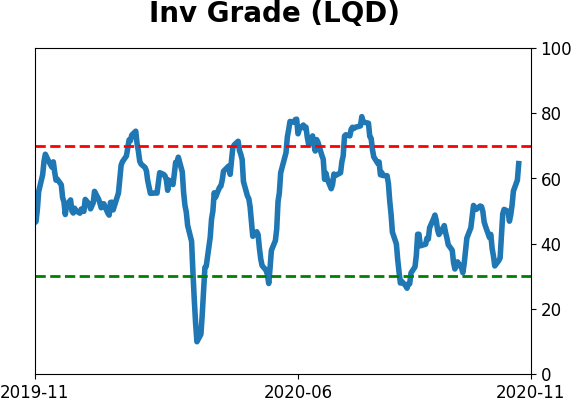
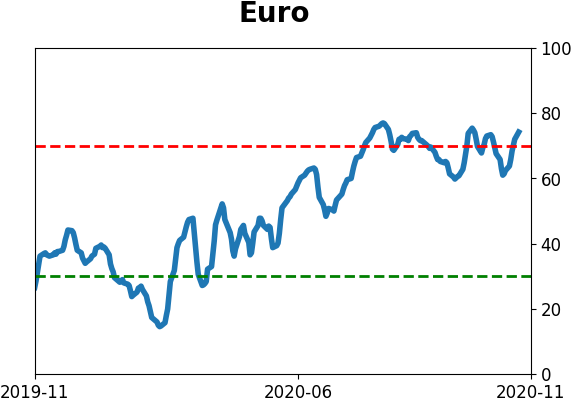
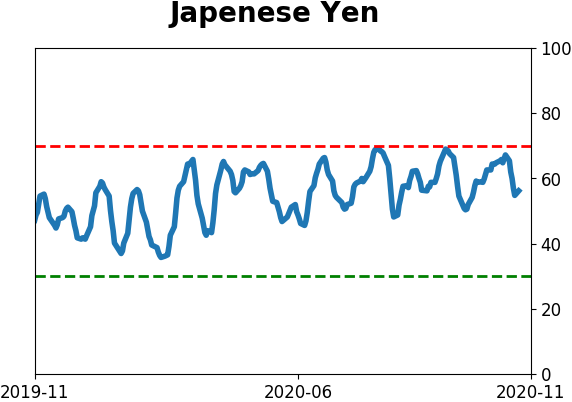
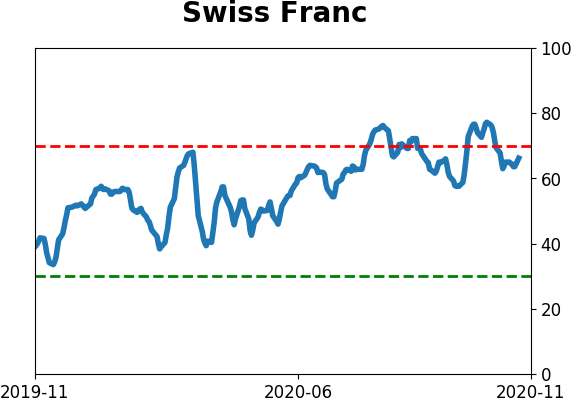
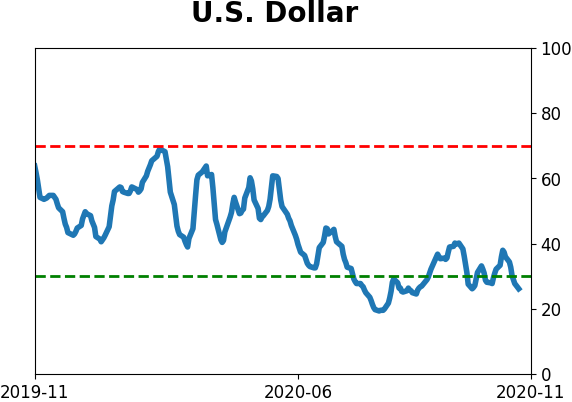
Sentiment Around The World
Optimism Index Thumbnails
|
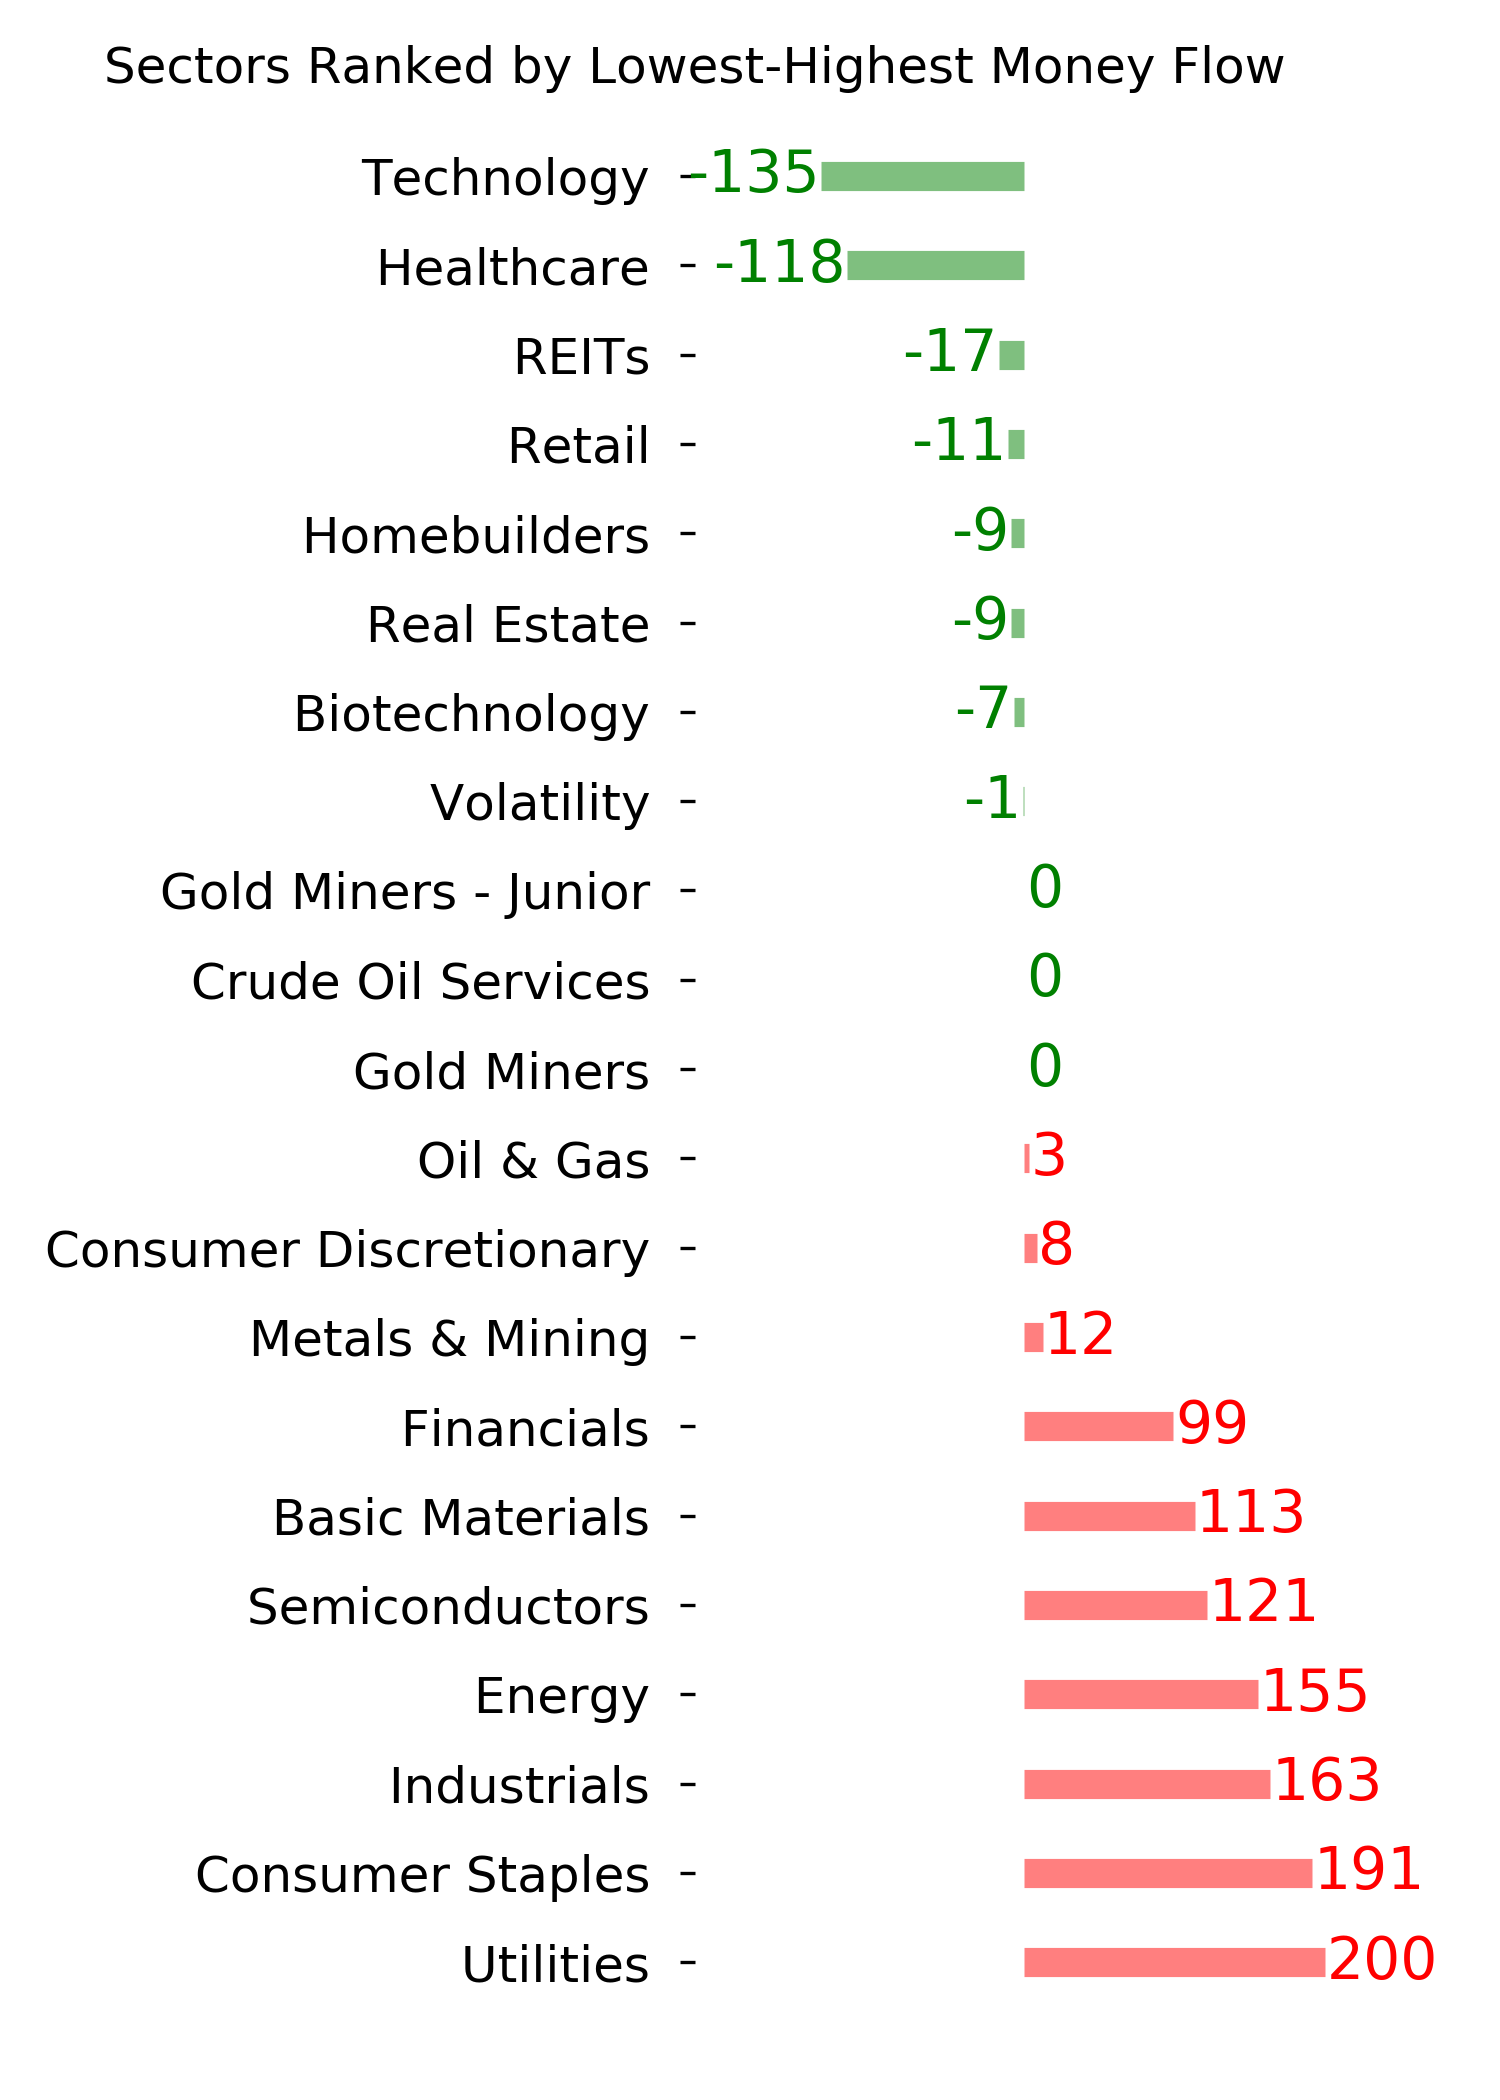
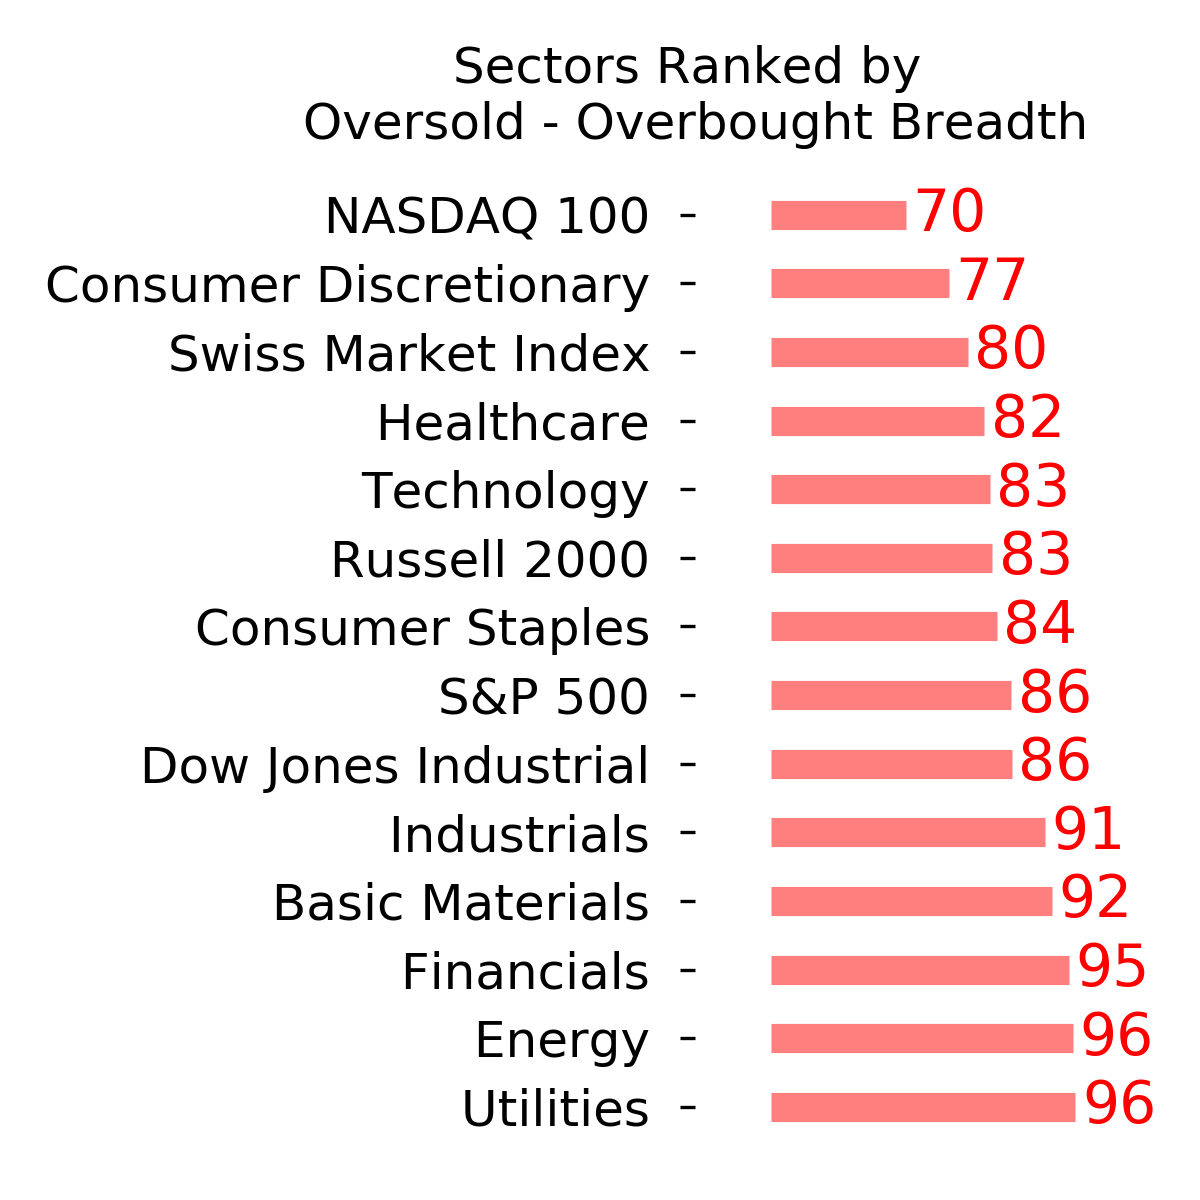
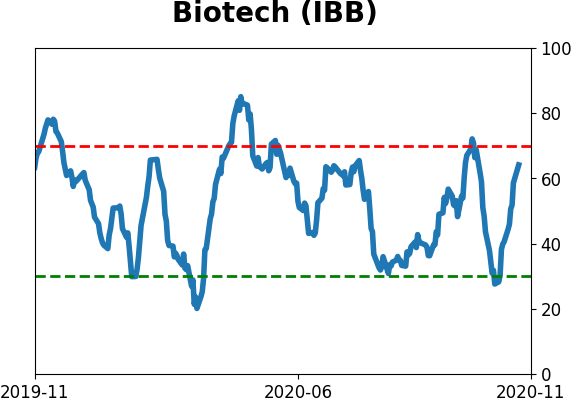
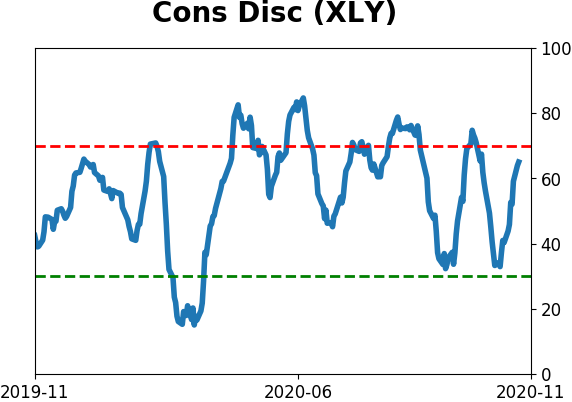
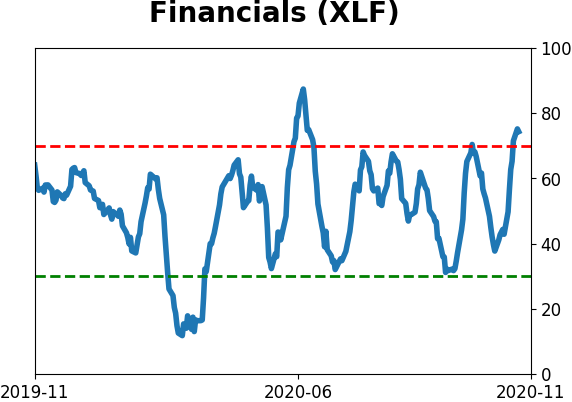
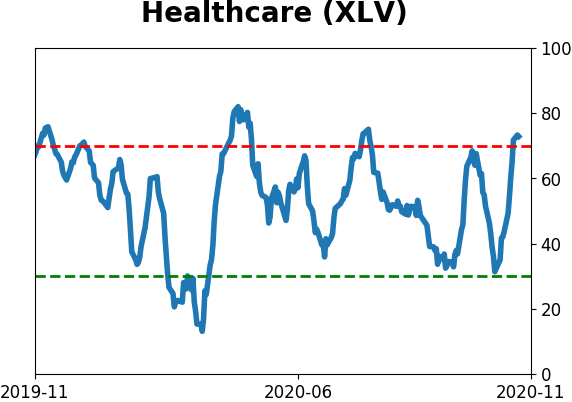
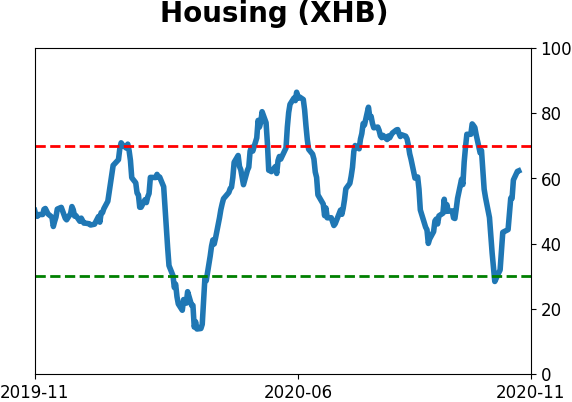
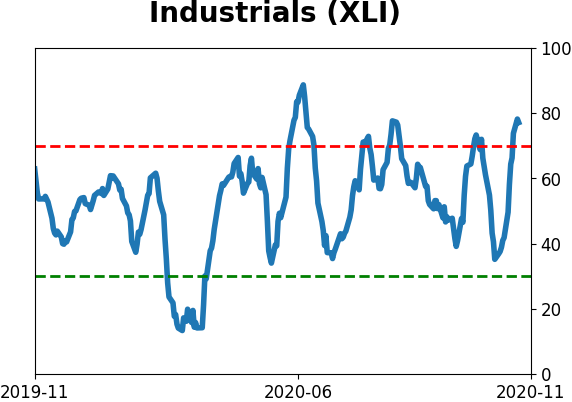
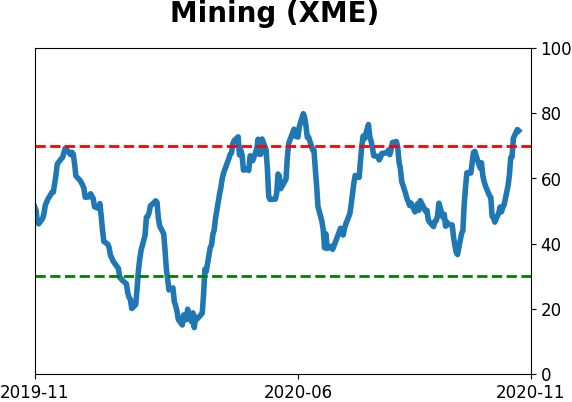
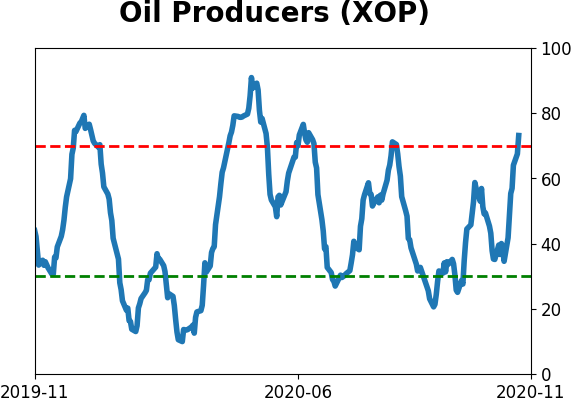
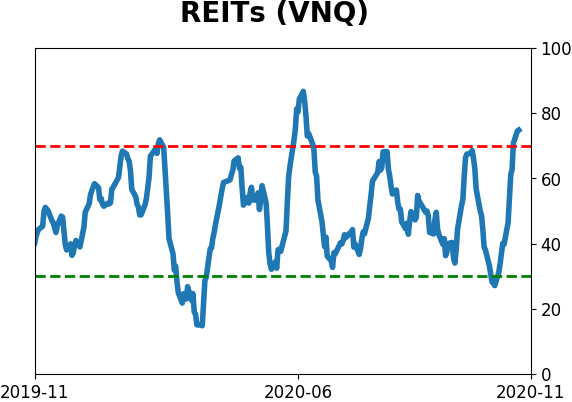
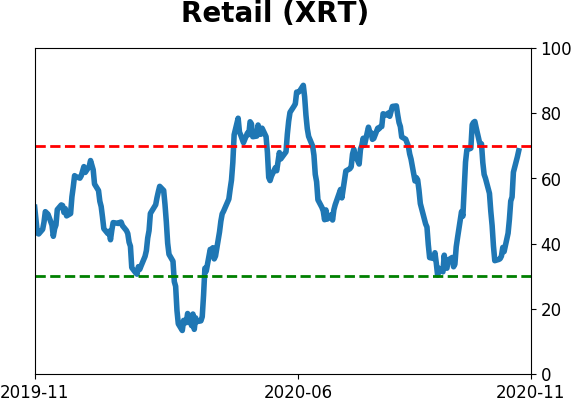
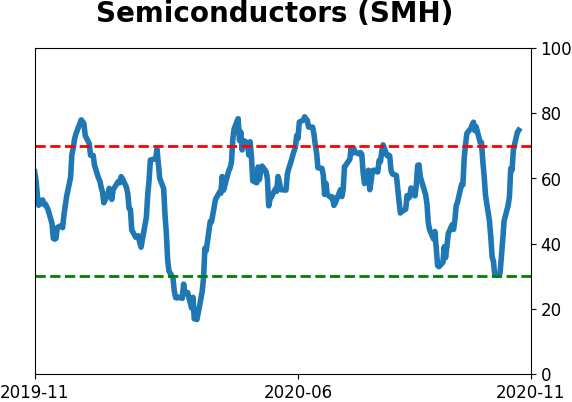
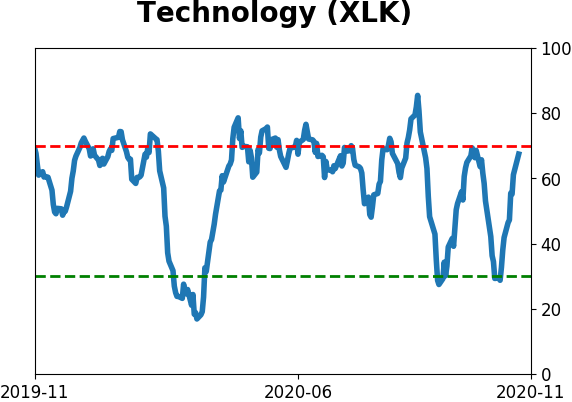
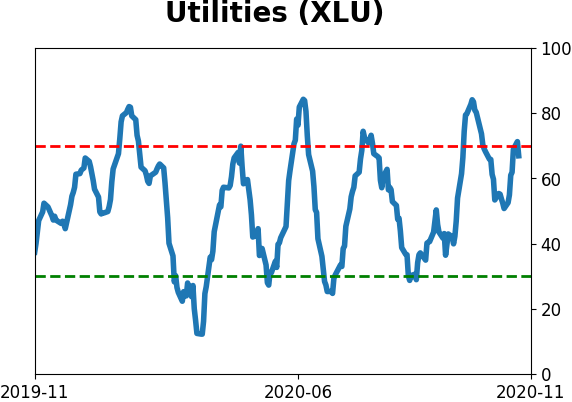
Sector ETF's - 10-Day Moving Average
|
|
|
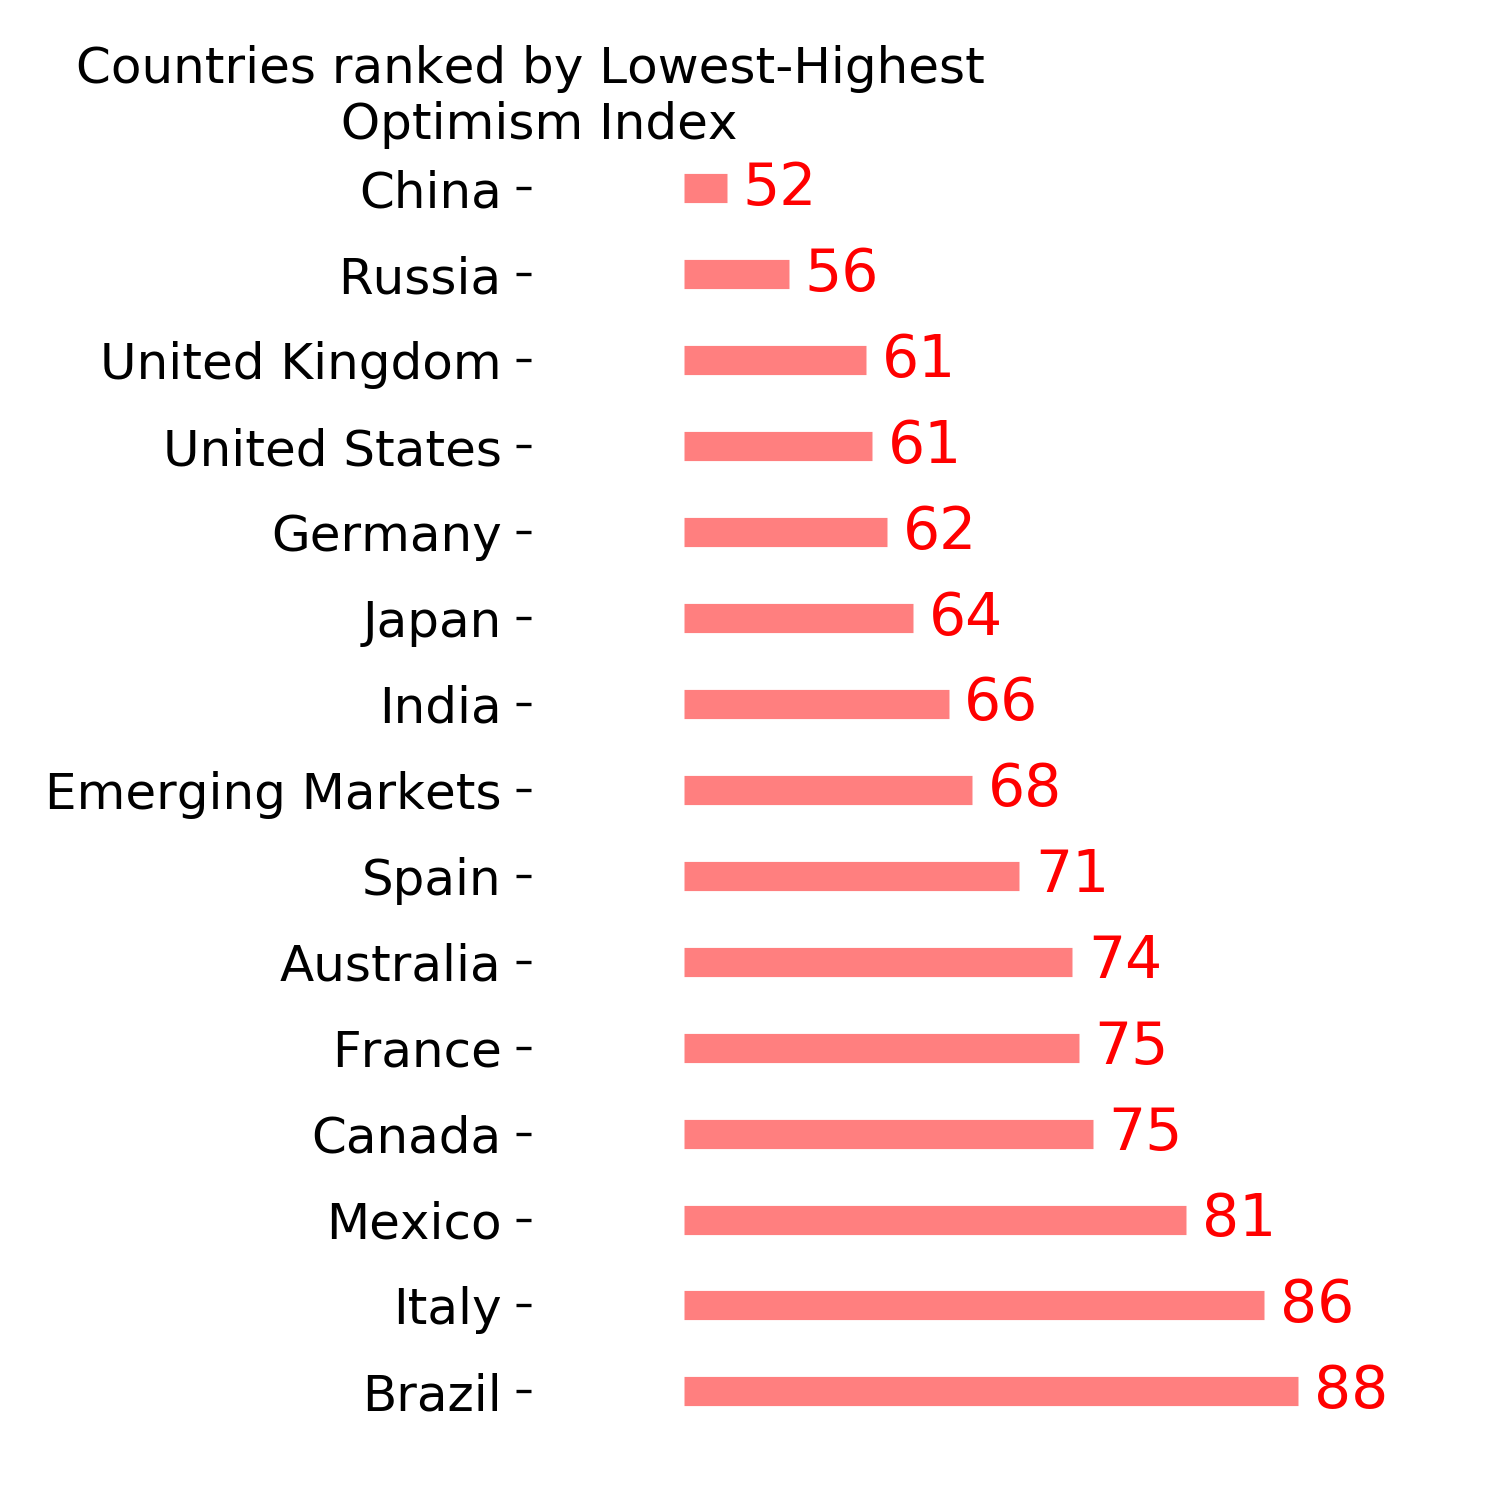
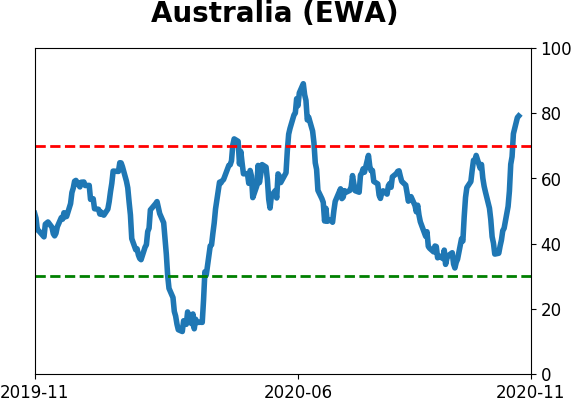
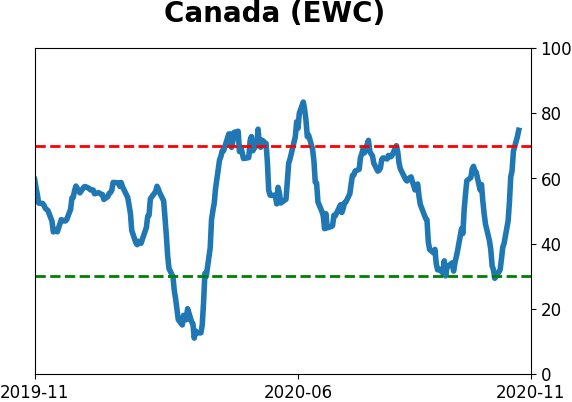
Country ETF's - 10-Day Moving Average
|
|
|
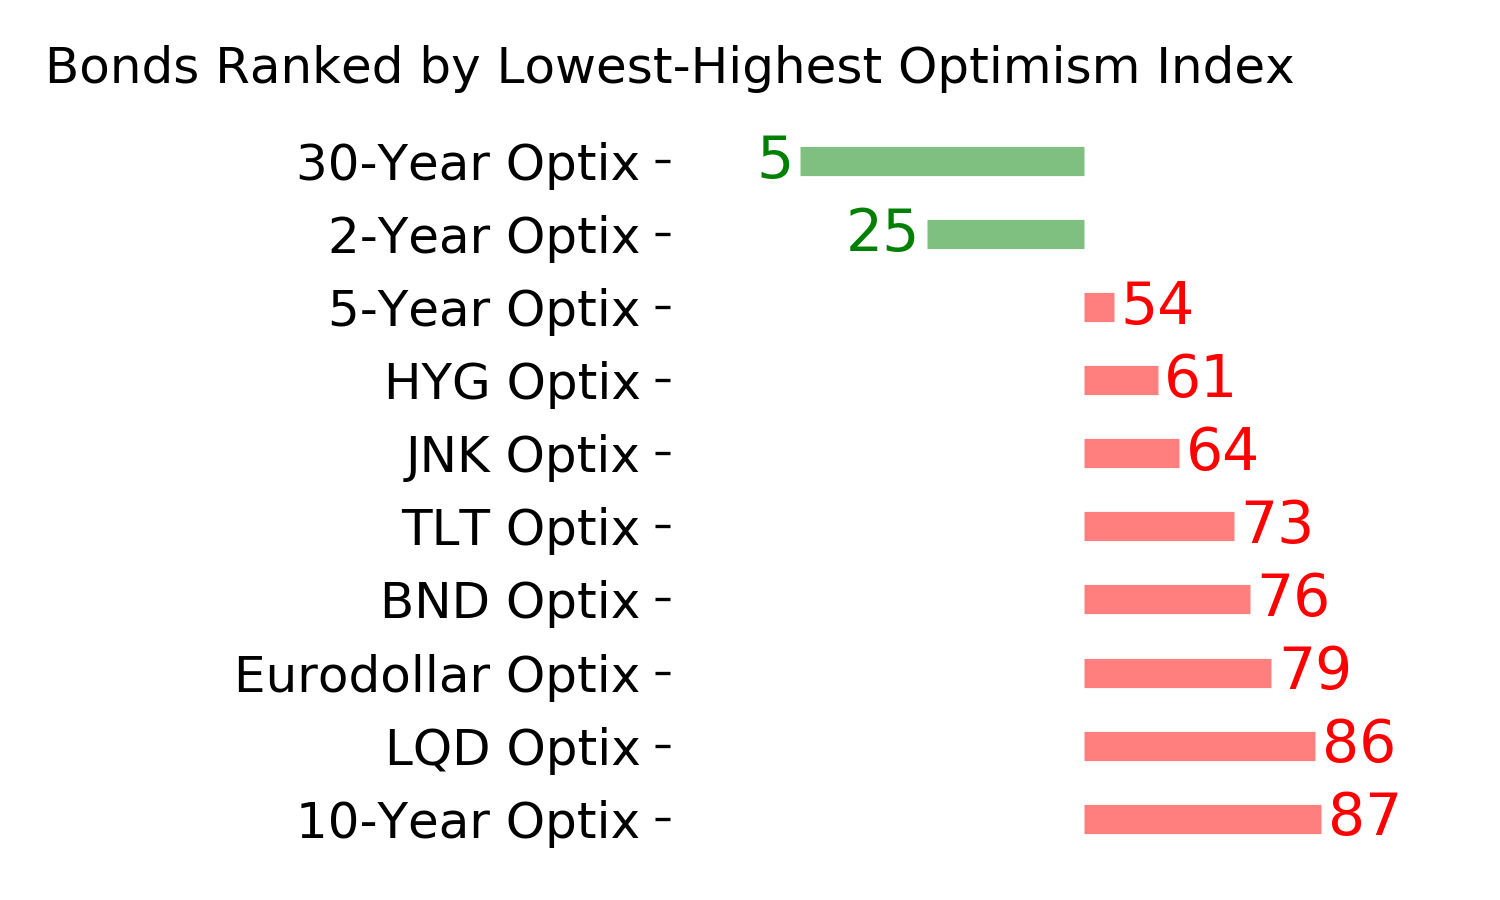
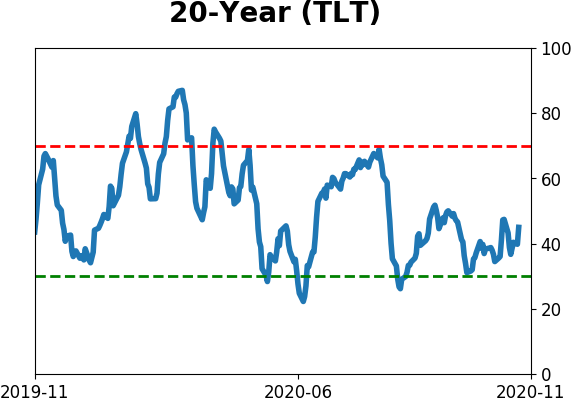
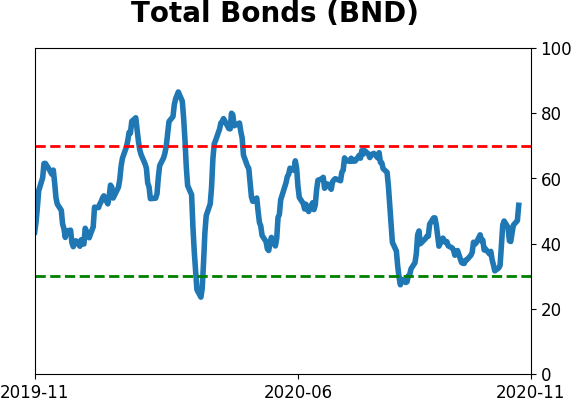
Bond ETF's - 10-Day Moving Average
|
|
|
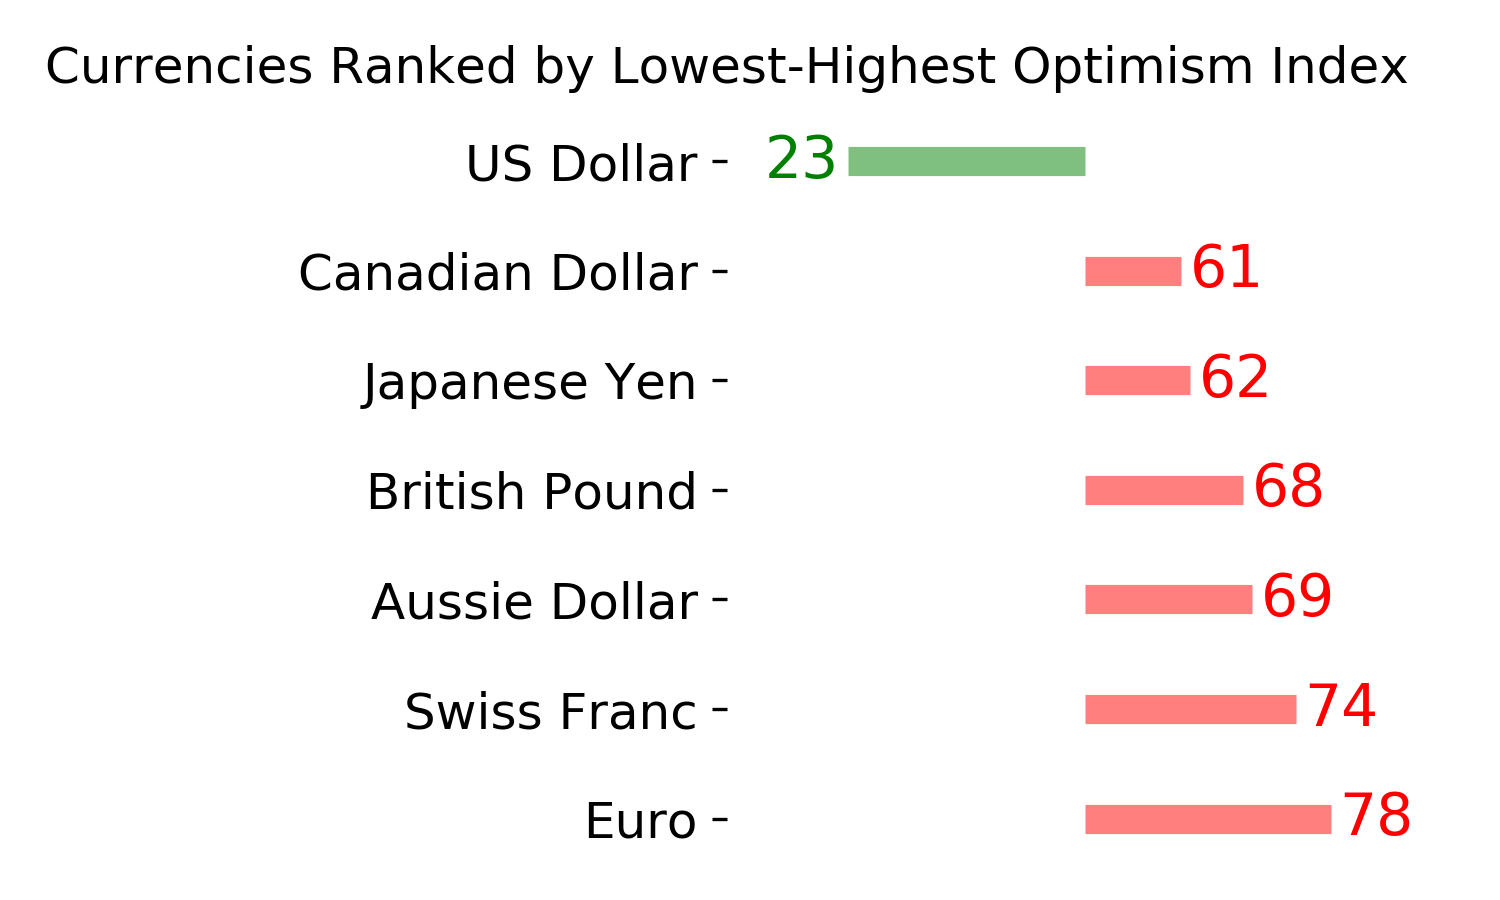
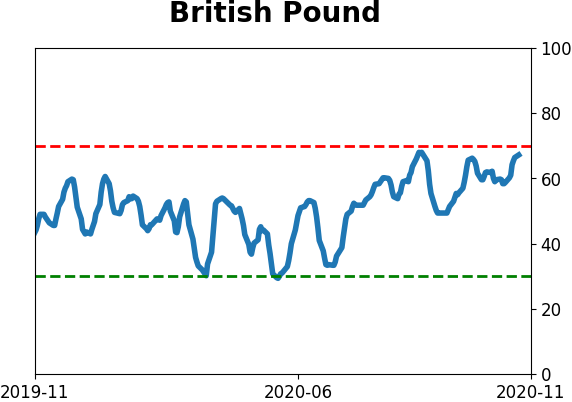
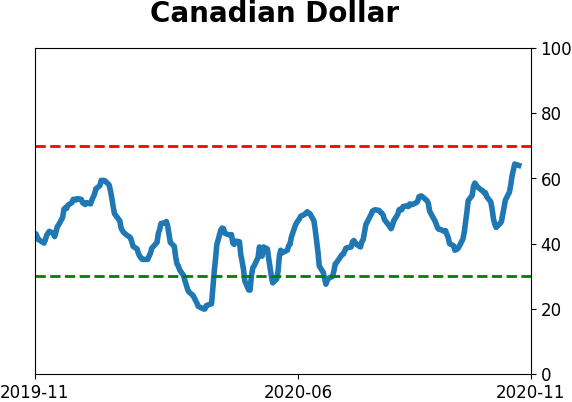
Currency ETF's - 5-Day Moving Average
|
|
|
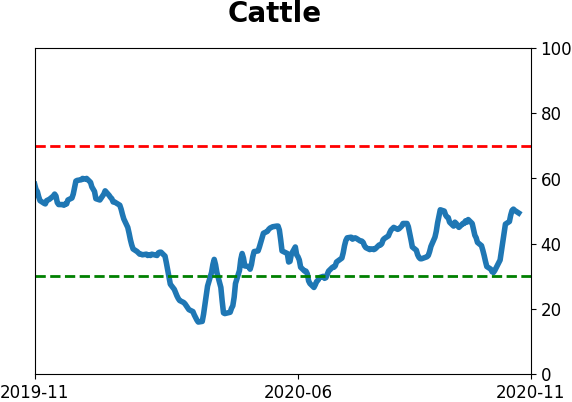
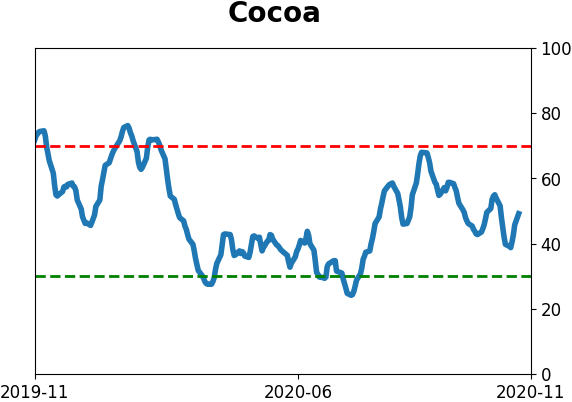
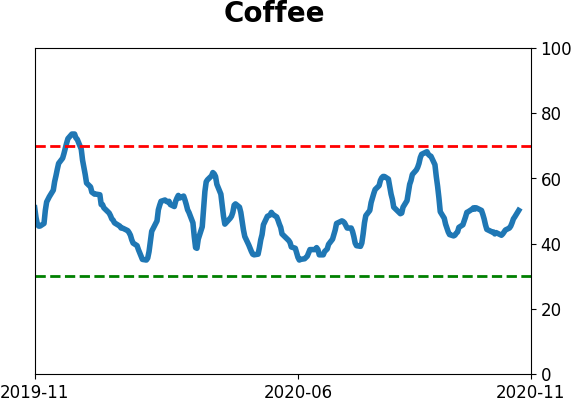
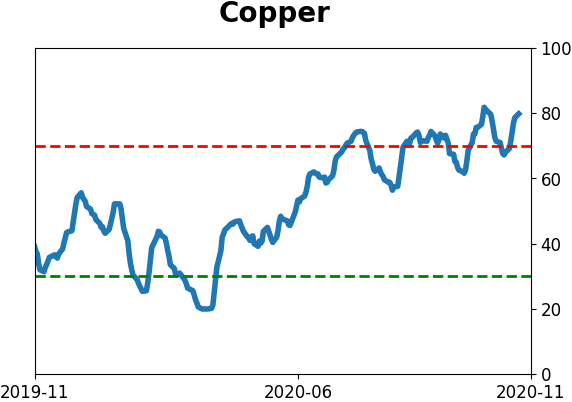
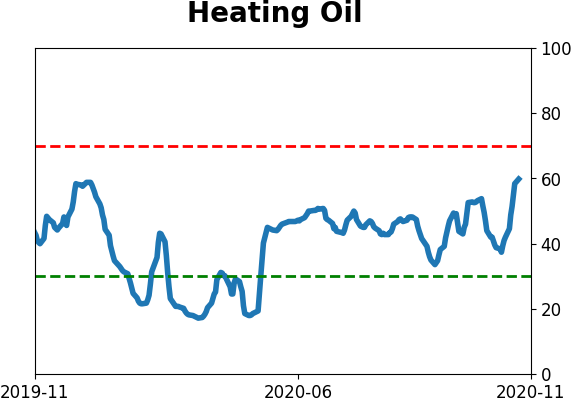
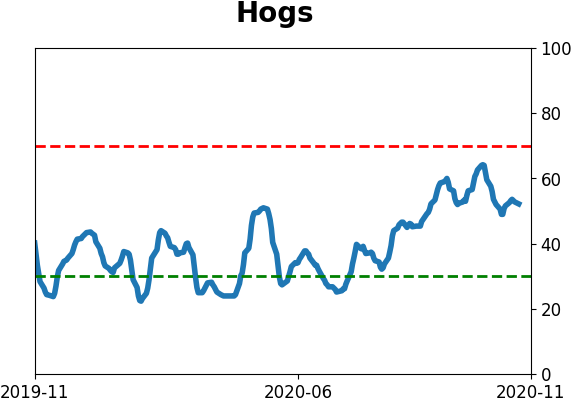
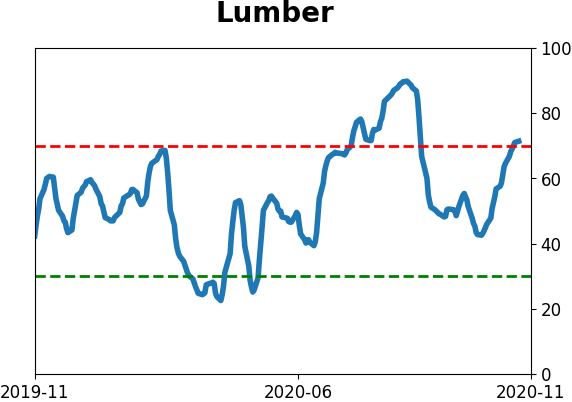
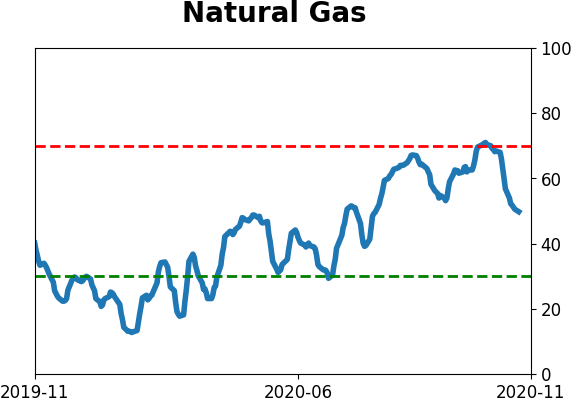
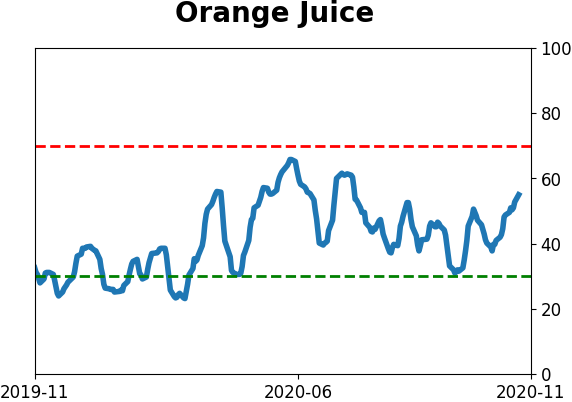
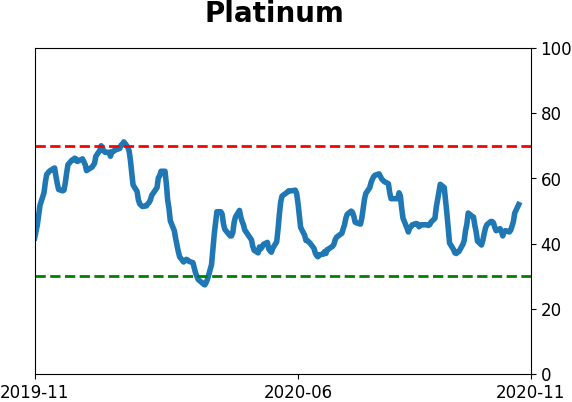
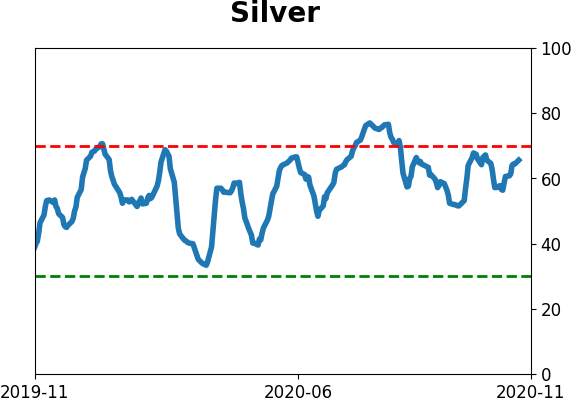
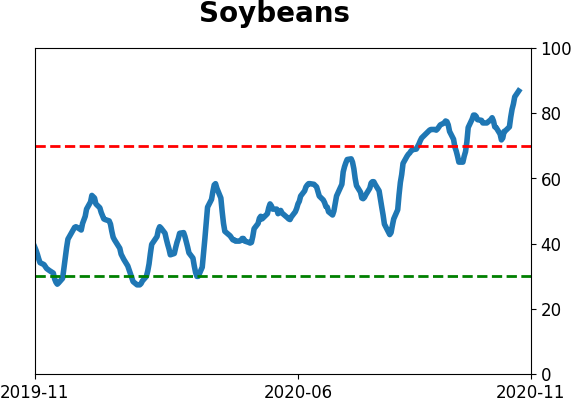
Commodity ETF's - 5-Day Moving Average
|
|