Headlines
|
|
Bond sentiment turns sour:
Sentiment on the bond market is starting to wane. The Optimism Index for that market just dropped below 50% for the first time in more than 6 months, which has tended to lead to further losses (and rising interest rates). Stocks held up well after these signals.
Mom and pop finally turn optimistic:
The latest AAII survey shows a nearly 70% ratio of bulls to bears, the highest in years. When optimism turns high after a protracted period of pessimism, it has led to above-average returns, especially over the past decade.
Big flow: In an apparent bid to take advantage of rising prices, investors shoveled nearly $24 billion into equity funds in the last week, thanks to a rush into big ETFs. Like the AAII survey, big inflows are treated as an automatic contrary indicator and a negative for forward returns. According to the Backtest Engine, there have been 12 weeks in the past decade with inflows of more than $15 billion in a single week. Over the next 8 weeks, the S&P 500 was higher after 9 of them, averaging +1.3%. None of them preceded major declines.
Bottom Line:
- A positive environment favors becoming aggressive on signs of excessive pessimism, of which there are few yet.
|
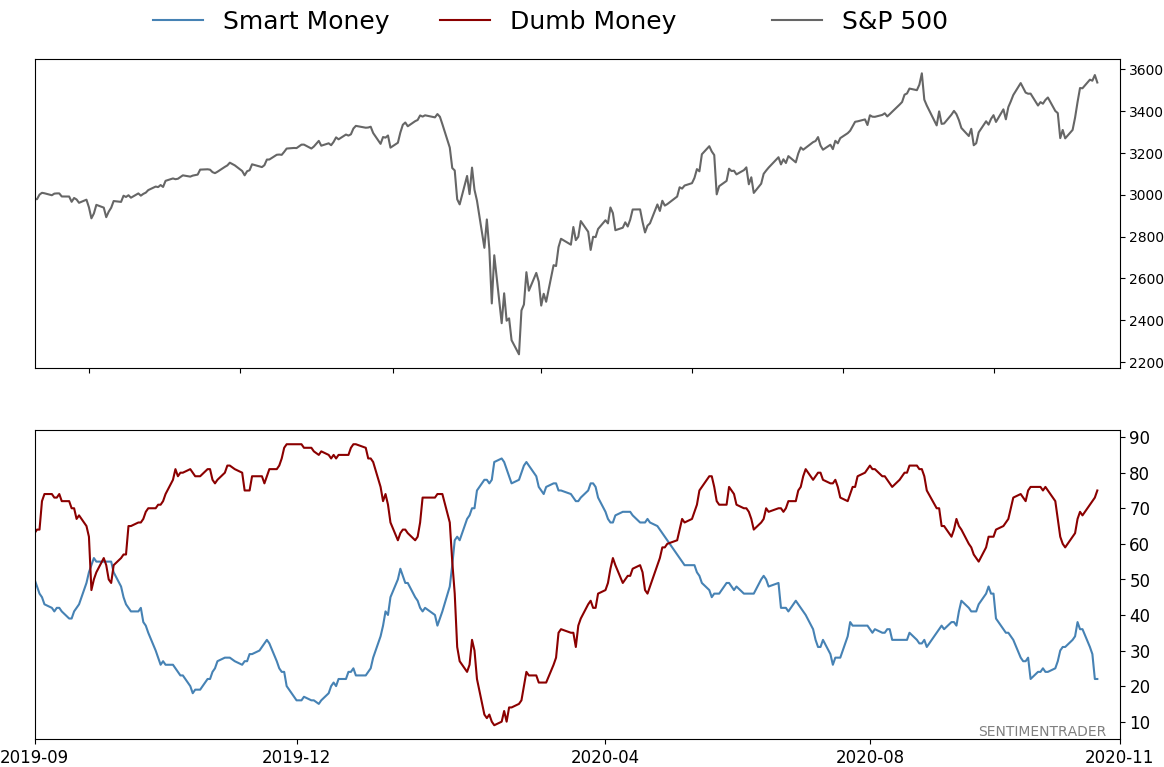
Smart / Dumb Money Confidence
|
Smart Money Confidence: 22%
Dumb Money Confidence: 75%
|
|
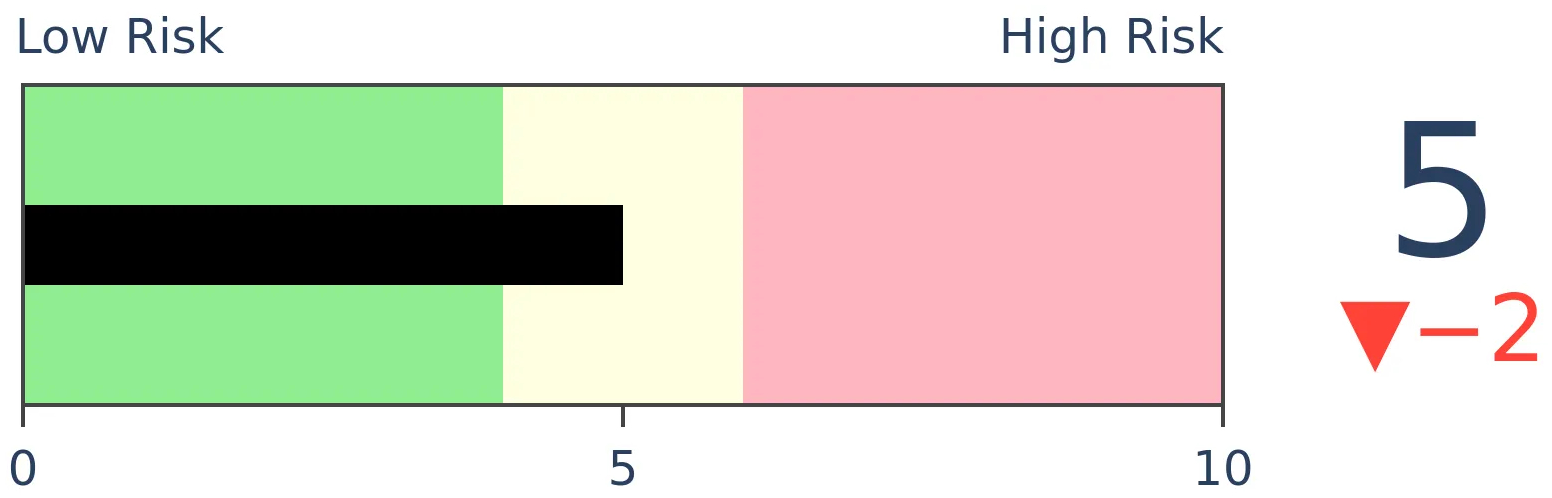
Risk Levels
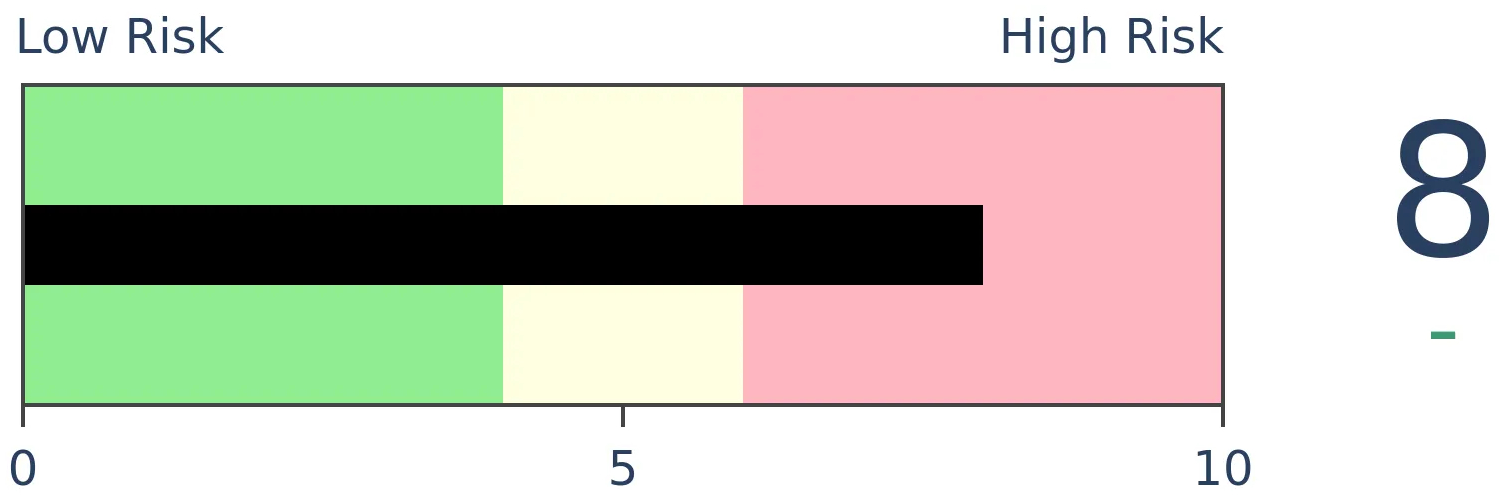
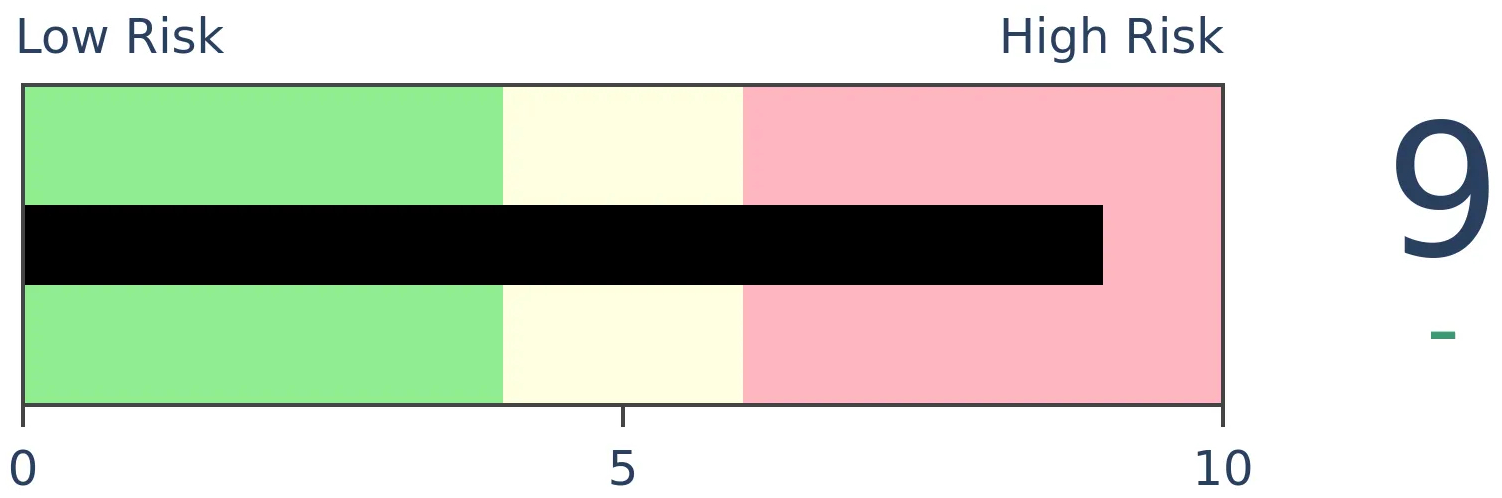
Stocks Short-Term
|
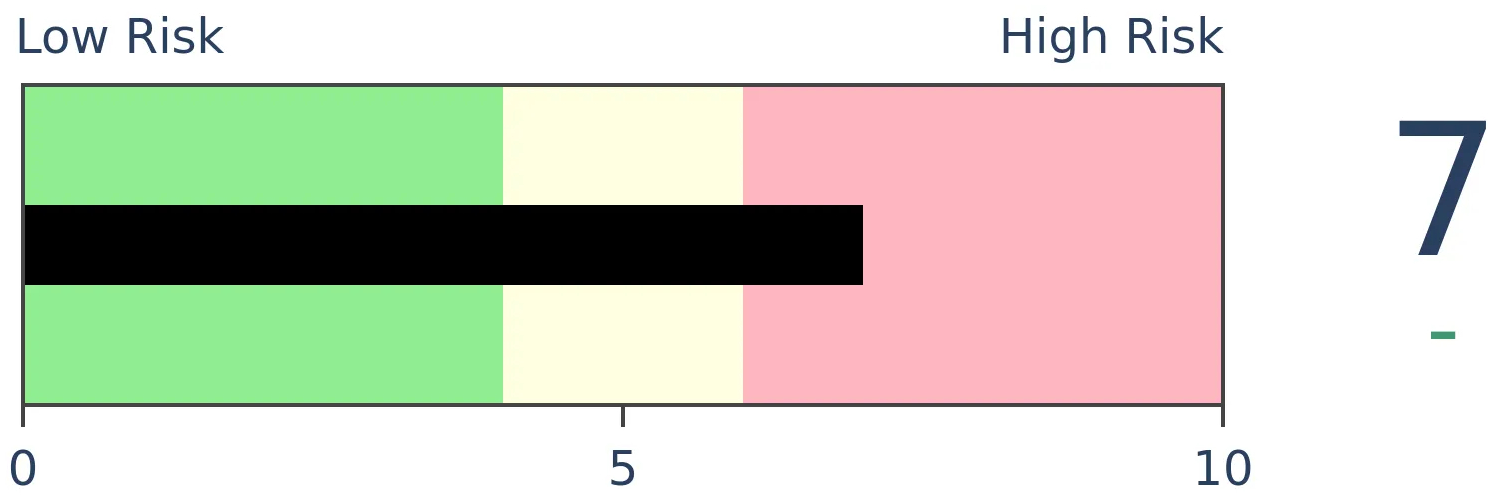
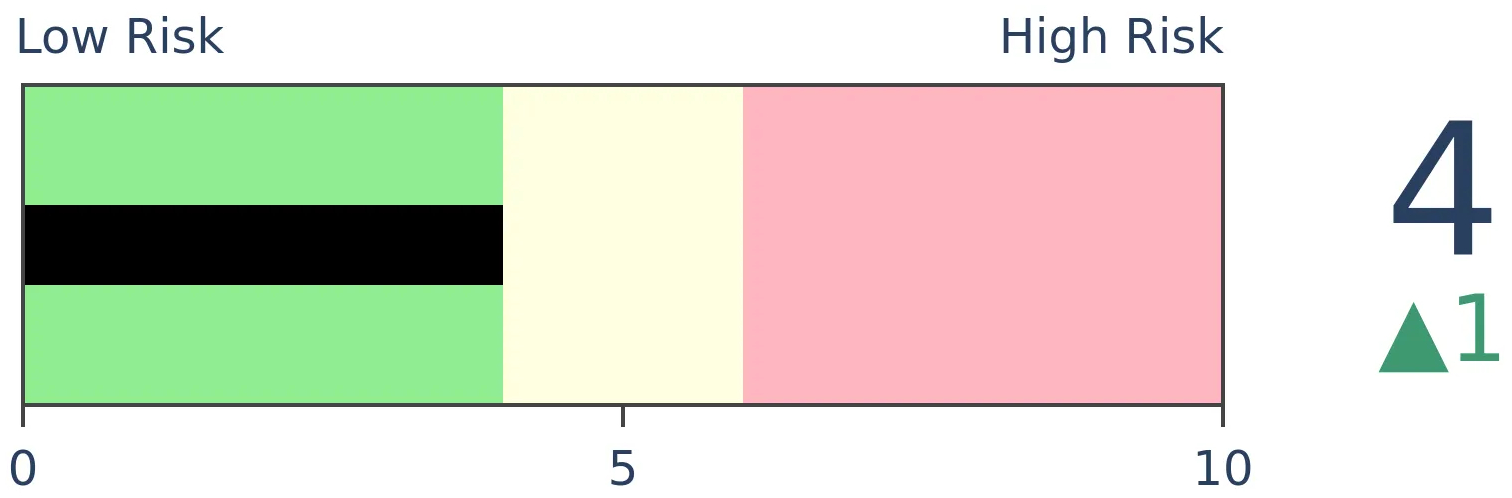
Stocks Medium-Term
|
|
Bonds

|
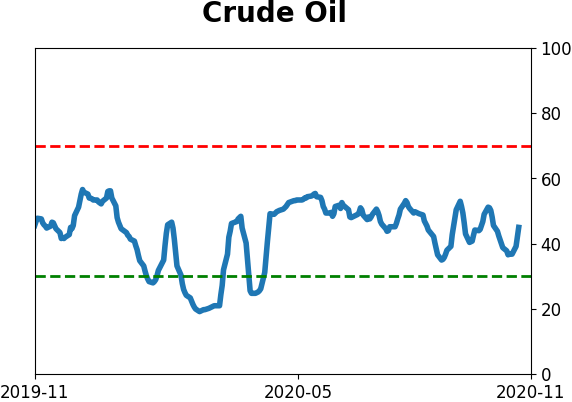
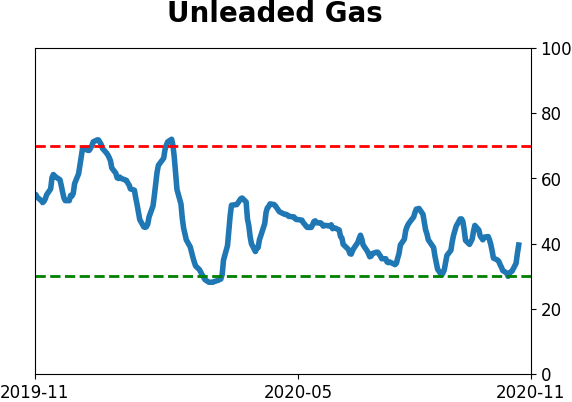
Crude Oil
|
|
Gold
|
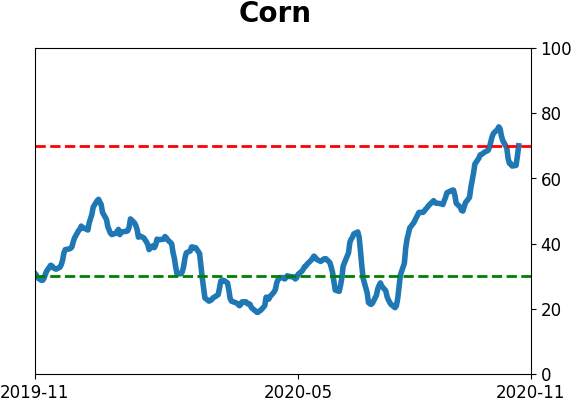
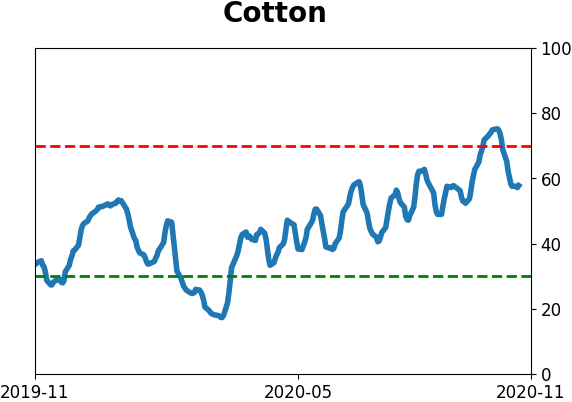
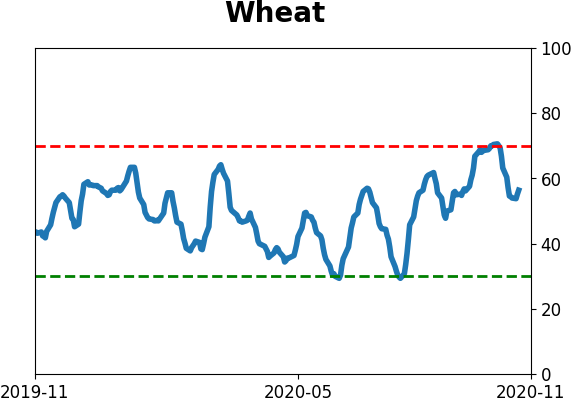
Agriculture
|
|
Research
BOTTOM LINE
Sentiment on the bond market is starting to wane. The Optimism Index for that market just dropped below 50% for the first time in more than 6 months, which has tended to lead to further losses (and rising interest rates). Stocks held up well after these signals.
FORECAST / TIMEFRAME
None
|
In a blurb in yesterday's Daily Report, we noted that for the first time in more than 6 months, investors pulled money out of bond mutual funds and ETFs. That's according to the Investment Company Institute, which monitors flows a bit differently than other organizations.
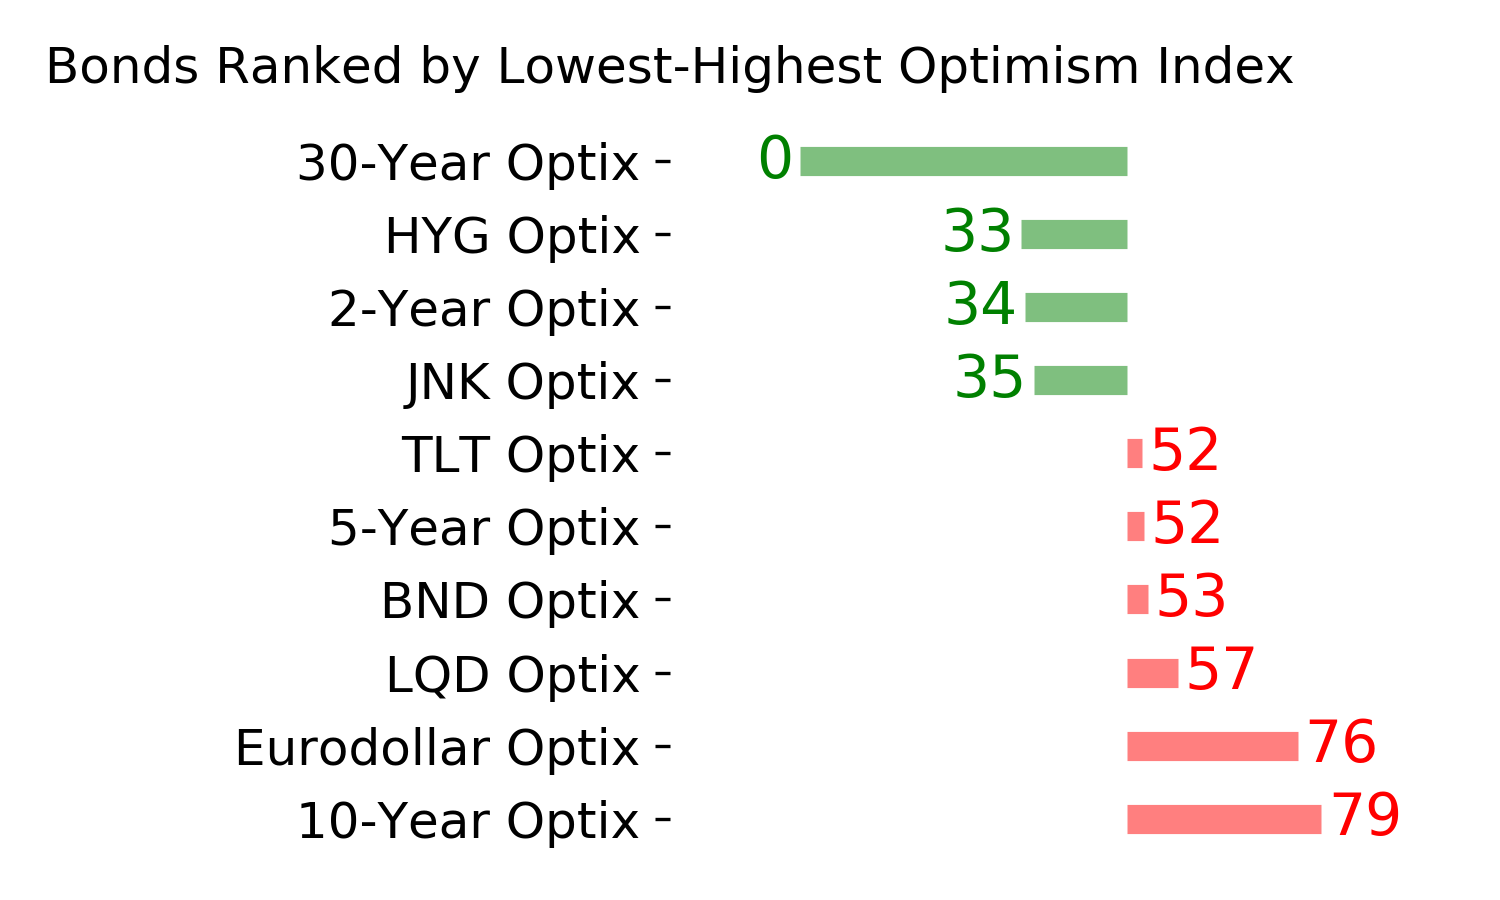
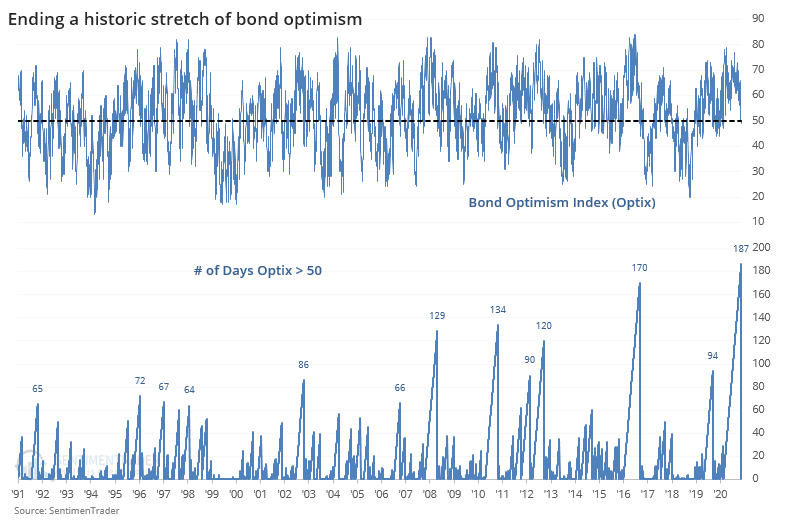
The flows are just one piece of evidence that sentiment toward the bond market has soured. That can also be seen in the Bond Optimism Index (Optix) which just dipped below 50 for the first time since the spring.
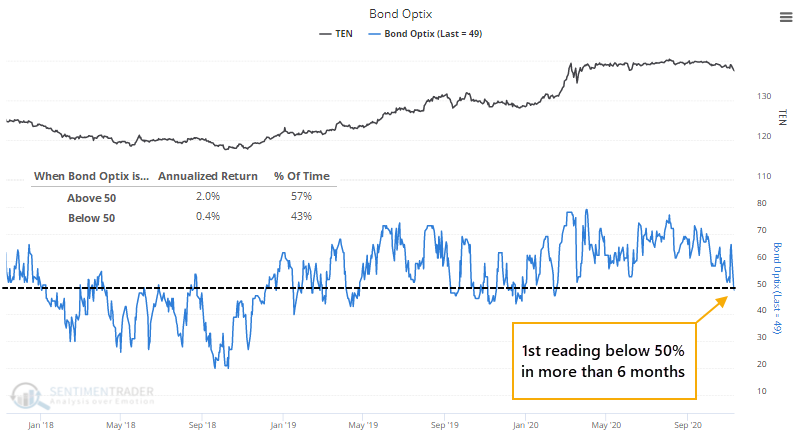
Like most of our Optimism Indexes, a market tends to do better when there is risk-on behavior, which typically just means the Optix is above 50. It's only when optimism gets extremely high that forward returns tend to suffer. For the Bond Optix, the 10-year Treasury note futures contract showed an annualized return when the Optix was above 50 that was 5x the return when it was below 50.
The drop in the Optix below 50 ends a record stretch for the model. It held above that threshold for 187 sessions, exceeding the prior record from 2016.
The table below shows every time the Bond Optimism Index held above 50 for at least 3 months, then fell below.
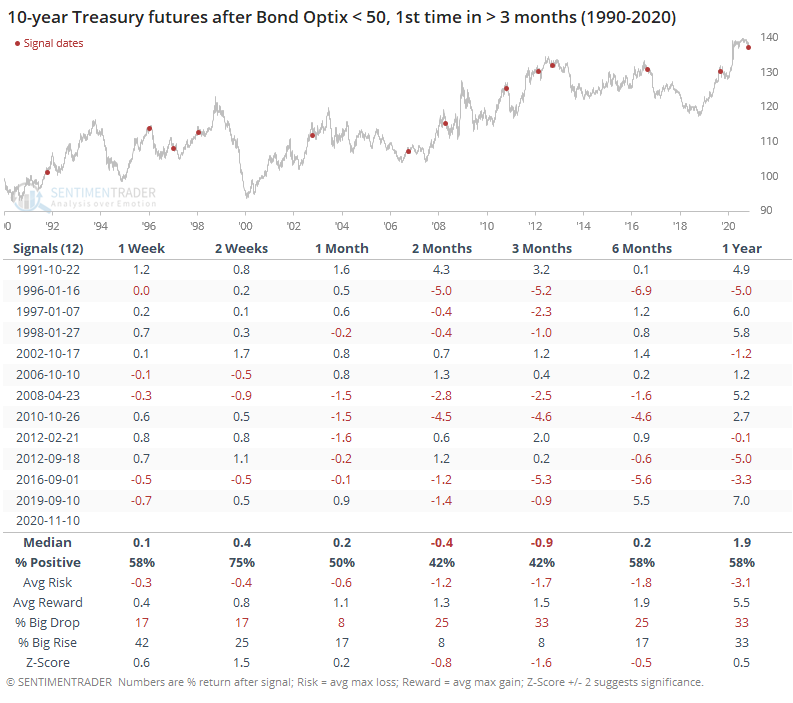
While the 10-year contract rebounded most of the time over the short-term, it fell back over the next 2-3 months, with a poor risk/reward and much larger probability of a big drop than a big rise (see this Knowledge Base article for more detail about the terms). Every one of the signals showed either a loss or less than a 1% gain sometime between 2-6 months later.
These drops in the bond market meant rising interest rates, but that wasn't much of a headwind for the stock market.
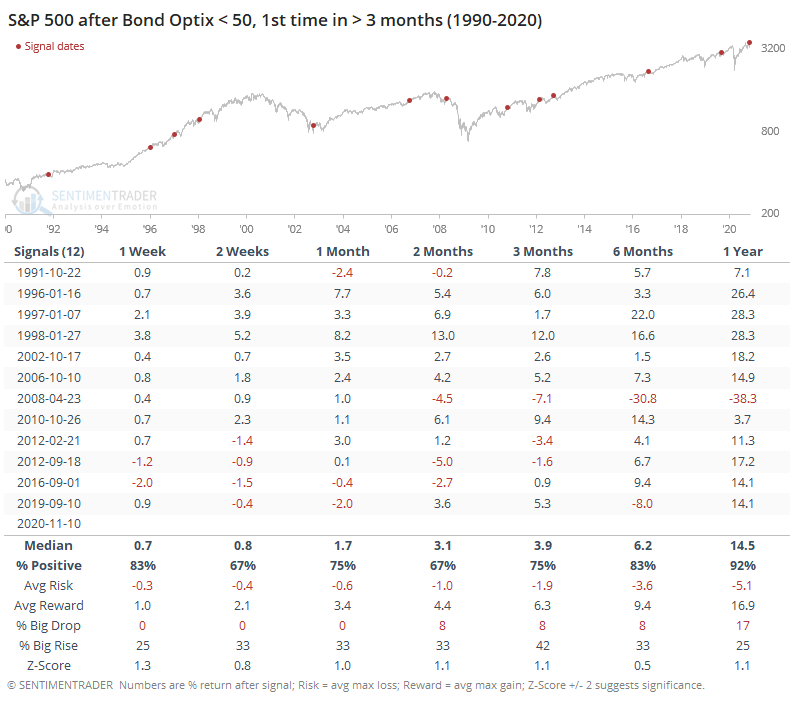
After these displays of waning optimism for bonds, the S&P 500 fared well in the months ahead. Over the next 3 months, the S&P rallied 8 out of 12 times, with really one a single loss of any consequence. Its overall risk/reward was good, and there was a 42% chance of a big rise versus only an 8% chance for a big drop within the first 3 months.
Note and bond prices have shown a modest tendency to rise when there is an outflow from mutual funds and ETFs focused on that market. But a wider perspective shows that other measures are weakening too, and aren't yet to a point that would indicate widespread pessimism. Under these conditions, bond prices have a stronger tendency to decline than rise. If Thursday's bond rally holds and turns the Optimism Index back above 50, then it will be a better sign, but the fact that it's already dipped below 50 suggests a tougher slog ahead.
BOTTOM LINE
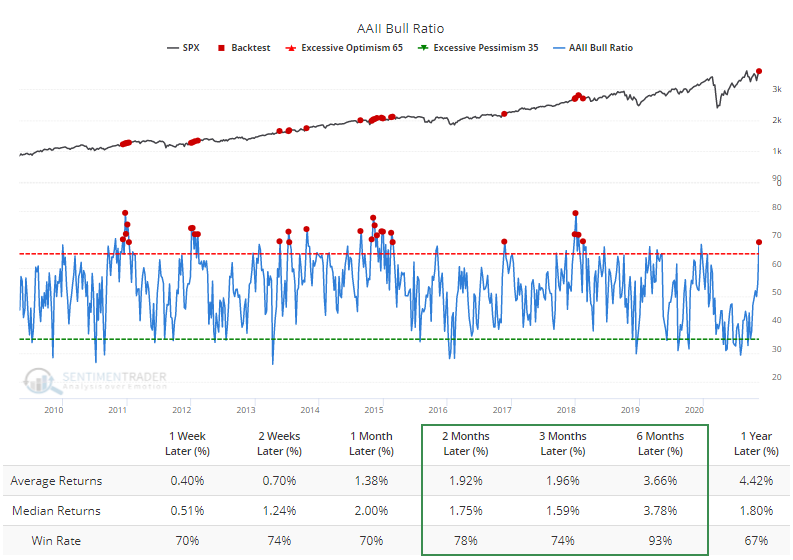
The latest AAII survey shows a nearly 70% ratio of bulls to bears, the highest in years. When optimism turns high after a protracted period of pessimism, it has led to above-average returns, especially over the past decade.
FORECAST / TIMEFRAME
None
|
We might as well get this out of the way. Bullishness in a weekly survey of individual investors has spiked to the highest level in years, and that's causing concern that optimism is out of control.
The percentage of bulls in the American Association of Individual Investors (AAII) survey rose to 55.8% while bears dropped to 24.9%, pushing the Bull Ratio, a more accurate measure of optimism, above 69%. The last 2 times it got this high, stocks ended up running into trouble eventually.
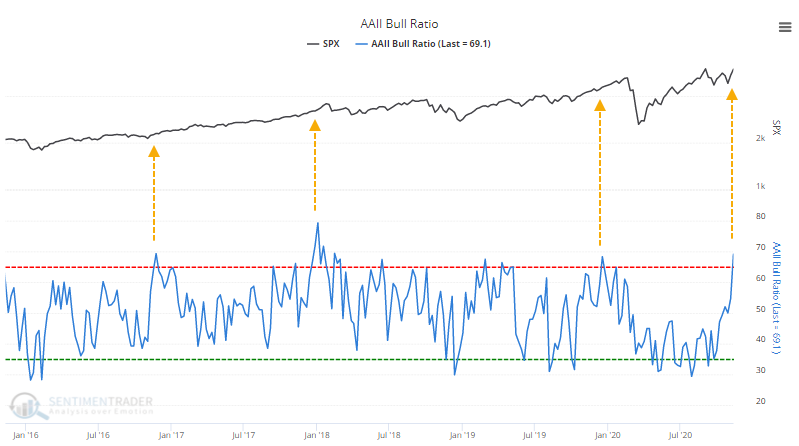
If we take about 15 seconds of our time to see what this has objectively meant in the past, then the Backtest Engine shows that over the past decade, a reading this high led to above-average returns for the S&P 500 in the months ahead. Over the next 26 weeks, the S&P 500 showed a positive return after 25 out of 27 signals.
Context is important, and so let's look at those times when the survey showed more than 2 bulls out of every 3 investors for the 1st time in more than 9 months.
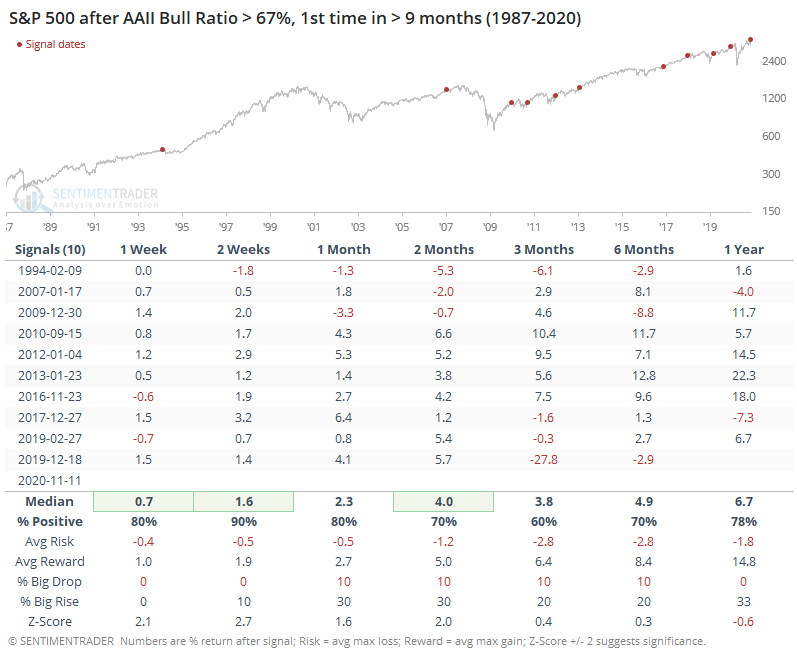
Again, not much to suggest a major worry here, though the last signal clearly resulted in some heartburn after an initial large rally through the beginning of this year.
The results are skewed by a large number of occurrences in the past decade, which was dominated by a momentum-driven bull market. If we relax the parameters, then we can get more samples from earlier time periods.
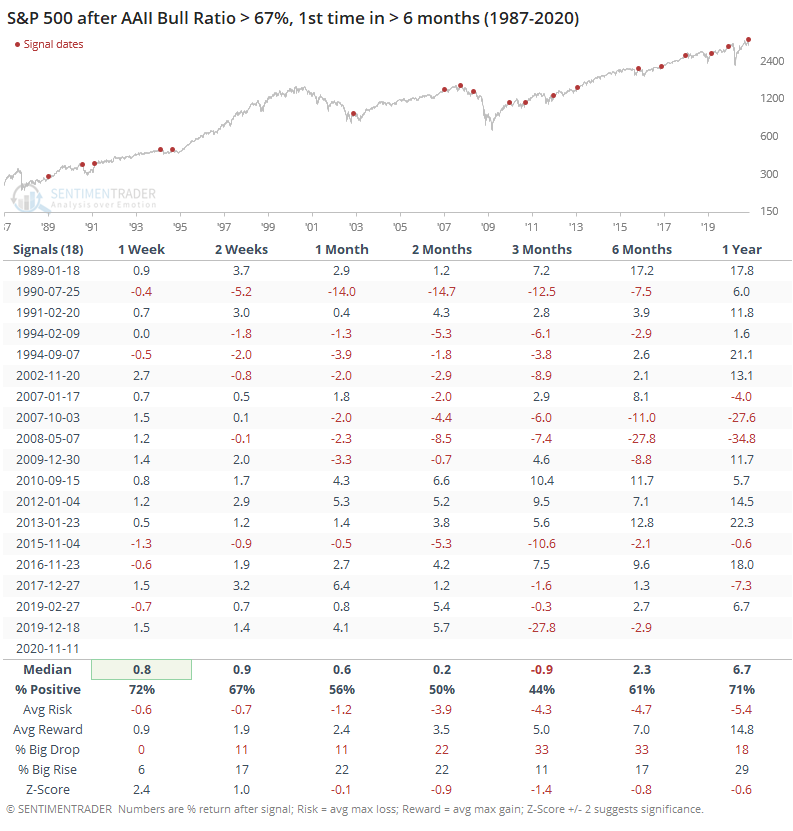
Here, results weren't so pristine. Prior to the last decade, the S&P most often showed a loss over the next 1-3 months, so that's a bit of a concern.
Another way to see the current extreme is the rate of change. The Bull Ratio has increased by more than 35% over the past 10 weeks, one of the largest changes going back to 1987.
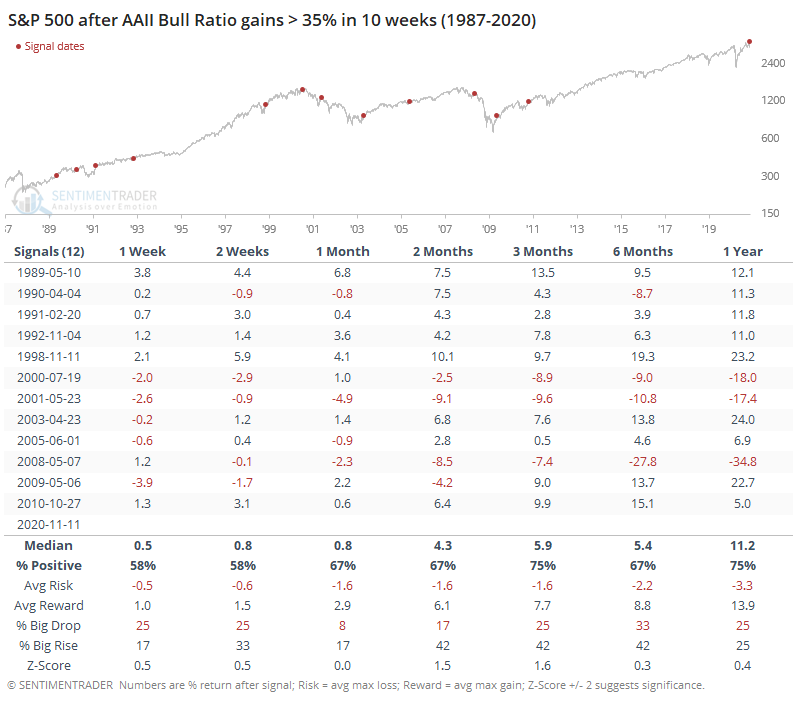
This, too, wasn't a consistent sell signal. While 3 of them led to very large losses over the next 6-12 months, those were the clear exceptions, with an overall risk/reward ratio that was heavily skewed to the upside.
The rapid rise in optimism in this survey, which is now to a high level, should not be a major worry. Some large declines began weeks after behavior like this, but those were the exceptions. Historically, these kinds of readings have led to above-average returns, and consistently higher prices. The biggest concern is that prior to the last decade or so, the next 1-3 months showed mostly moderate losses.
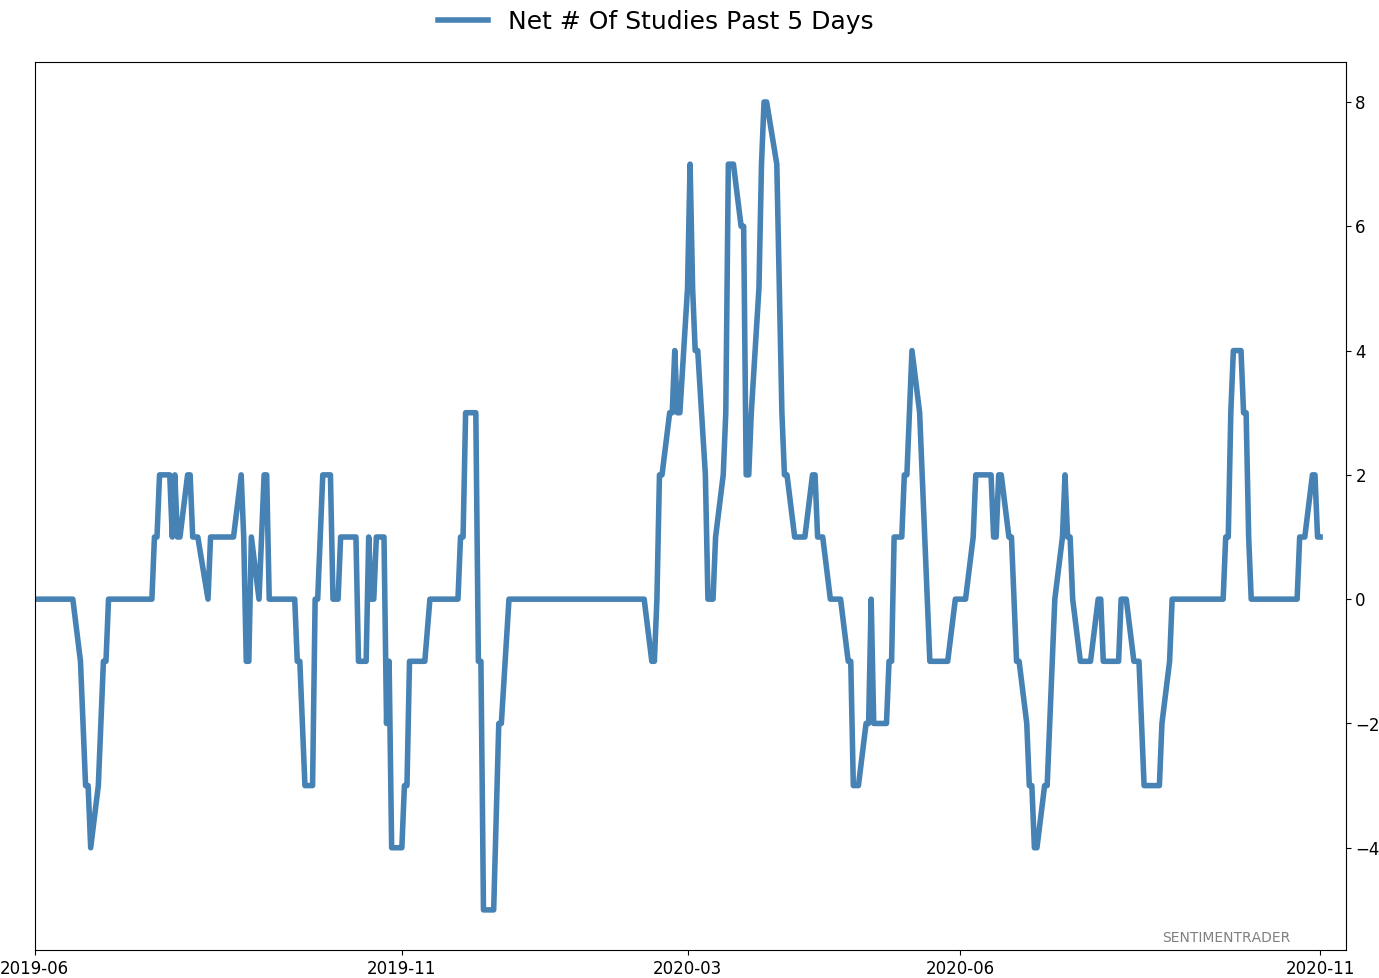
Active Studies
| Time Frame | Bullish | Bearish | | Short-Term | 0 | 0 | | Medium-Term | 5 | 8 | | Long-Term | 50 | 2 |
|
Indicators at Extremes
Portfolio
| Position | Description | Weight % | Added / Reduced | Date | | Stocks | 15.6% RSP, 10.1% VWO, 7.5% XLE, 5.1% PSCE | 38.2 | Added 5% | 2020-10-15 | | Bonds | 10% BND, 10% SCHP, 10% ANGL | 29.7 | Reduced 0.1% | 2020-10-02 | | Commodities | GCC | 2.4 | Reduced 2.1%
| 2020-09-04 | | Precious Metals | GDX | 4.7 | Added 5% | 2020-09-09 | | Special Situations | | 0.0 | Reduced 5% | 2020-10-02 | | Cash | | 25.0 | | |
|
Updates (Changes made today are underlined)
After the September swoon wrung some of the worst of the speculation out of stocks, there are some signs that it's returning, especially in the options market. It's helped to push Dumb Money Confidence above 70%. A big difference between now and August is that in August, there was a multitude of days with exceptionally odd breadth readings. Some of the biggest stocks were masking underlying weakness. Combined with heavy speculative activity, it was a dangerous setup. Now, we've seen very strong internal strength, in the broad market, as well as tech and small-cap stocks. Prior signals almost invariably led to higher prices. That's hard to square with the idea that forward returns tend to be subdued when Confidence is high, but that's less reliable during healthy market conditions, which we're seeing now (for the most part). I added some risk with small-cap energy stocks, due to an increasing number of positive signs in both small-caps and energy. This is intended as a long-term position.
RETURN YTD: 1.2% 2019: 12.6%, 2018: 0.6%, 2017: 3.8%, 2016: 17.1%, 2015: 9.2%, 2014: 14.5%, 2013: 2.2%, 2012: 10.8%, 2011: 16.5%, 2010: 15.3%, 2009: 23.9%, 2008: 16.2%, 2007: 7.8%
|
|
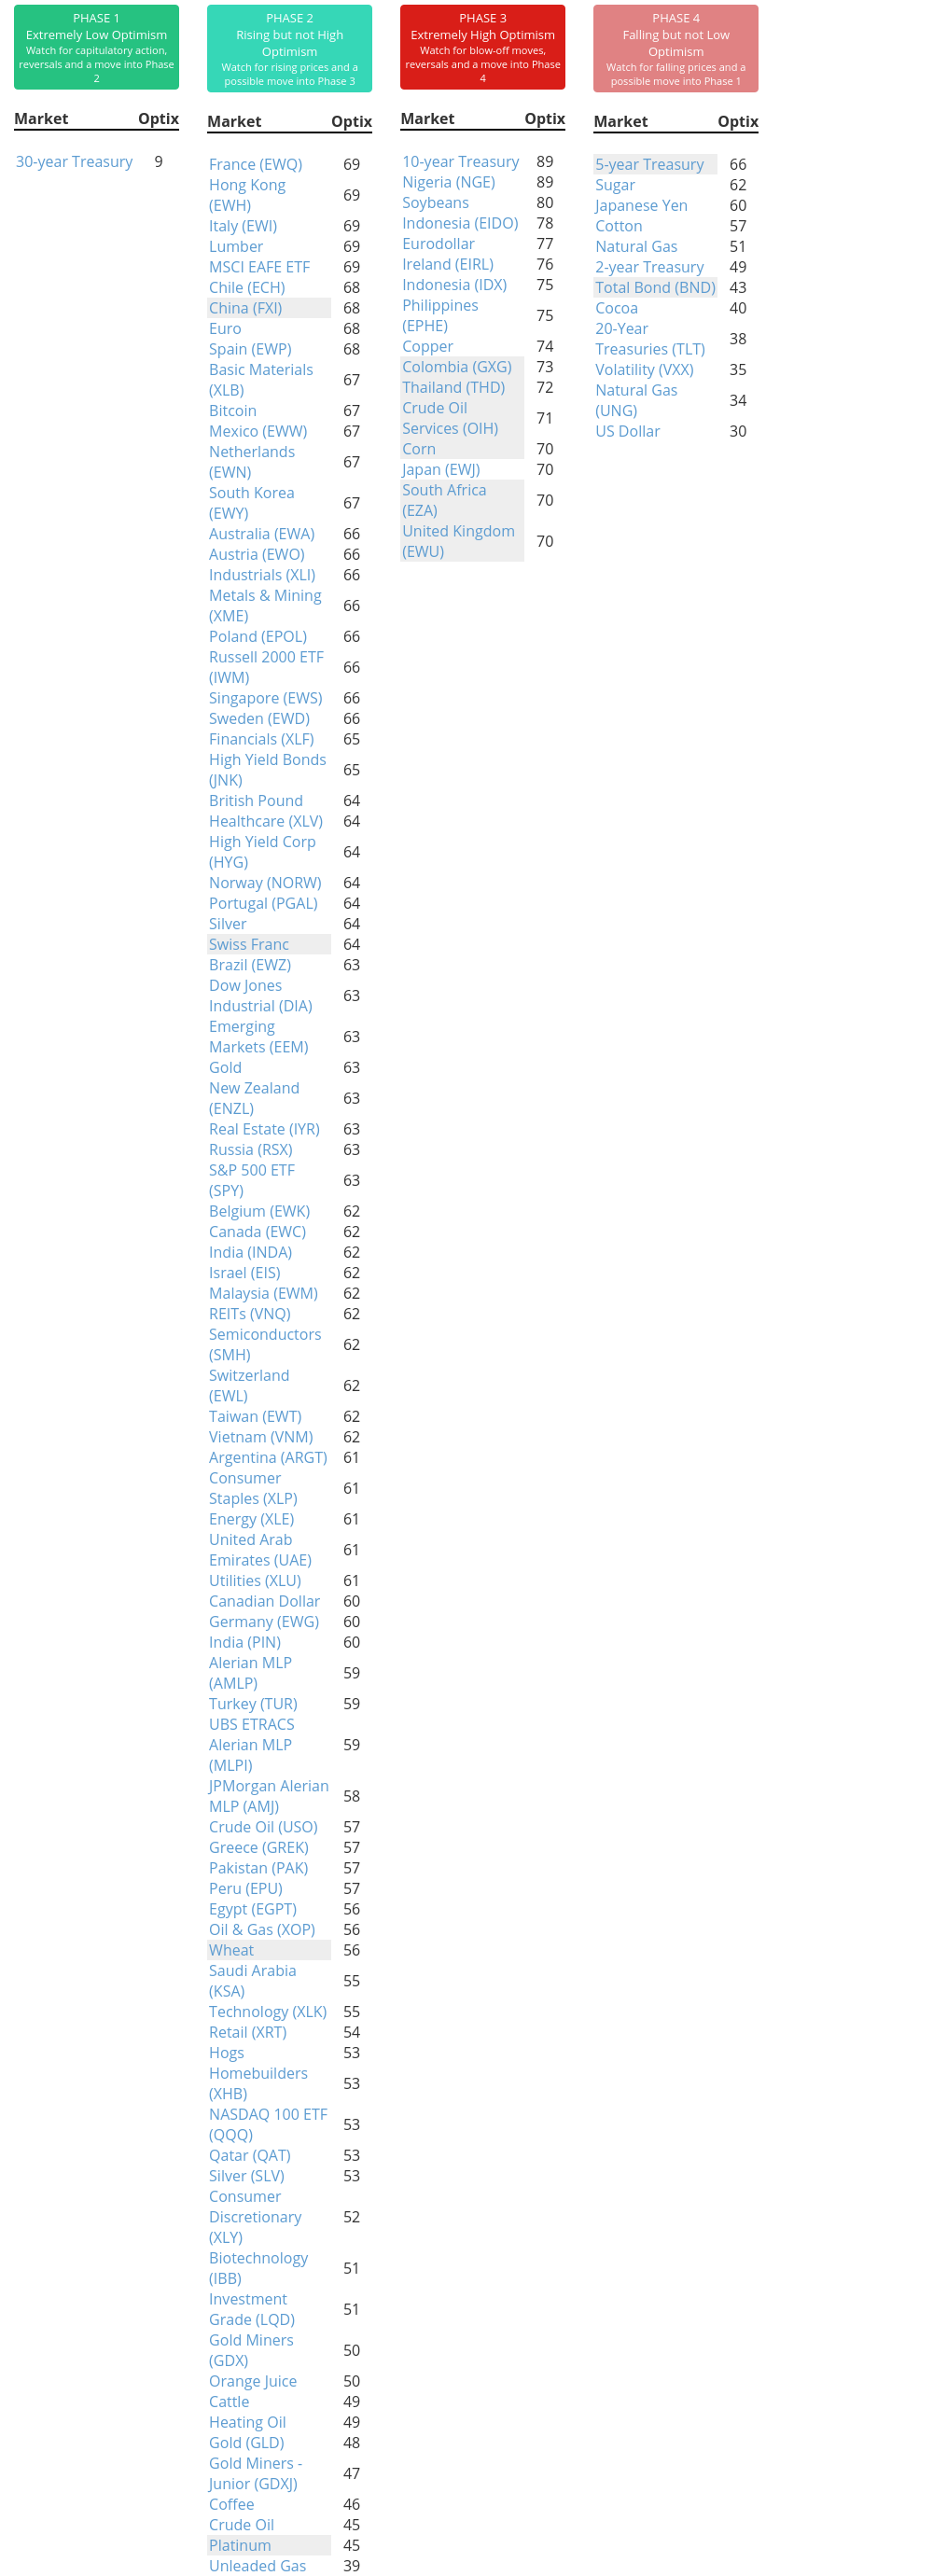
Phase Table
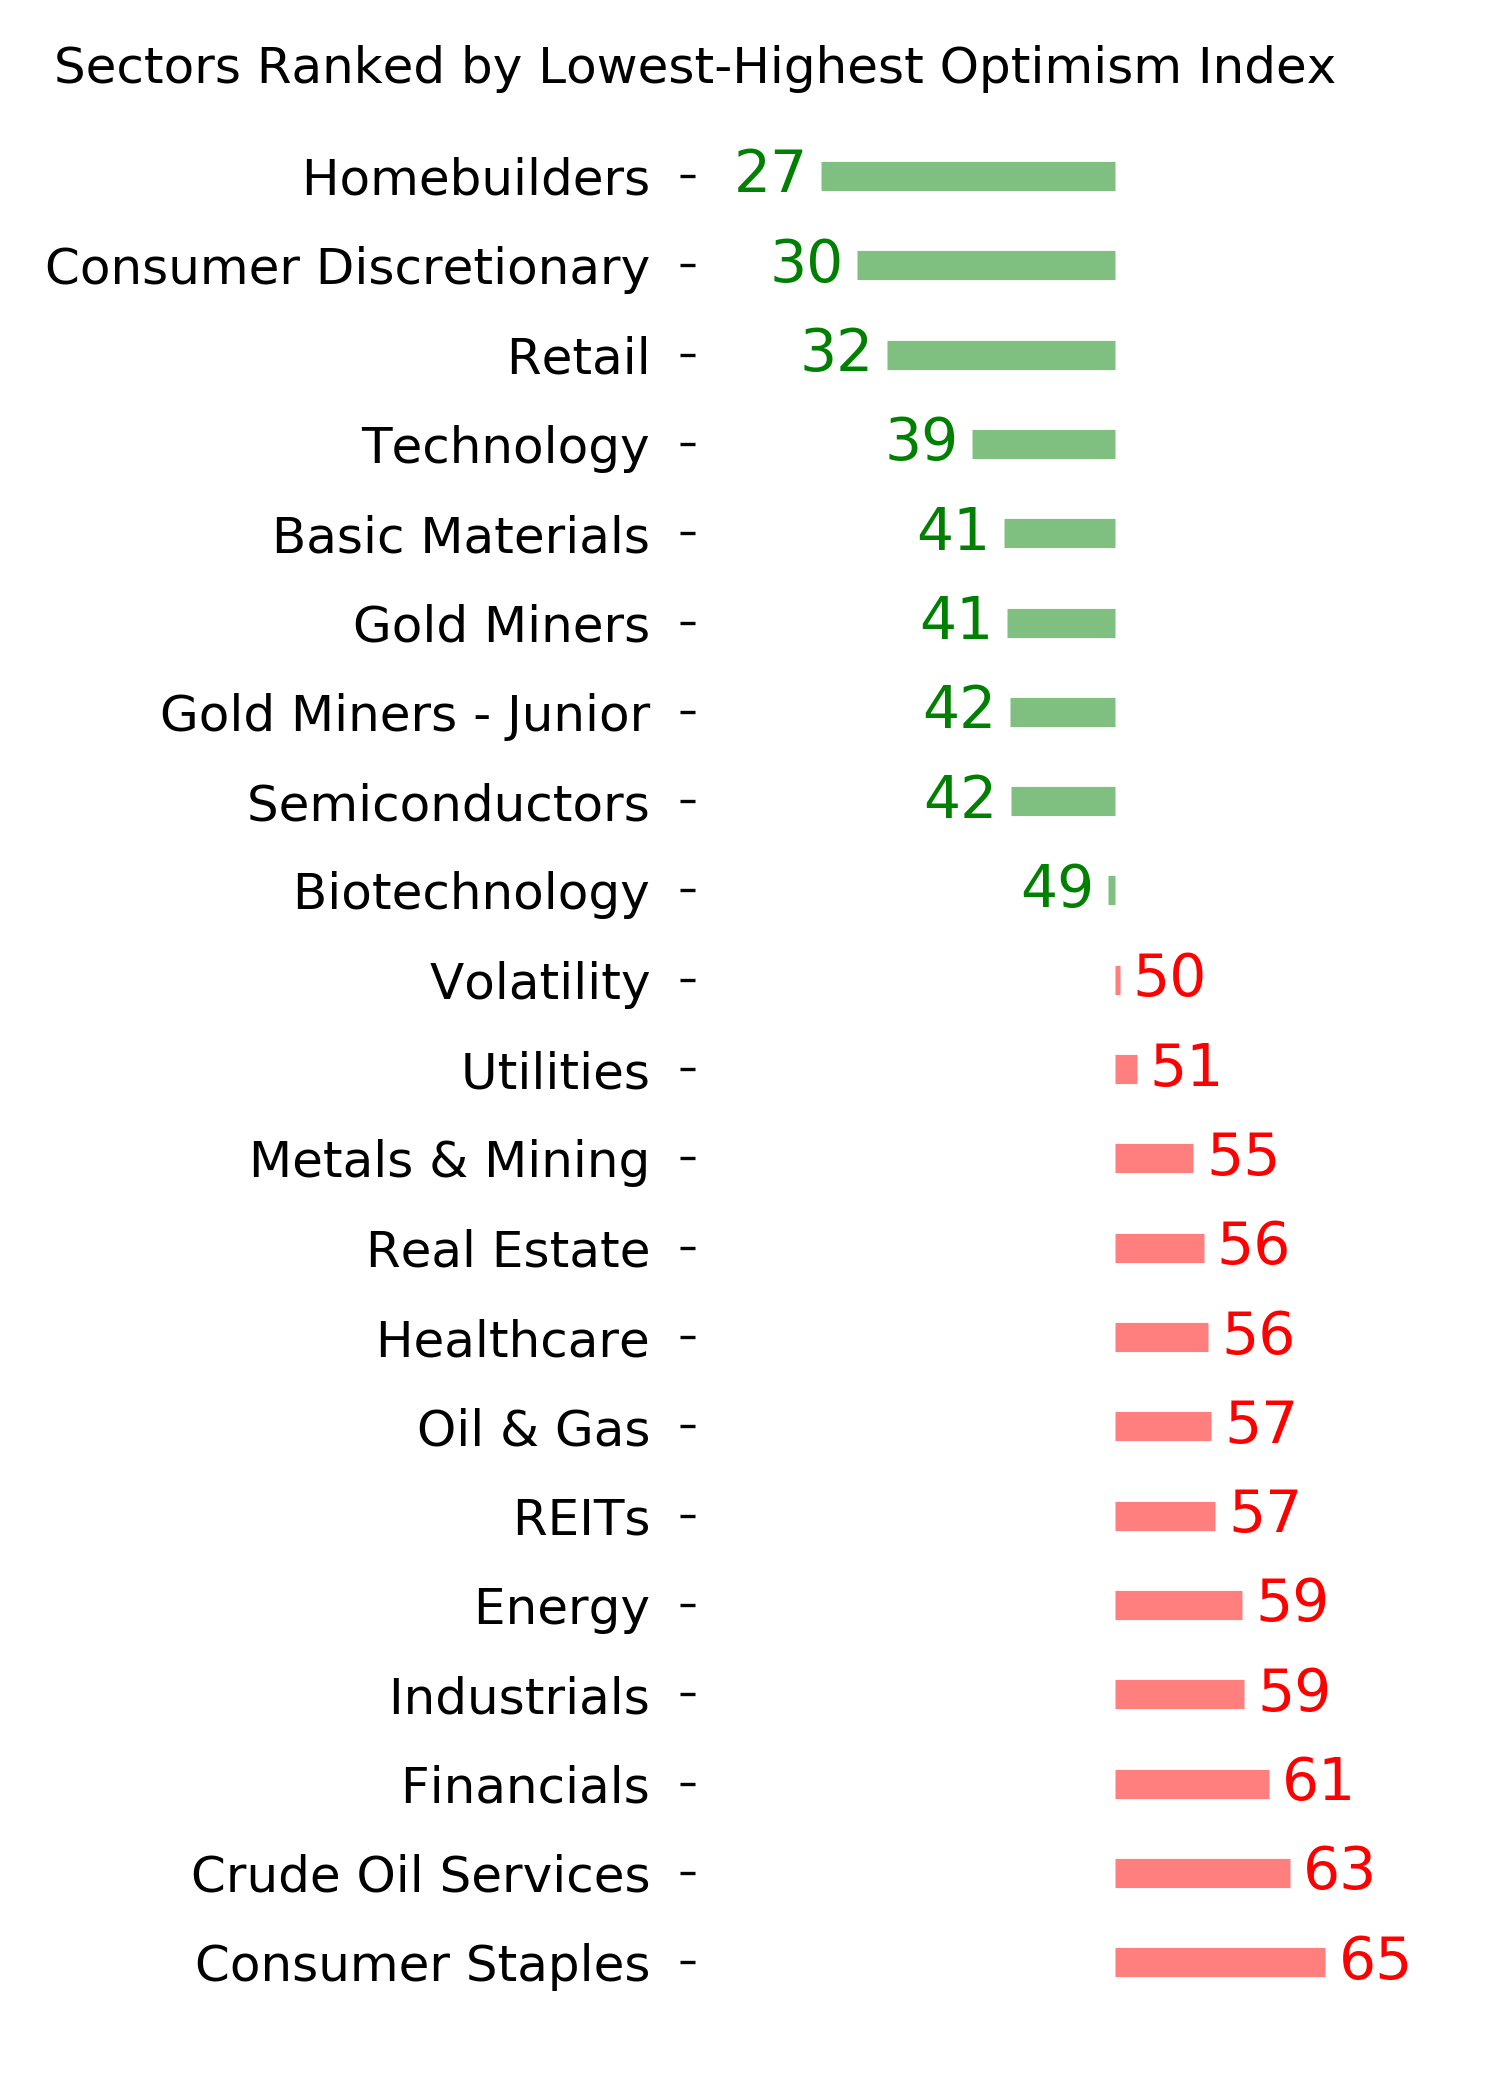
Ranks
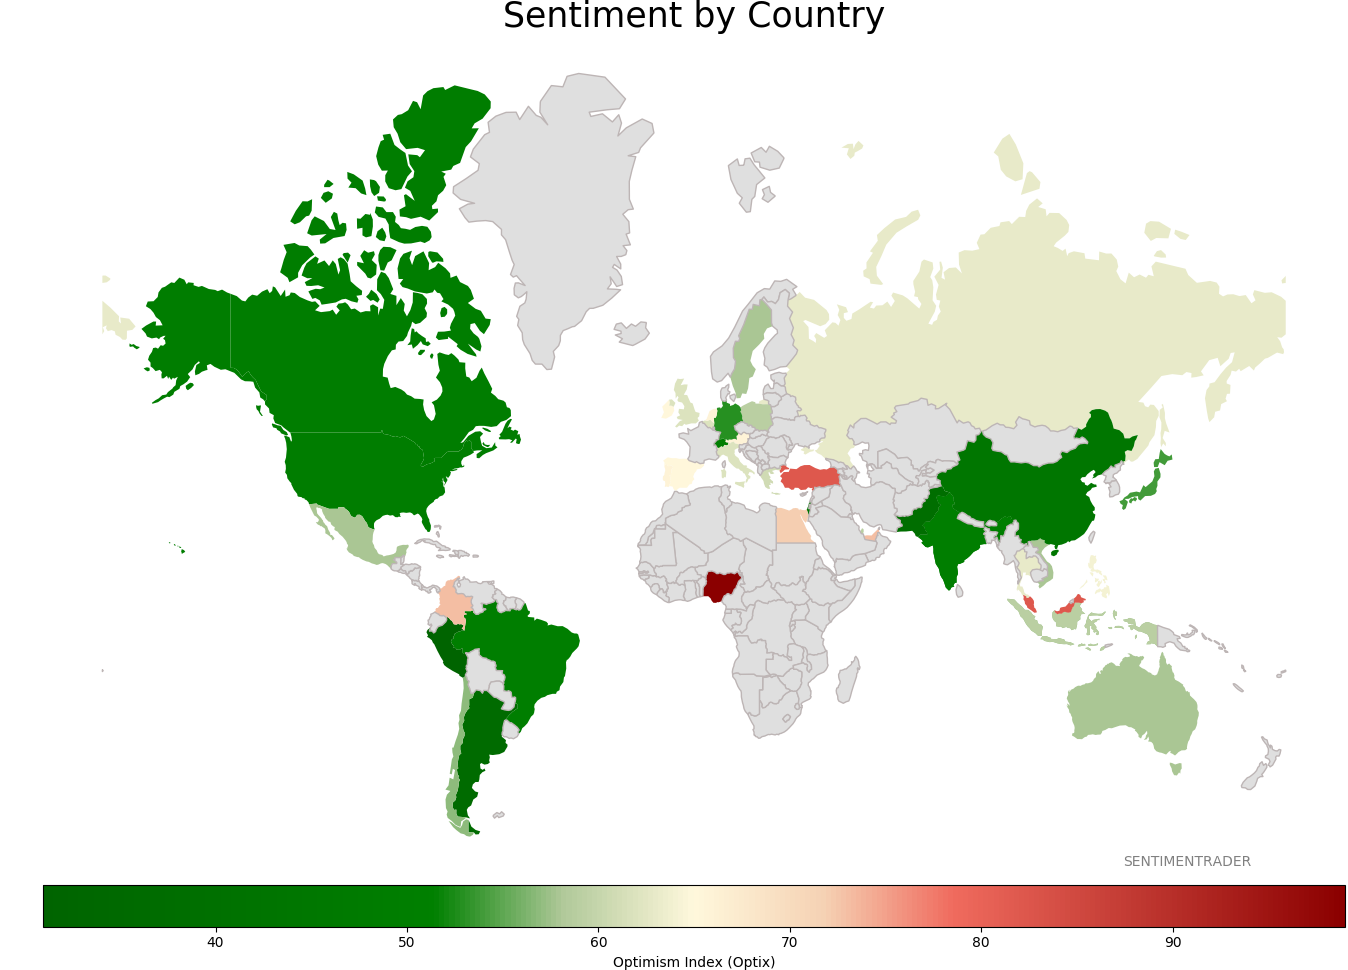
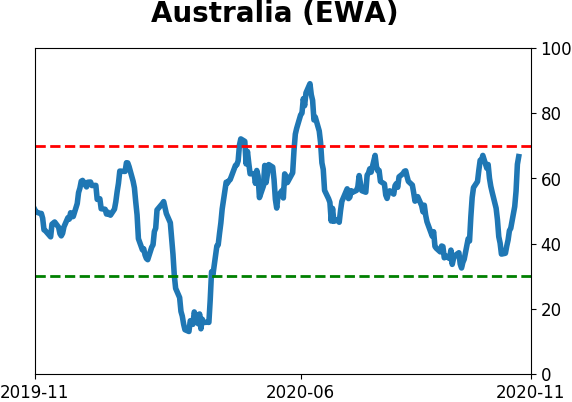
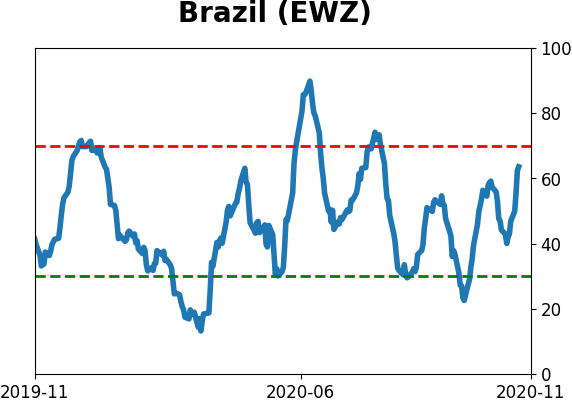
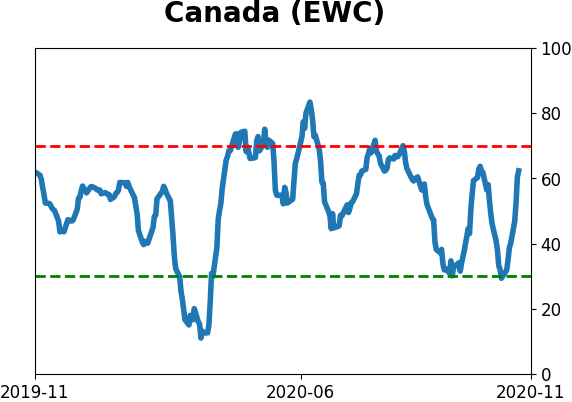
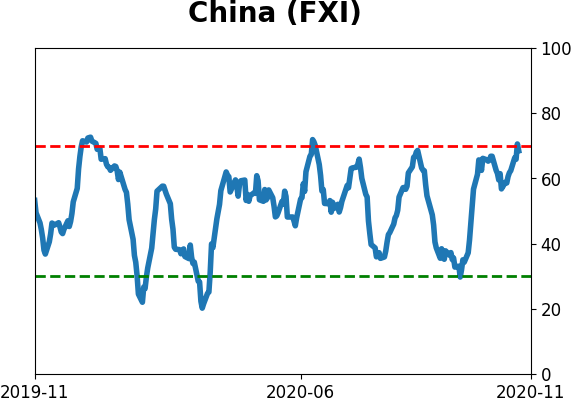
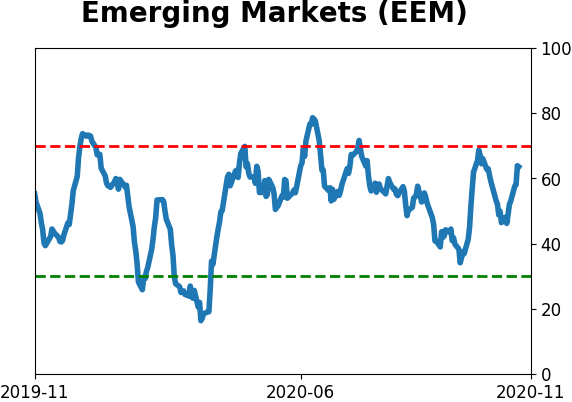
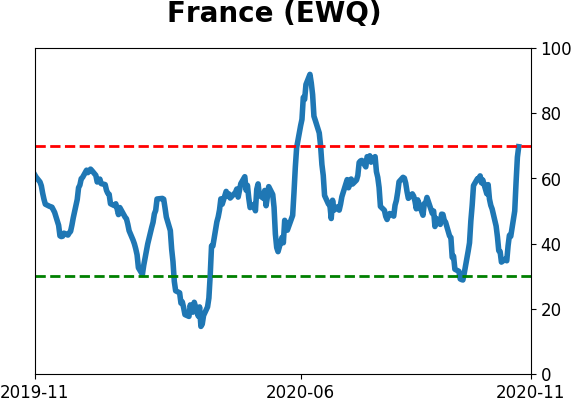
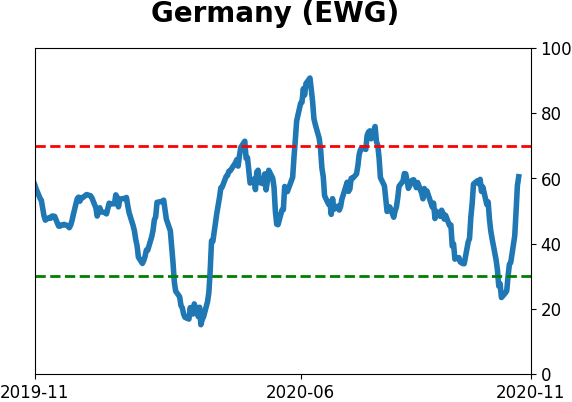
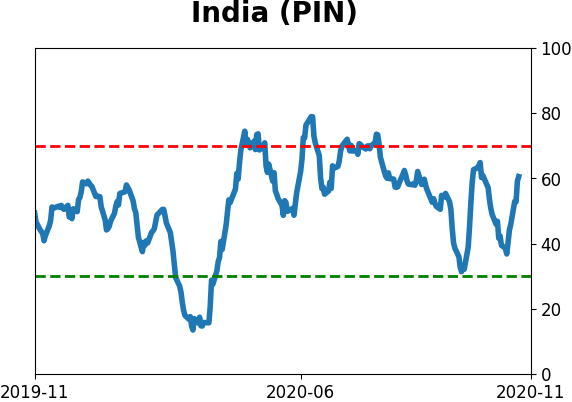
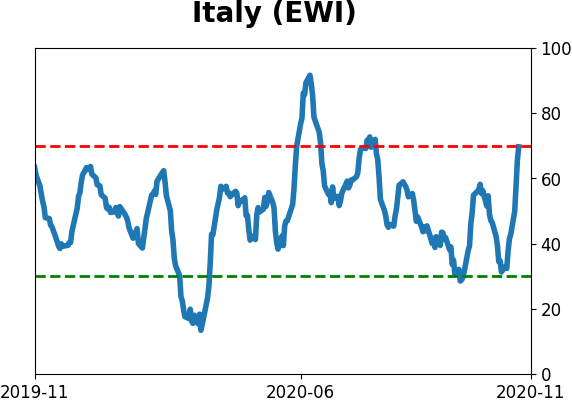
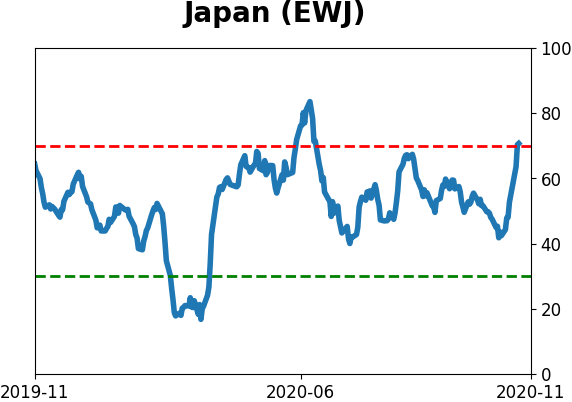
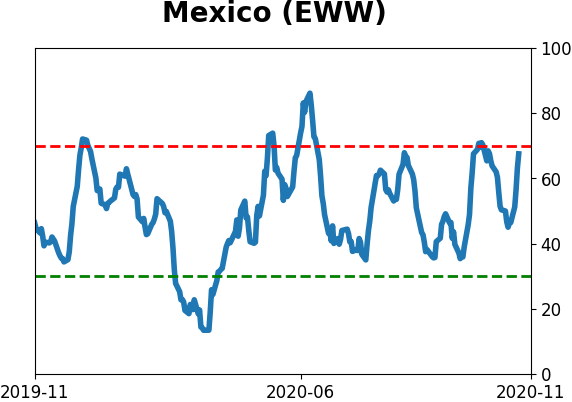
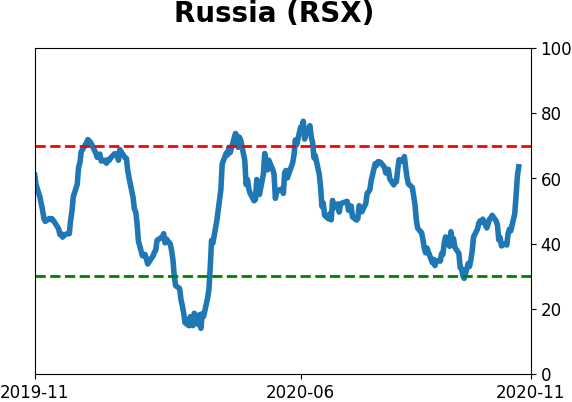
Sentiment Around The World
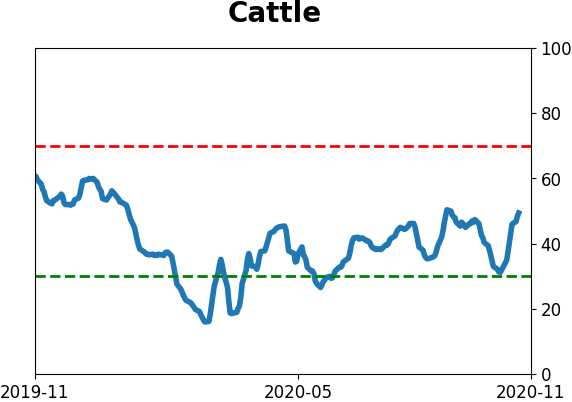
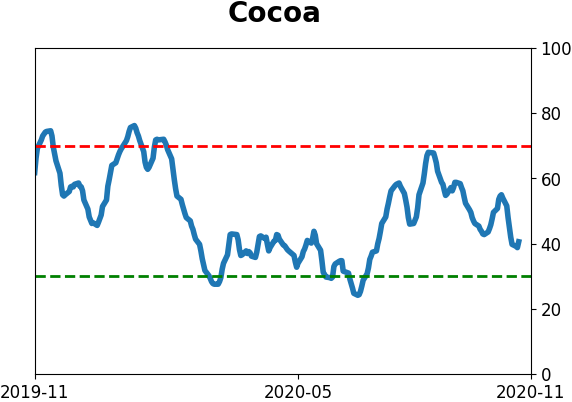
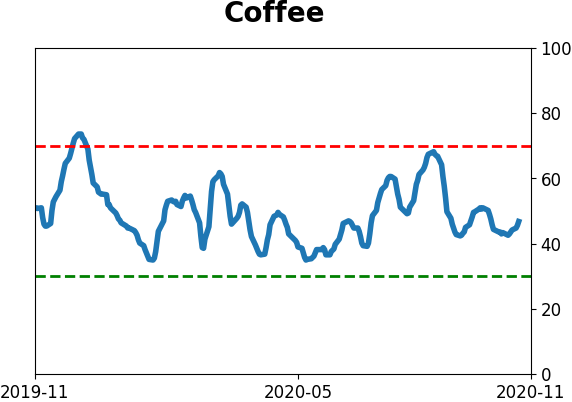
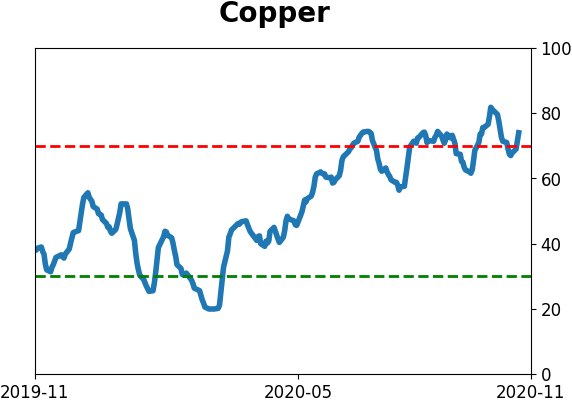
Optimism Index Thumbnails
|
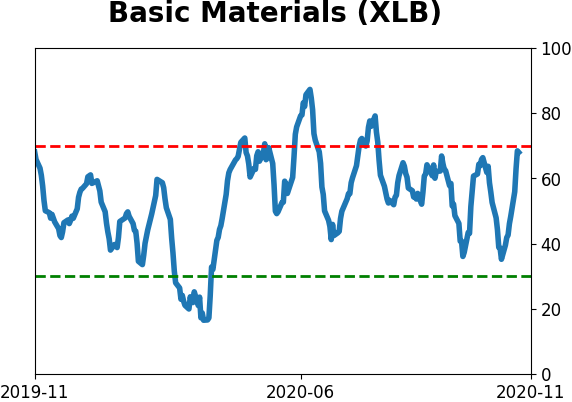
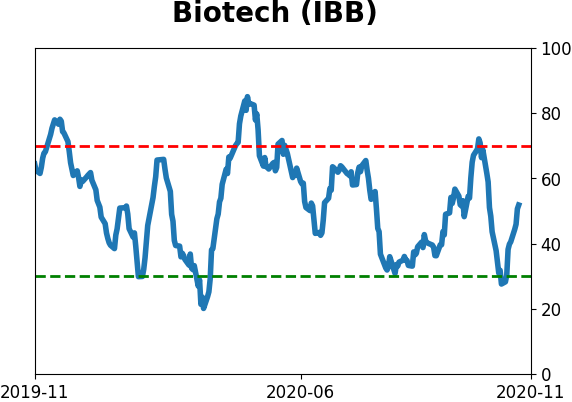
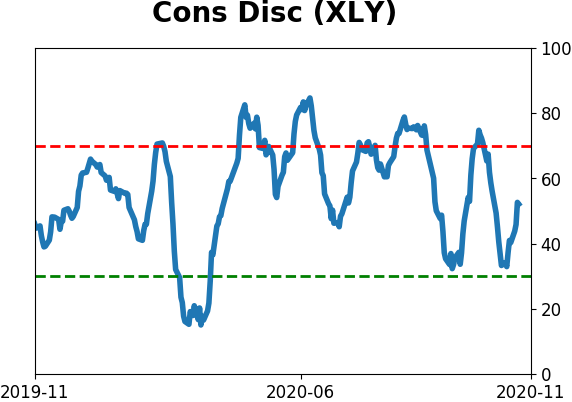
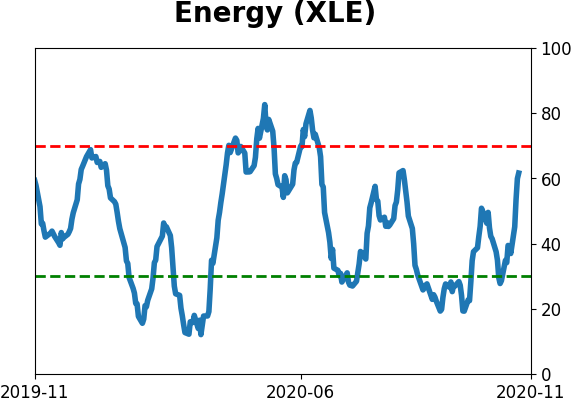
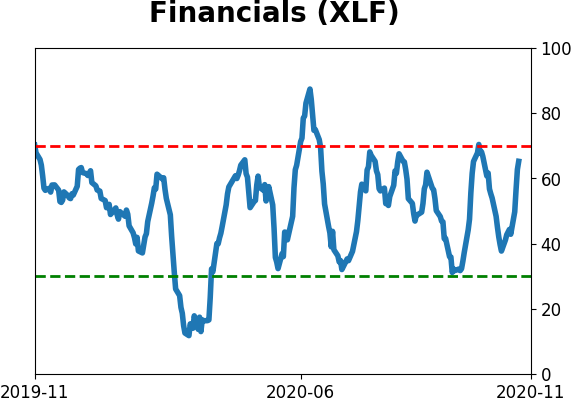
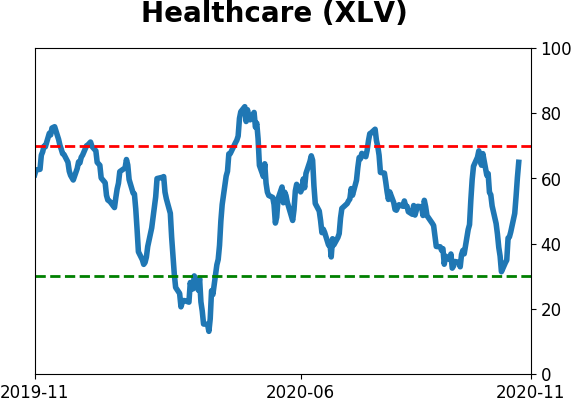
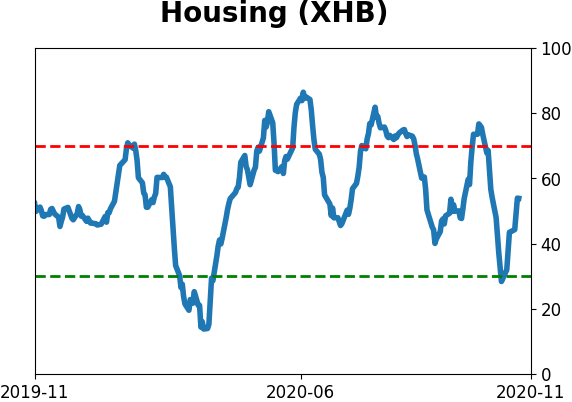
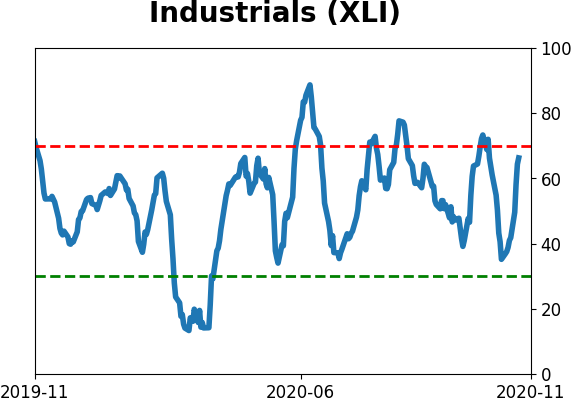
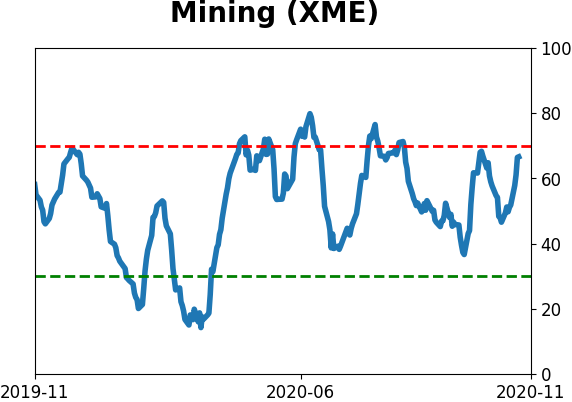
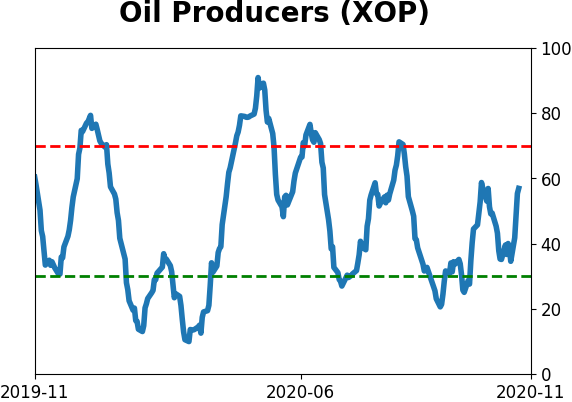
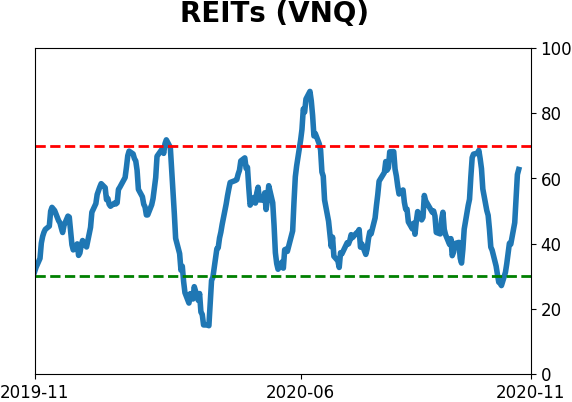
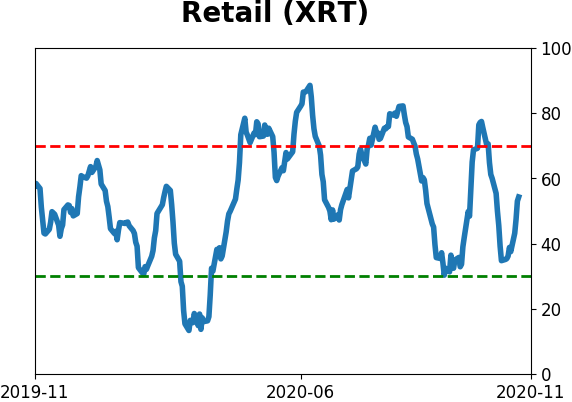
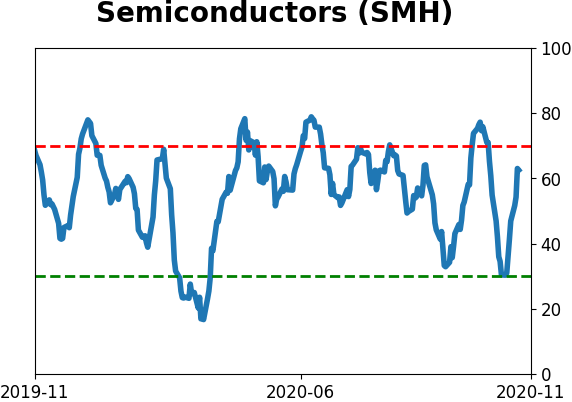
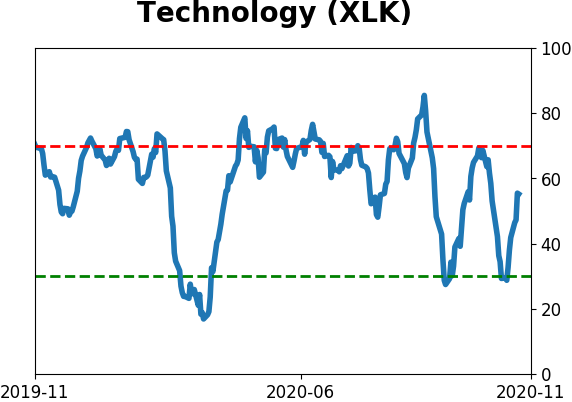
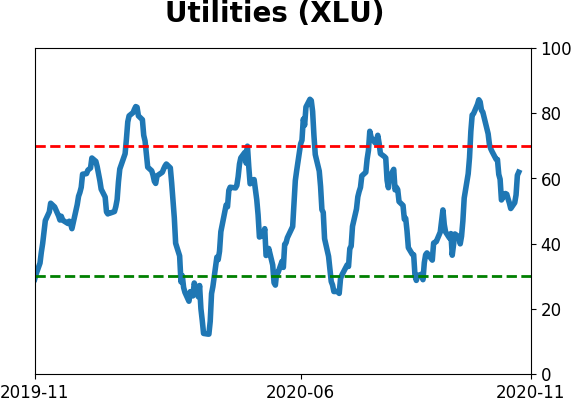
Sector ETF's - 10-Day Moving Average
|
|
|
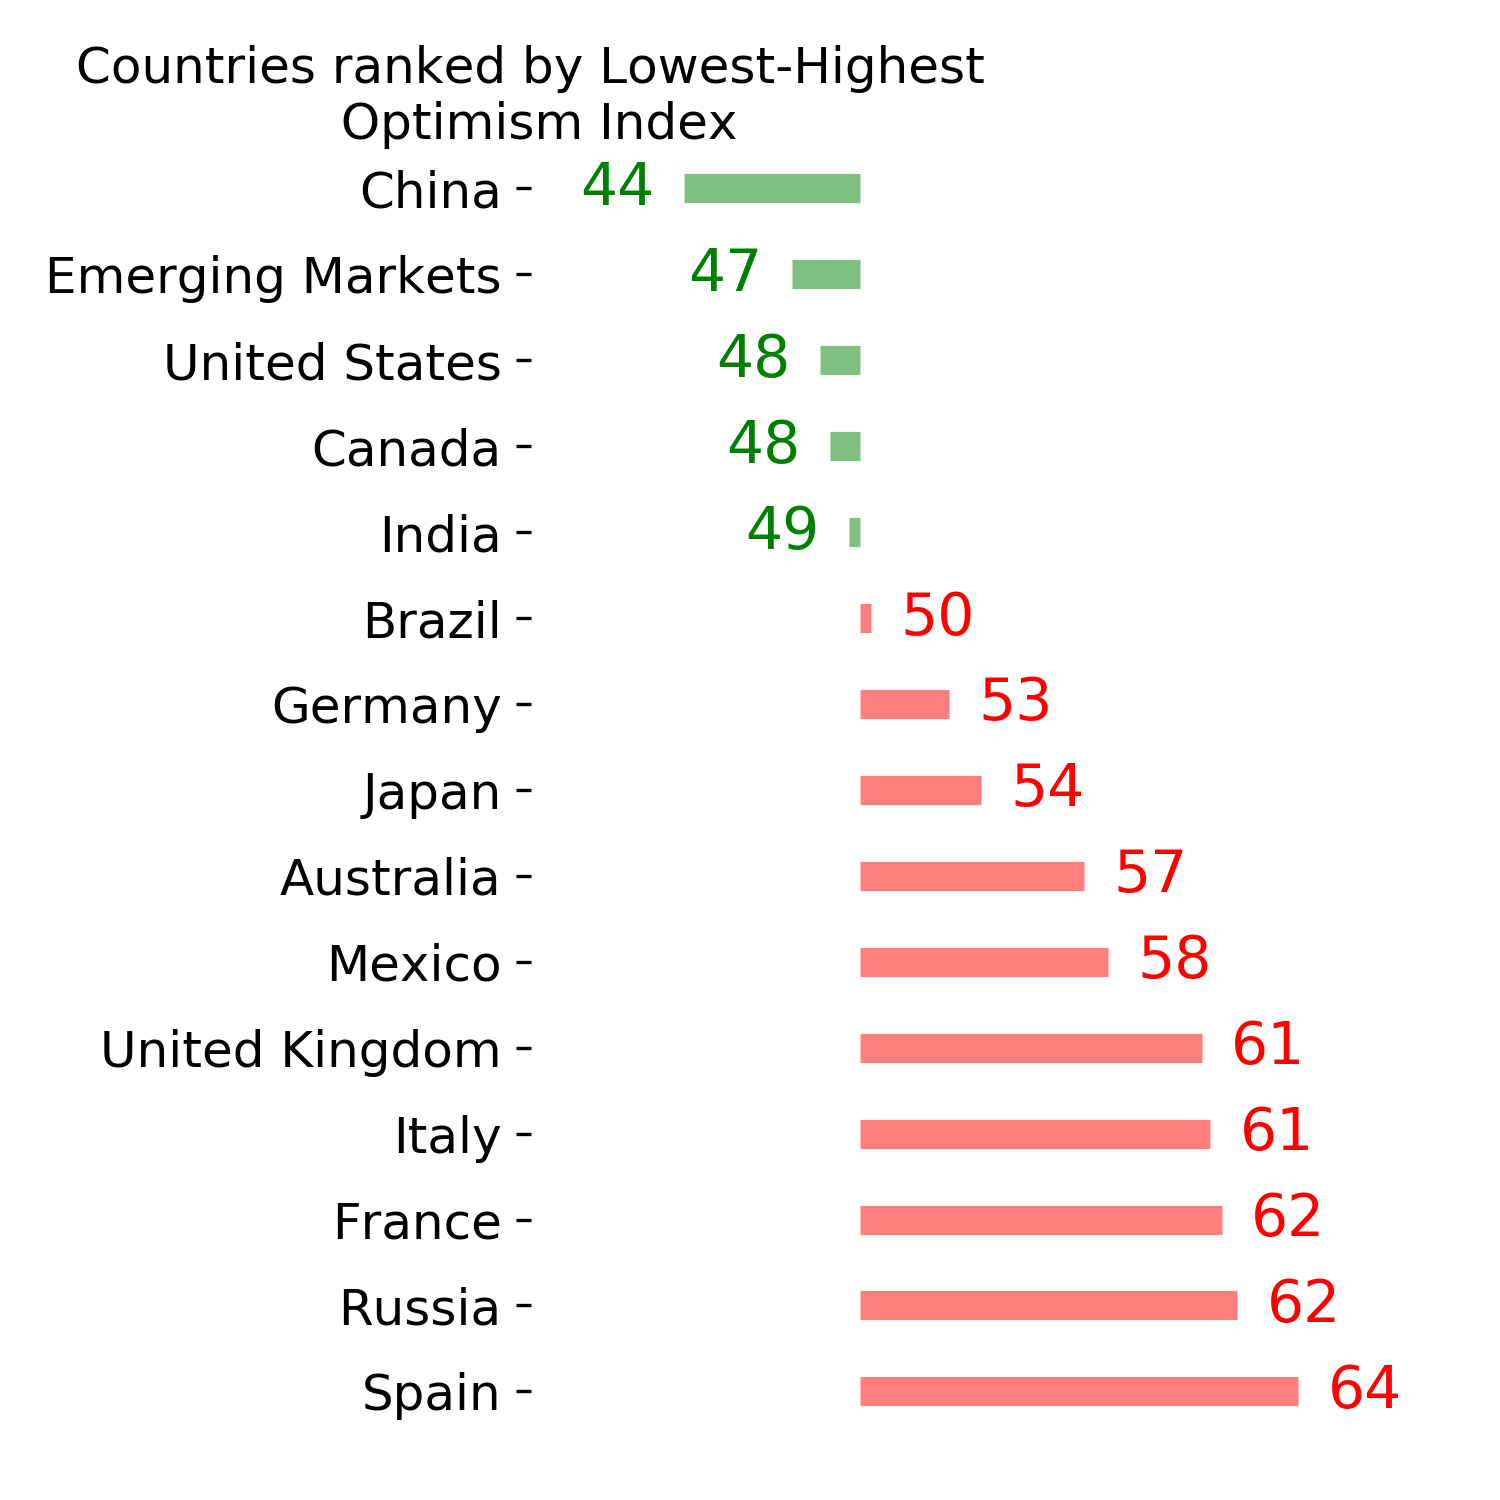
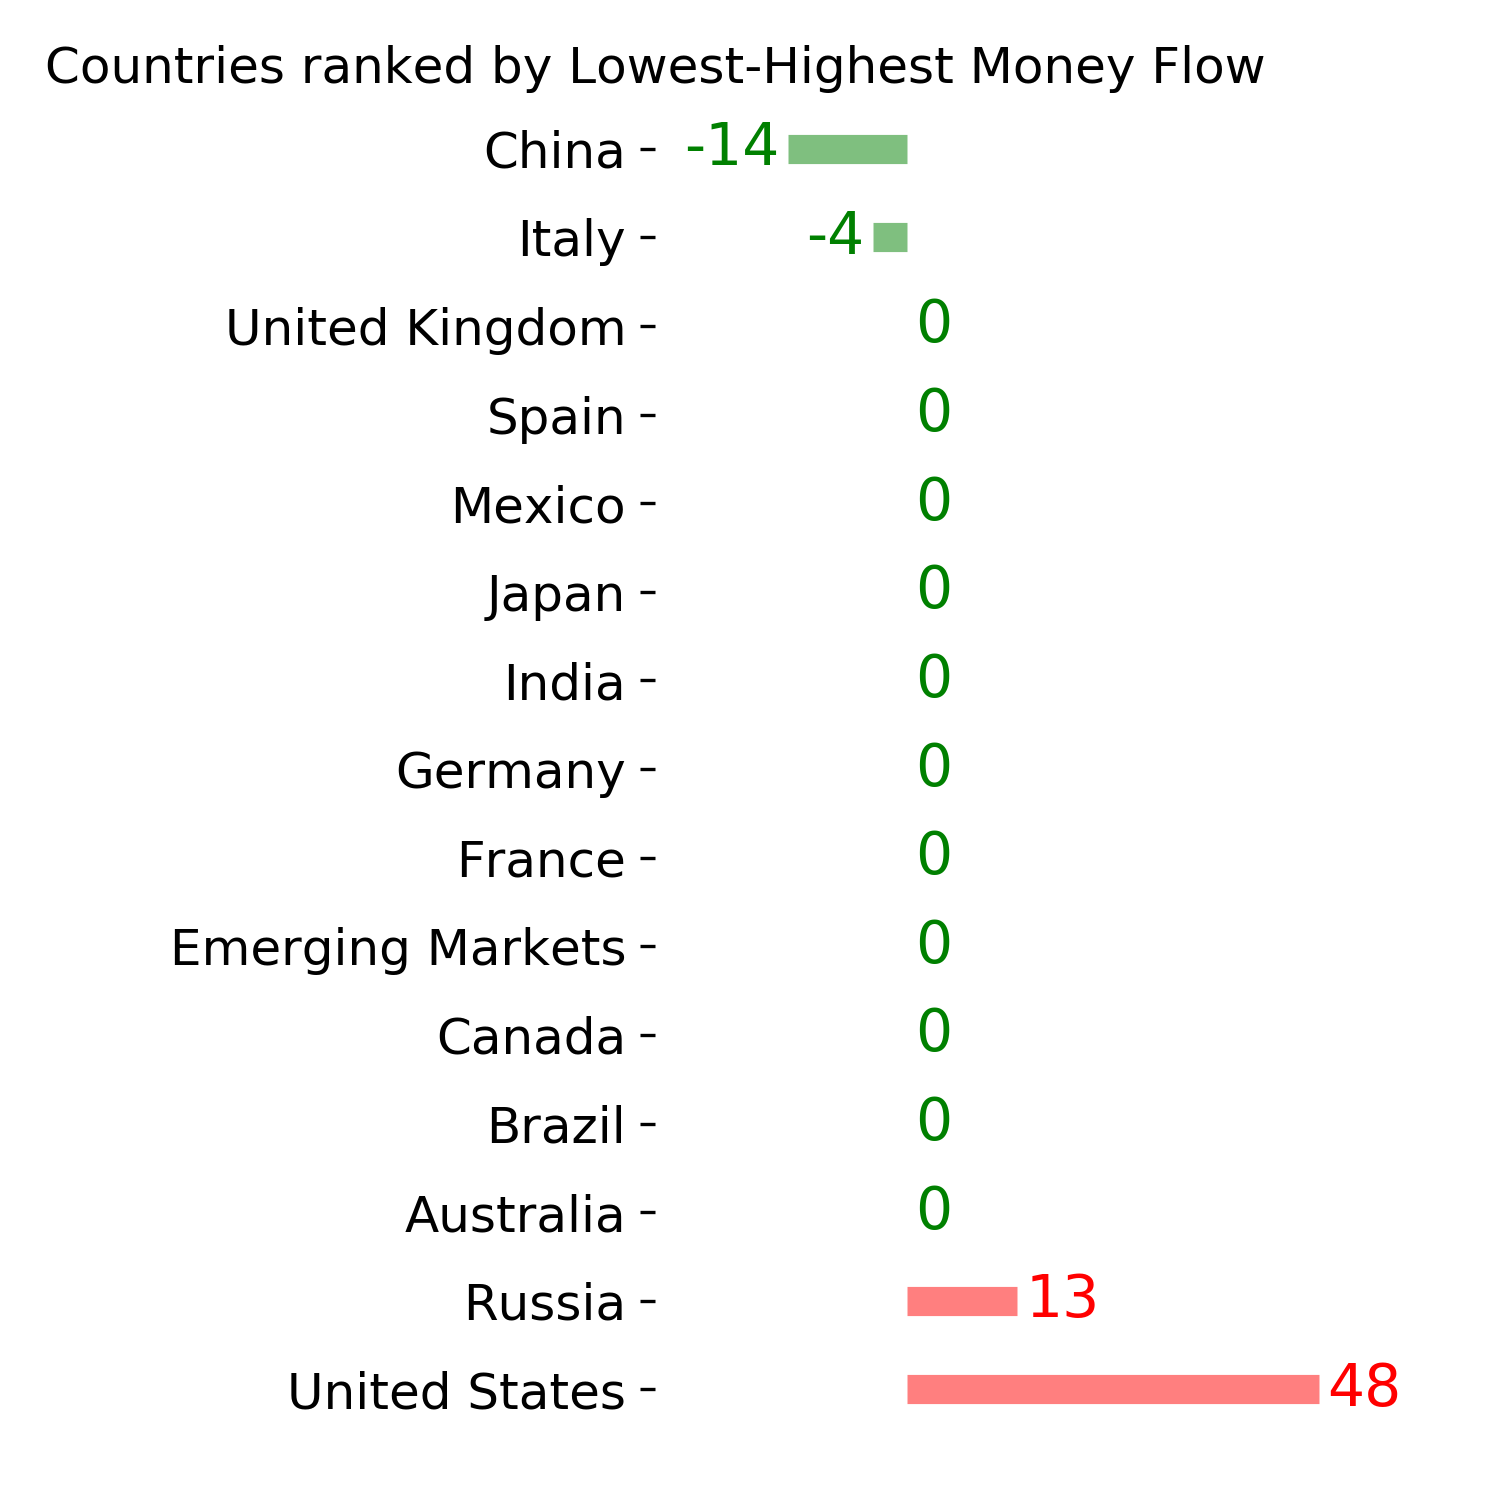
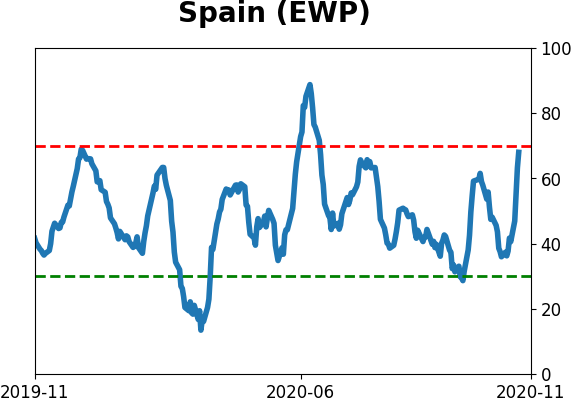
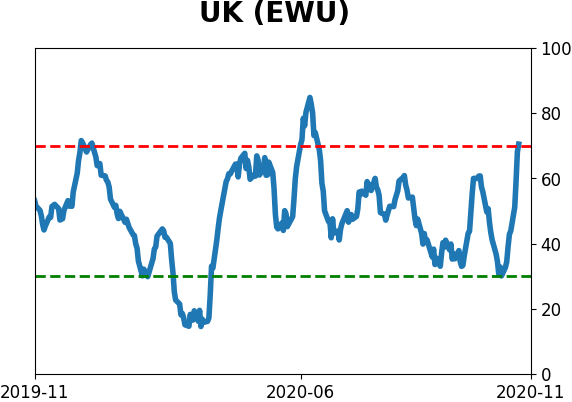
Country ETF's - 10-Day Moving Average
|
|
|
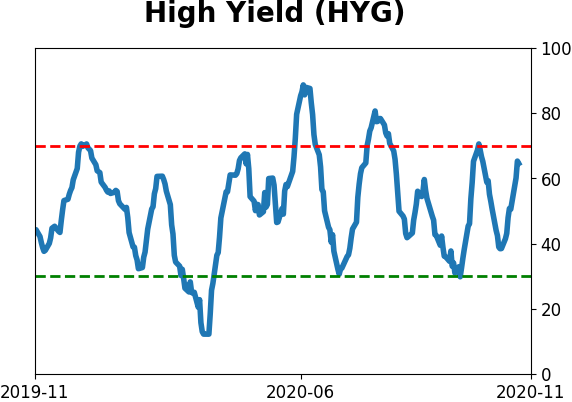
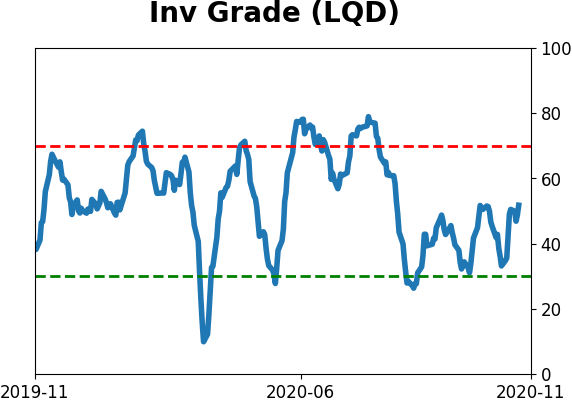
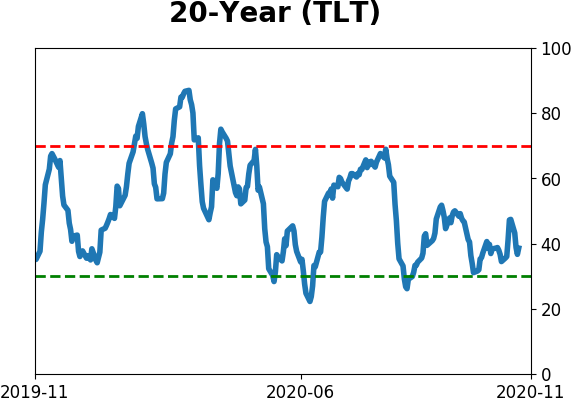
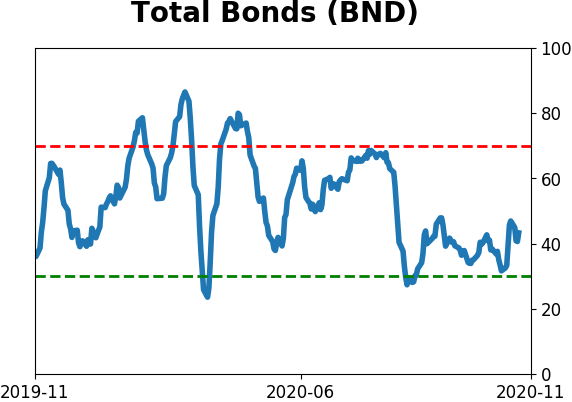
Bond ETF's - 10-Day Moving Average
|
|
|
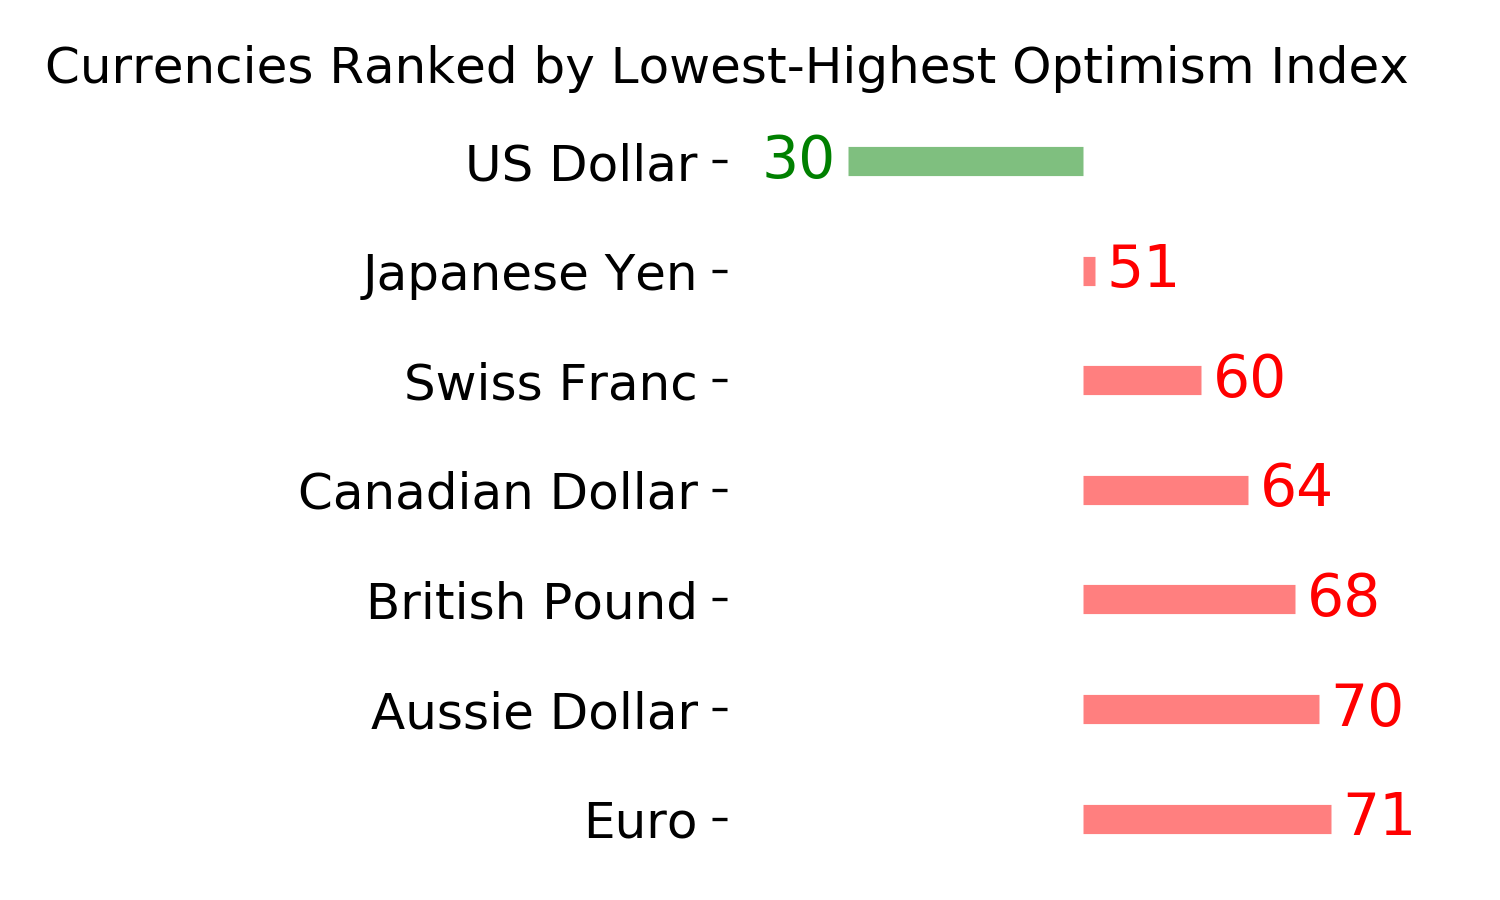
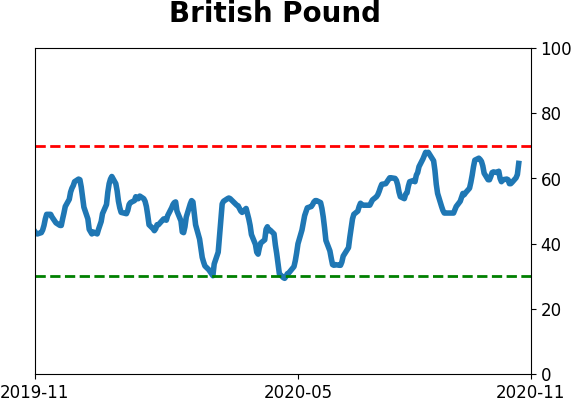
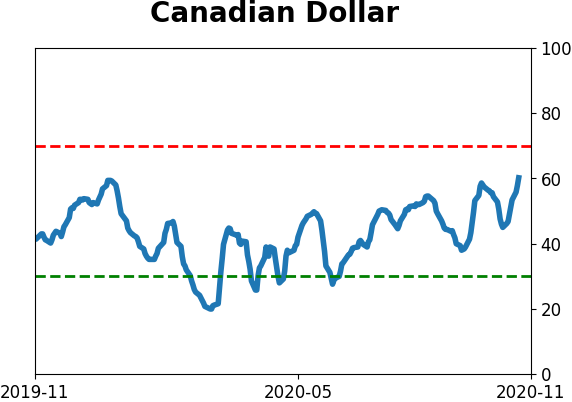
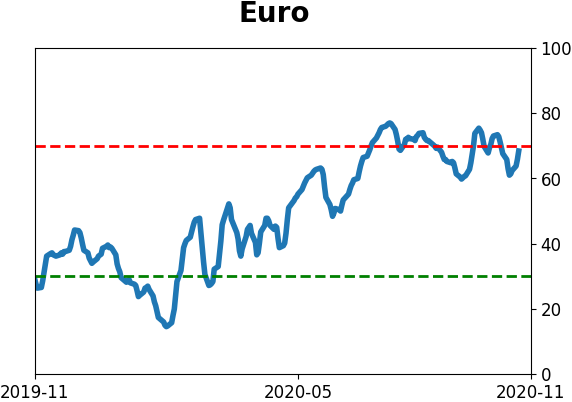
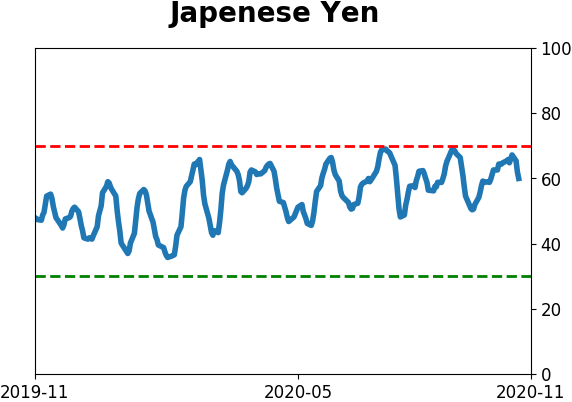
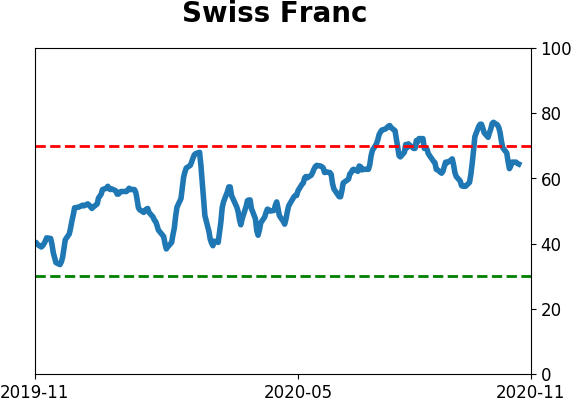
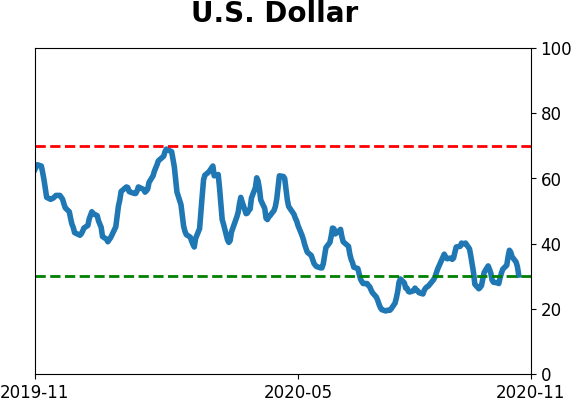
Currency ETF's - 5-Day Moving Average
|
|
|
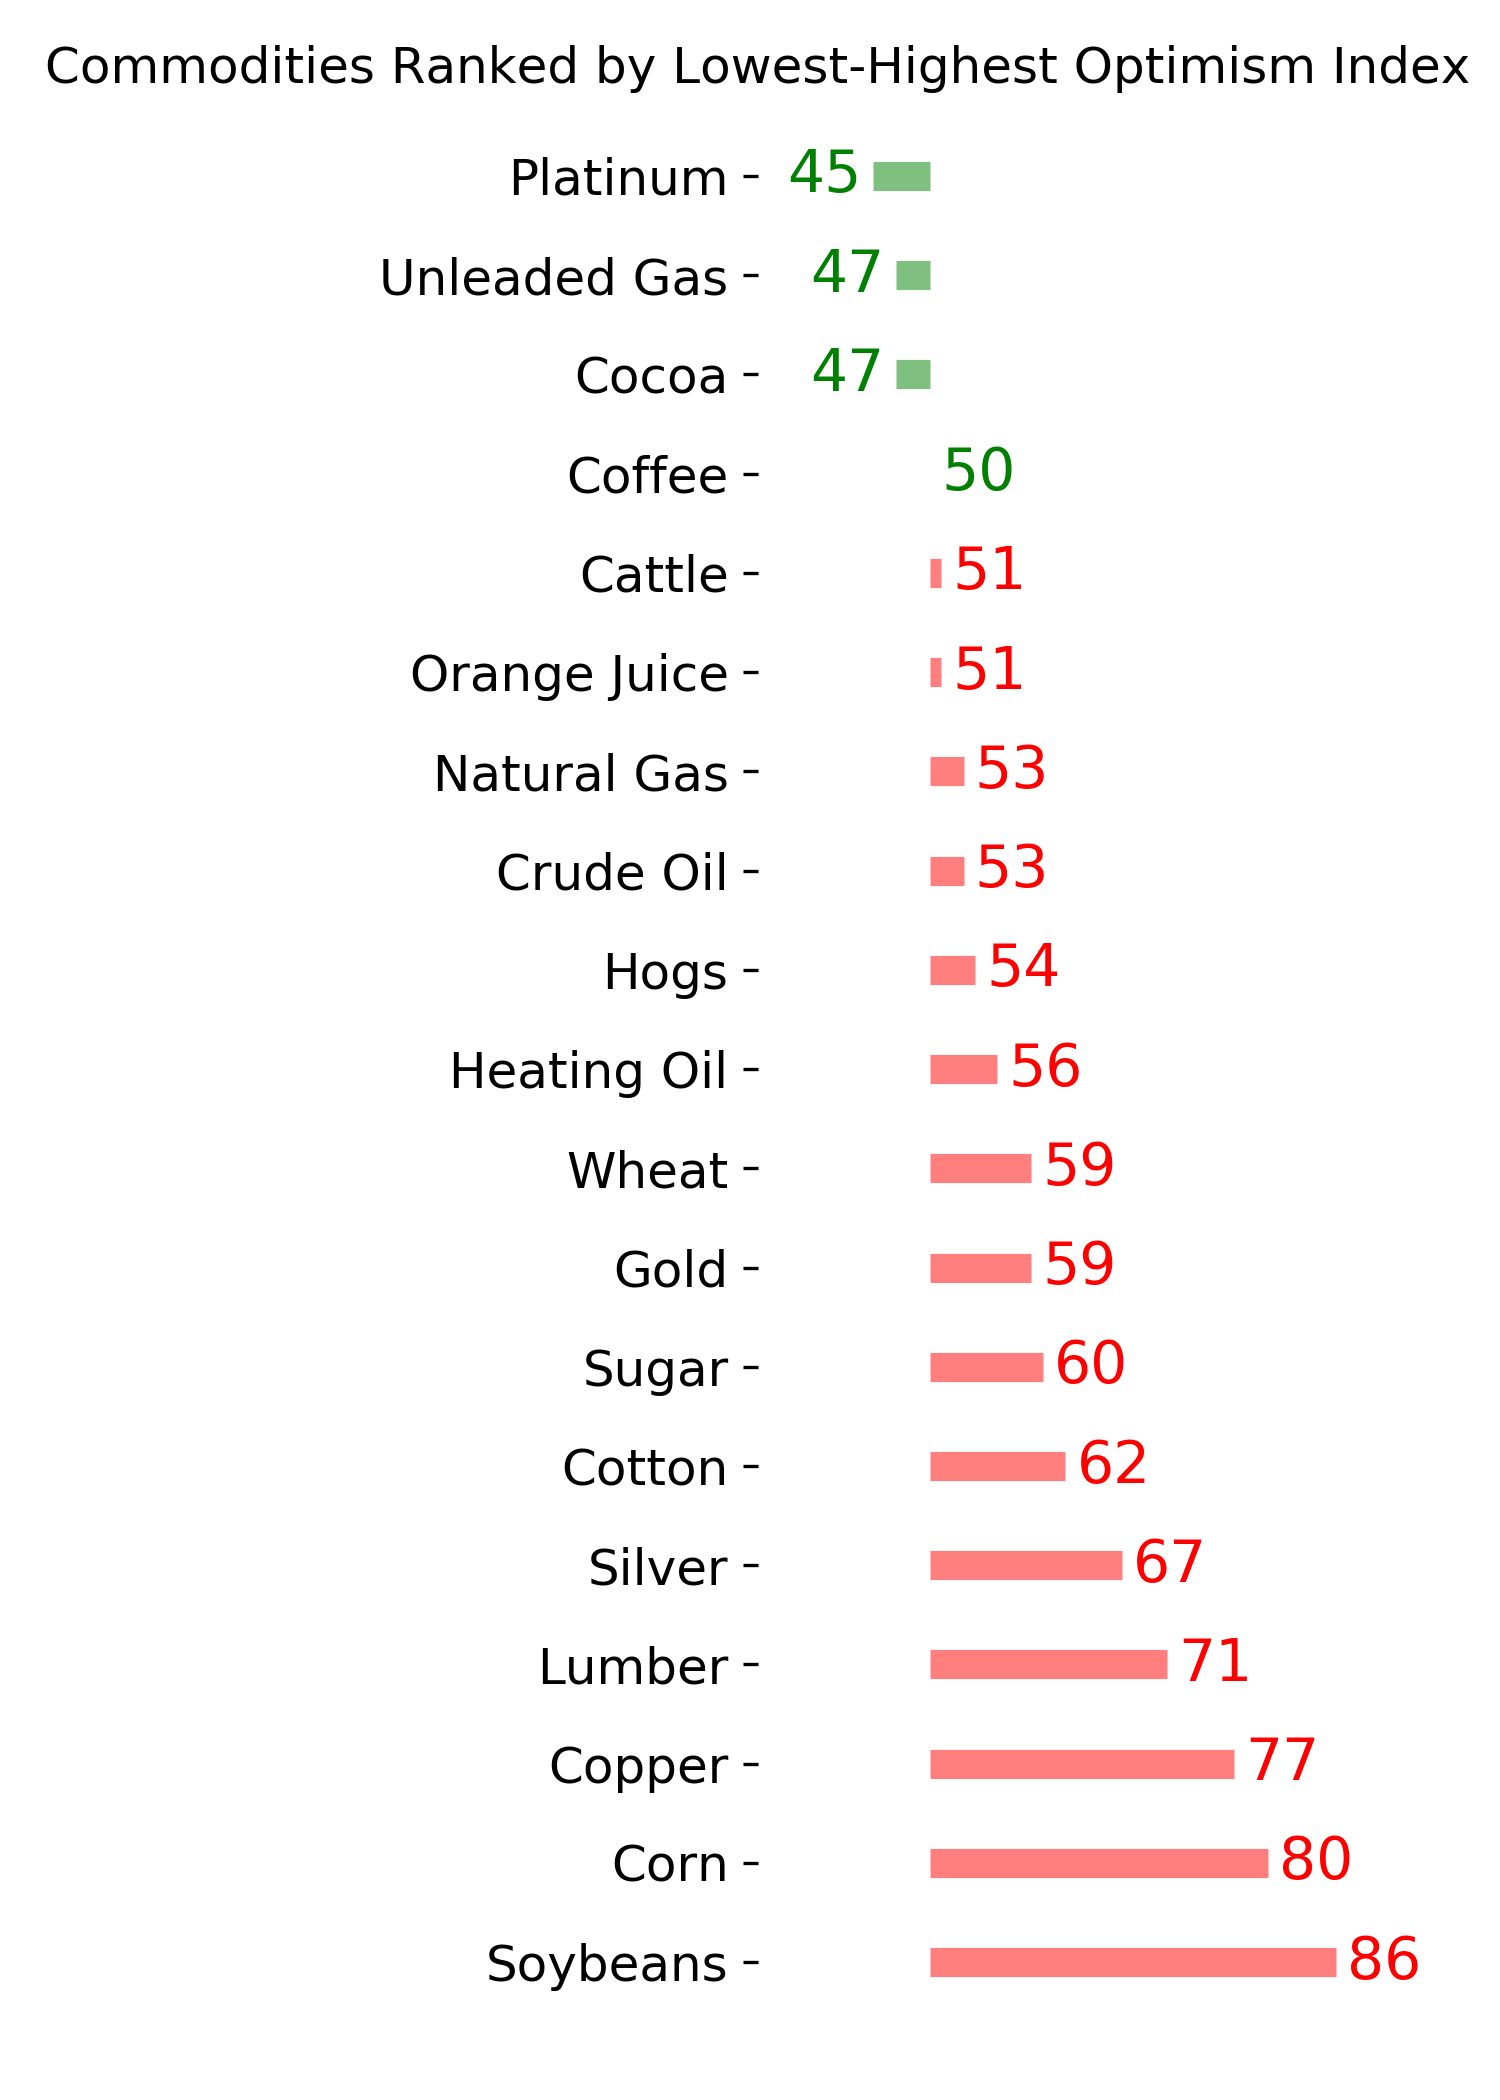
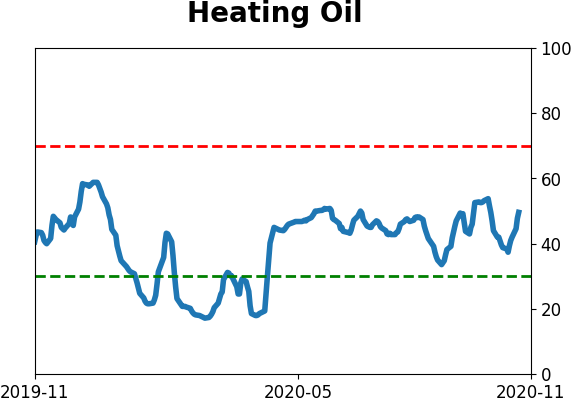
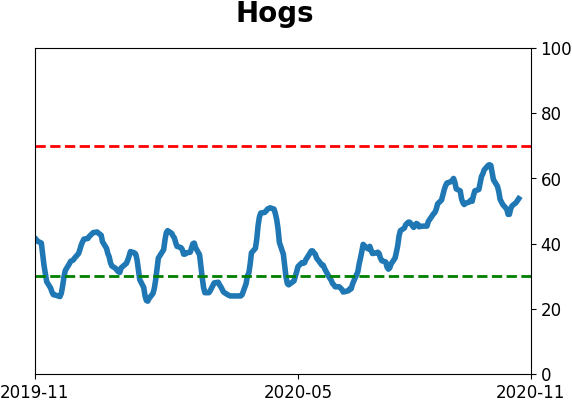
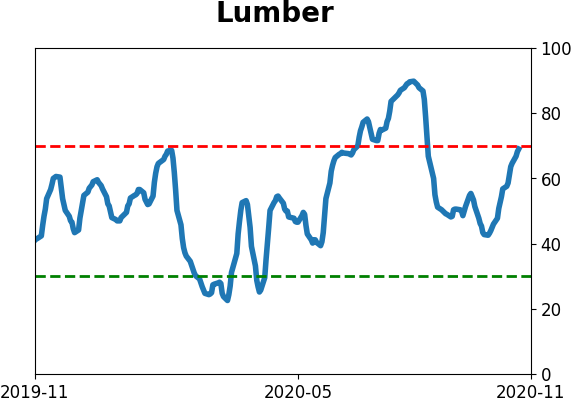
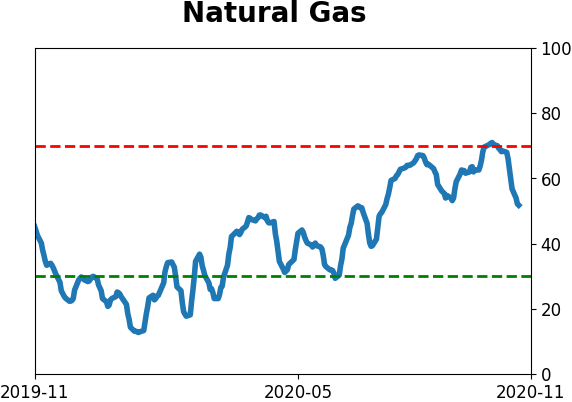
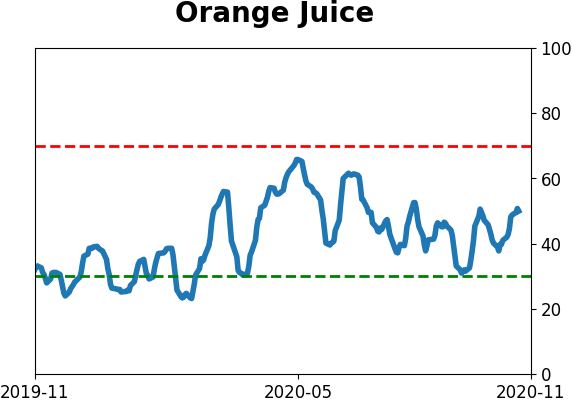
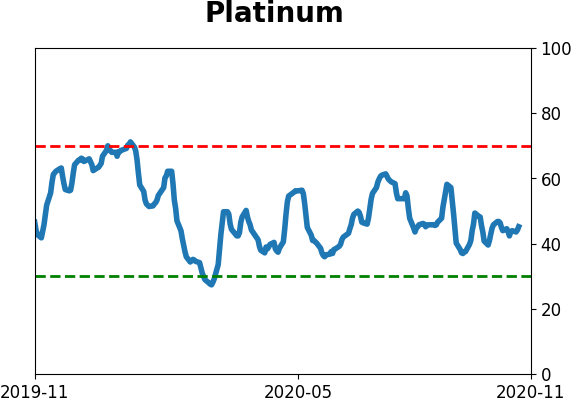
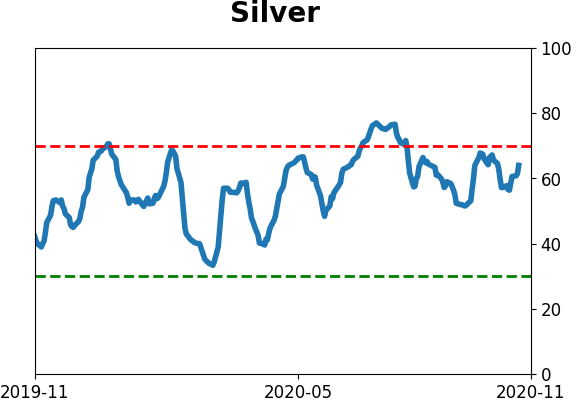
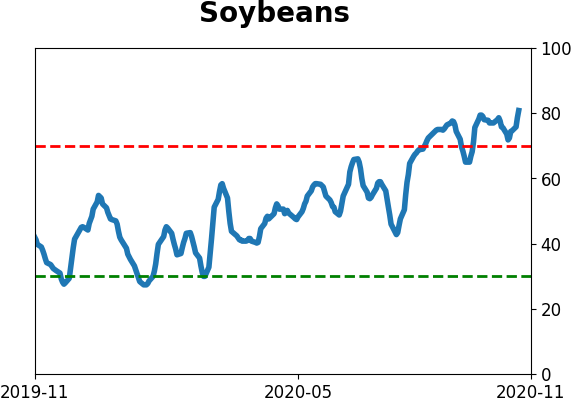
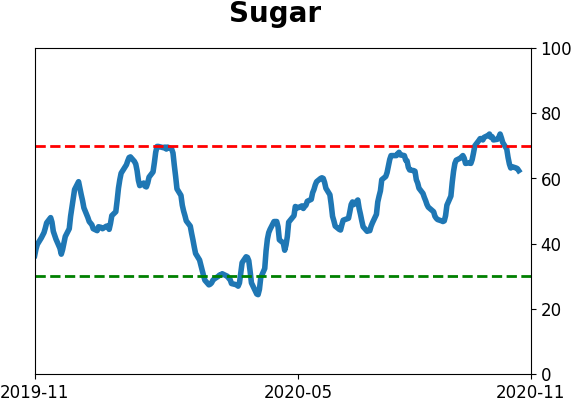
Commodity ETF's - 5-Day Moving Average
|
|