Headlines
|
|
A broad breakout:
The relief rally on Monday pushed more than 80% of S&P 500 stocks above their 200-day moving averages, and more than 25% of them to new highs. There was also a surge in positive reactions in discretionary, material, and industrial stocks.
Buy-losers-and-sell-winners hits historic proportions:
Monday's lurch from large to small stocks, and from growth to value, was among the most extreme in 75 years. That builds on months of wide swings between them. There have been 2 other periods in history when this happened, both leading to massive shifts to small and value stocks.
Bottom Line:
- A positive environment favors becoming aggressive on signs of excessive pessimism, of which there are few yet.
|
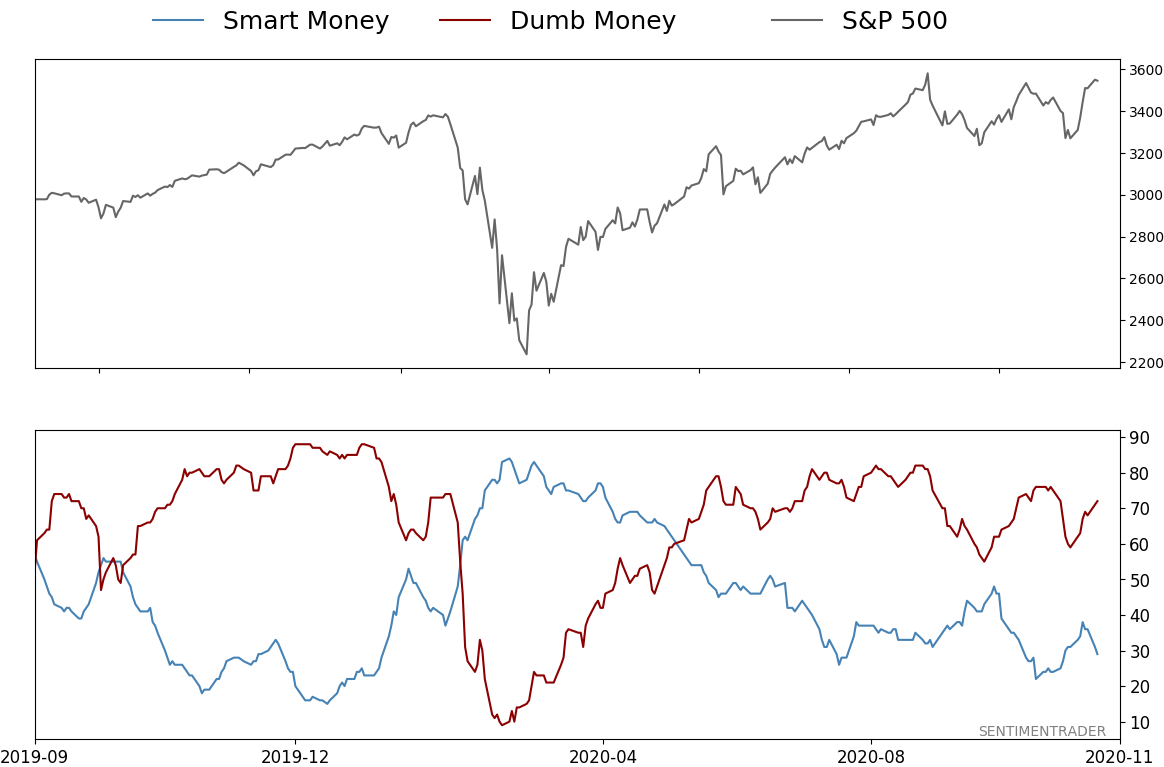
Smart / Dumb Money Confidence
|
Smart Money Confidence: 29%
Dumb Money Confidence: 72%
|
|
Risk Levels
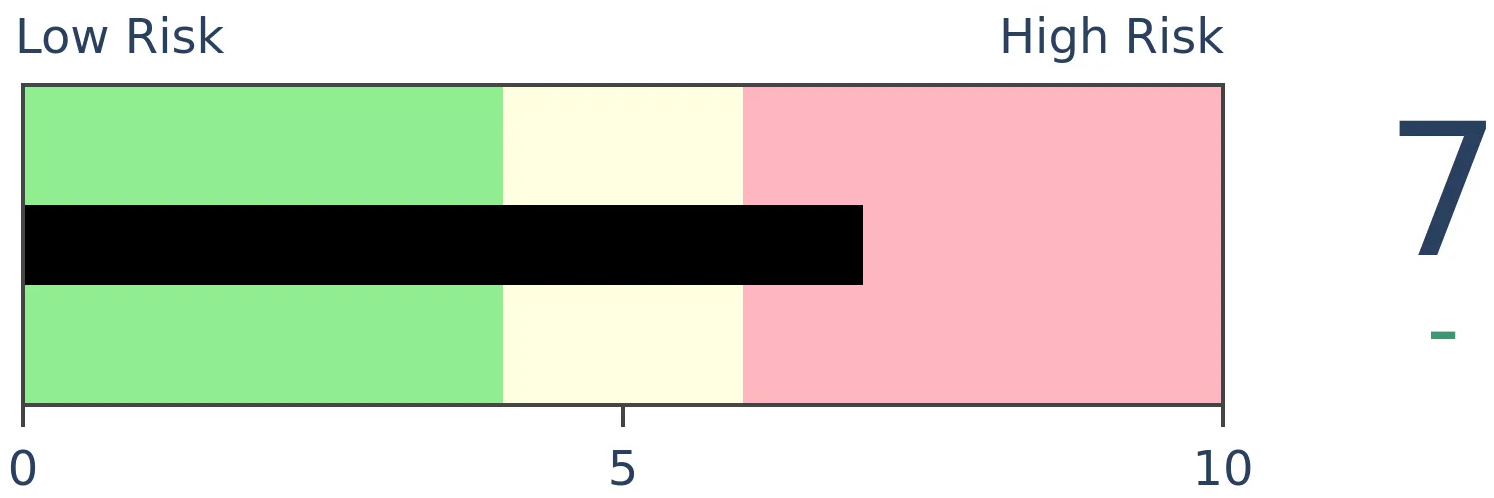
Stocks Short-Term
|
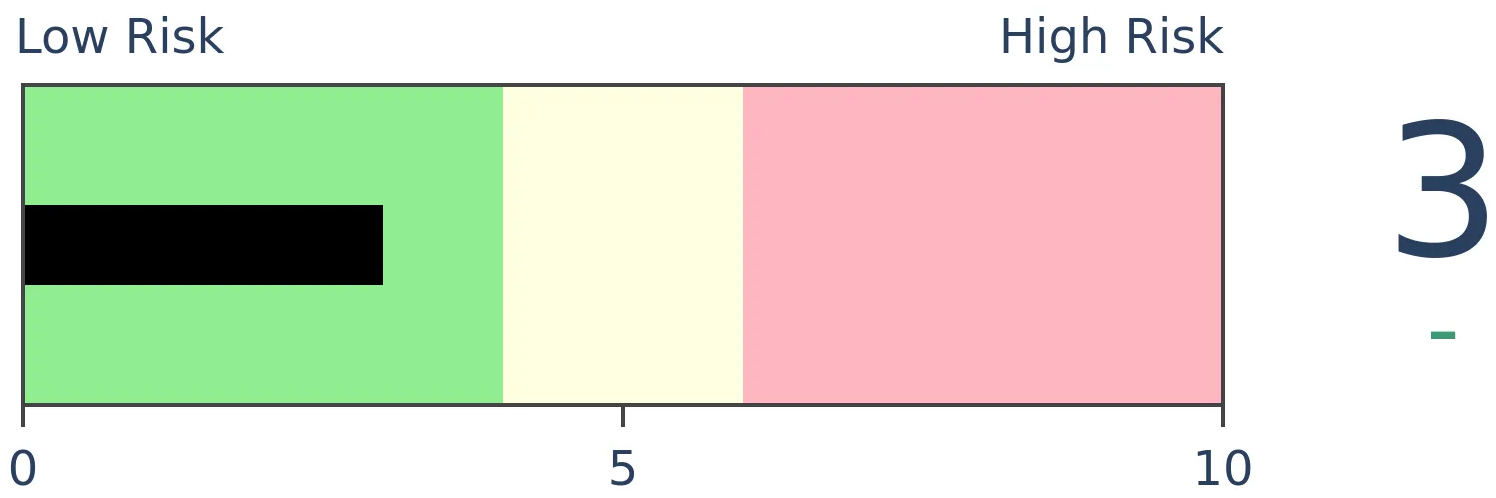
Stocks Medium-Term
|
|
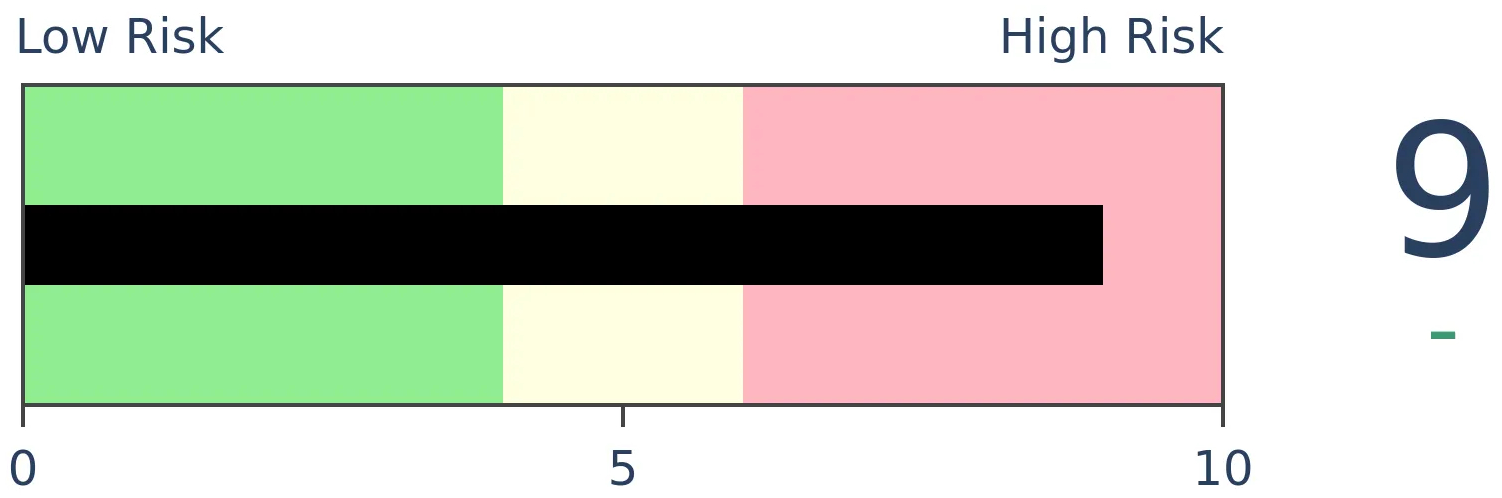
Bonds

|
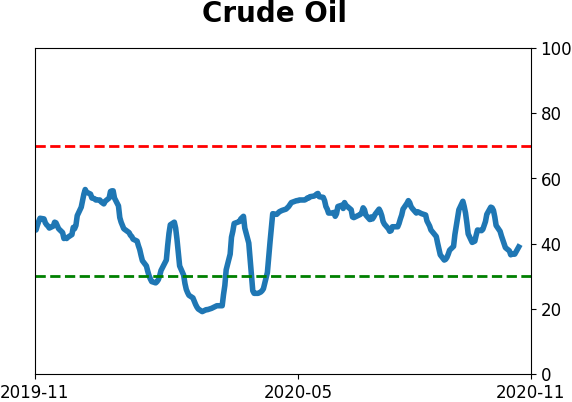
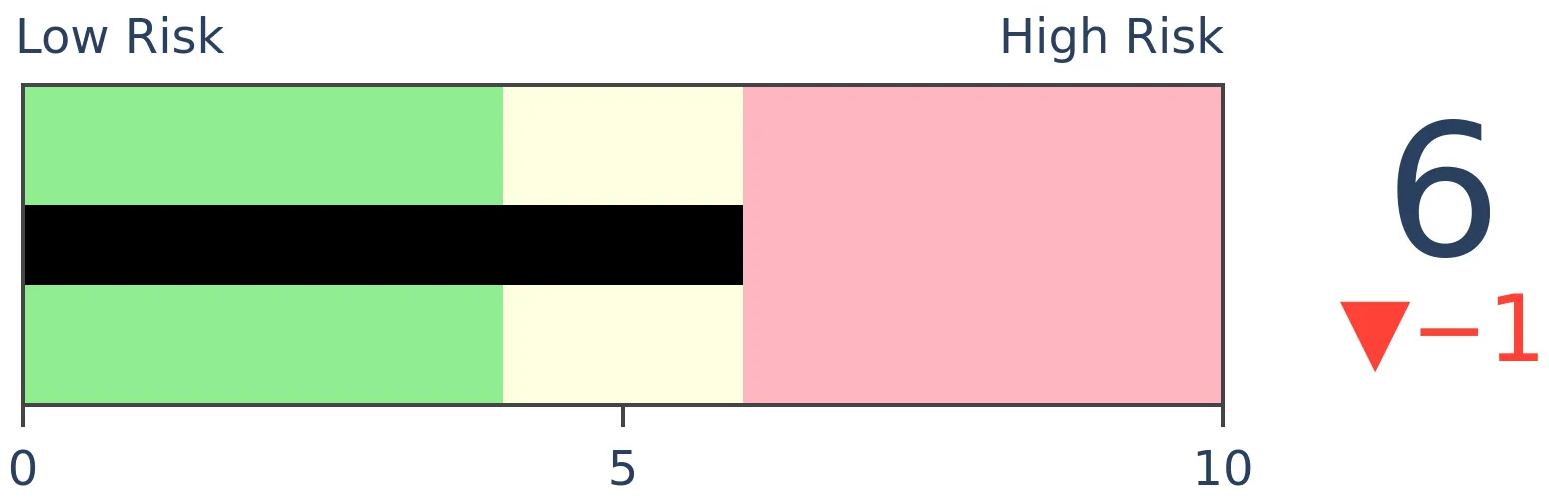
Crude Oil
|
|
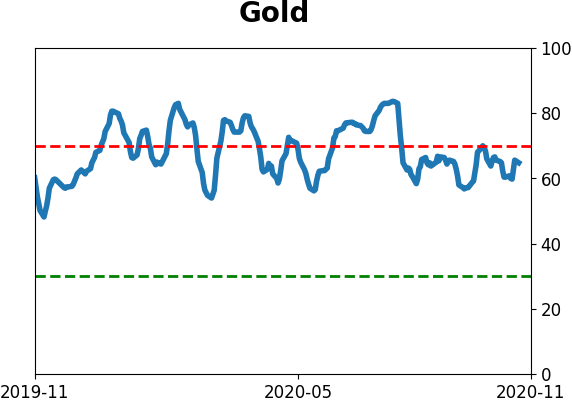
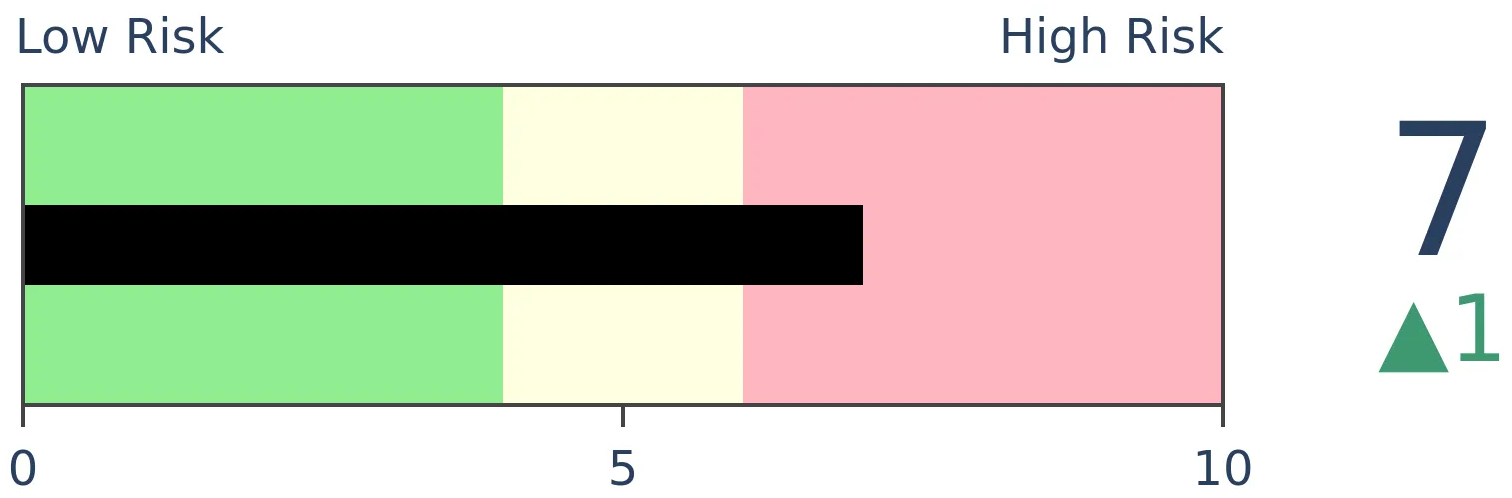
Gold
|
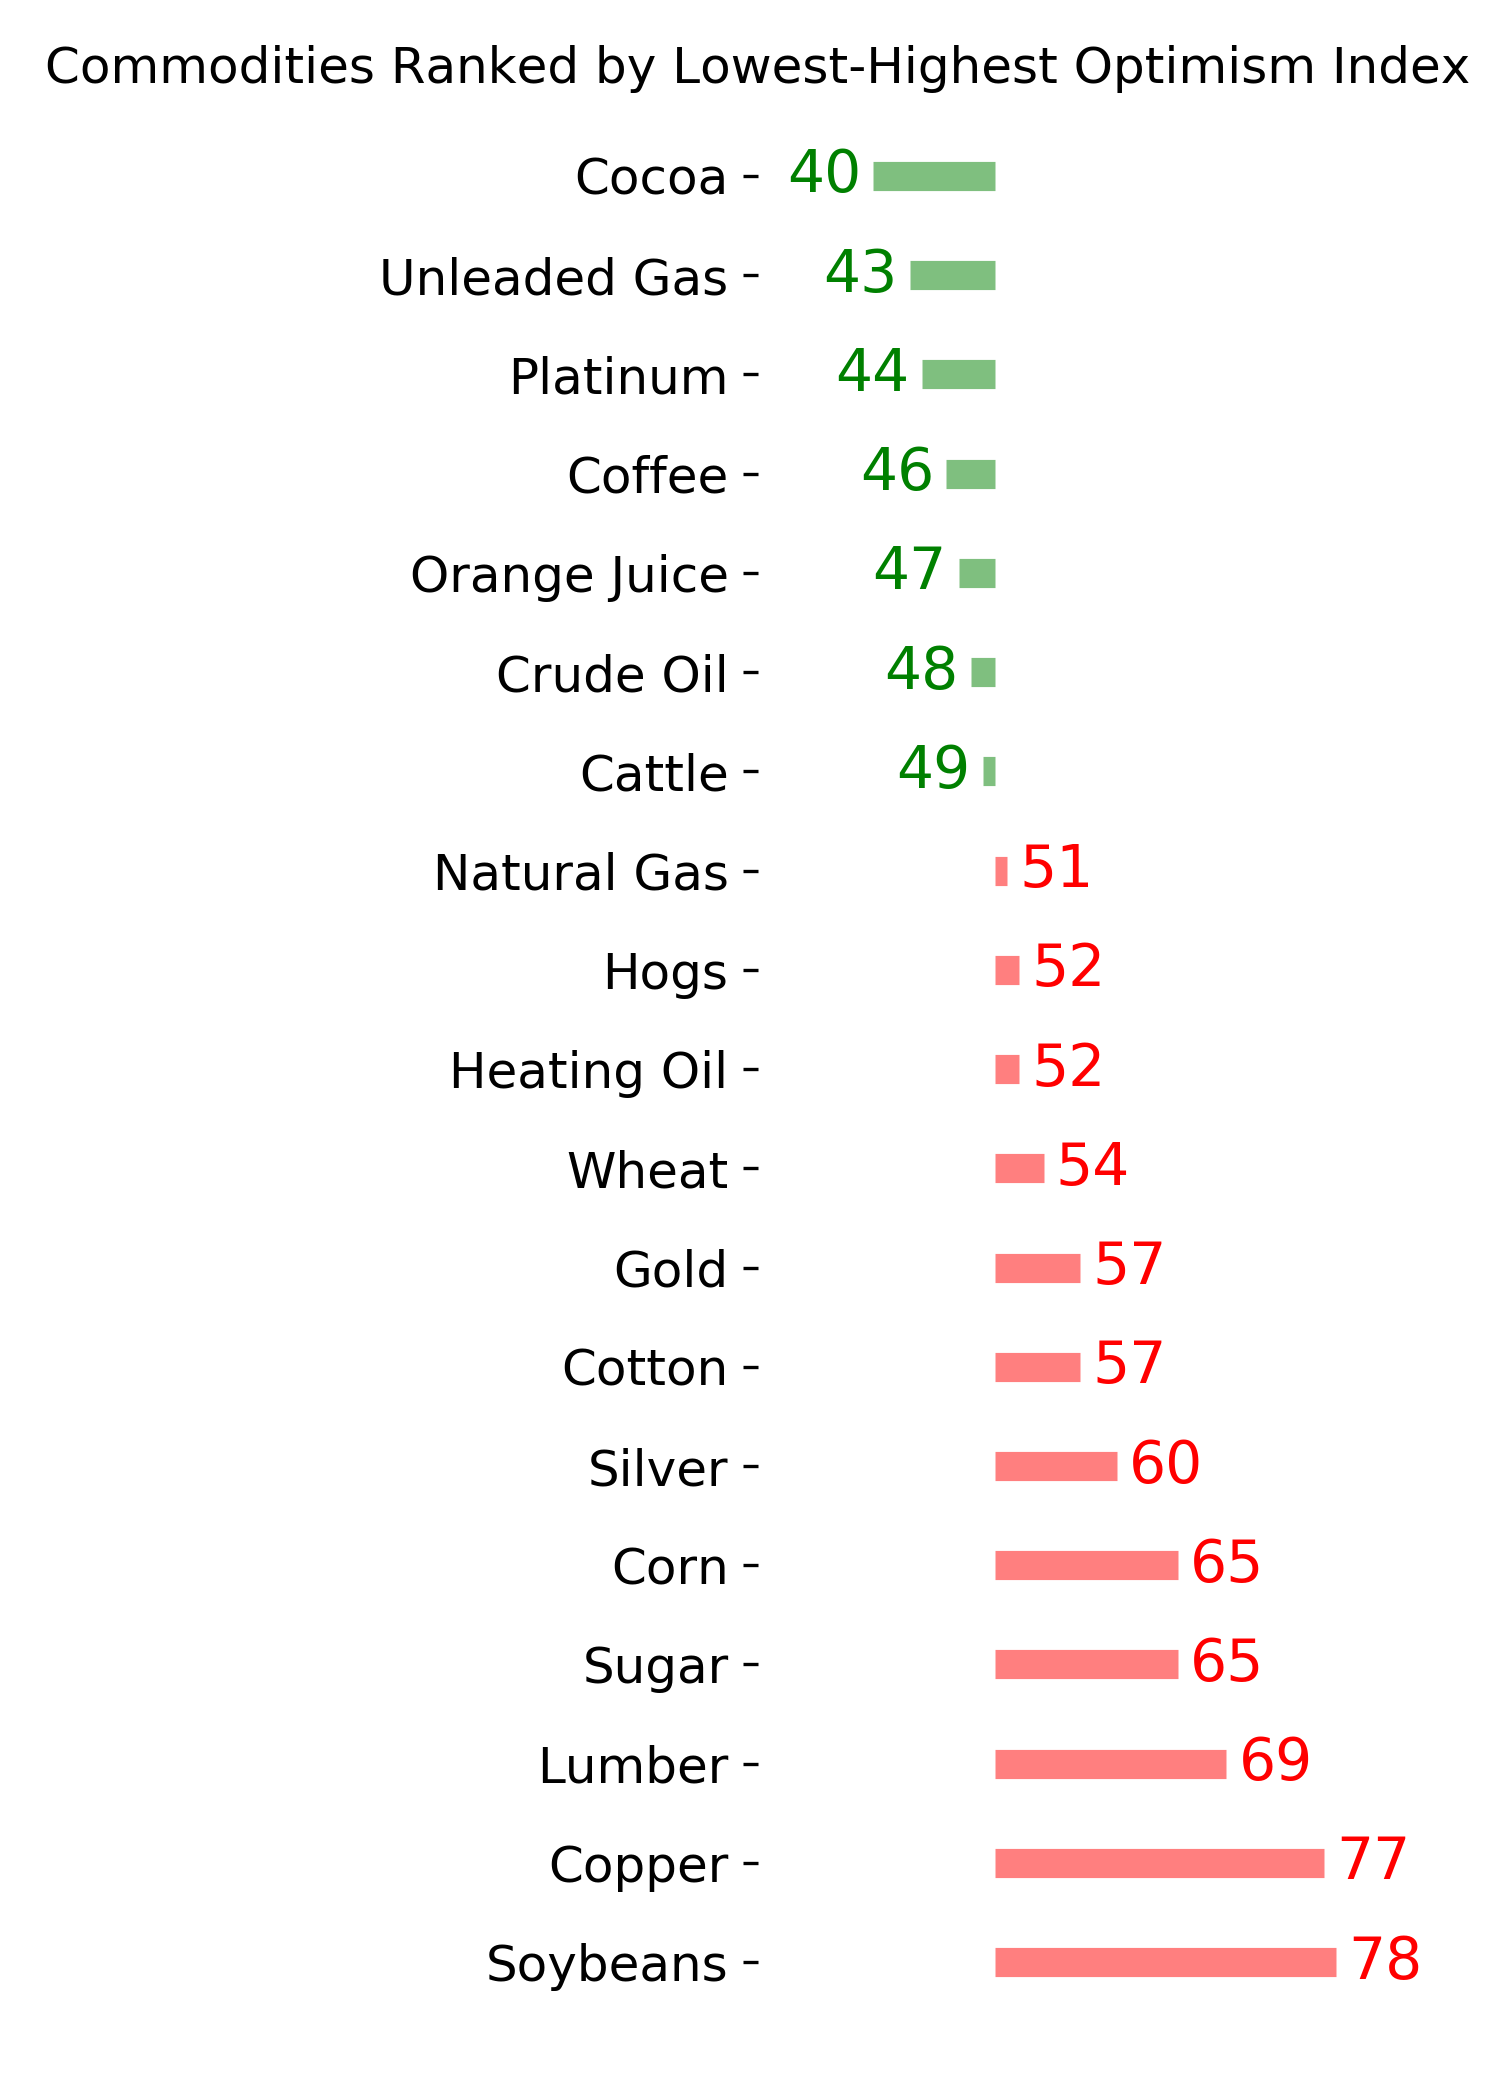
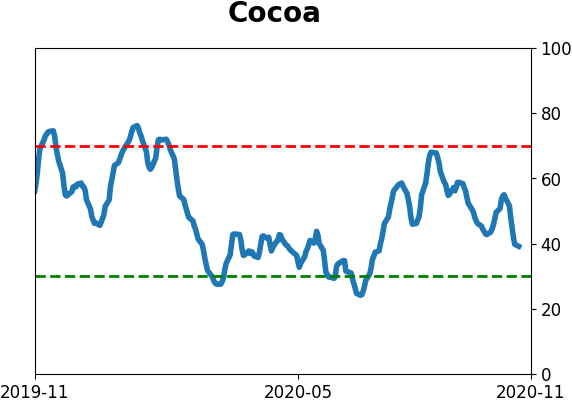
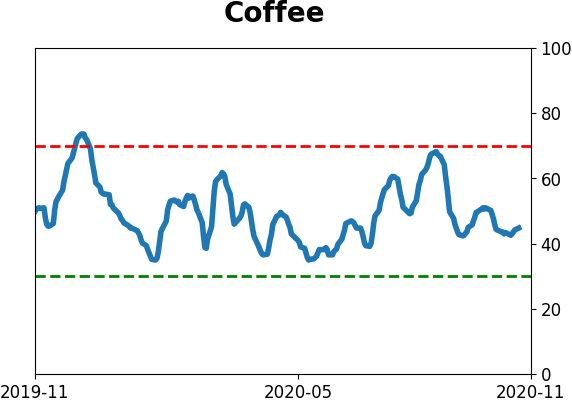
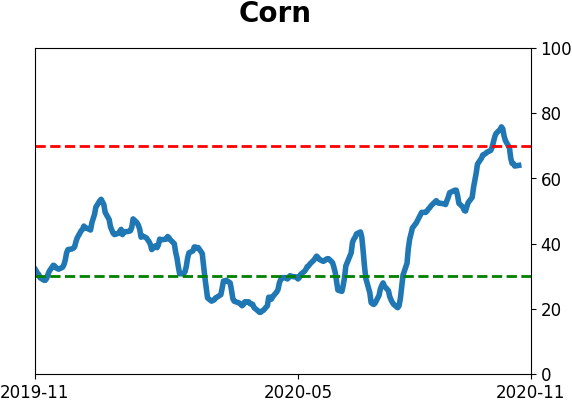
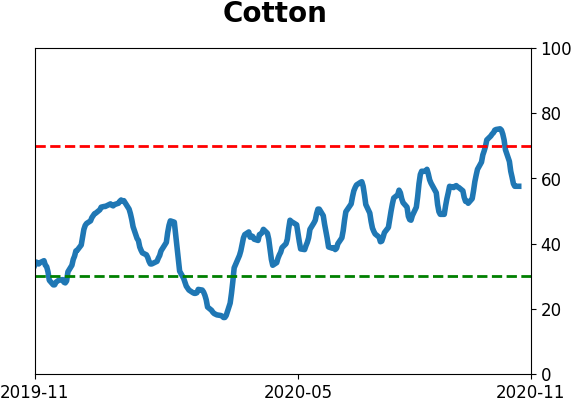
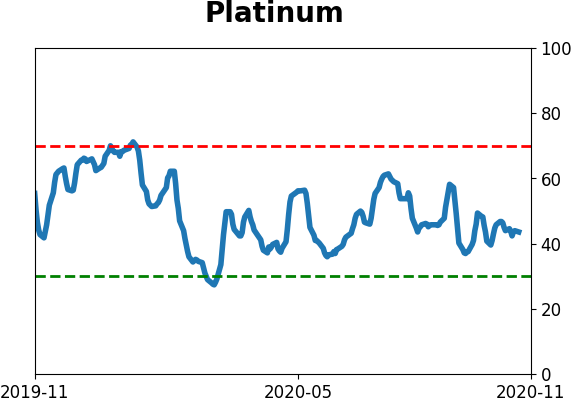
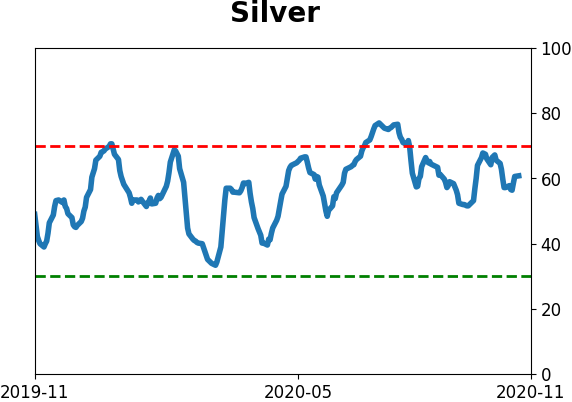
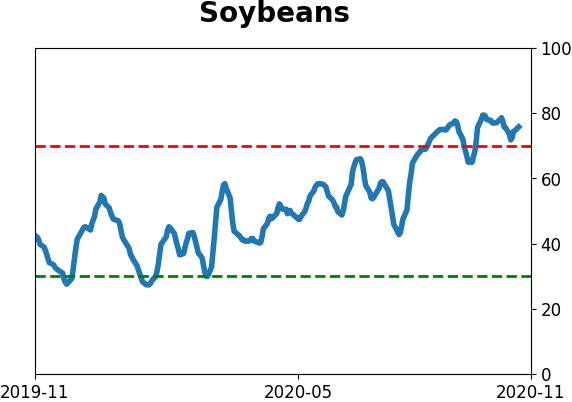
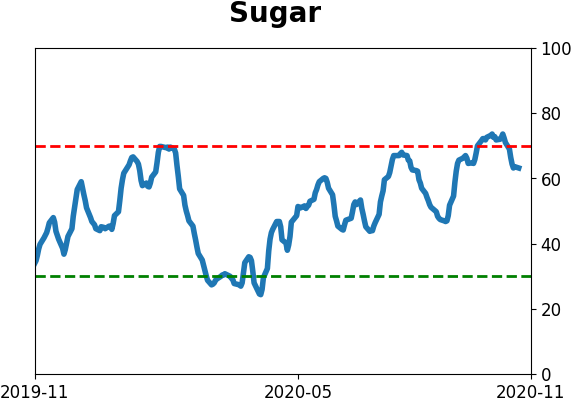
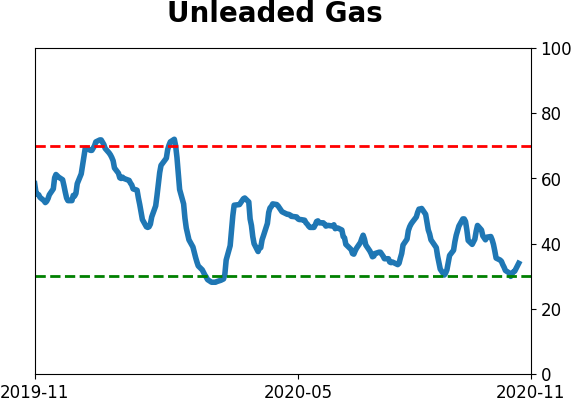
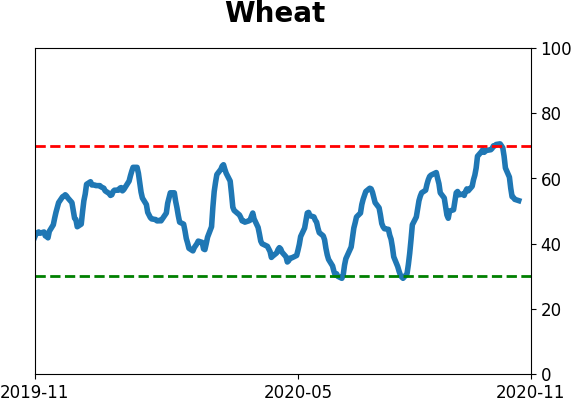
Agriculture
|
|
Research
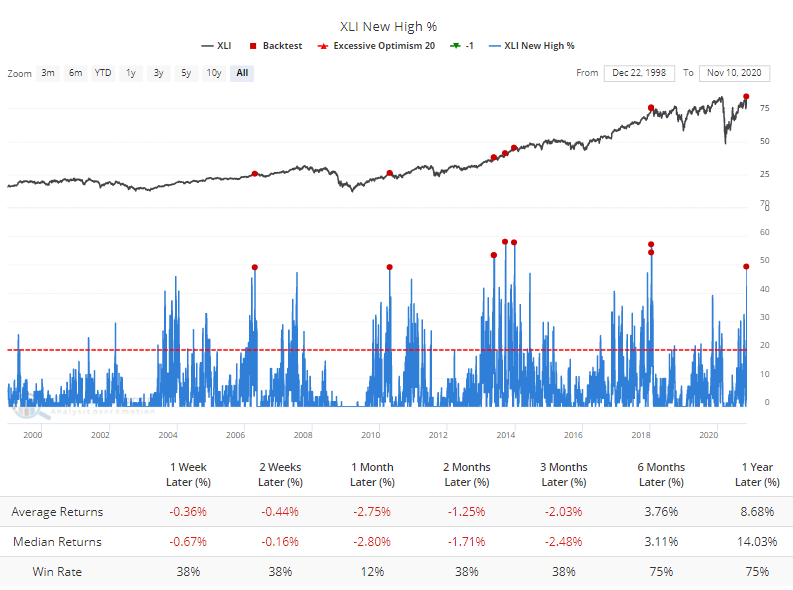
BOTTOM LINE
The relief rally on Monday pushed more than 80% of S&P 500 stocks above their 200-day moving averages, and more than 25% of them to new highs. There was also a surge in positive reactions in discretionary, material, and industrial stocks.
FORECAST / TIMEFRAME
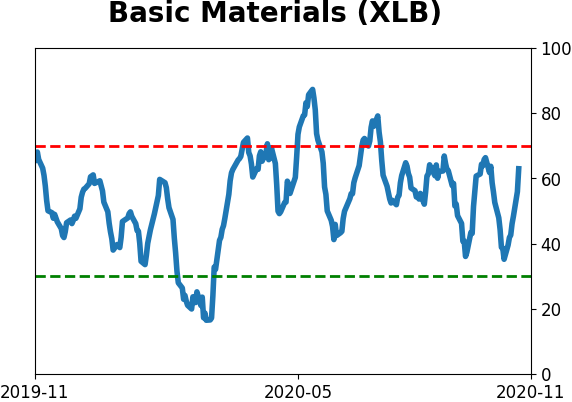
XLB -- Down, Short-Term
|
There's a whole lot of recovery going on.
Whatever your opinion on politics, it's hard to deny that the preliminary (?) election results on Saturday followed by the Pfizer vaccine news introduced a massive shift in psychology. As a result, we saw yet another wave of overwhelming buying pressure.
It was broad-based, too. For the 1st time in nearly 9 months, more than 80% of stocks in the S&P 500 managed to close above their 200-day moving averages.
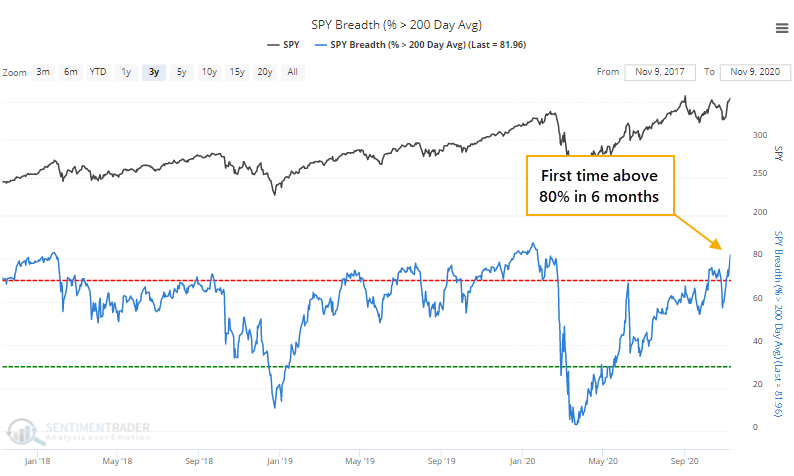
That marks a recovery from a point when fewer than 10% of stocks in the index were in uptrends. Over the past 30 years, such a cycle within a year's time has happened only 3 times, all of them very positive for forward returns.
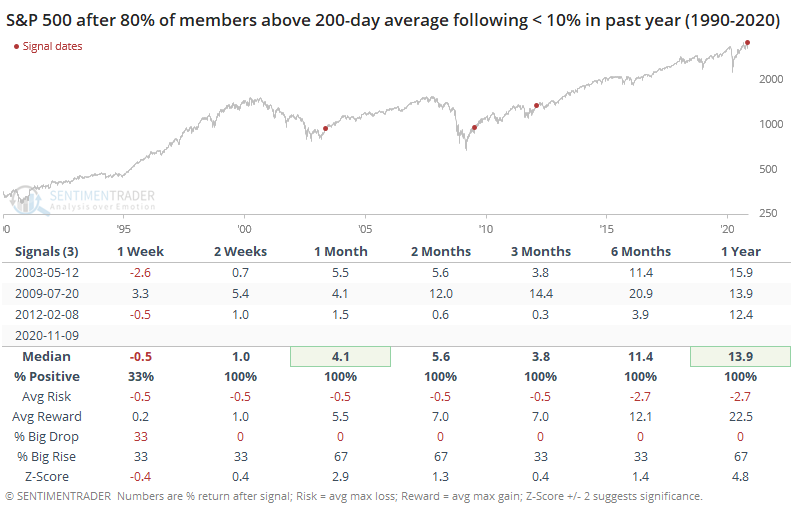
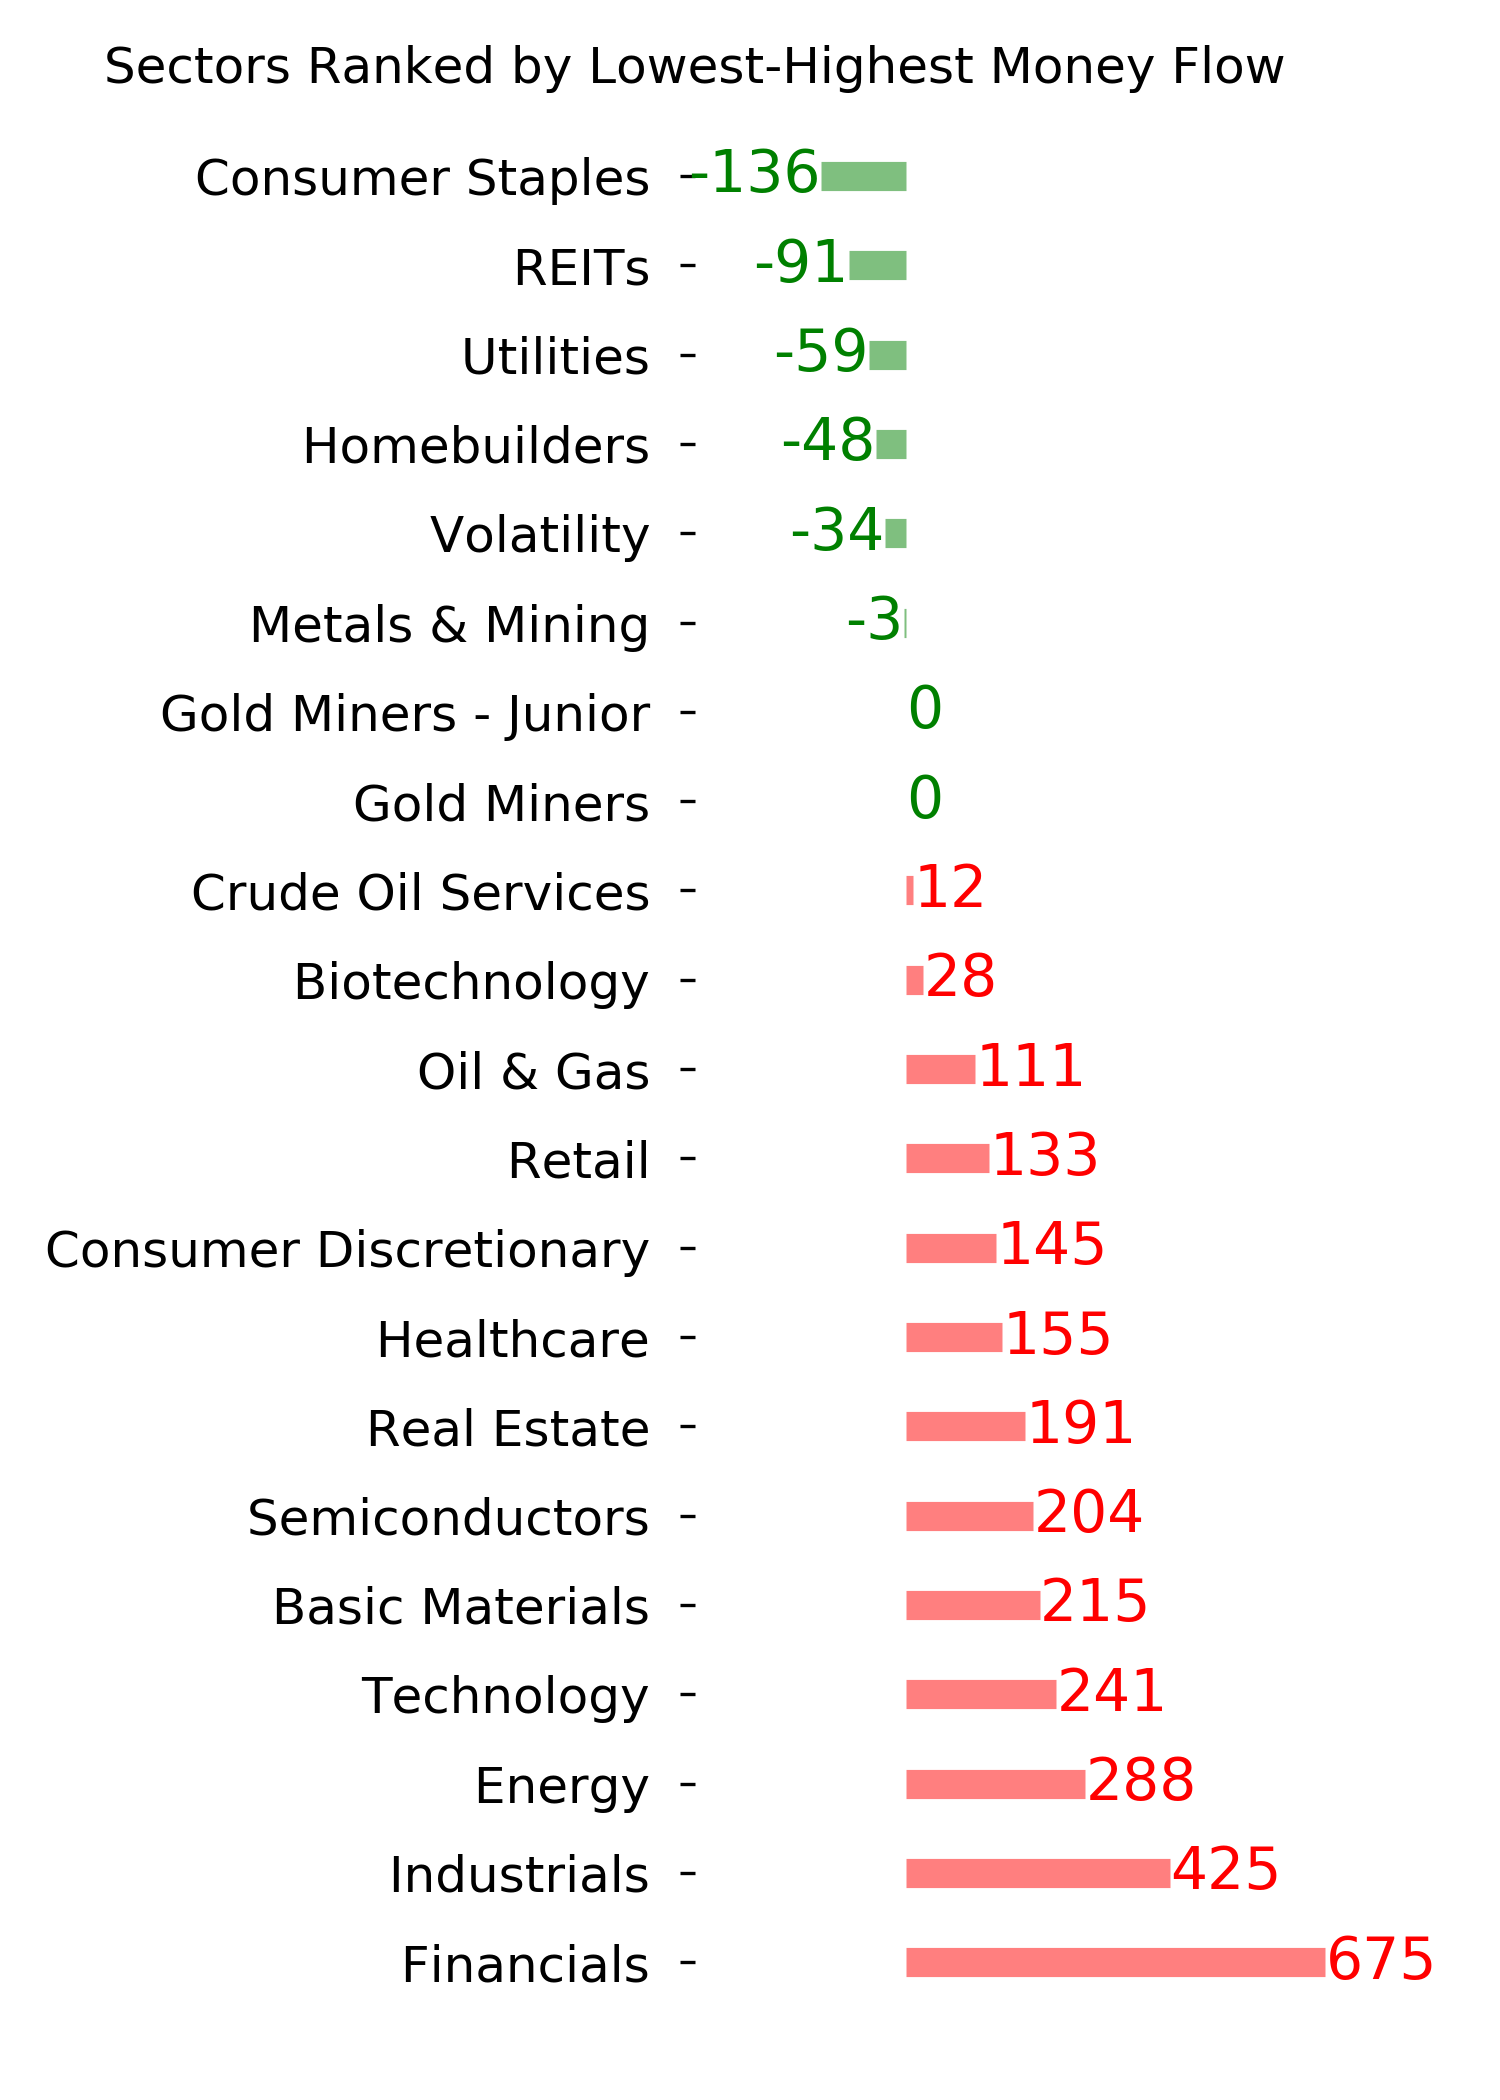
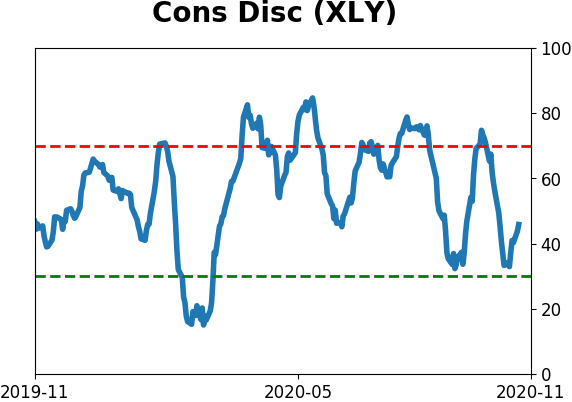
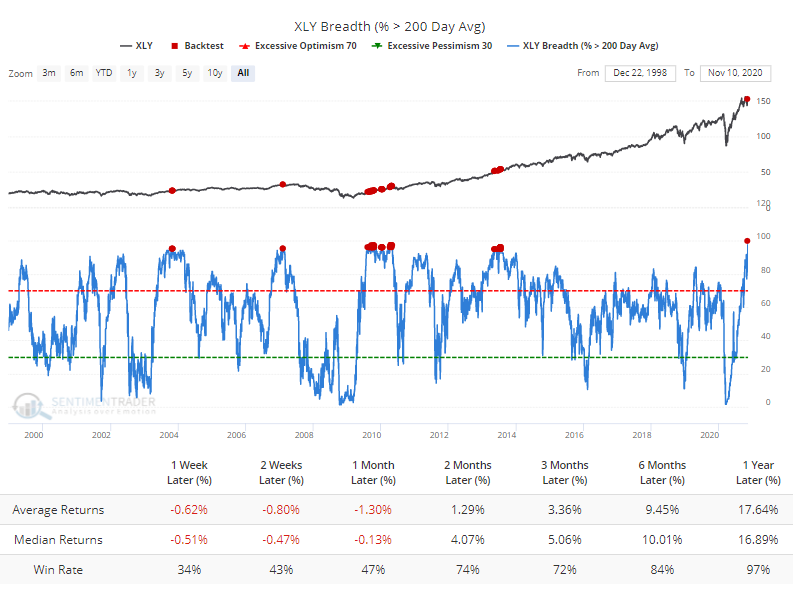
Among major sectors, every member of the Consumer Discretionary group managed to close above their 200-day average. Going back to 1990, that's never happened before. The handful of times more than 95% of the stocks did, the sector pulled back in the short-term but showed very good long-term returns according to the Backtest Engine.
Monday's jump also triggered a wave of 52-week highs in more than a quarter of stocks in the broader S&P 500 index. A surge in new highs is usually a short-term negative as traders need to digest the gains, but when it's the first big reading in months, it has generated fairly positive long-term returns.
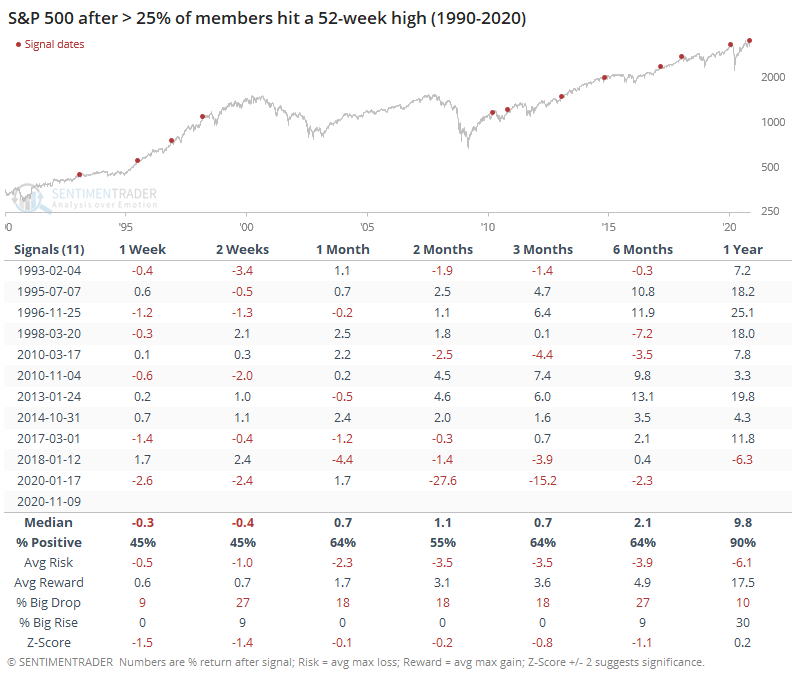
The biggest failure was earlier this year, when a surge in new highs not only led to a short-term pullback, it preceded an outright crash. That had never happened before. Granted, no other signal had to deal with a global pandemic, but we don't like to make excuses for indicators.
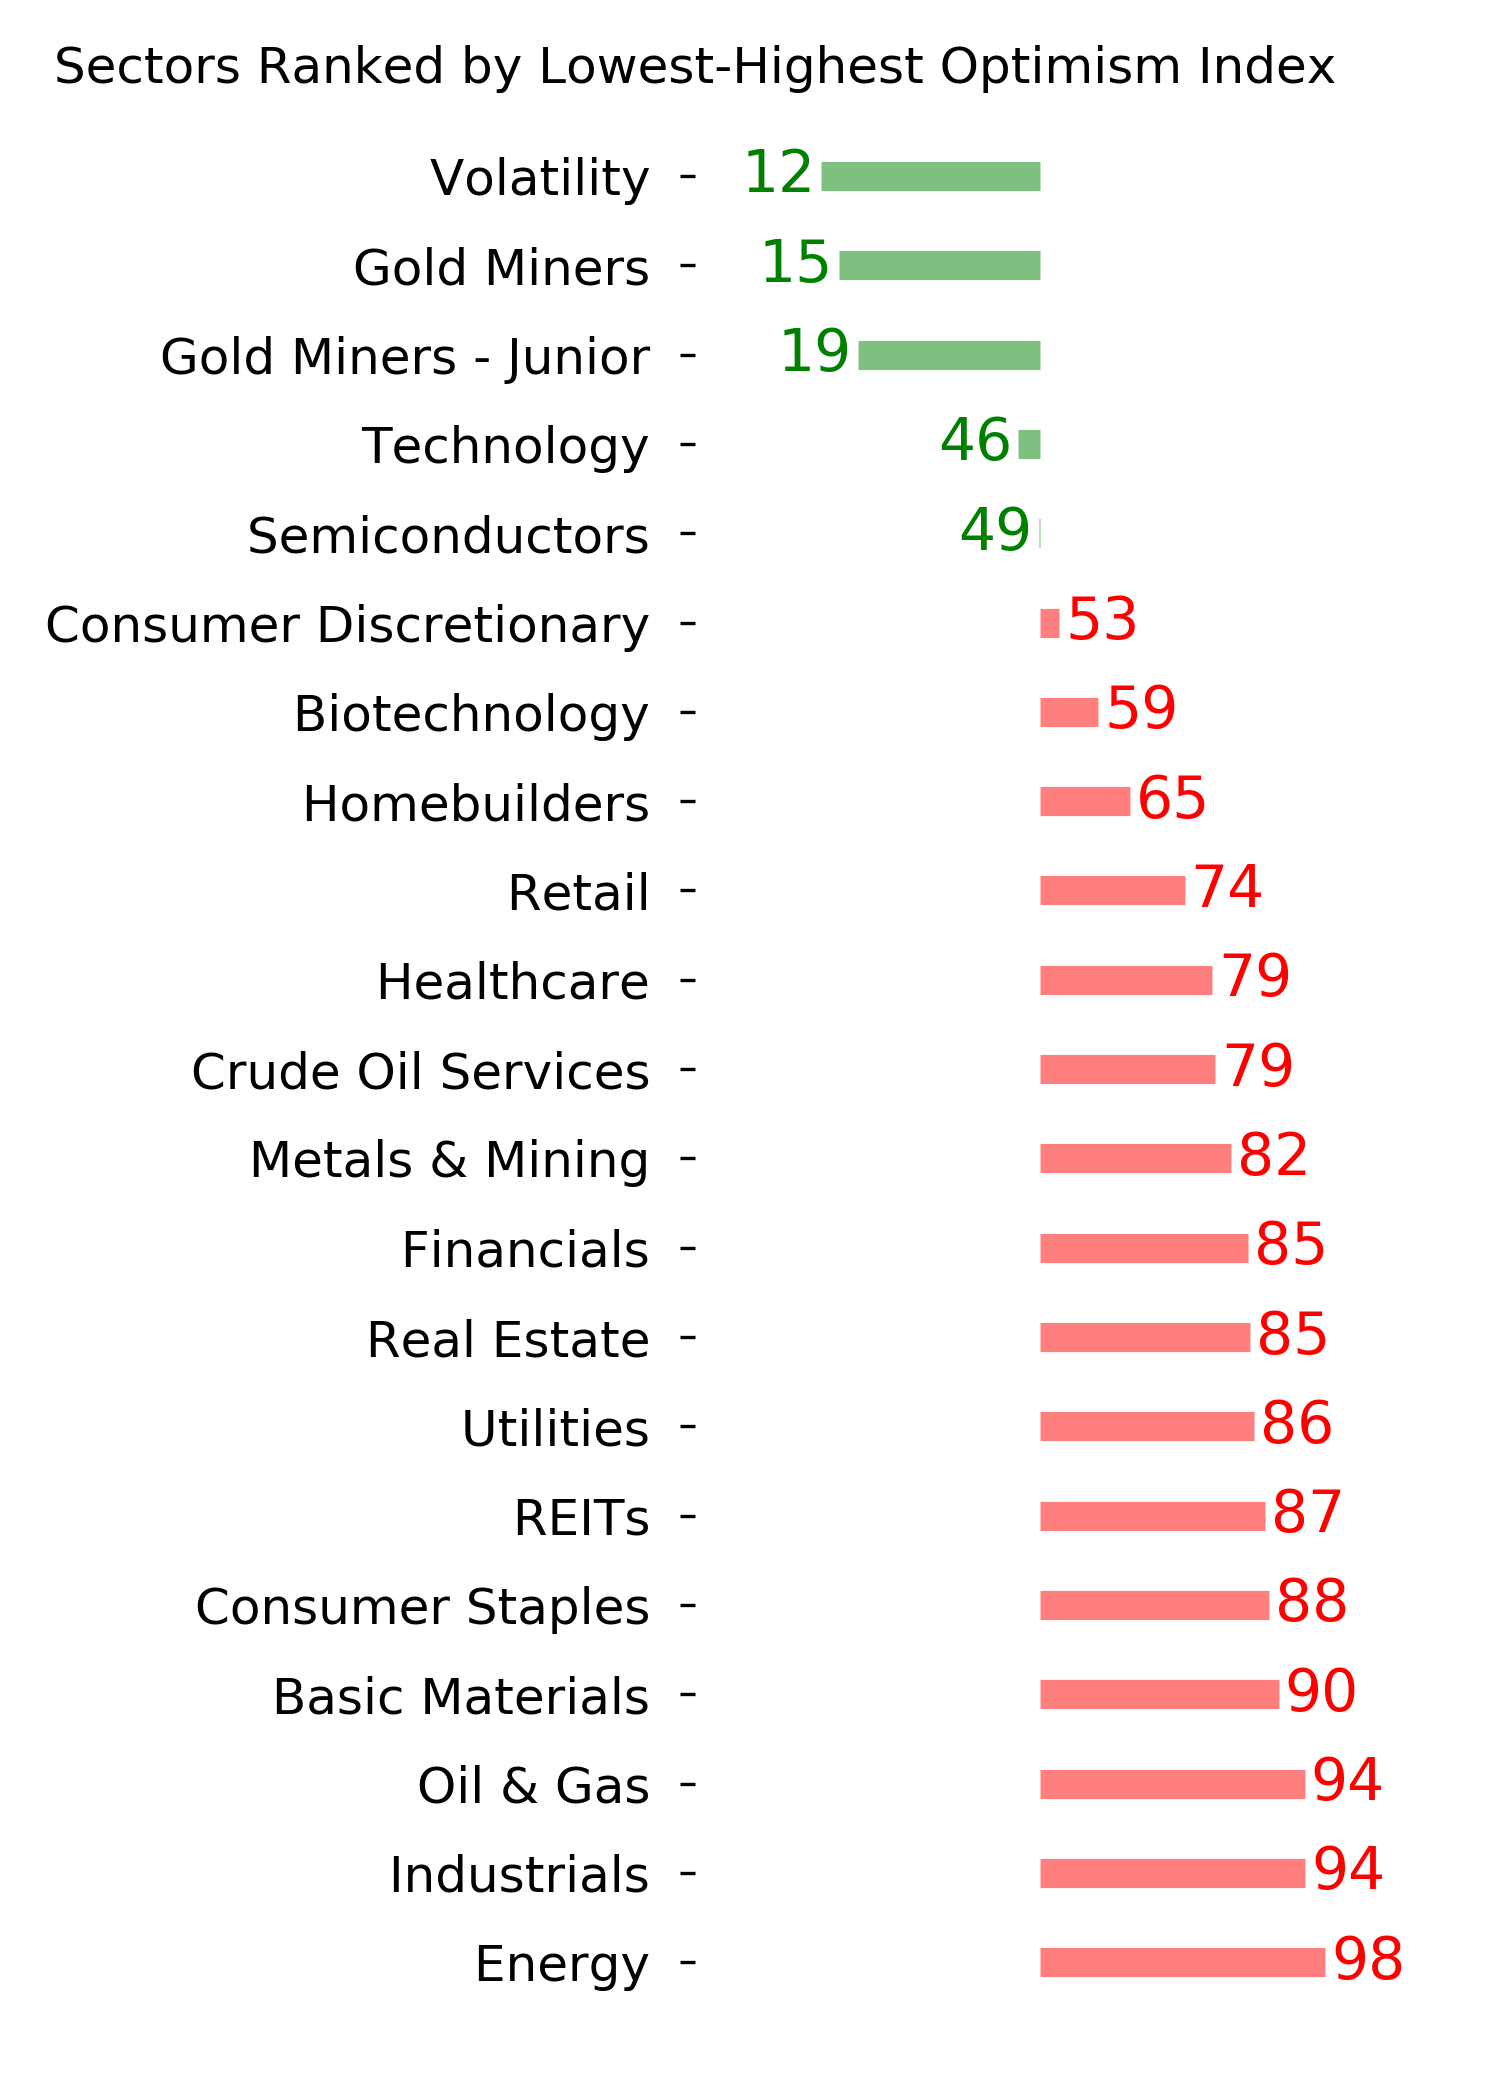
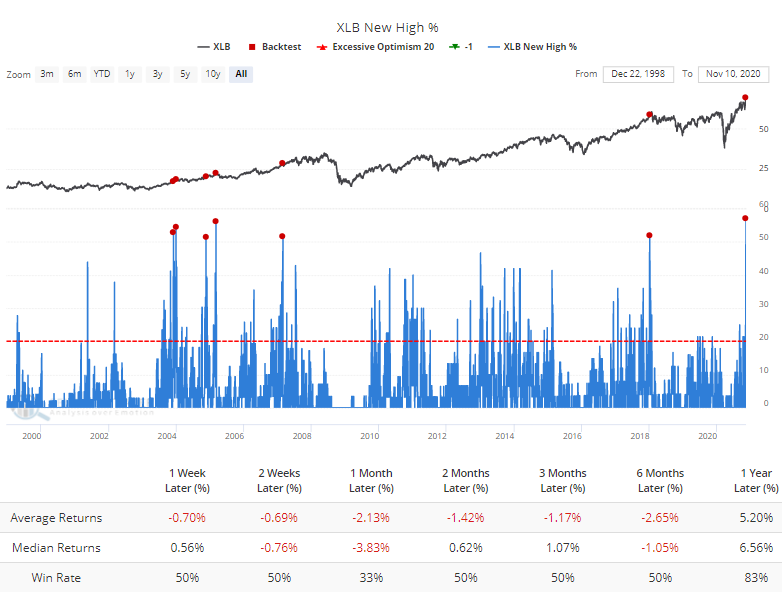
Among sectors, the most notable jumps in new highs were in Materials and Industrials. For Materials, the Backtest Engine shows some struggles after surges like this.
It was even harder for Industrials to add to their gains, with the Engine showing only 1 win out of 8 attempts over the next month.
There is the potential that the major news events over the past few days are enough to qualify for a "this time is different" situation. That's an awfully high hurdle, so we'll have to see how things shake out - so far, there is some very early evidence that it might be. As it stands, the jump on Monday should be a long-term positive, but the short-term is riskier, especially for some of the formerly staid sectors that saw a sudden surge in interest among investors.
BOTTOM LINE
Monday's lurch from large to small stocks, and from growth to value, was among the most extreme in 75 years. That builds on months of wide swings between them. There have been 2 other periods in history when this happened, both leading to massive shifts to small and value stocks.
FORECAST / TIMEFRAME
None
|
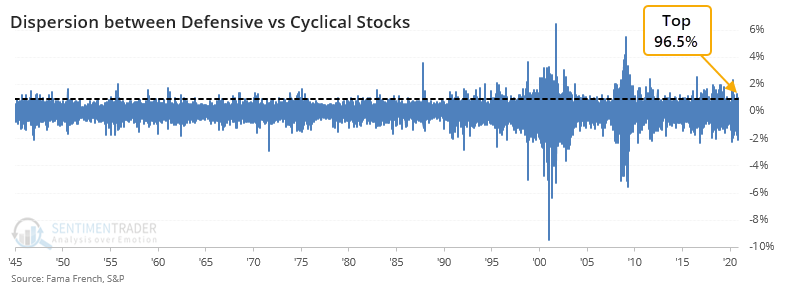
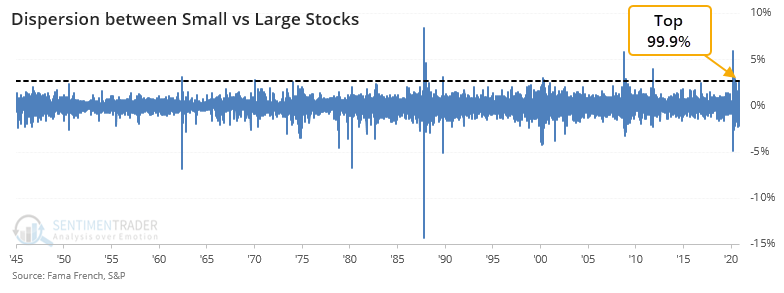
Monday's session was one for the record books for multiple reasons. We went over some of them yesterday, with the overall tone being positive due to the types of stocks that were seeing the most buying interest.
There was a clear shift from former winners to former losers. The spread in daily returns between defensive and cyclical stocks on Monday ranked in the top 96.5% of all readings since 1945.
It was even starker between small- and large-cap stocks, with Monday's difference ranking in the top 99.9% of all readings.
And greater still between value and growth stocks. The shift from growth to value on Monday had never been more extreme in the past 75 years.
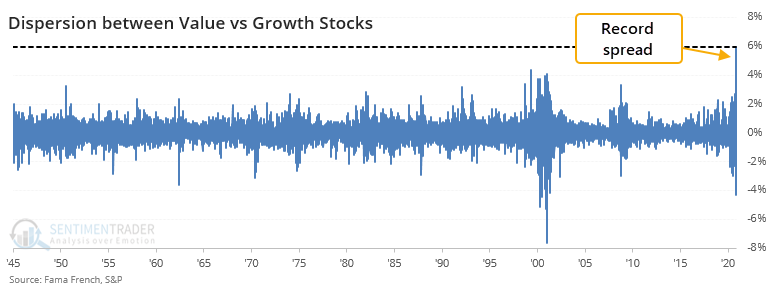
If we look at those charts, then it's not just Monday's activity that stands out, but the wild differences in returns that have been evident for months. When we look at the absolute difference in price changes between all 6 factors over the past 200 days, then we've seen one of the truly extreme risk-on vs risk-off environments ever.
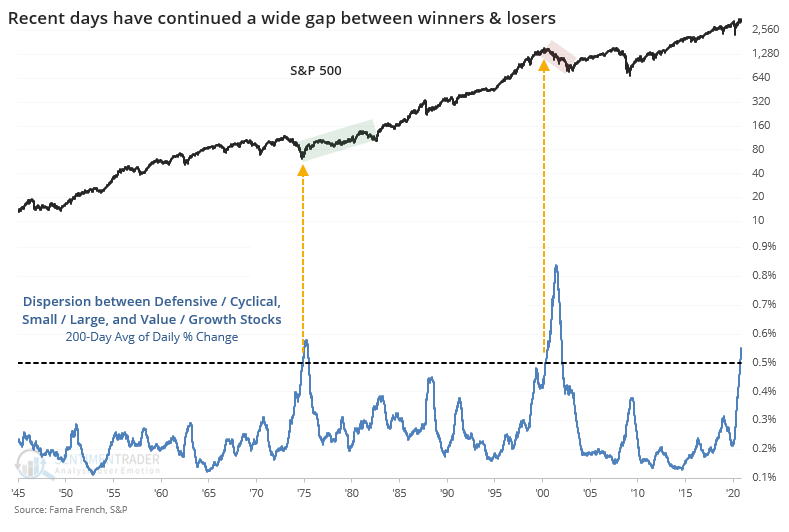
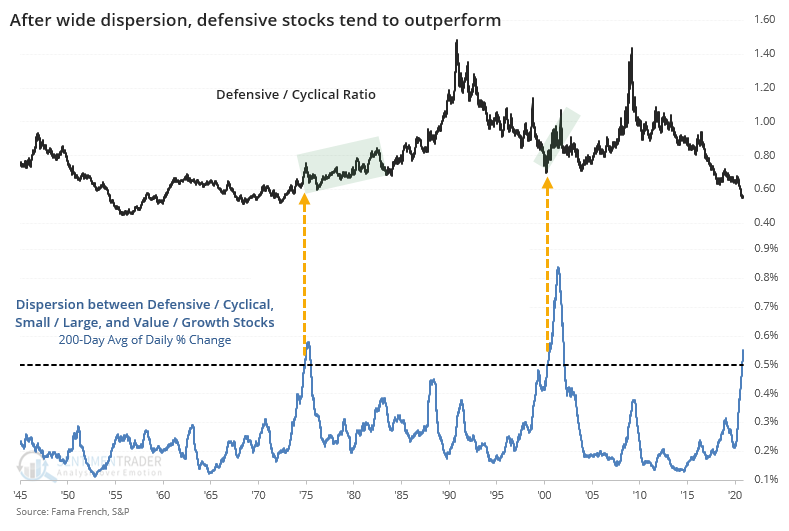
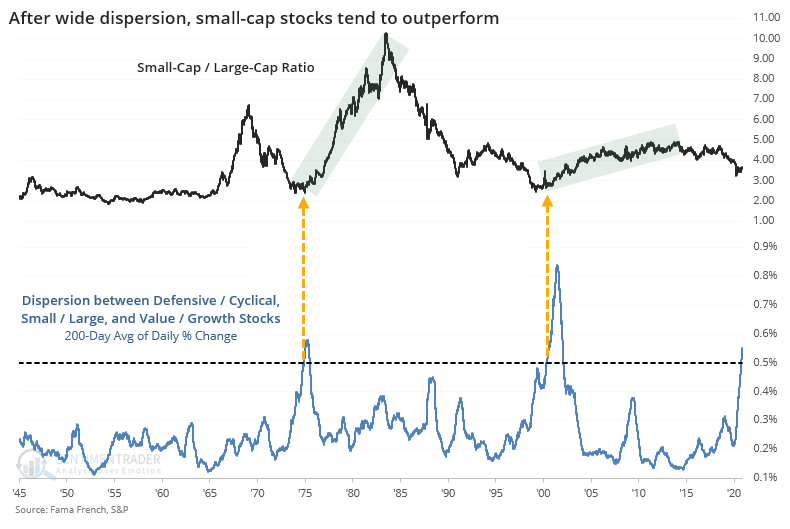
The only two time periods which exceeded the current one were in late 1975 and late 2000. Both coincided with important turning points in the broader market, one a trough and one a peak. There were 4 lesser extremes in 1983, 1988, 1991, and 2009, all following big dislocations in stocks, and all leading to higher prices for the S&P 500 going forward.
Let's look at these periods of wide dispersions versus the various factors. When we do that, we can see that defensive stocks typically did better than cyclical ones but it was not very consistent.
It was much more consistent to see small-cap stocks outperform large-cap ones. The two periods with dispersions as great as they are now both led to extended periods of smaller stocks doing better than larger ones.
The same pattern holds true for value versus growth stocks. By the time dispersion among the factors reached the current level, value stocks were about to embark on multiple years with massive outperformance relative to growth.

Investors have been looking for a turn in these relationships for years, and yet in most respects, they just keep getting more extreme. It seems like Monday's shock, building on the massive differences in positioning for most of this year, is enough to equate to some of the most notable changes in 75 years, and that has been a very good relative sign for small and value stocks.
Active Studies
| Time Frame | Bullish | Bearish | | Short-Term | 0 | 0 | | Medium-Term | 5 | 8 | | Long-Term | 50 | 2 |
|
Indicators at Extremes
Portfolio
| Position | Description | Weight % | Added / Reduced | Date | | Stocks | 15.6% RSP, 10.1% VWO, 7.5% XLE, 5.1% PSCE | 38.2 | Added 5% | 2020-10-15 | | Bonds | 10% BND, 10% SCHP, 10% ANGL | 29.7 | Reduced 0.1% | 2020-10-02 | | Commodities | GCC | 2.4 | Reduced 2.1%
| 2020-09-04 | | Precious Metals | GDX | 4.7 | Added 5% | 2020-09-09 | | Special Situations | | 0.0 | Reduced 5% | 2020-10-02 | | Cash | | 25.0 | | |
|
Updates (Changes made today are underlined)
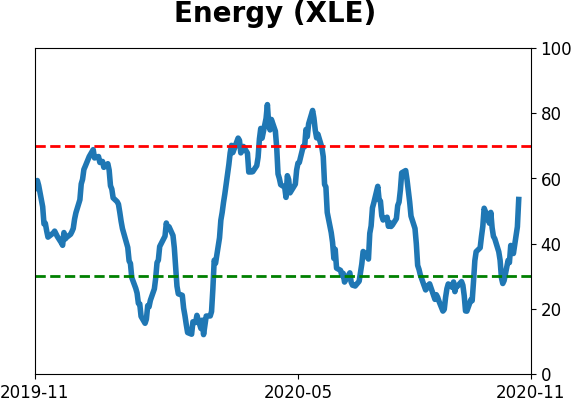
After the September swoon wrung some of the worst of the speculation out of stocks, there are some signs that it's returning, especially in the options market. It's helped to push Dumb Money Confidence above 70%. A big difference between now and August is that in August, there was a multitude of days with exceptionally odd breadth readings. Some of the biggest stocks were masking underlying weakness. Combined with heavy speculative activity, it was a dangerous setup. Now, we've seen very strong internal strength, in the broad market, as well as tech and small-cap stocks. Prior signals almost invariably led to higher prices. That's hard to square with the idea that forward returns tend to be subdued when Confidence is high, but that's less reliable during healthy market conditions, which we're seeing now (for the most part). I added some risk with small-cap energy stocks, due to an increasing number of positive signs in both small-caps and energy. This is intended as a long-term position.
RETURN YTD: 2.2% 2019: 12.6%, 2018: 0.6%, 2017: 3.8%, 2016: 17.1%, 2015: 9.2%, 2014: 14.5%, 2013: 2.2%, 2012: 10.8%, 2011: 16.5%, 2010: 15.3%, 2009: 23.9%, 2008: 16.2%, 2007: 7.8%
|
|
Phase Table
Ranks
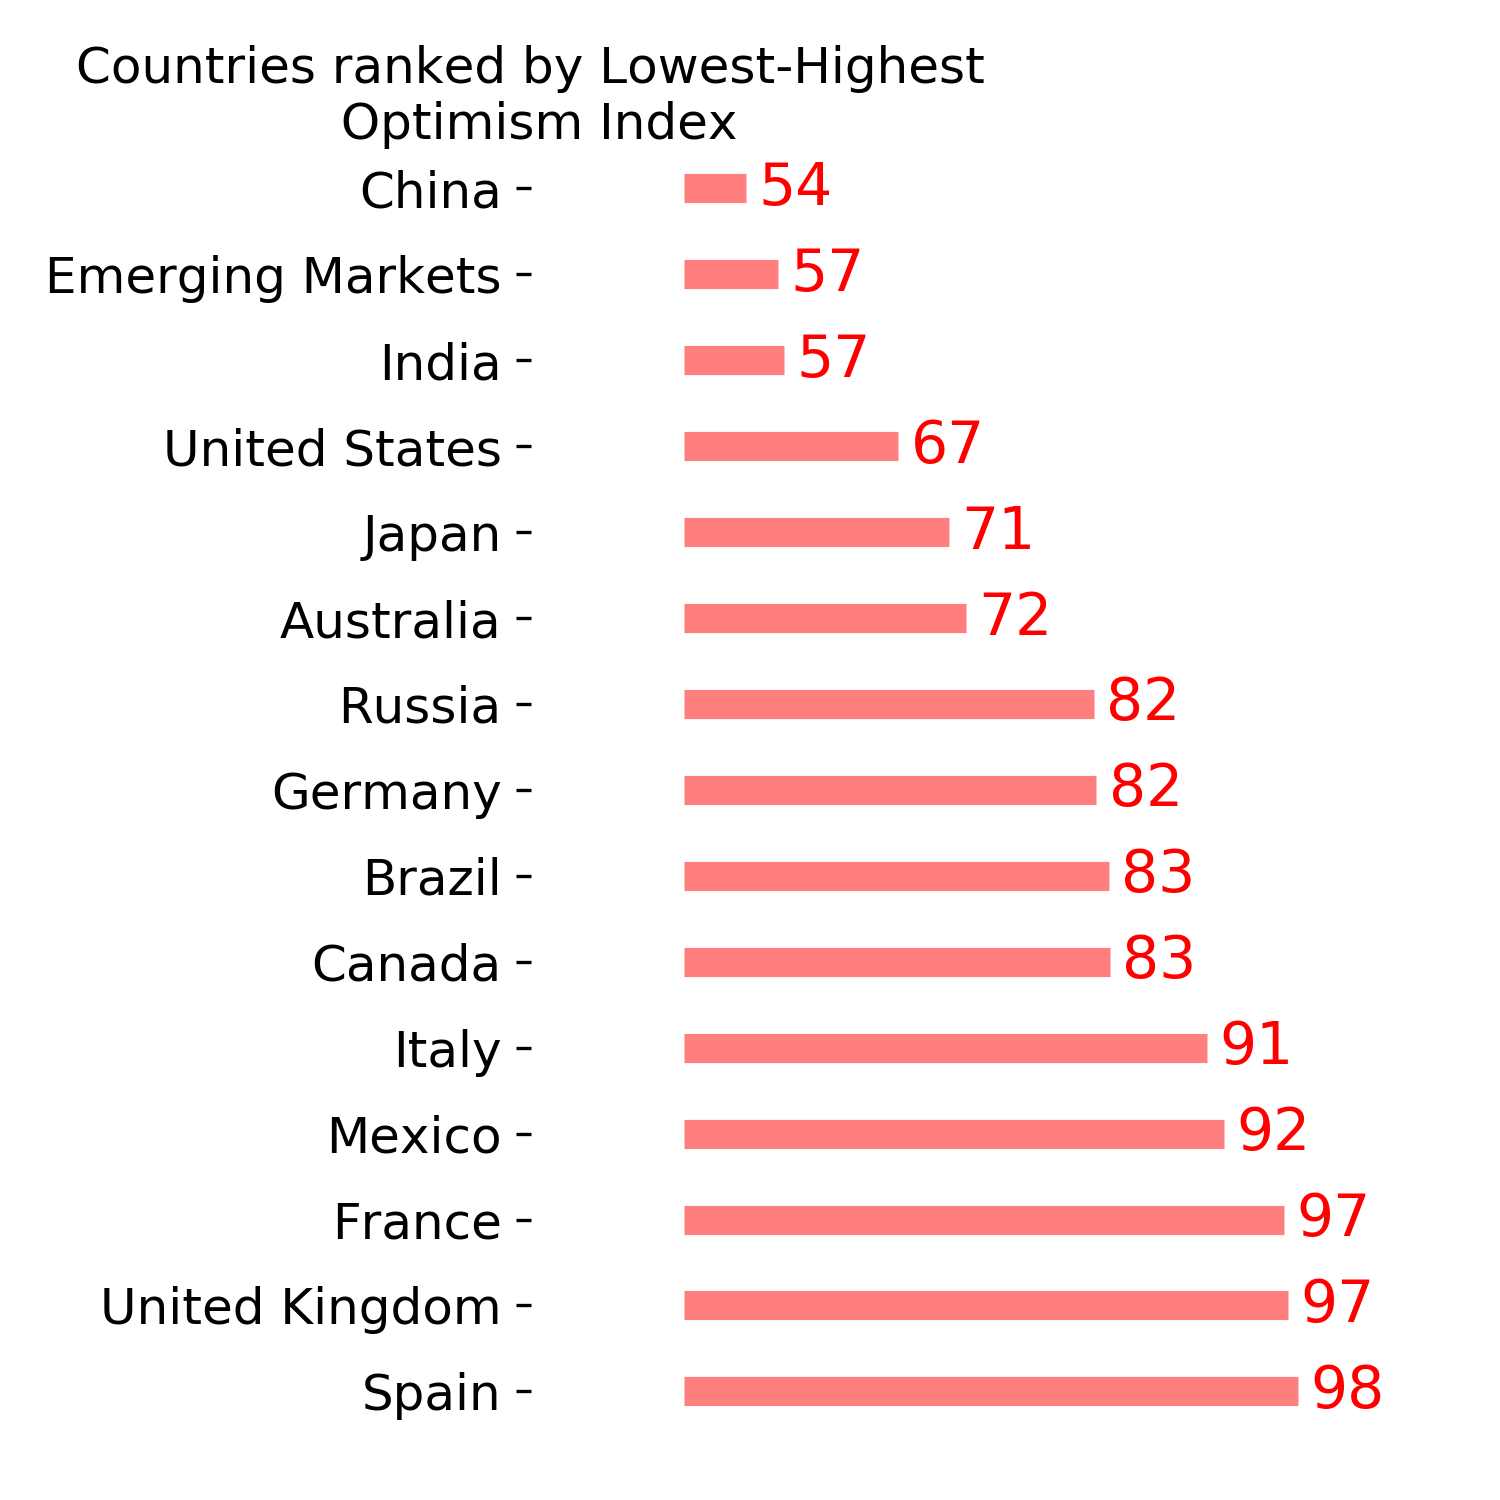
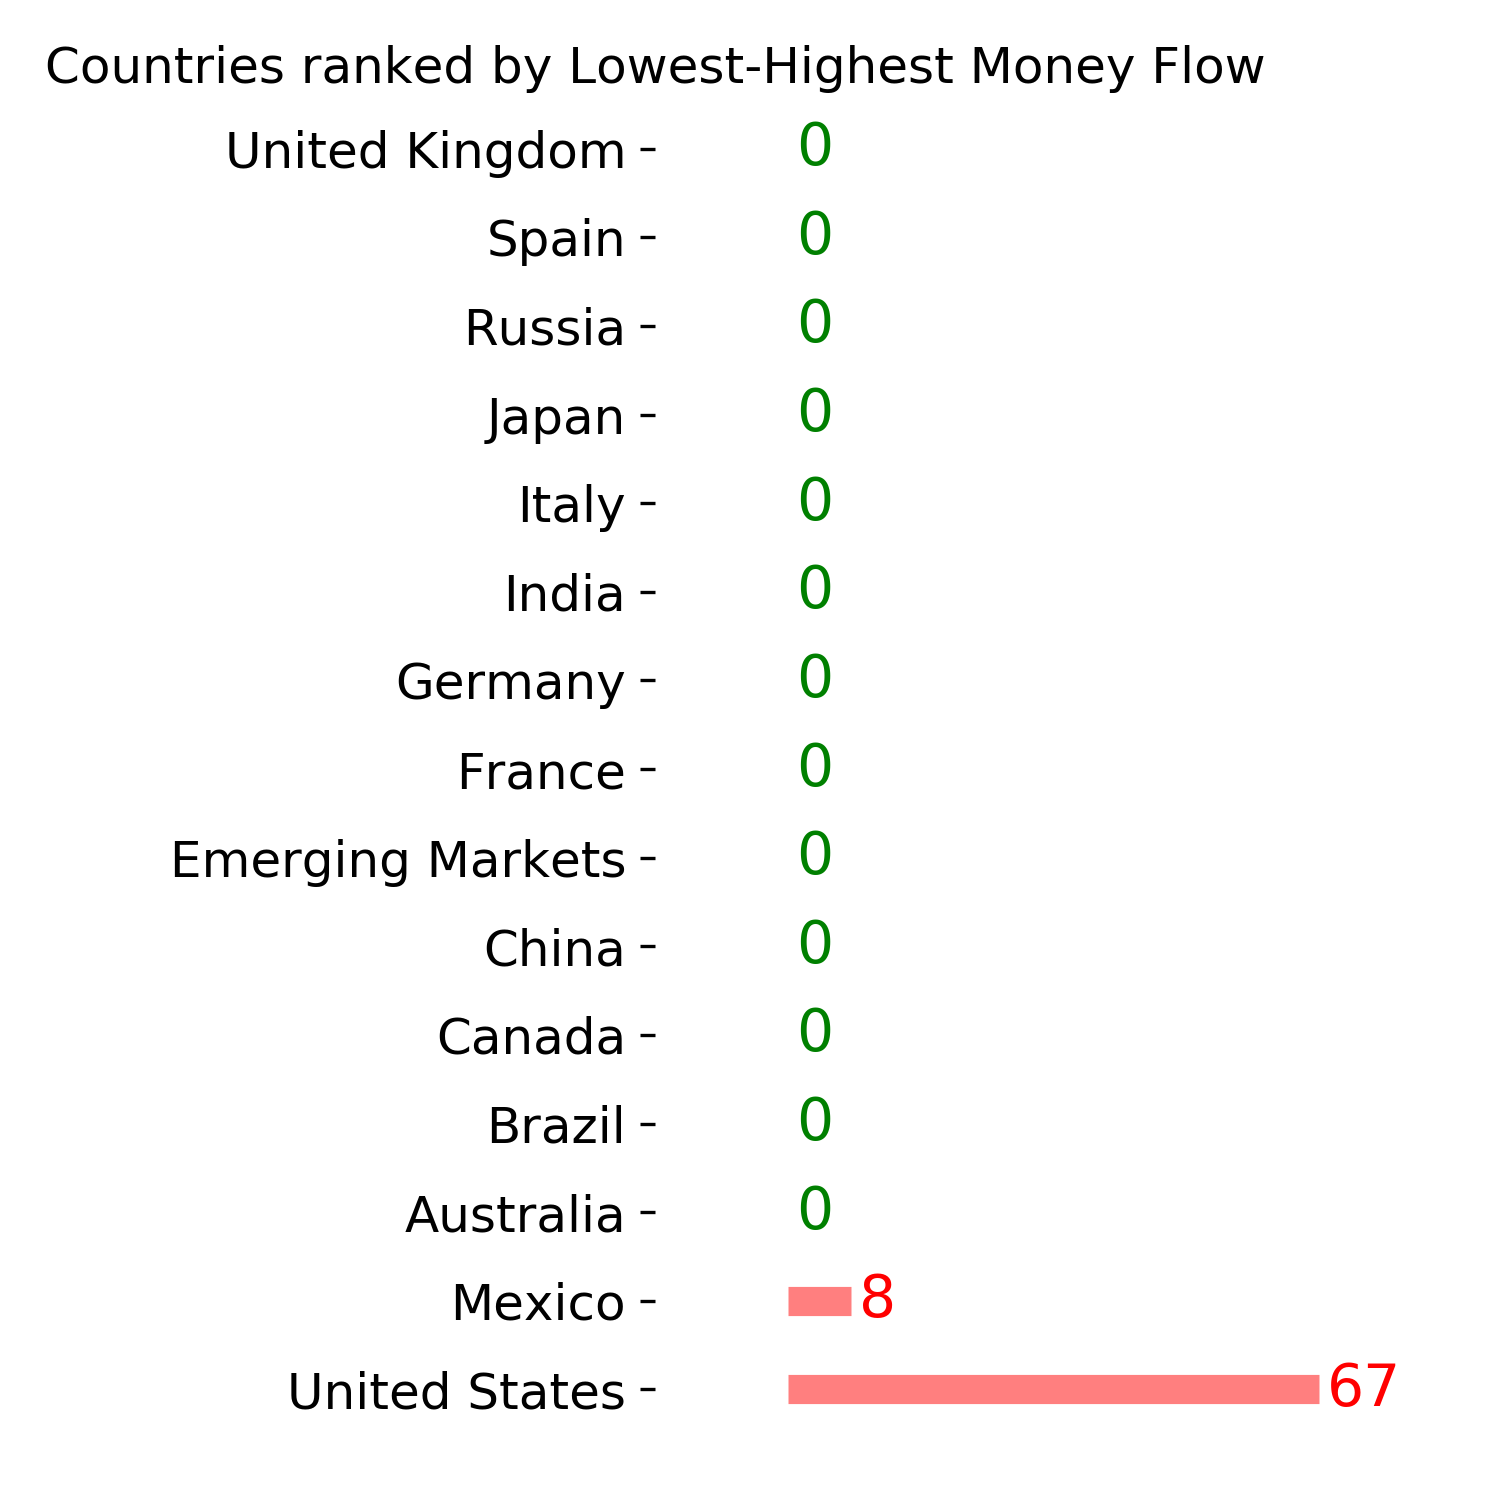
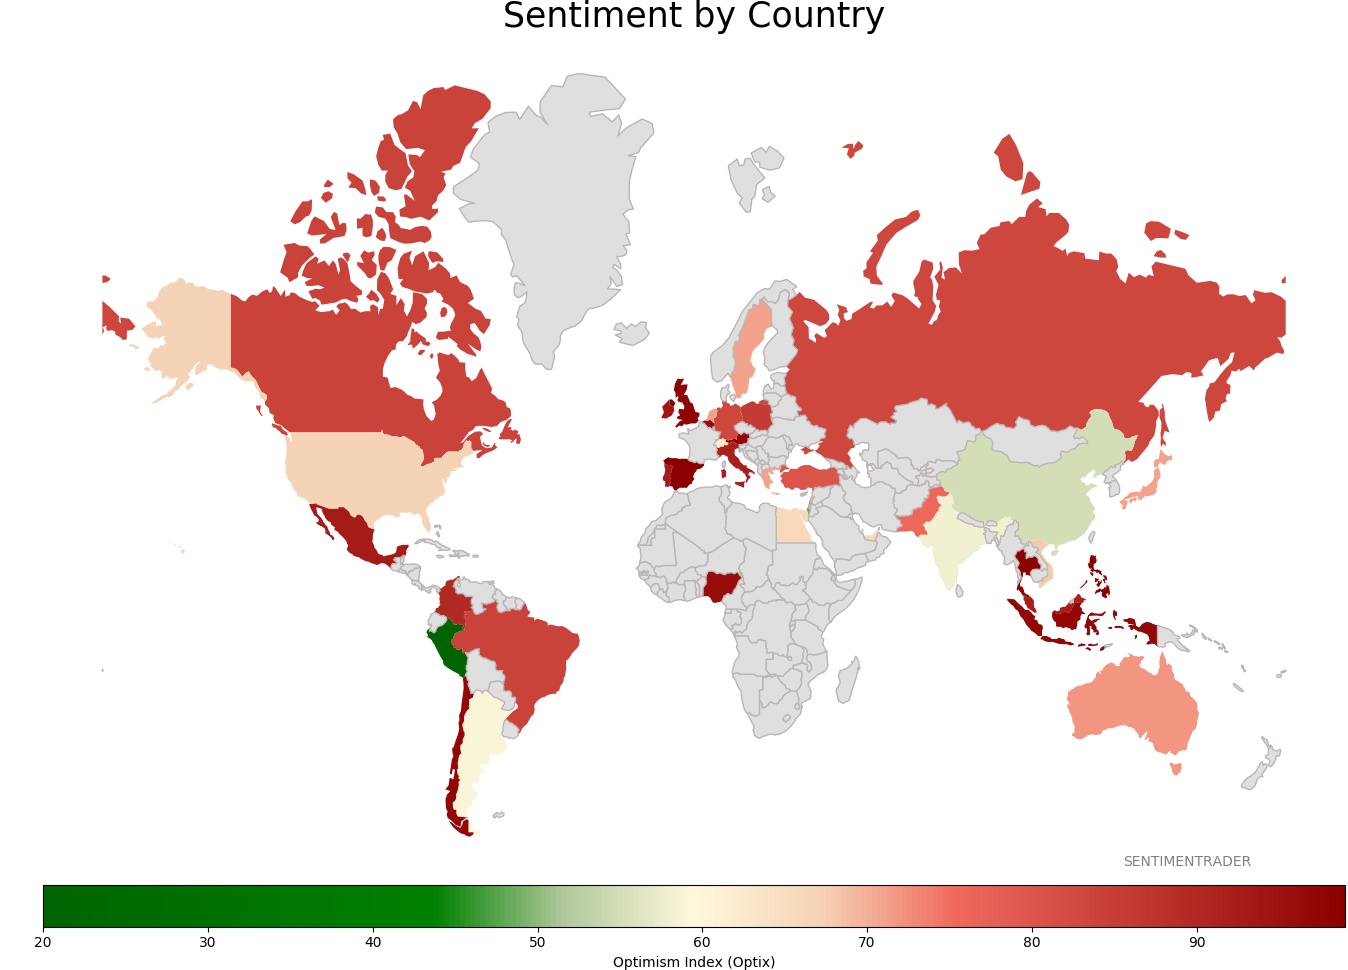
Sentiment Around The World
Optimism Index Thumbnails
|
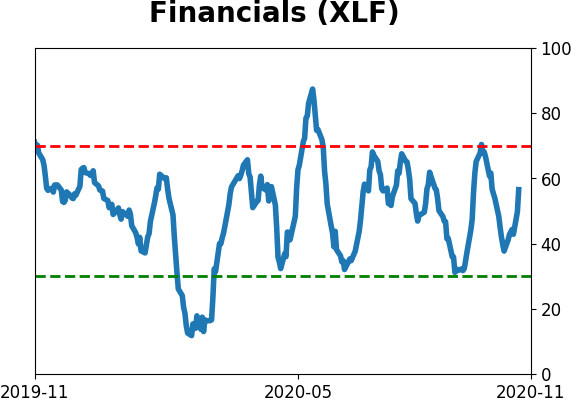
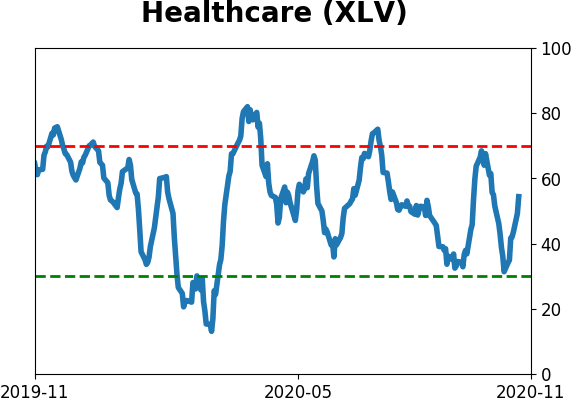
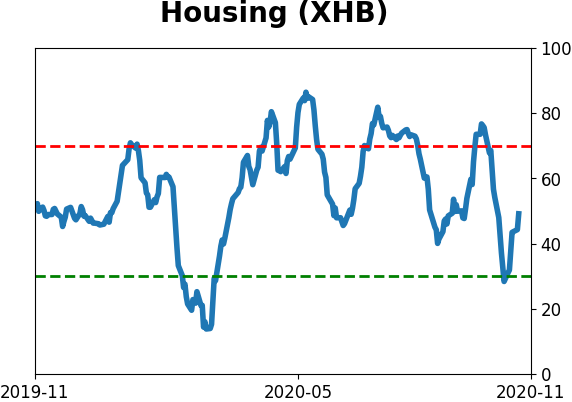
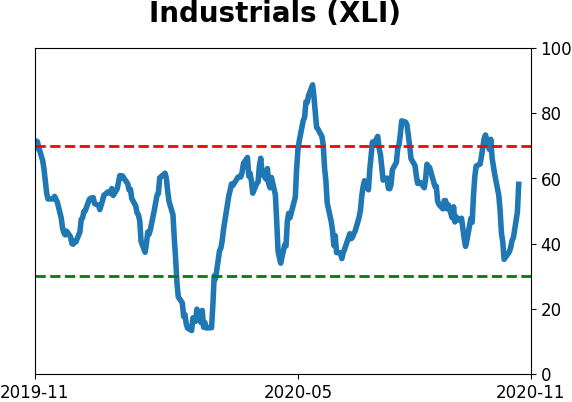
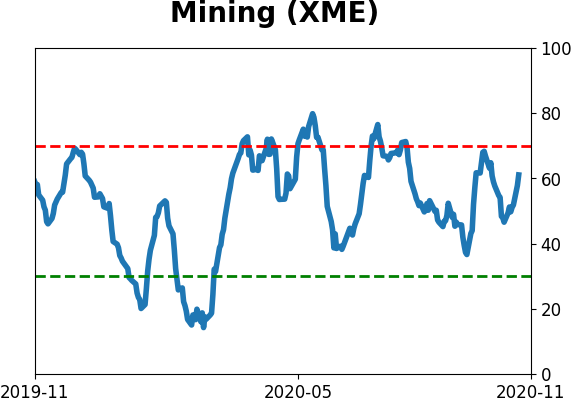
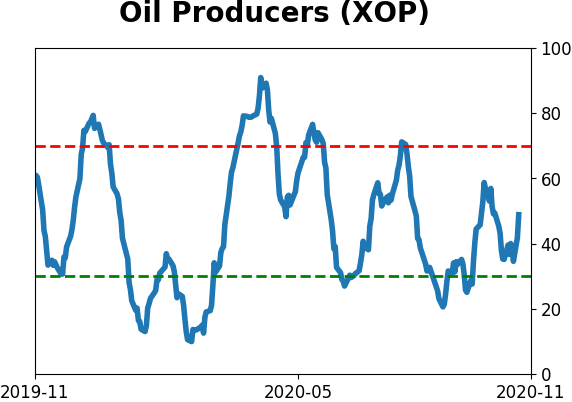
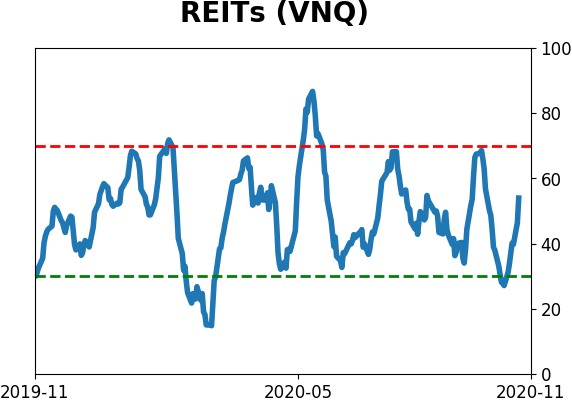
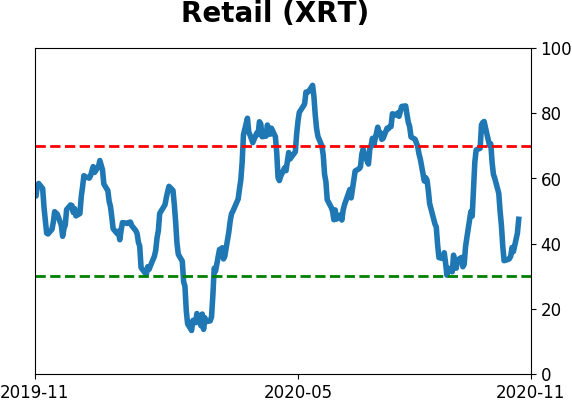
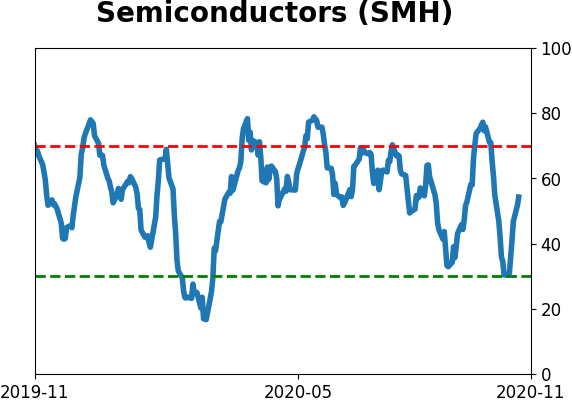
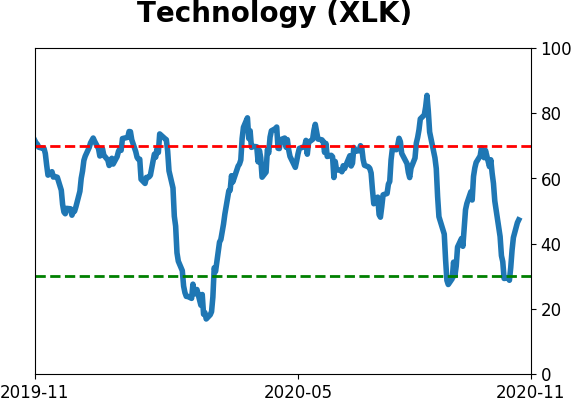
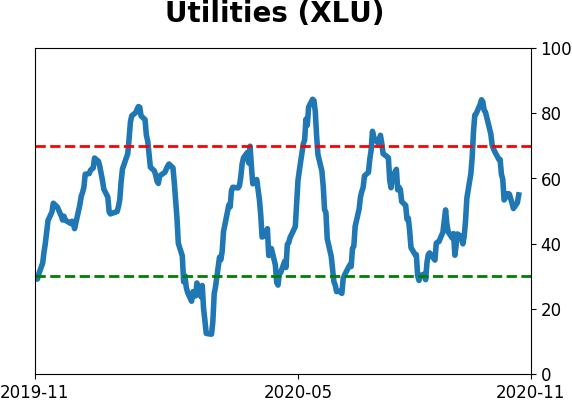
Sector ETF's - 10-Day Moving Average
|
|
|
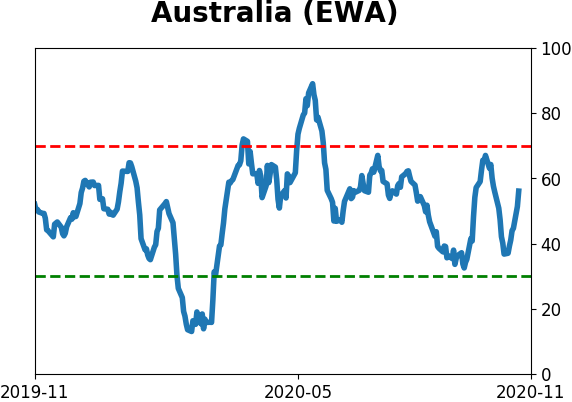
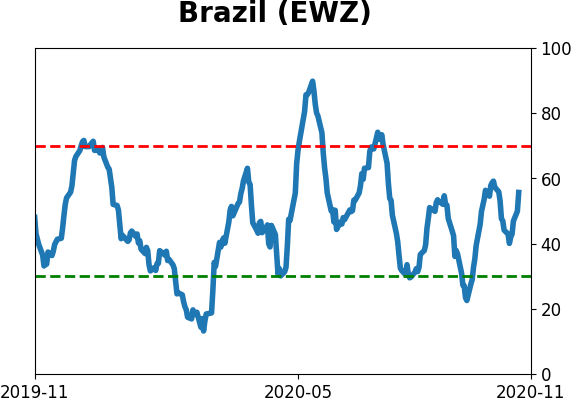
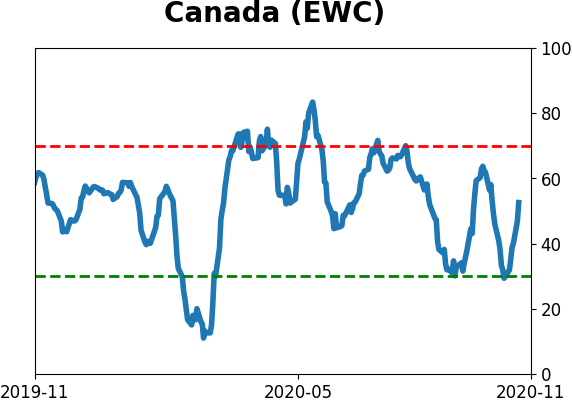
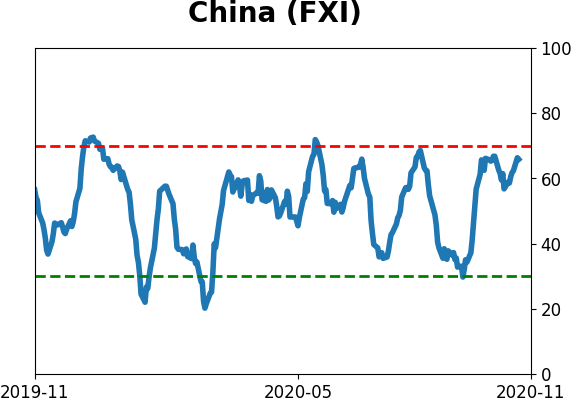
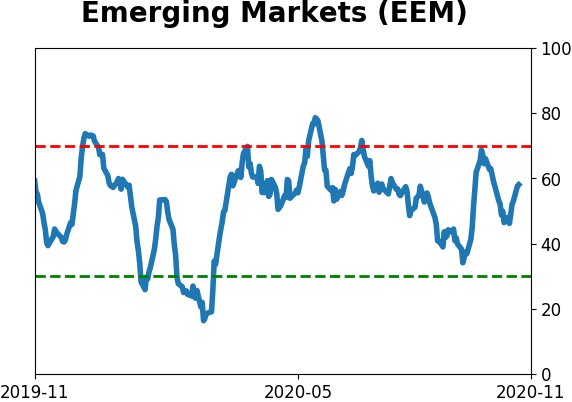
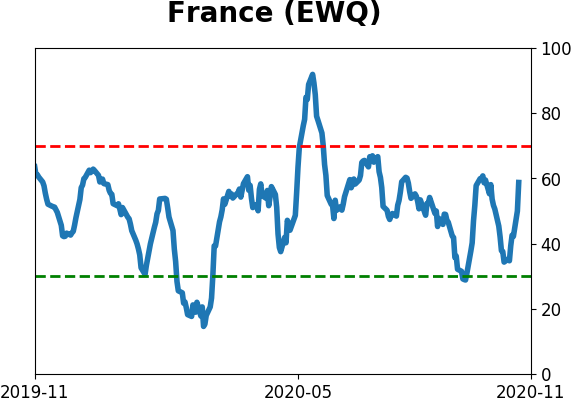
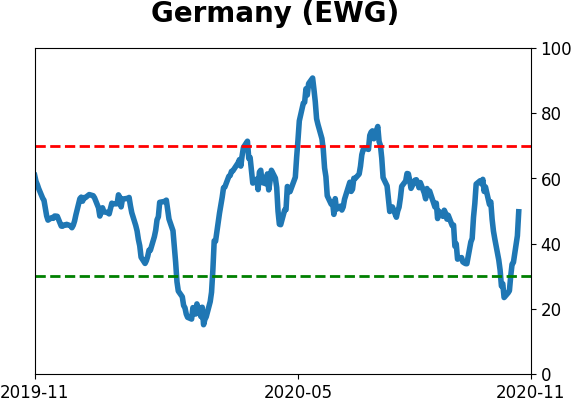
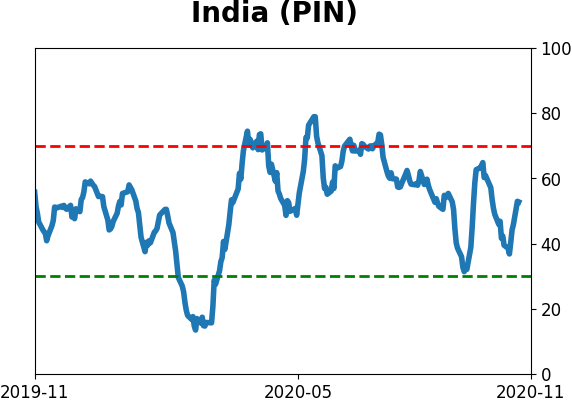
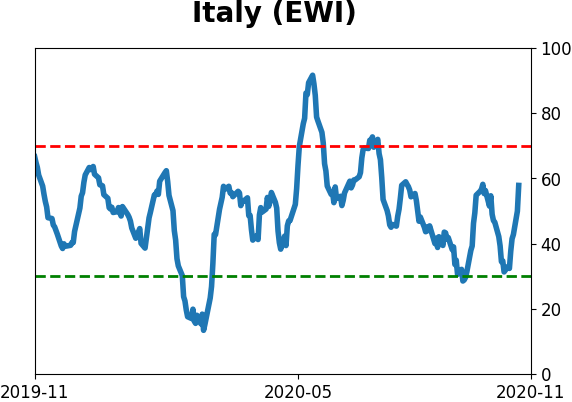
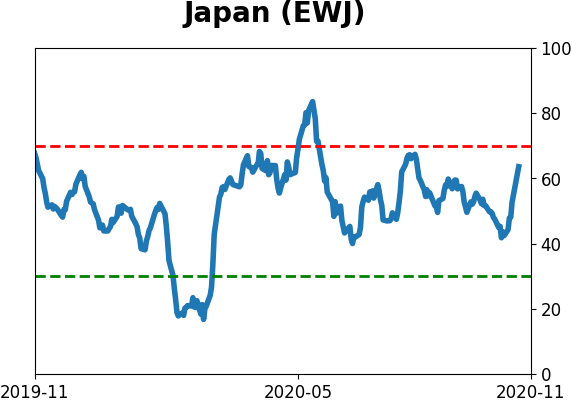
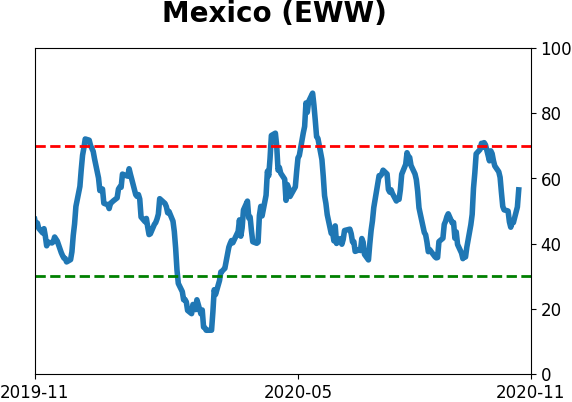
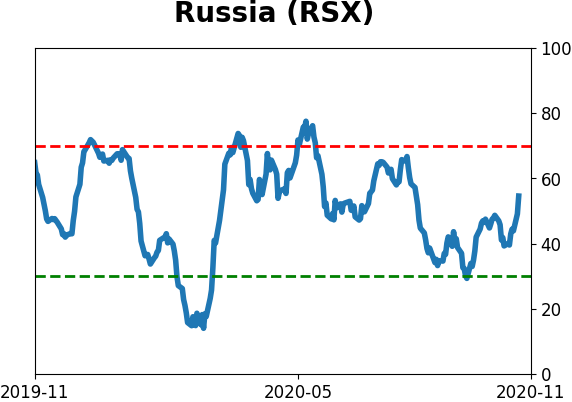
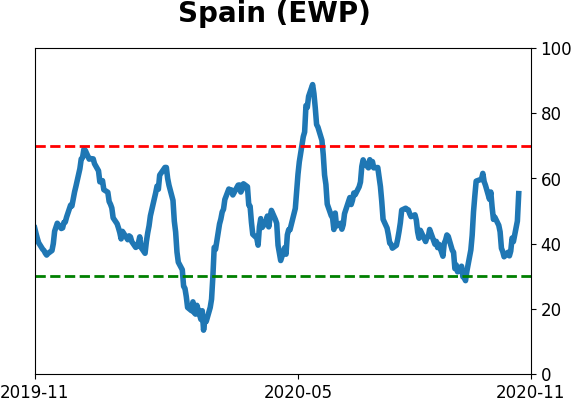
Country ETF's - 10-Day Moving Average
|
|
|
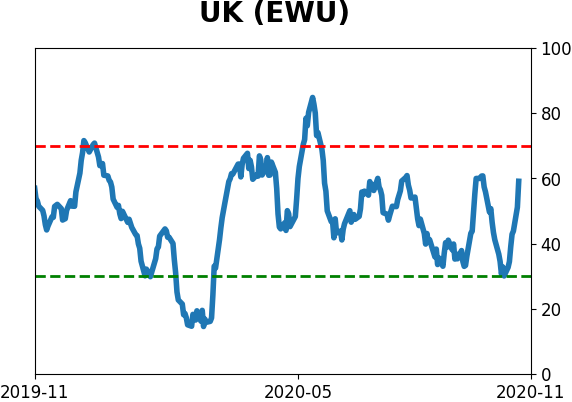
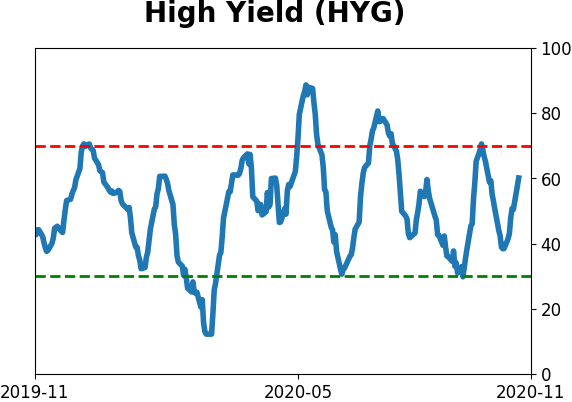
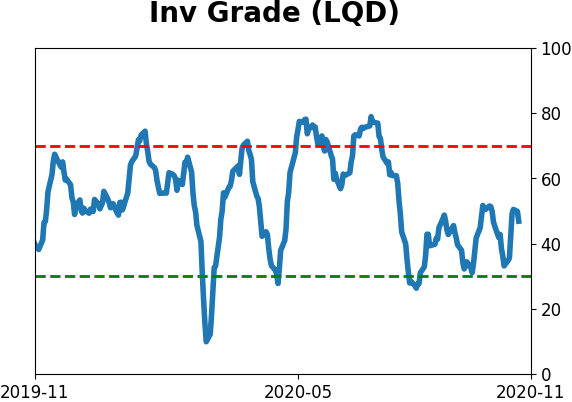
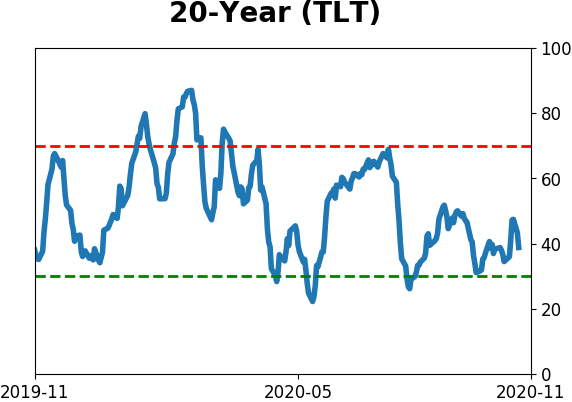
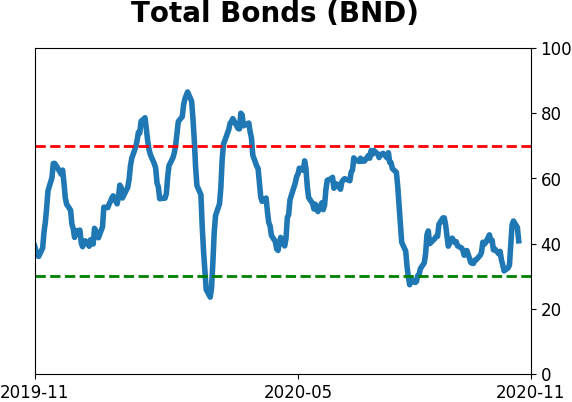
Bond ETF's - 10-Day Moving Average
|
|
|
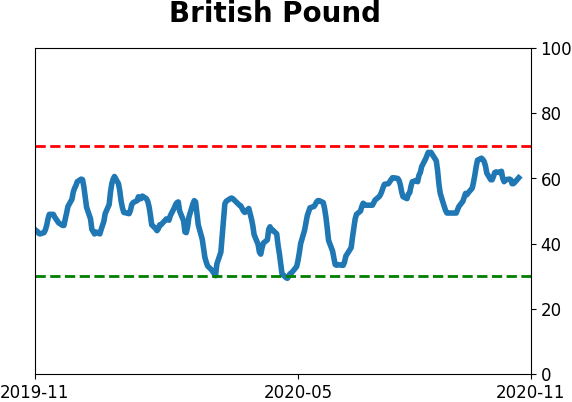
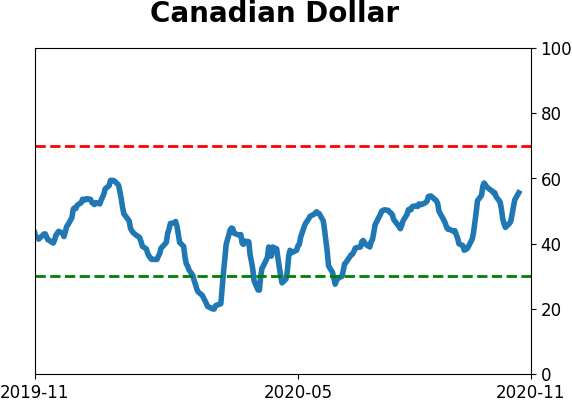
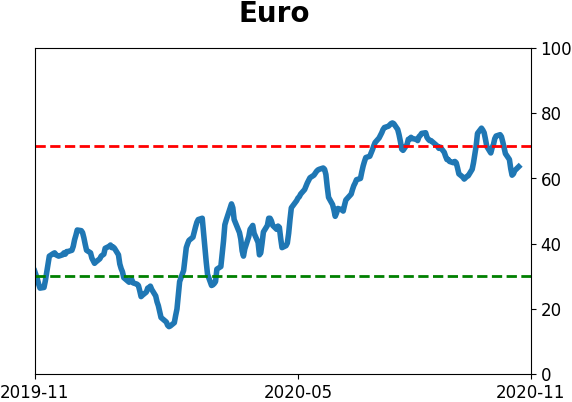
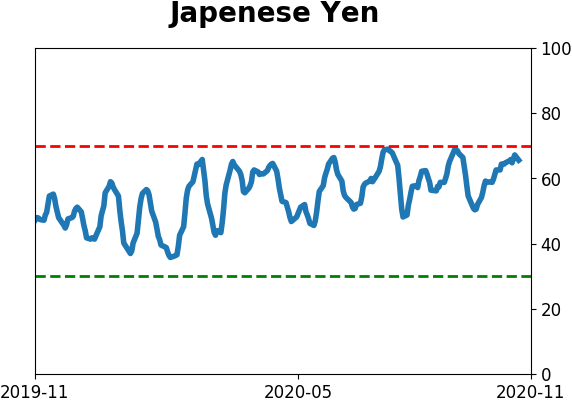
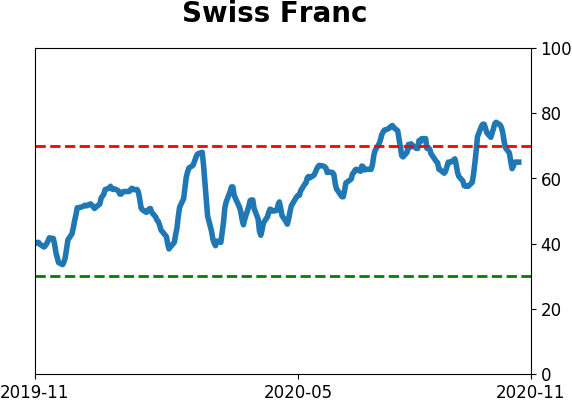
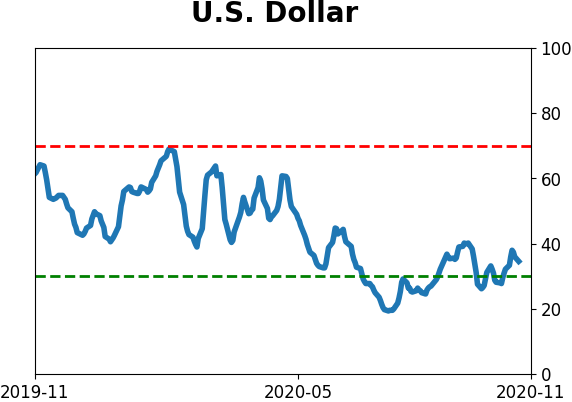
Currency ETF's - 5-Day Moving Average
|
|
|
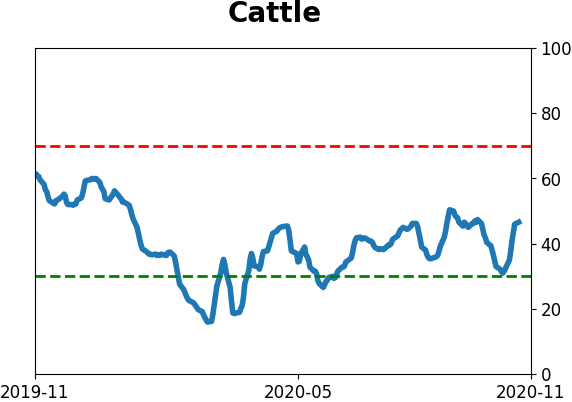
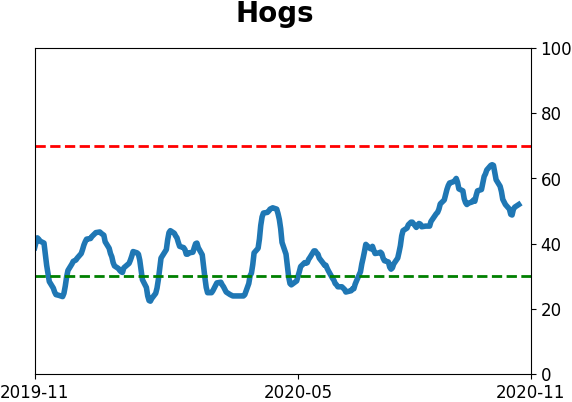
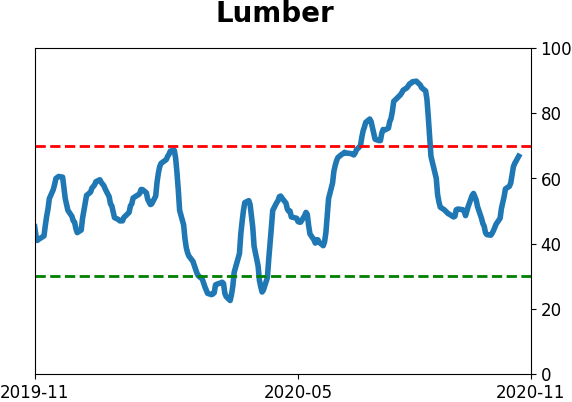
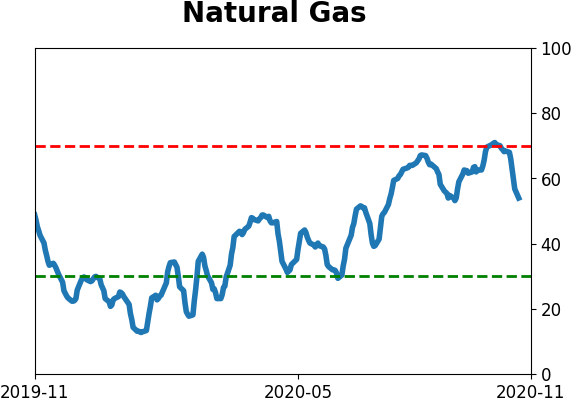
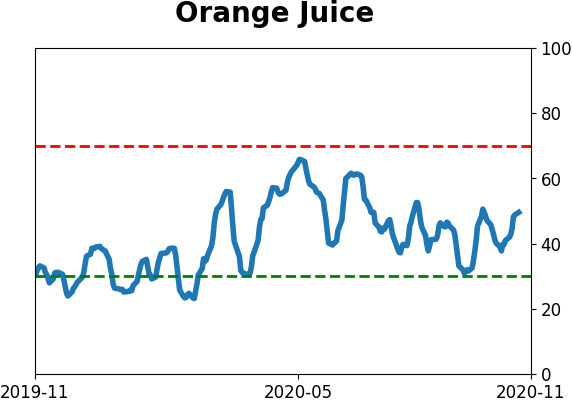
Commodity ETF's - 5-Day Moving Average
|
|