Headlines
|
|
Flows to bonds versus stocks reaches another record:
Investors pulled money from bond mutual funds and ETFs in the latest week, only the 2nd outflow in the past 30 weeks. They continue to flee stock funds. The consistency of flows between bonds and stocks over more than 6 months has never been more stark.
Buyers push stocks to yet another surge:
So far this week, buying interest in stocks was enough to generate 3 days with overwhelming volume flowing into advancing stocks. Similar surges preceded long-term gains every time. This year has also now surpassed 2009 as having the most thrusts of any year since 1962.
Best week evah: We have a contested presidential election and a record high in coronavirus cases. In the twisted logic of markets, that's apparently the best combination possible, as the S&P 500 rallied more than 7% for the best weekly gain in its history when also closing at a record weekly high. Go figure.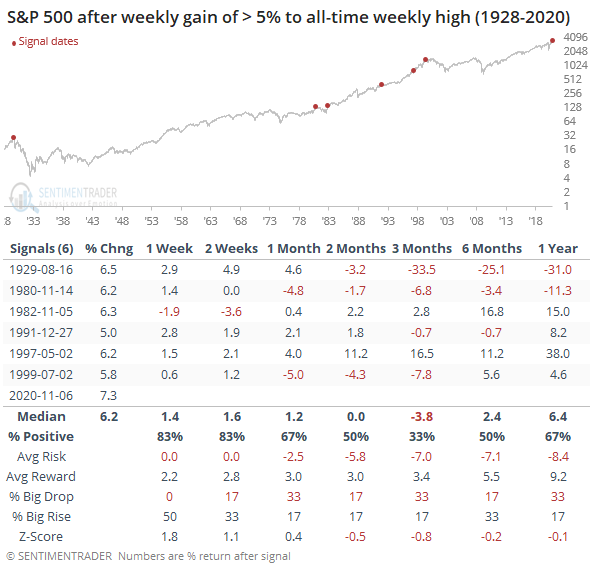
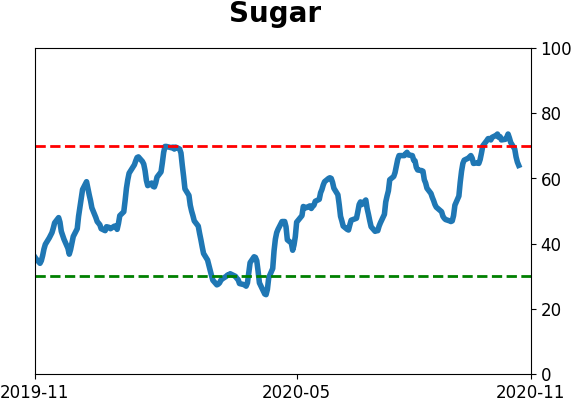
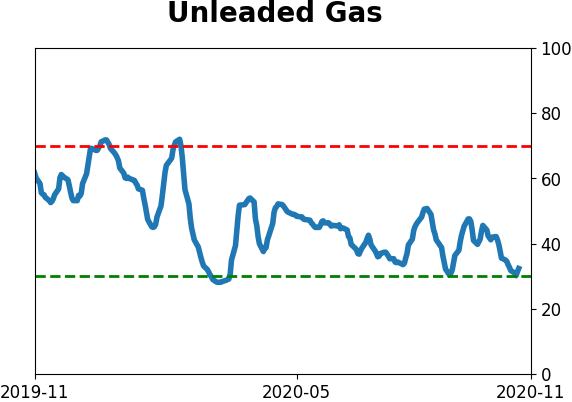
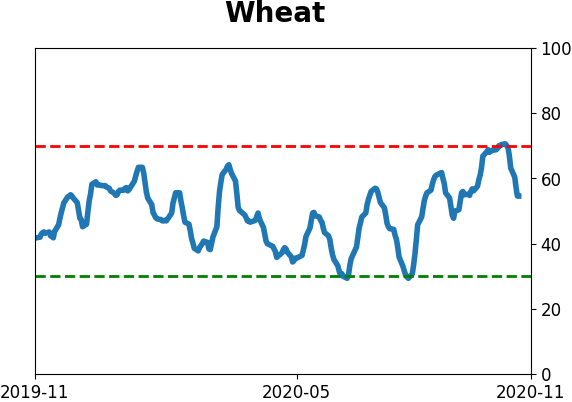
The latest Commitments of Traders report was released, covering positions through Tuesday: The 3-Year Min/Max Screen shows that "smart money" hedgers were pretty quiet with few new extremes this week. They moved to a record long position in 30-year Treasury bonds, and also got a little longer 10-year notes, but remain far from a positive extreme there. They're now holding their lowest short exposure against unleaded gas, a contract they've never been net long. The Backtest Engine shows there have been 32 weeks when they held less than 11% of the open interest net short, and the contract was higher 6 months later after all 32 weeks. They reduced their shorts against stocks a bit, but nothing too notable there. They pulled back a little from massive short exposure against agriculture and commodities in general but continue to hold big bets against them.
Bottom Line:
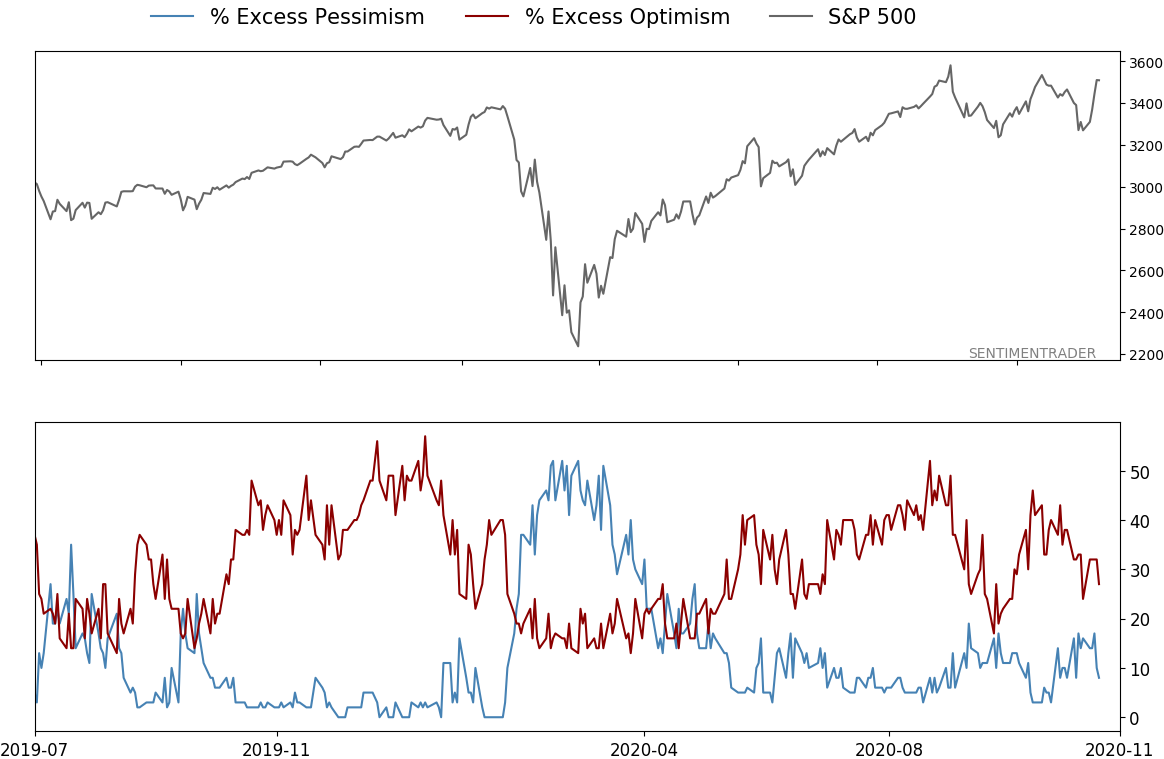
- A positive environment favors becoming aggressive on signs of excessive pessimism, of which there are few yet.
|
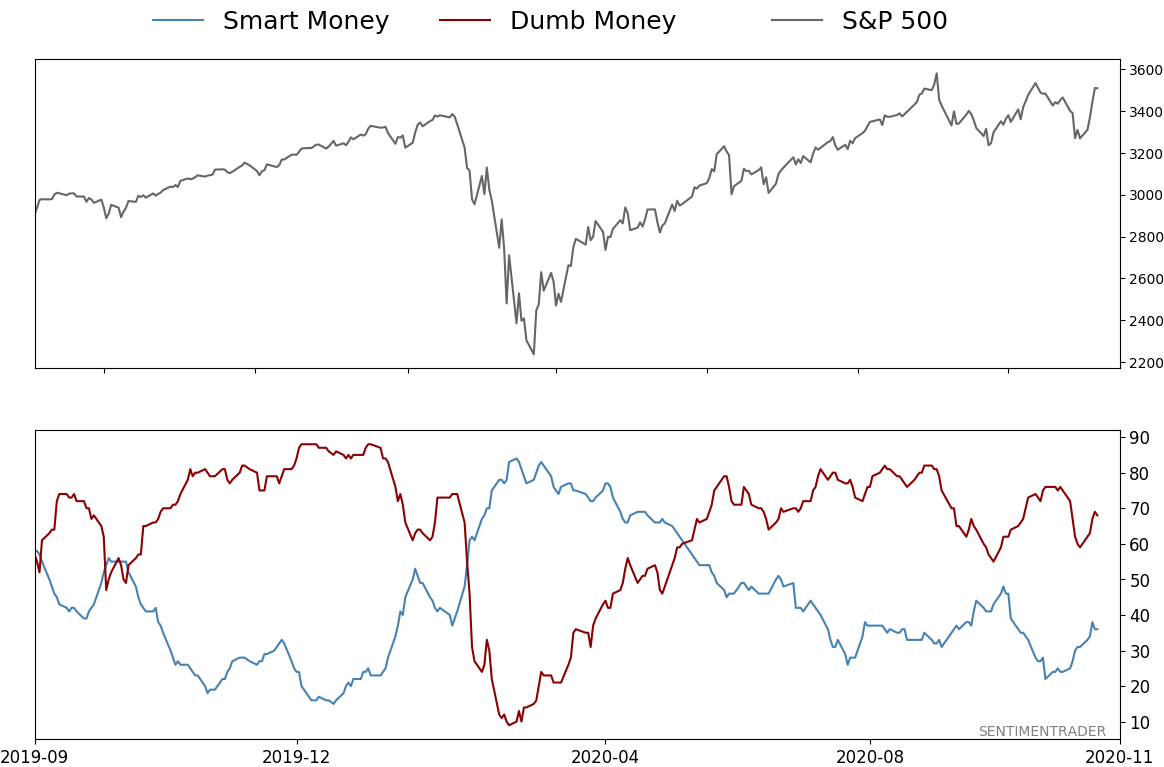
Smart / Dumb Money Confidence
|
Smart Money Confidence: 36%
Dumb Money Confidence: 68%
|
|
Risk Levels
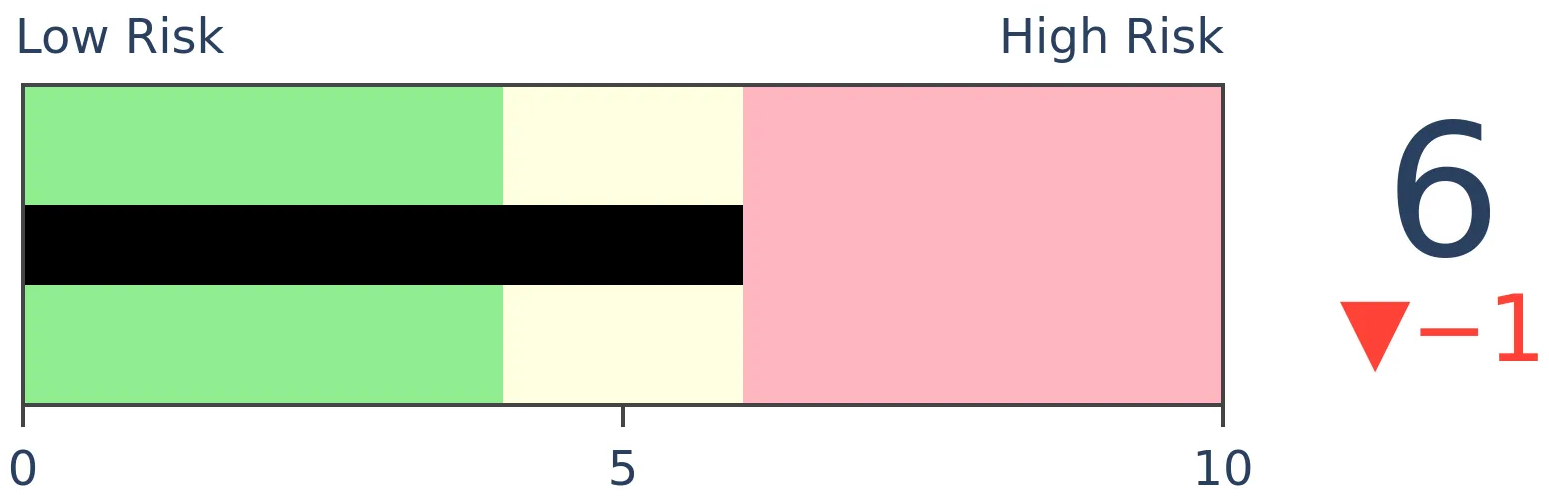
Stocks Short-Term
|
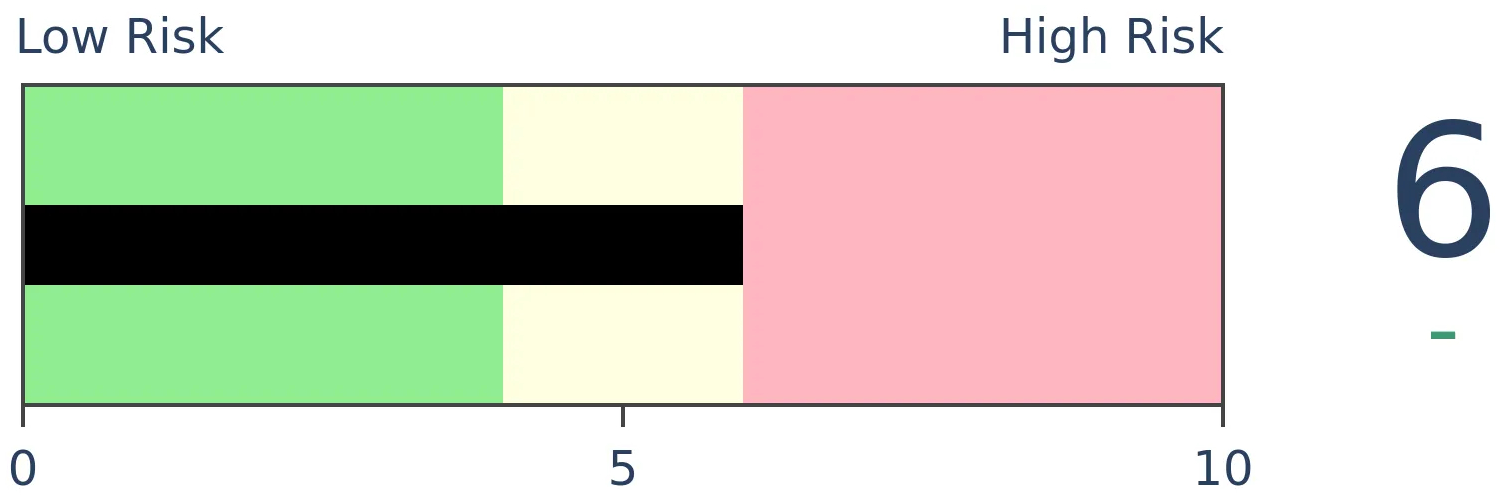
Stocks Medium-Term
|
|
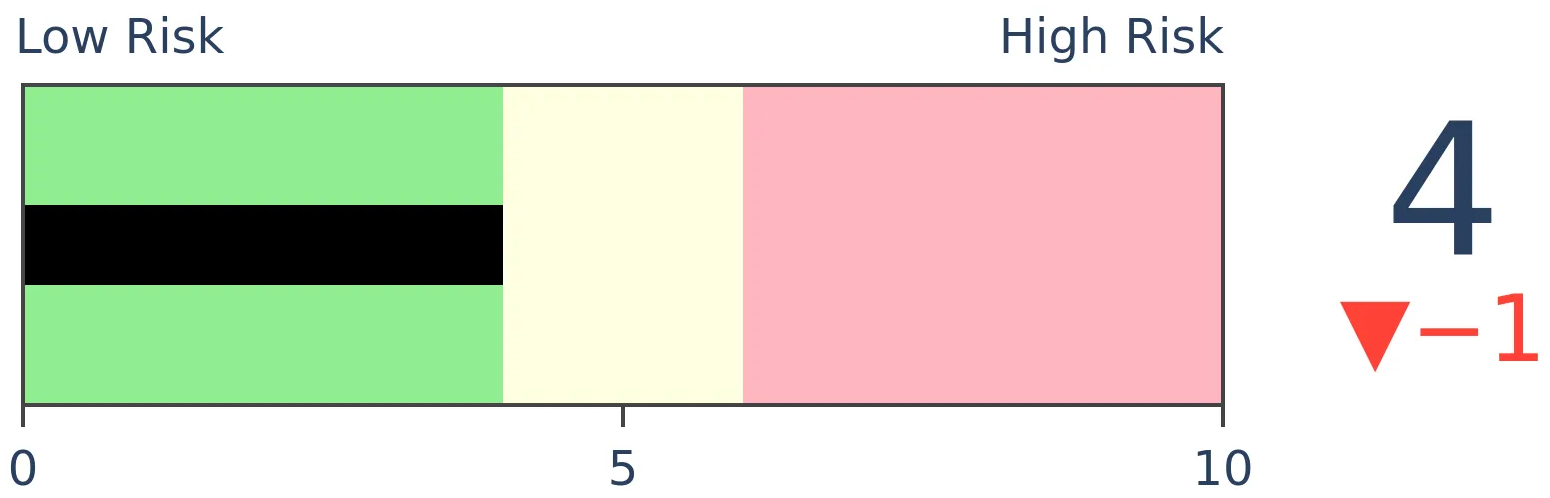
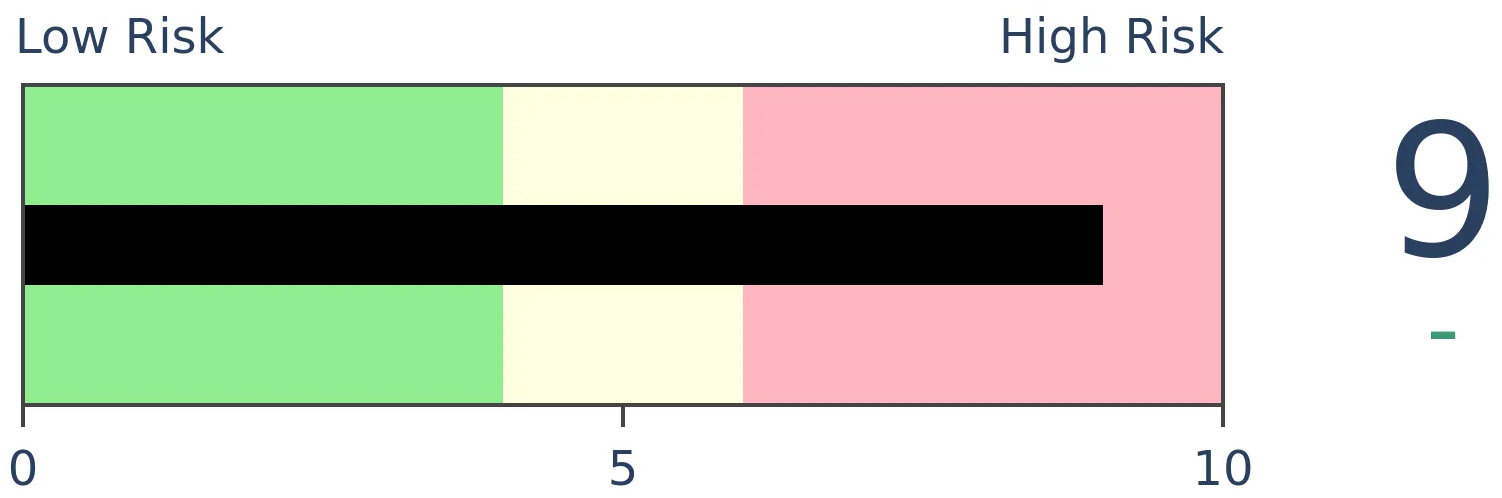
Bonds
|
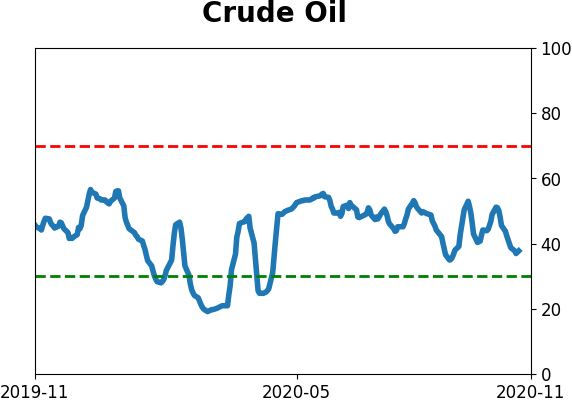
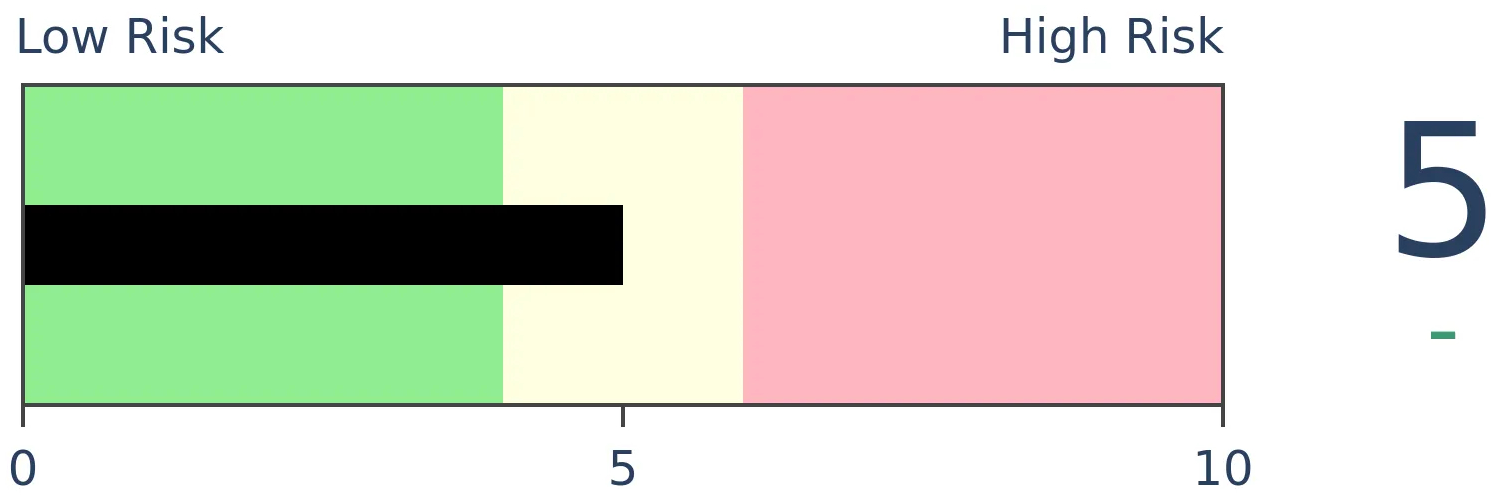
Crude Oil

|
|
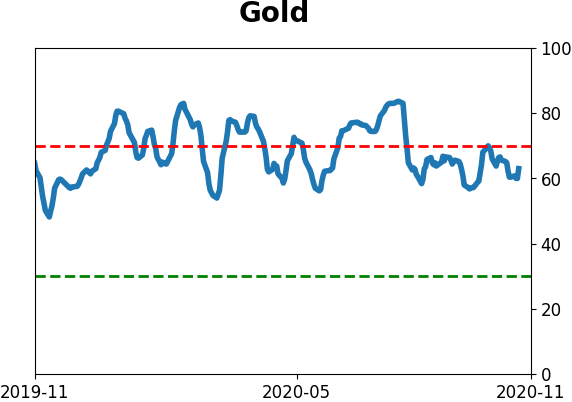
Gold
|
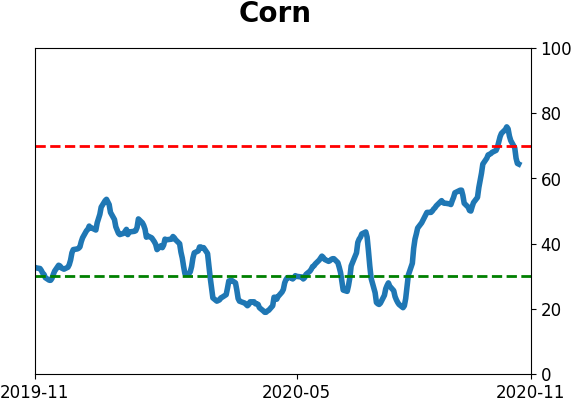
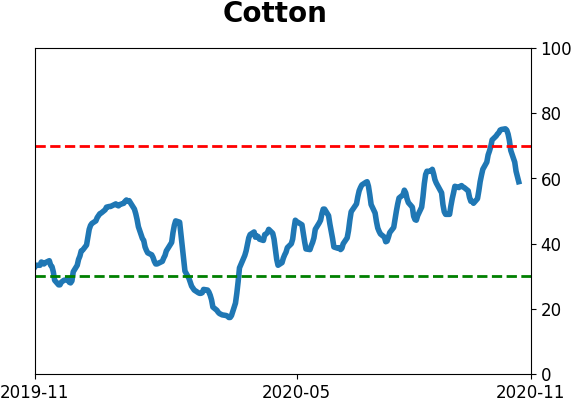
Agriculture
|
|
Research
BOTTOM LINE
Investors pulled money from bond mutual funds and ETFs in the latest week, only the 2nd outflow in the past 30 weeks. They continue to flee stock funds. The consistency of flows between bonds and stocks over more than 6 months has never been more stark.
FORECAST / TIMEFRAME
None
|
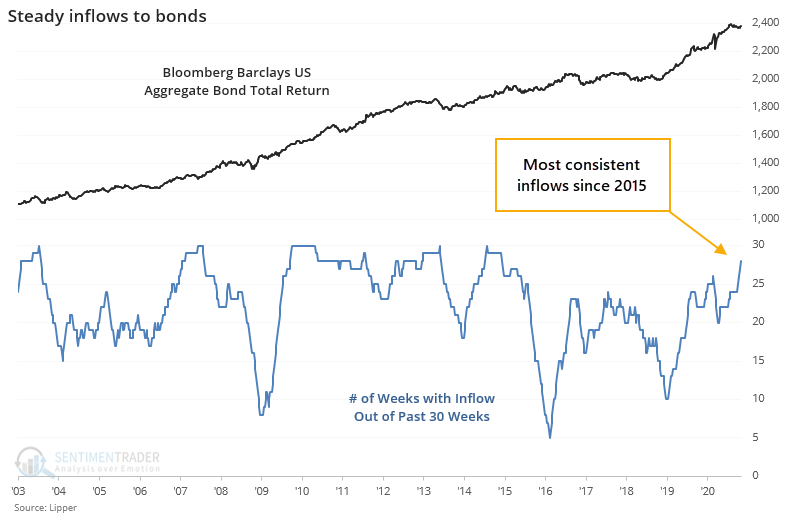
Investors still aren't showing much love for stocks, at least according to flows in mutual funds and ETFs. They still favor bonds, despite a recent blip.
The latest data from Lipper shows that investors finally pulled some money out of bond funds over the past week. That's only the 2nd outflow in the past 30 weeks.
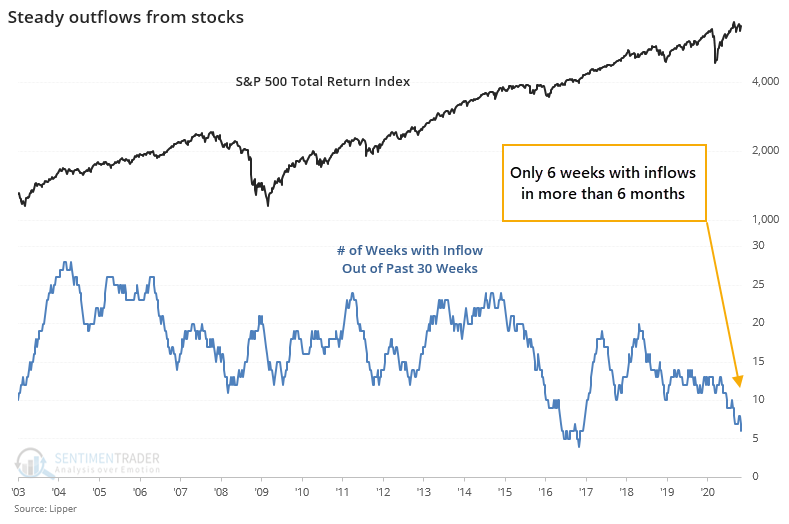
Stocks, on the other hand, have seen almost nothing but outflows over that time span.
The consistency of flows between the two asset classes has never been more stark. The chart below shows the difference in the number of weeks with inflows between bonds and stocks, along with a ratio of the Bloomberg Barclays U.S. Aggregate Bond Total Return index versus the S&P 500 Total Return index.
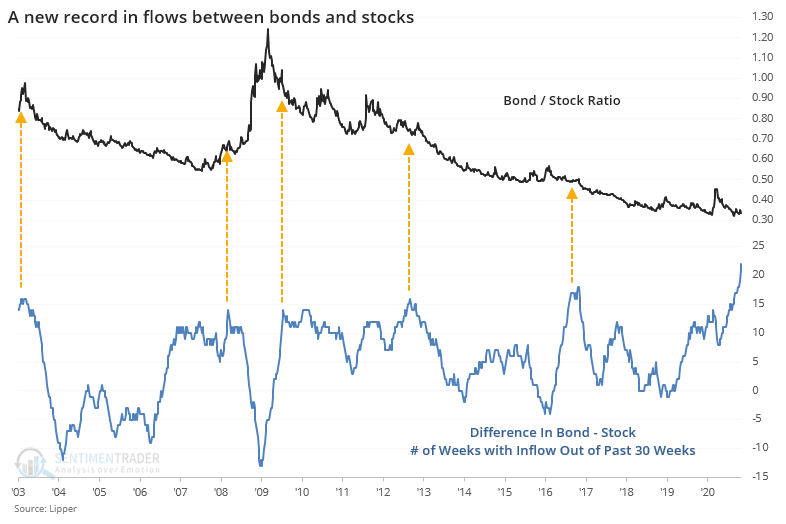
The difference in flows moved to a record several weeks ago and continues to reach new highs. The handful of other times there were around 15 more weeks of inflows to bonds versus stocks, the bond/stock ratio tended to decline. Clearly, the overall trend has been down anyway, so it wasn't a high hurdle to cross. It's simply a suggestion that it would be odd to see bonds turn meaningfully higher versus stocks given the way investors have been shifting their assets.
BOTTOM LINE
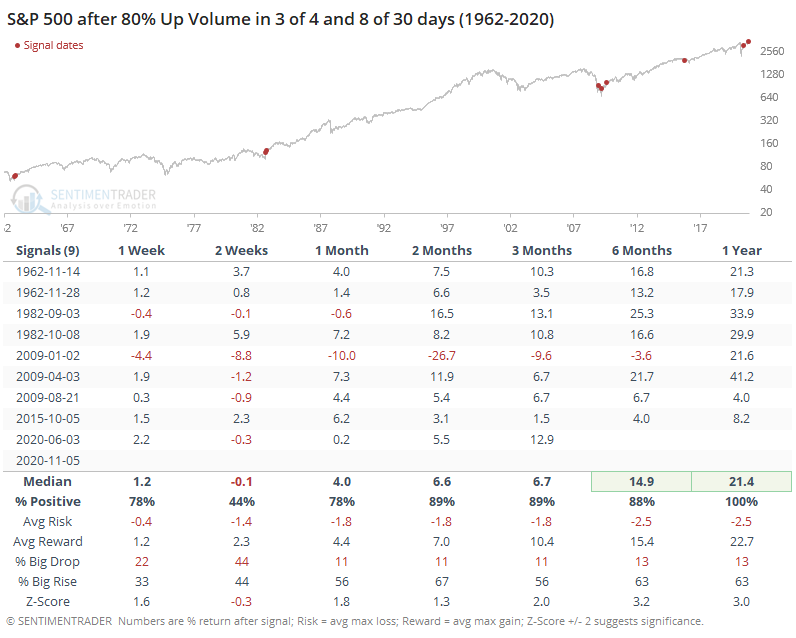
So far this week, buying interest in stocks was enough to generate 3 days with overwhelming volume flowing into advancing stocks. Similar surges preceded long-term gains every time. This year has also now surpassed 2009 as having the most thrusts of any year since 1962.
FORECAST / TIMEFRAME
SPY -- Up, Long-Term
|
This has been quite a year in many respects. One of the most remarkable is the sheer number of days when buyers went almost all-in on stocks.
There was a historic surge of days with buyers focusing their volume overwhelming in advancing stocks in March through May. Then again in early October, we saw another significant cluster.
This week triggered another round, with 3 out of the past 4 sessions having better than 80% Up Volume on the NYSE. That just adds to what we'd seen in October, so there have also been at least 8 sessions out of the past 30 with such positively skewed volume.
When these clusters have triggered before, stocks breathed a bit short-term but showed excellent gains and risk versus reward over the next 6-12 months.
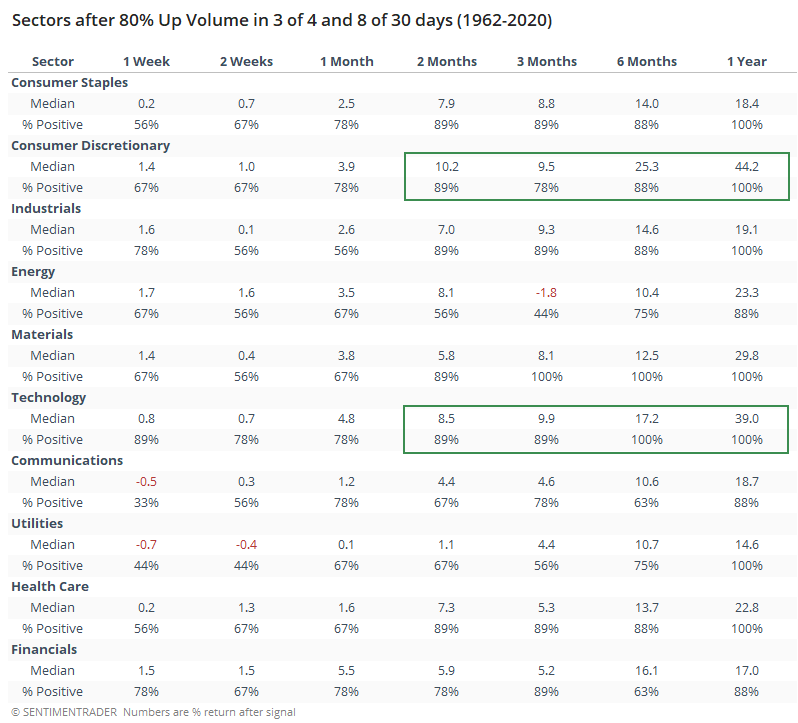
Not surprisingly, the sectors showing the best returns after clusters like this were the higher-beta ones, like Consumer Discretionary and Technology.
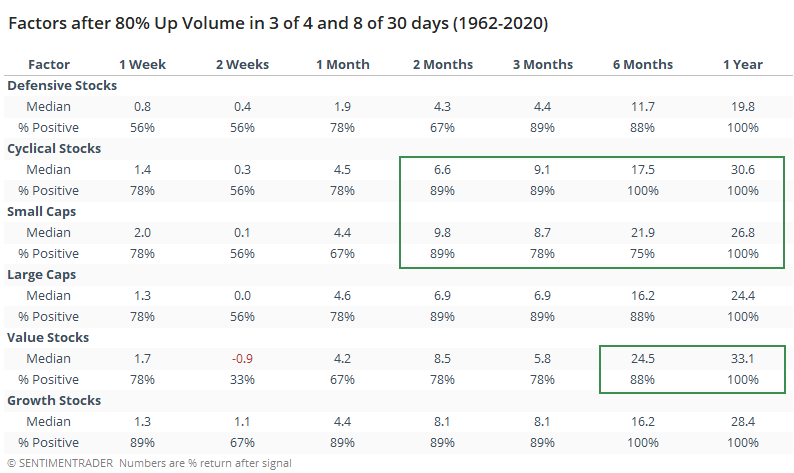
The factors showed the same bias, with the best returns in Cyclical and Small-Cap stocks over the medium- to long-term. Value stocks also performed well, with an average gain of more than 33% over the next 12 months.
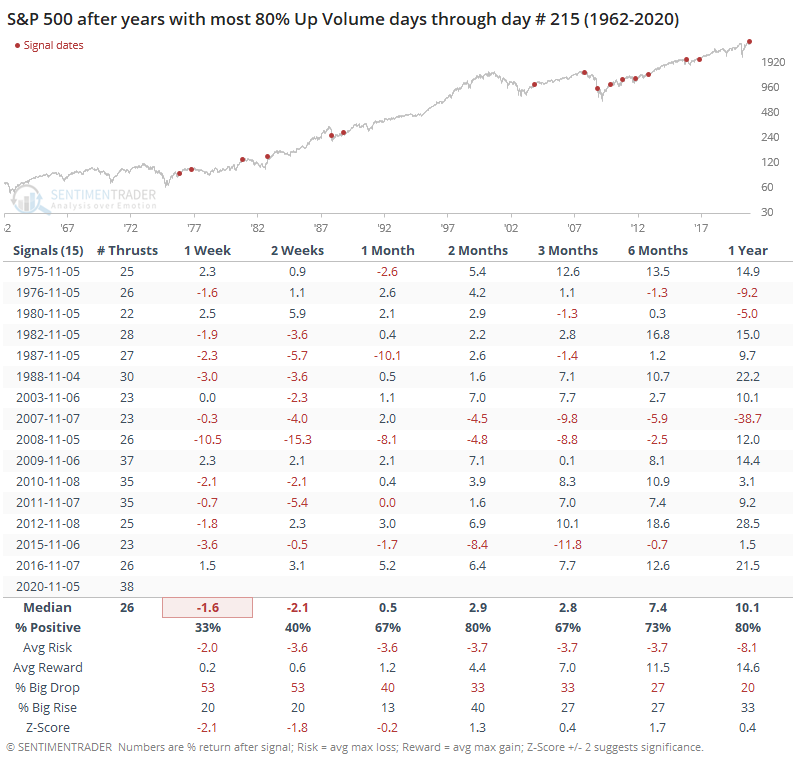
This year has now surpassed 2009 as having the greatest number of days with 80% or more Up Volume through session #215.
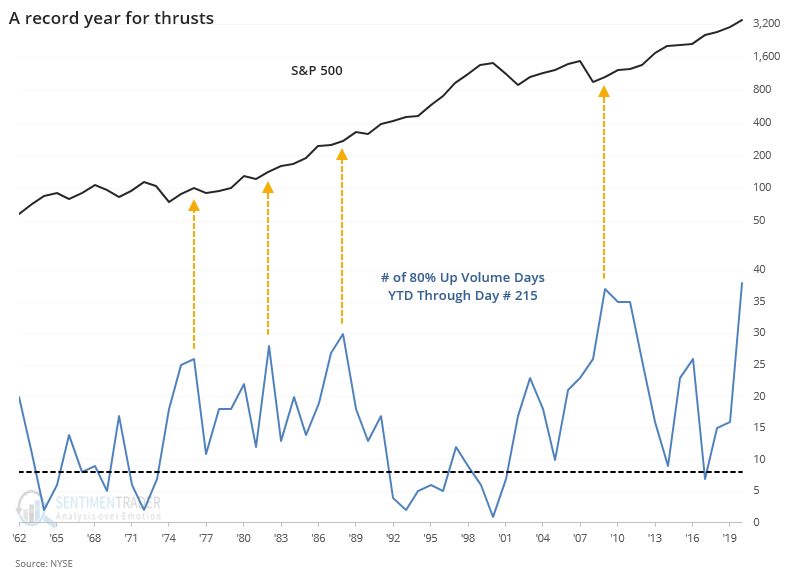
After the years with the most thrusts at this time of year, short-term returns were poor, but medium-term ones were good with 3 losses out of 15 signals over the next 2 months.
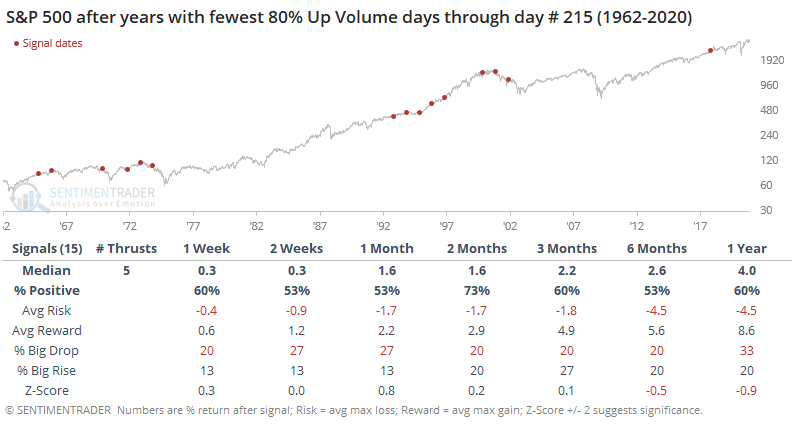
After years with the fewest number of 80% Up Volume days, returns were more muted over the medium- to long-term.
Just because we see a cluster of days with huge Up Volume doesn't mean there can be no weakness going forward - we saw that clearly enough in October. Short-term returns aren't the most consistent time frame for these, anyway. The continued pressure from buyers that was on display yet again this week continues to be a strong argument for higher prices over the medium- to long-term.
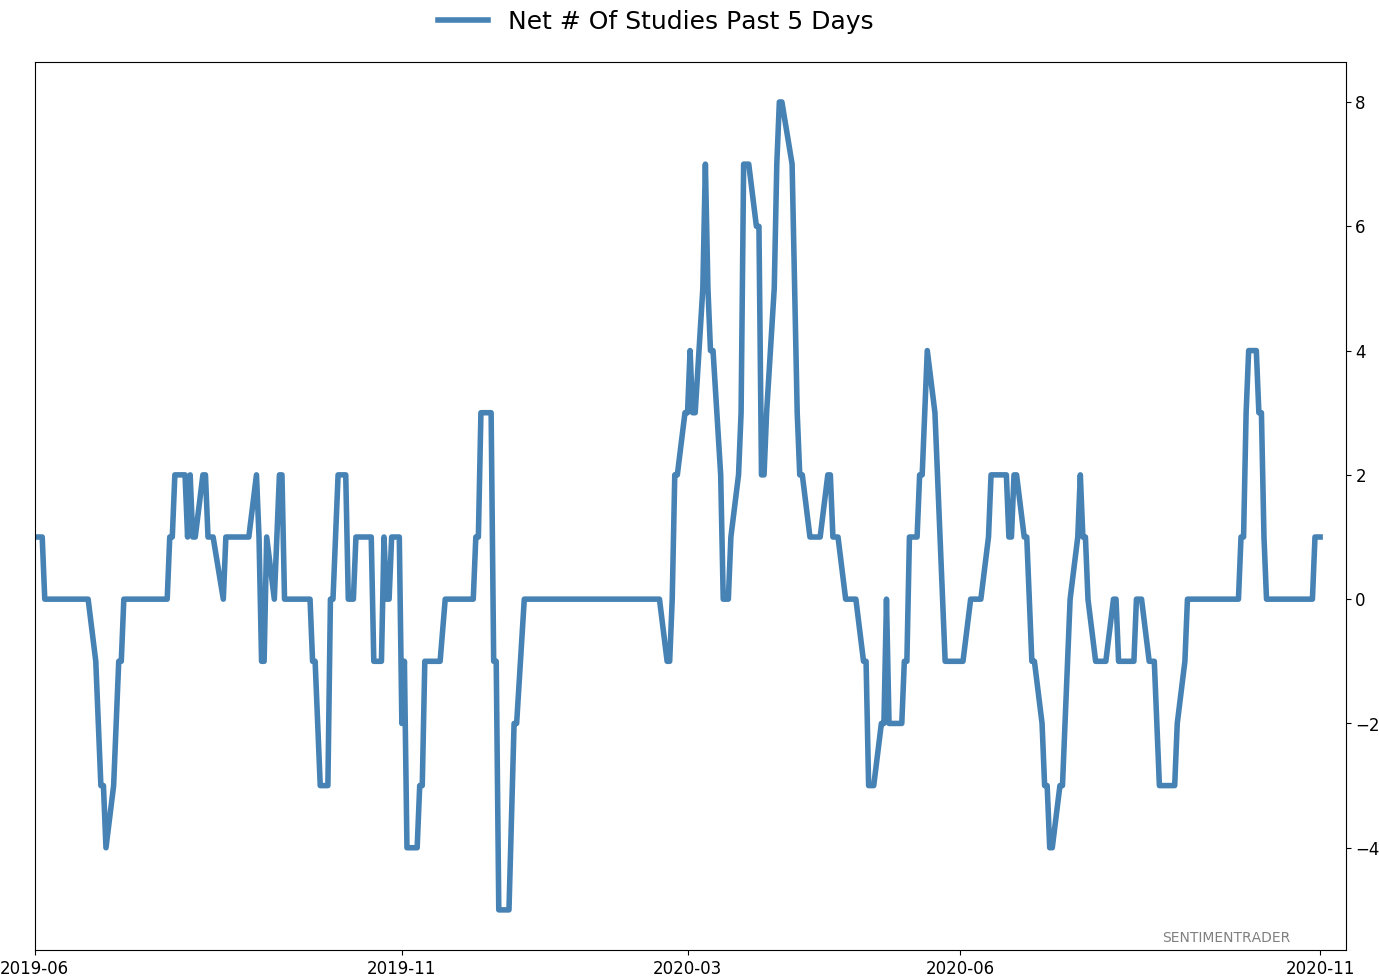
Active Studies
| Time Frame | Bullish | Bearish | | Short-Term | 0 | 0 | | Medium-Term | 5 | 8 | | Long-Term | 49 | 2 |
|
Indicators at Extremes
Portfolio
| Position | Description | Weight % | Added / Reduced | Date | | Stocks | 15.6% RSP, 10.1% VWO, 7.5% XLE, 5.1% PSCE | 38.2 | Added 5% | 2020-10-15 | | Bonds | 10% BND, 10% SCHP, 10% ANGL | 29.7 | Reduced 0.1% | 2020-10-02 | | Commodities | GCC | 2.4 | Reduced 2.1%
| 2020-09-04 | | Precious Metals | GDX | 4.7 | Added 5% | 2020-09-09 | | Special Situations | | 0.0 | Reduced 5% | 2020-10-02 | | Cash | | 25.0 | | |
|
Updates (Changes made today are underlined)
After the September swoon wrung some of the worst of the speculation out of stocks, there are some signs that it's returning, especially in the options market. It's helped to push Dumb Money Confidence above 70%. A big difference between now and August is that in August, there was a multitude of days with exceptionally odd breadth readings. Some of the biggest stocks were masking underlying weakness. Combined with heavy speculative activity, it was a dangerous setup. Now, we've seen very strong internal strength, in the broad market, as well as tech and small-cap stocks. Prior signals almost invariably led to higher prices. That's hard to square with the idea that forward returns tend to be subdued when Confidence is high, but that's less reliable during healthy market conditions, which we're seeing now (for the most part). I added some risk with small-cap energy stocks, due to an increasing number of positive signs in both small-caps and energy. This is intended as a long-term position.
RETURN YTD: -0.3% 2019: 12.6%, 2018: 0.6%, 2017: 3.8%, 2016: 17.1%, 2015: 9.2%, 2014: 14.5%, 2013: 2.2%, 2012: 10.8%, 2011: 16.5%, 2010: 15.3%, 2009: 23.9%, 2008: 16.2%, 2007: 7.8%
|
|
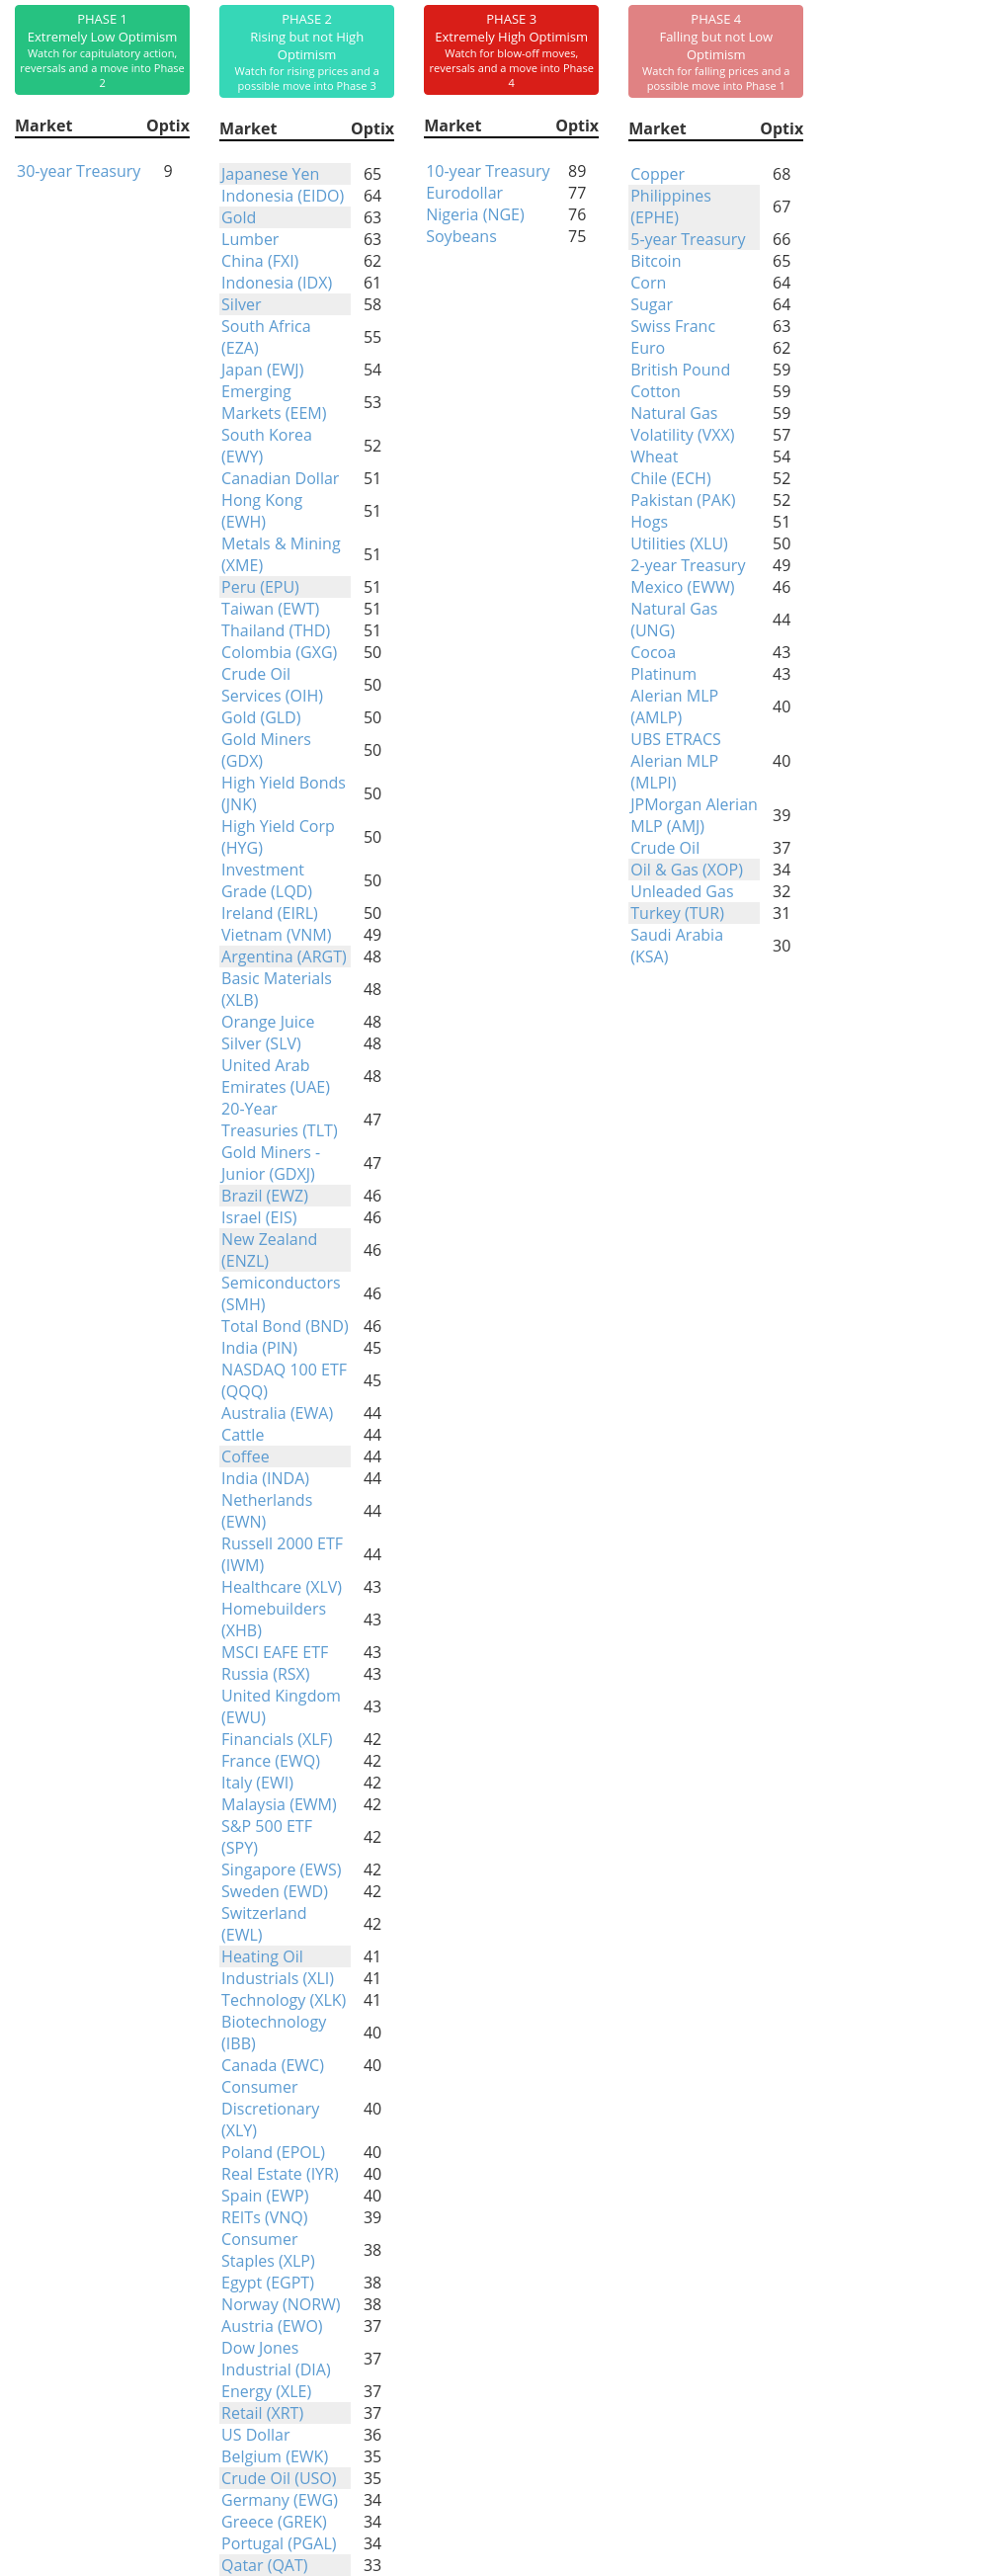
Phase Table
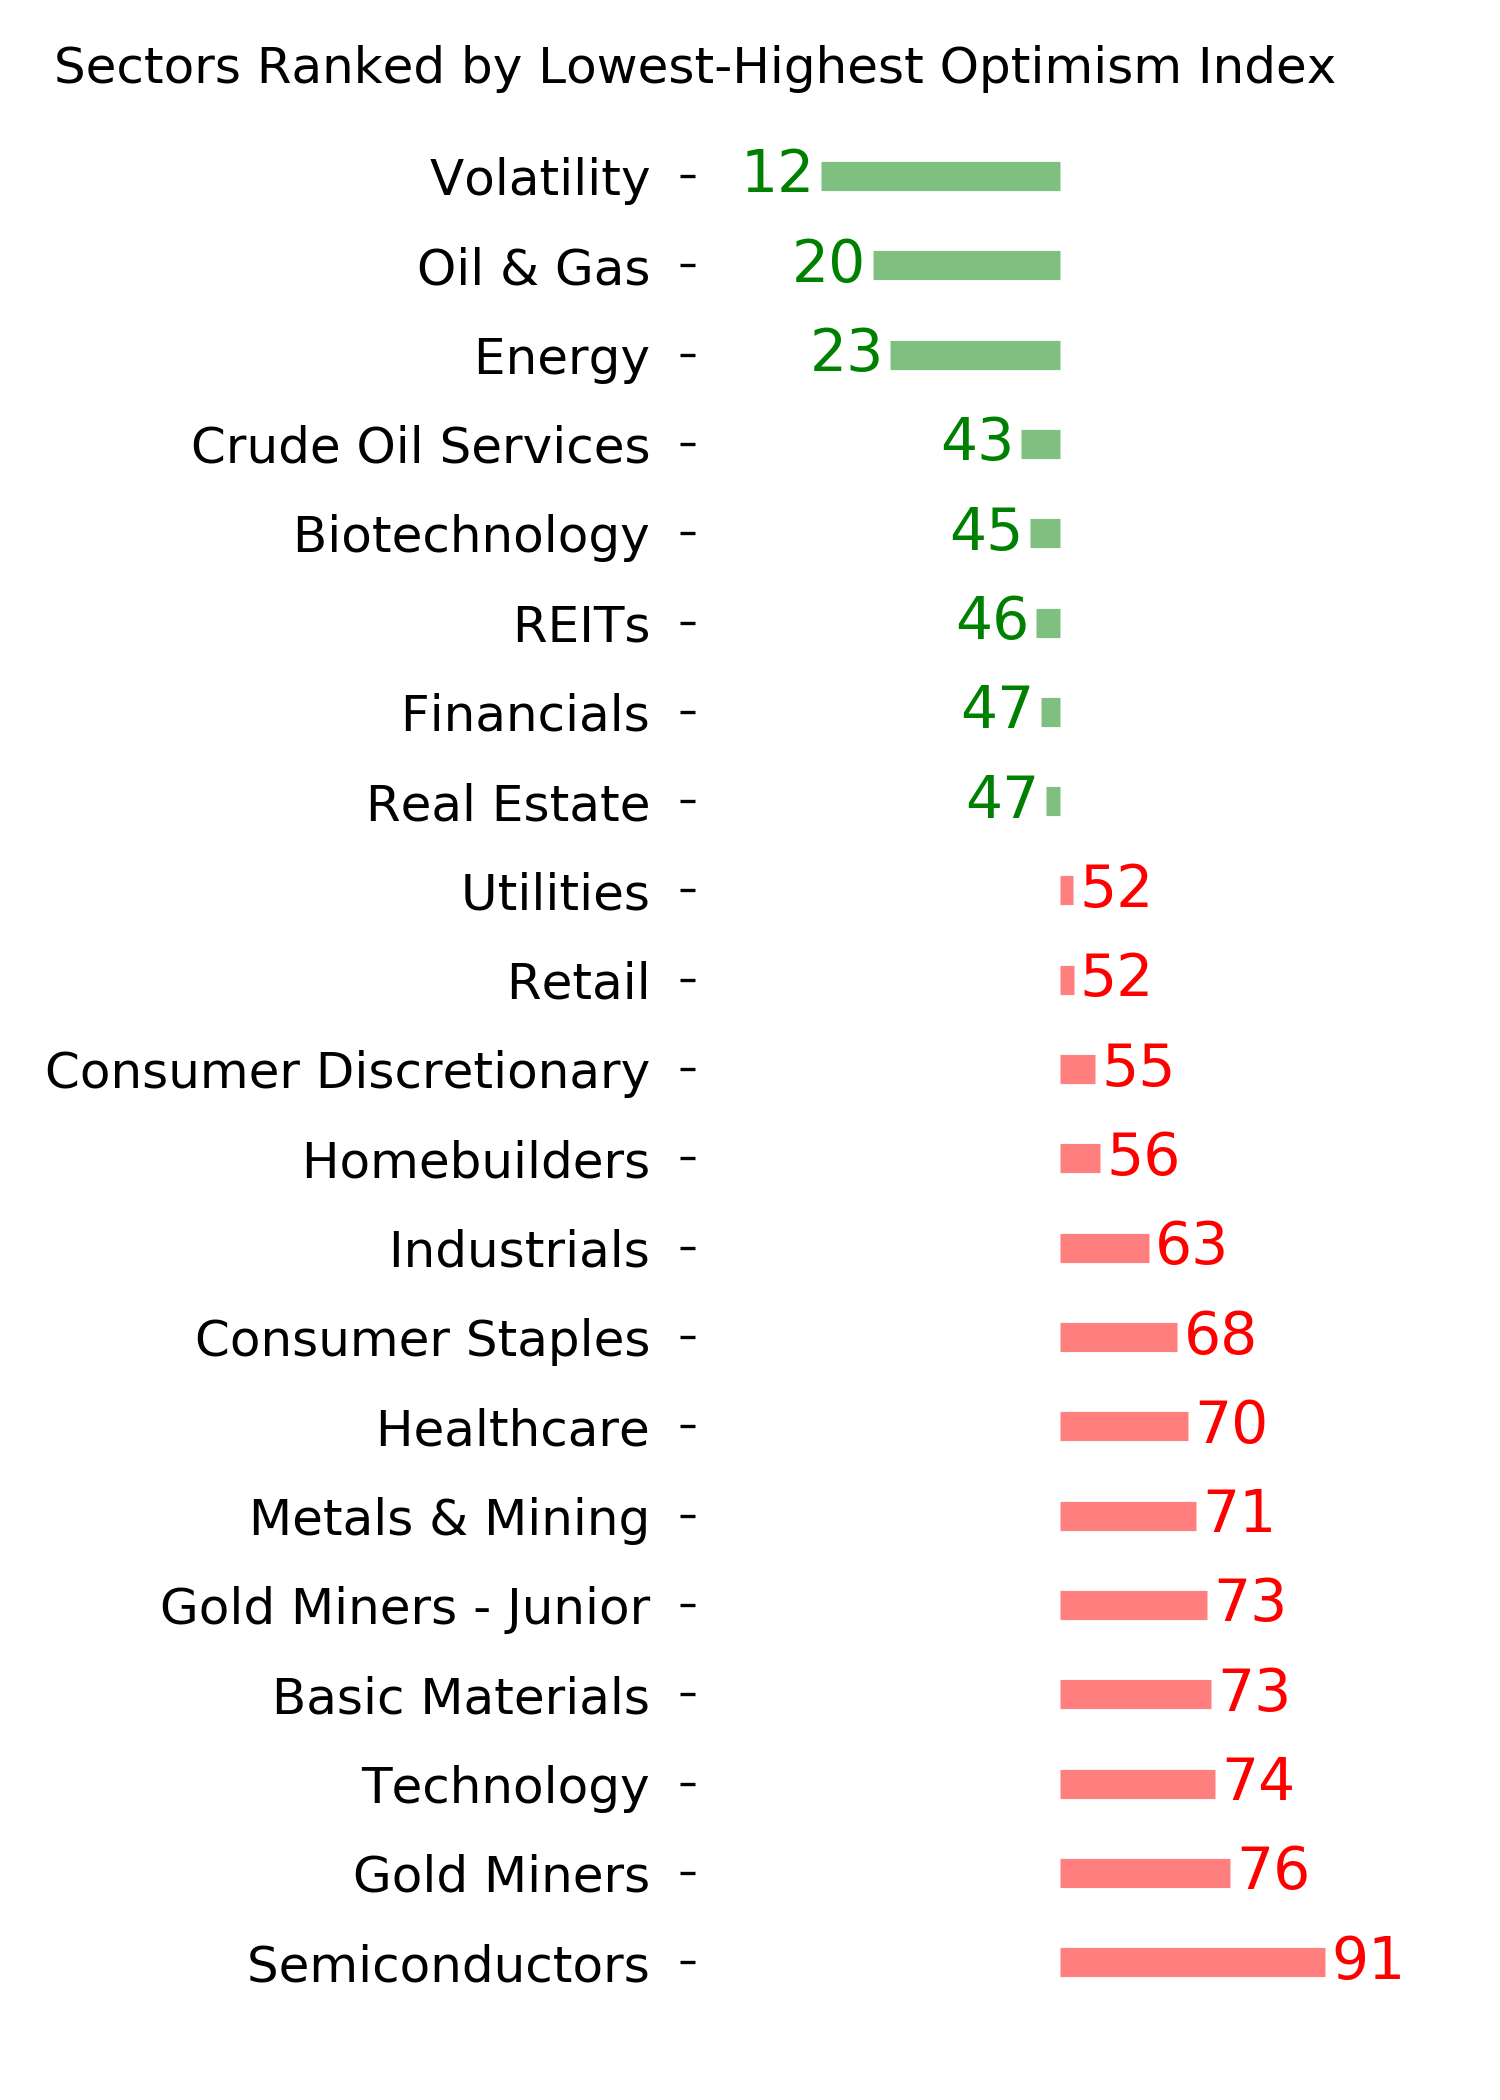
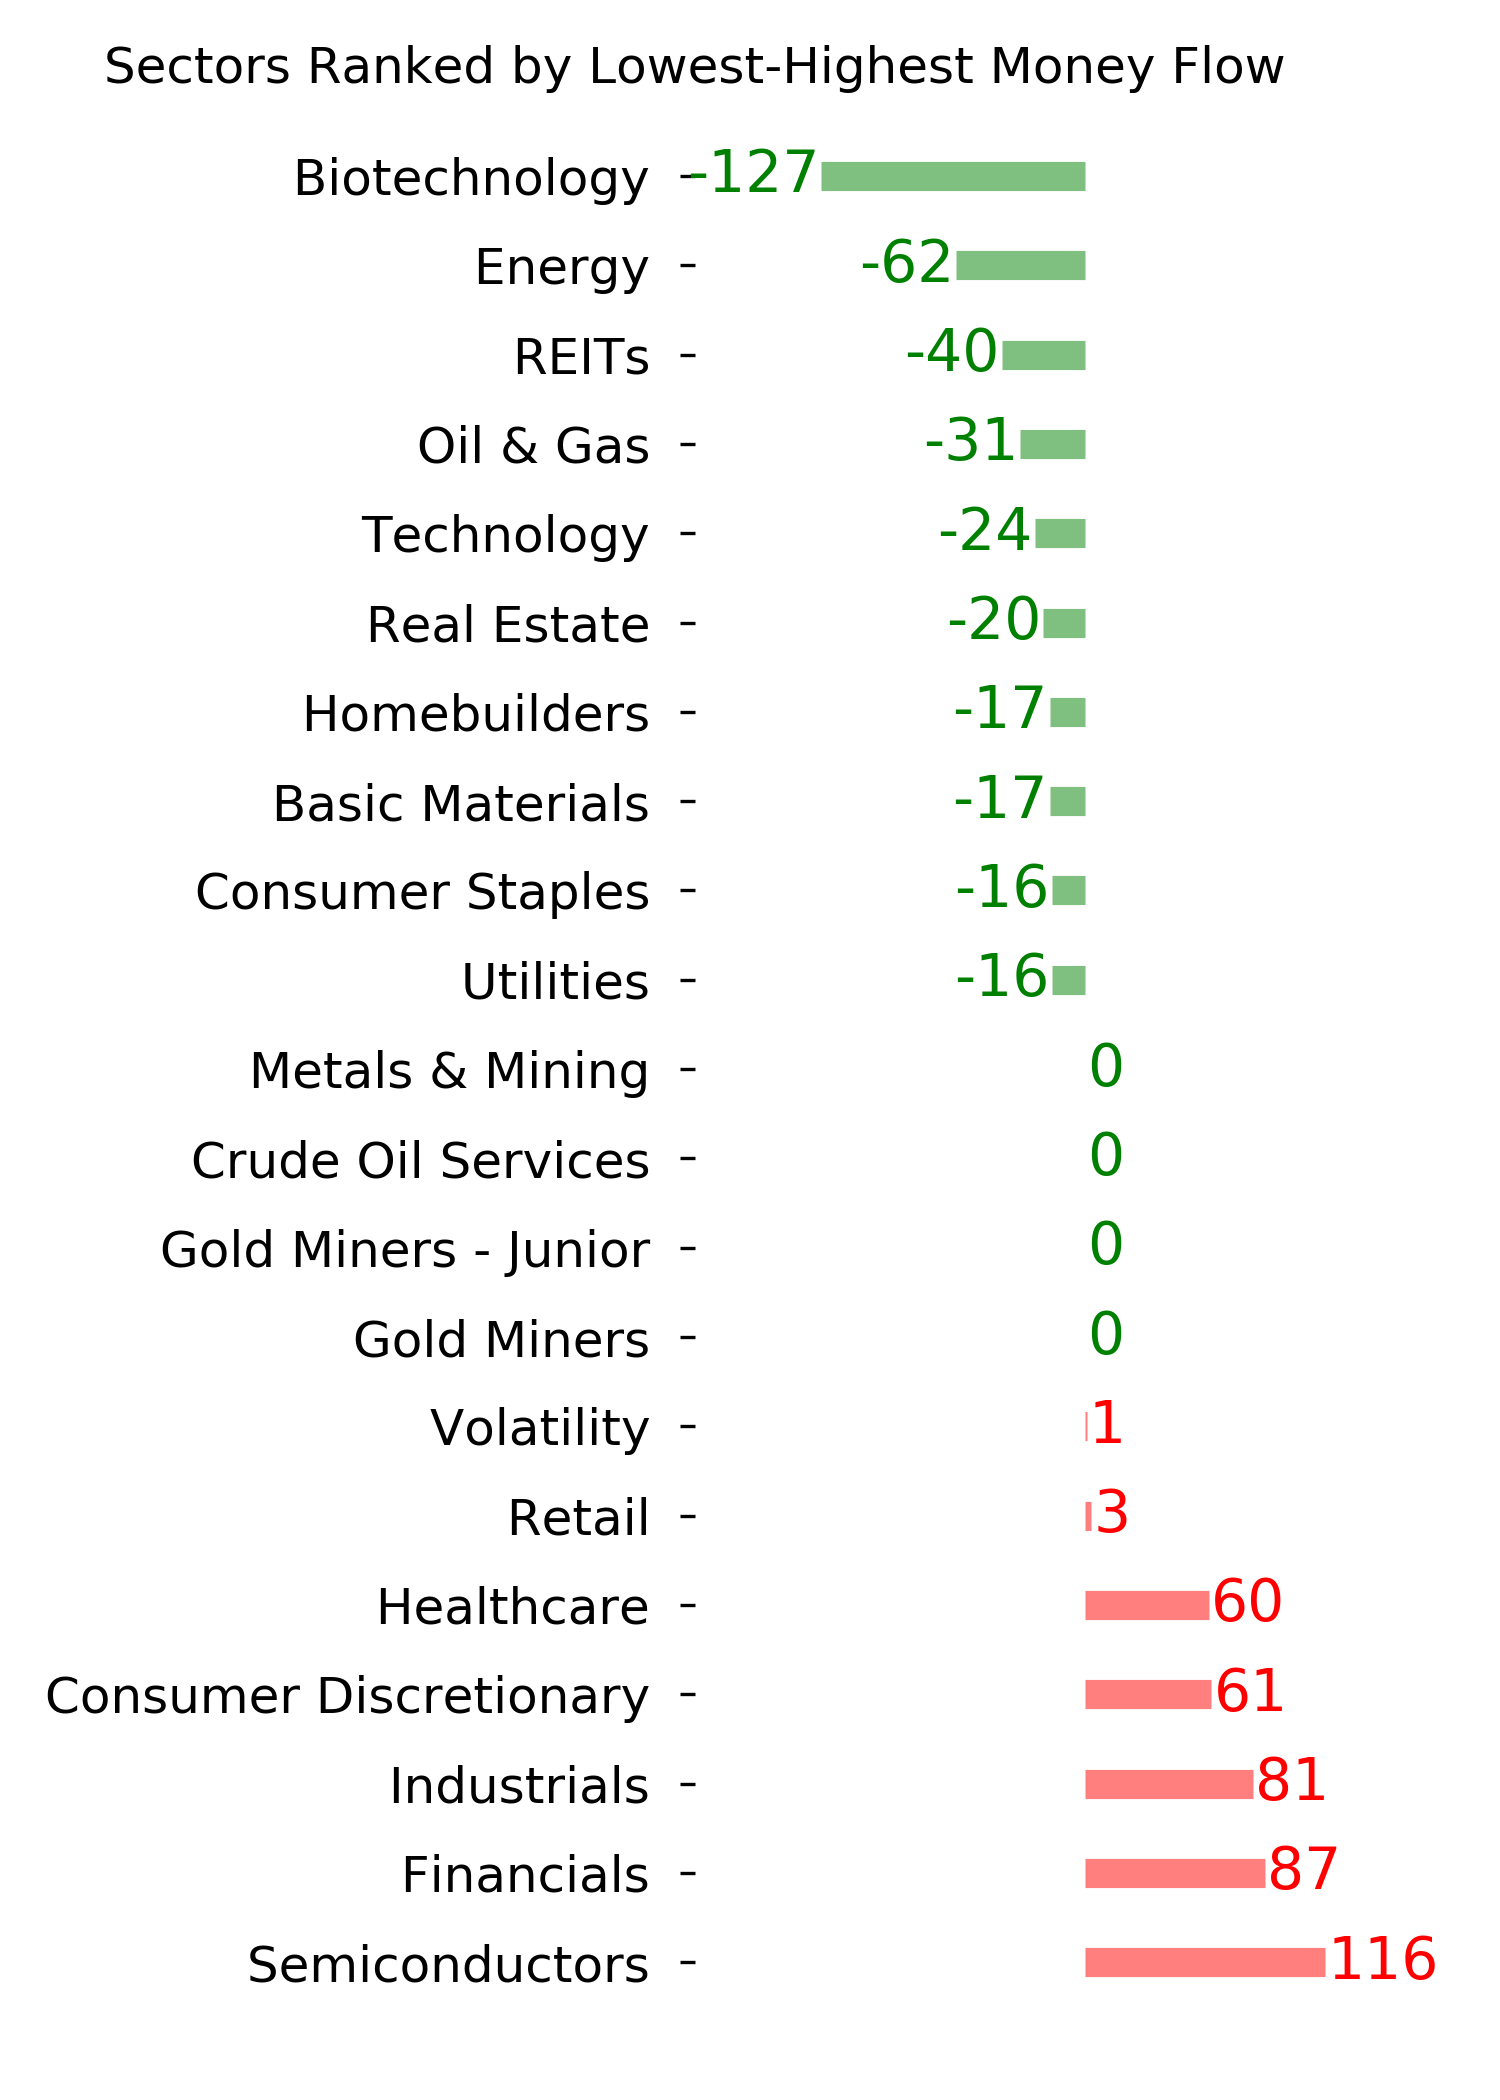
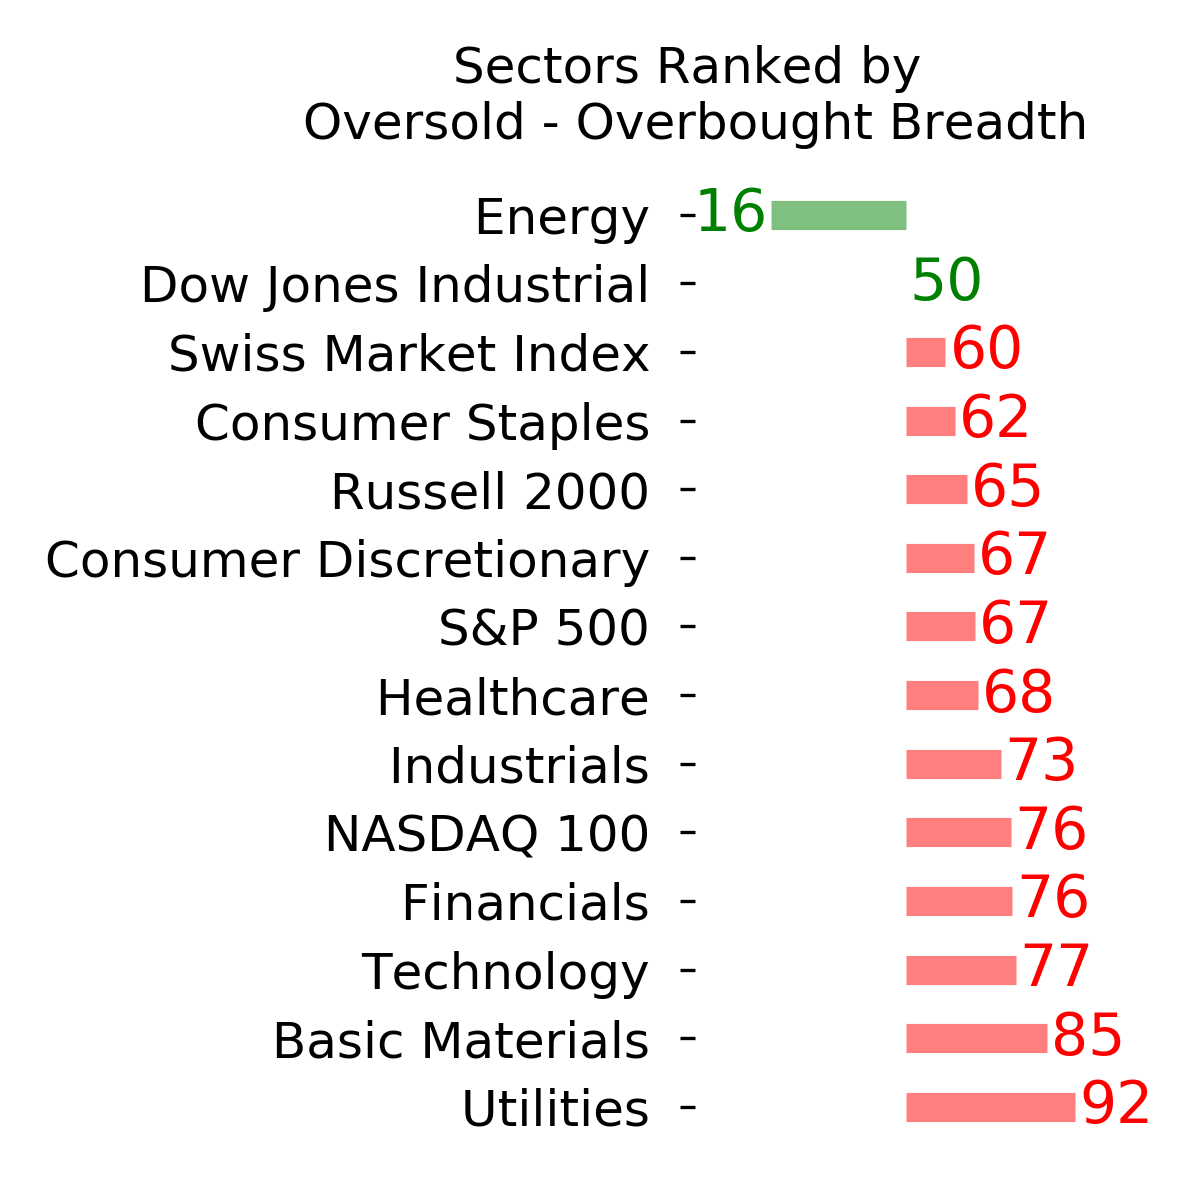
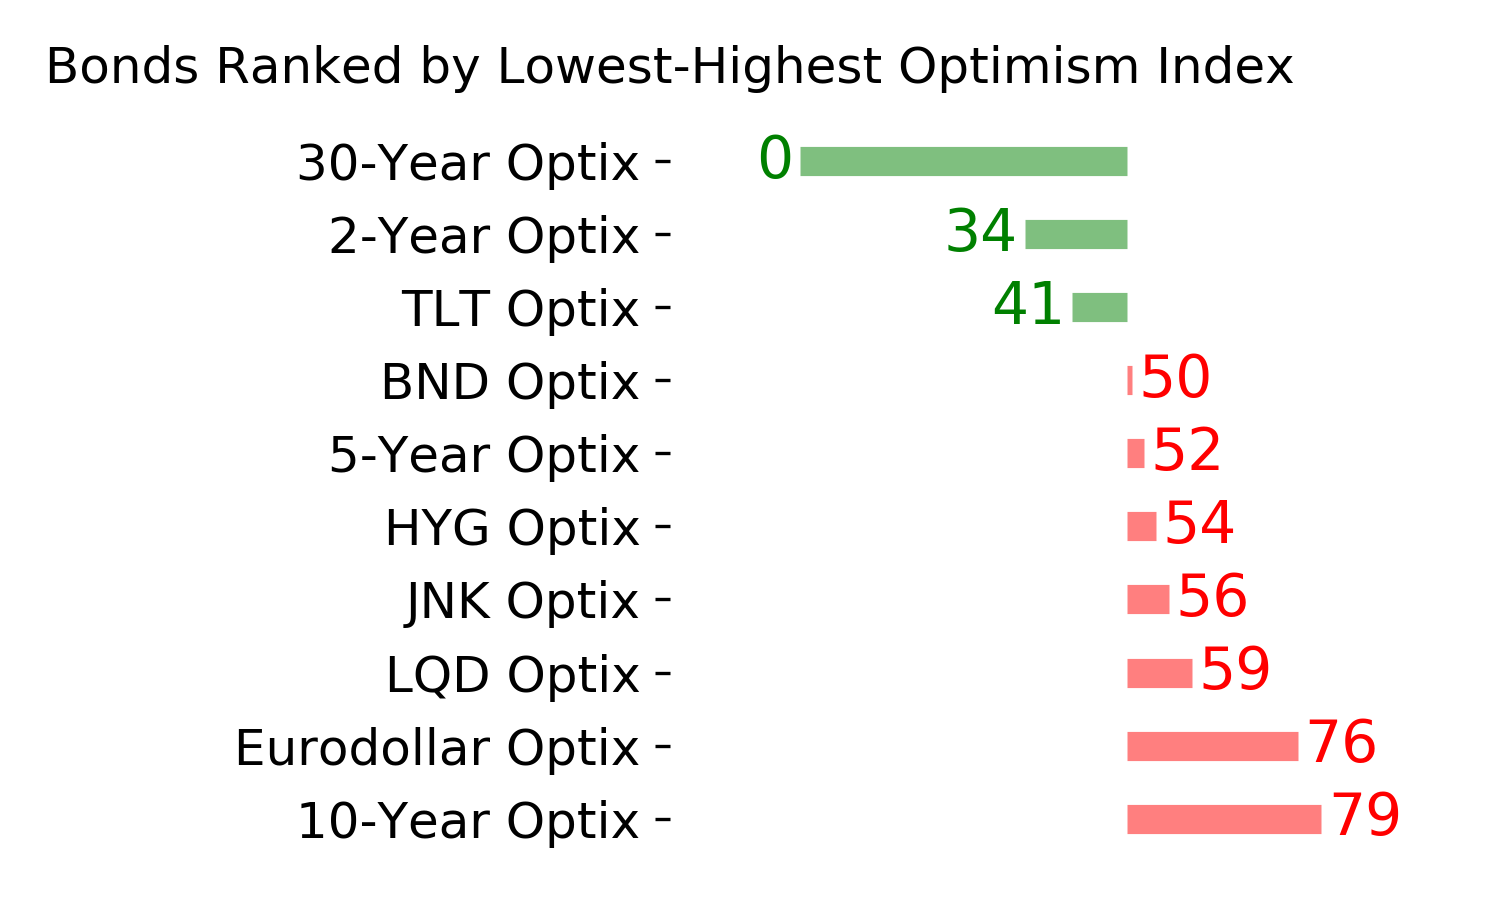
Ranks
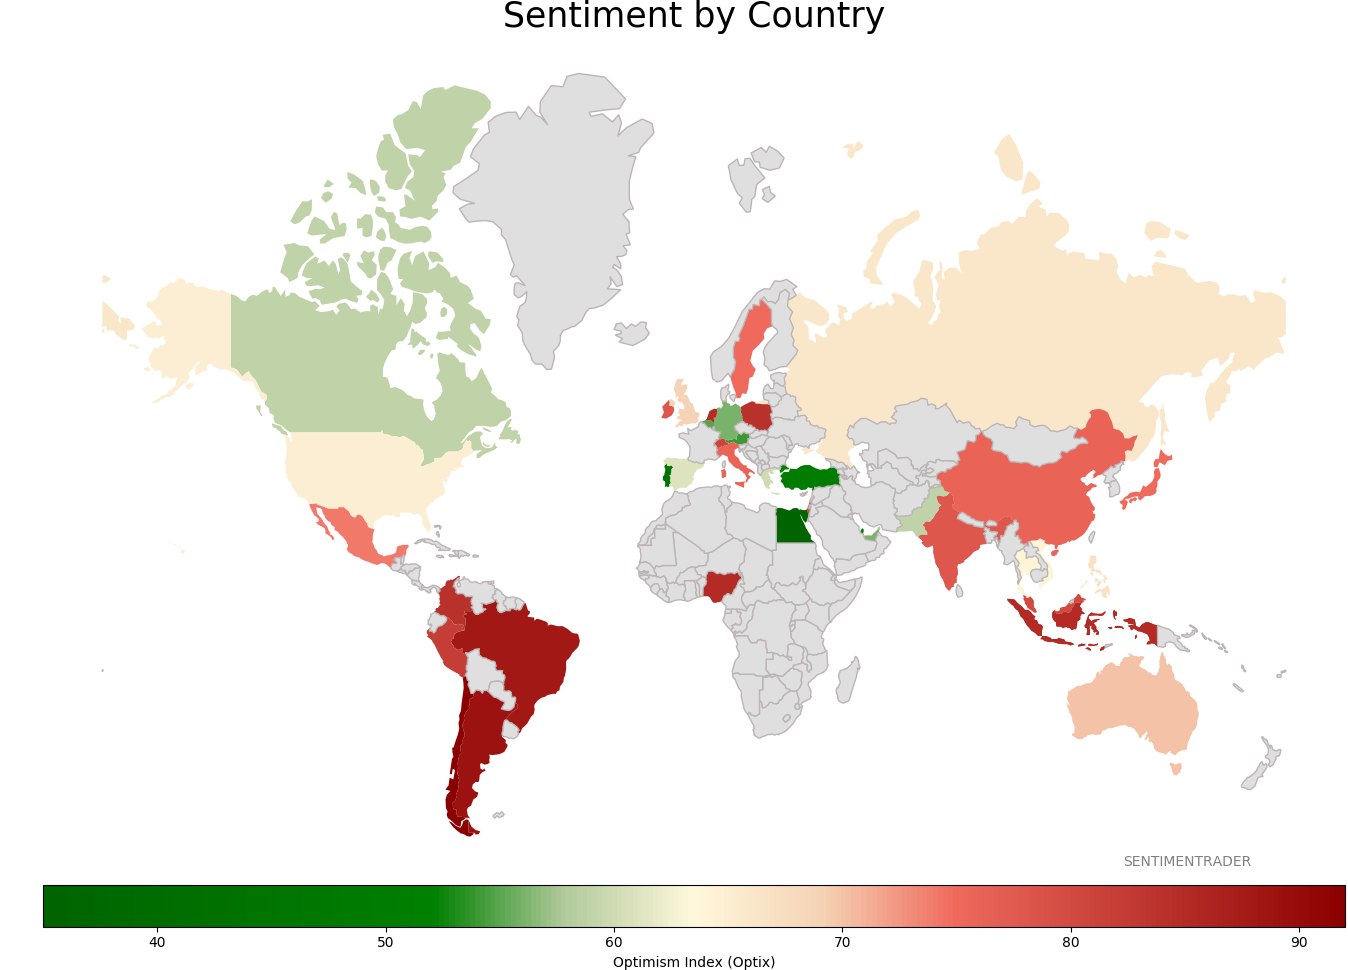
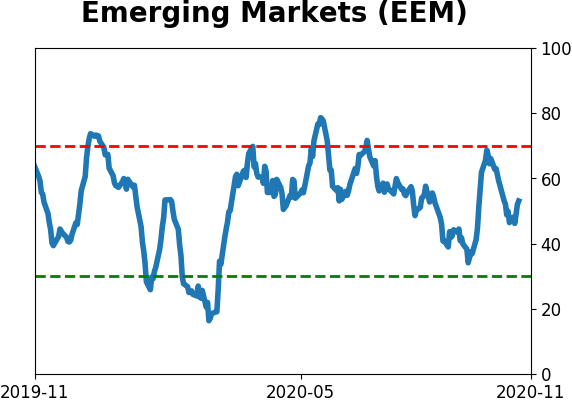
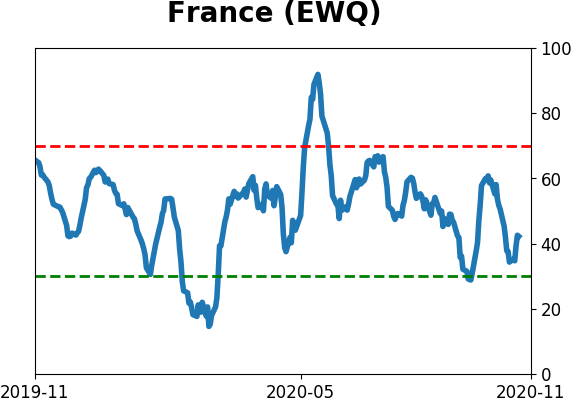
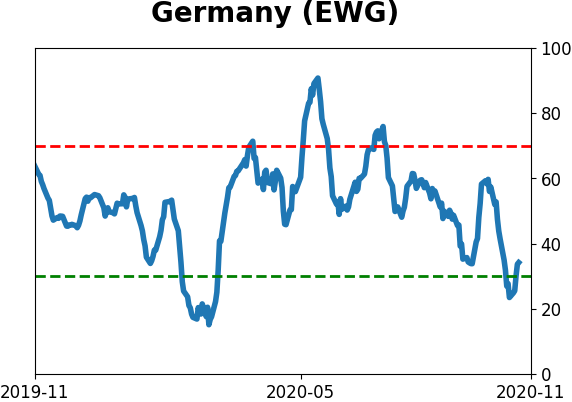
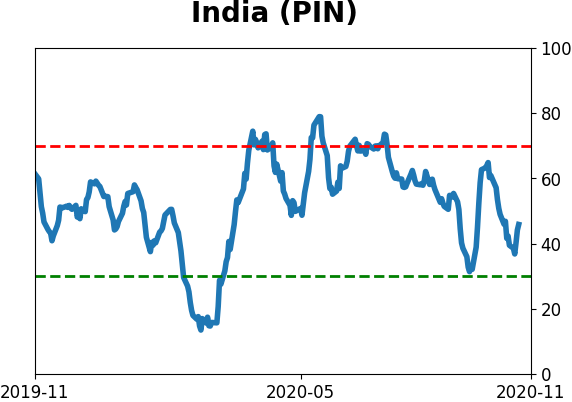
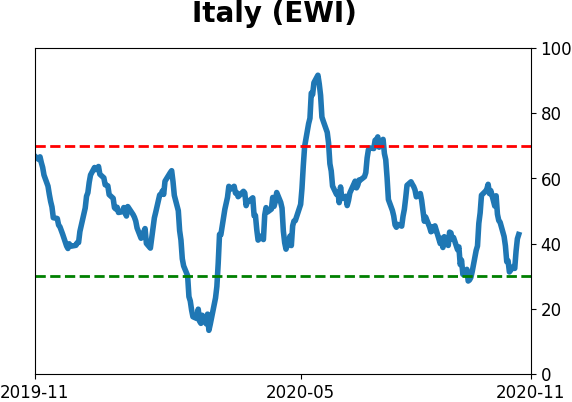
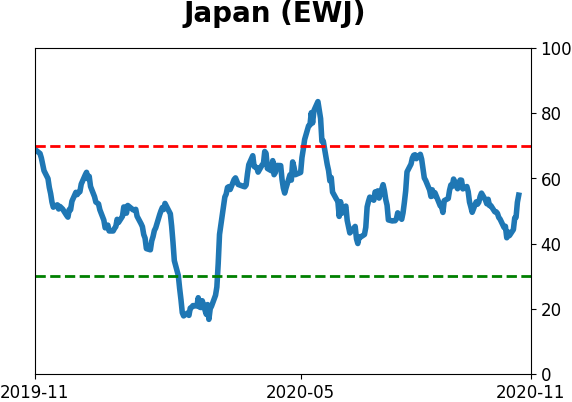
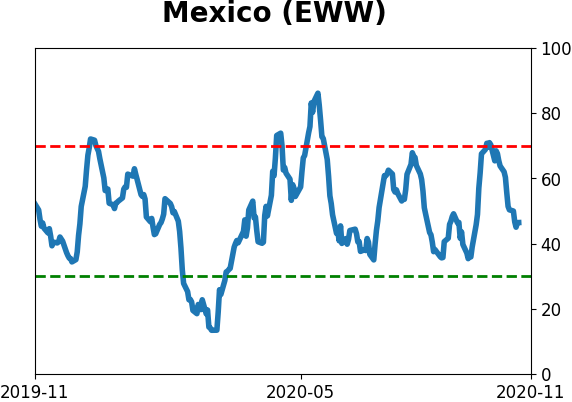
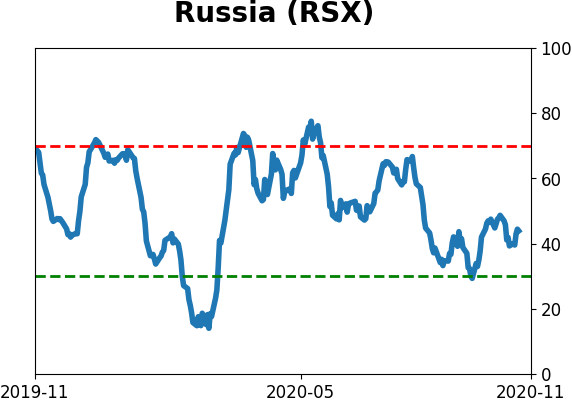
Sentiment Around The World
Optimism Index Thumbnails
|
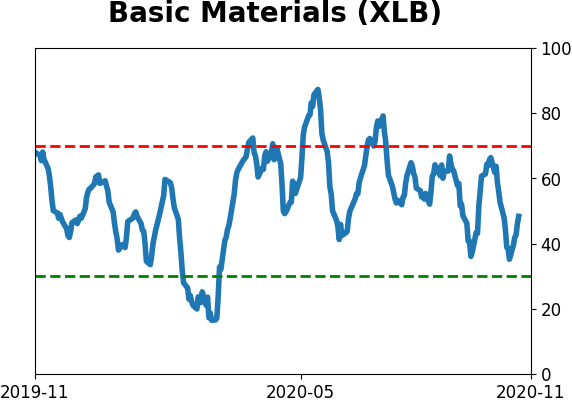
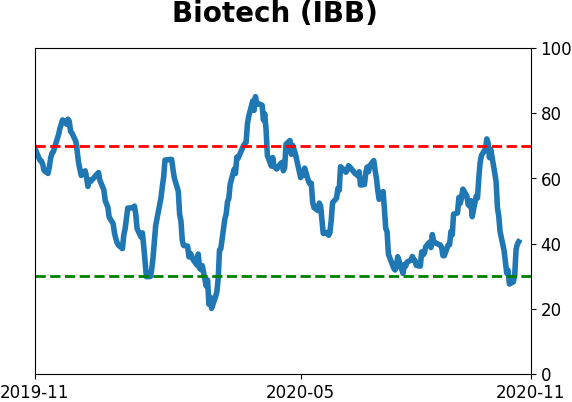
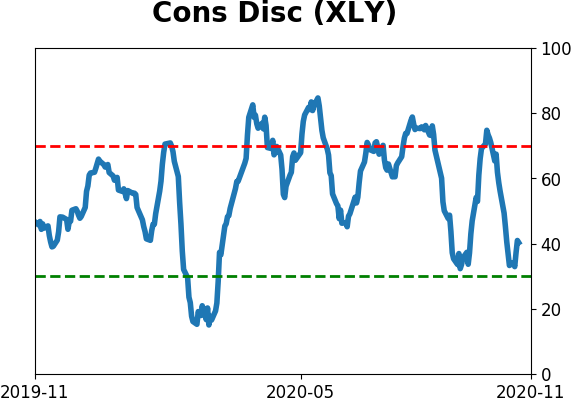
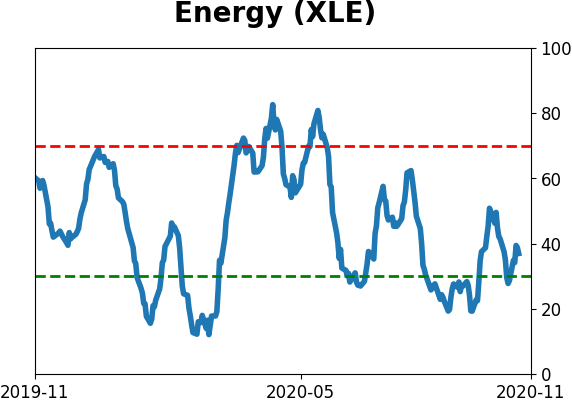
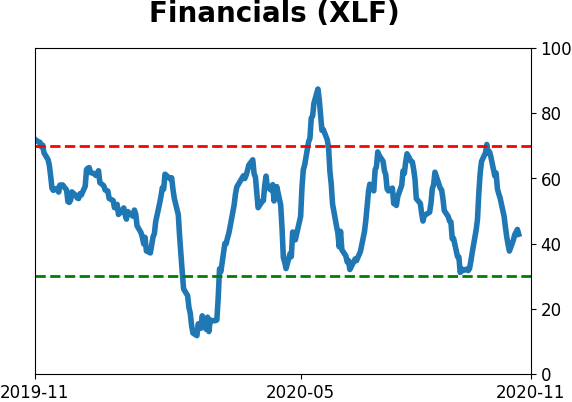
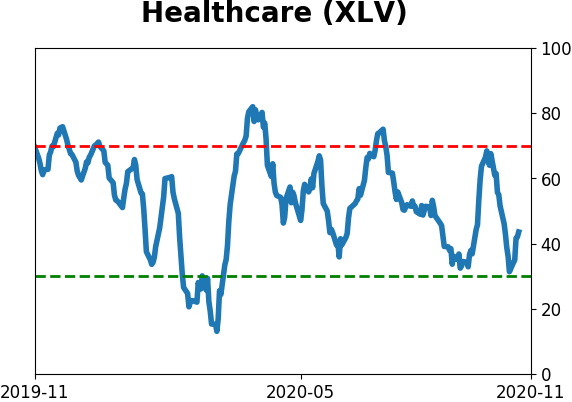
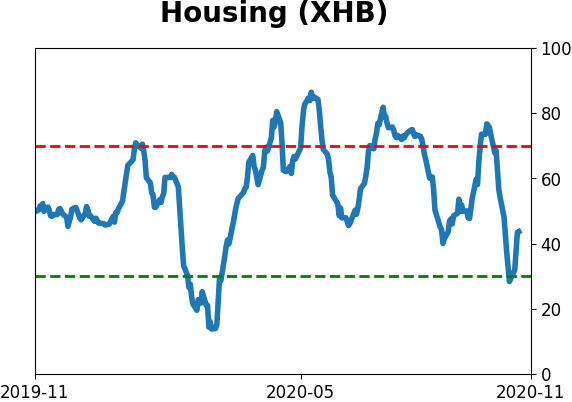
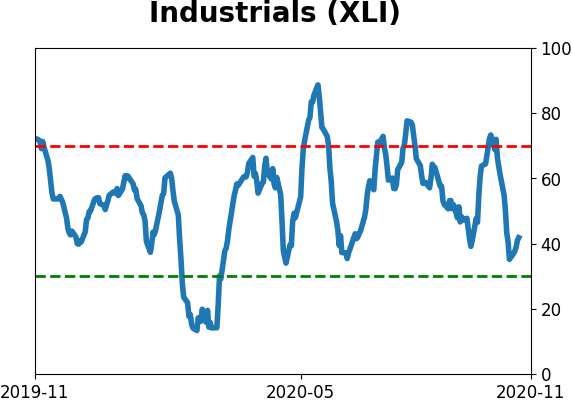
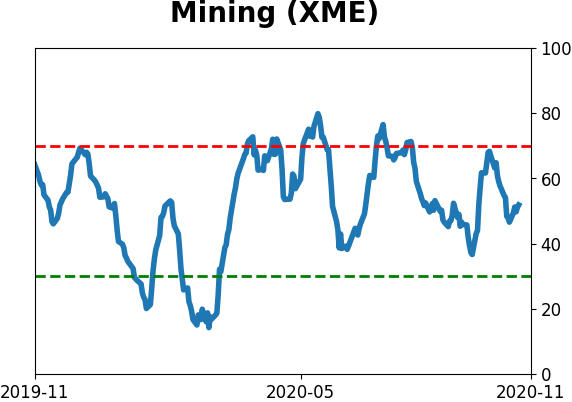
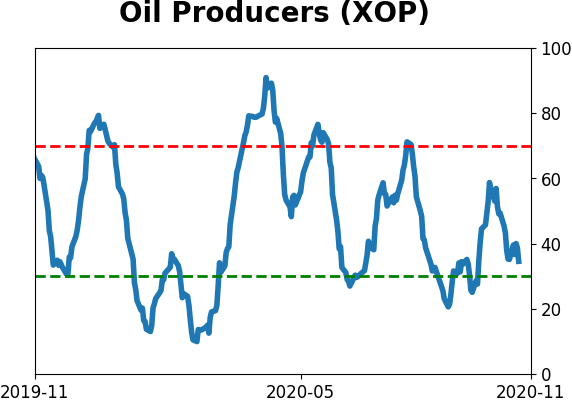
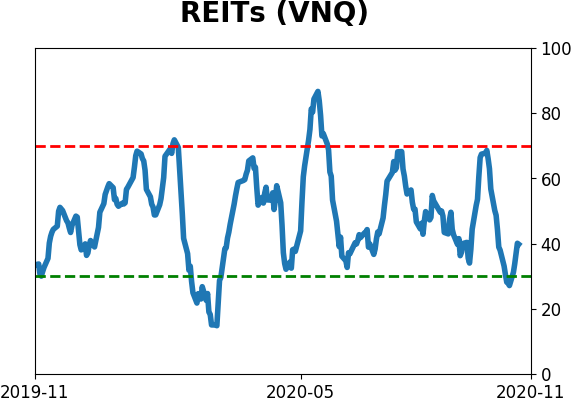
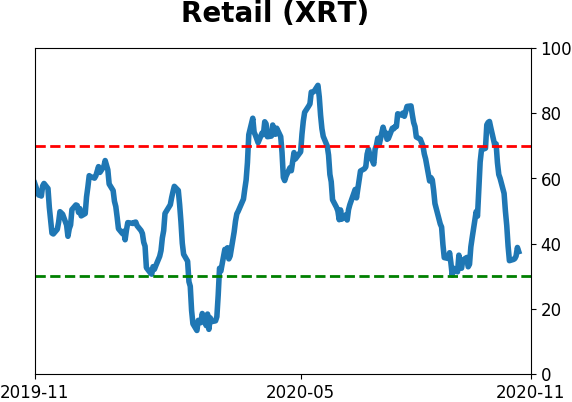
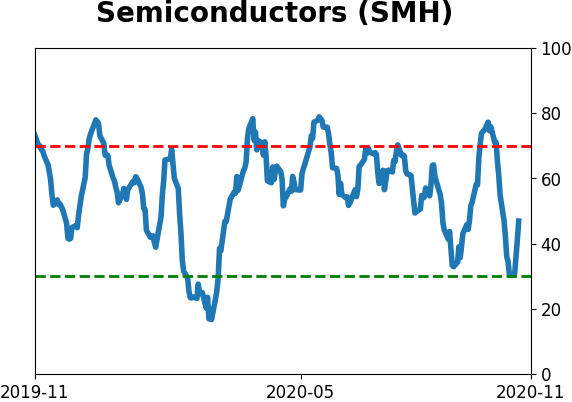
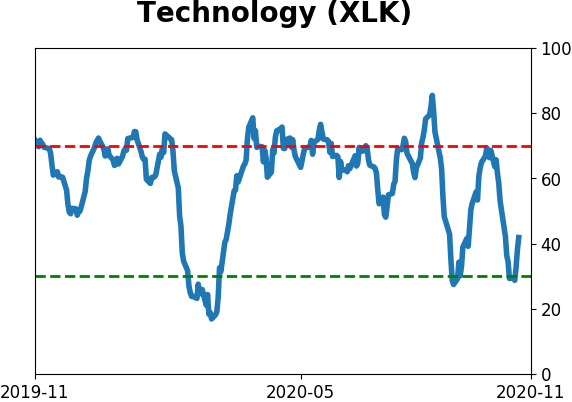
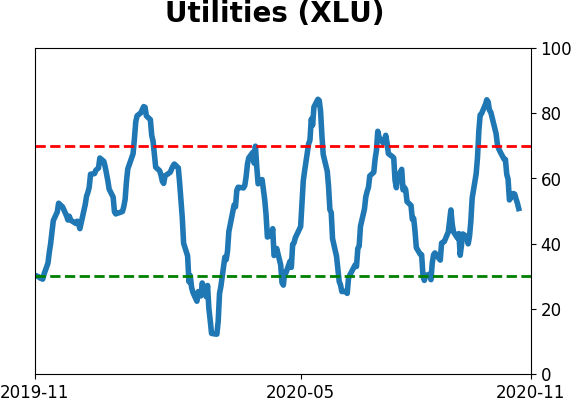
Sector ETF's - 10-Day Moving Average
|
|
|
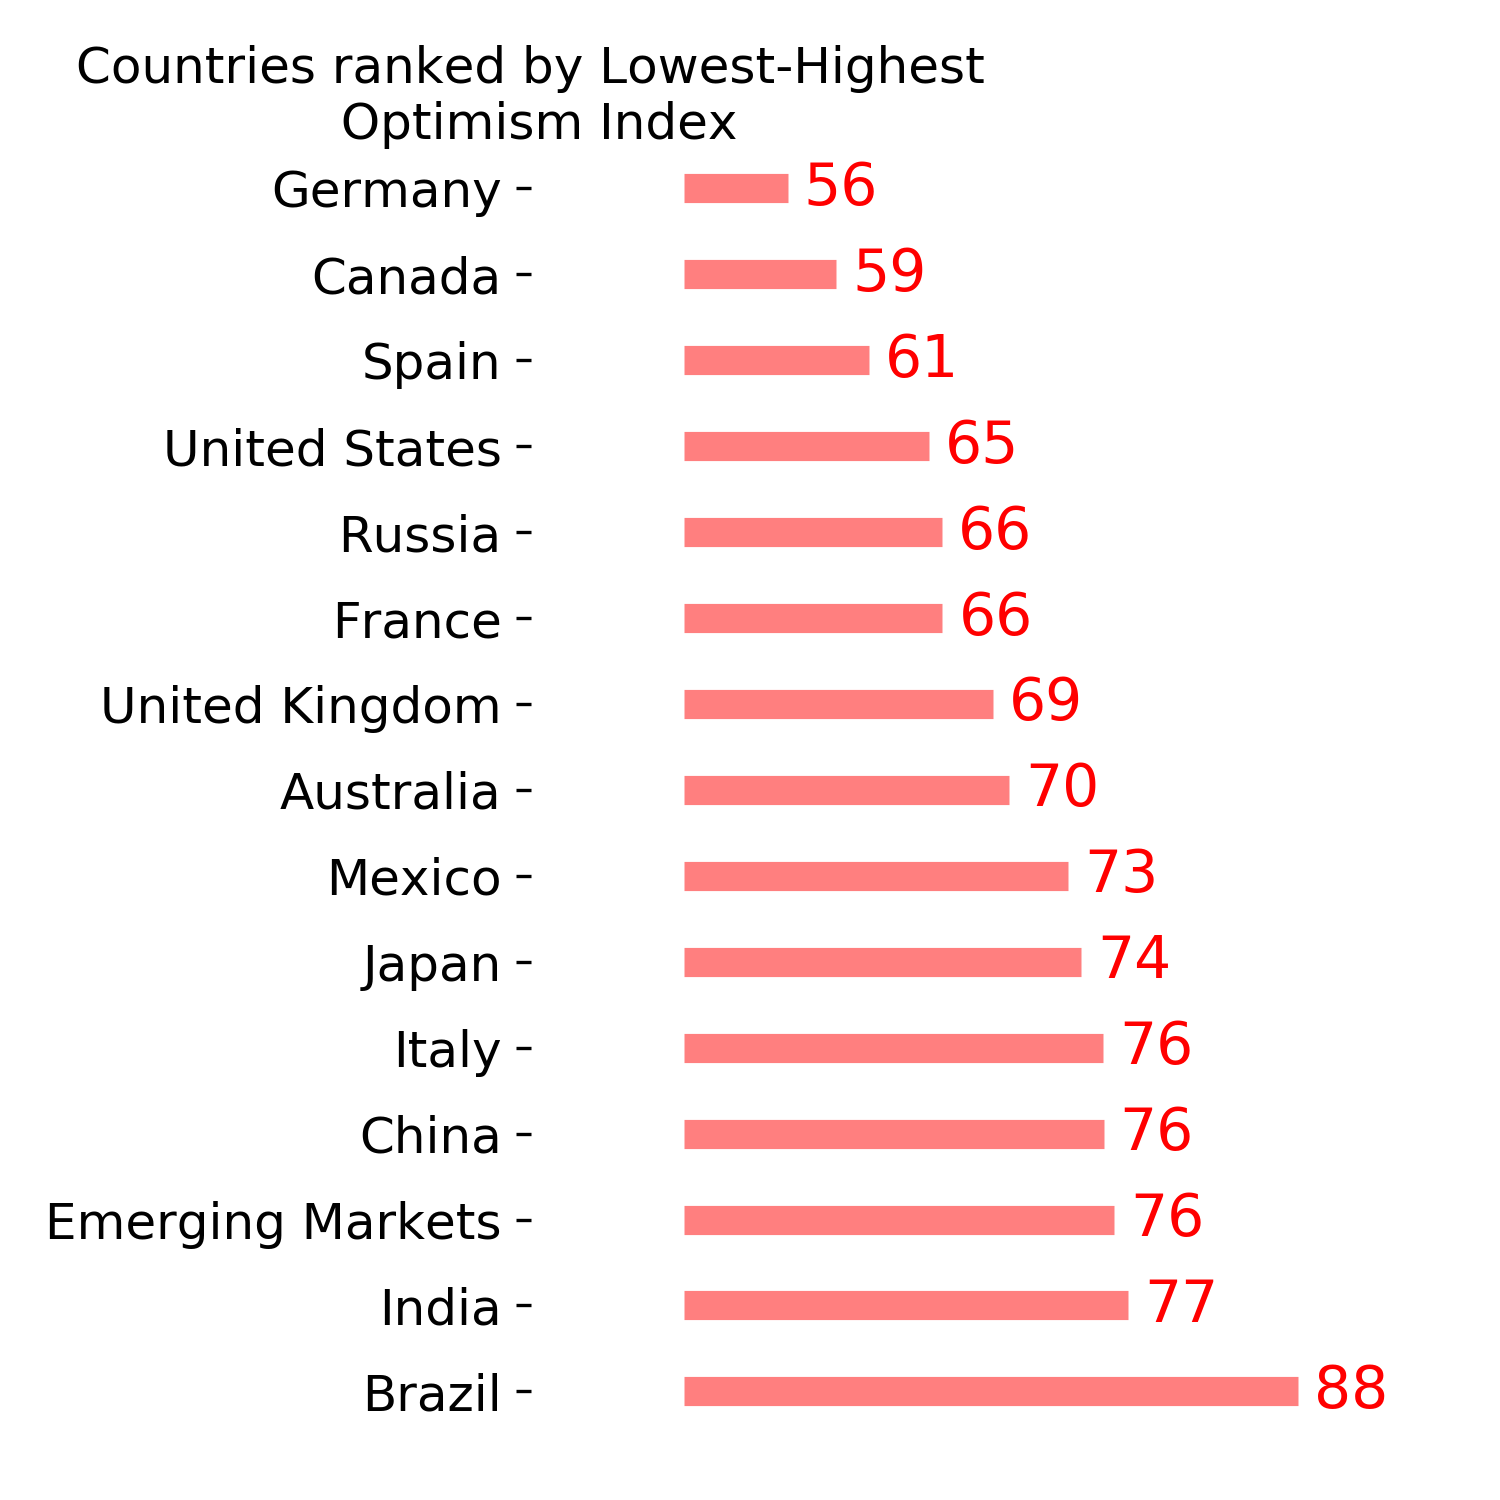
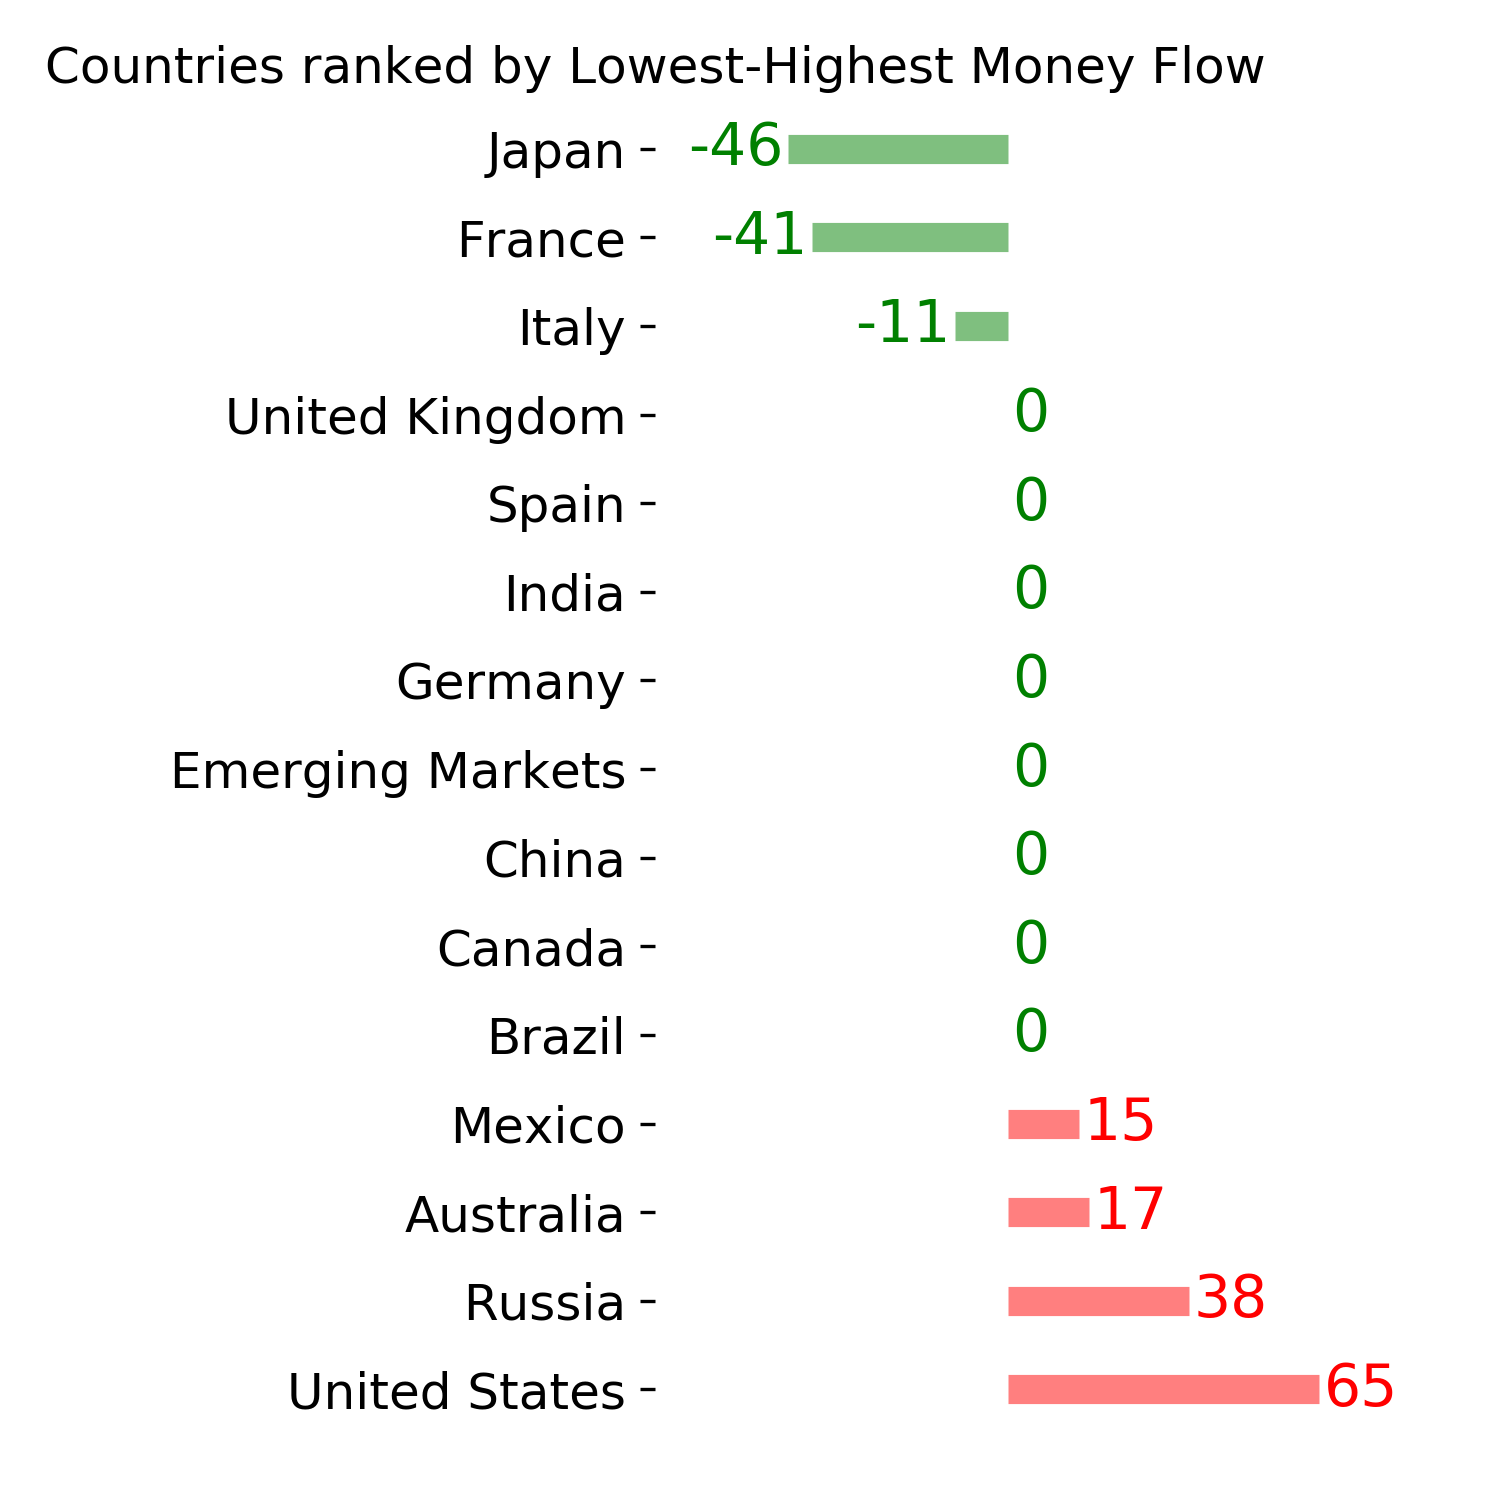
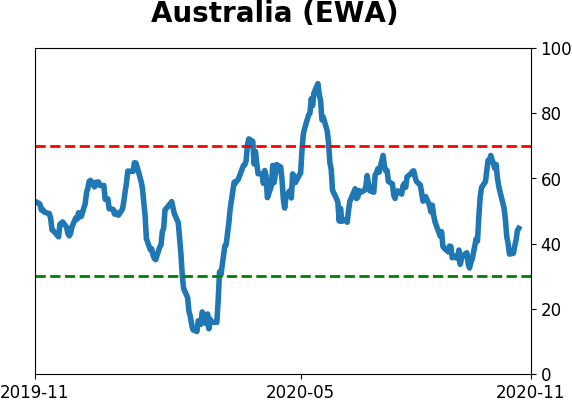
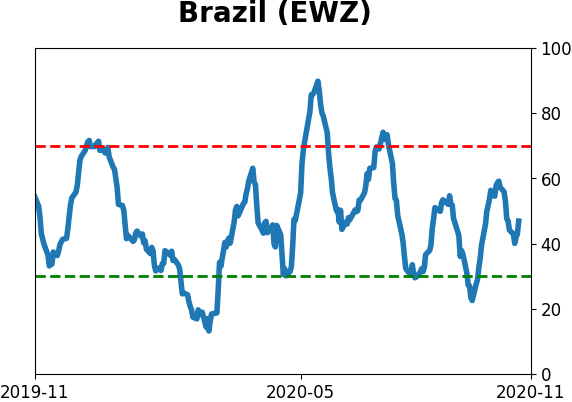
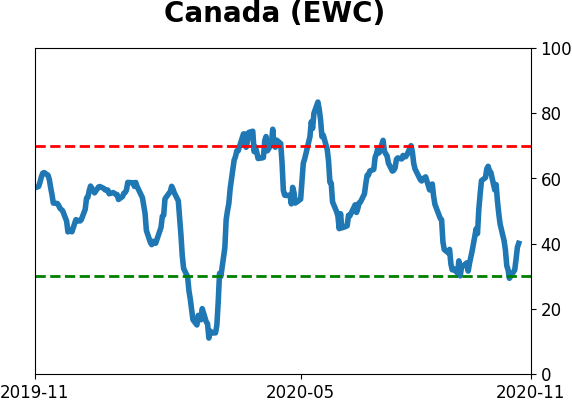
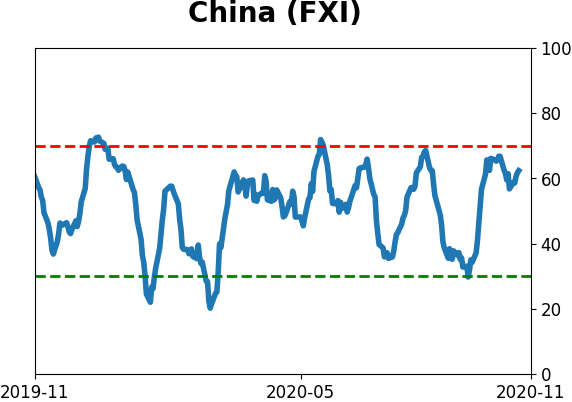
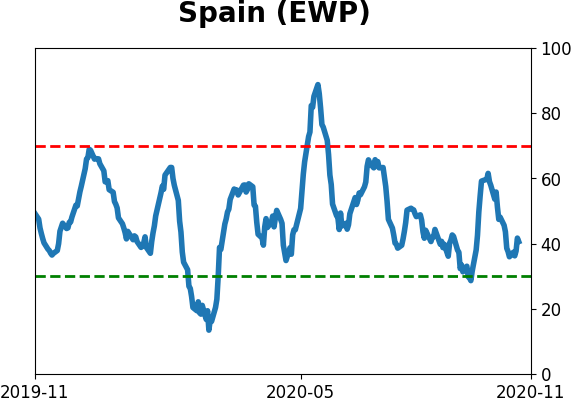
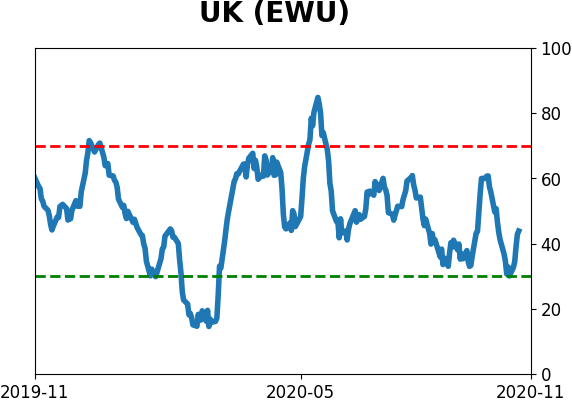
Country ETF's - 10-Day Moving Average
|
|
|
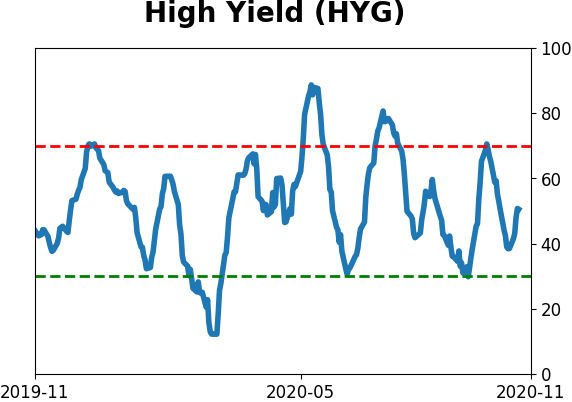
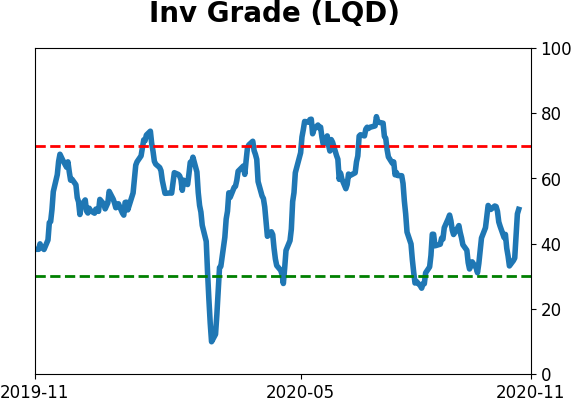
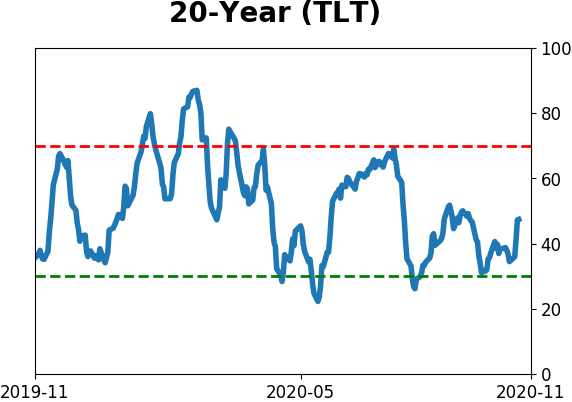
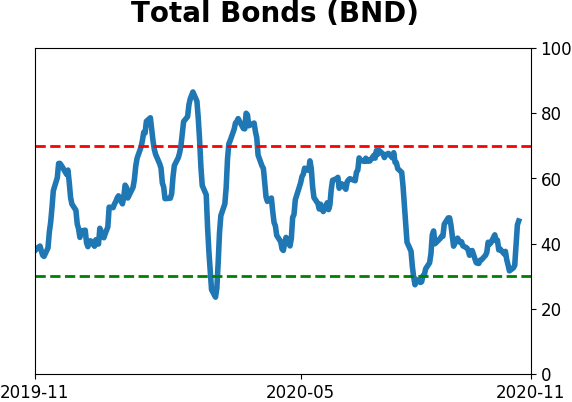
Bond ETF's - 10-Day Moving Average
|
|
|
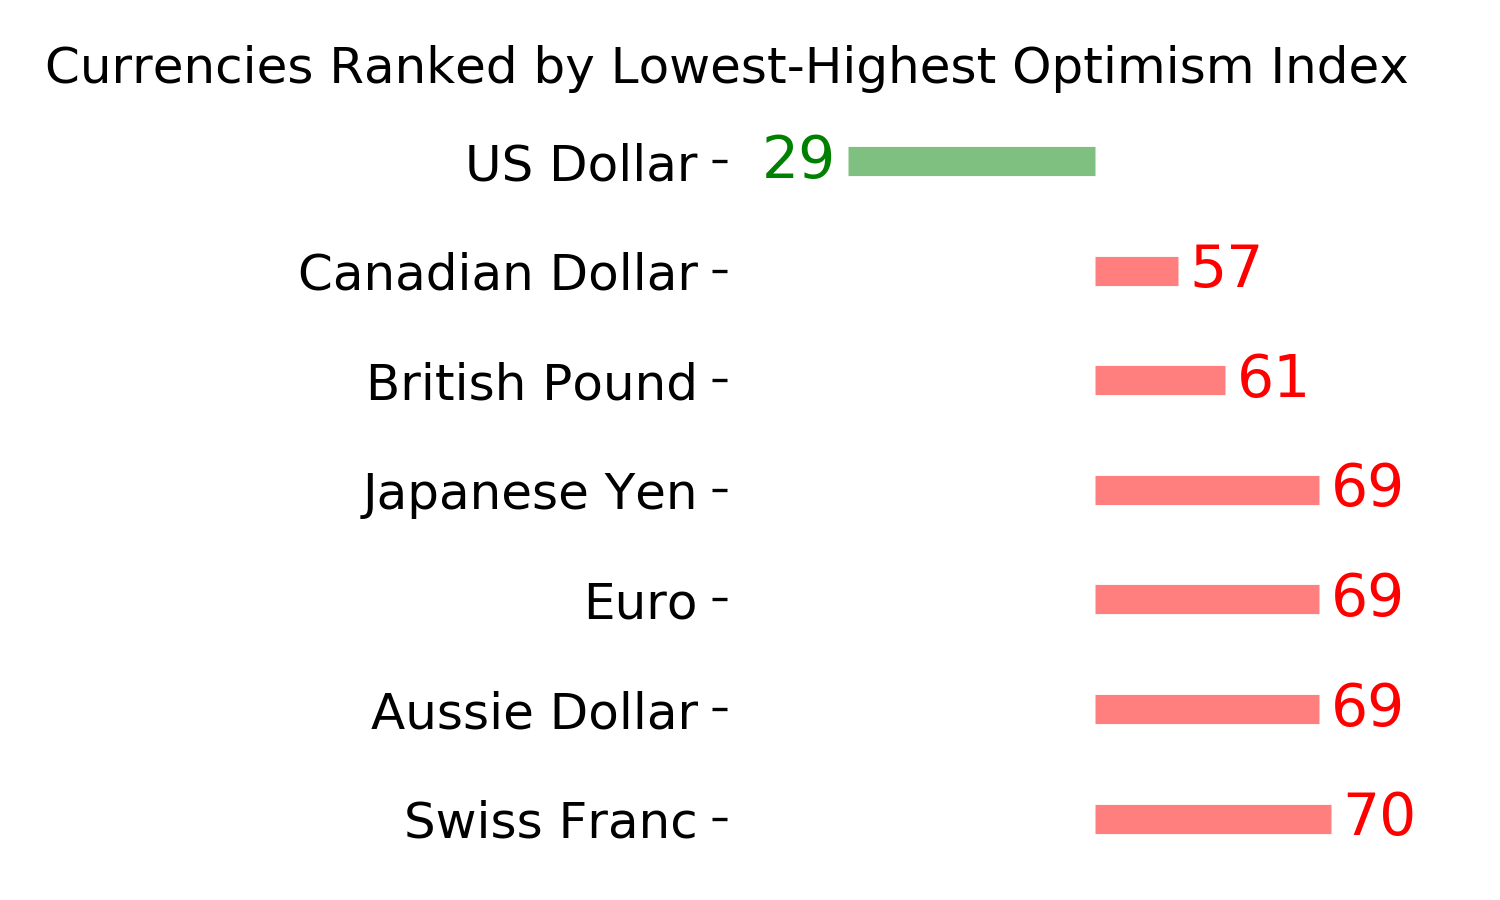
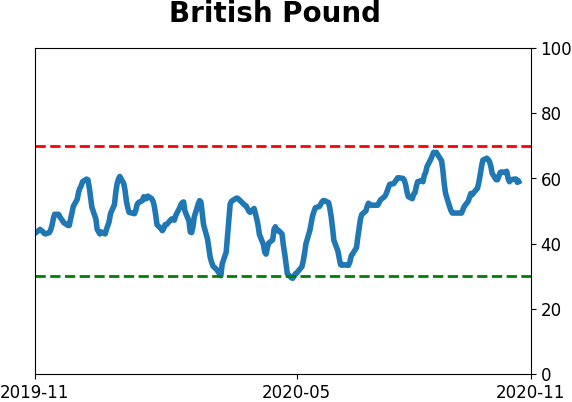
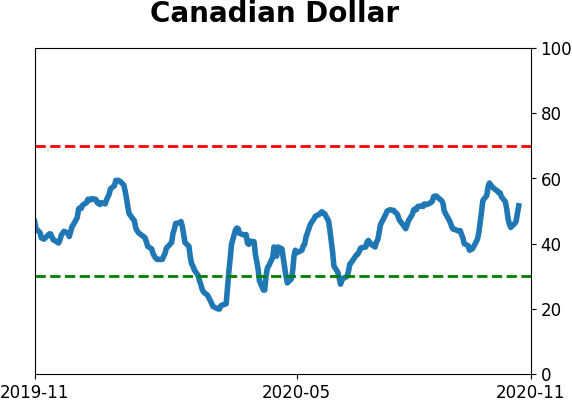
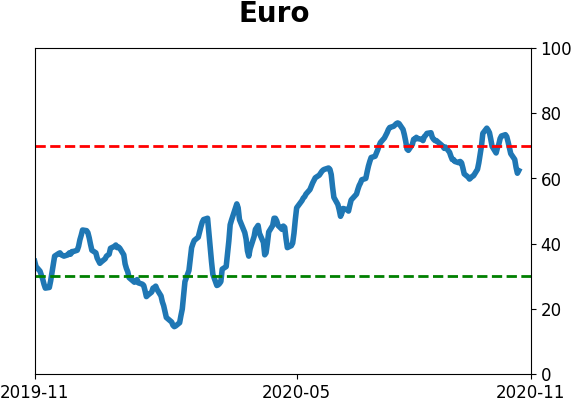
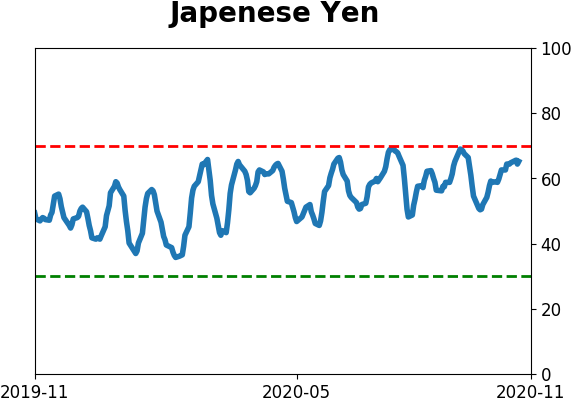
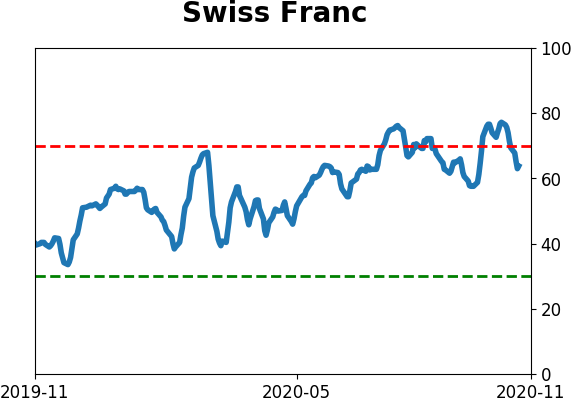
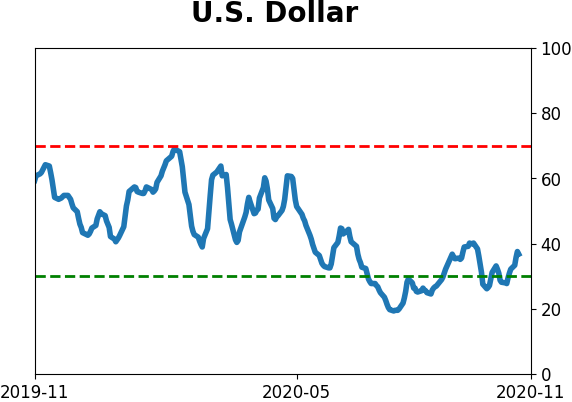
Currency ETF's - 5-Day Moving Average
|
|
|
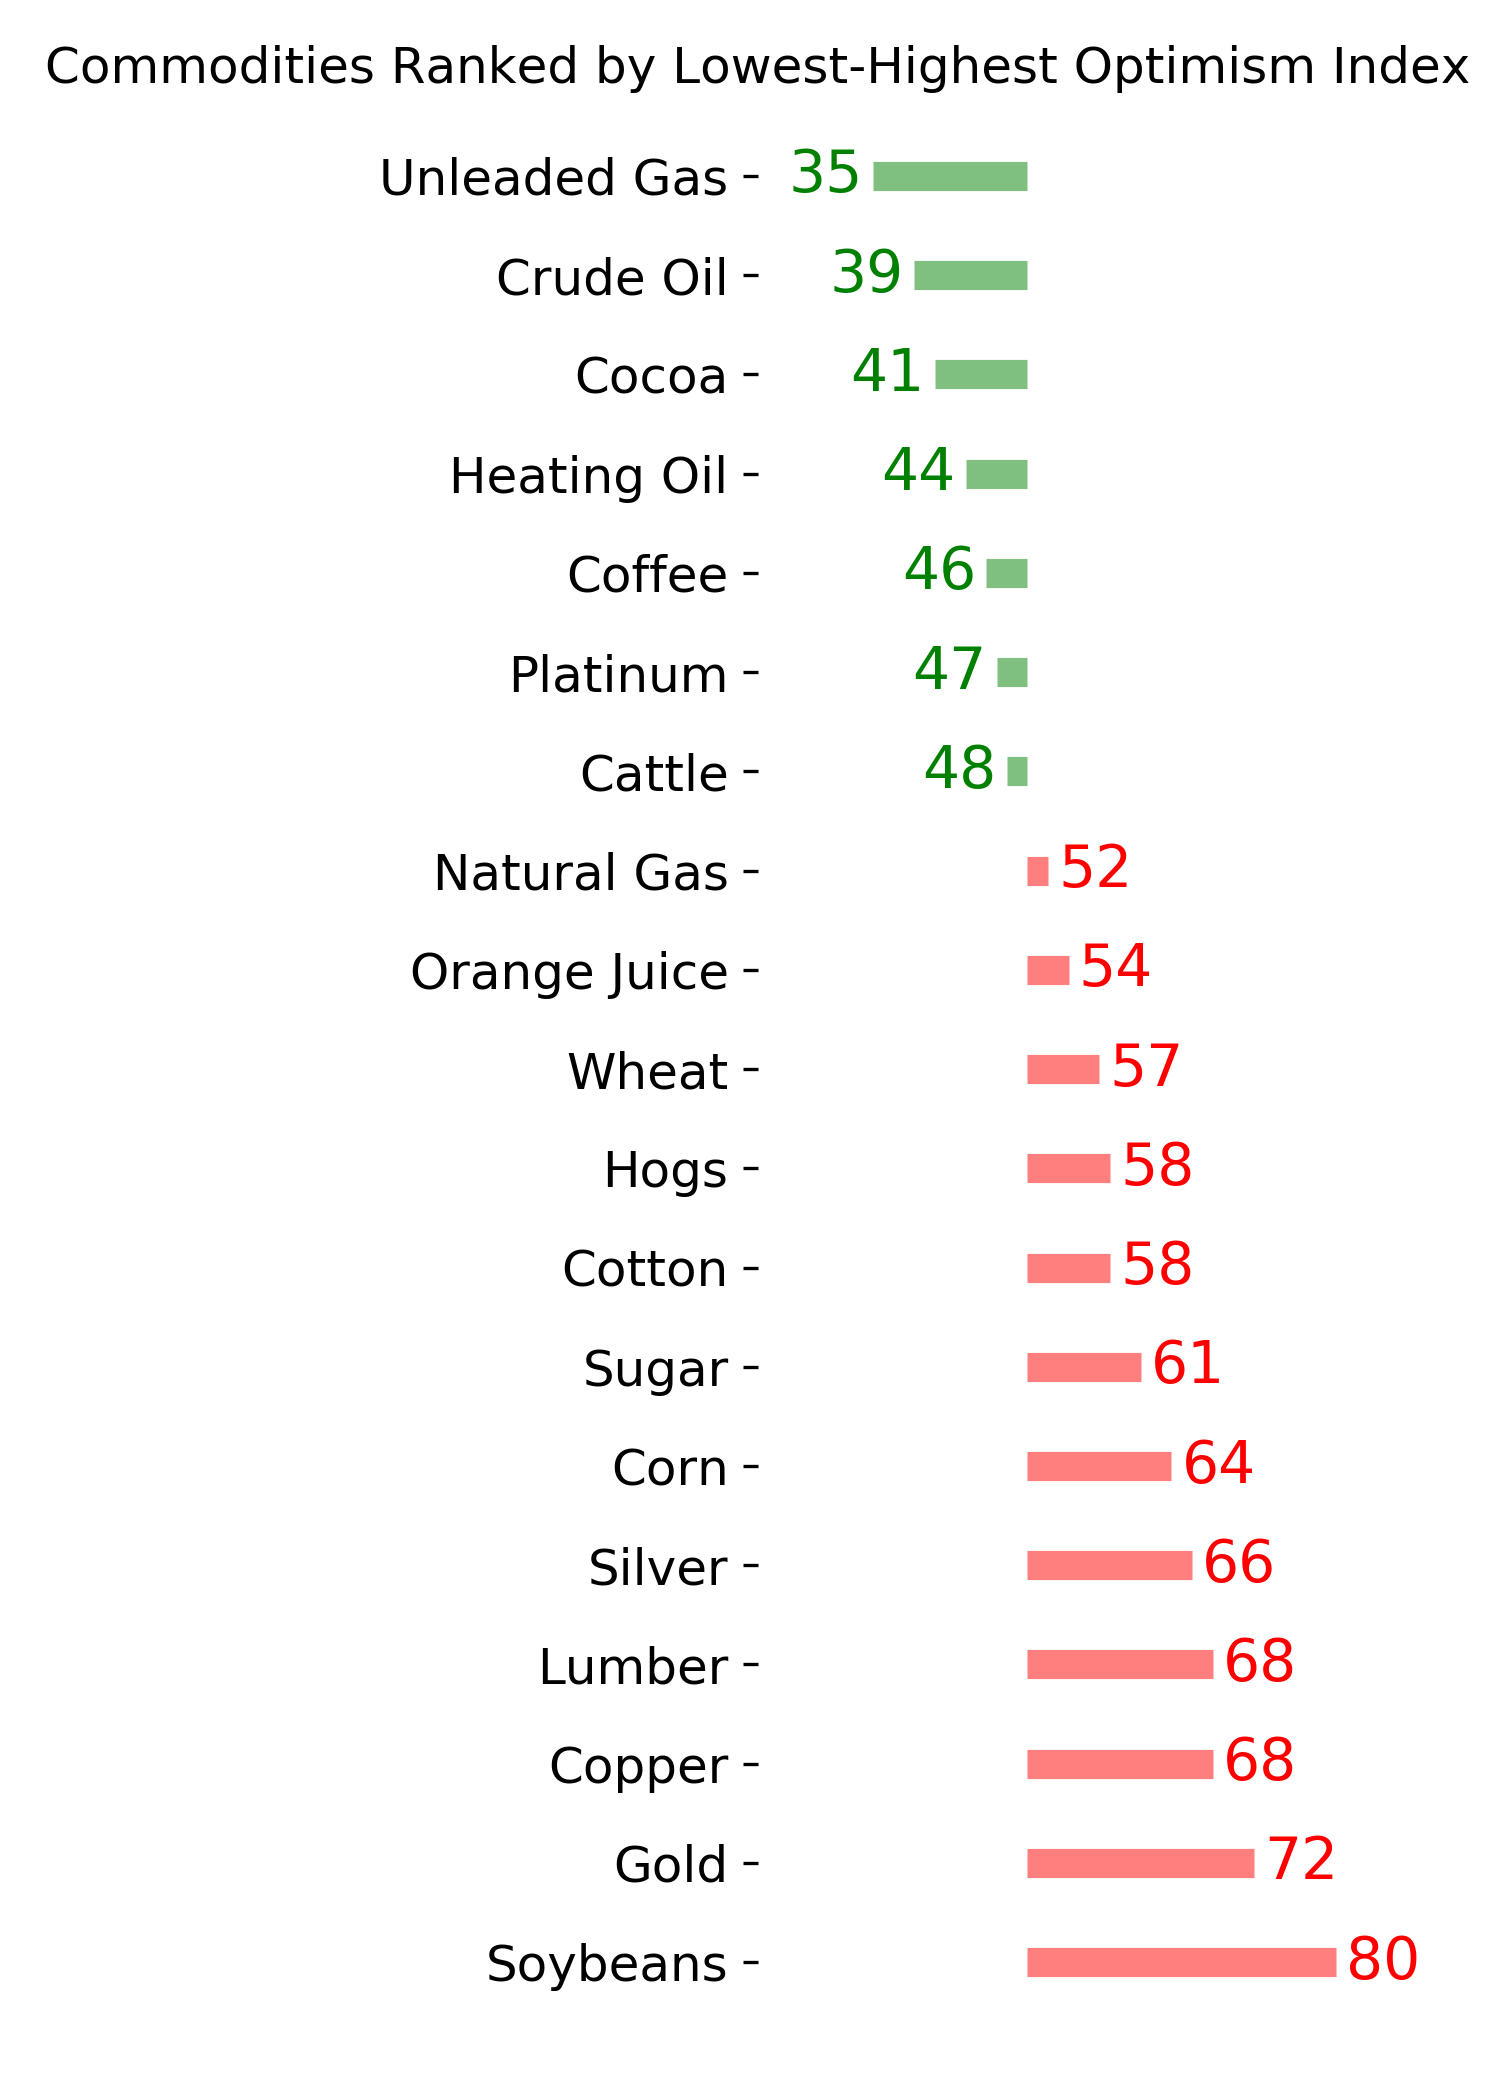
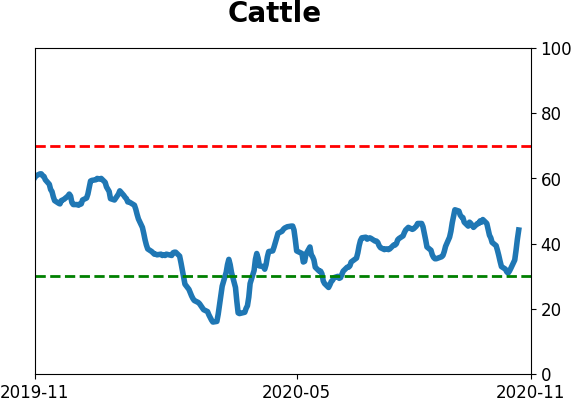
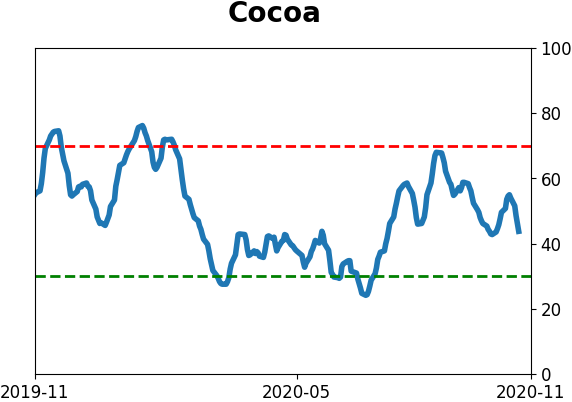
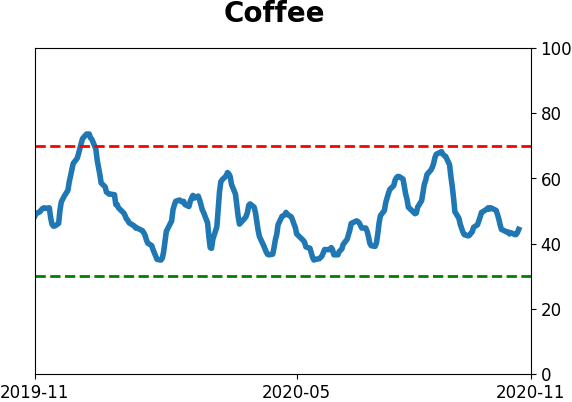
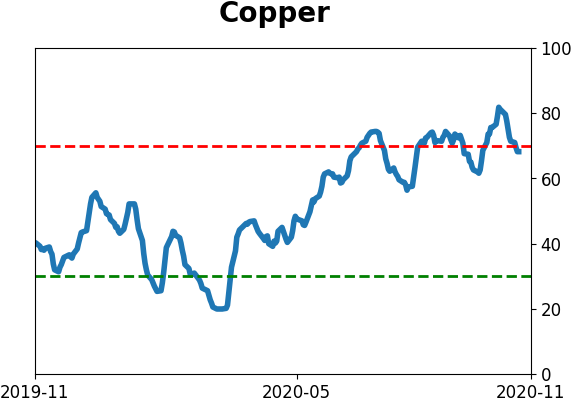
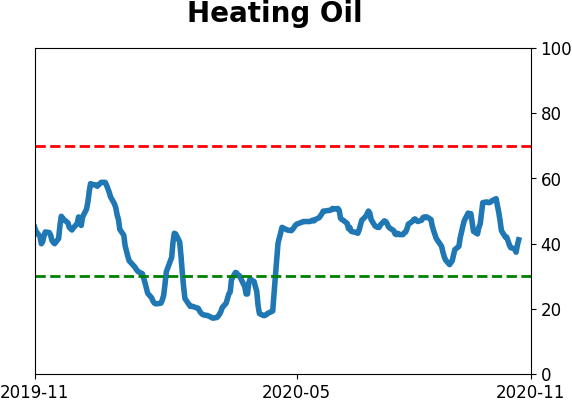
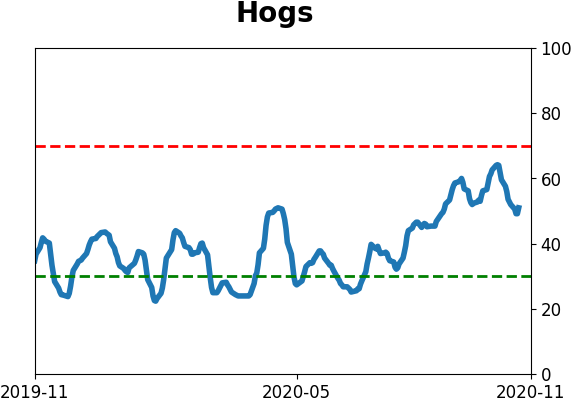
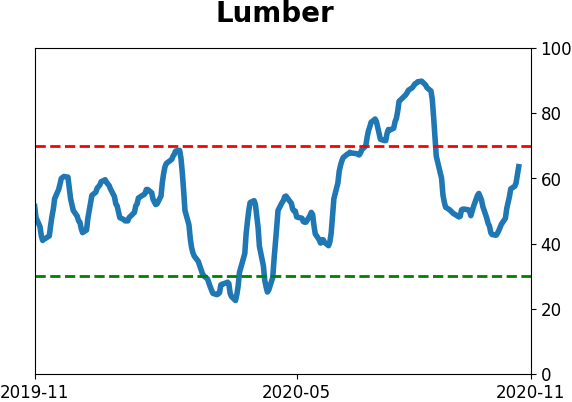
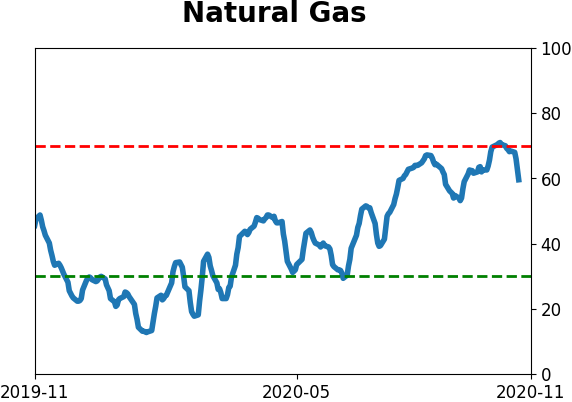
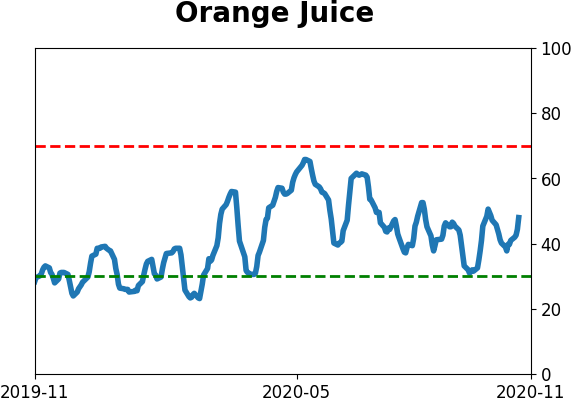
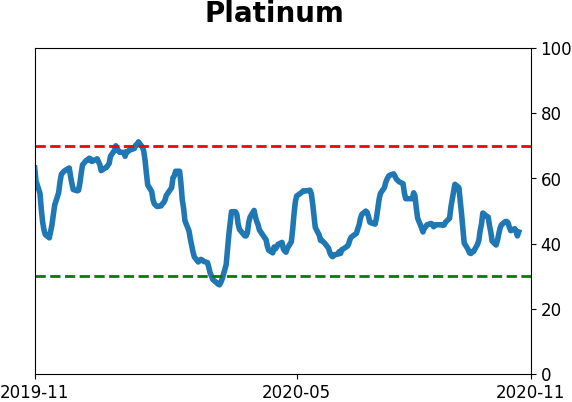
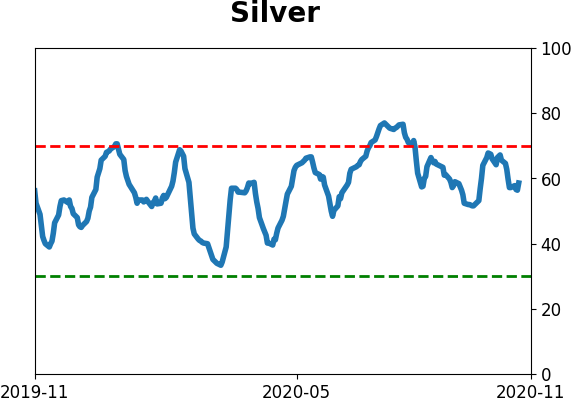
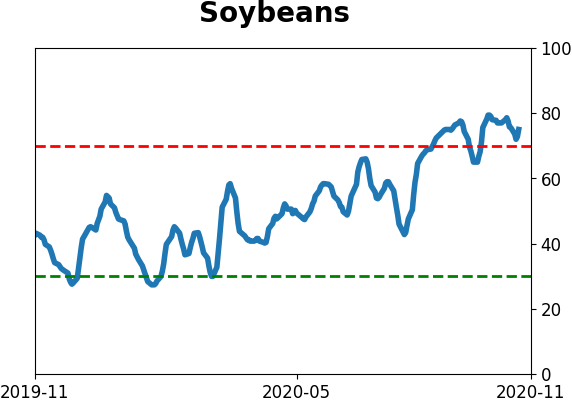
Commodity ETF's - 5-Day Moving Average
|
|