Headlines
|
|
The "day after" and its impressive record:
When investors react positively to a presidential election, it bodes well for the weeks and months ahead. When they don't, stocks have struggled.
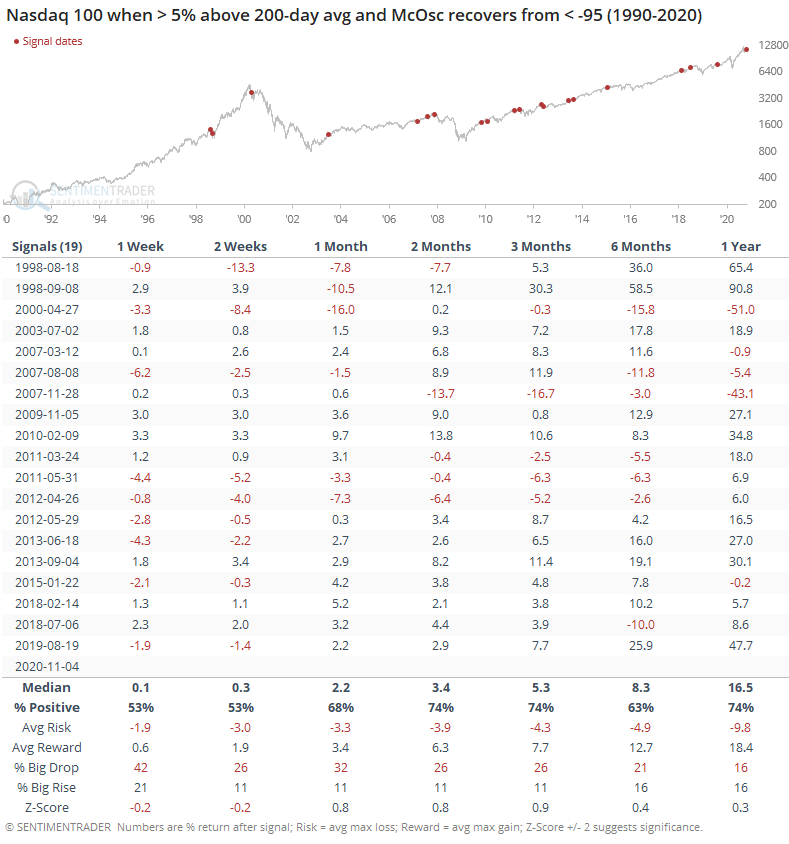
Tech stocks show returning internal momentum:
The McClellan Oscillators for the Nasdaq 100 and wider technology sector have turned positive after a couple of weeks being negative, and deeply so. This typically results in more medium-term strength, especially for the broader market.
Weird day: Thanks to relatively poor action in small-cap stocks, breadth on the NYSE was tepid on Wednesday. Since at least 1962, never before had the S&P 500 gained more than 2% on a day with more volume flowing into declining securities than advancing ones on the NYSE. The previous biggest gain was 1.5% in November 2007. The bigger the gain, the worse the forward results were (mostly). The few precedents of large gains on negative volume are not encouraging, but we're placing little weight on this given the knee-jerk reactions to a still-developing event.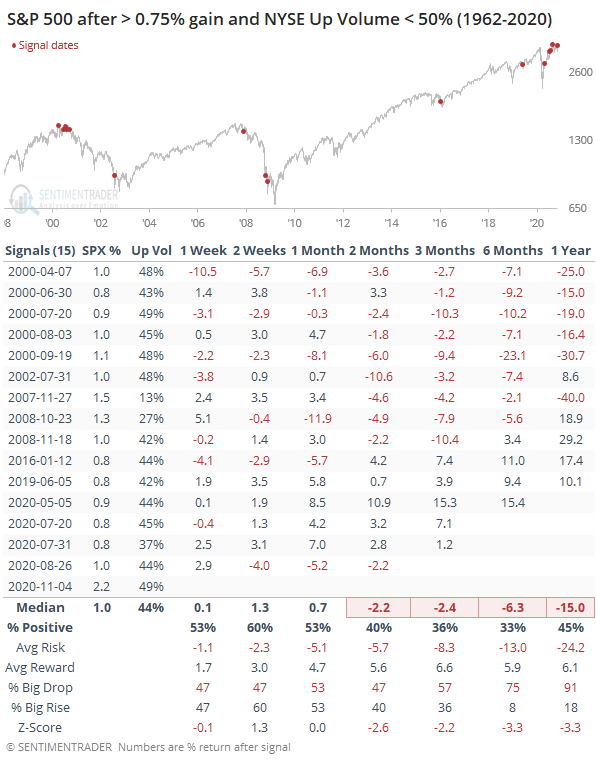
Bottom Line:
- A positive environment favors becoming aggressive on signs of excessive pessimism, of which there are few yet.
|
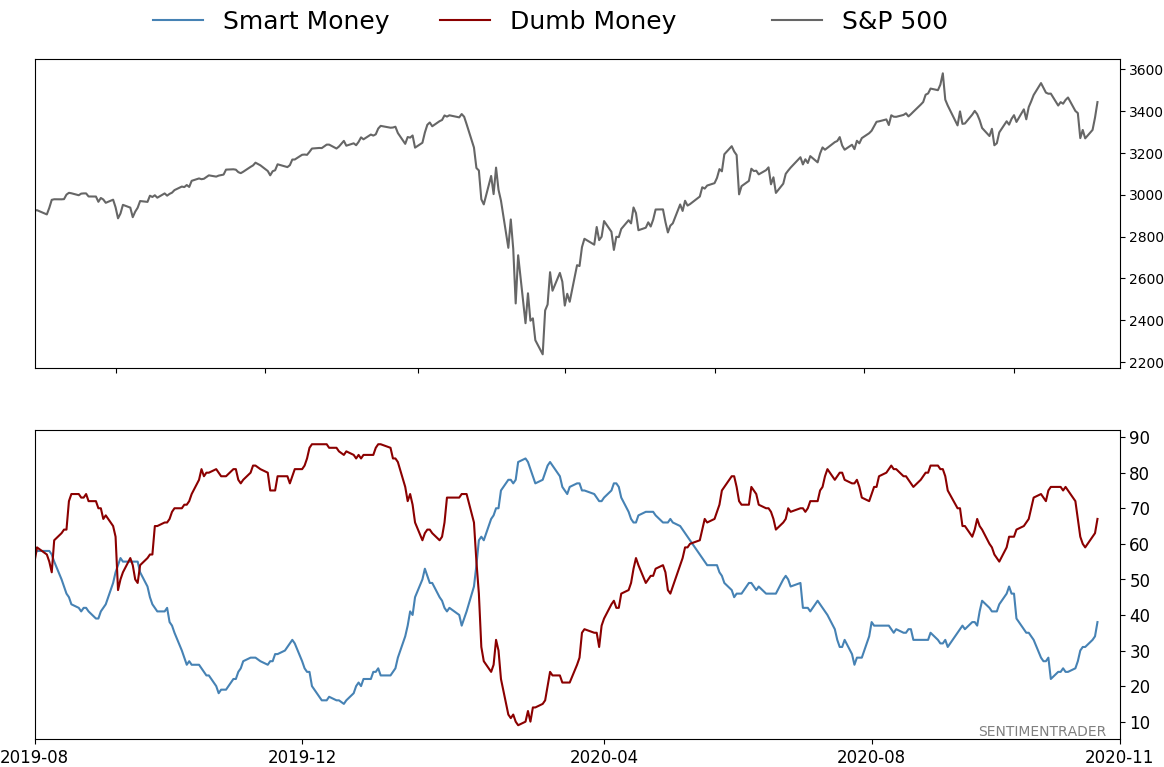
Smart / Dumb Money Confidence
|
Smart Money Confidence: 38%
Dumb Money Confidence: 67%
|
|
Risk Levels
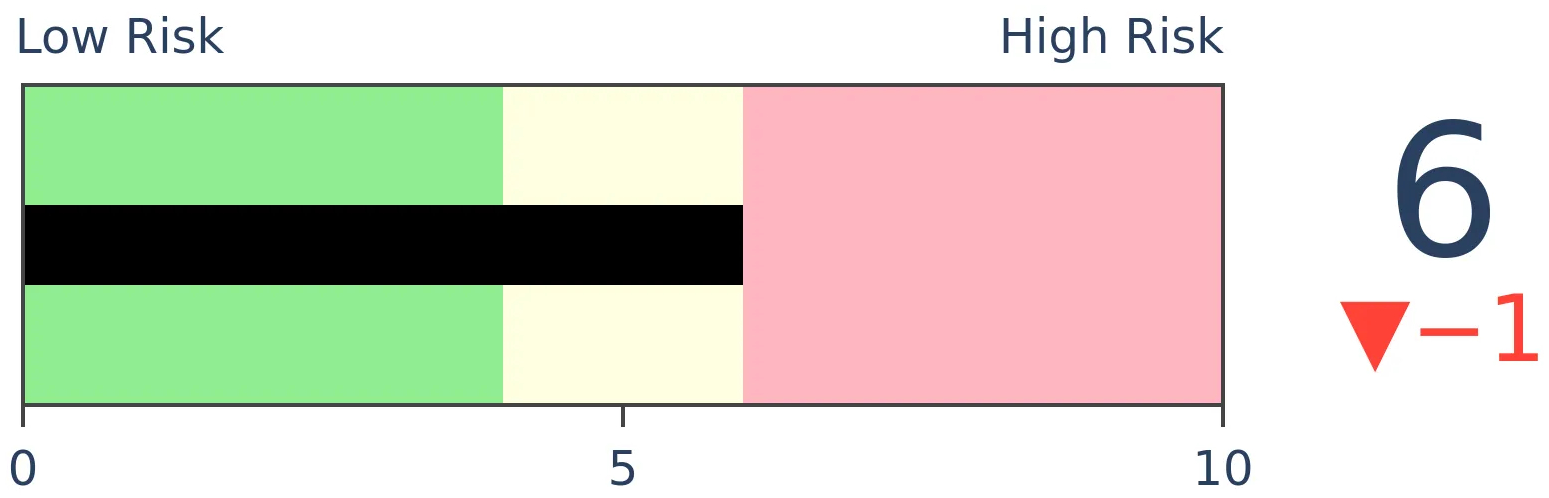
Stocks Short-Term
|
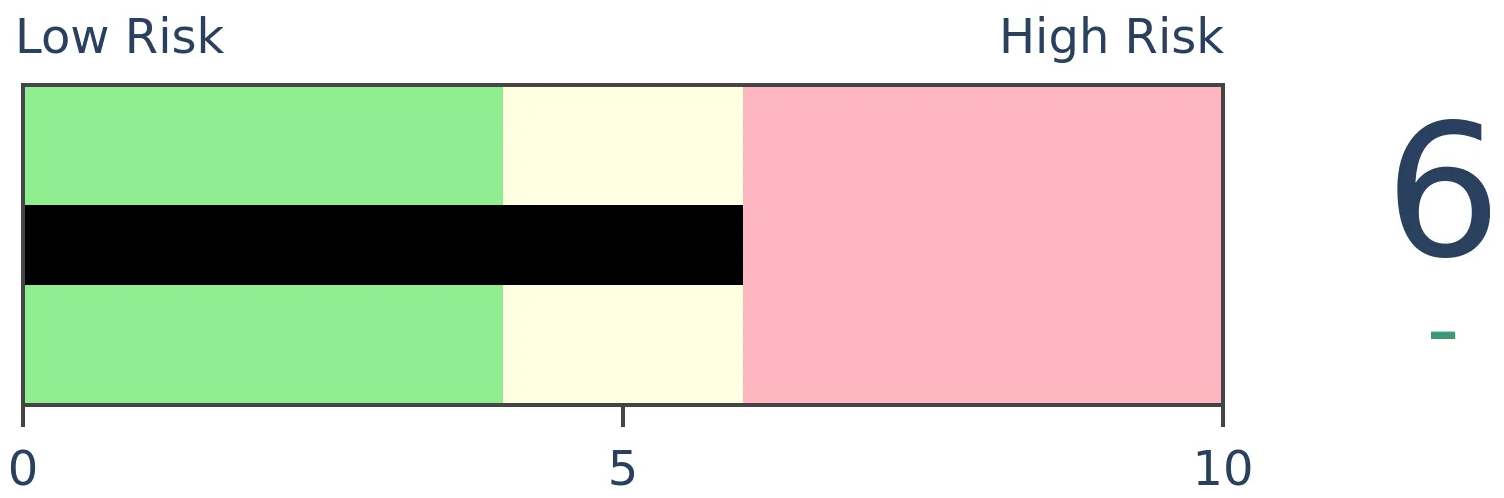
Stocks Medium-Term
|
|
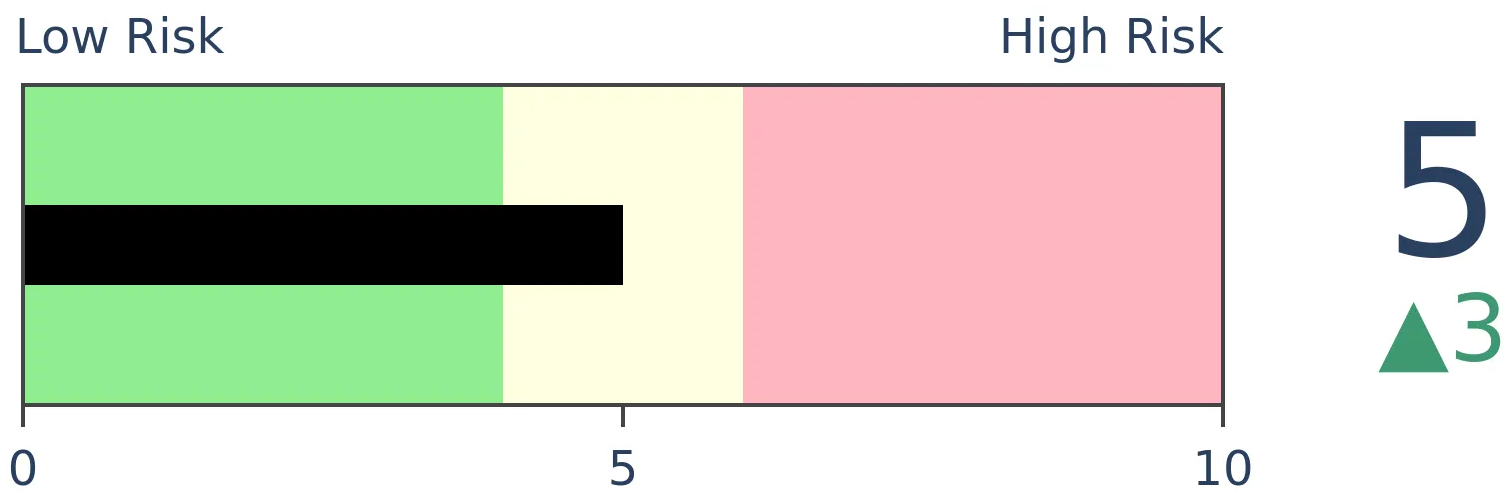
Bonds
|
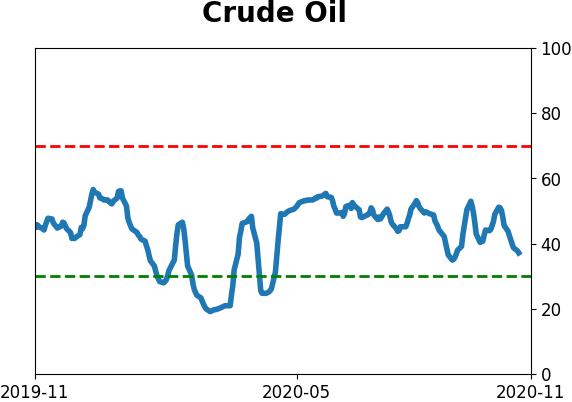
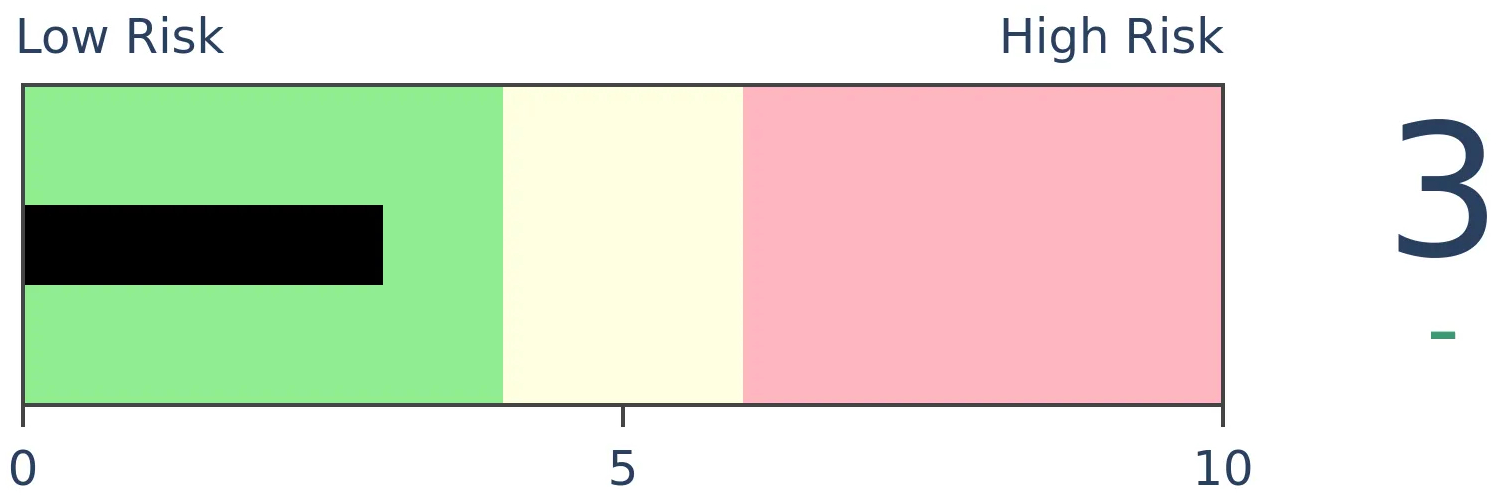
Crude Oil

|
|
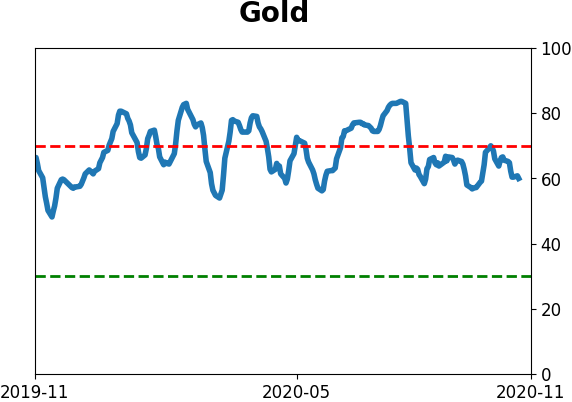
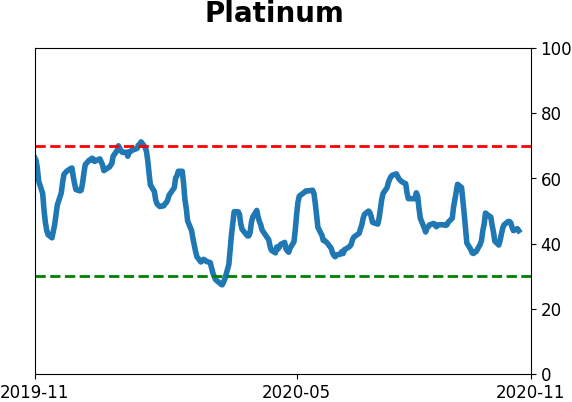
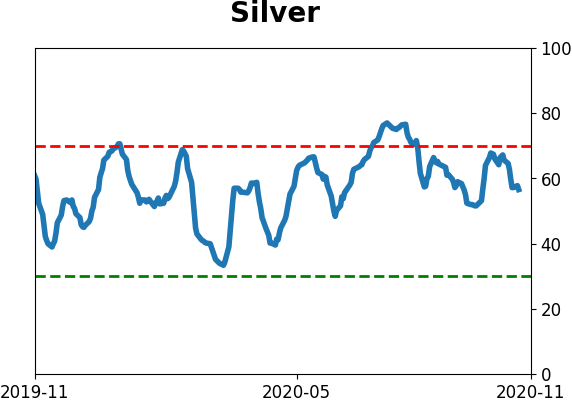
Gold
|
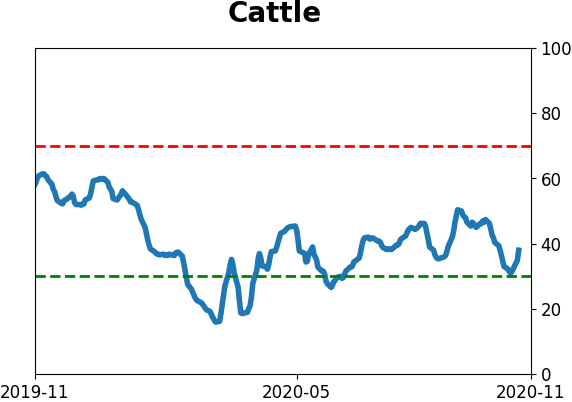
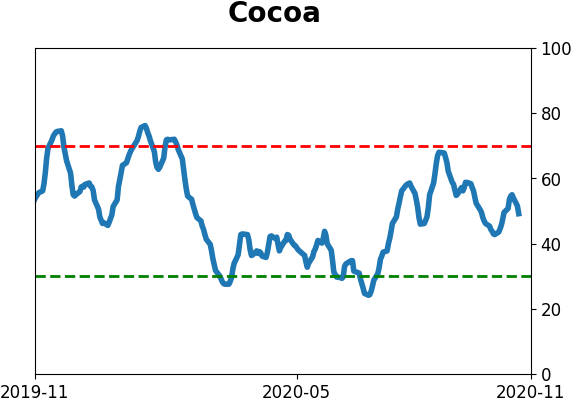
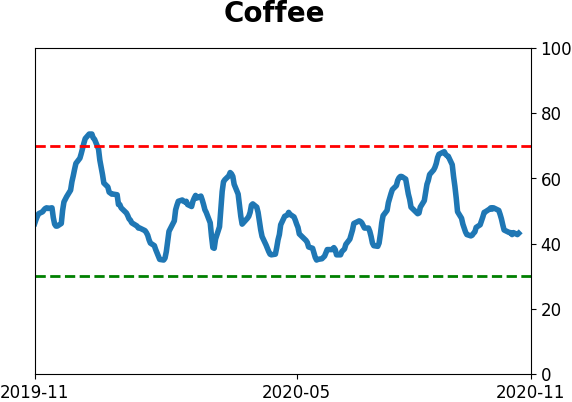
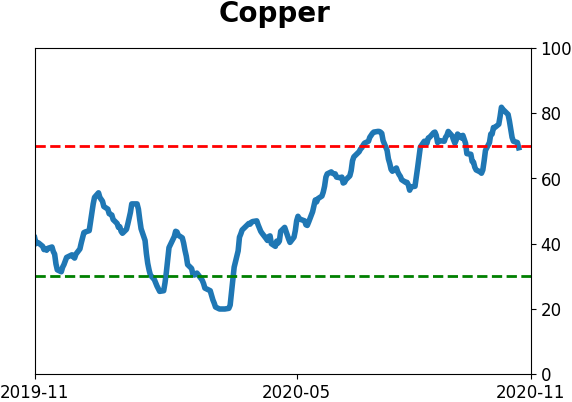
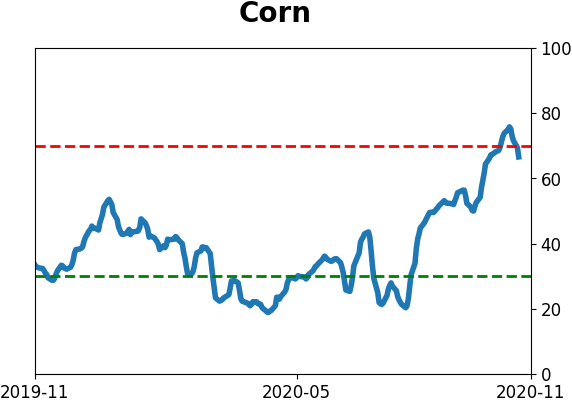
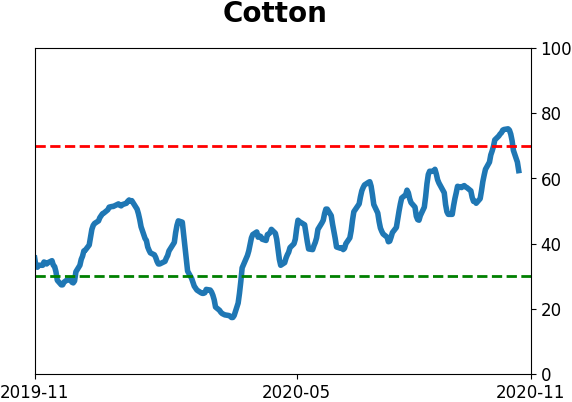
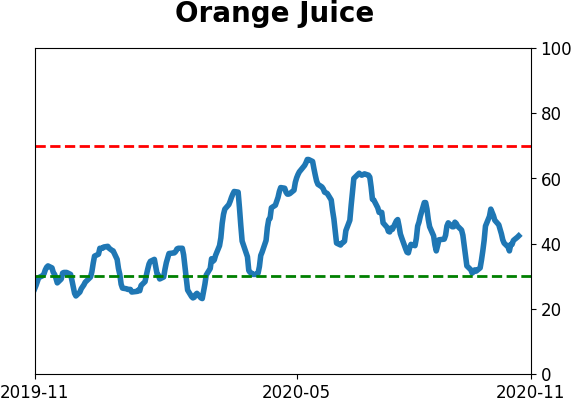
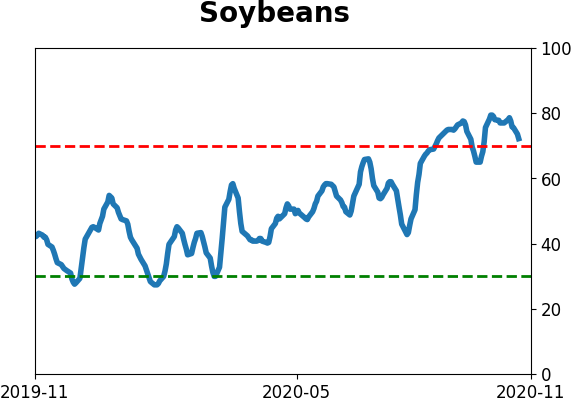
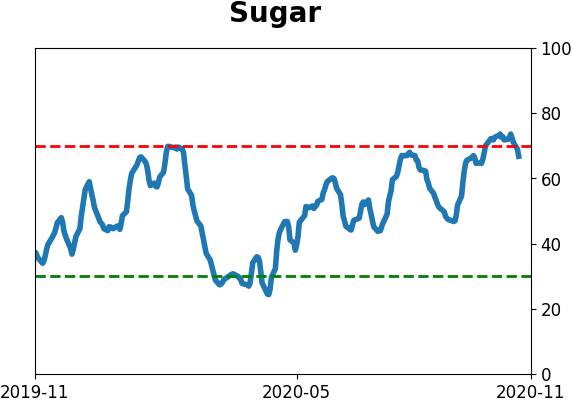
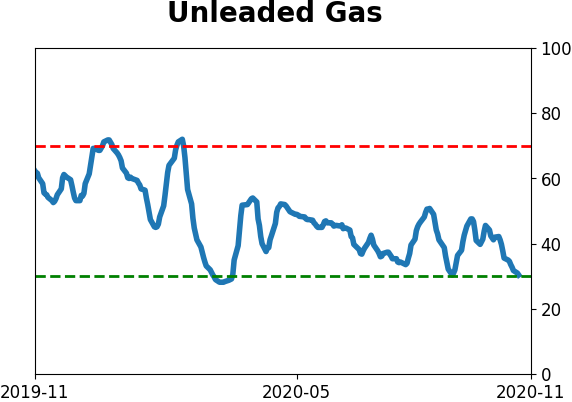
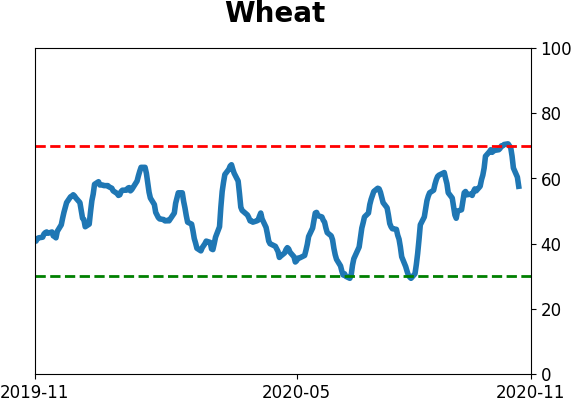
Agriculture
|
|
Research
BOTTOM LINE
When investors react positively to a presidential election, it bodes well for the weeks and months ahead. When they don't, stocks have struggled.
FORECAST / TIMEFRAME
SPY -- Up, Medium-Term
|
One day doesn't make a trend. Usually.
That's a pretty sound principle, as we often one-day reactions reversed going forward, especially surrounding major events. Turns out that hasn't been the case so much with presidential elections.
Below, we can see every time the S&P 500 rallied in relief the day after an election.
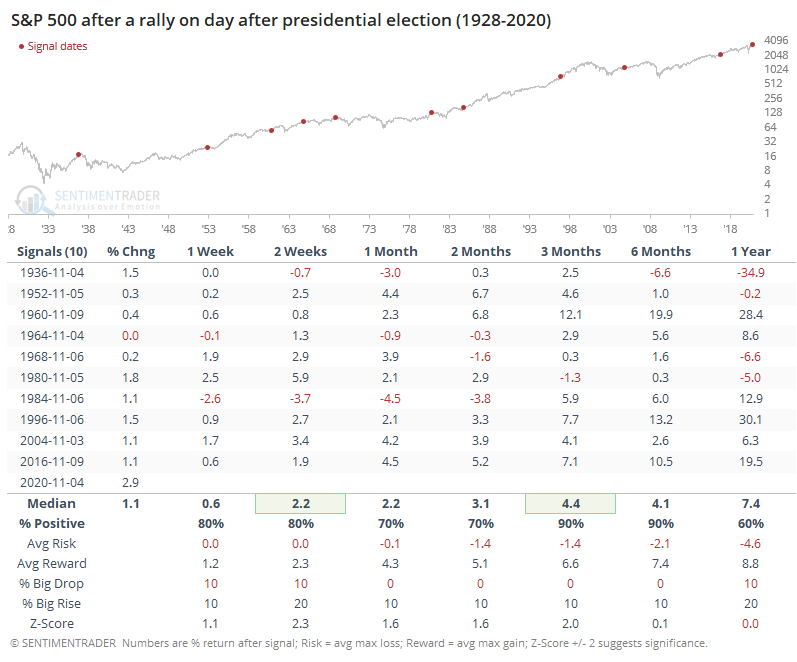
The returns in the table are as of the day after, so it indicates further gains, not including the gain on the day after. It was impressively consistent, with only a single loss 3 months later, and a positively skewed risk/reward ratio. As of the time this was published, the S&P was up by about 3%, the best gain in its history. The magnitude seemed to matter less than the direction.
Now consider those years when investors were less enthused about their new leader.
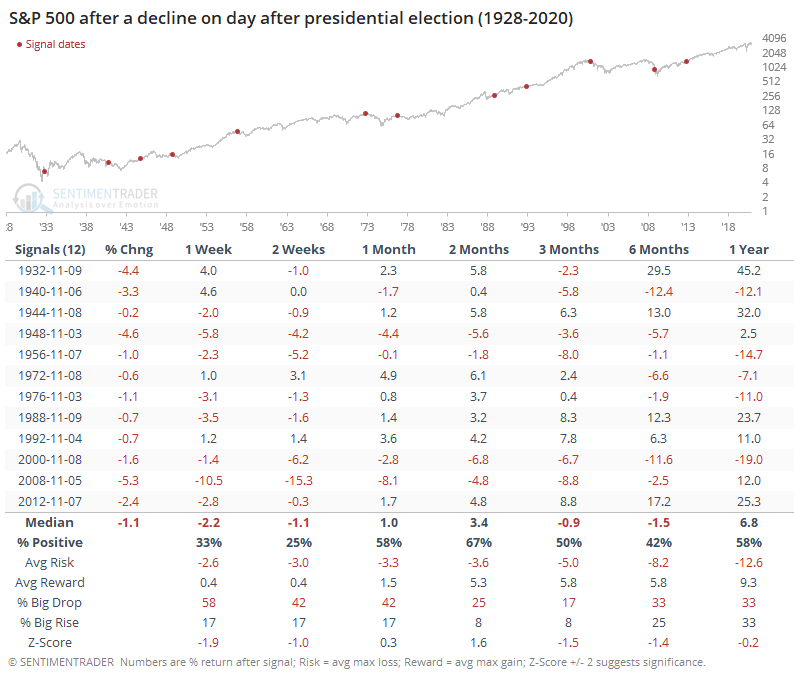
After these signals, the S&P had a hard time reversing to the upside over the next 1-2 weeks. Even 3-6 months later, it was consistently negative and with a very poor risk/reward ratio. The only post-election letdown that reversed itself completely going forward, with no losses on any time frame, was after Bill Clinton's first win.
Overall, there was a strong positive correlation between the S&P's day-after return and its additional gain or loss over the next 3 months.
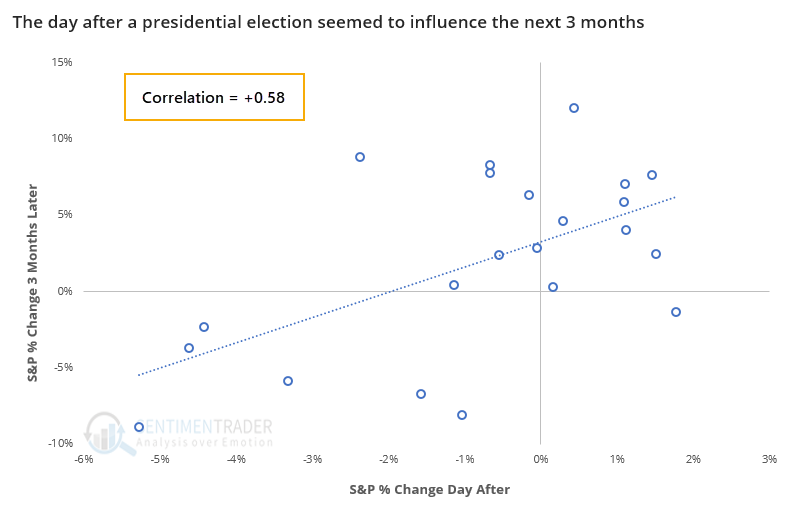
When investors had been anticipating a good result on election day, they were often disappointed. But a good initial reaction following the election has been a very good sign. We don't often see such good returns both the day of and day after an election - this is the first time in history the S&P 500 rallied more than 1.5% on both days.
It's always questionable to extrapolate very short-term movements to longer-term returns. With that warning, these results should give a little comfort to bulls.
BOTTOM LINE
The McClellan Oscillators for the Nasdaq 100 and wider technology sector have turned positive after a couple of weeks being negative, and deeply so. This typically results in more medium-term strength, especially for the broader market.
FORECAST / TIMEFRAME
None
|
Thanks to at least a temporary pre- and post-election sigh of relief among technology investors, underlying momentum in many of those names has turned positive.
The McClellan Oscillator for the broader tech sector will move into positive territory on Wednesday after a couple of weeks below zero (barring a historic intraday reversal after this is published), and with a severely oversold reading during that span.
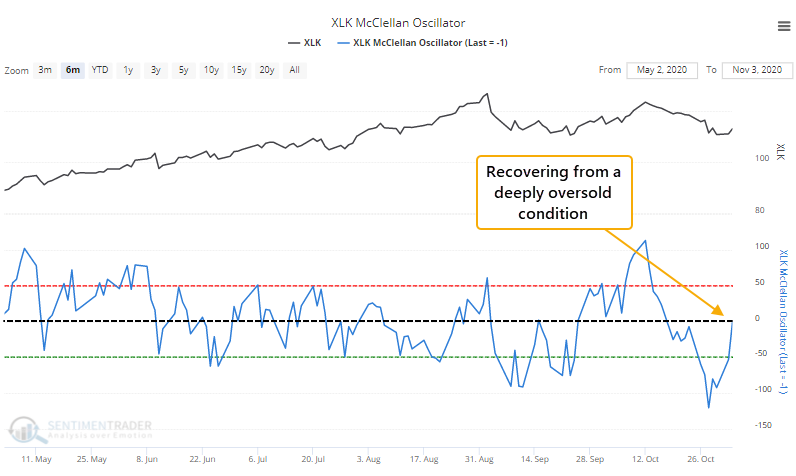
The Oscillator is telling us that the average stock in that sector is not only rising, but doing so at an increasing pace. And that's within the context of the S&P 500 Information Technology sector still being more than 5% above its 200-day moving average. It's showing recovering momentum during an already-momentum-driven market.
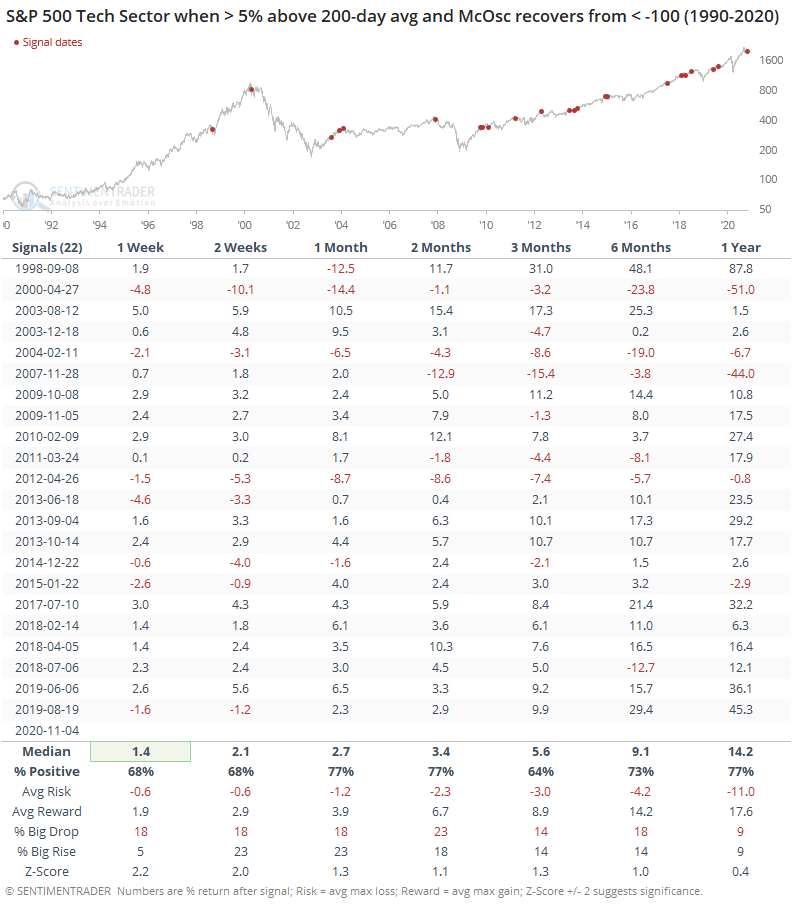
This was a mostly good sign for the sector, especially over the next 1-2 months, which had the best combination of average returns, percentage of time positive, and risk/reward ratio, especially in recent years. The probability of a big rise was about equal to that of a big drop, but both were small.
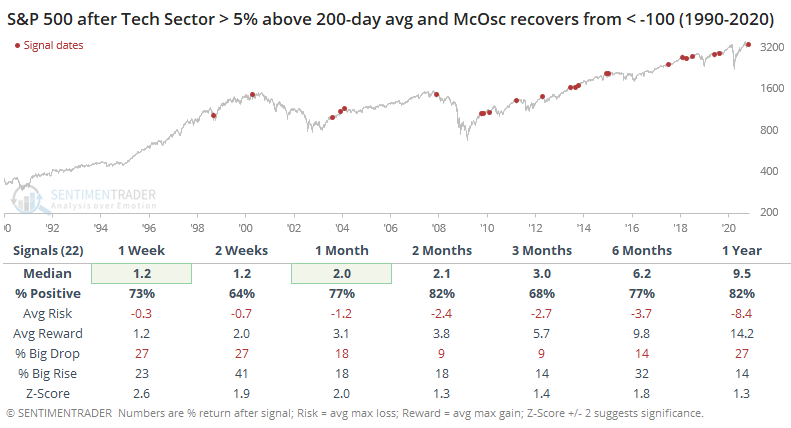
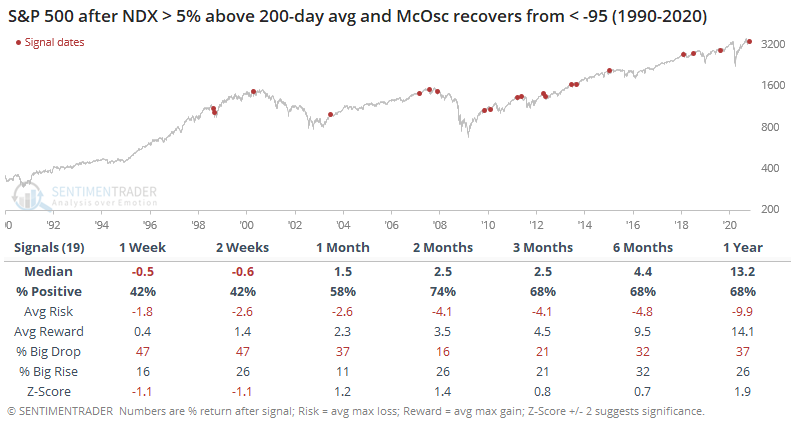
For the broader S&P, it was an even better sign, with only 4 losses out of 22 signals after 2 months.
We're seeing the same thing happening among the biggest tech stocks, as the McClellan Oscillator for the Nasdaq 100 is also recovering from a deeply oversold condition.
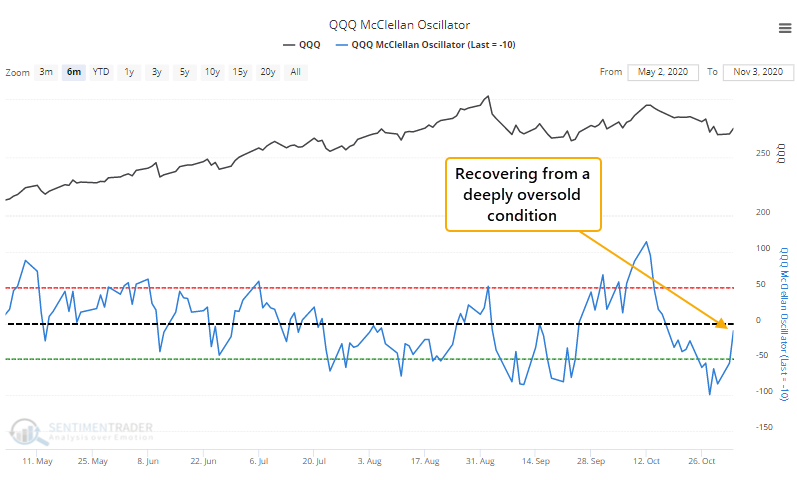
This was less of a positive for the biggest stocks, especially shorter-term. Still, over the next 2-3 months, they typically rose. It wasn't a very strong signal, mostly due to some losses from 2008 - 2012.
It was less of a positive for the S&P 500 in the short-term.
Markets have a nasty habit of showing a fake-out first move following major and widely anticipated events. That makes it hard to trust the knee-jerk reaction to Tuesday's elections. While momentum in many tech stocks has turned positive, it hasn't been a very reliable signal in the shorter-term, and the fact that it's triggering around a major news event probably makes it even less so. It should still be at least a minor medium-term positive.
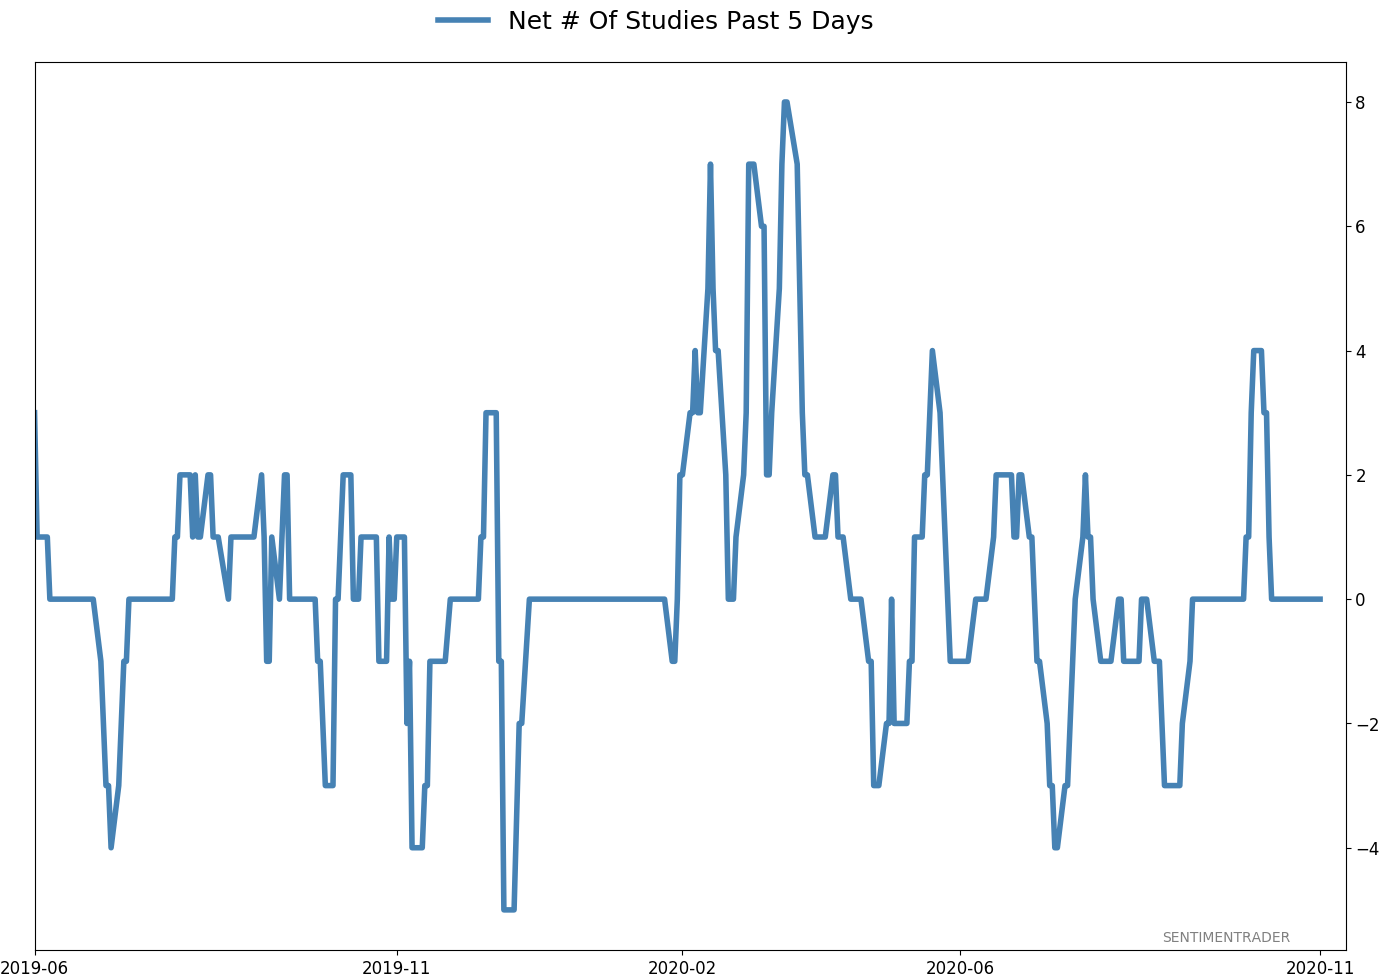
Active Studies
| Time Frame | Bullish | Bearish | | Short-Term | 0 | 0 | | Medium-Term | 5 | 8 | | Long-Term | 48 | 2 |
|
Indicators at Extremes
Portfolio
| Position | Description | Weight % | Added / Reduced | Date | | Stocks | 15.6% RSP, 10.1% VWO, 7.5% XLE, 5.1% PSCE | 38.2 | Added 5% | 2020-10-15 | | Bonds | 10% BND, 10% SCHP, 10% ANGL | 29.7 | Reduced 0.1% | 2020-10-02 | | Commodities | GCC | 2.4 | Reduced 2.1%
| 2020-09-04 | | Precious Metals | GDX | 4.7 | Added 5% | 2020-09-09 | | Special Situations | | 0.0 | Reduced 5% | 2020-10-02 | | Cash | | 25.0 | | |
|
Updates (Changes made today are underlined)
After the September swoon wrung some of the worst of the speculation out of stocks, there are some signs that it's returning, especially in the options market. It's helped to push Dumb Money Confidence above 70%. A big difference between now and August is that in August, there was a multitude of days with exceptionally odd breadth readings. Some of the biggest stocks were masking underlying weakness. Combined with heavy speculative activity, it was a dangerous setup. Now, we've seen very strong internal strength, in the broad market, as well as tech and small-cap stocks. Prior signals almost invariably led to higher prices. That's hard to square with the idea that forward returns tend to be subdued when Confidence is high, but that's less reliable during healthy market conditions, which we're seeing now (for the most part). I added some risk with small-cap energy stocks, due to an increasing number of positive signs in both small-caps and energy. This is intended as a long-term position.
RETURN YTD: -0.8% 2019: 12.6%, 2018: 0.6%, 2017: 3.8%, 2016: 17.1%, 2015: 9.2%, 2014: 14.5%, 2013: 2.2%, 2012: 10.8%, 2011: 16.5%, 2010: 15.3%, 2009: 23.9%, 2008: 16.2%, 2007: 7.8%
|
|
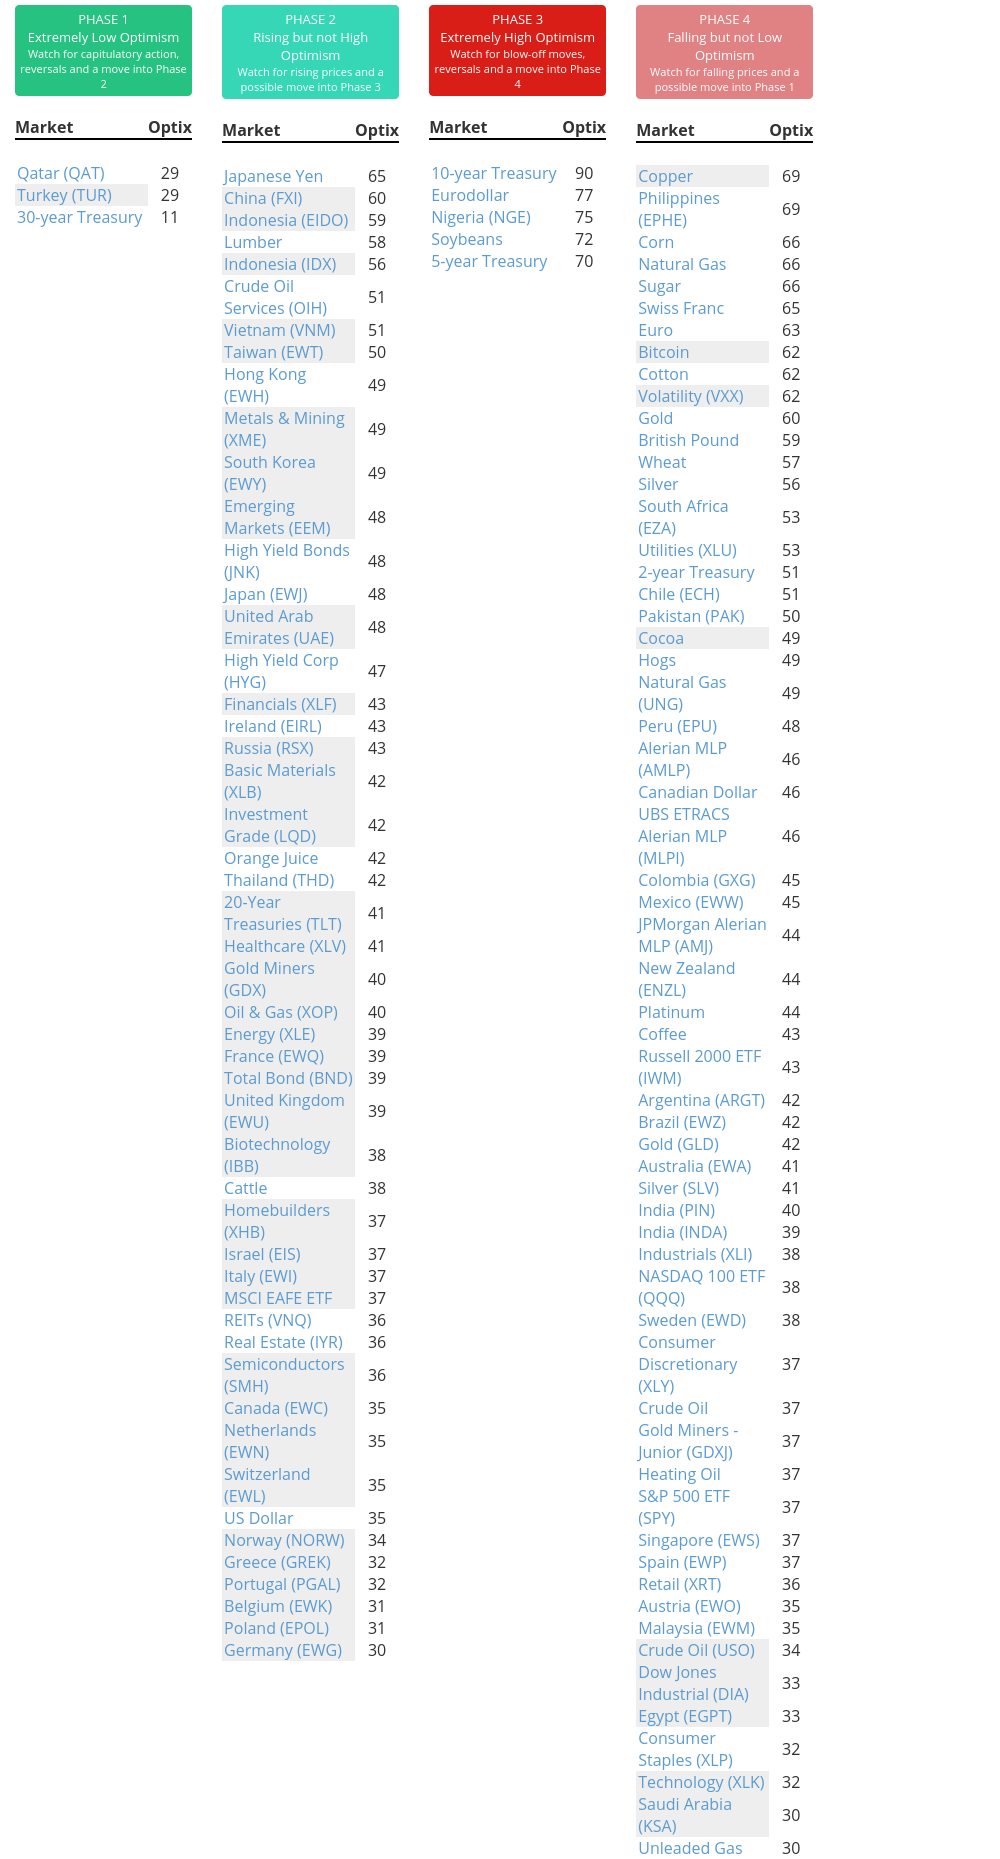
Phase Table
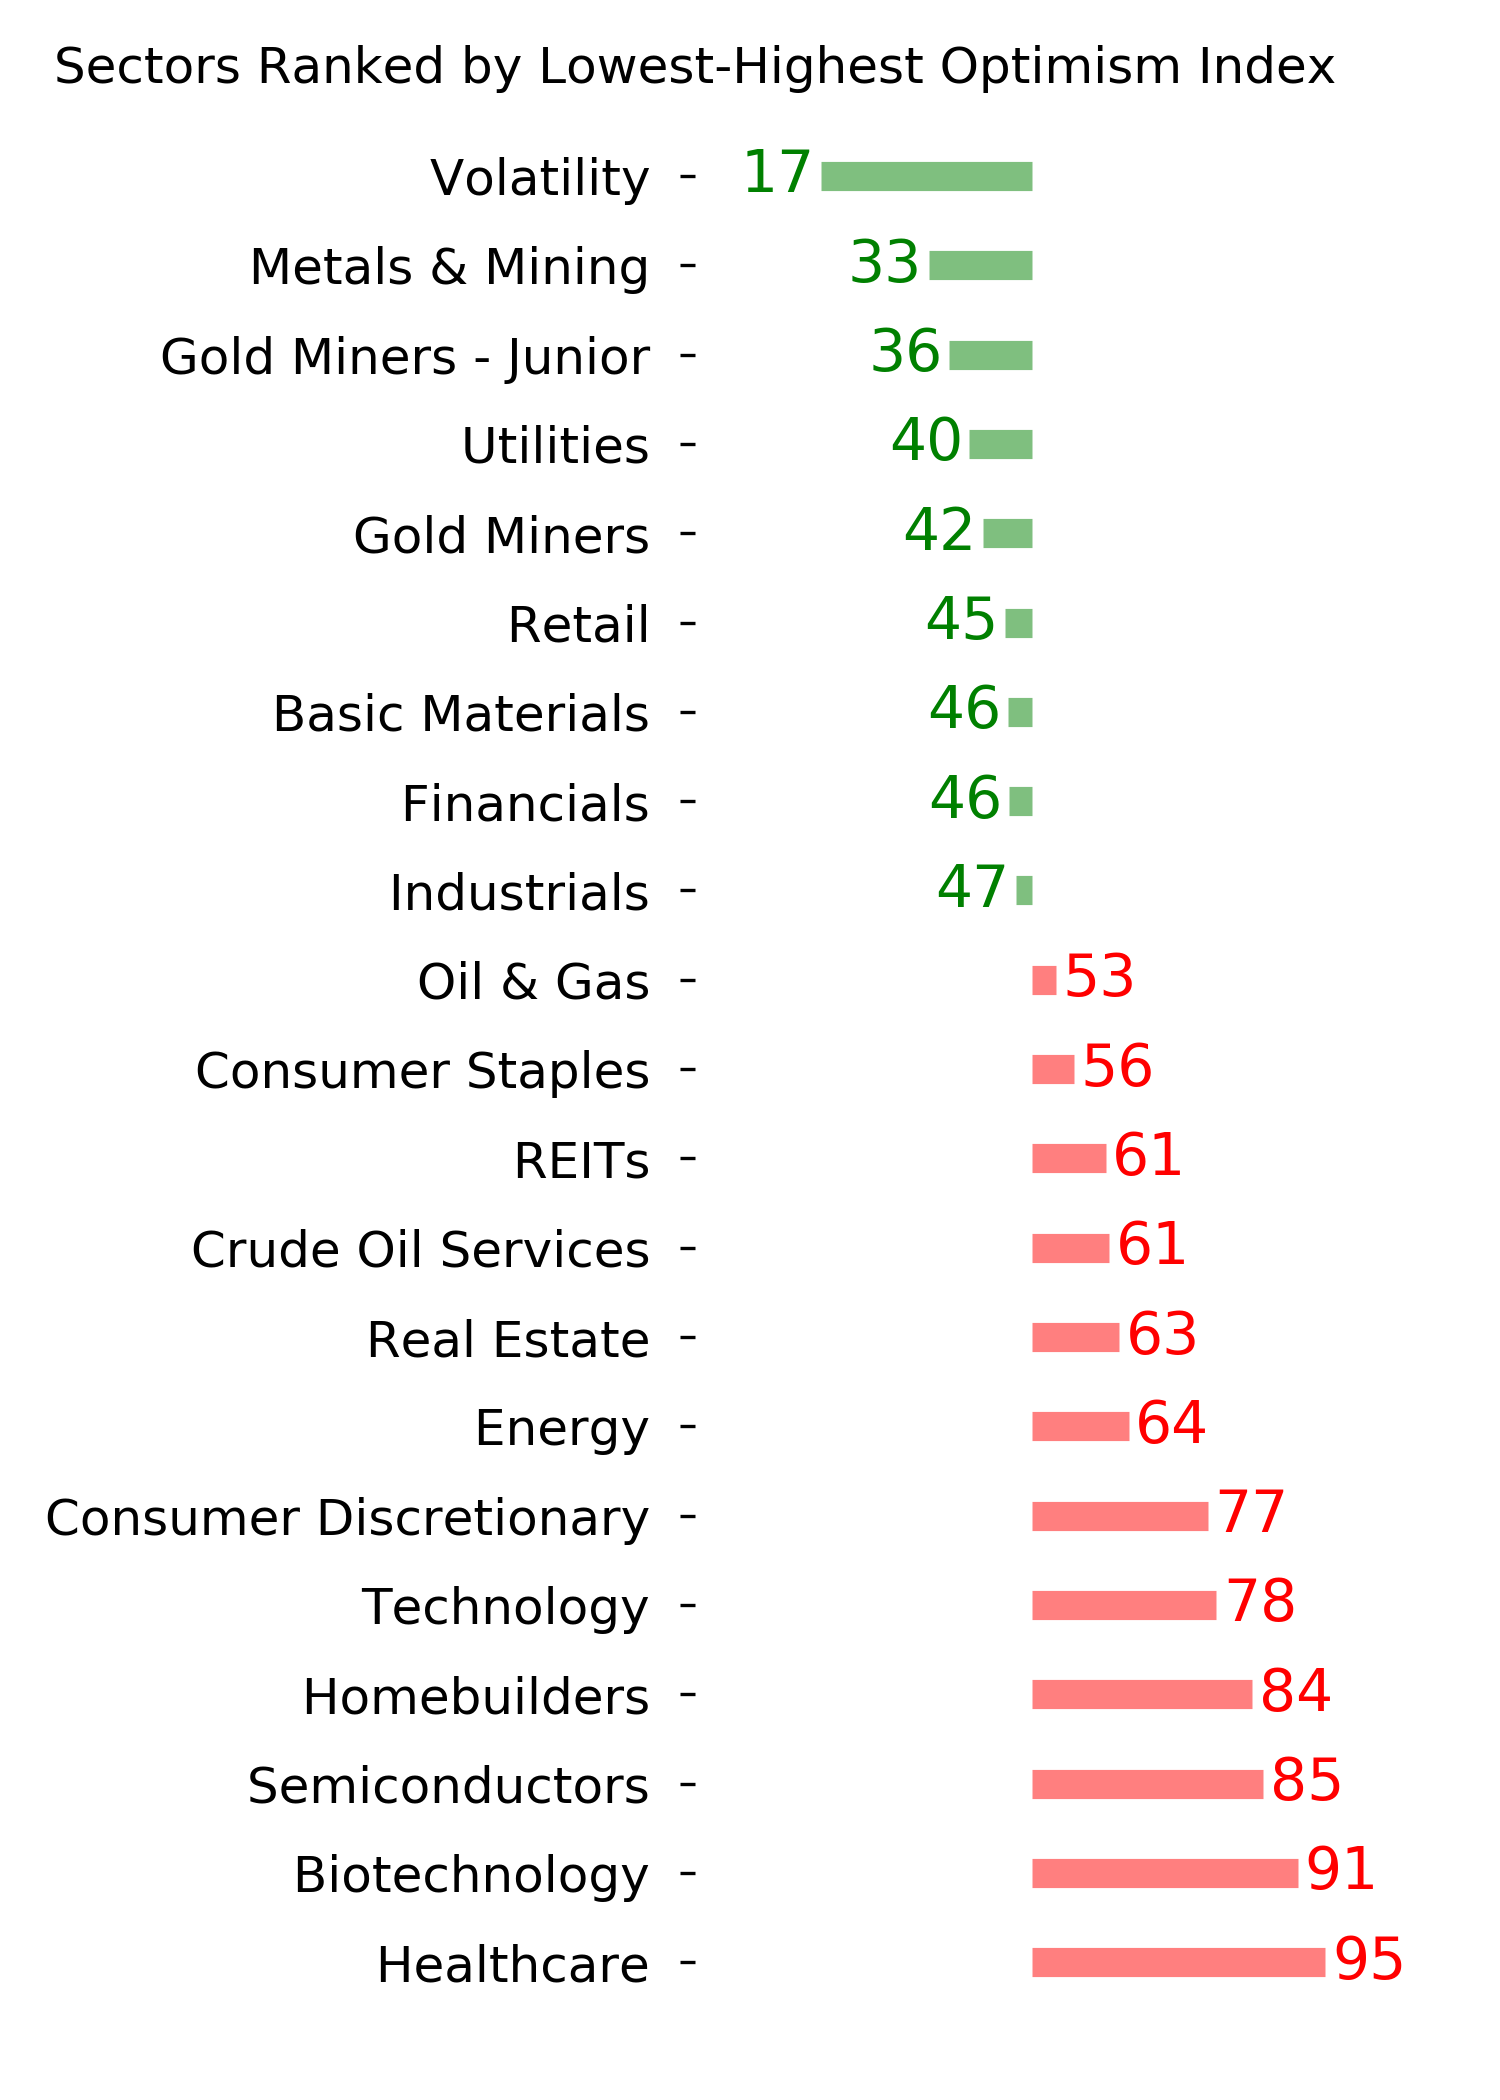
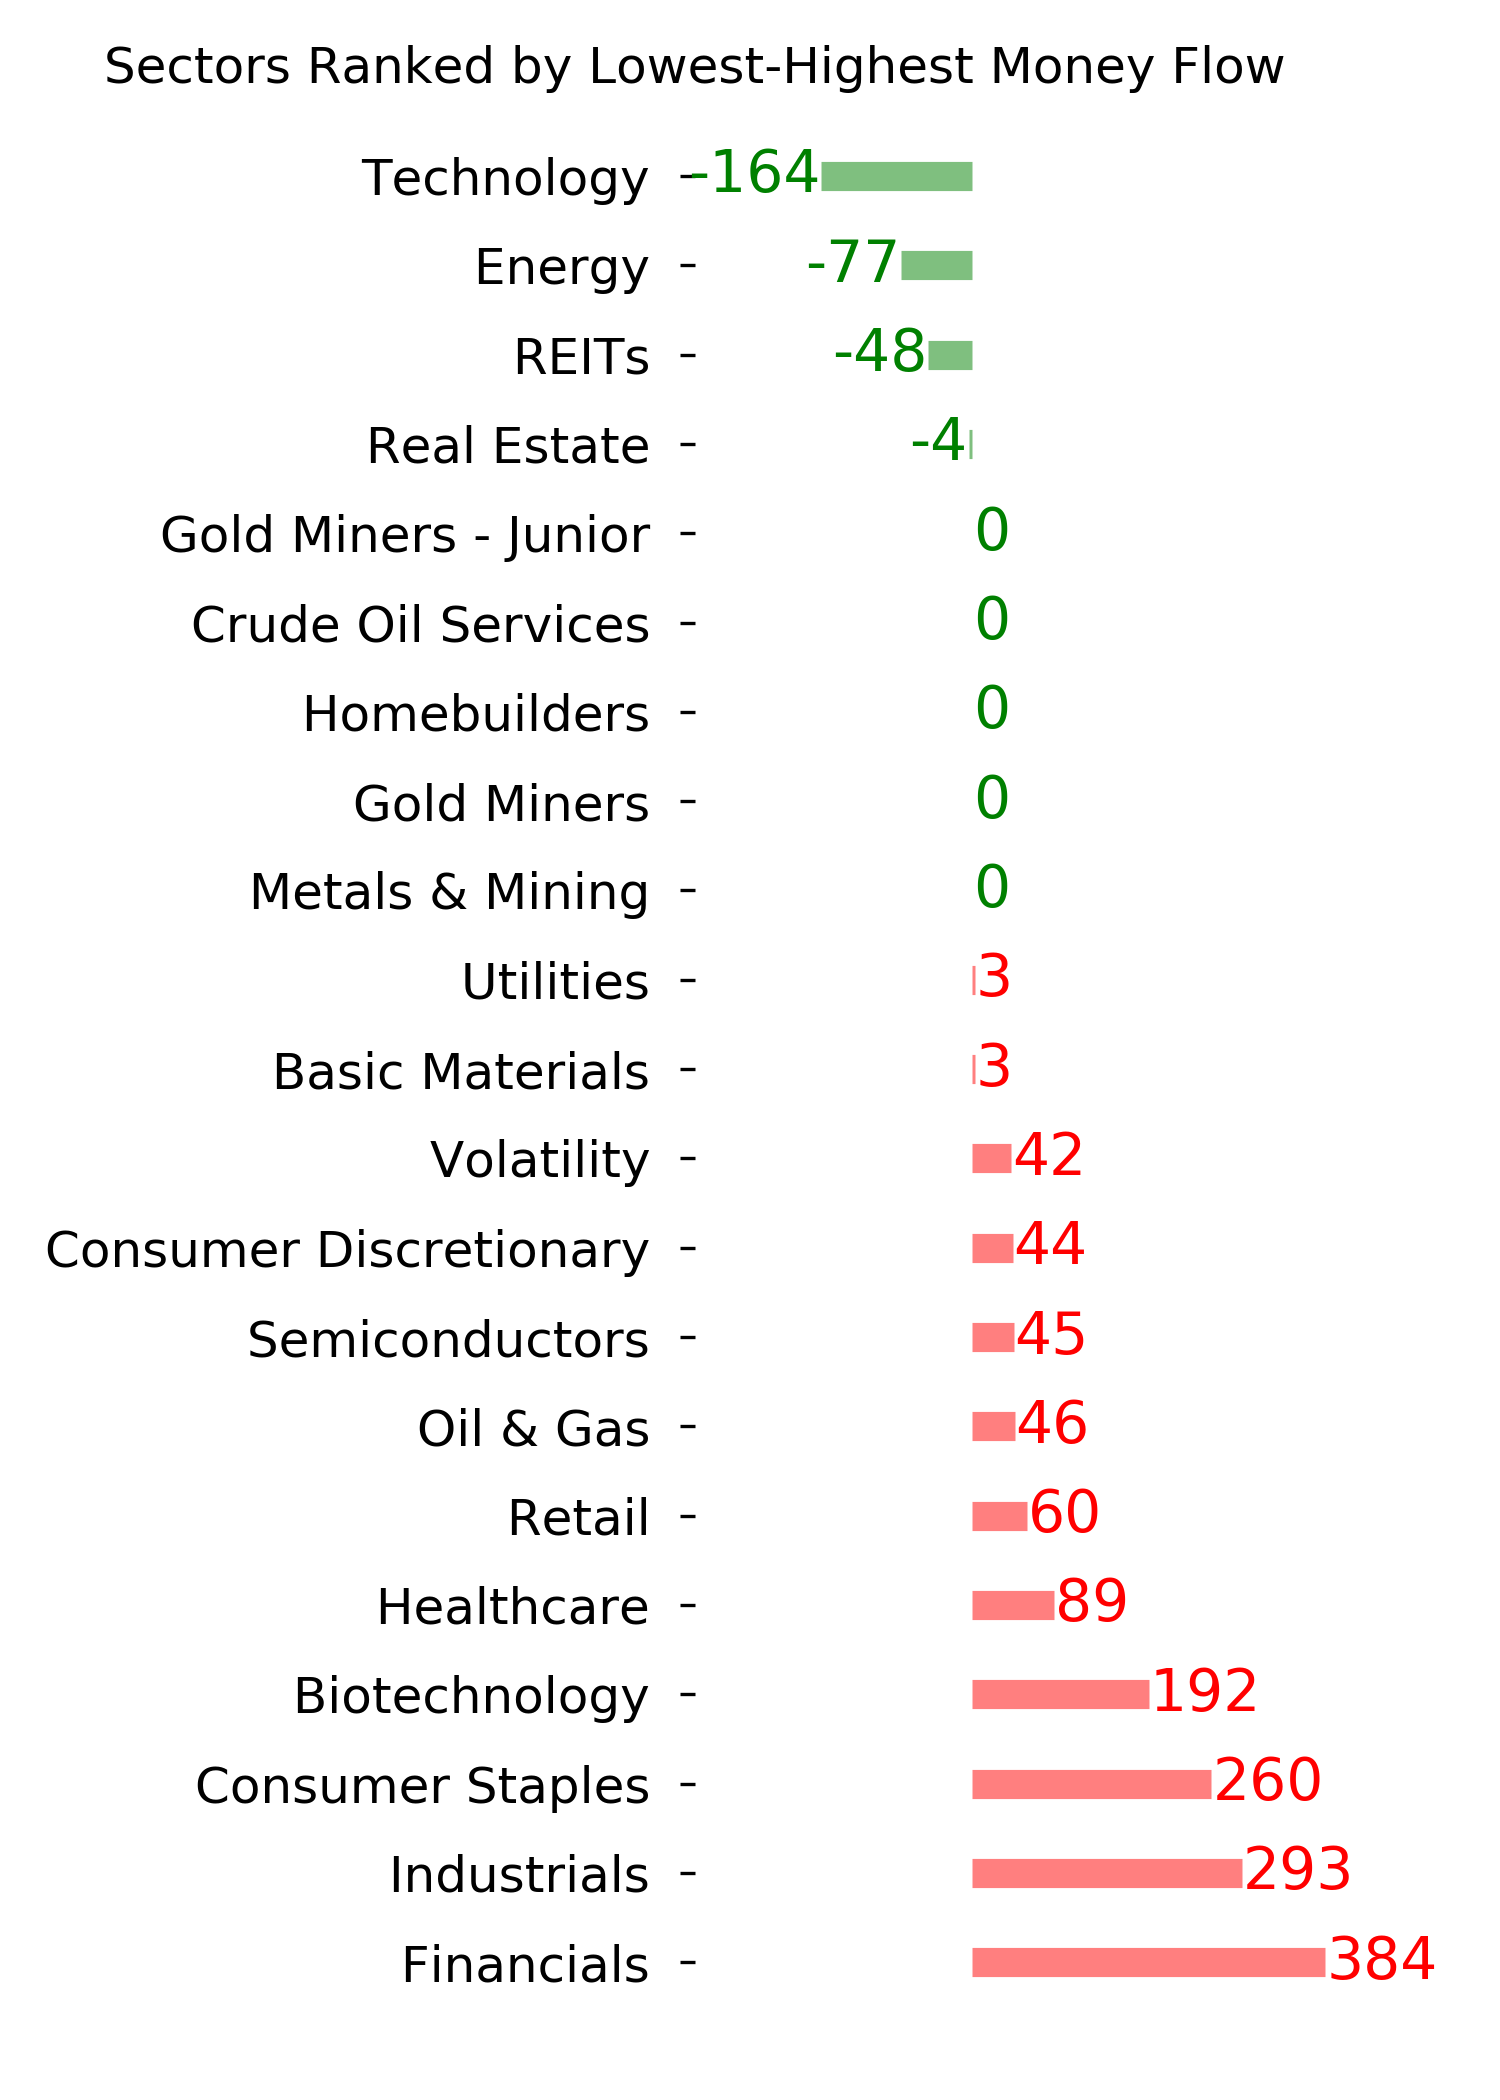
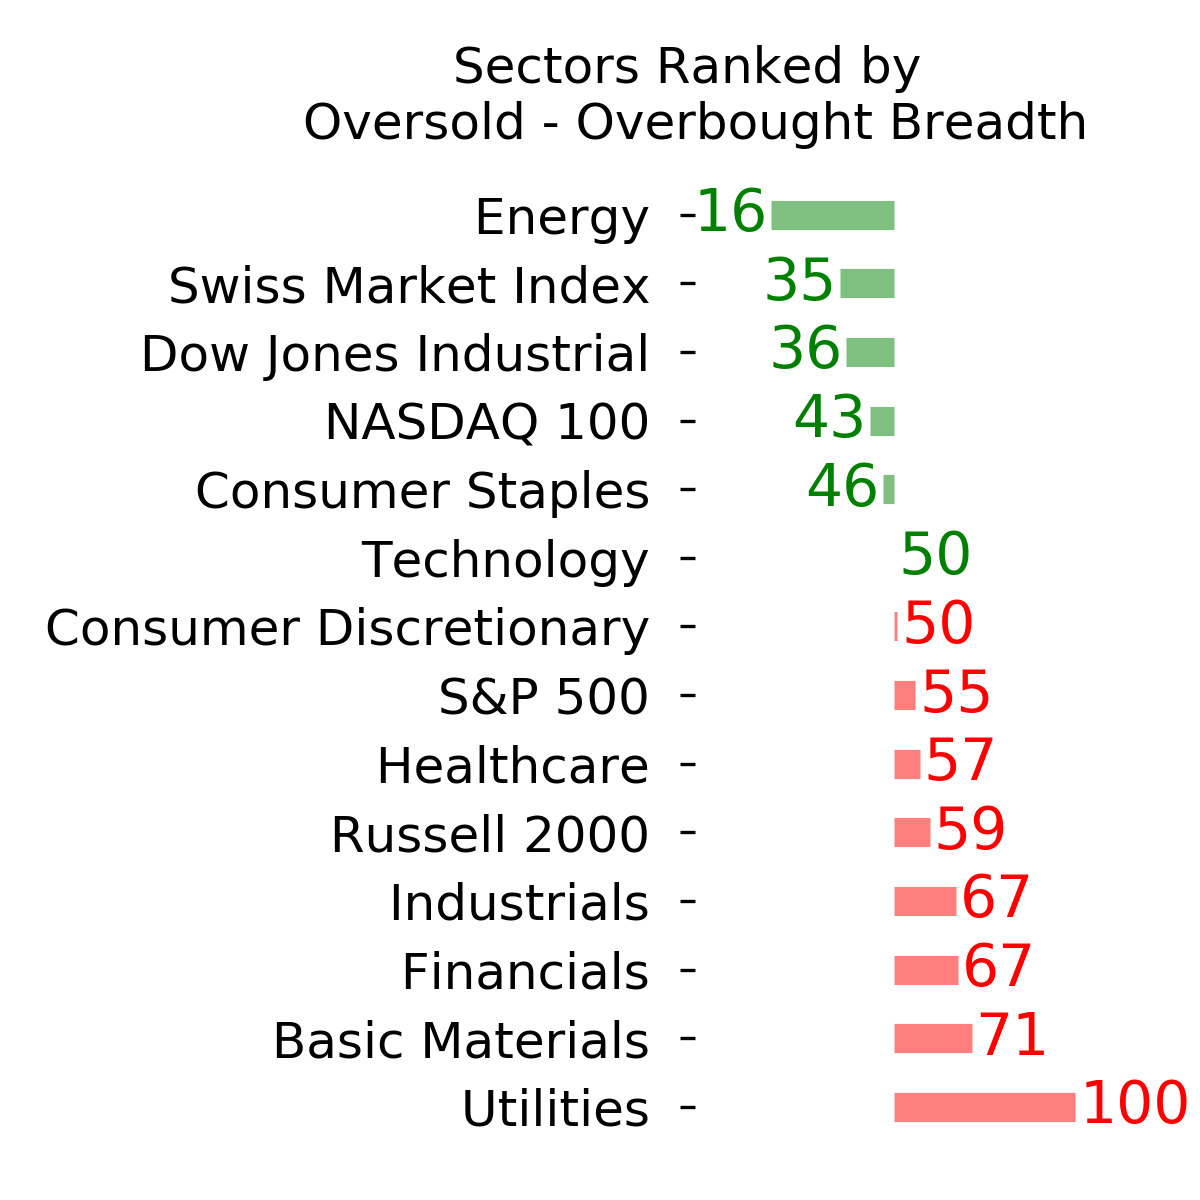
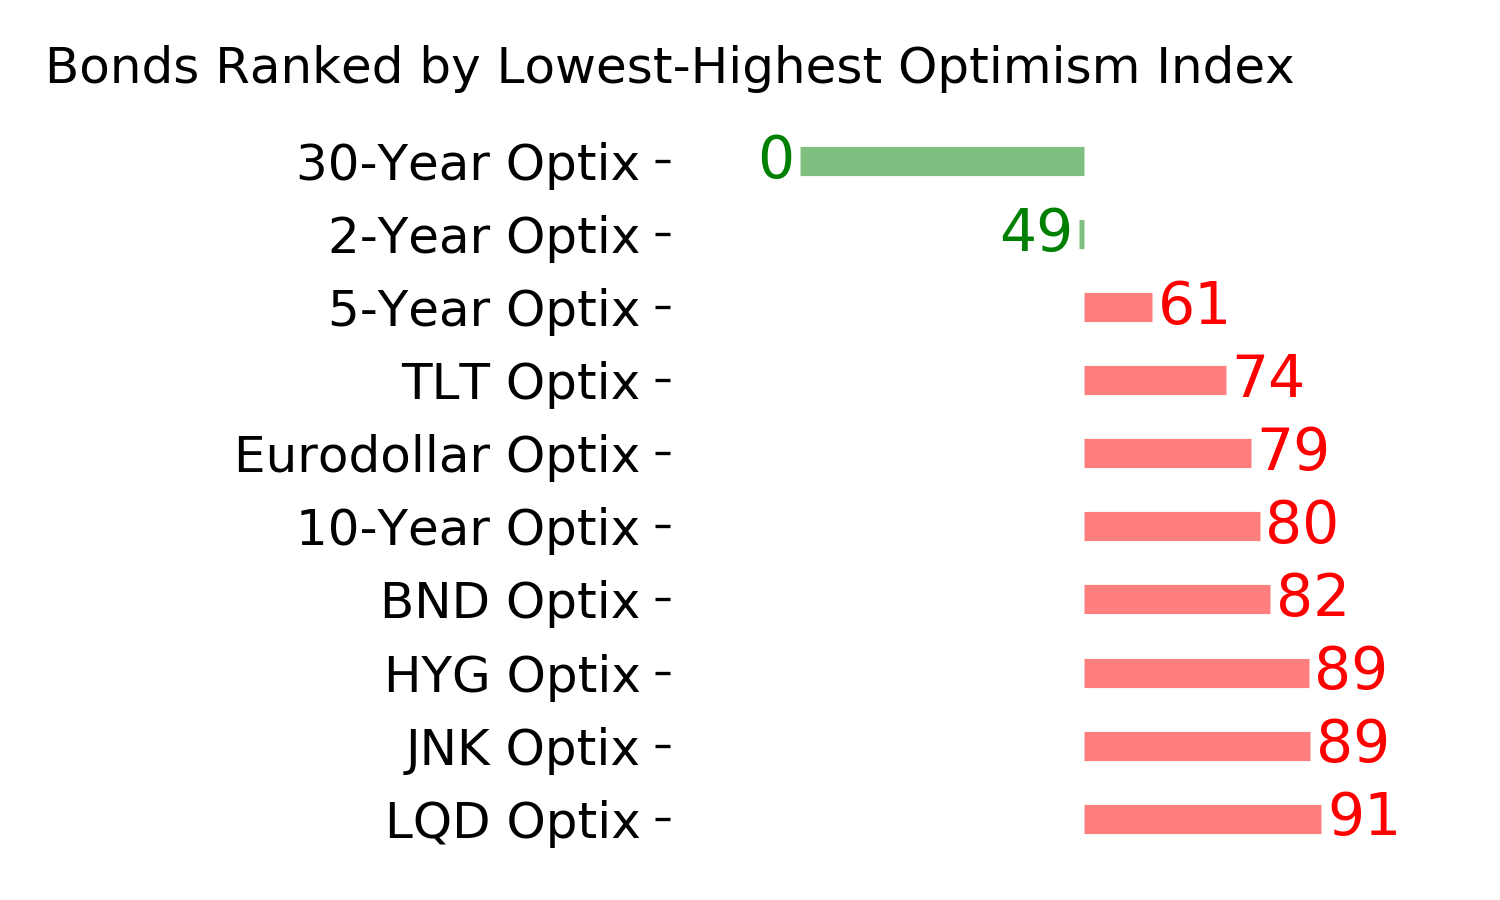
Ranks
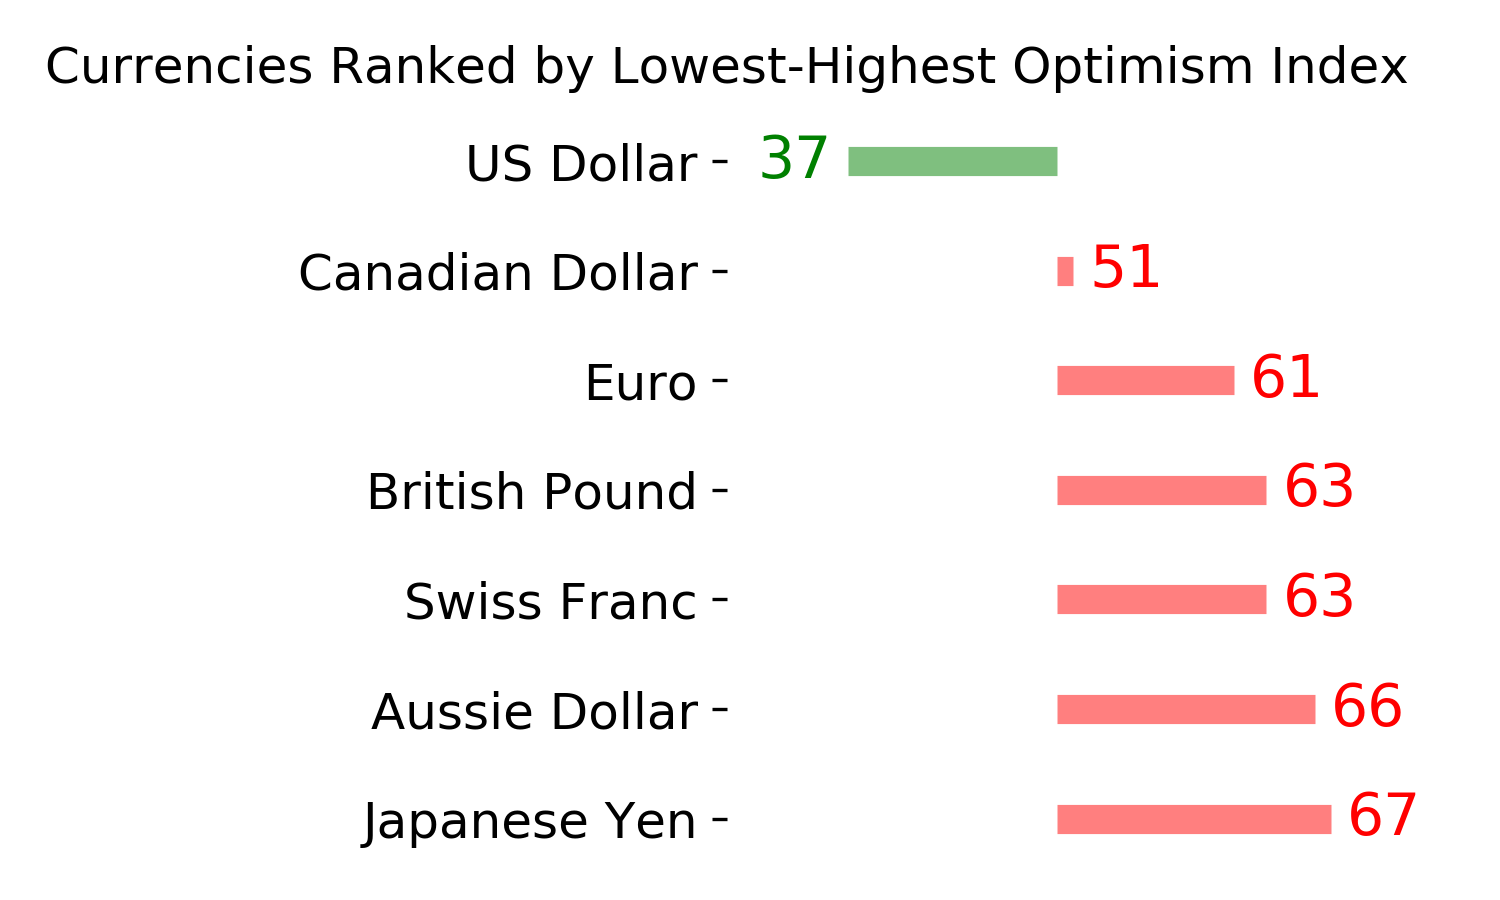
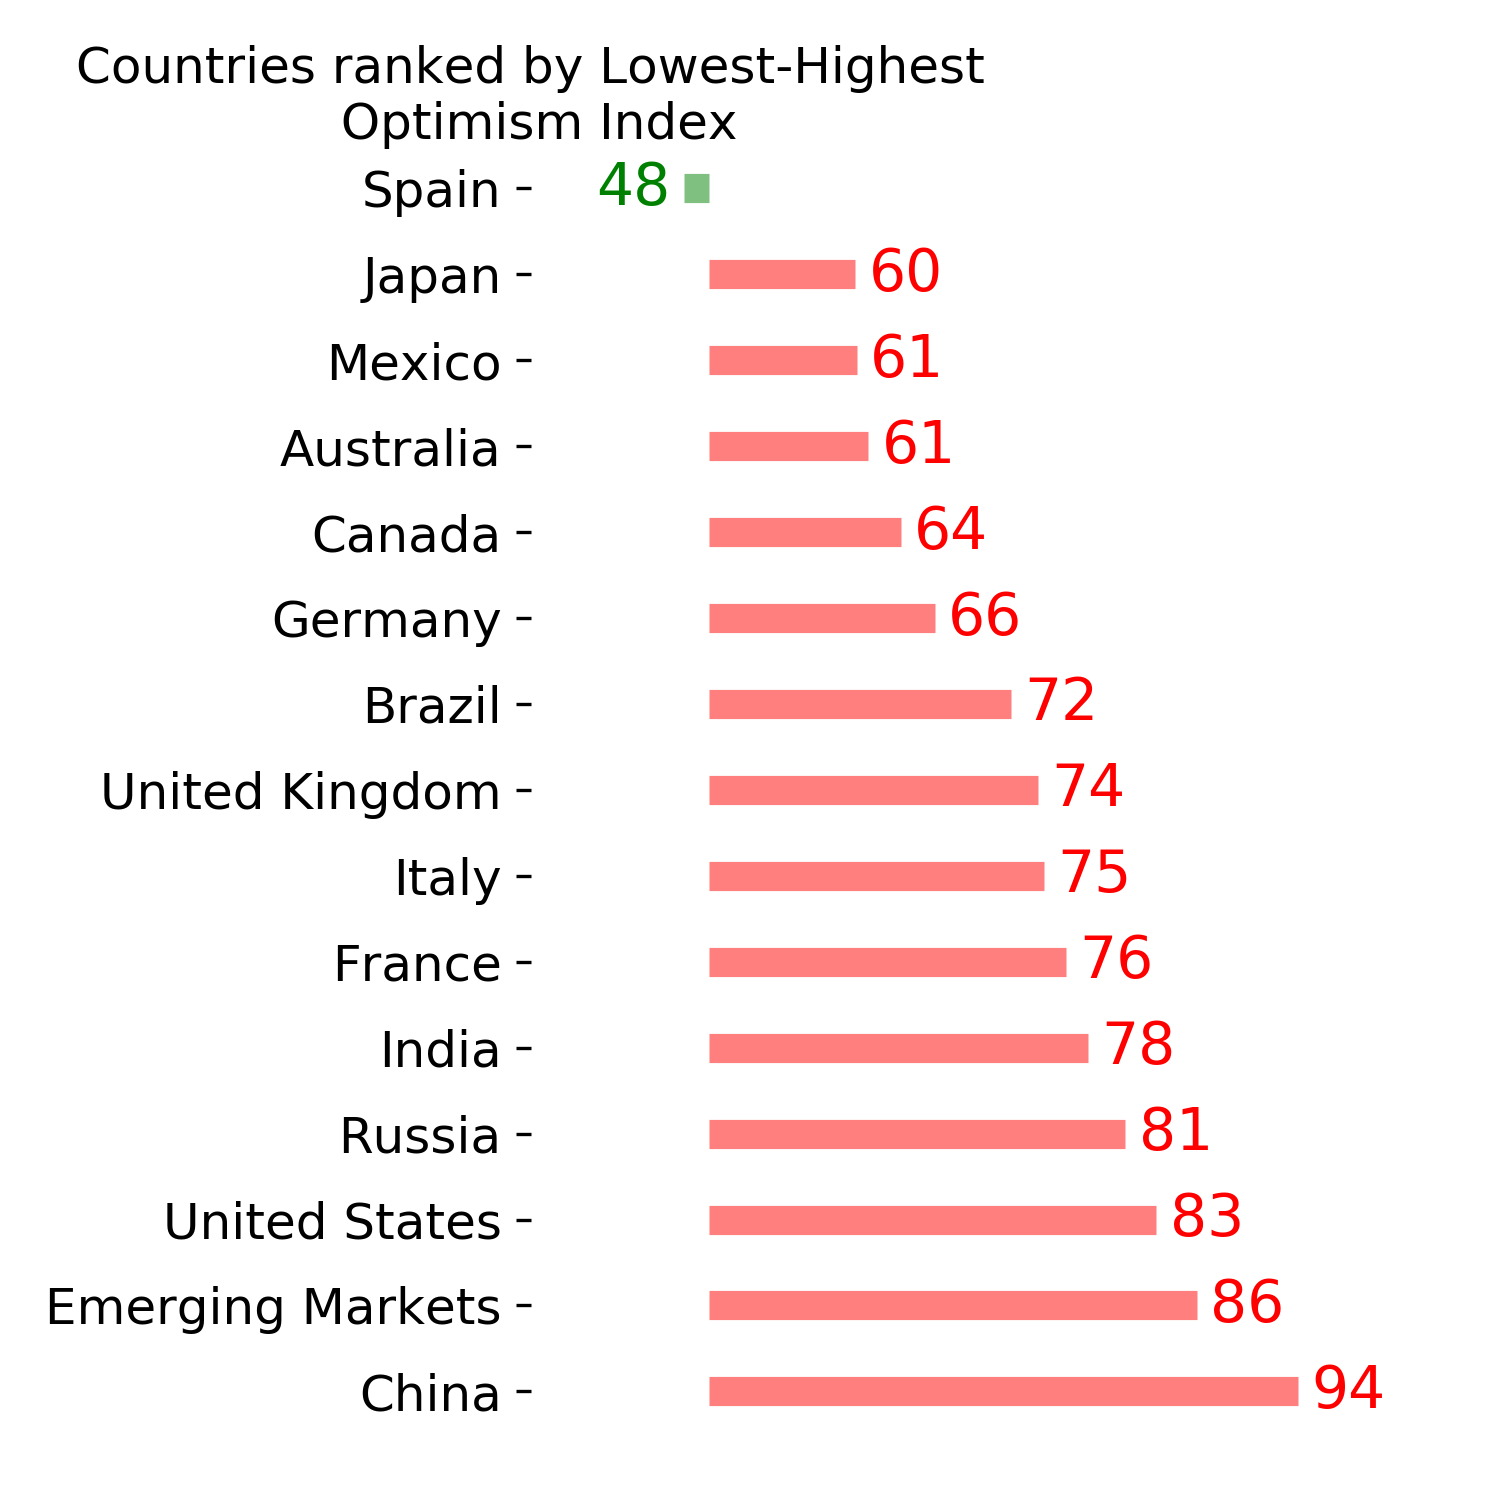
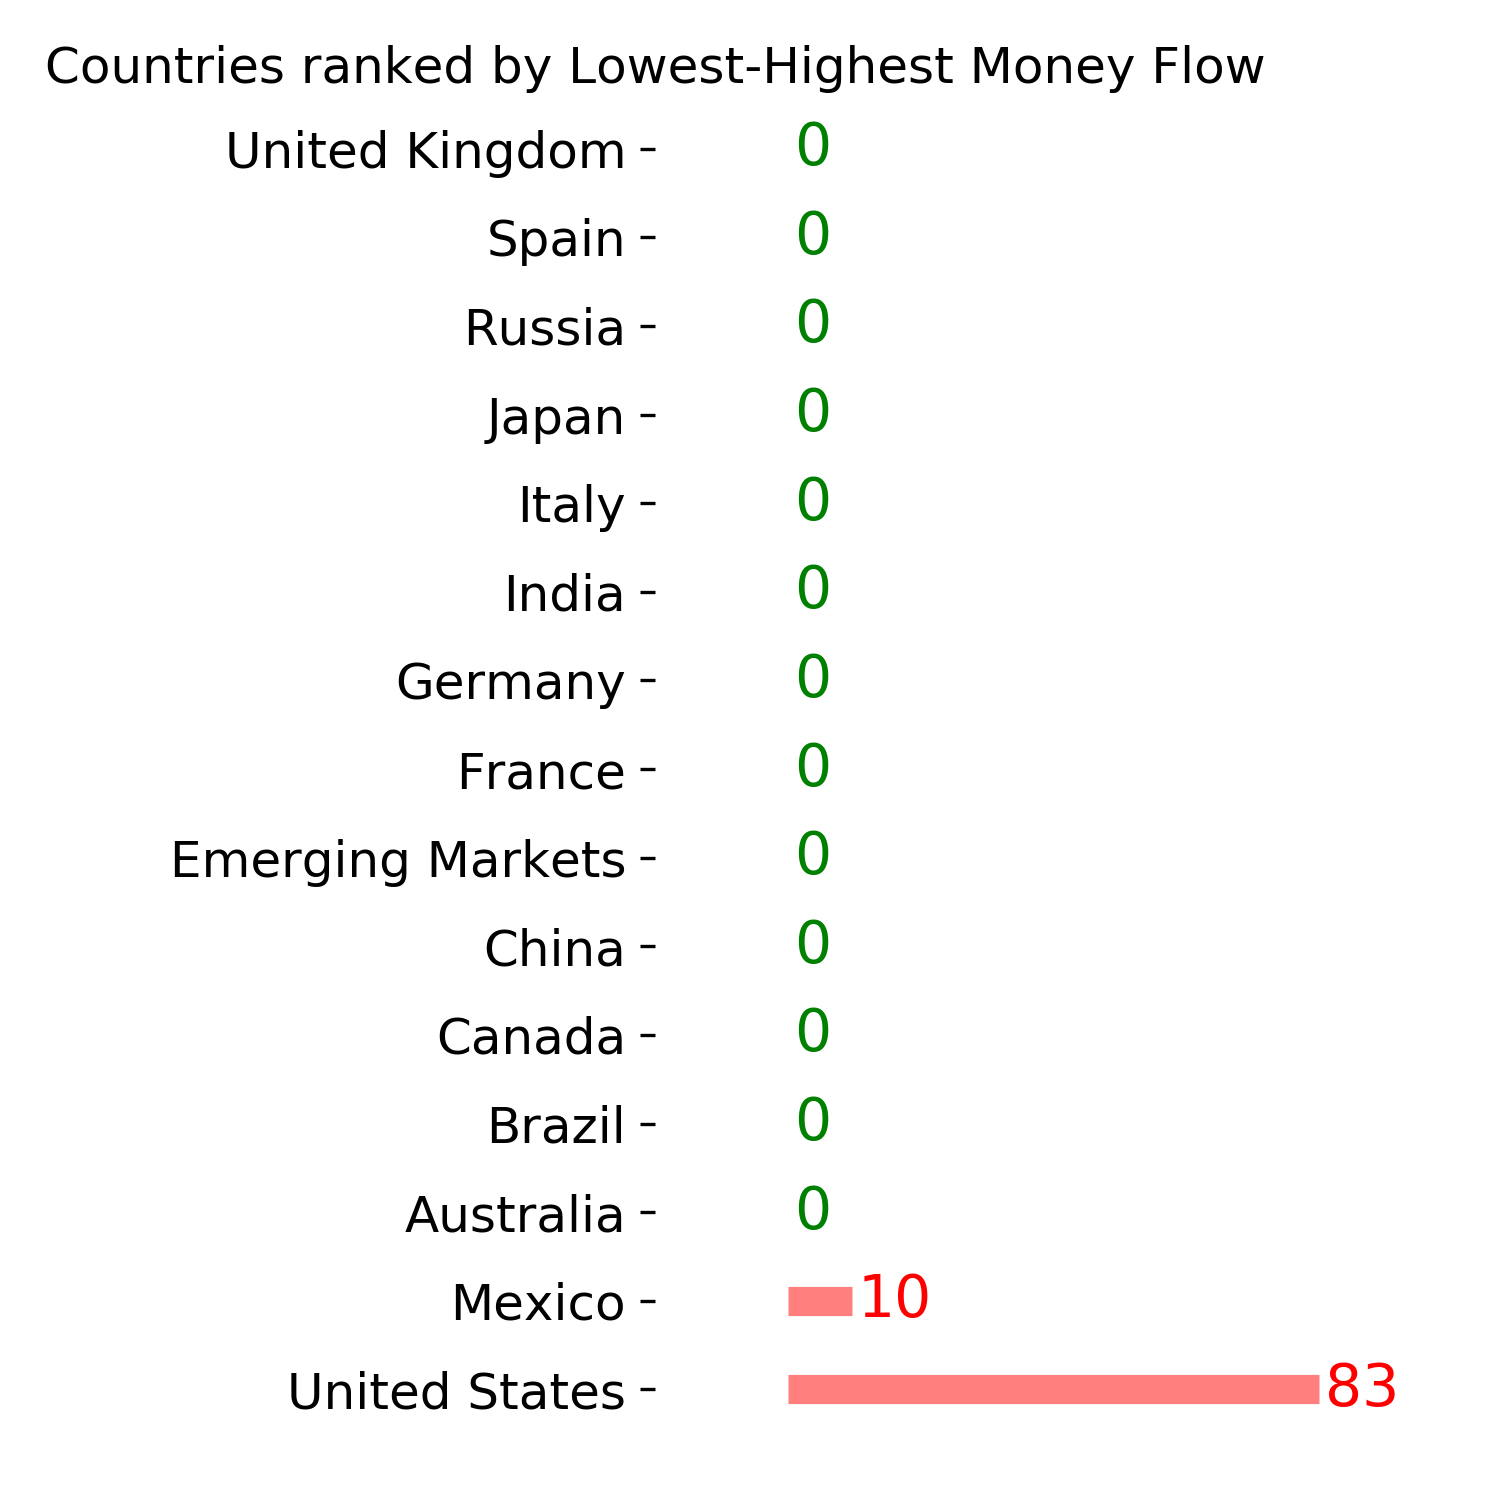
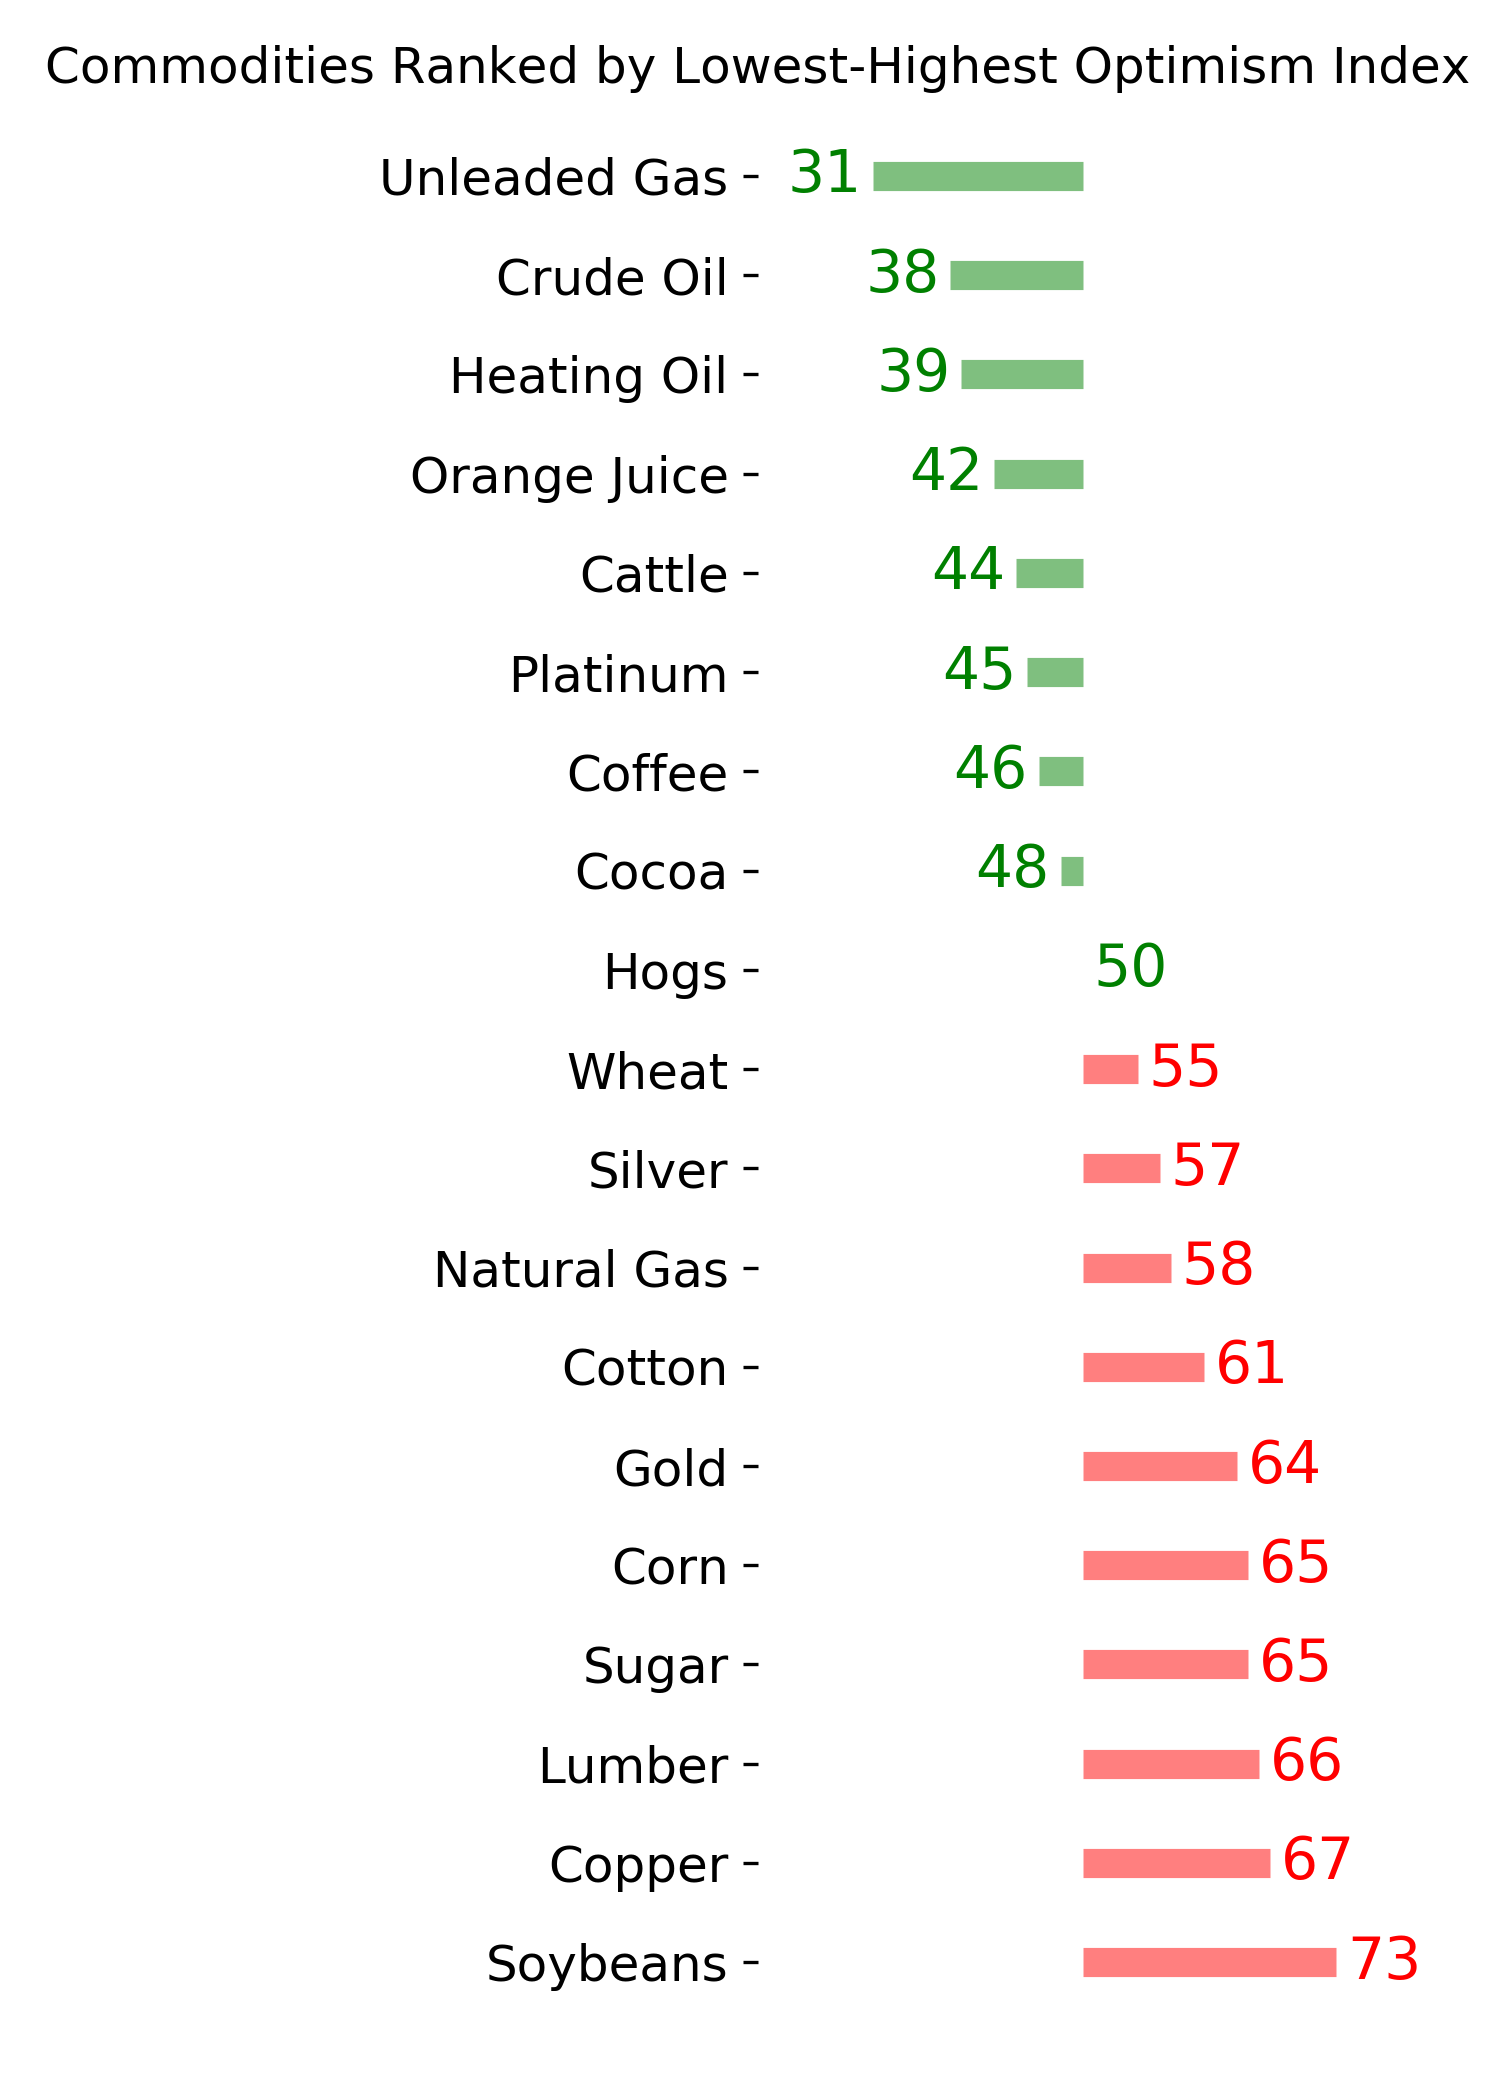
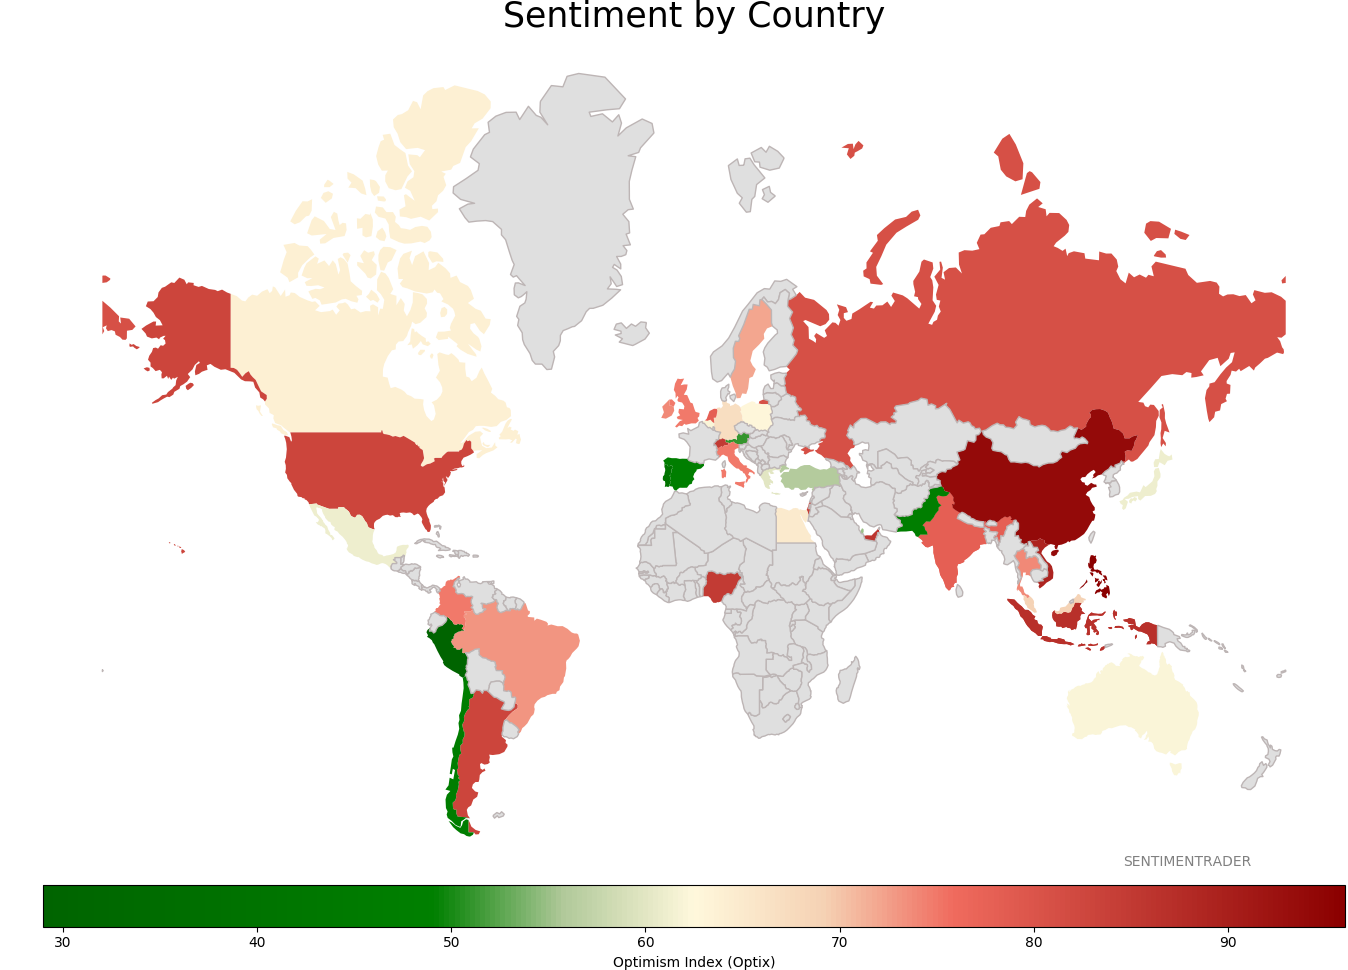
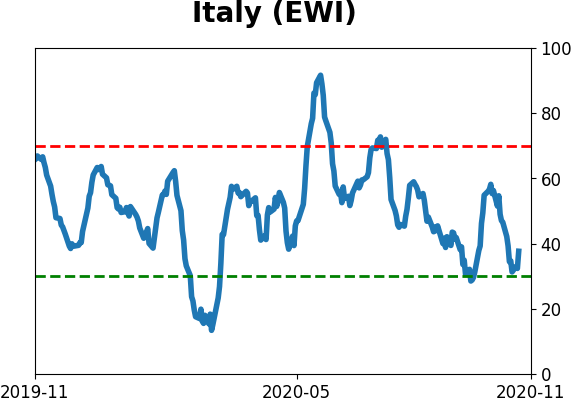
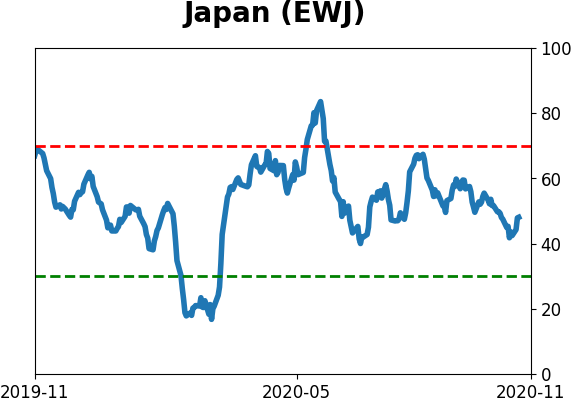
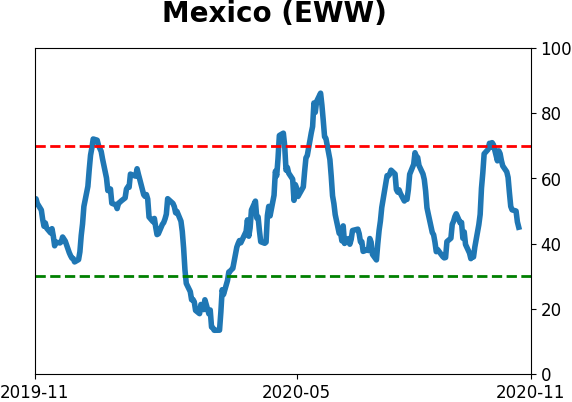
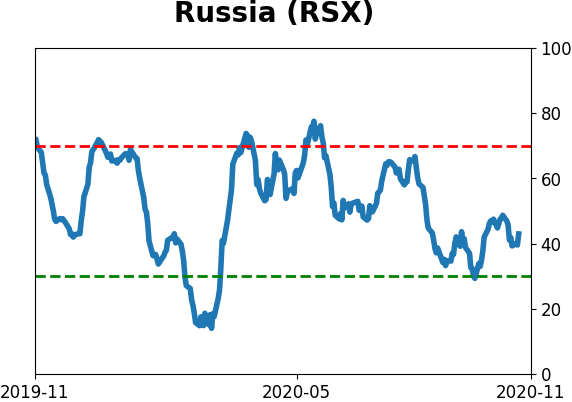
Sentiment Around The World
Optimism Index Thumbnails
|
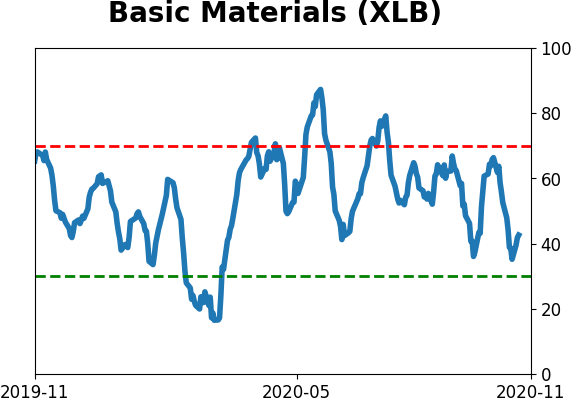
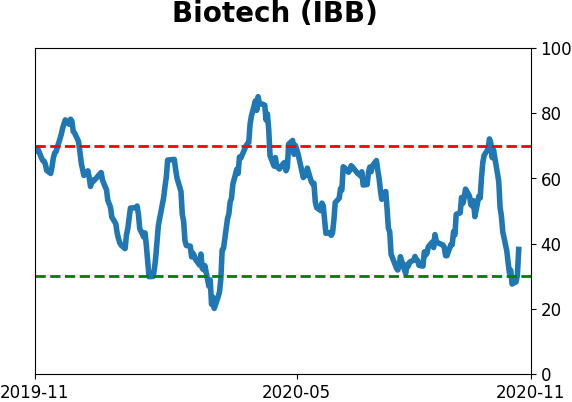
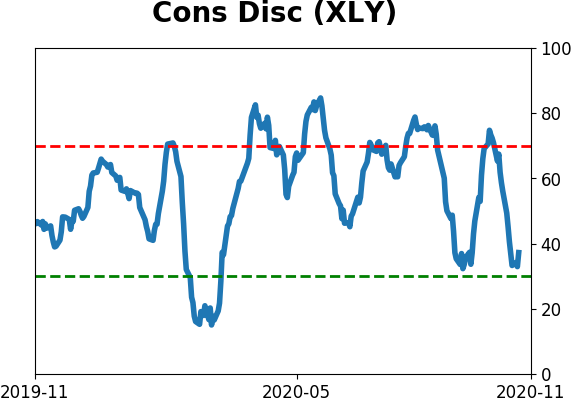
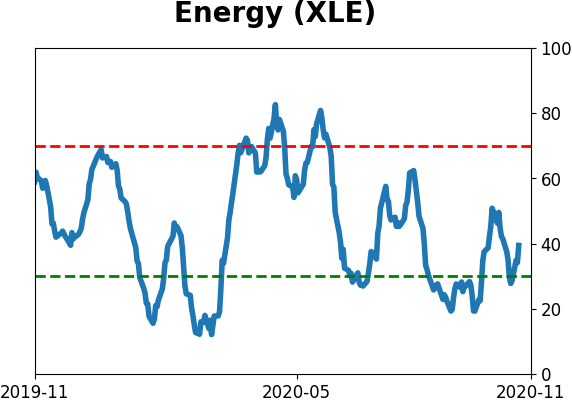
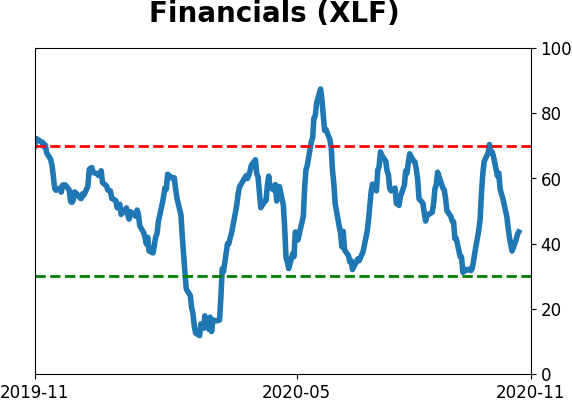
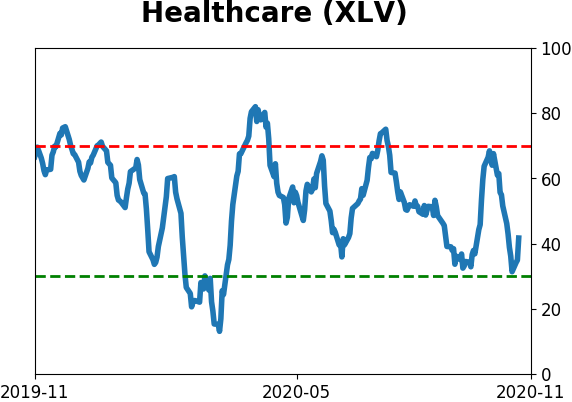
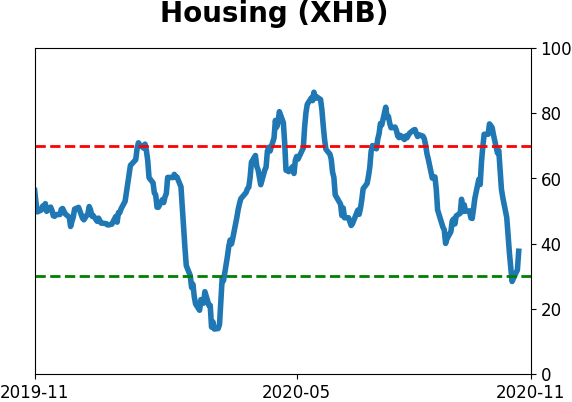
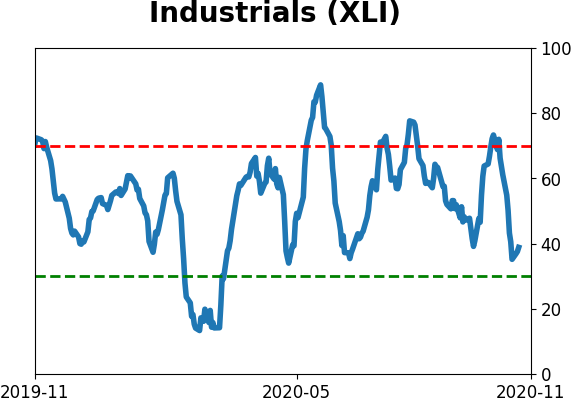
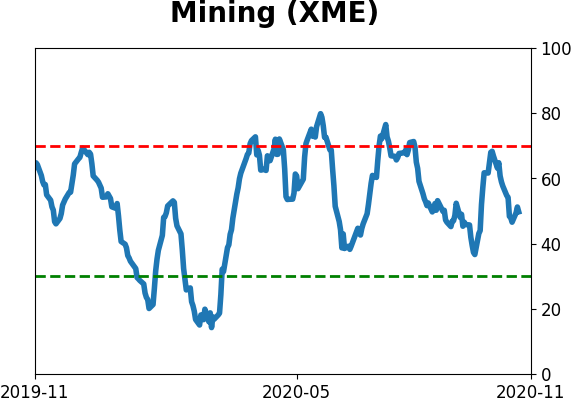
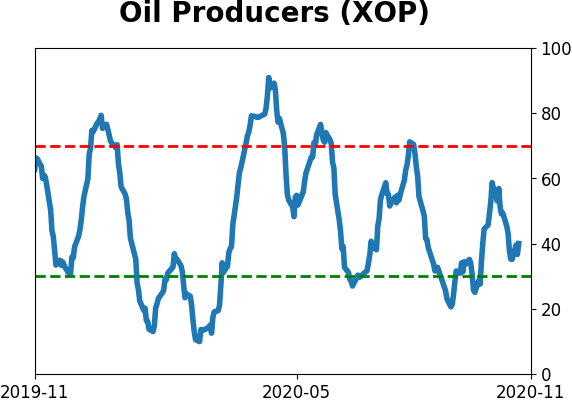
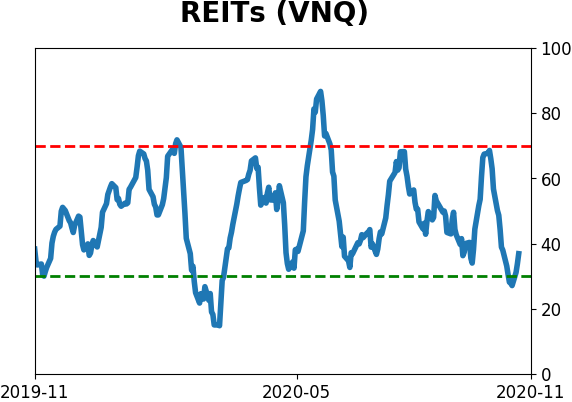
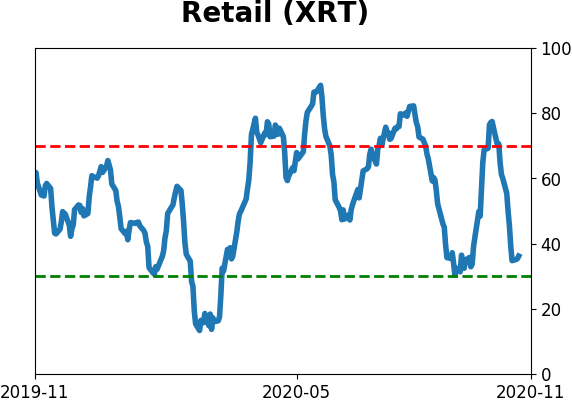
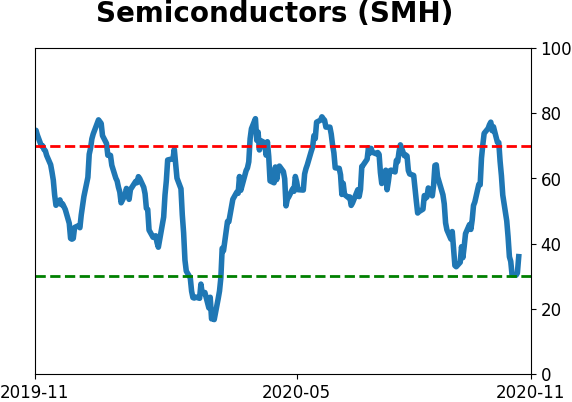
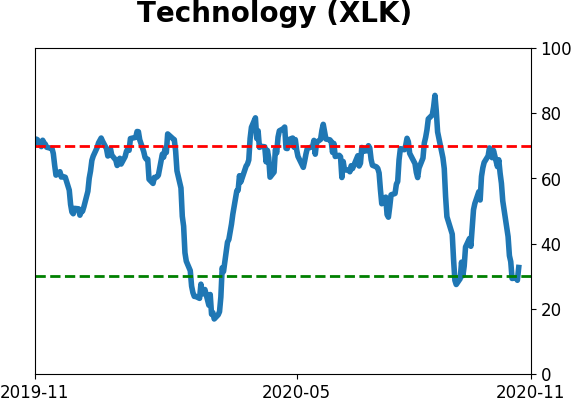
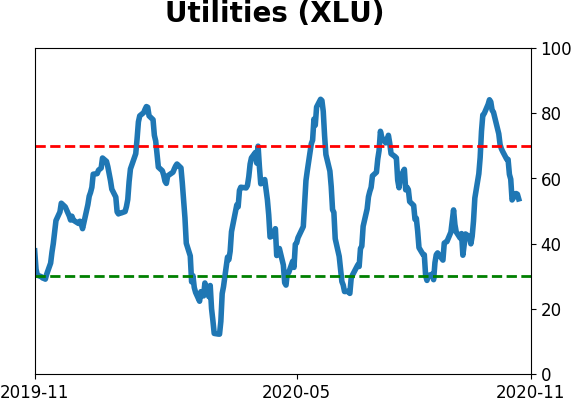
Sector ETF's - 10-Day Moving Average
|
|
|
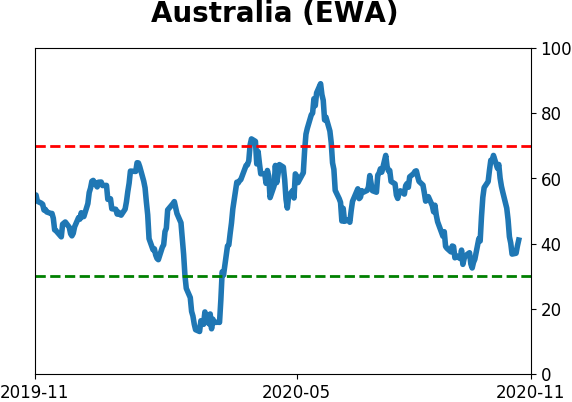
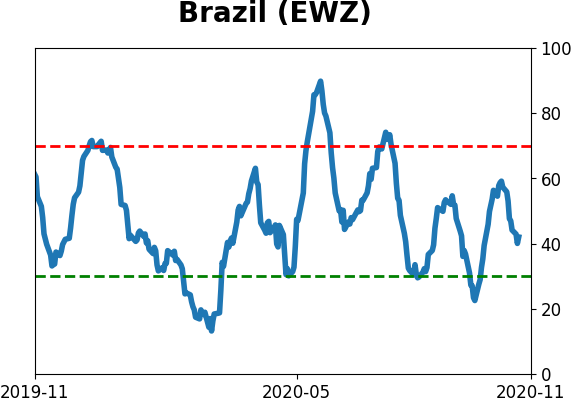
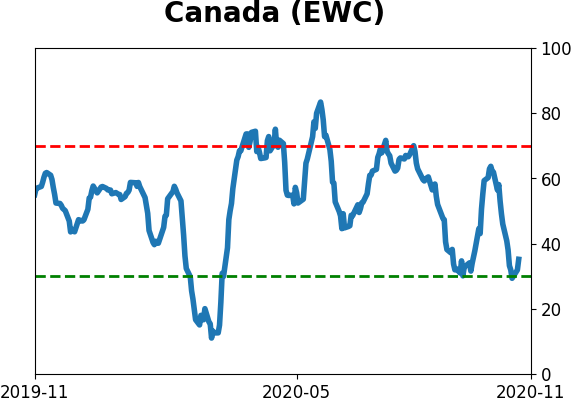
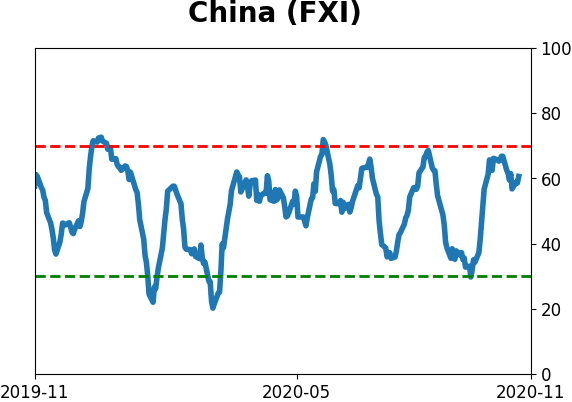
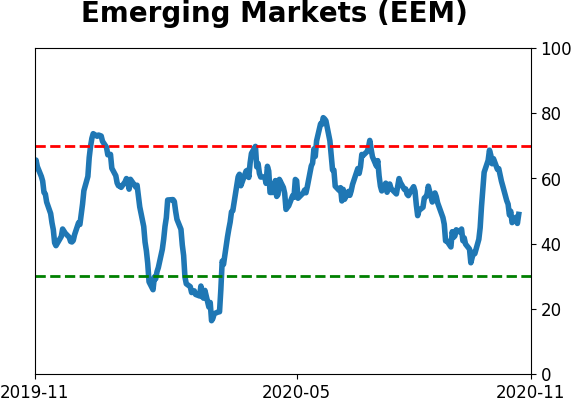
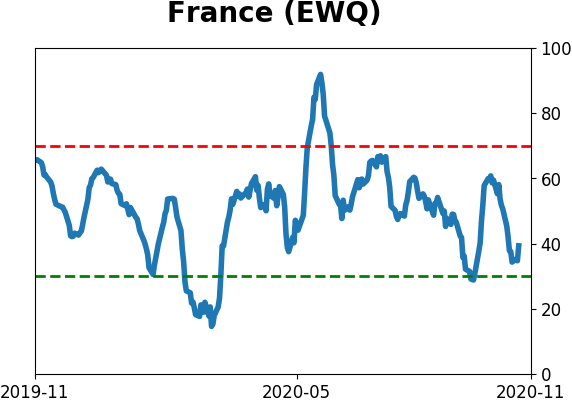
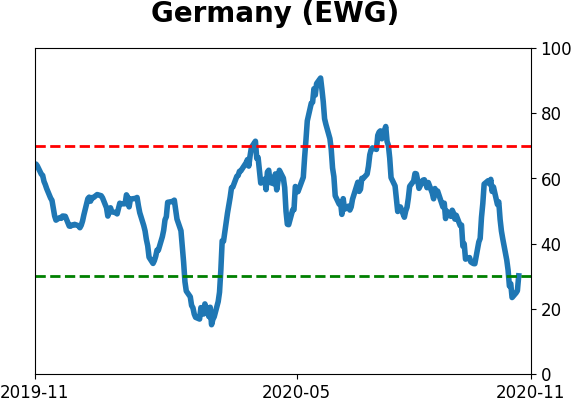
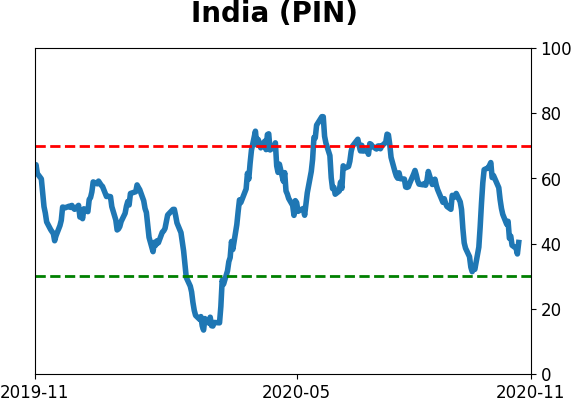
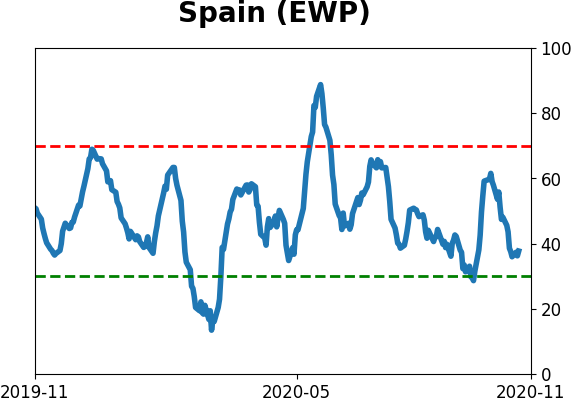
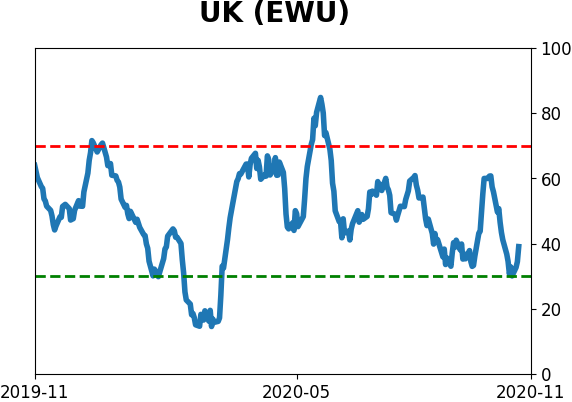
Country ETF's - 10-Day Moving Average
|
|
|
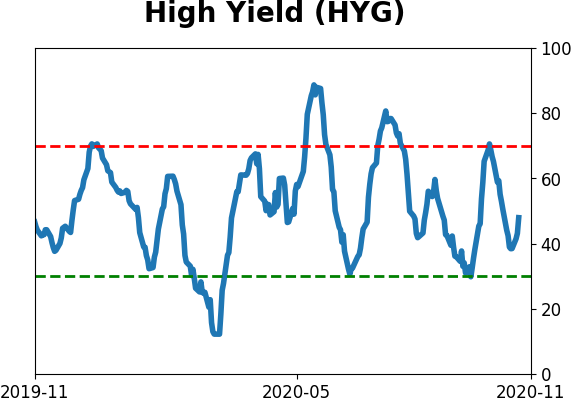
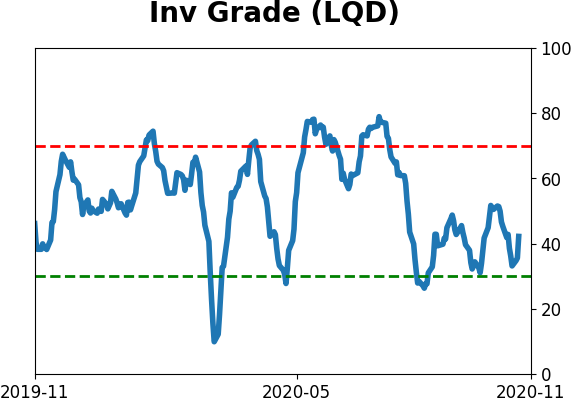
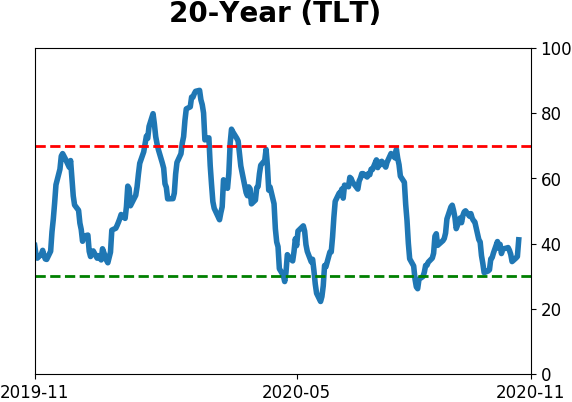
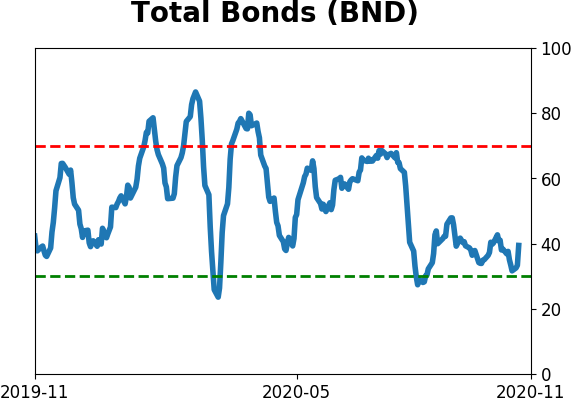
Bond ETF's - 10-Day Moving Average
|
|
|
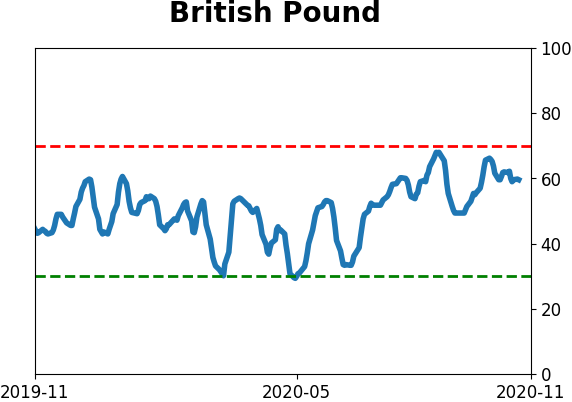
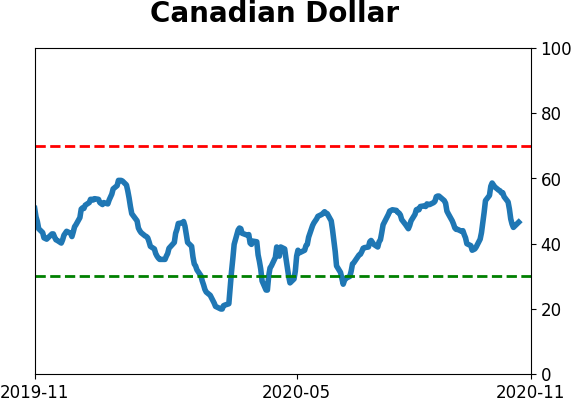
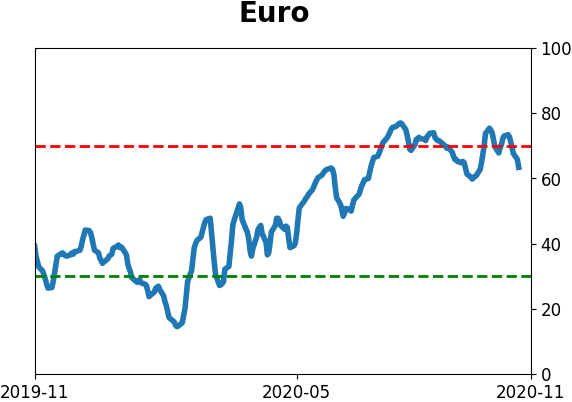
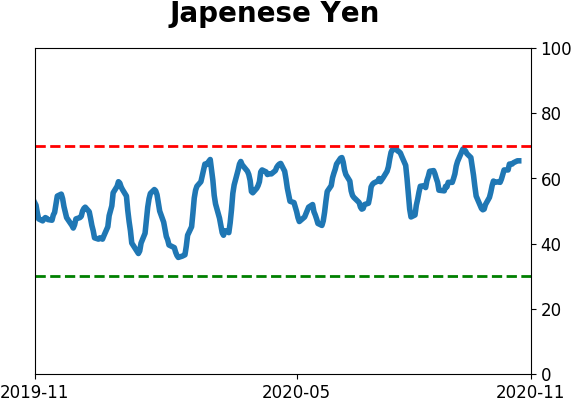
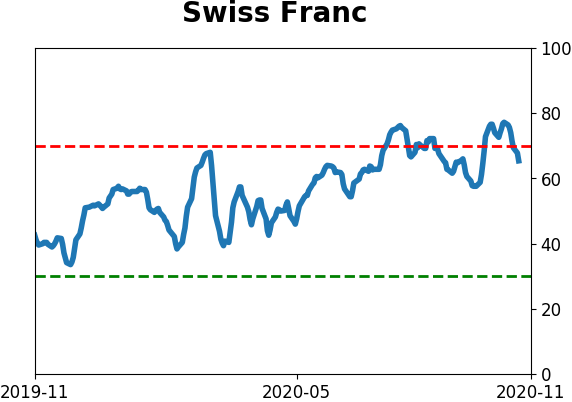
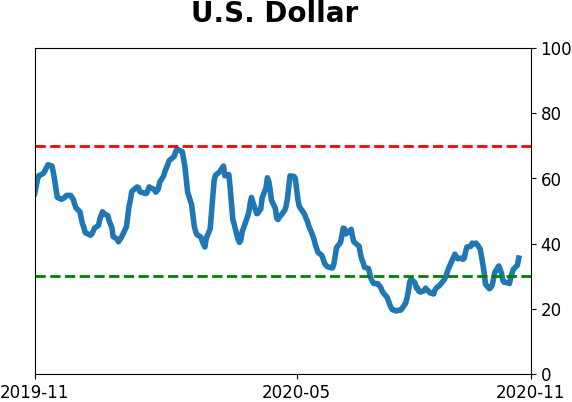
Currency ETF's - 5-Day Moving Average
|
|
|
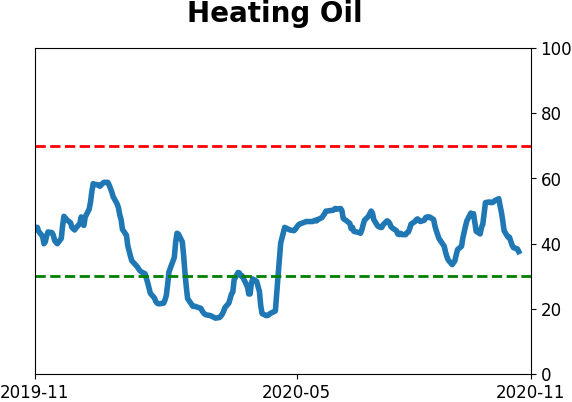
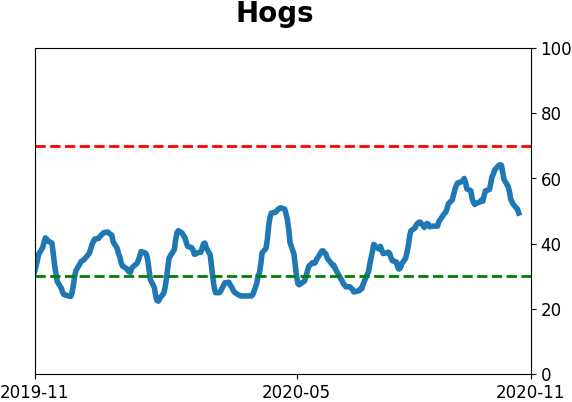
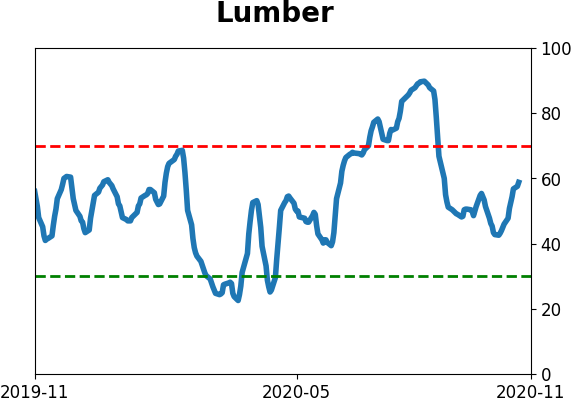
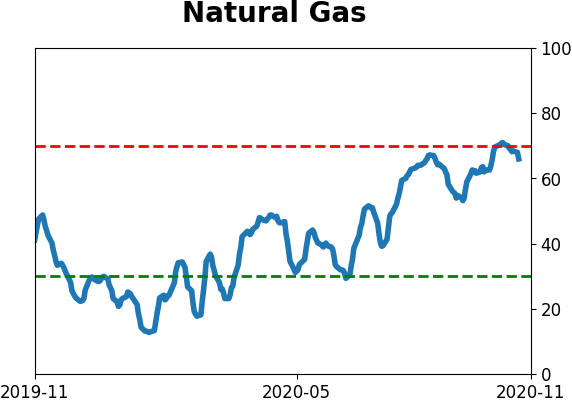
Commodity ETF's - 5-Day Moving Average
|
|