Headlines
|
|
Speculators are betting on even more volatility ahead:
Smart money hedgers in VIX futures seem to be betting that volatility is going to increase in the coming weeks as markets digest major news events. But their record in volatility is opposite of what it is in most other markets, and the VIX tends to decline after they establish big positions, as they have recently.
Oil's historic reversal:
On Monday, crude oil enjoyed a historic reversal from a 90-day low. The few other times it reversed like this, oil and energy companies took off to the upside. The biggest caveat is that lesser reversals didn't show a consistent tendency to lead to good returns.
Election elation: Maybe everyone's just glad to put the ads and vitriol behind them (hopefully). Whatever the reasons, investors scooped up stocks on election day. Going back to 1962, today marked one of the few times when more than 70% of volume on the NYSE flowed into advancing securities. Most didn't last in the days ahead.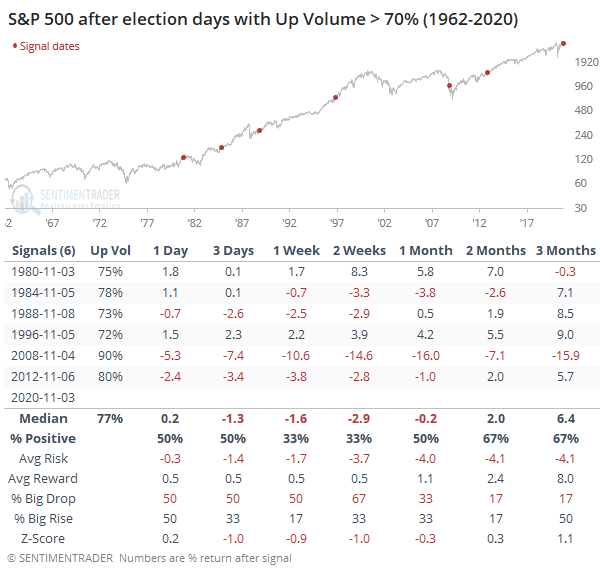
Bottom Line:
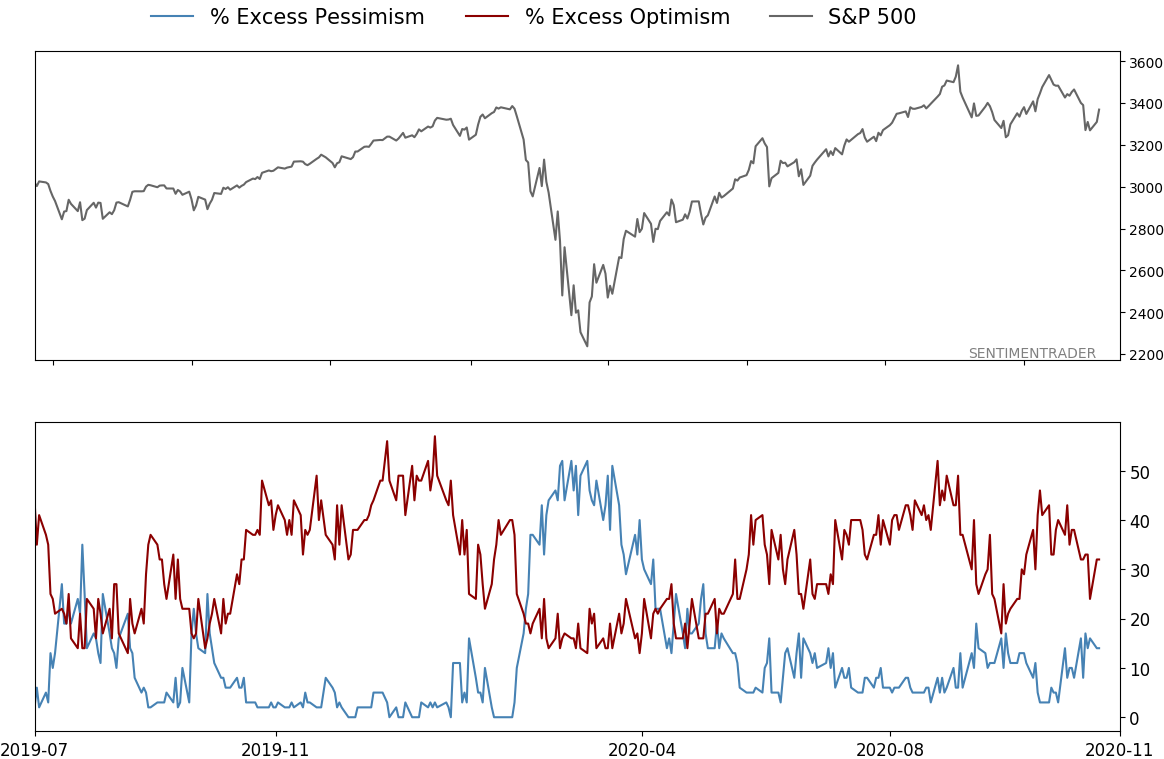
- A positive environment favors becoming aggressive on signs of excessive pessimism, of which there are few yet.
|
Smart / Dumb Money Confidence
|
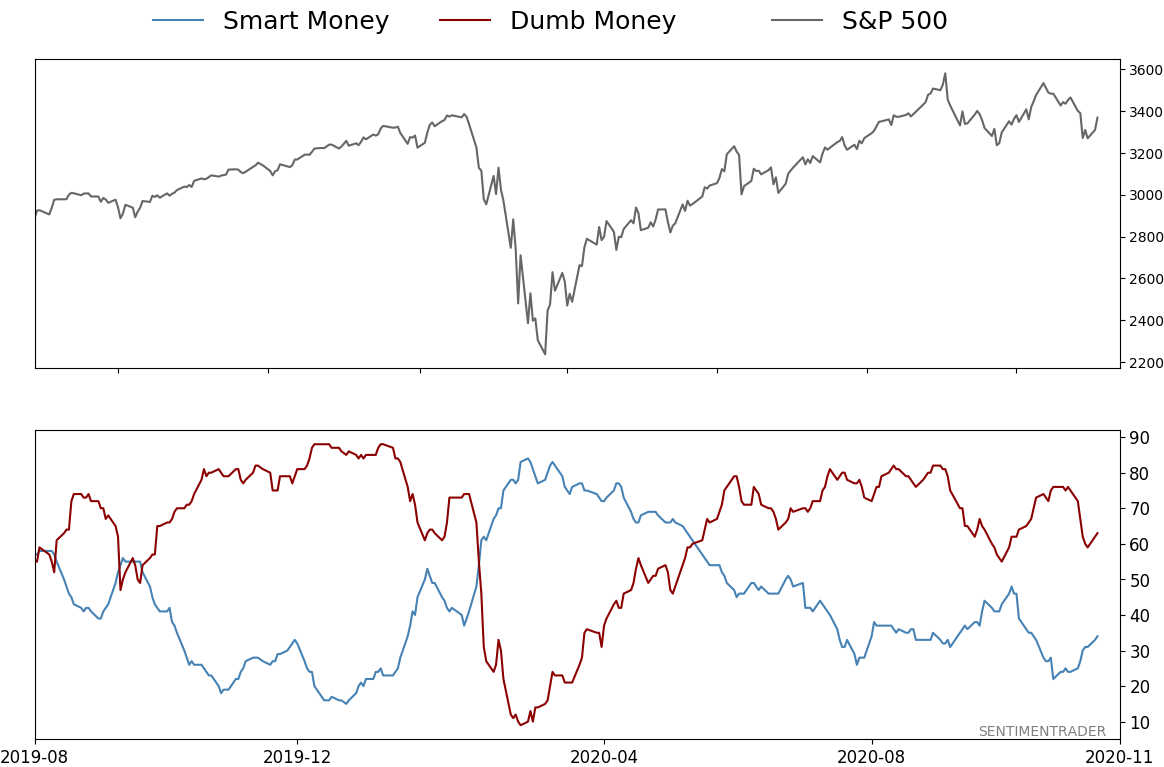
Smart Money Confidence: 34%
Dumb Money Confidence: 63%
|
|
Risk Levels
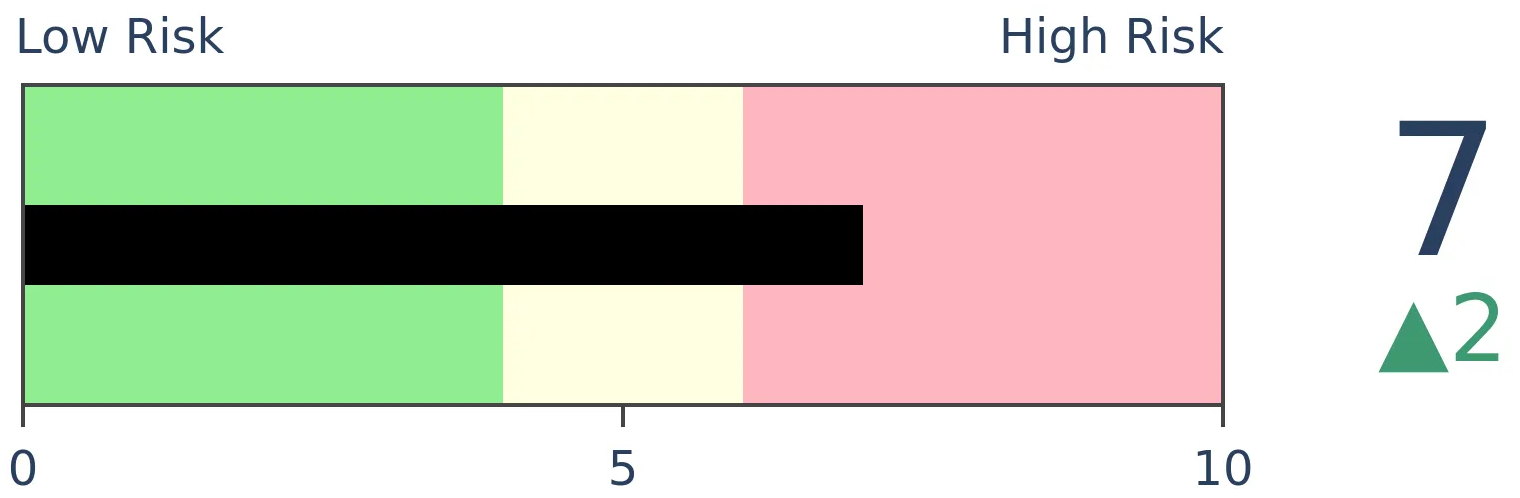
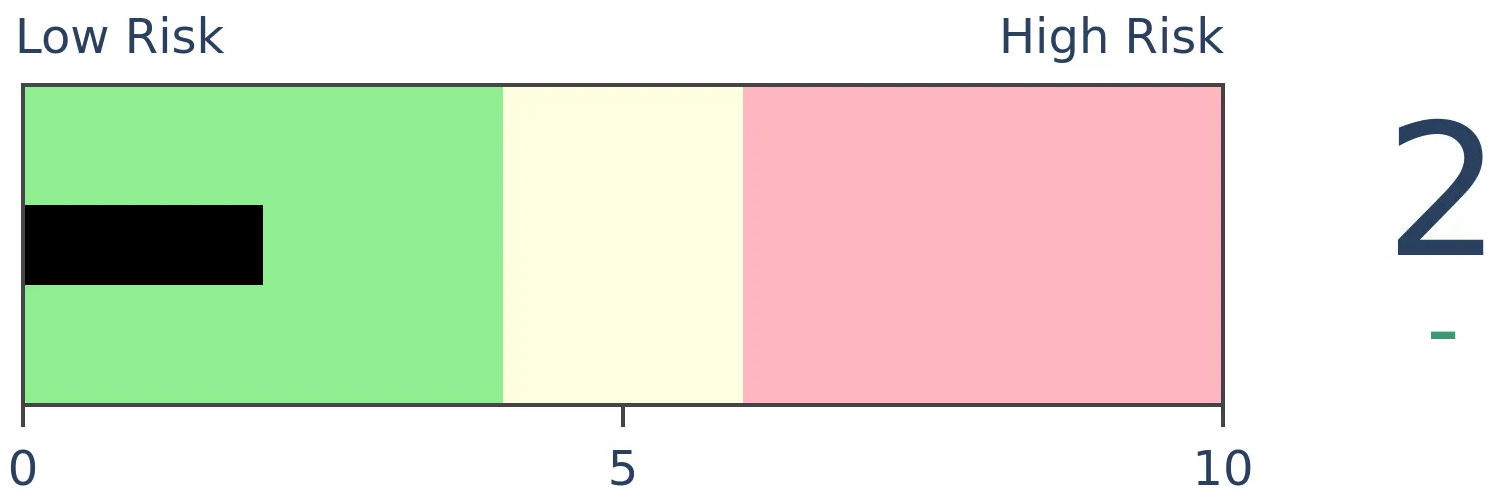
Stocks Short-Term
|
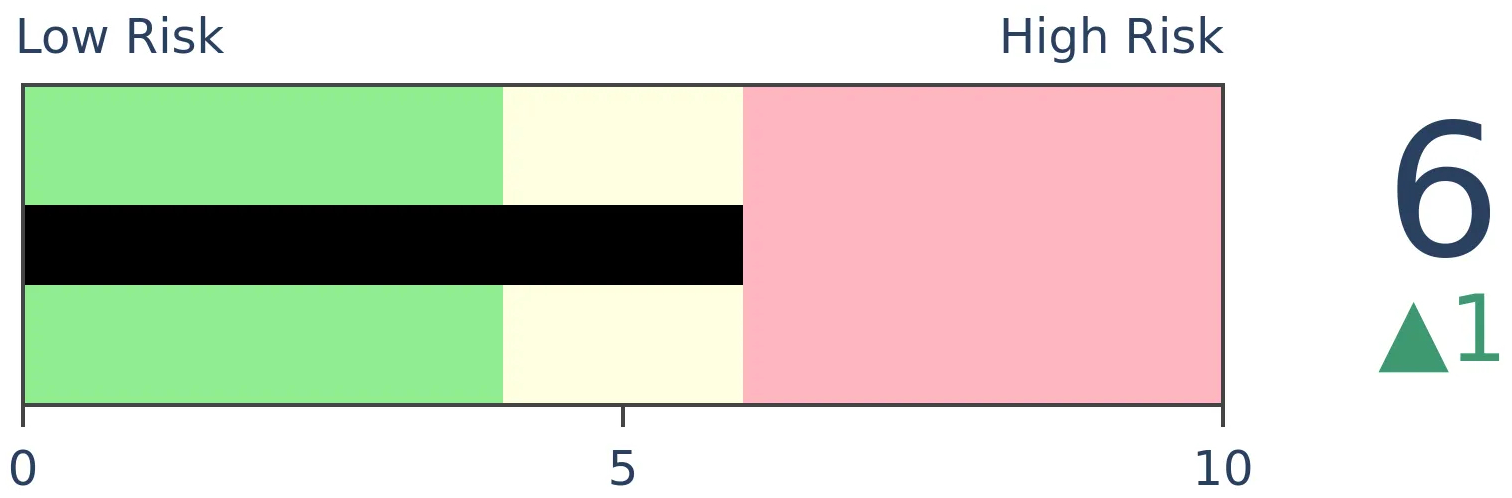
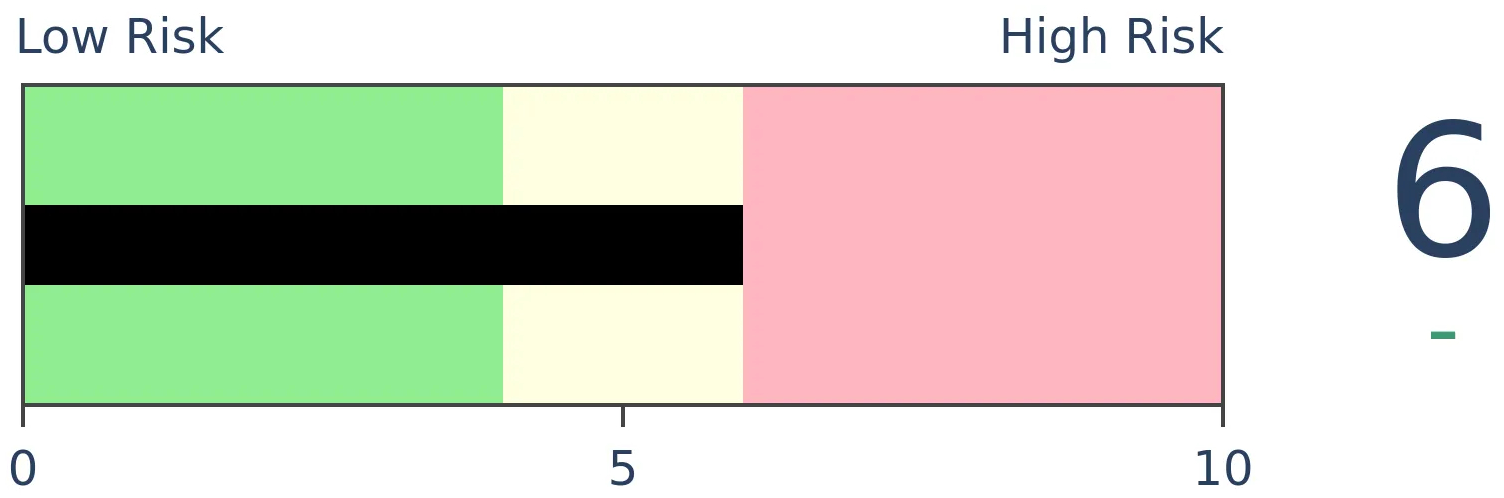
Stocks Medium-Term
|
|
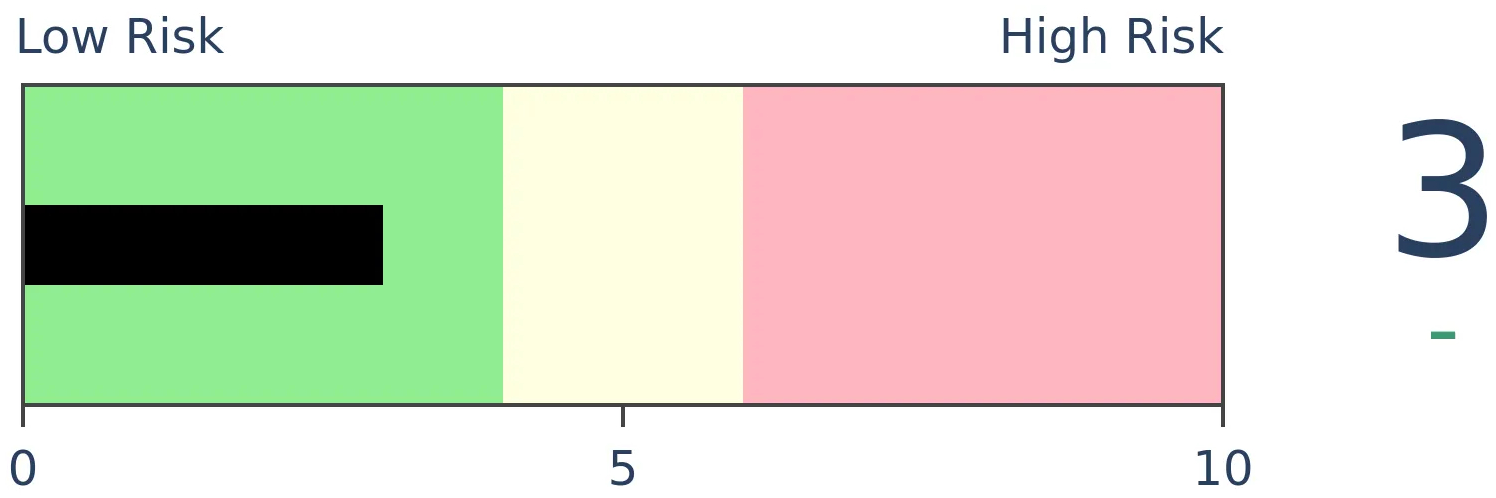
Bonds
|
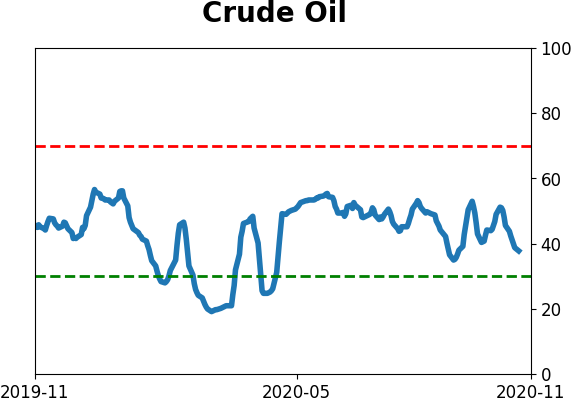
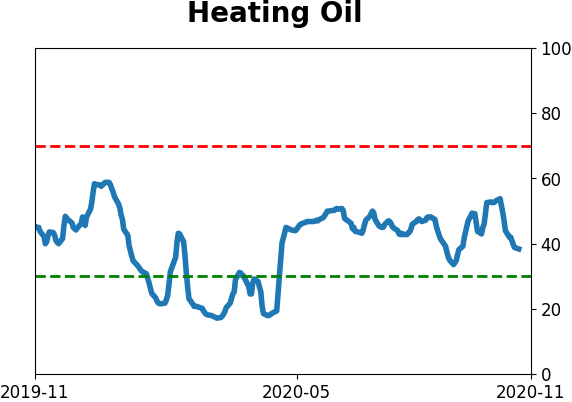
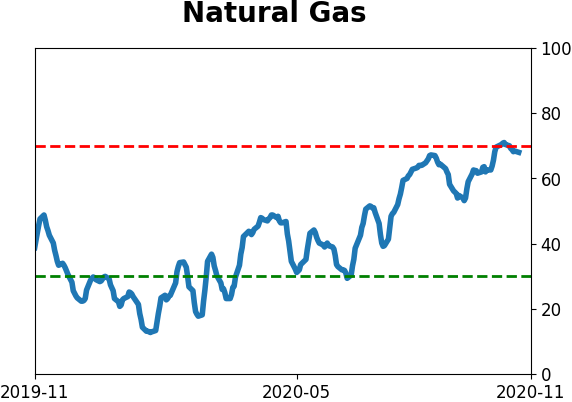
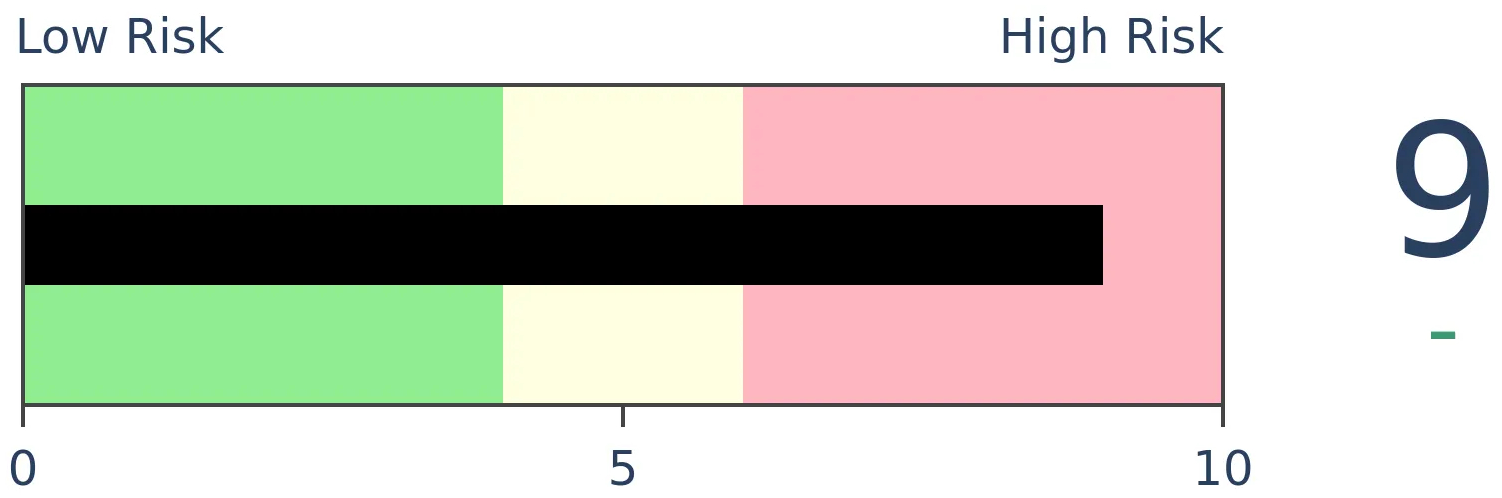
Crude Oil
|
|
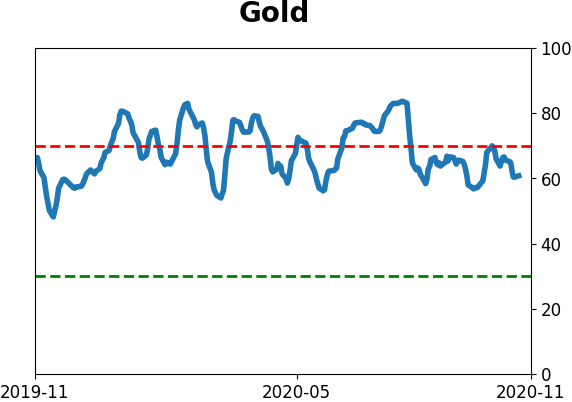
Gold
|
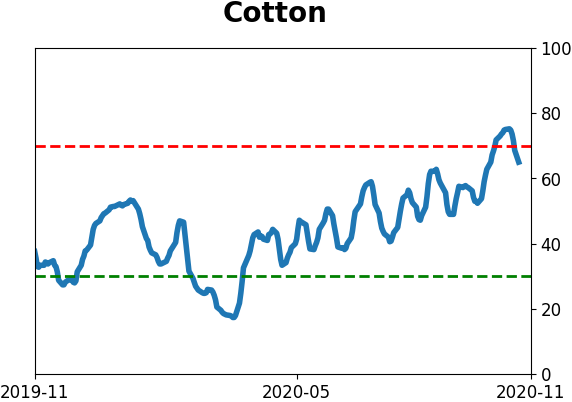
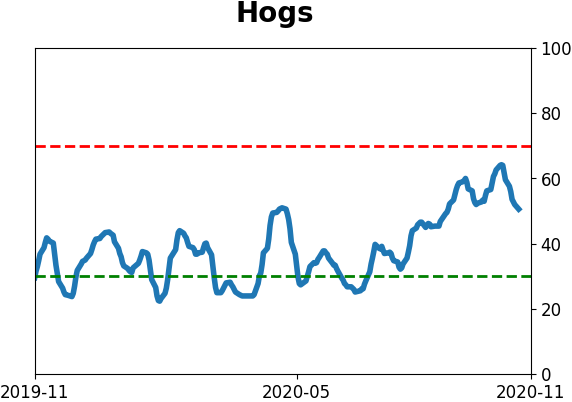
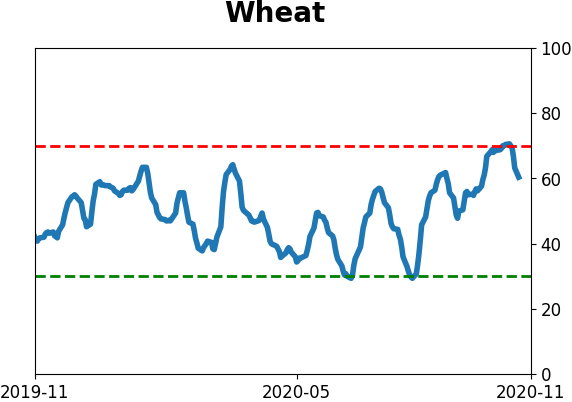
Agriculture
|
|
Research
BOTTOM LINE
Smart money hedgers in VIX futures seem to be betting that volatility is going to increase in the coming weeks as markets digest major news events. But their record in volatility is opposite of what it is in most other markets, and the VIX tends to decline after they establish big positions, as they have recently.
FORECAST / TIMEFRAME
None
|
As we head into the uncertainty of the U.S. elections, one of the worries is that we'll suffer extreme moves in the weeks ahead. Depending on the source, that volatility could be due to a contested election, a split decision, or a blue wave. There are a whole lot of biases at work with those opinions.
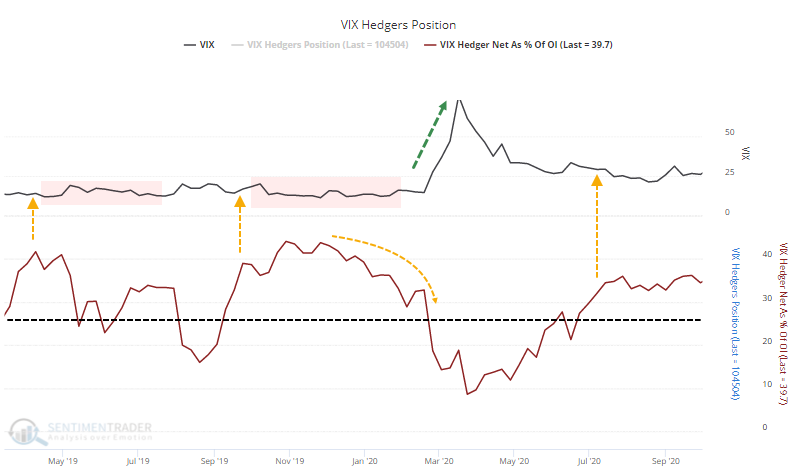
Whatever the outcomes, one worry is that speculators seem to be betting heavily that volatility will decline in the coming weeks. When speculators are betting heavily on something, it usually doesn't happen, which means that volatility should increase even though the VIX is already high.
The trouble with this worry is that speculators' positions in the VIX and other volatility contracts don't behave like they do in other markets. To a large degree, volatility speculators are the "smart money." We've seen that already with VIX Sentiment and it's also clear in traders' positions in VIX futures contracts.
Because commercial hedgers take the opposite sides of the trades of large and small speculators, a heavy short position by speculators means that hedgers are heavily long the VIX. In most contracts, a large net long position by hedgers would be a bullish event, but that hasn't been the case in the VIX. It's a rare case of the "smart money" not being very smart when holding an extreme position in a market.
As of last Tuesday, hedgers were net long nearly 40% of the open interest in VIX contracts. That's almost a record high dating back to 2006 (there is some missing data from the CFTC in 2006 and 2009).
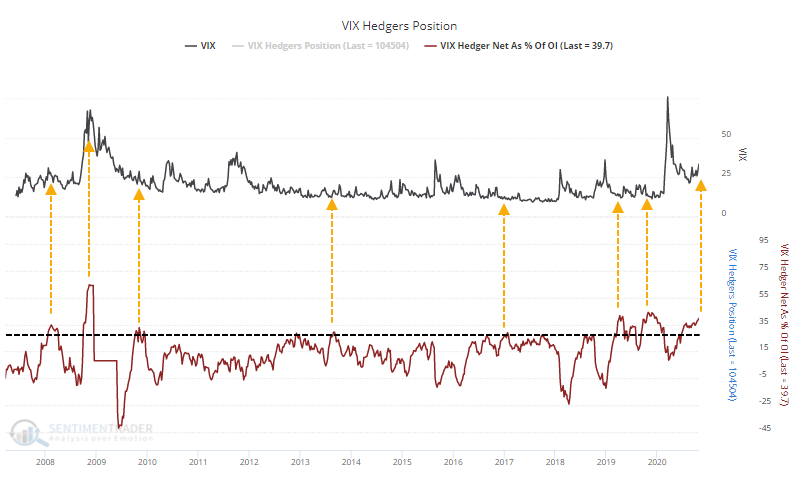
Let's zoom in on those dates when hedgers were net long more than 25% of the open interest in these contracts and see if it consistently resulted in an even higher level of volatility going forward.
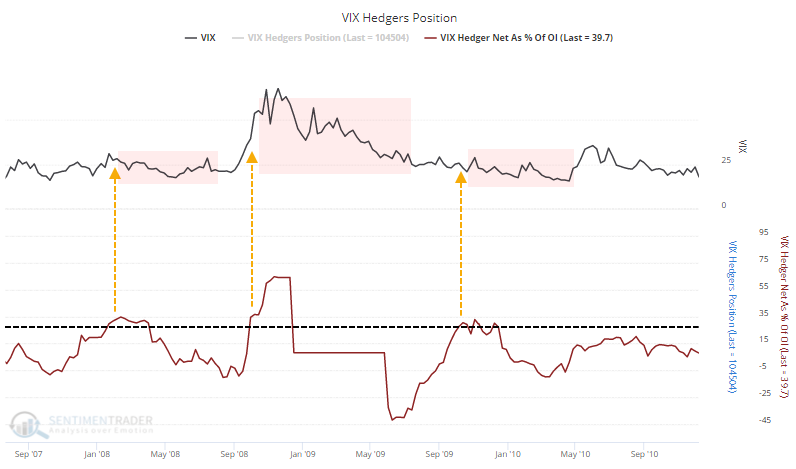
From 2007 through late 2009, hedgers got extremely long the VIX several times. Each time, the VIX declined over the next 3-6 months.
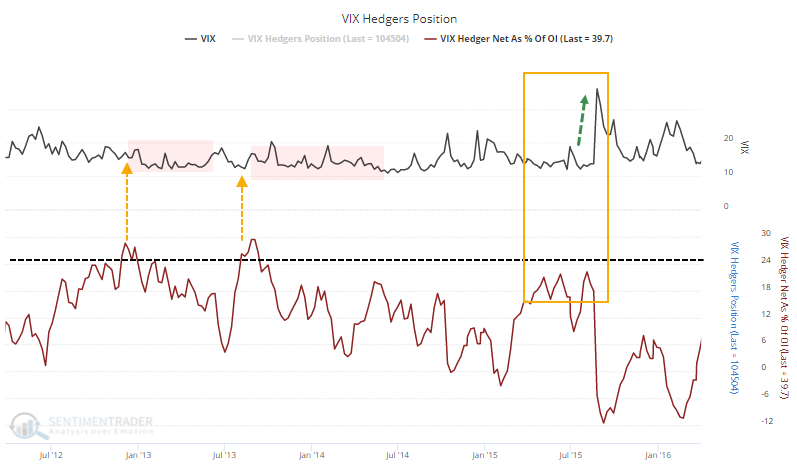
From 2012 - 2016, hedgers didn't often establish a major long position in the VIX, but when they did, volatility dropped. There were a few little spikes of a few percent in the VIX but no major events. They got kind of long from May through August of 2015, which eventually resulted in the VIX jumping from around 13 to above 35 in late August, but suggesting that hedgers were anticipating this is a big stretch.
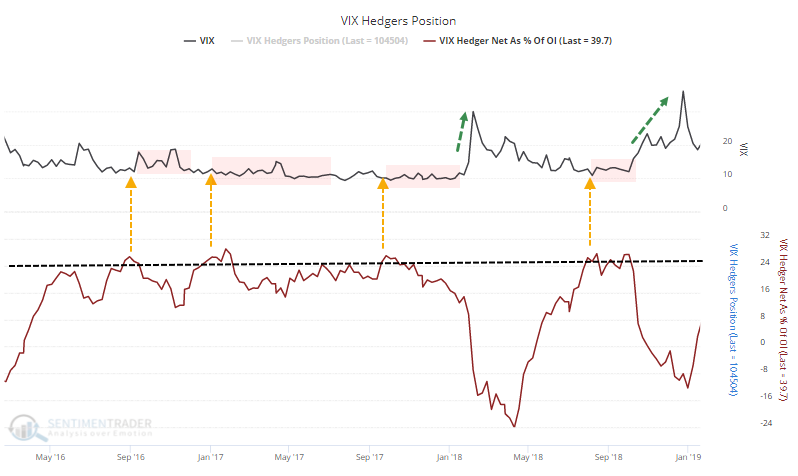
From 2016 - 2018, there were a few instances of hedgers getting long the VIX, and mostly it ended up leading to nothing. Volatility basically flatlined in the months after these extreme positions. It eventually ended up leading to a big spike in volatility in February 2018, but that was 4 months after hedgers had established their major long position, and was already mostly unwound it by the time volatility spiked. Same goes for the increase in the VIX later that year.
In recent years, hedgers have consistently been net long the VIX, and it's mostly led to nothing. The big exception, of course, is the February - March pandemic chaos, but hedgers had been holding a large percentage of open interest for months before that and the VIX didn't spike until they had already greatly reduced their positions.
As noted on Monday, I have no idea what's going to happen with the elections or how investors will react in response. The big caveat here is that we should not assume that any of the news flow will necessarily lead to an even bigger and sustained increase in volatility, just because the "smart money" seems to be betting that way.
BOTTOM LINE
On Monday, crude oil enjoyed a historic reversal from a 90-day low. The few other times it reversed like this, oil and energy companies took off to the upside. The biggest caveat is that lesser reversals didn't show a consistent tendency to lead to good returns.
FORECAST / TIMEFRAME
None
|
Traders in the oil patch finally got a bit of relief on Monday after an early scare.
The price of crude oil plunged more than 5% (again) and hit its lowest level in more than 90 sessions (again) before reversing enough to erase all of the intraday losses and then some. Oil futures ended up closing nearly 3% higher than the previous close.
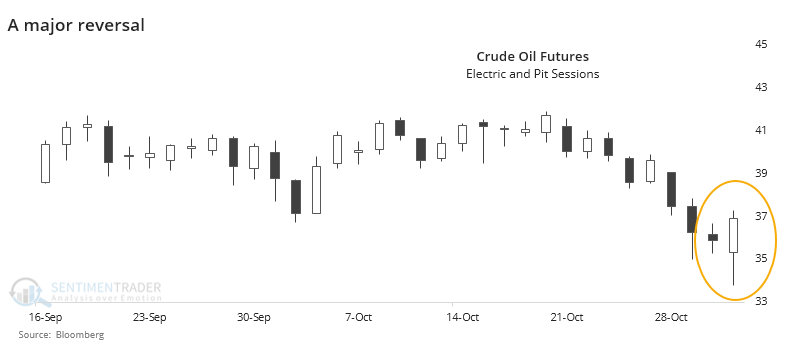
In commodity markets, the concepts of "open" and "close" aren't as clear-cut due to pit versus electronic trading and which specific contracts are being used. For these purposes, we're using front-month, roll-adjusted crude oil futures, including pit and electronic sessions, as computed by Bloomberg.
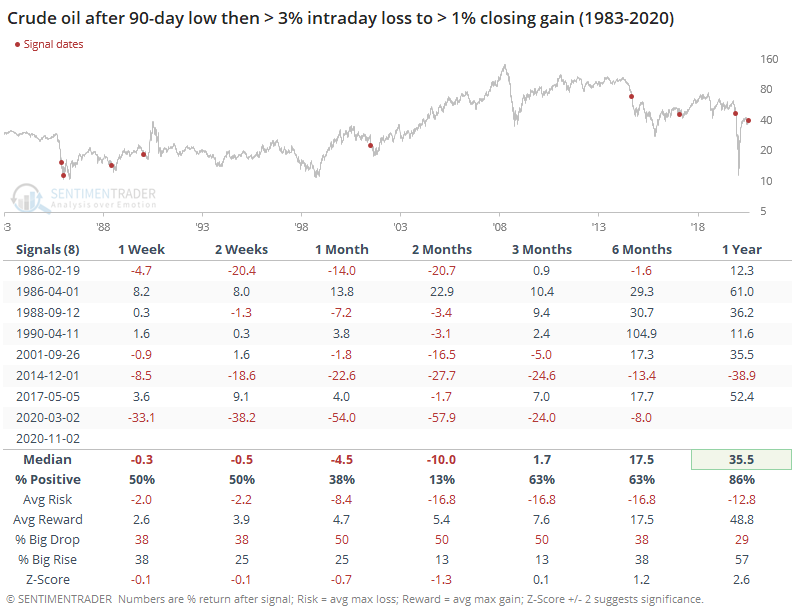
Using these parameters, Monday's reversal was one of the most impressive ever for crude. The few other times it managed such a feat proved to be a good sign going forward.
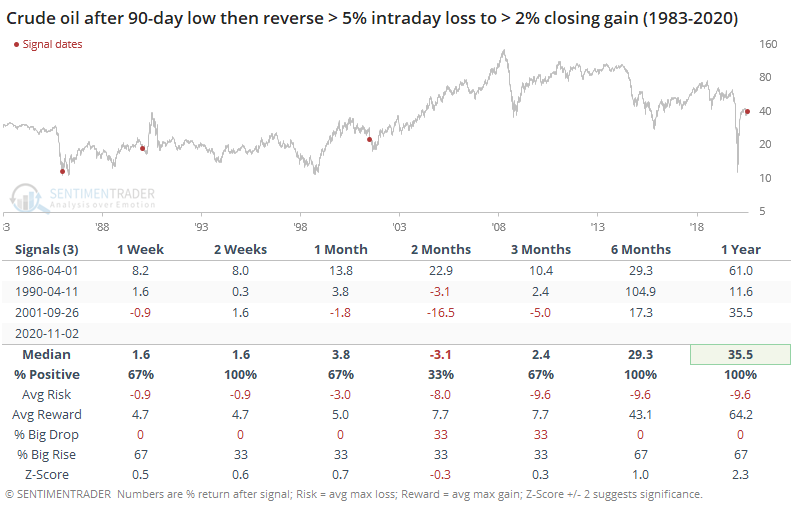
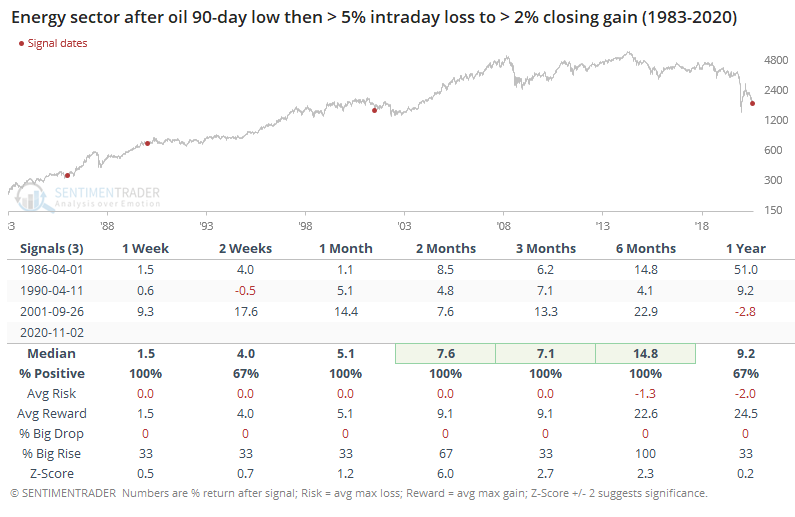
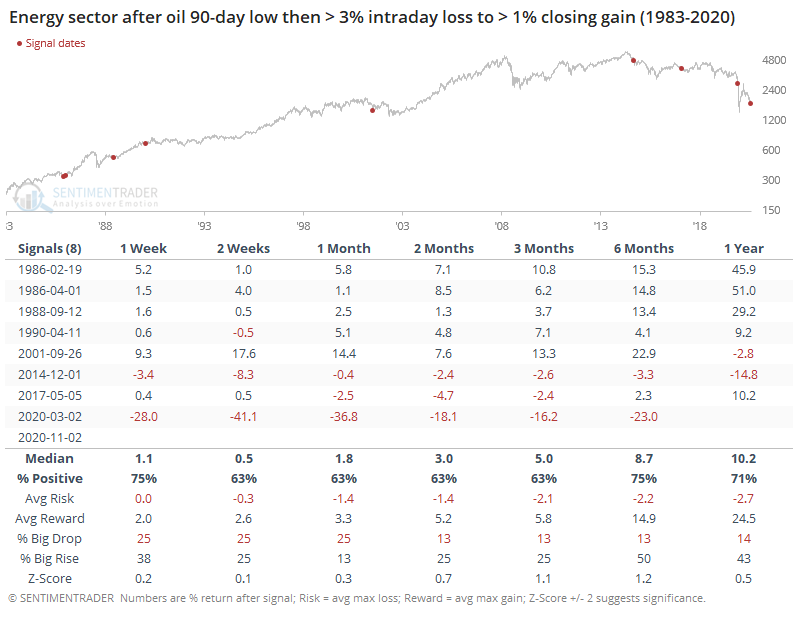
It was an even better sign for those companies most dependent on the price of oil. Over the next 2-6 months, energy companies enjoyed large gains with very limited losses.
A sample size of 3 is hard to rely on, so let's expand the sample by relaxing the parameters. Here, we'll look at intraday losses of 3% or more, with a reversal to close higher by more than 1% for the day.
These were...not so great. Over the next 2 months, oil reversed the reversal almost every time, with only April 1986 proving to be a lasting bottom.
Despite the losses in oil, energy companies mostly held up okay. The biggest exception was the most recent when the sector was grossly oversold then Russia and Saudia Arabia engaged in a geopolitical spat.
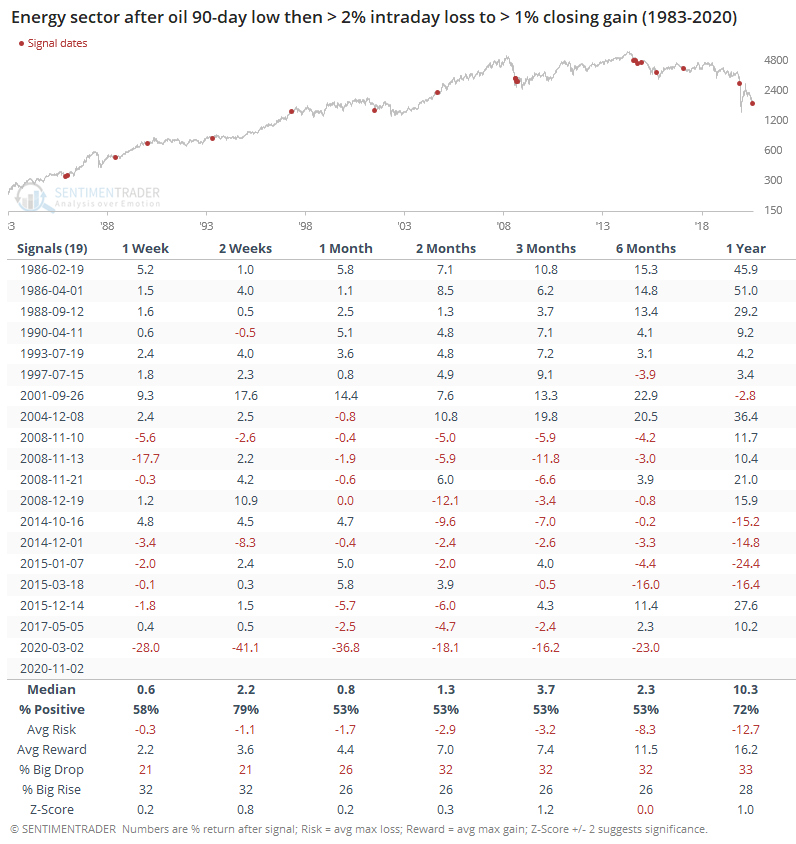
If we relax even further to generate a larger sample, the same pattern holds true. These smaller reversals were not a reliable sign that selling pressure was exhausted in oil.
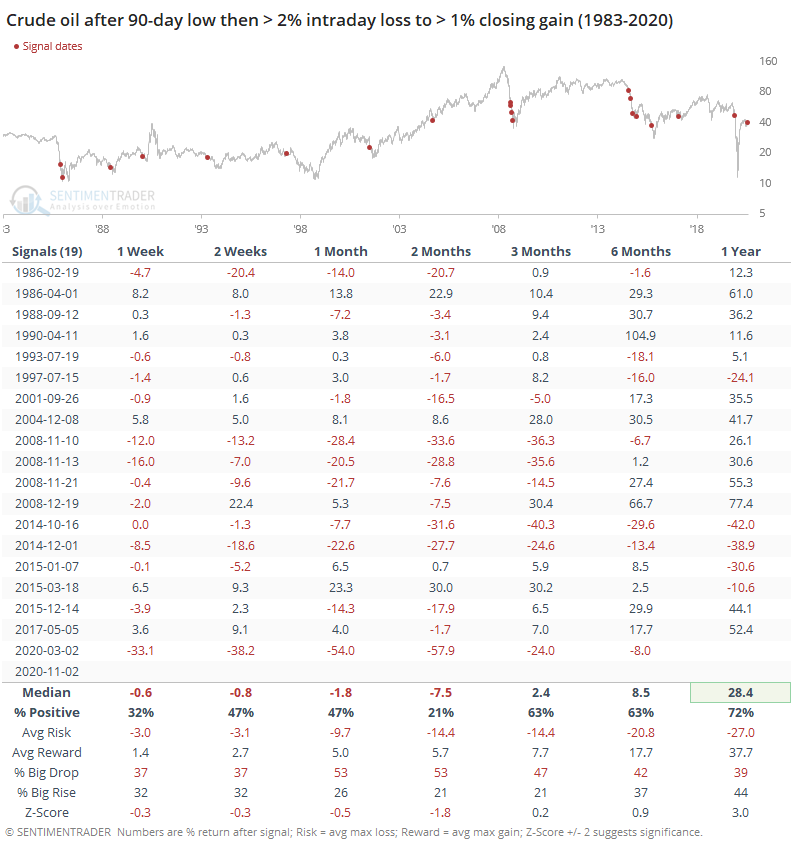
Energy companies typically rallied anyway, but the positive overall averages are almost entirely due to signals before 2008. Since then, forward returns were almost exclusively negative thanks to the extended bear market in these shares.
It's tempting to look at Monday's reversal and extrapolate it. Perhaps it's big enough, from such a place of despair, that it will trigger short-covering and more evidence that conditions are shifting from horrible to not-quite-so-horrible. There just isn't enough evidence here to include it as a positive going forward.
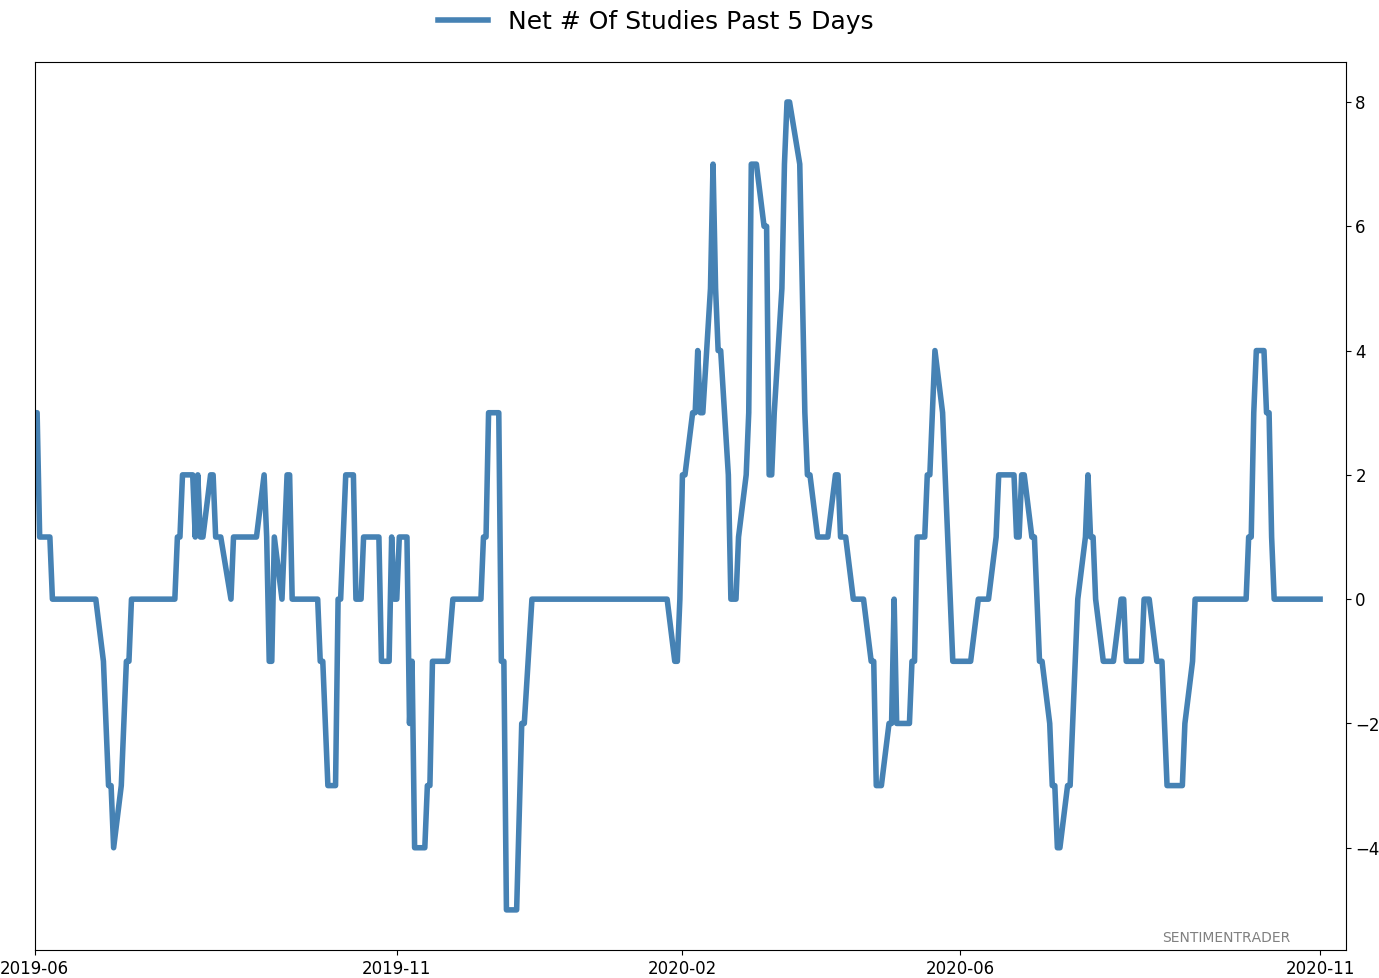
Active Studies
| Time Frame | Bullish | Bearish | | Short-Term | 0 | 0 | | Medium-Term | 4 | 8 | | Long-Term | 48 | 2 |
|
Indicators at Extremes
Portfolio
| Position | Description | Weight % | Added / Reduced | Date | | Stocks | 15.6% RSP, 10.1% VWO, 7.5% XLE, 5.1% PSCE | 38.2 | Added 5% | 2020-10-15 | | Bonds | 10% BND, 10% SCHP, 10% ANGL | 29.7 | Reduced 0.1% | 2020-10-02 | | Commodities | GCC | 2.4 | Reduced 2.1%
| 2020-09-04 | | Precious Metals | GDX | 4.7 | Added 5% | 2020-09-09 | | Special Situations | | 0.0 | Reduced 5% | 2020-10-02 | | Cash | | 25.0 | | |
|
Updates (Changes made today are underlined)
After the September swoon wrung some of the worst of the speculation out of stocks, there are some signs that it's returning, especially in the options market. It's helped to push Dumb Money Confidence above 70%. A big difference between now and August is that in August, there was a multitude of days with exceptionally odd breadth readings. Some of the biggest stocks were masking underlying weakness. Combined with heavy speculative activity, it was a dangerous setup. Now, we've seen very strong internal strength, in the broad market, as well as tech and small-cap stocks. Prior signals almost invariably led to higher prices. That's hard to square with the idea that forward returns tend to be subdued when Confidence is high, but that's less reliable during healthy market conditions, which we're seeing now (for the most part). I added some risk with small-cap energy stocks, due to an increasing number of positive signs in both small-caps and energy. This is intended as a long-term position.
RETURN YTD: -1.2% 2019: 12.6%, 2018: 0.6%, 2017: 3.8%, 2016: 17.1%, 2015: 9.2%, 2014: 14.5%, 2013: 2.2%, 2012: 10.8%, 2011: 16.5%, 2010: 15.3%, 2009: 23.9%, 2008: 16.2%, 2007: 7.8%
|
|
Phase Table
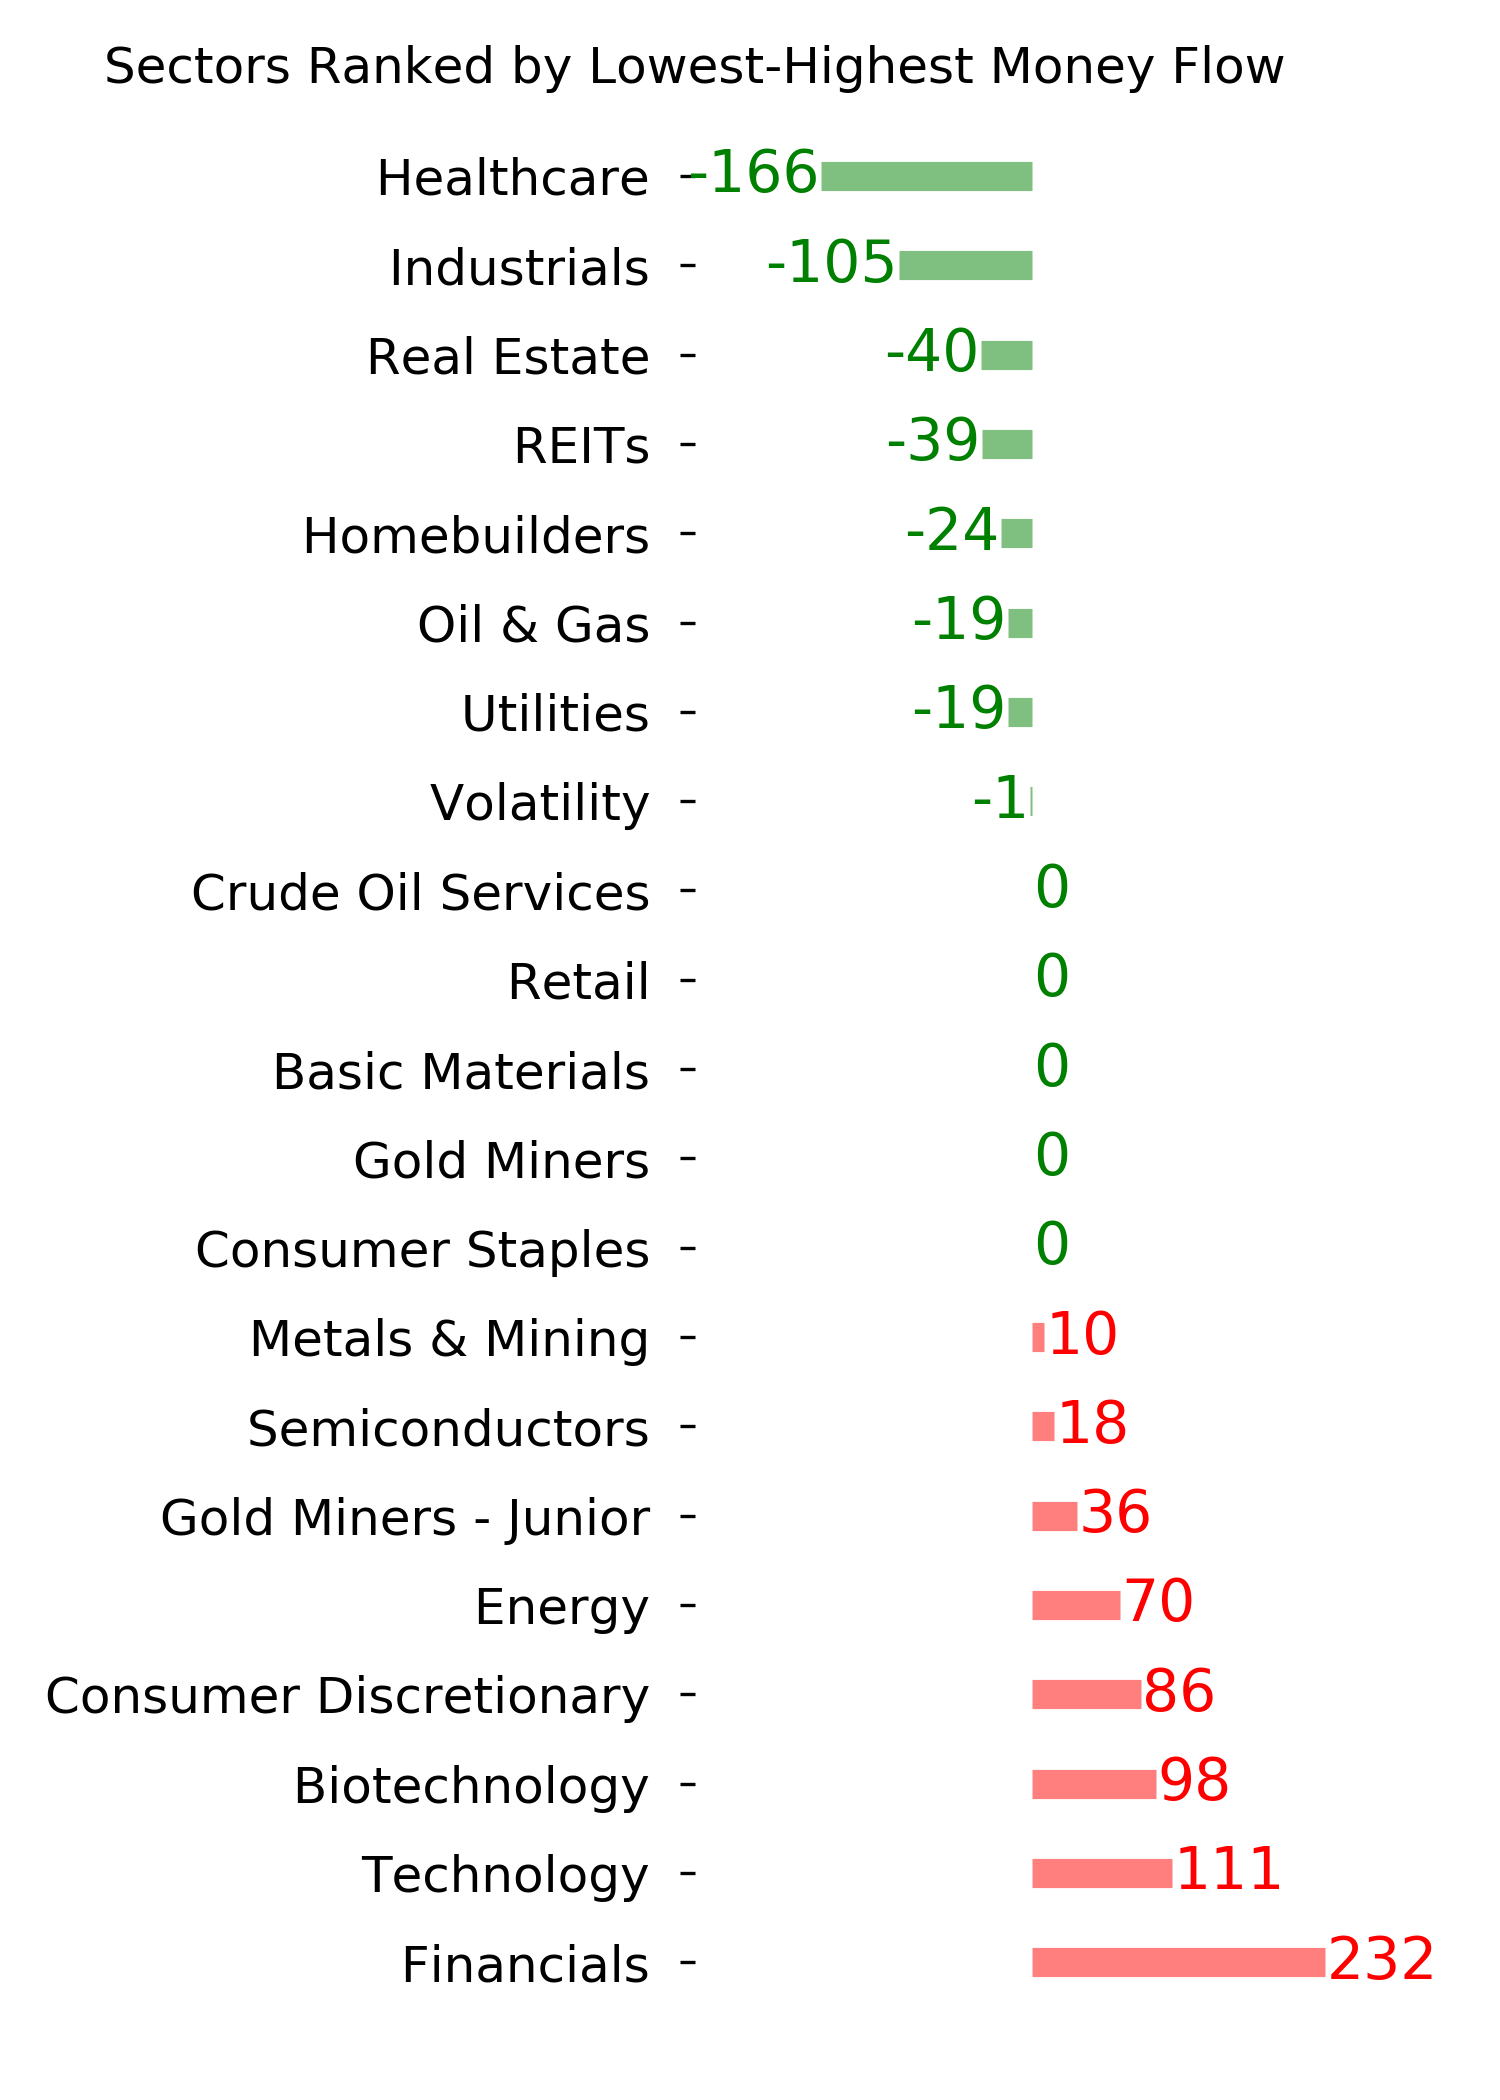
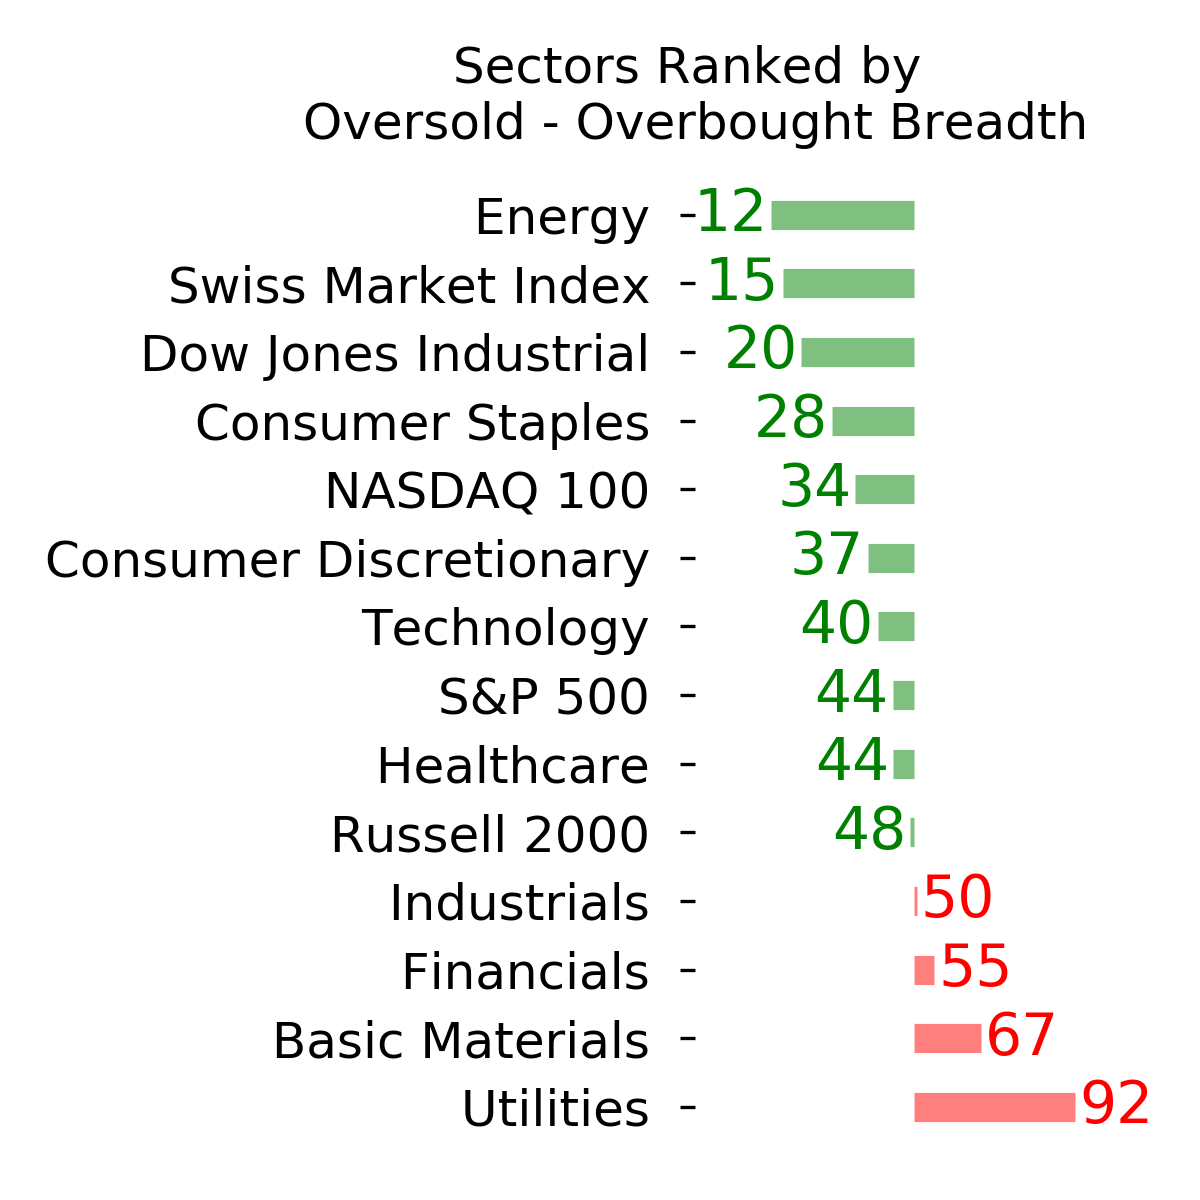
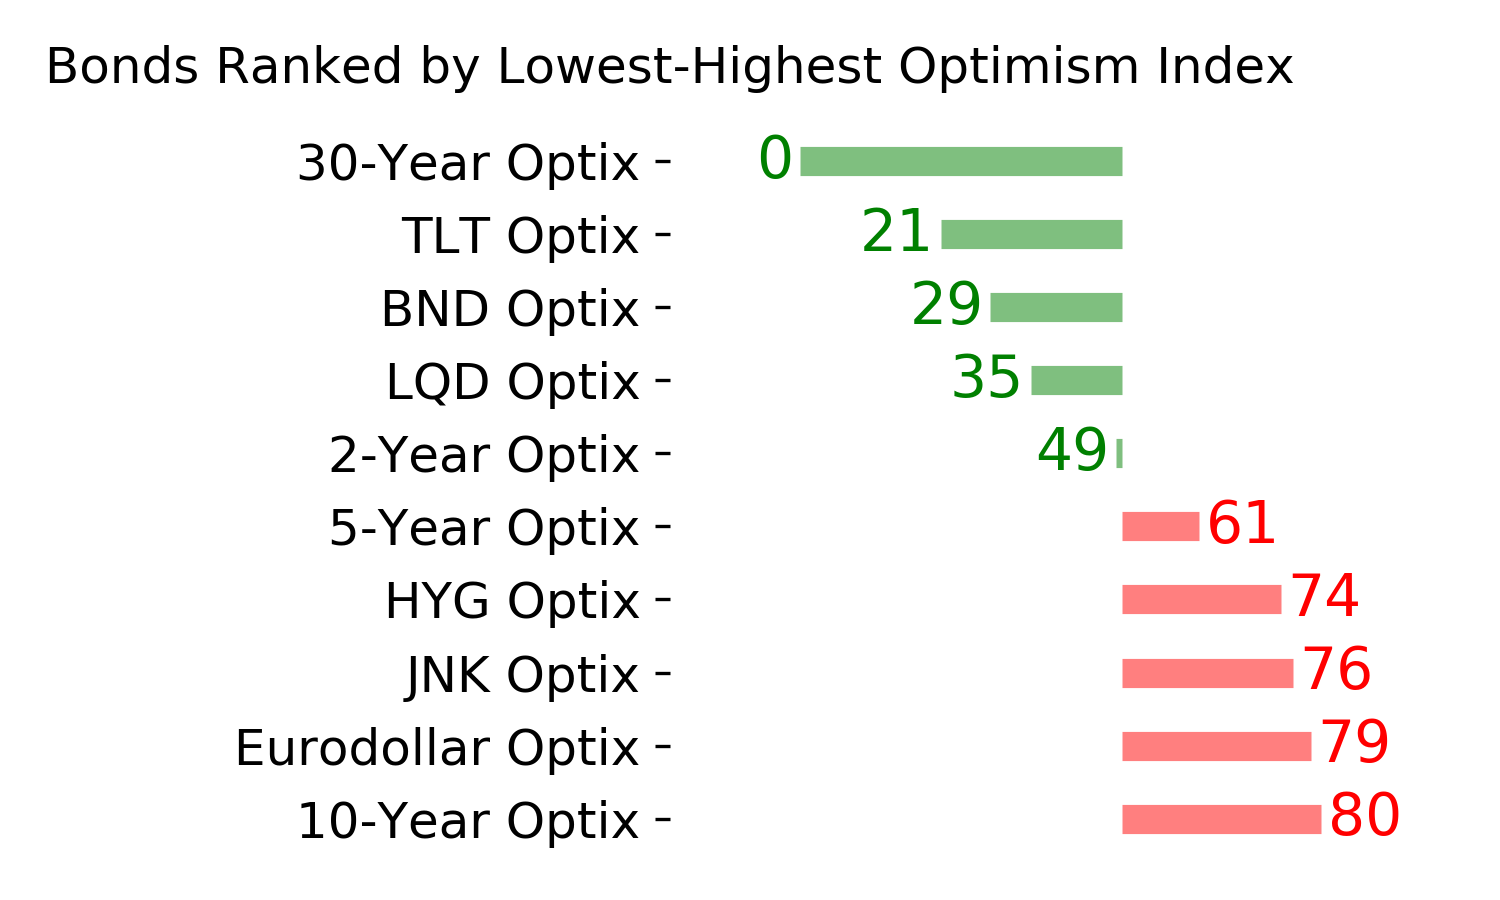
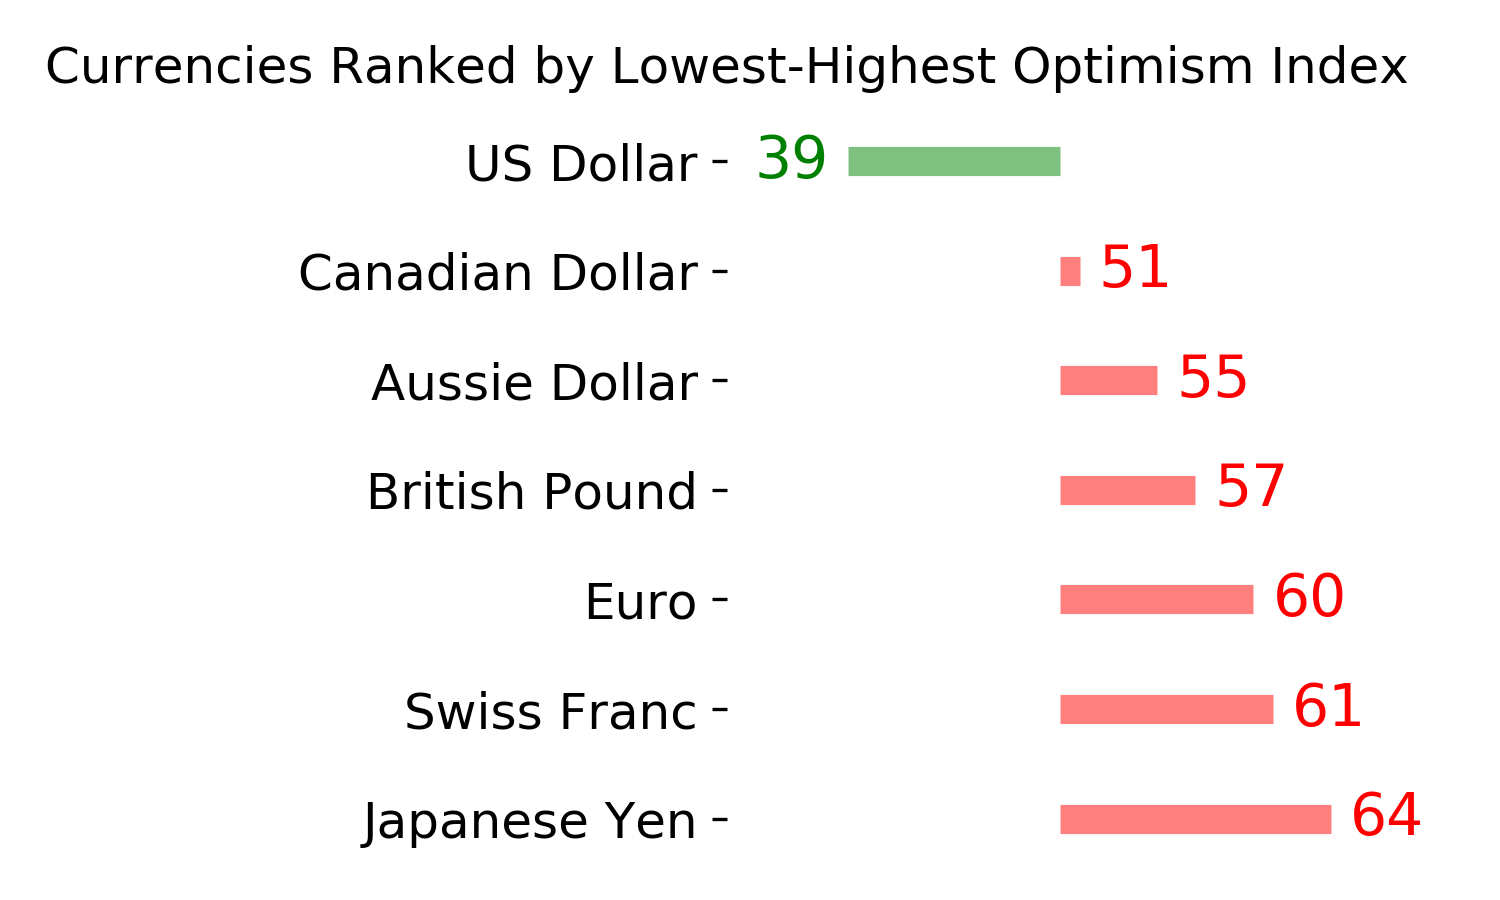
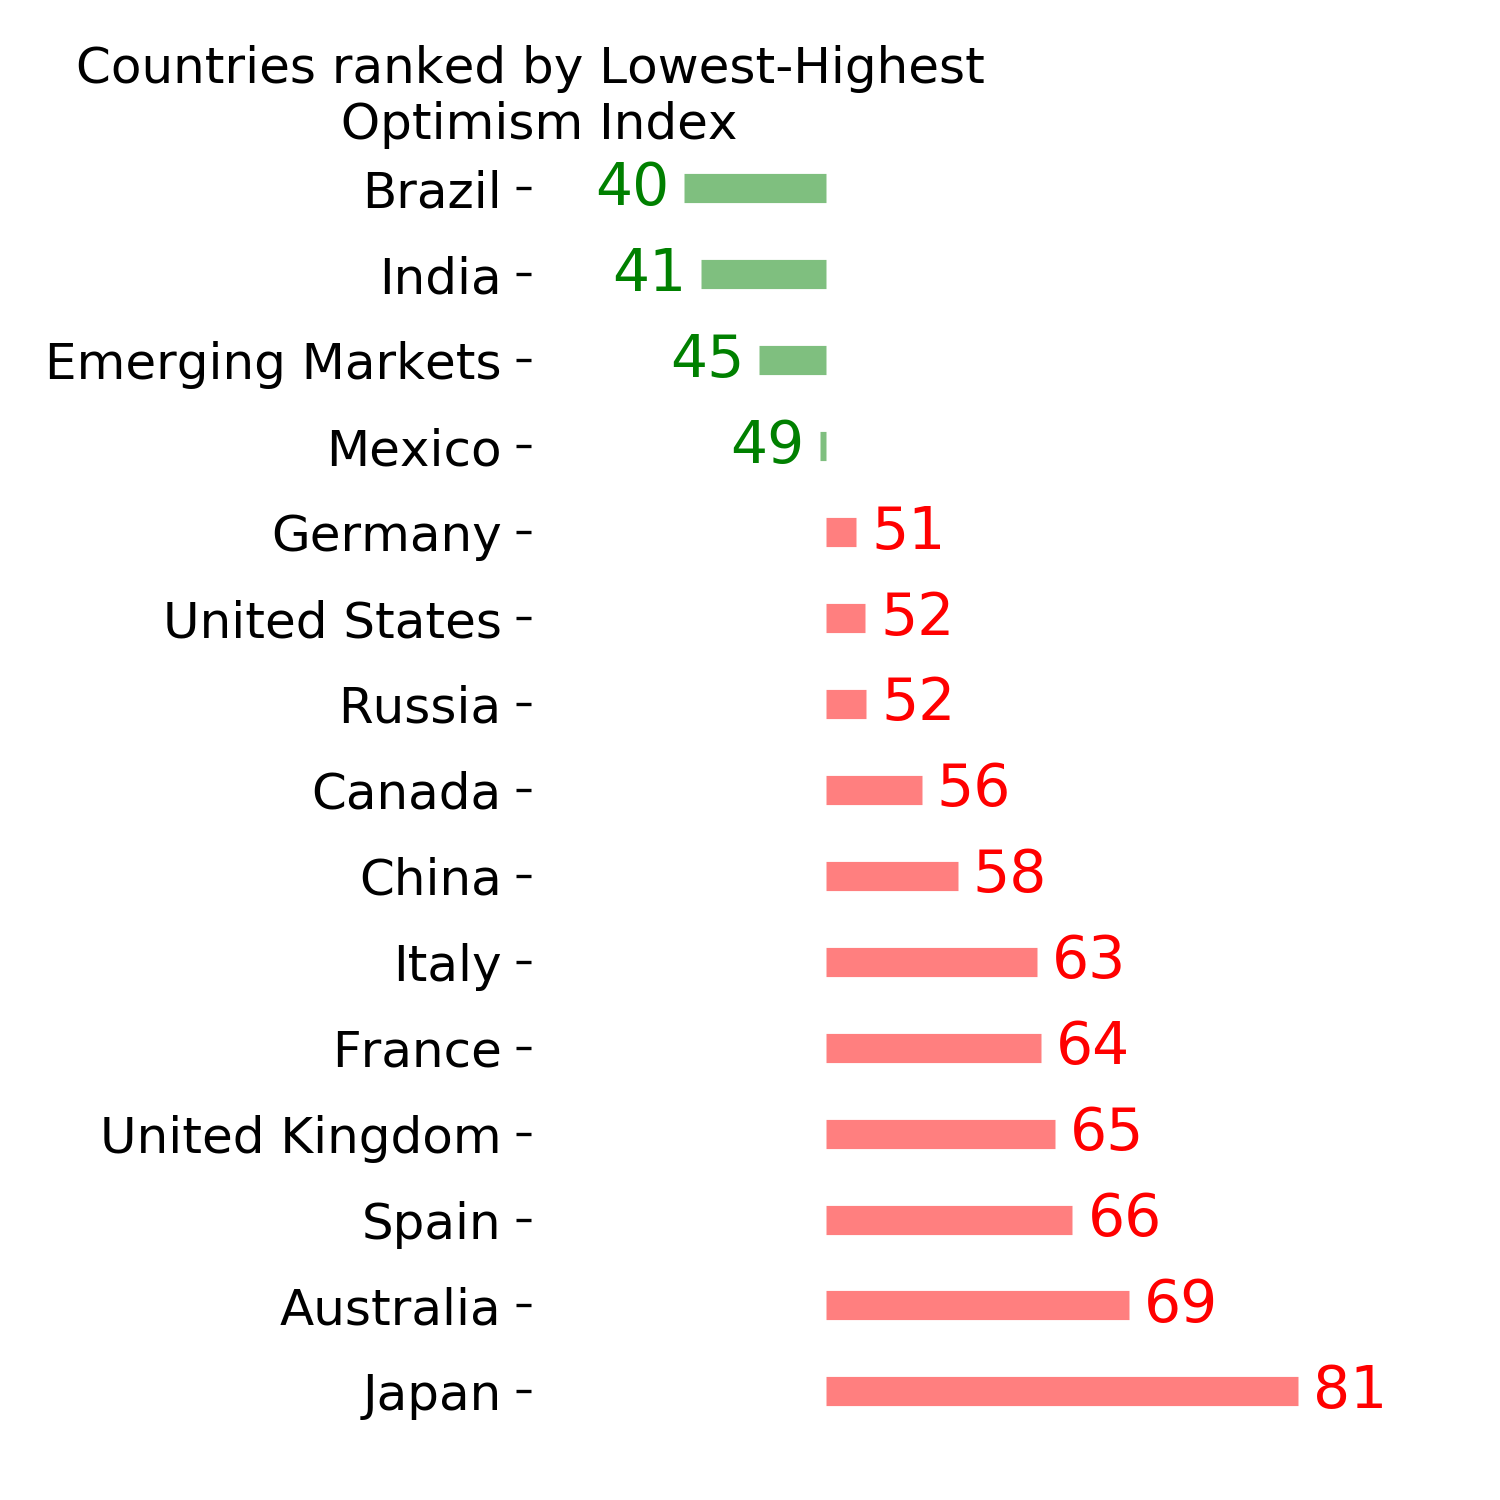
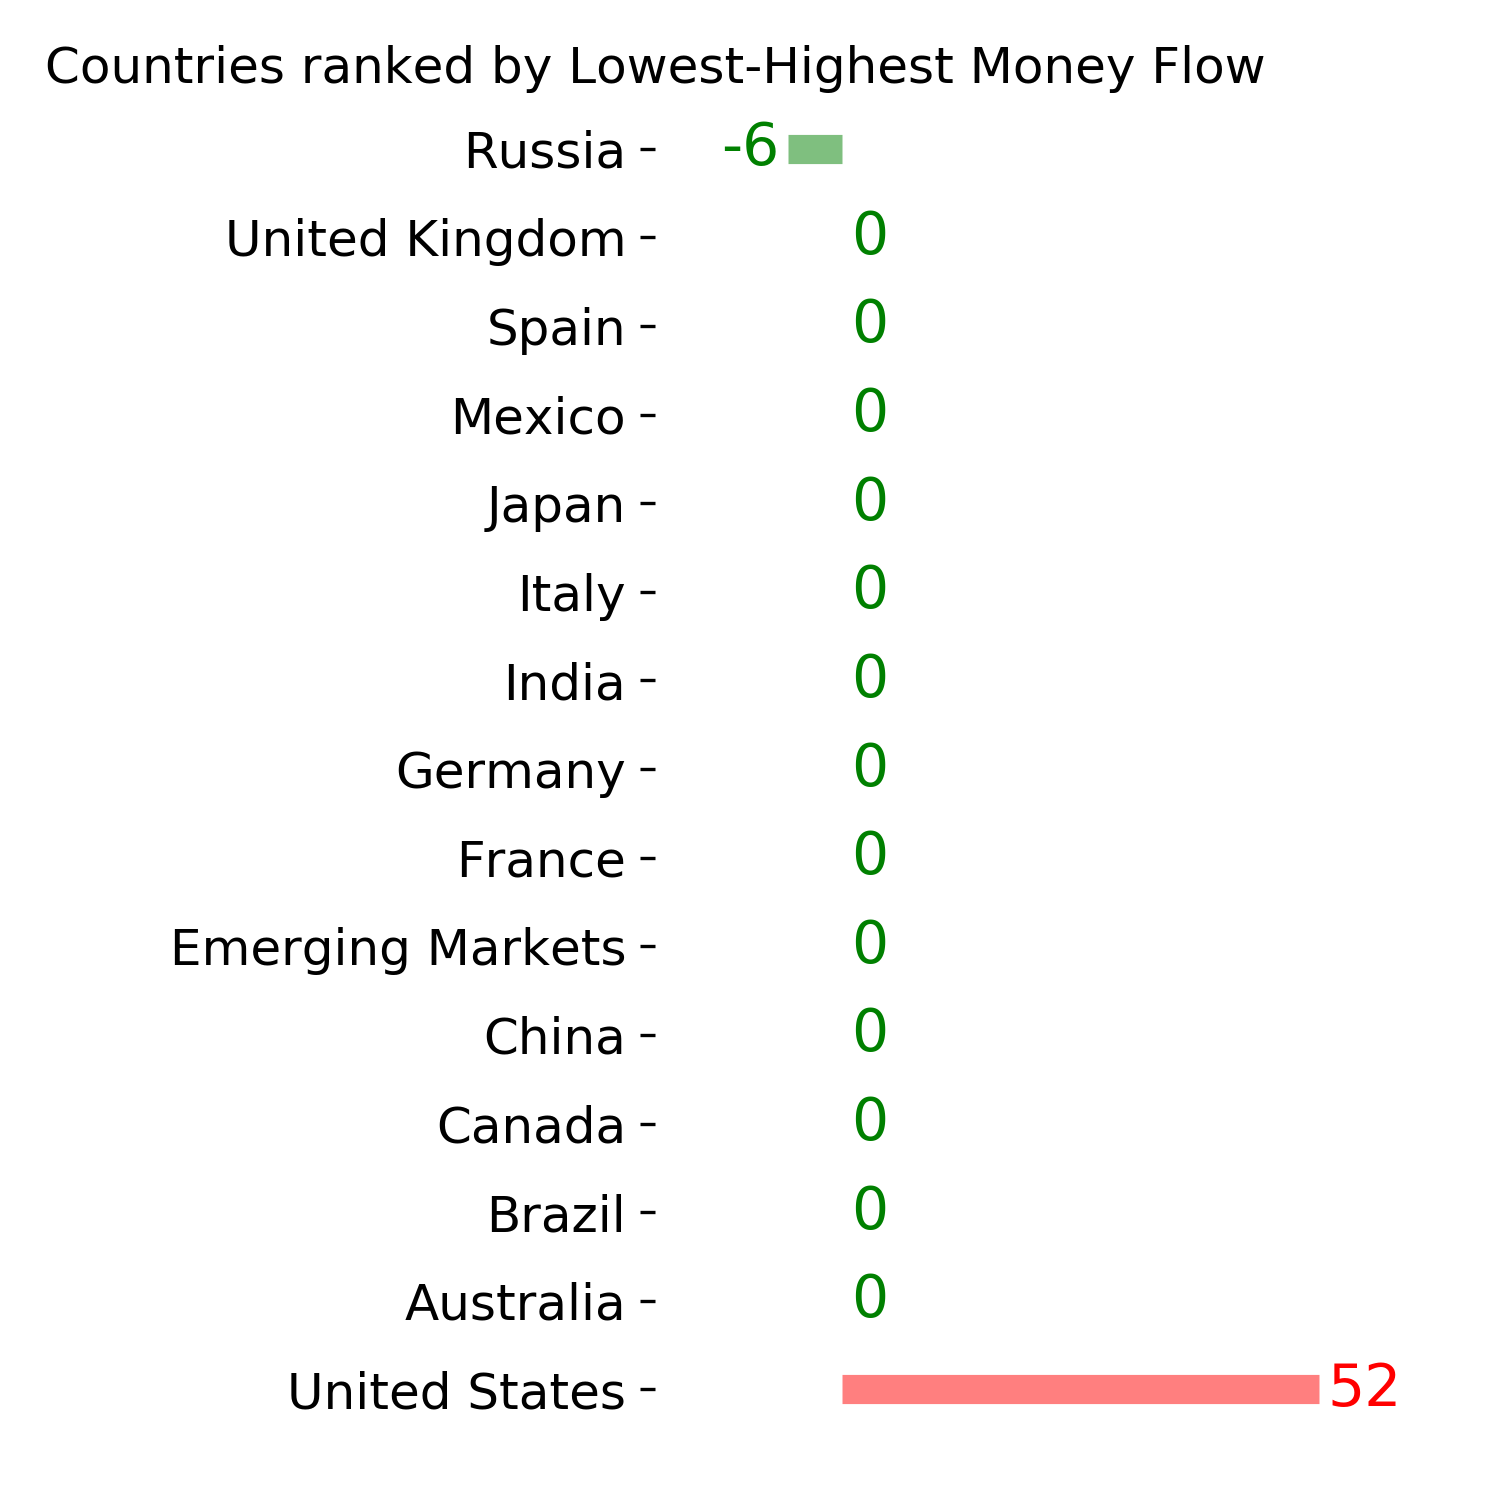
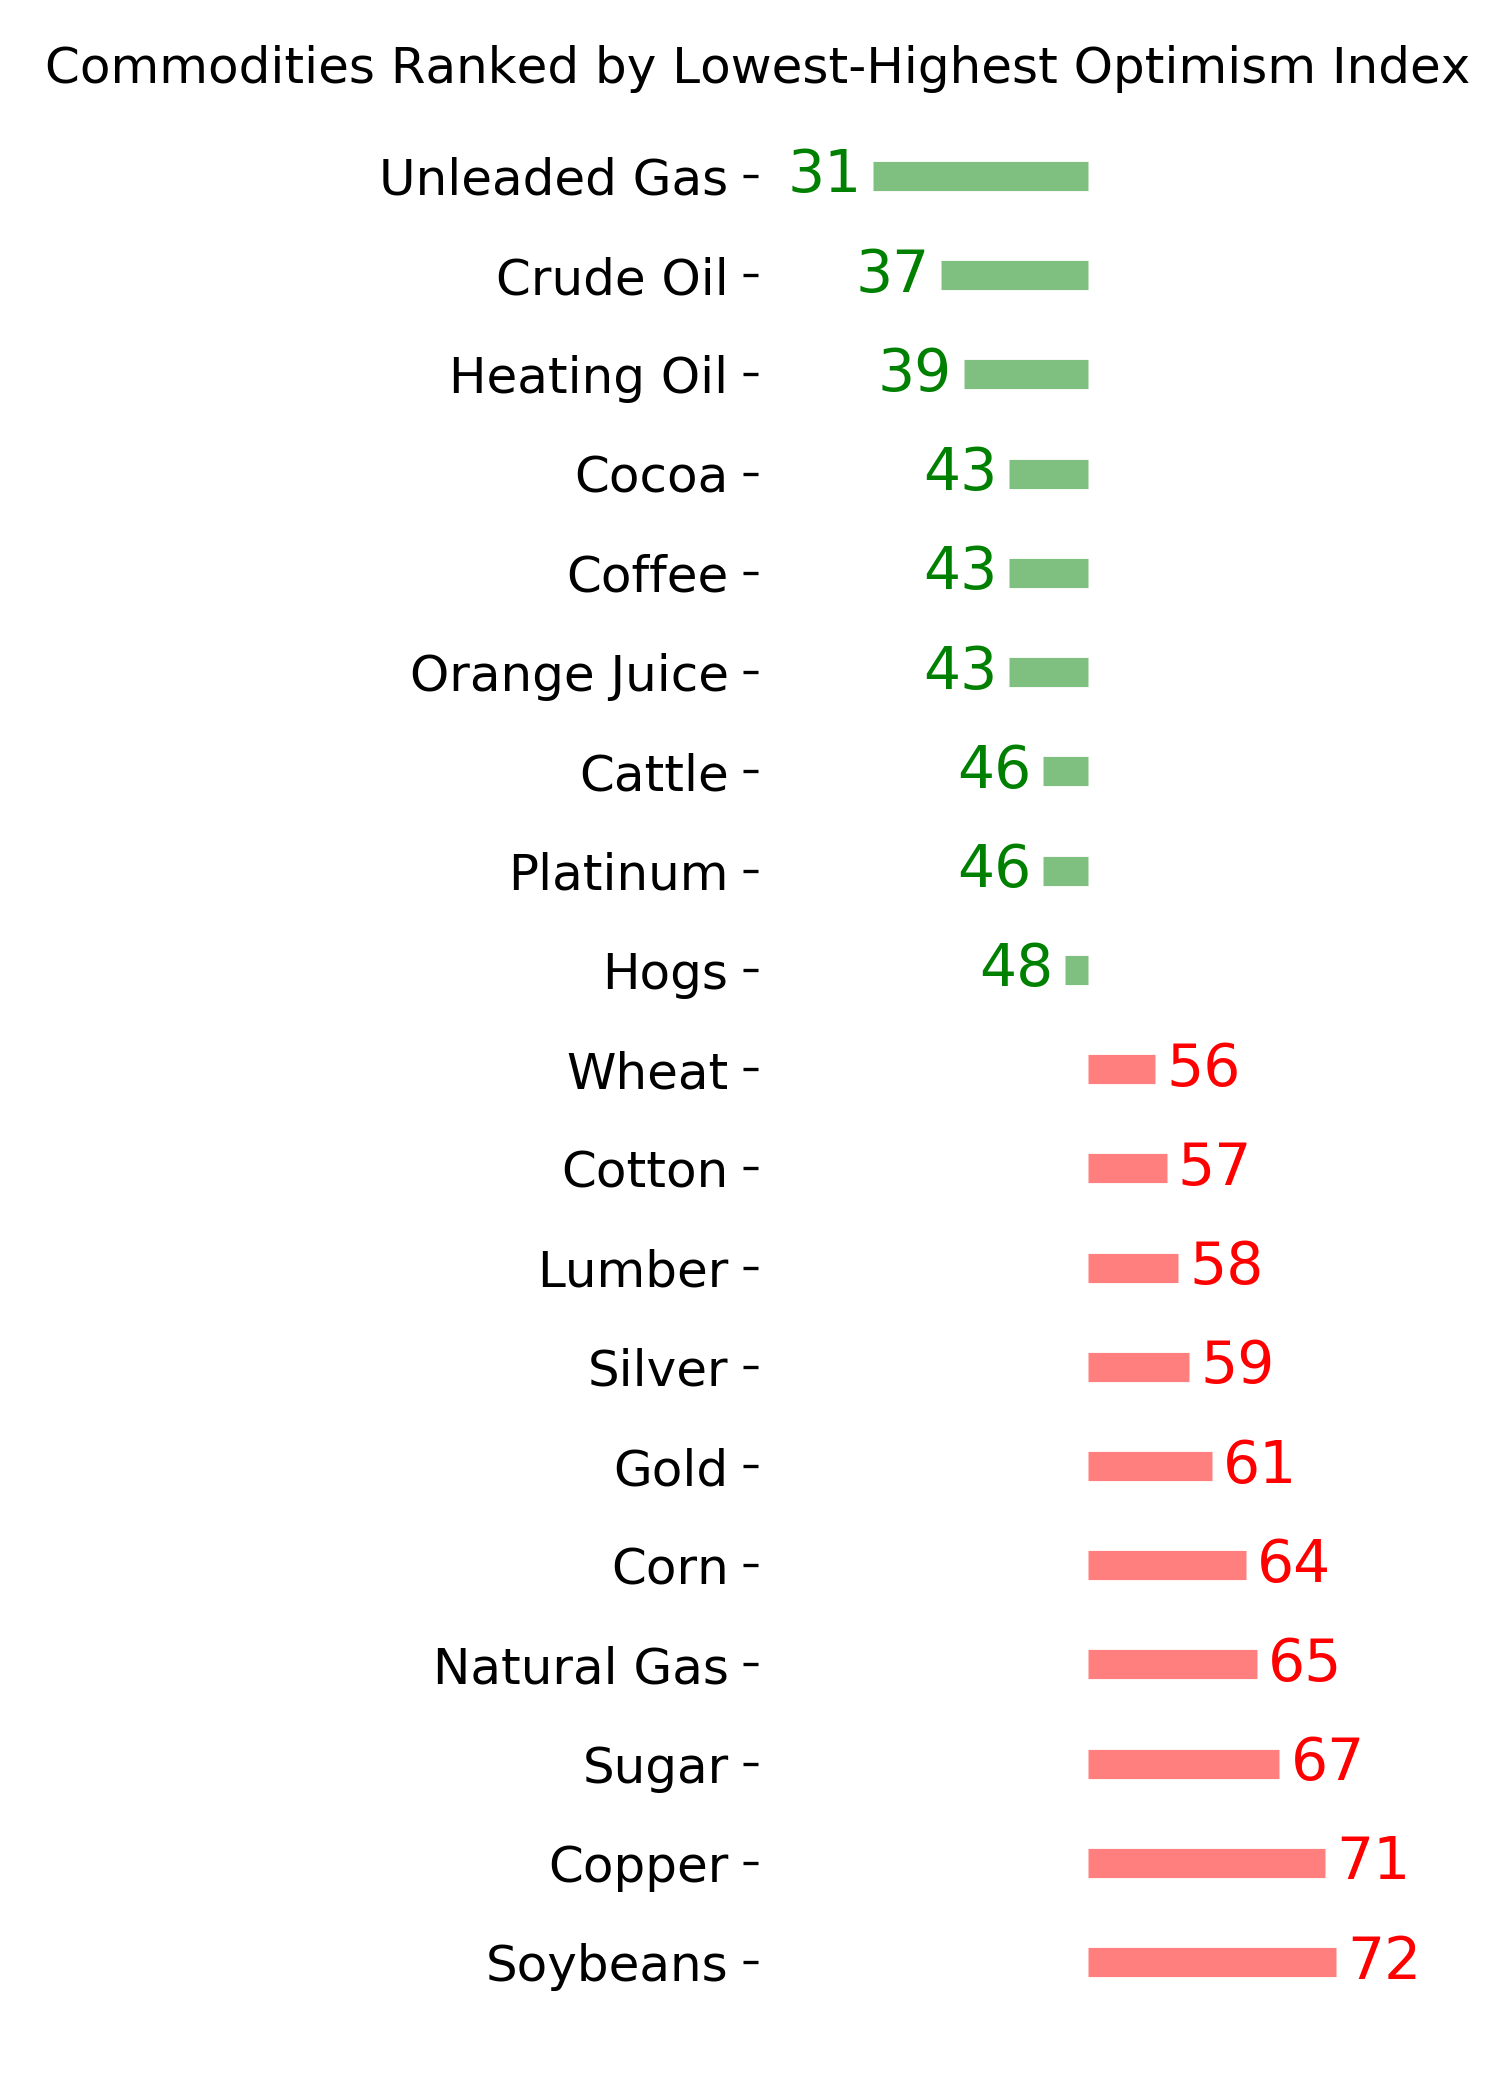
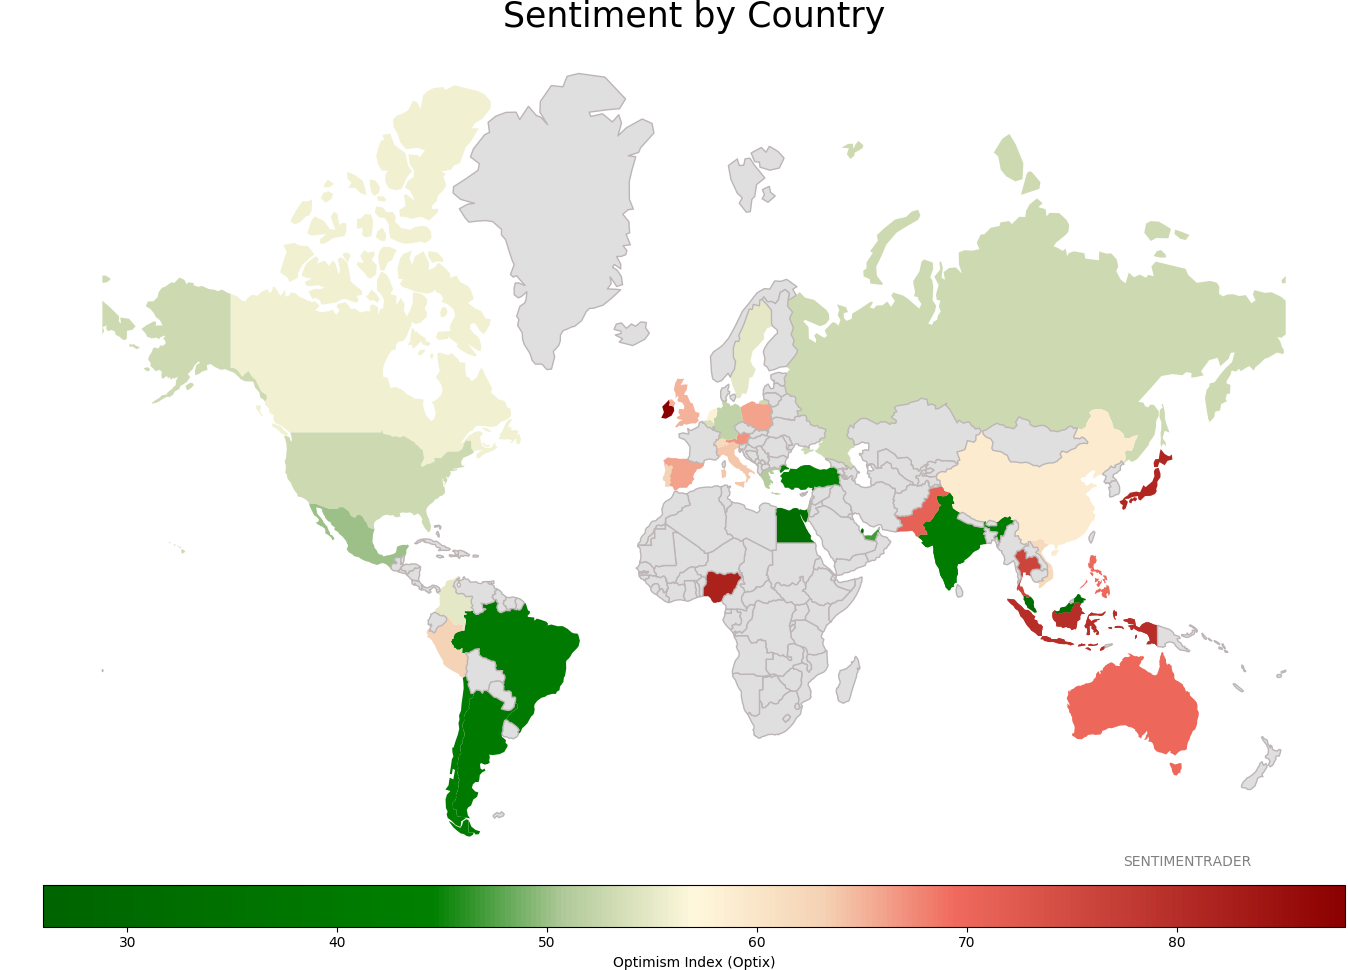
Ranks
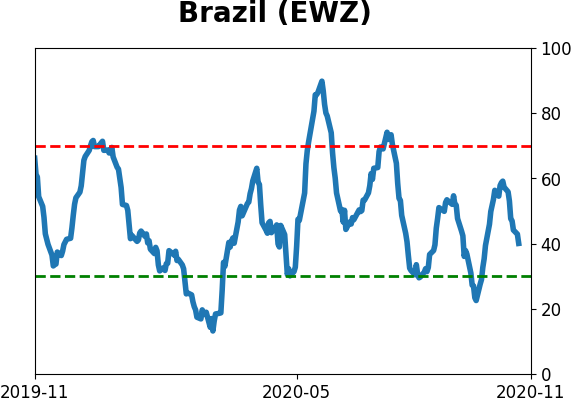
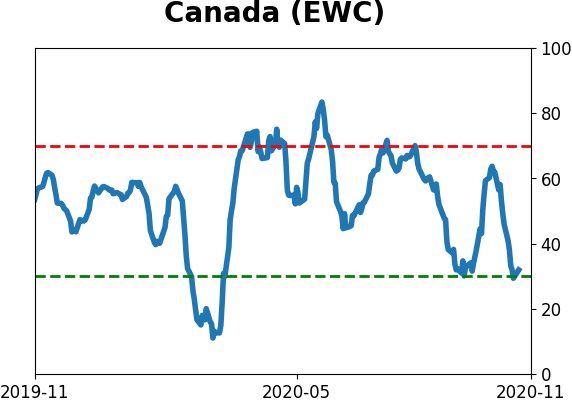
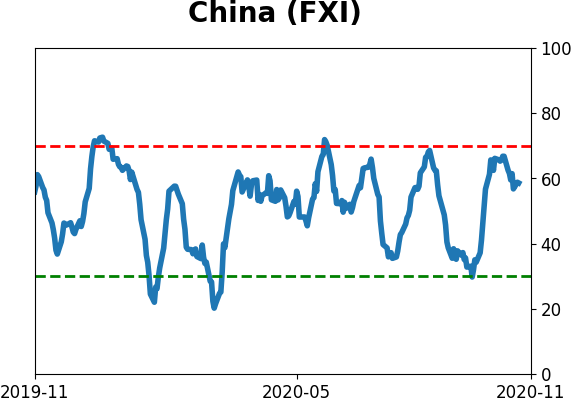
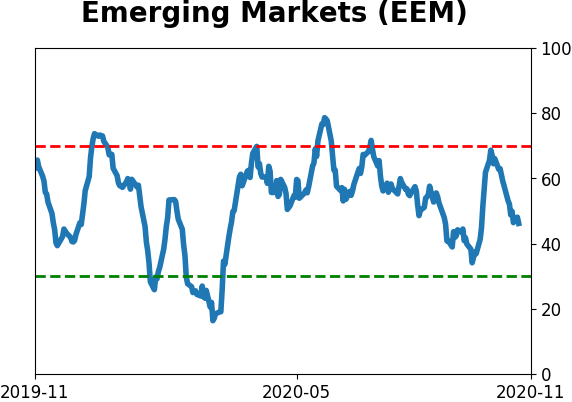
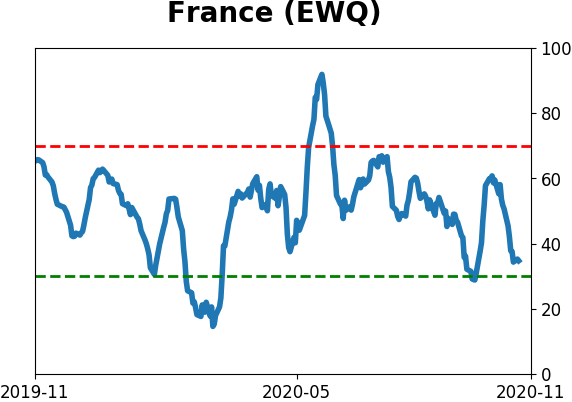
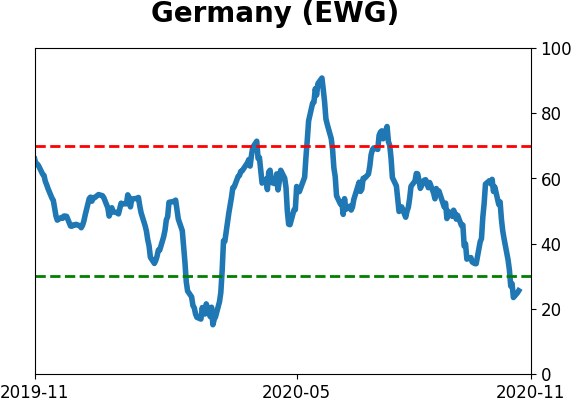
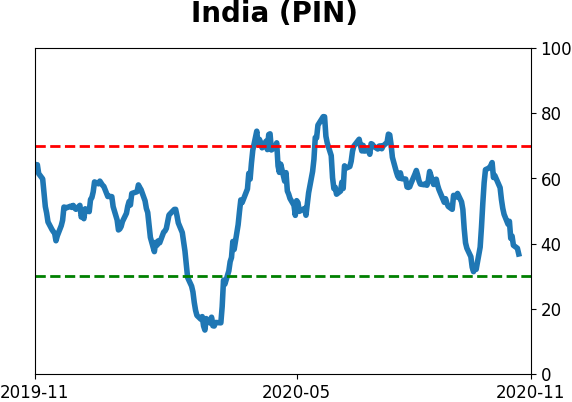
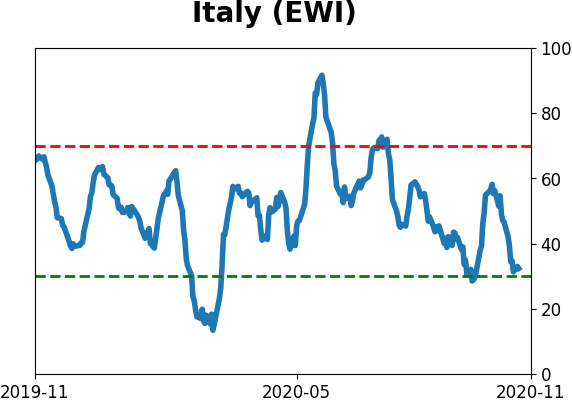
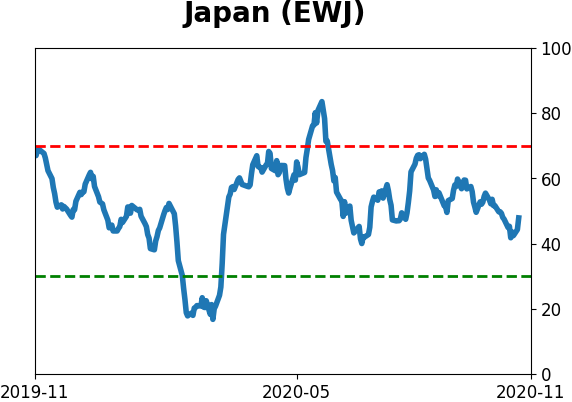
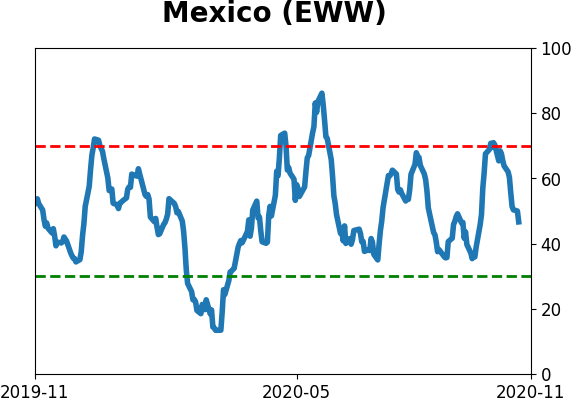
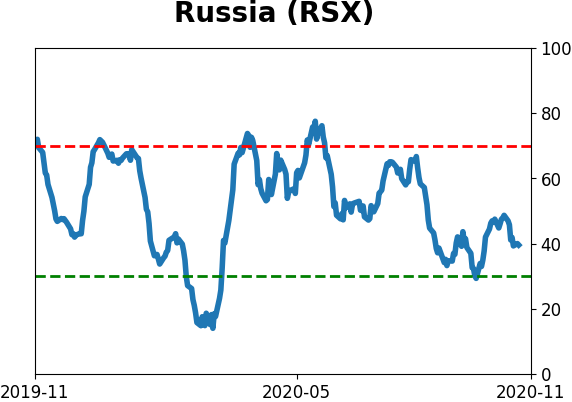
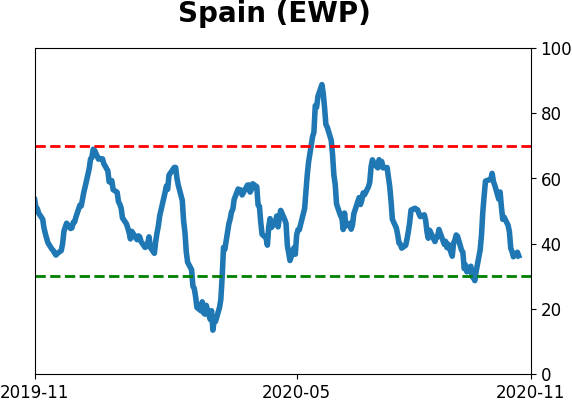
Sentiment Around The World
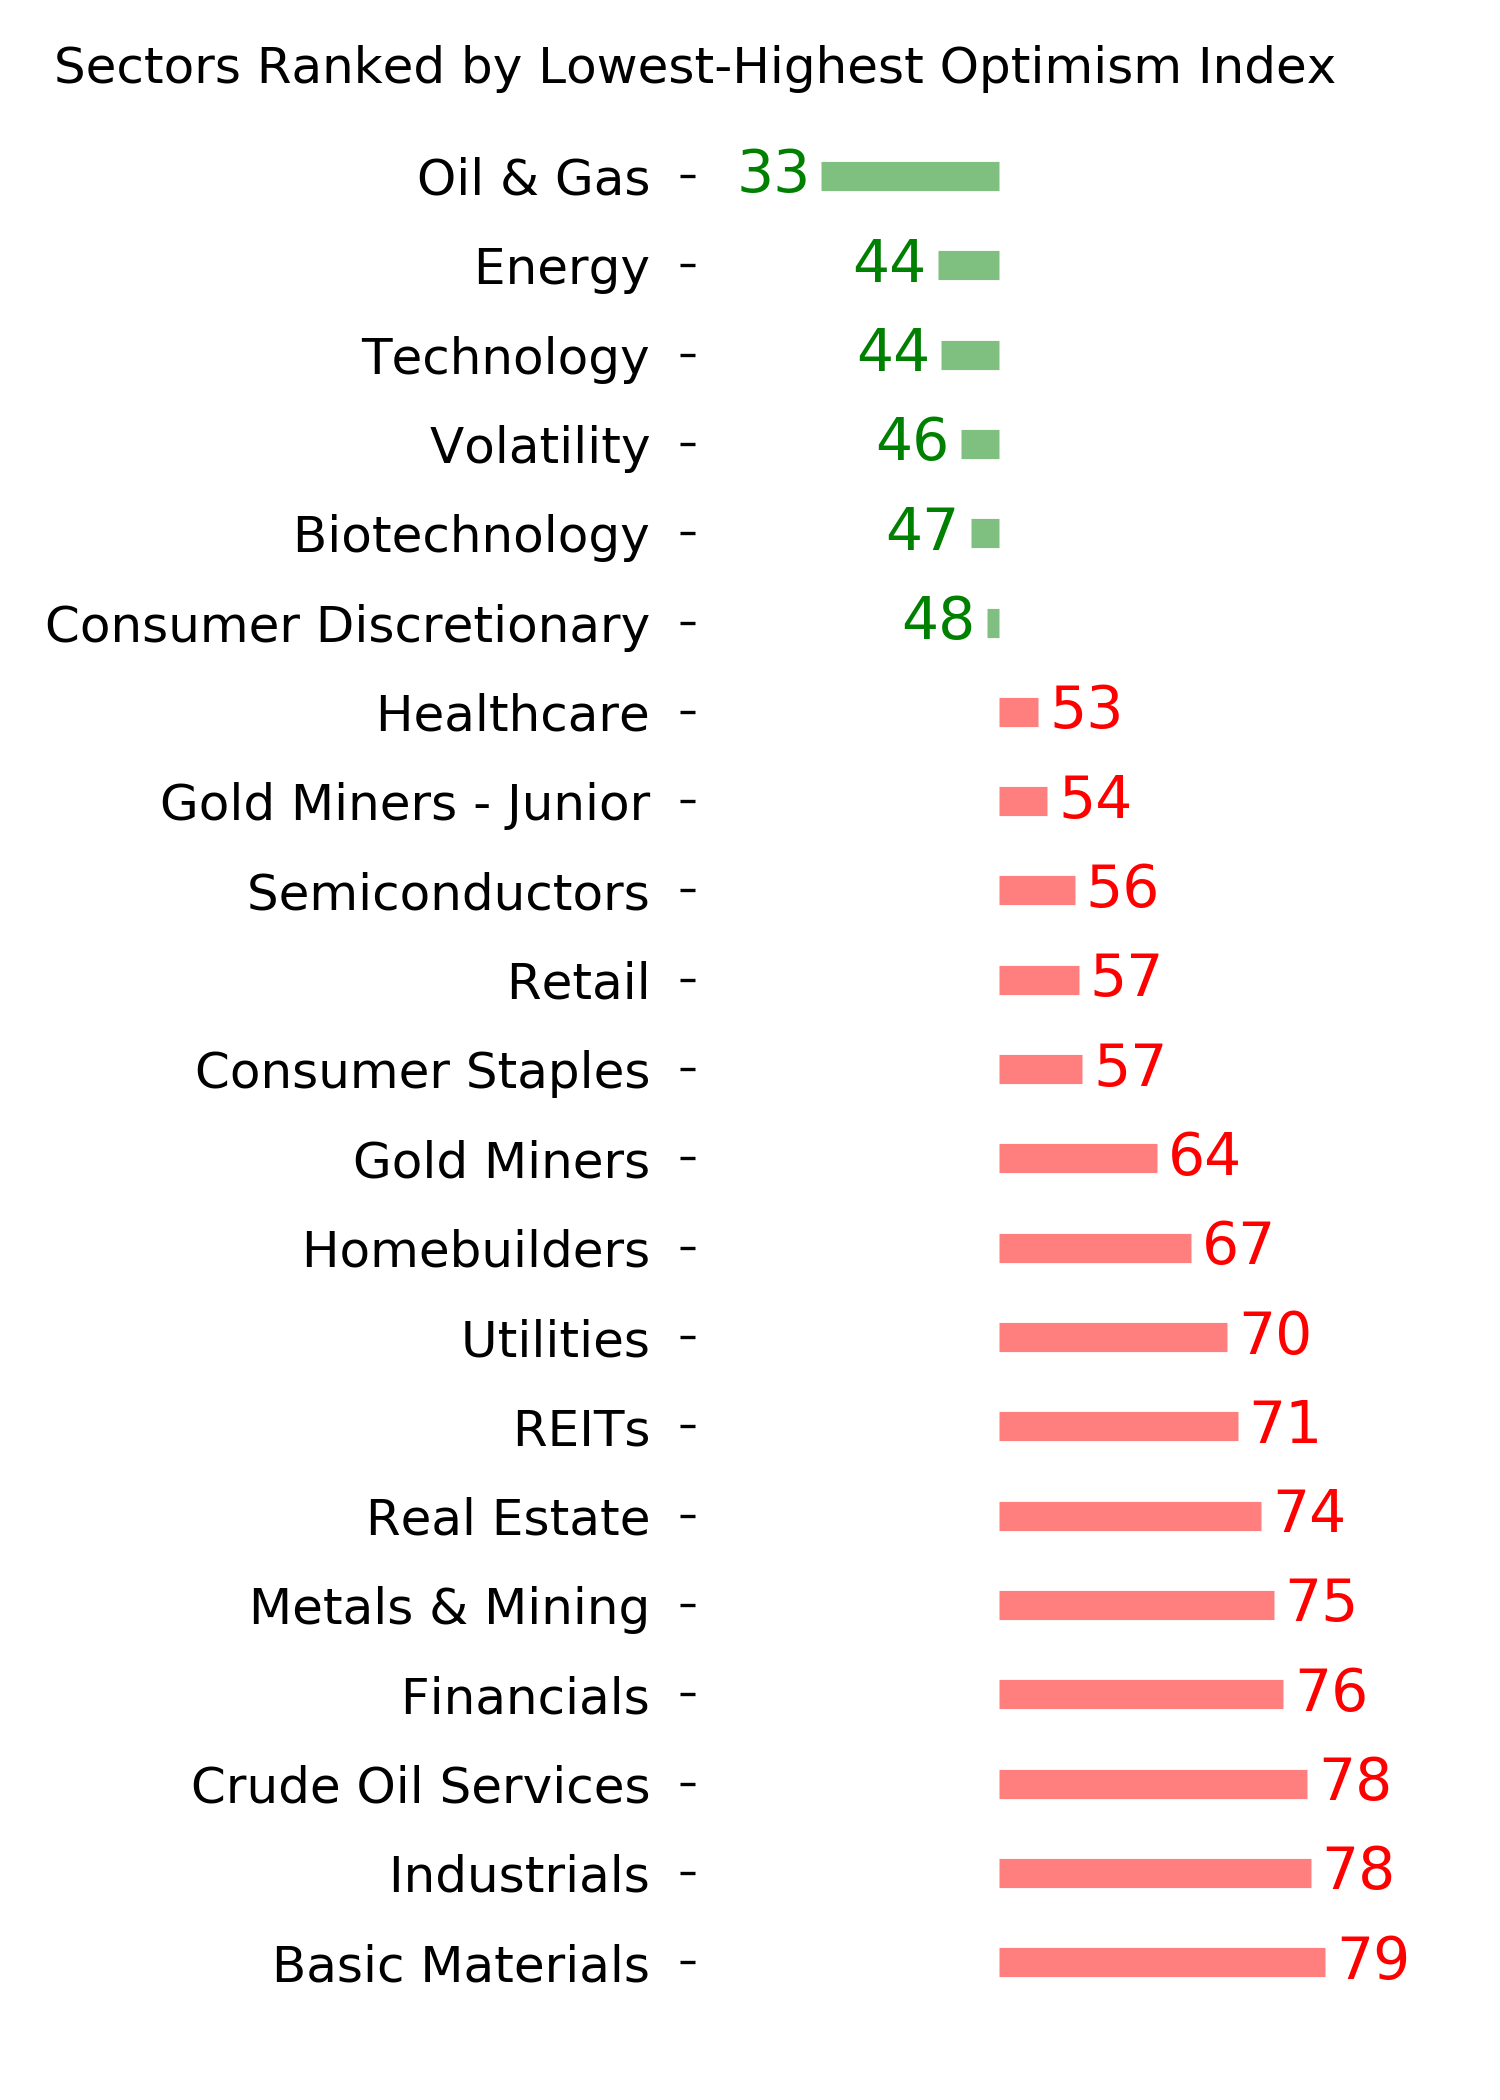
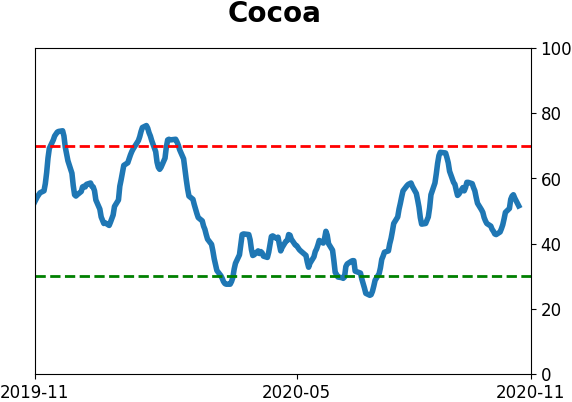
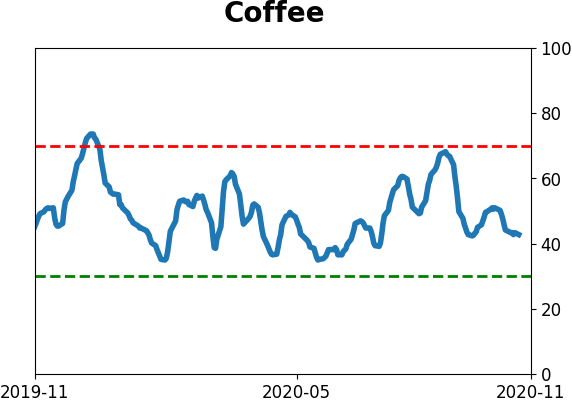
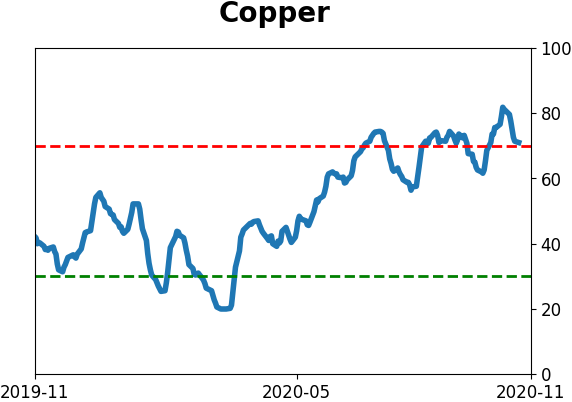
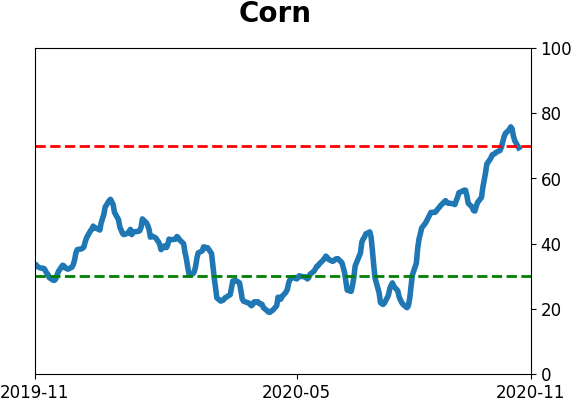
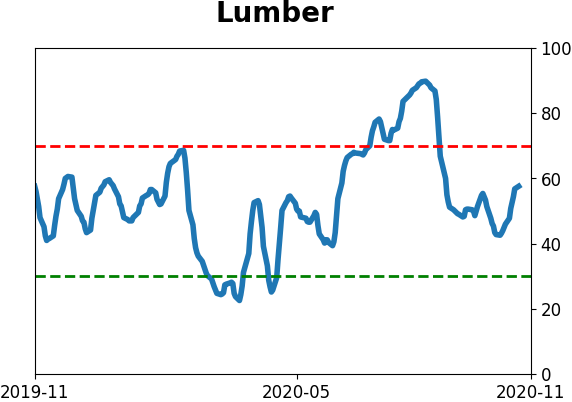
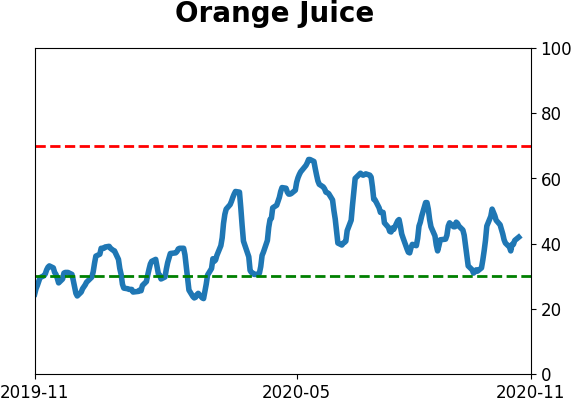
Optimism Index Thumbnails
|
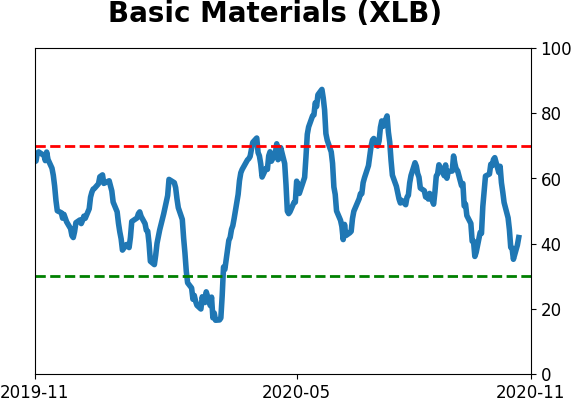
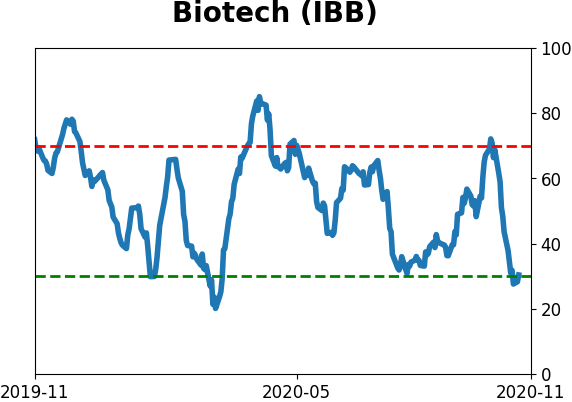
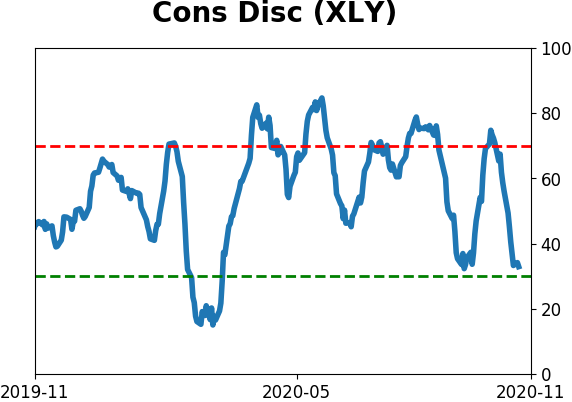
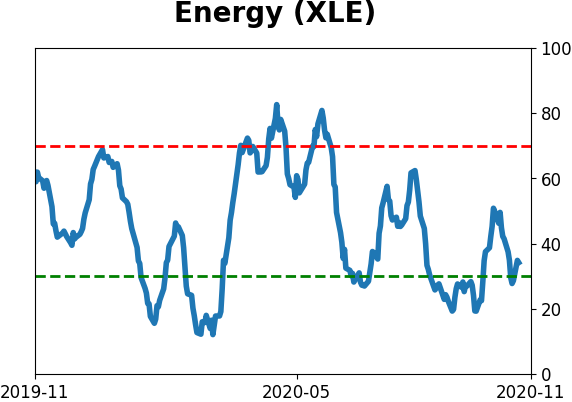
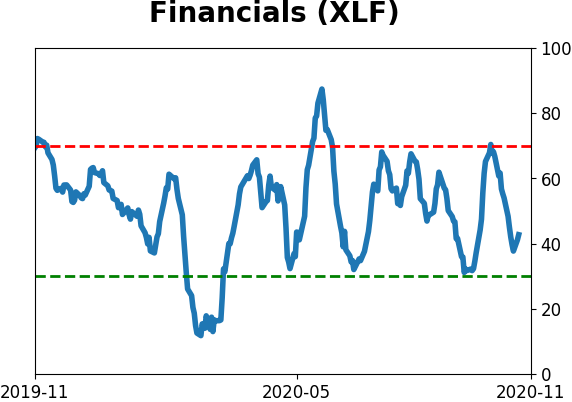
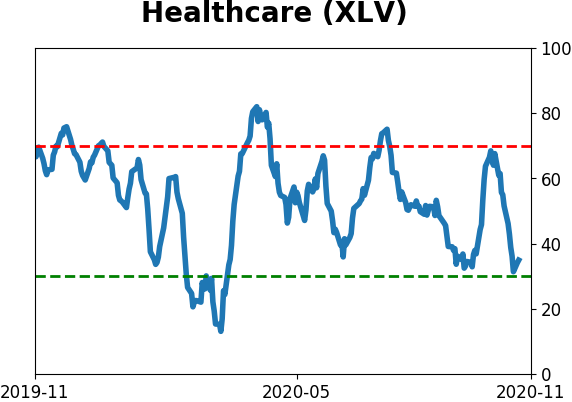
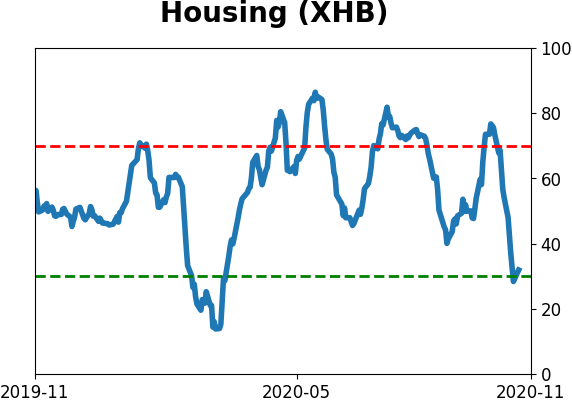
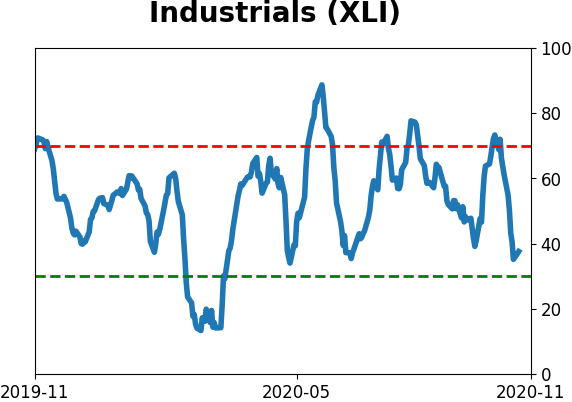
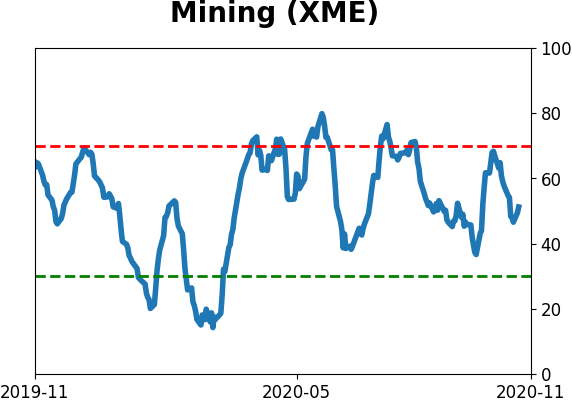
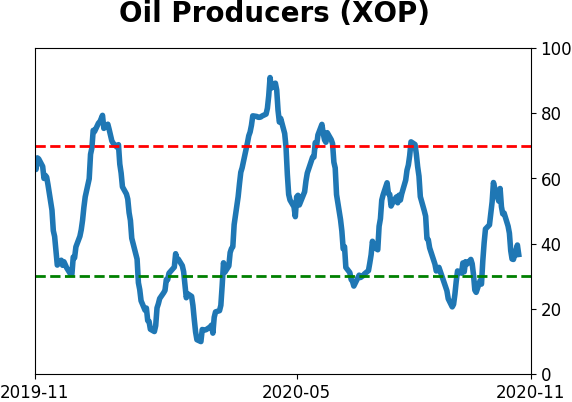
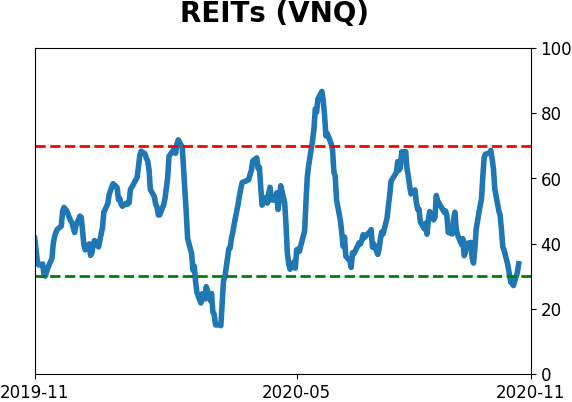
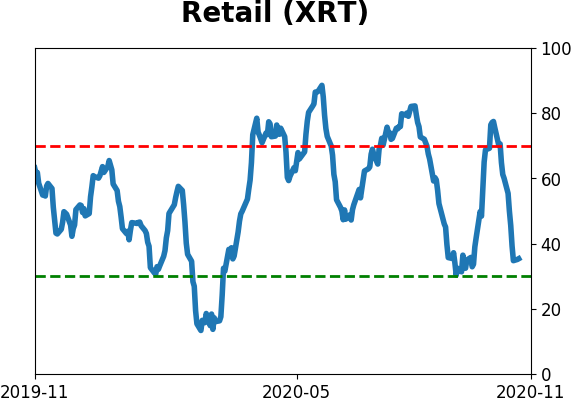
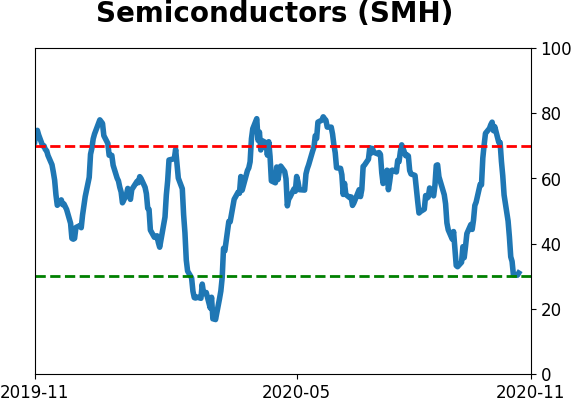
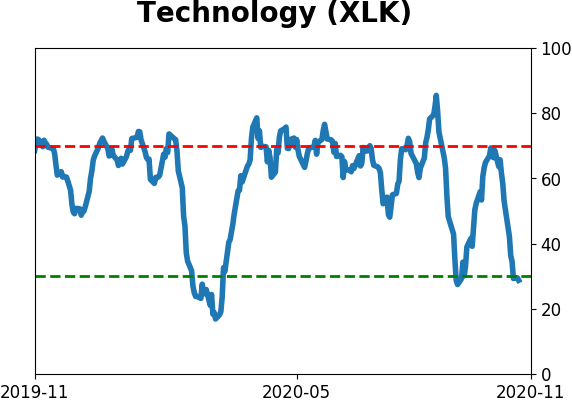
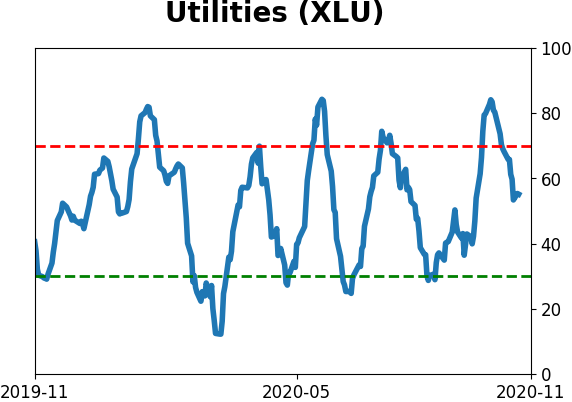
Sector ETF's - 10-Day Moving Average
|
|
|
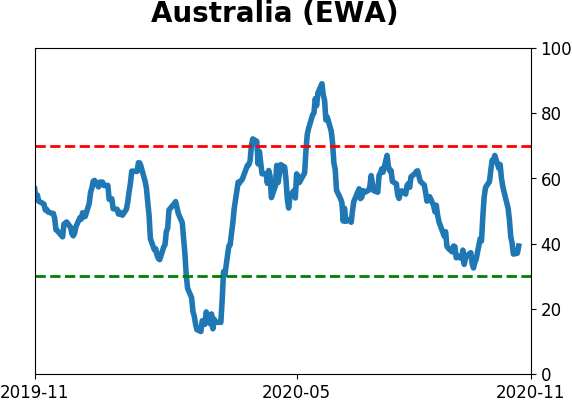
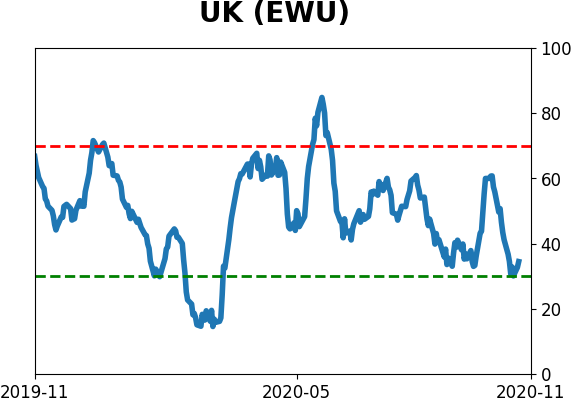
Country ETF's - 10-Day Moving Average
|
|
|
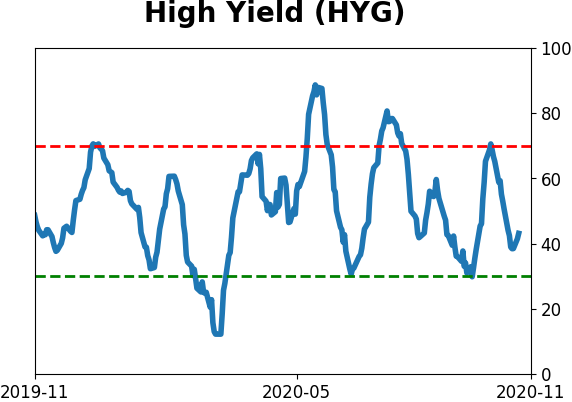
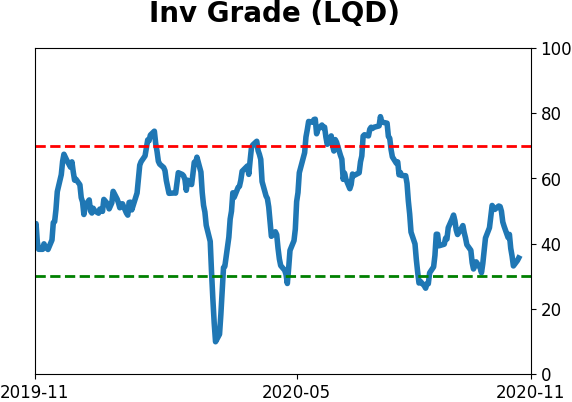
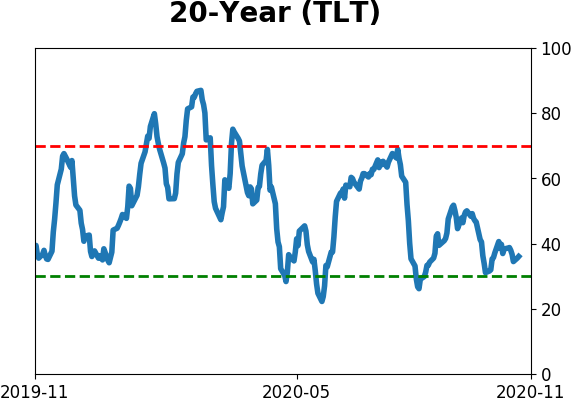
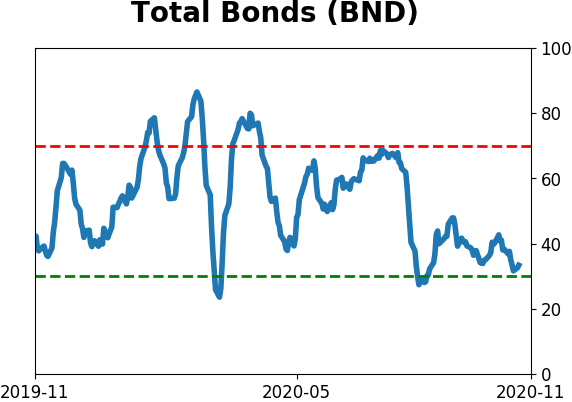
Bond ETF's - 10-Day Moving Average
|
|
|
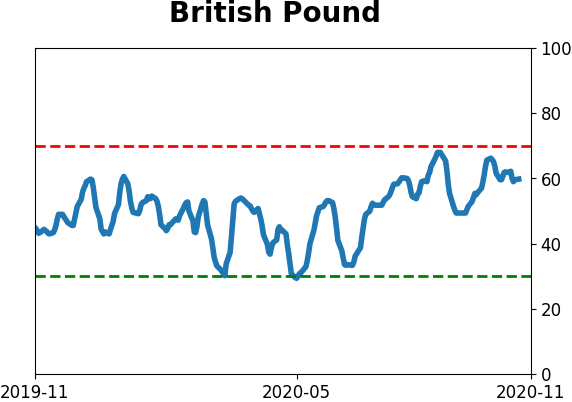
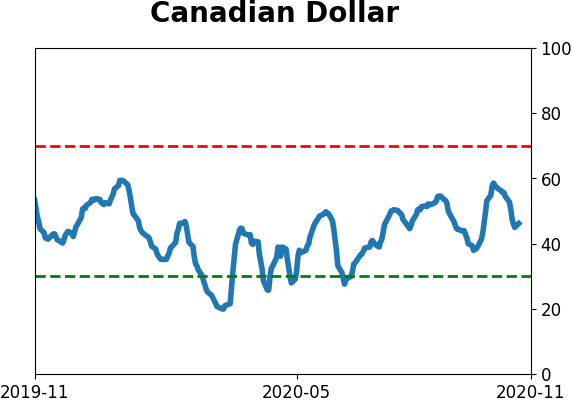
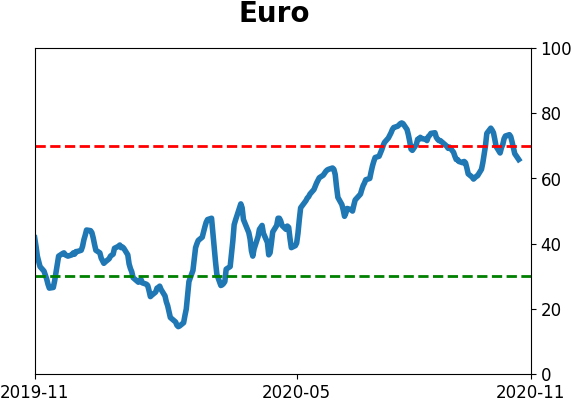
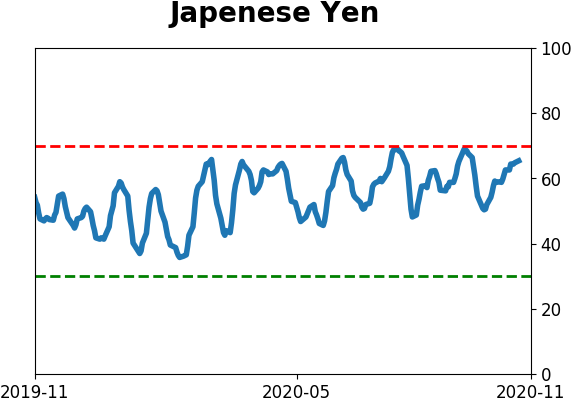
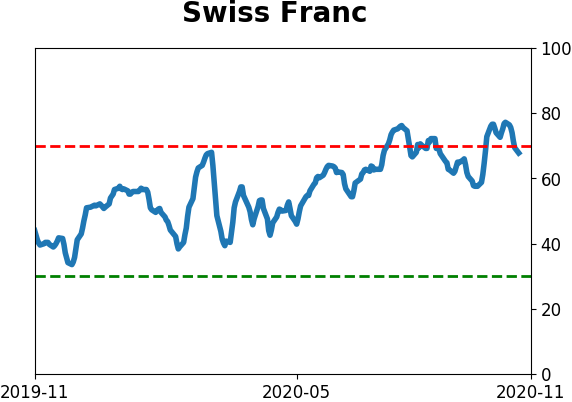
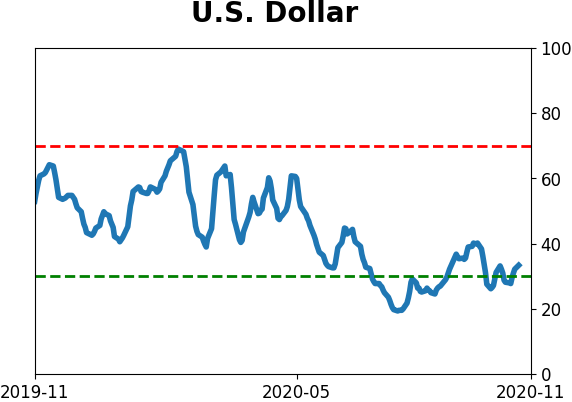
Currency ETF's - 5-Day Moving Average
|
|
|
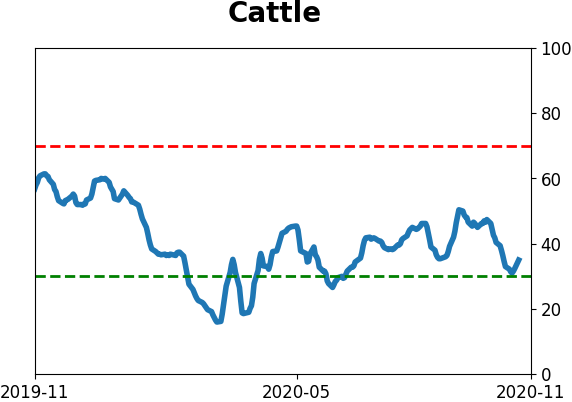
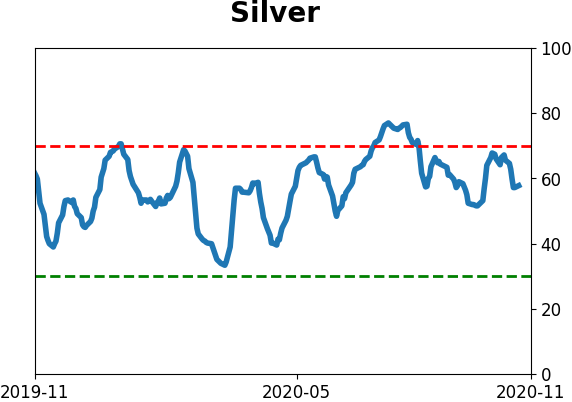
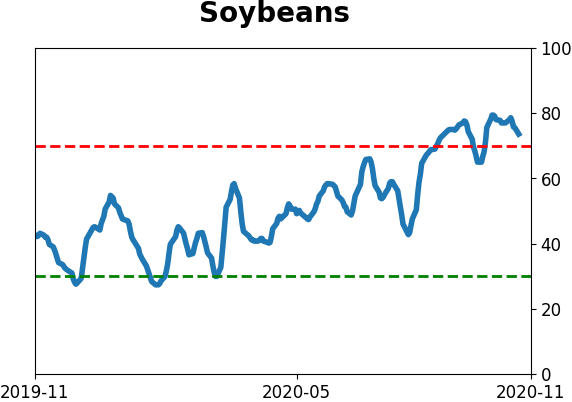
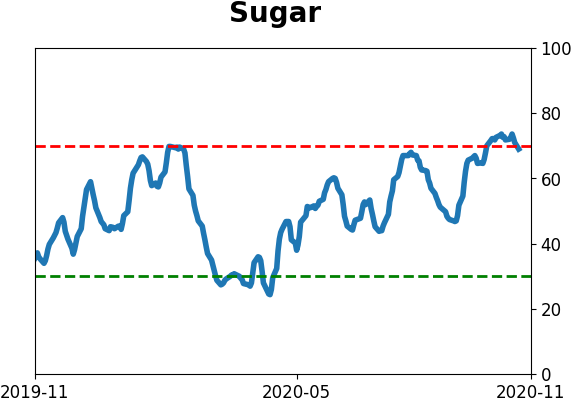
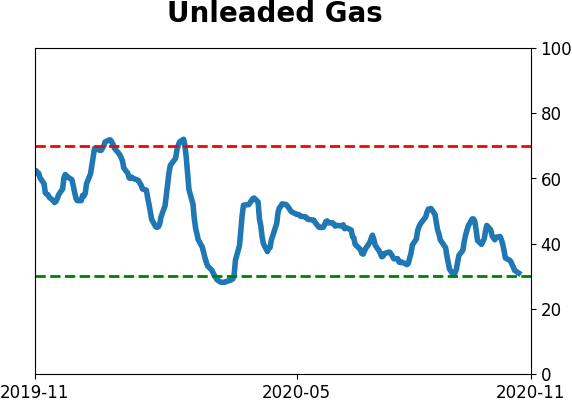
Commodity ETF's - 5-Day Moving Average
|
|