Headlines
|
|
Options traders pull back as Dumb Money loses confidence:
Last week, the smallest of options traders pulled back further from speculative trading activity. Call buying was the lowest since May. But that's only a start to unwinding what has been record-setting speculative behavior. Dumb Money Confidence is still way above the average level where stocks bottom.
Bottom Line:
- A positive environment favors becoming aggressive on signs of excessive pessimism, of which there are few yet.
|
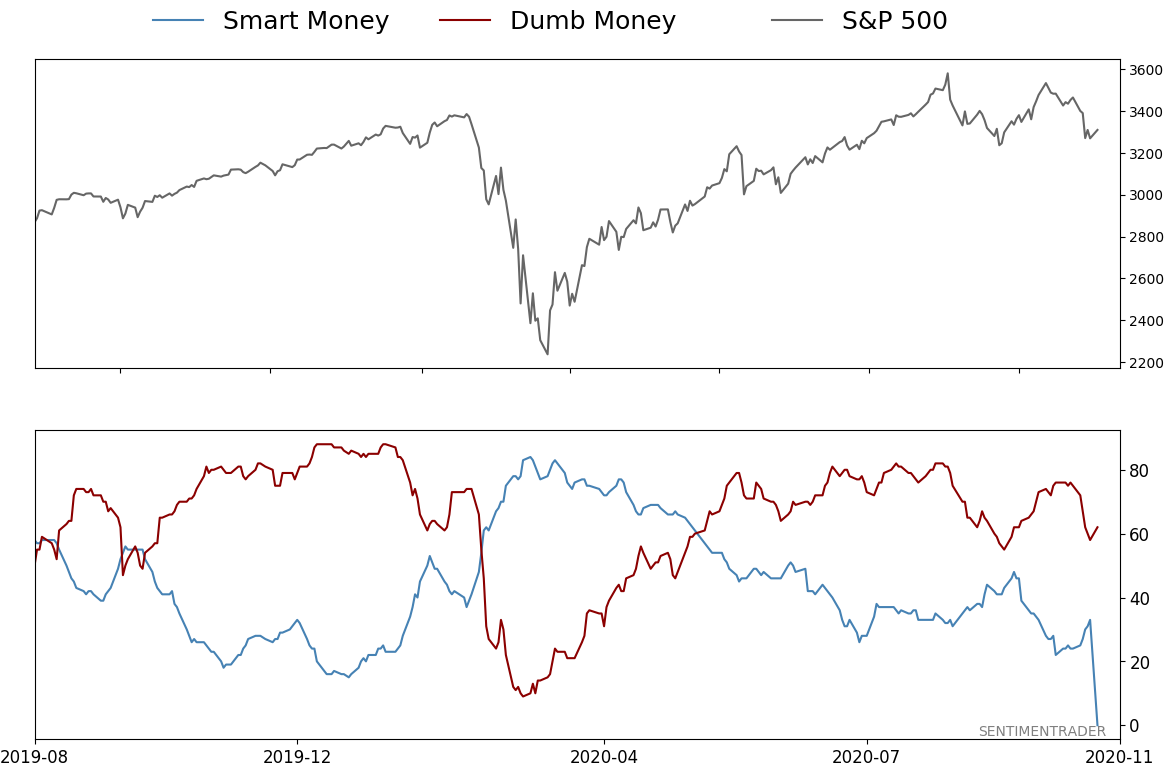
Smart / Dumb Money Confidence
|
Smart Money Confidence: 0%
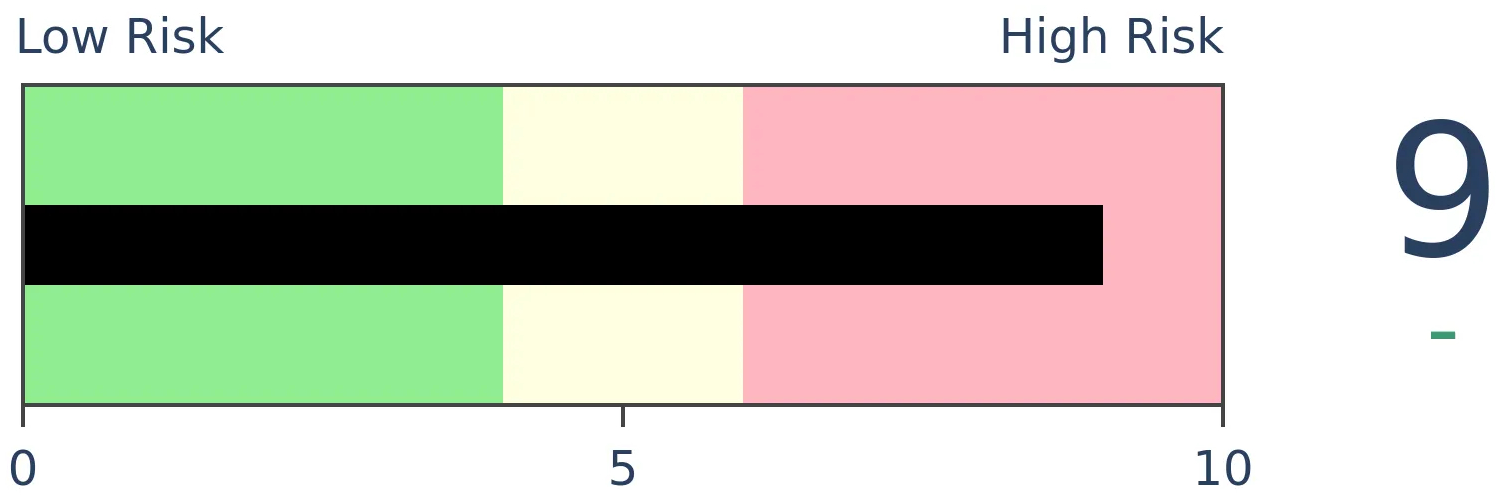
Dumb Money Confidence: 62%
|
|
Risk Levels
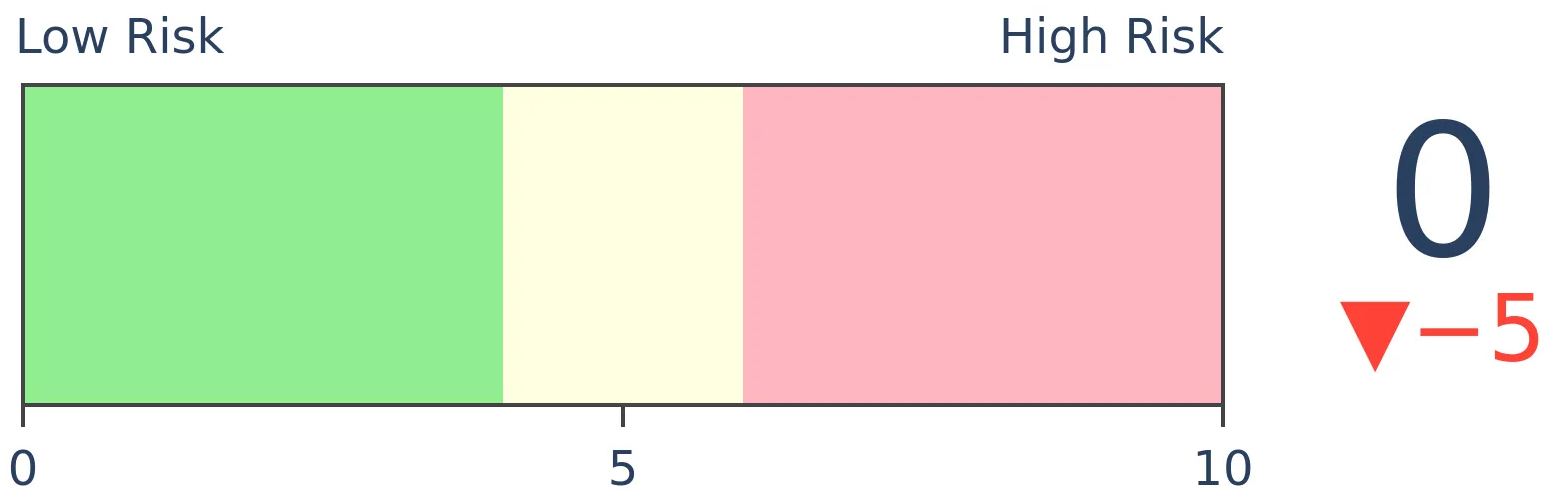
Stocks Short-Term
|
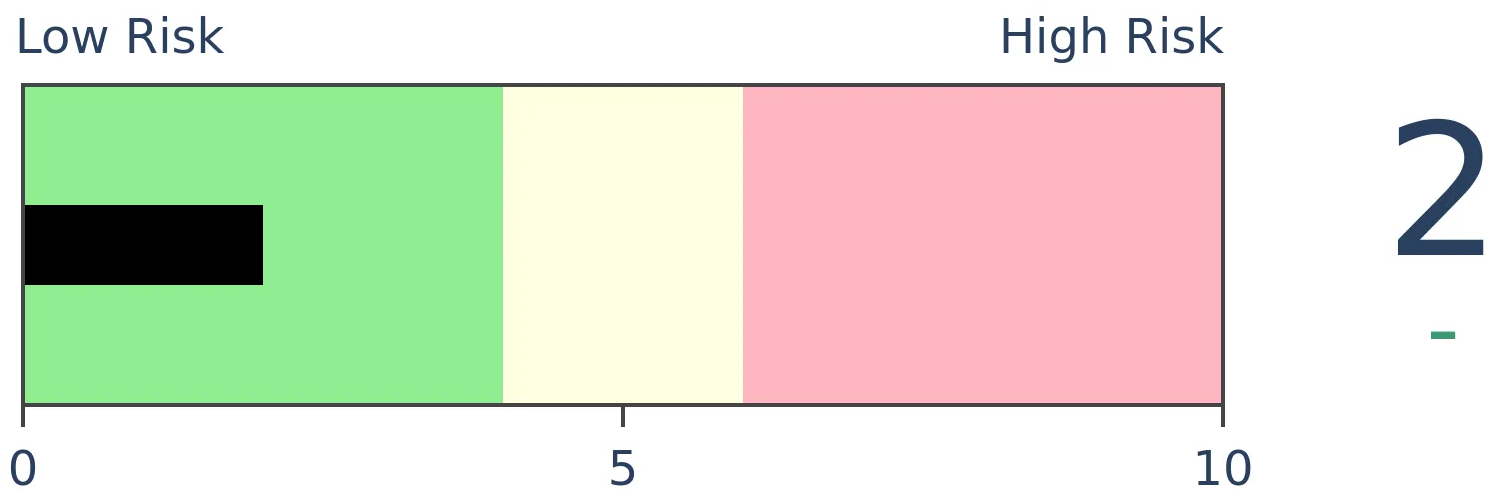
Stocks Medium-Term
|
|
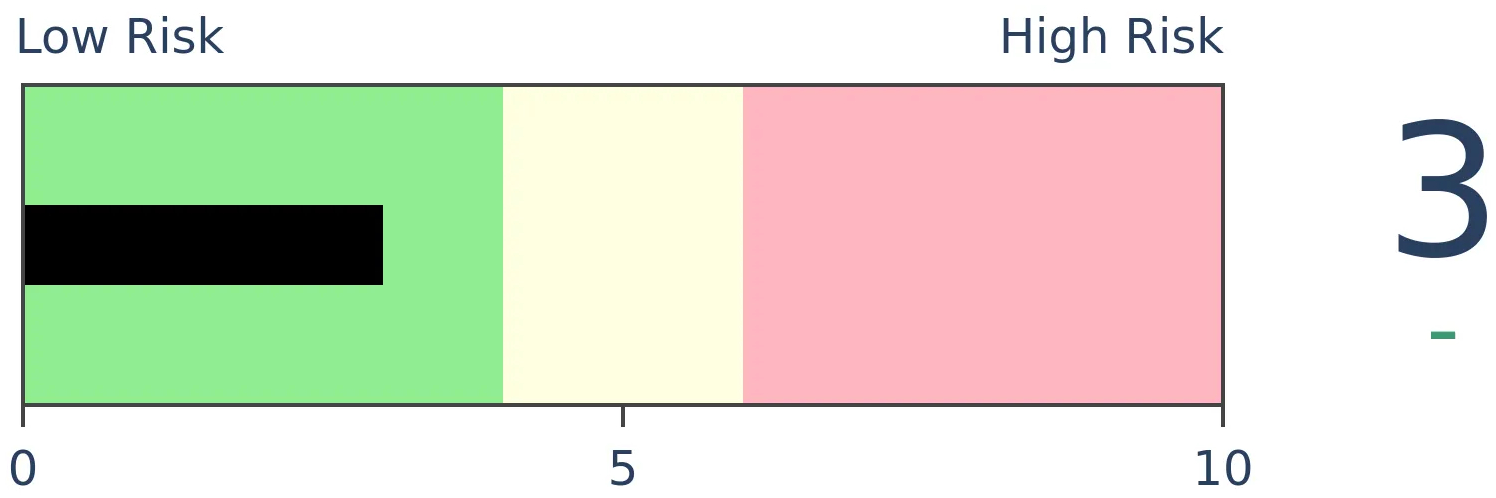
Bonds
|
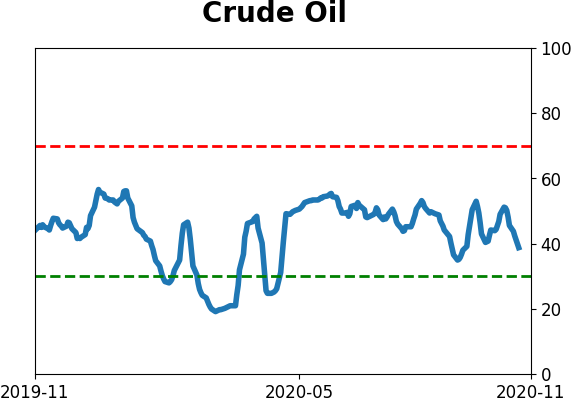
Crude Oil
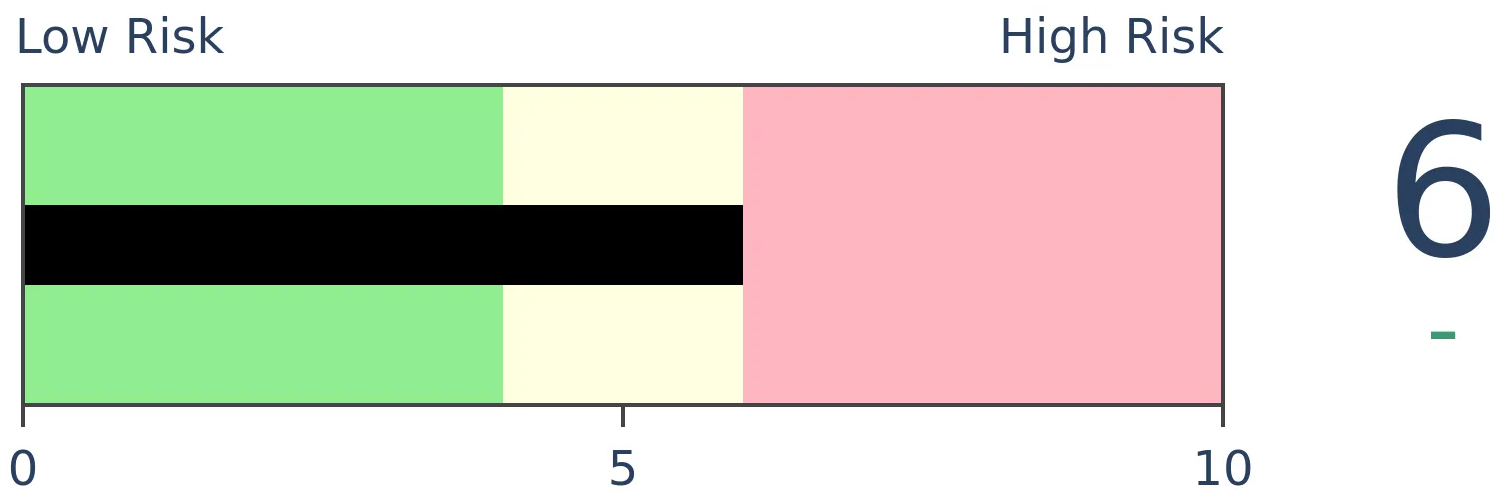
|
|
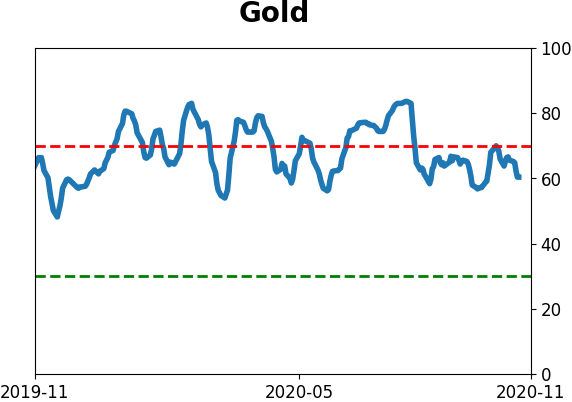
Gold
|
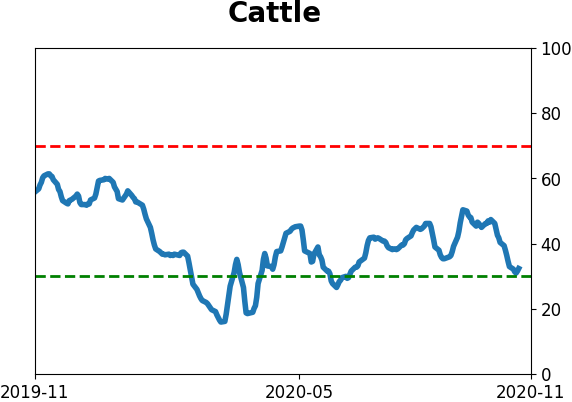
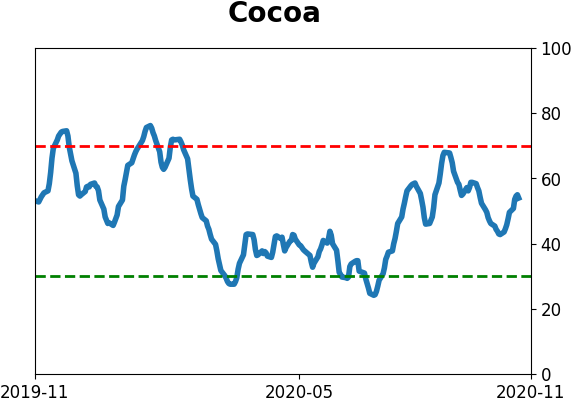
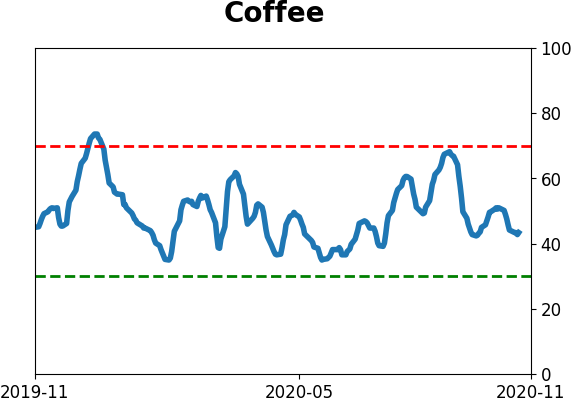
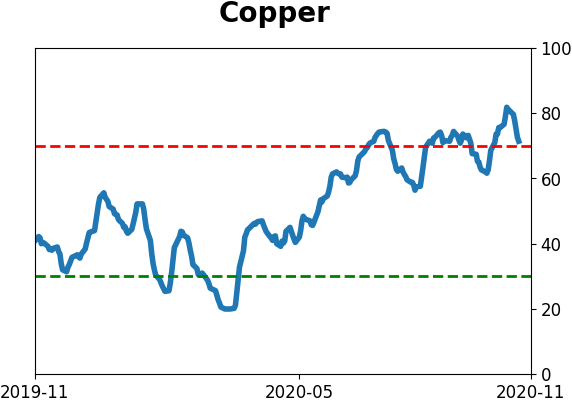
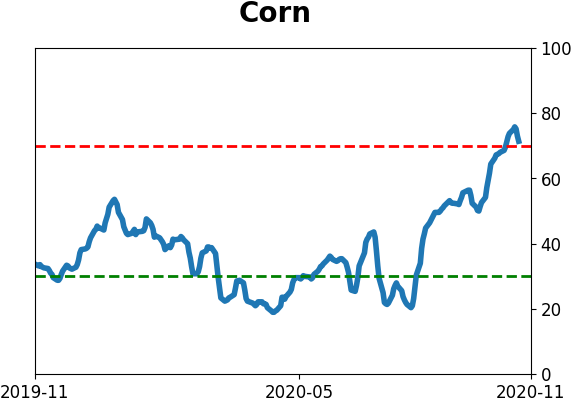
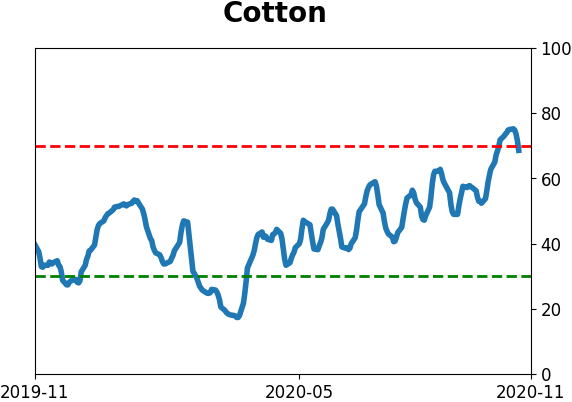
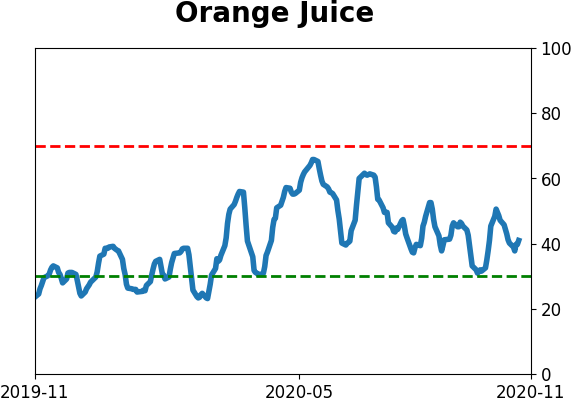
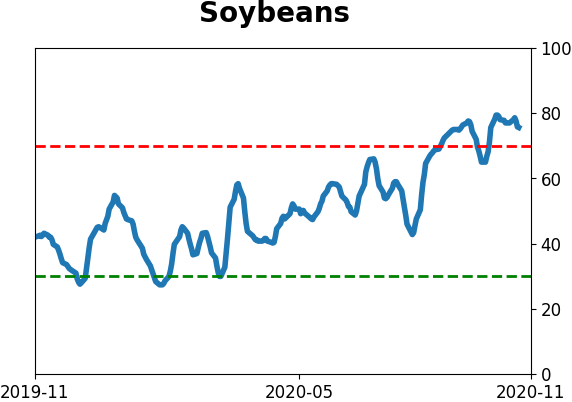
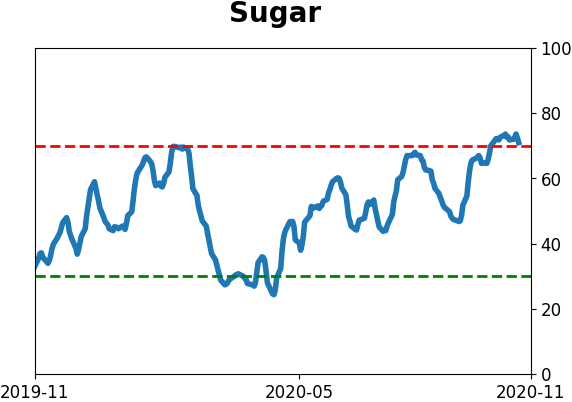
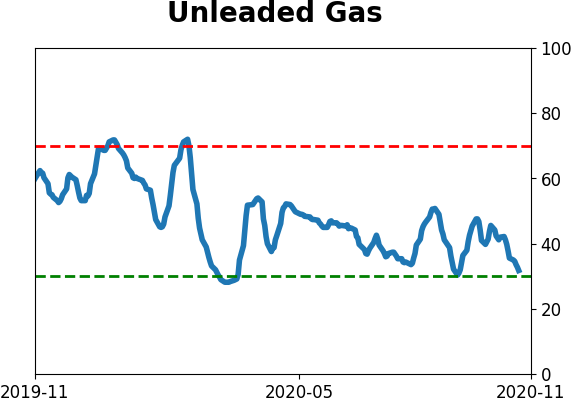
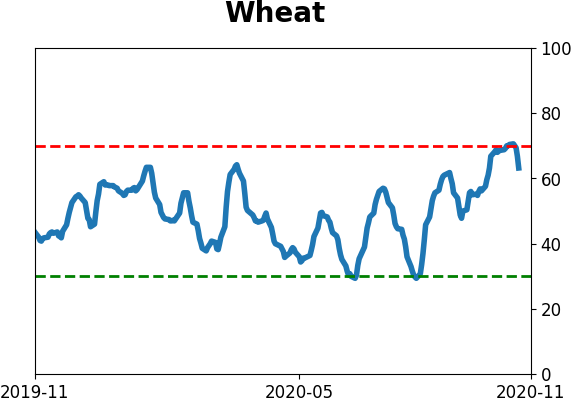
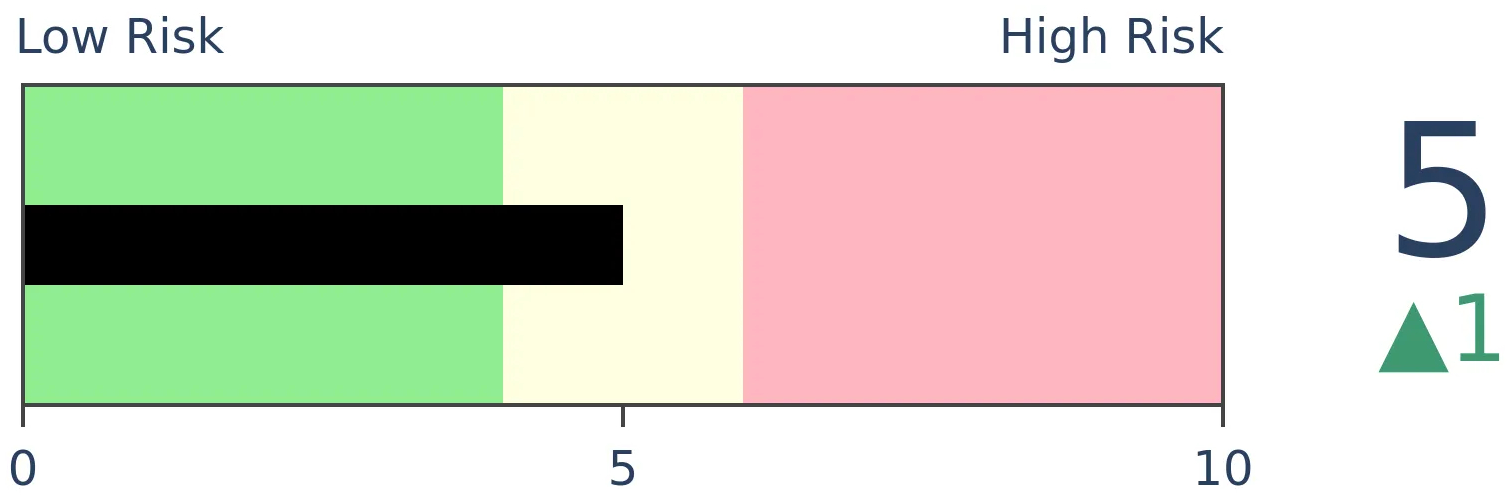
Agriculture
|
|
Research
BOTTOM LINE
Last week, the smallest of options traders pulled back further from speculative trading activity. Call buying was the lowest since May. But that's only a start to unwinding what has been record-setting speculative behavior. Dumb Money Confidence is still way above the average level where stocks bottom.
FORECAST / TIMEFRAME
None
|
Despite a drop in speculative options activity, sentiment among trend-followers is still higher than it has been at almost any low over the past 20 years.
We've been checking regularly on the behavior of options traders over the past couple of months because their activity had been speculative to a record degree.
The week before last, they became a bit less aggressive. That continued last week, with a drop in speculative call buying among the smallest of traders, and an uptick in protective put buying.
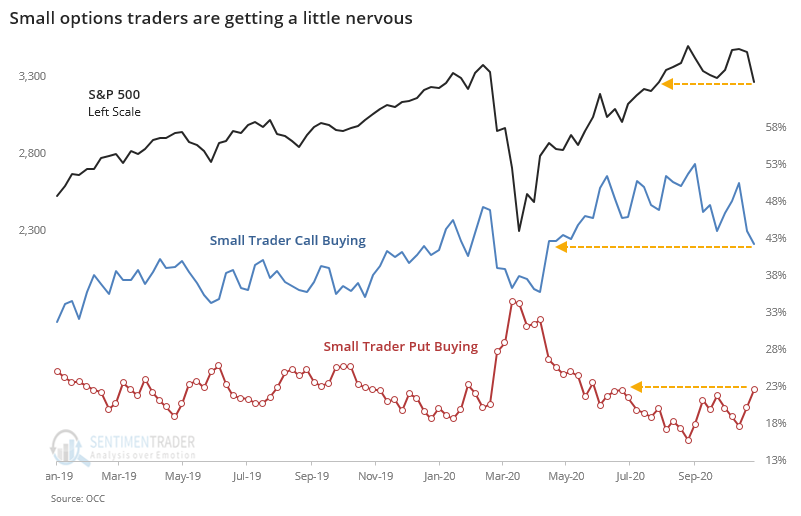
Their activity is nowhere near showing pessimism - in March, the volume of their put buying nearly matched their call buying, while currently the two are still quite far apart.
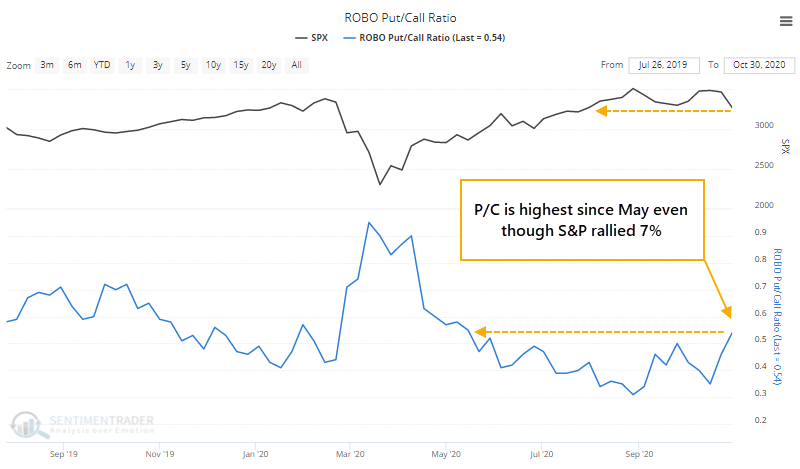
About the only interesting thing about this initial unwind is that it's the most in months. The ROBO Put/Call Ratio, which looks at the ratio of opening put purchases relative to opening call purchases among the smallest traders, has moved above 50% for the first time in more than 20 weeks. The S&P 500 is still nearly 8% higher than where it was 20 weeks ago.
Below, we can see every time when the ROBO ratio hit a 20-week high while the S&P was 5% or more above where it was 20 weeks ago. This shows that traders are showing at least some concern even though stocks have rallied.
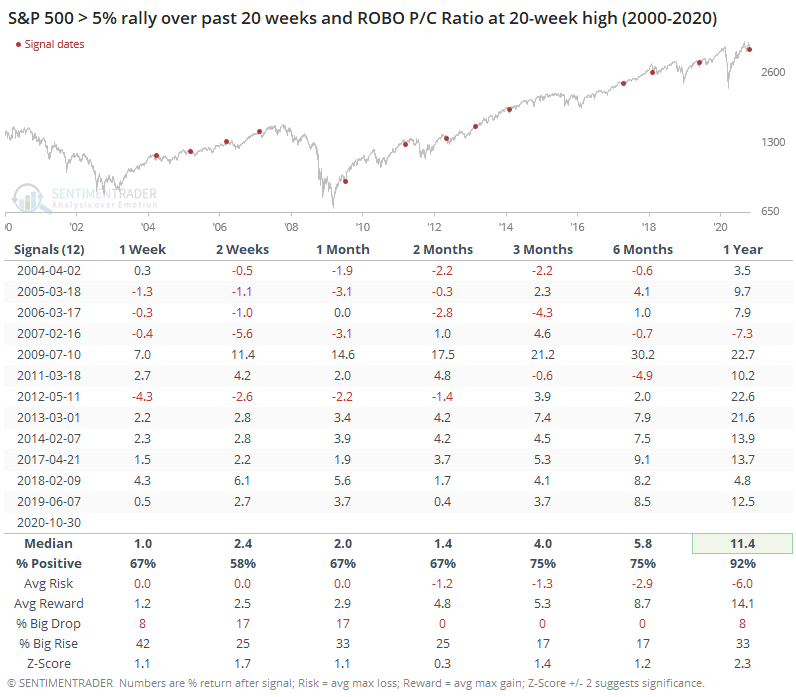
This proved to be a mostly good sign for forward returns, especially over the medium- to long-term. If we're looking for a positive in this data, this is about the only way. Overall, we'd suggest the data is still a concern for all the reasons laid out since August. The speculative excess has been record-setting, and it's only now being unwound. It may be a small positive that options activity is the least-speculative in months despite a mostly healthy market, but that's a small consolation.
The drop in speculative activity among options traders has helped to push Dumb Money Confidence lower, now just below 60% after peaking above 75% a couple of weeks ago. Declining Confidence from a high level is not a good thing. In the strongest bull markets, we usually see Confidence drop to 50% or below before stocks form a low. During bear markets - or even neutral environments - it usually drops to 30% or below.
Over the past few years, when the S&P 500 troughed at its lowest point in a month, Confidence was below 50% every time, except for the rebound in September when it only dropped to 55%.
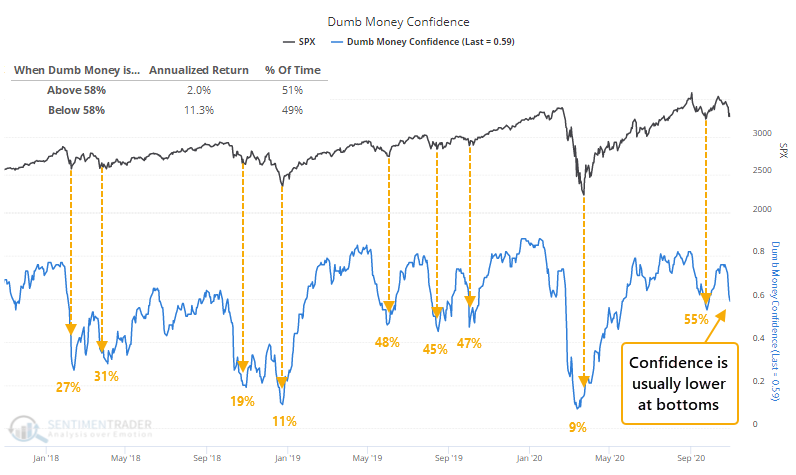
Because stocks generally rise, and investors are generally an optimistic bunch, Dumb Money Confidence spends a lot of time at higher levels. Its median reading since 1999 is 58%. Even so, when Confidence is above that threshold, forward returns tend to be muted, with an annualized gain of only +2.0% in the S&P. When it's below 58%, that rises to +11.3%.
If the S&P bottomed on Friday with Dumb Money Confidence at 59%, then it would be the highest reading we've ever seen at a 1-month bottom when the S&P had lost at least 7%. In other words, it would be extremely unusual to see stocks form a low while Confidence was still so high.
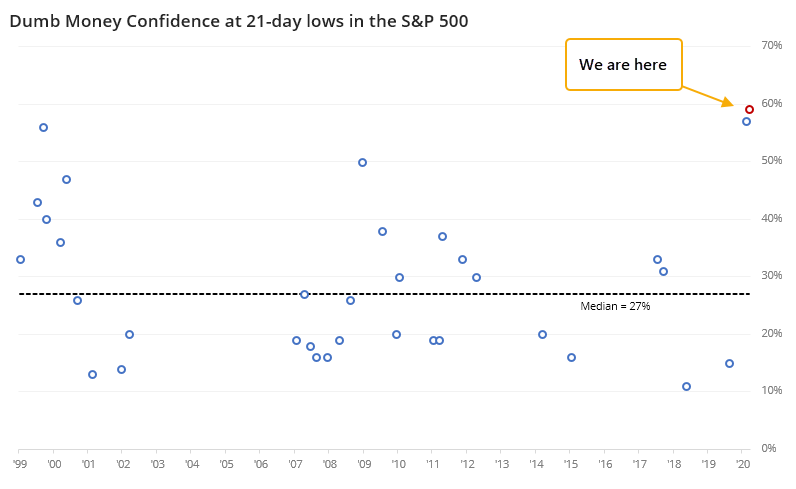
There were only a few times when stocks formed a 1-month low with Dumb Money Confidence above 50%; the median reading was only 27%, more than 30% below Friday's level.
The table below shows every date since 1999 when the S&P fell to its lowest price in 21 days, with a loss of at least 7% over the past month. It filters the table to only show the 20 days with the highest Dumb Money Confidence readings.
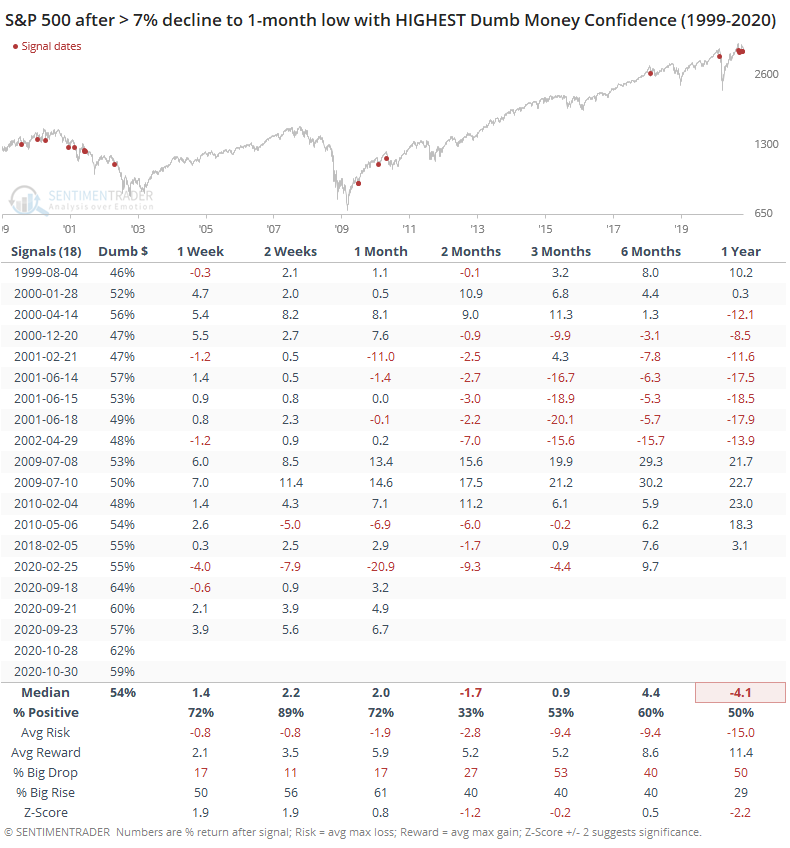
The next couple of weeks showed good returns, which is a bit surprising. But the S&P showed a gain only 33% of the time over the next 2 months. The only one that showed sustained gains was following the bear market bottom in 2009 when the sudden jump in optimism was just the start of a process of eroding a years-long buildup of pessimism.
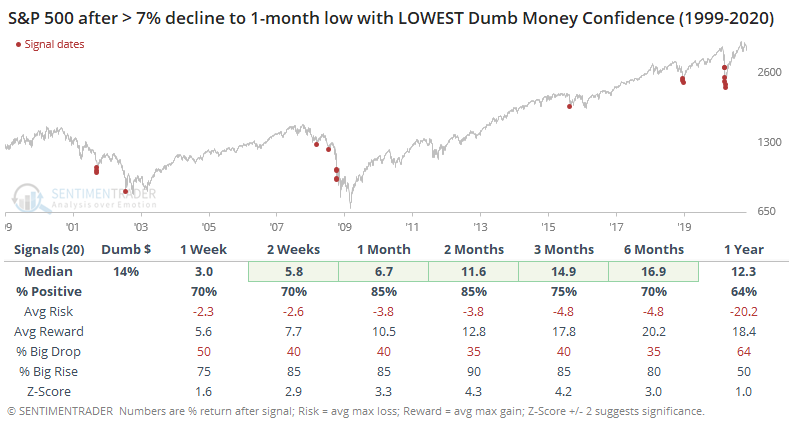
When we contrast that to the 20 days with the lowest Dumb Money Confidence readings after the S&P suffered such a decline, then we can see how much better the forward returns were.
Currently, we're in a precarious position. Some of the breadth and momentum we saw earlier this month has been an excellent sign for medium- to long-term returns, but we're still seeing relatively high (and declining) optimism during a mostly neutral-to-slightly-positive market environment. That's usually a recipe for choppy conditions at best, with a more typical scenario of enough weak price action to drive sentiment to a below-neutral level. We're still quite a ways from that.
I have no idea who will win the election, or control Congress. I have no idea if it will be decided on Tuesday. Even if it did, I have no idea how markets would respond on Wednesday. Even if I knew the results, and knew Wednesday's reaction, I have no idea how markets will respond in the weeks following.
Every so often, we get these "momentous" events that turn out to be mostly nothing. Maybe temporary disruptions at best. It happens time and time and time again. Most of the things that truly rock markets are unseen and become obvious after the fact. Based on how investors are currently positioned, and where we are in the market environment, there is not a clear edge to either side, but the evidence suggests more risk than reward over the shorter-term and more reward than risk over the medium- to long-term.
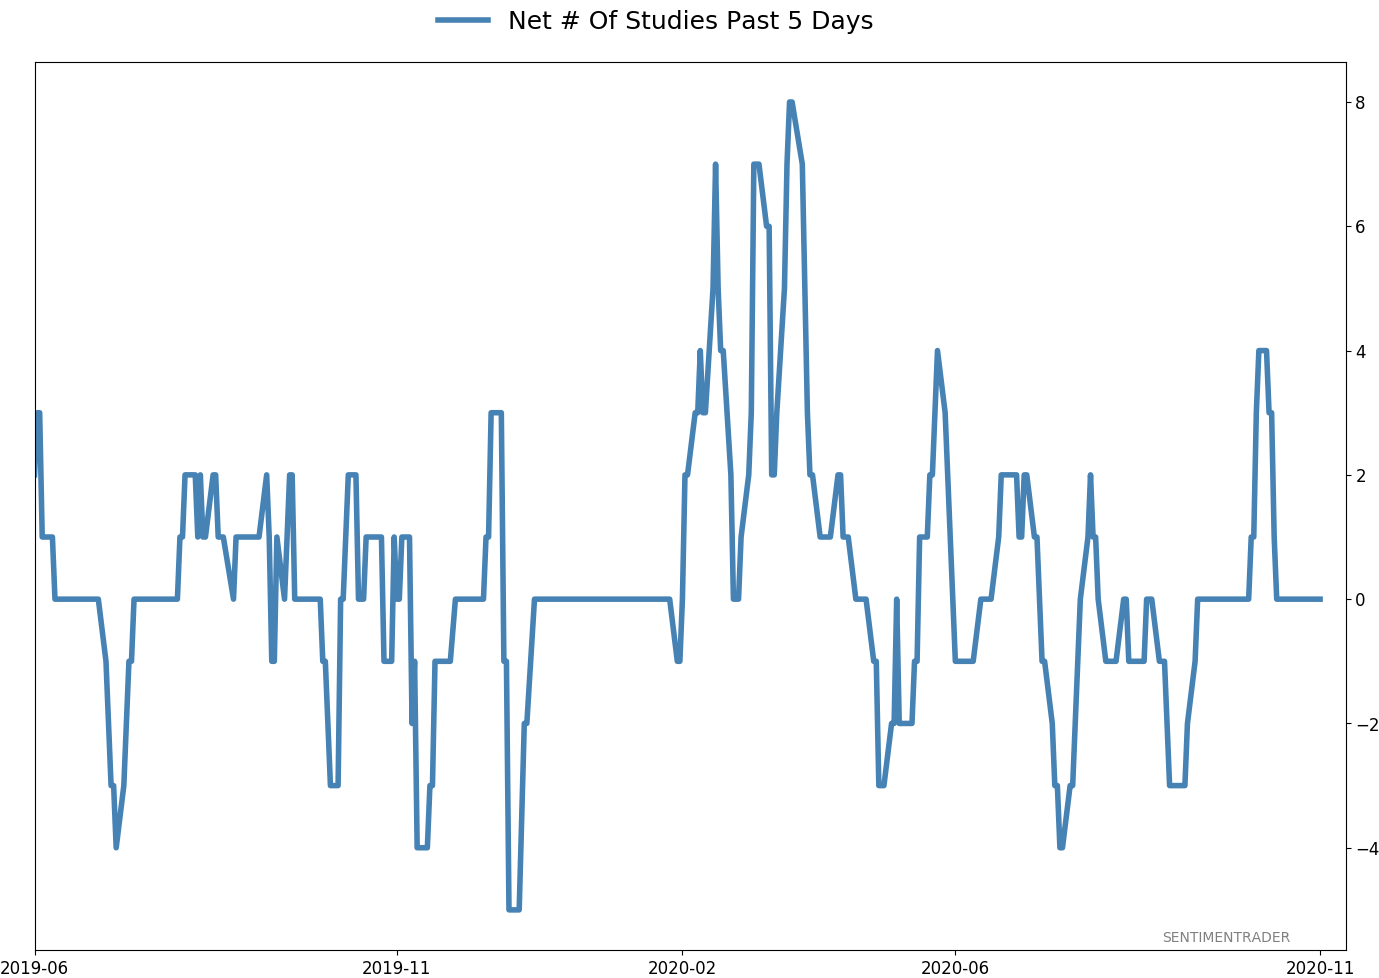
Active Studies
| Time Frame | Bullish | Bearish | | Short-Term | 0 | 0 | | Medium-Term | 4 | 8 | | Long-Term | 48 | 2 |
|
Indicators at Extremes
Portfolio
| Position | Description | Weight % | Added / Reduced | Date | | Stocks | 15.6% RSP, 10.1% VWO, 7.5% XLE, 5.1% PSCE | 38.2 | Added 5% | 2020-10-15 | | Bonds | 10% BND, 10% SCHP, 10% ANGL | 29.7 | Reduced 0.1% | 2020-10-02 | | Commodities | GCC | 2.4 | Reduced 2.1%
| 2020-09-04 | | Precious Metals | GDX | 4.7 | Added 5% | 2020-09-09 | | Special Situations | | 0.0 | Reduced 5% | 2020-10-02 | | Cash | | 25.0 | | |
|
Updates (Changes made today are underlined)
After the September swoon wrung some of the worst of the speculation out of stocks, there are some signs that it's returning, especially in the options market. It's helped to push Dumb Money Confidence above 70%. A big difference between now and August is that in August, there was a multitude of days with exceptionally odd breadth readings. Some of the biggest stocks were masking underlying weakness. Combined with heavy speculative activity, it was a dangerous setup. Now, we've seen very strong internal strength, in the broad market, as well as tech and small-cap stocks. Prior signals almost invariably led to higher prices. That's hard to square with the idea that forward returns tend to be subdued when Confidence is high, but that's less reliable during healthy market conditions, which we're seeing now (for the most part). I added some risk with small-cap energy stocks, due to an increasing number of positive signs in both small-caps and energy. This is intended as a long-term position.
RETURN YTD: -2.6% 2019: 12.6%, 2018: 0.6%, 2017: 3.8%, 2016: 17.1%, 2015: 9.2%, 2014: 14.5%, 2013: 2.2%, 2012: 10.8%, 2011: 16.5%, 2010: 15.3%, 2009: 23.9%, 2008: 16.2%, 2007: 7.8%
|
|
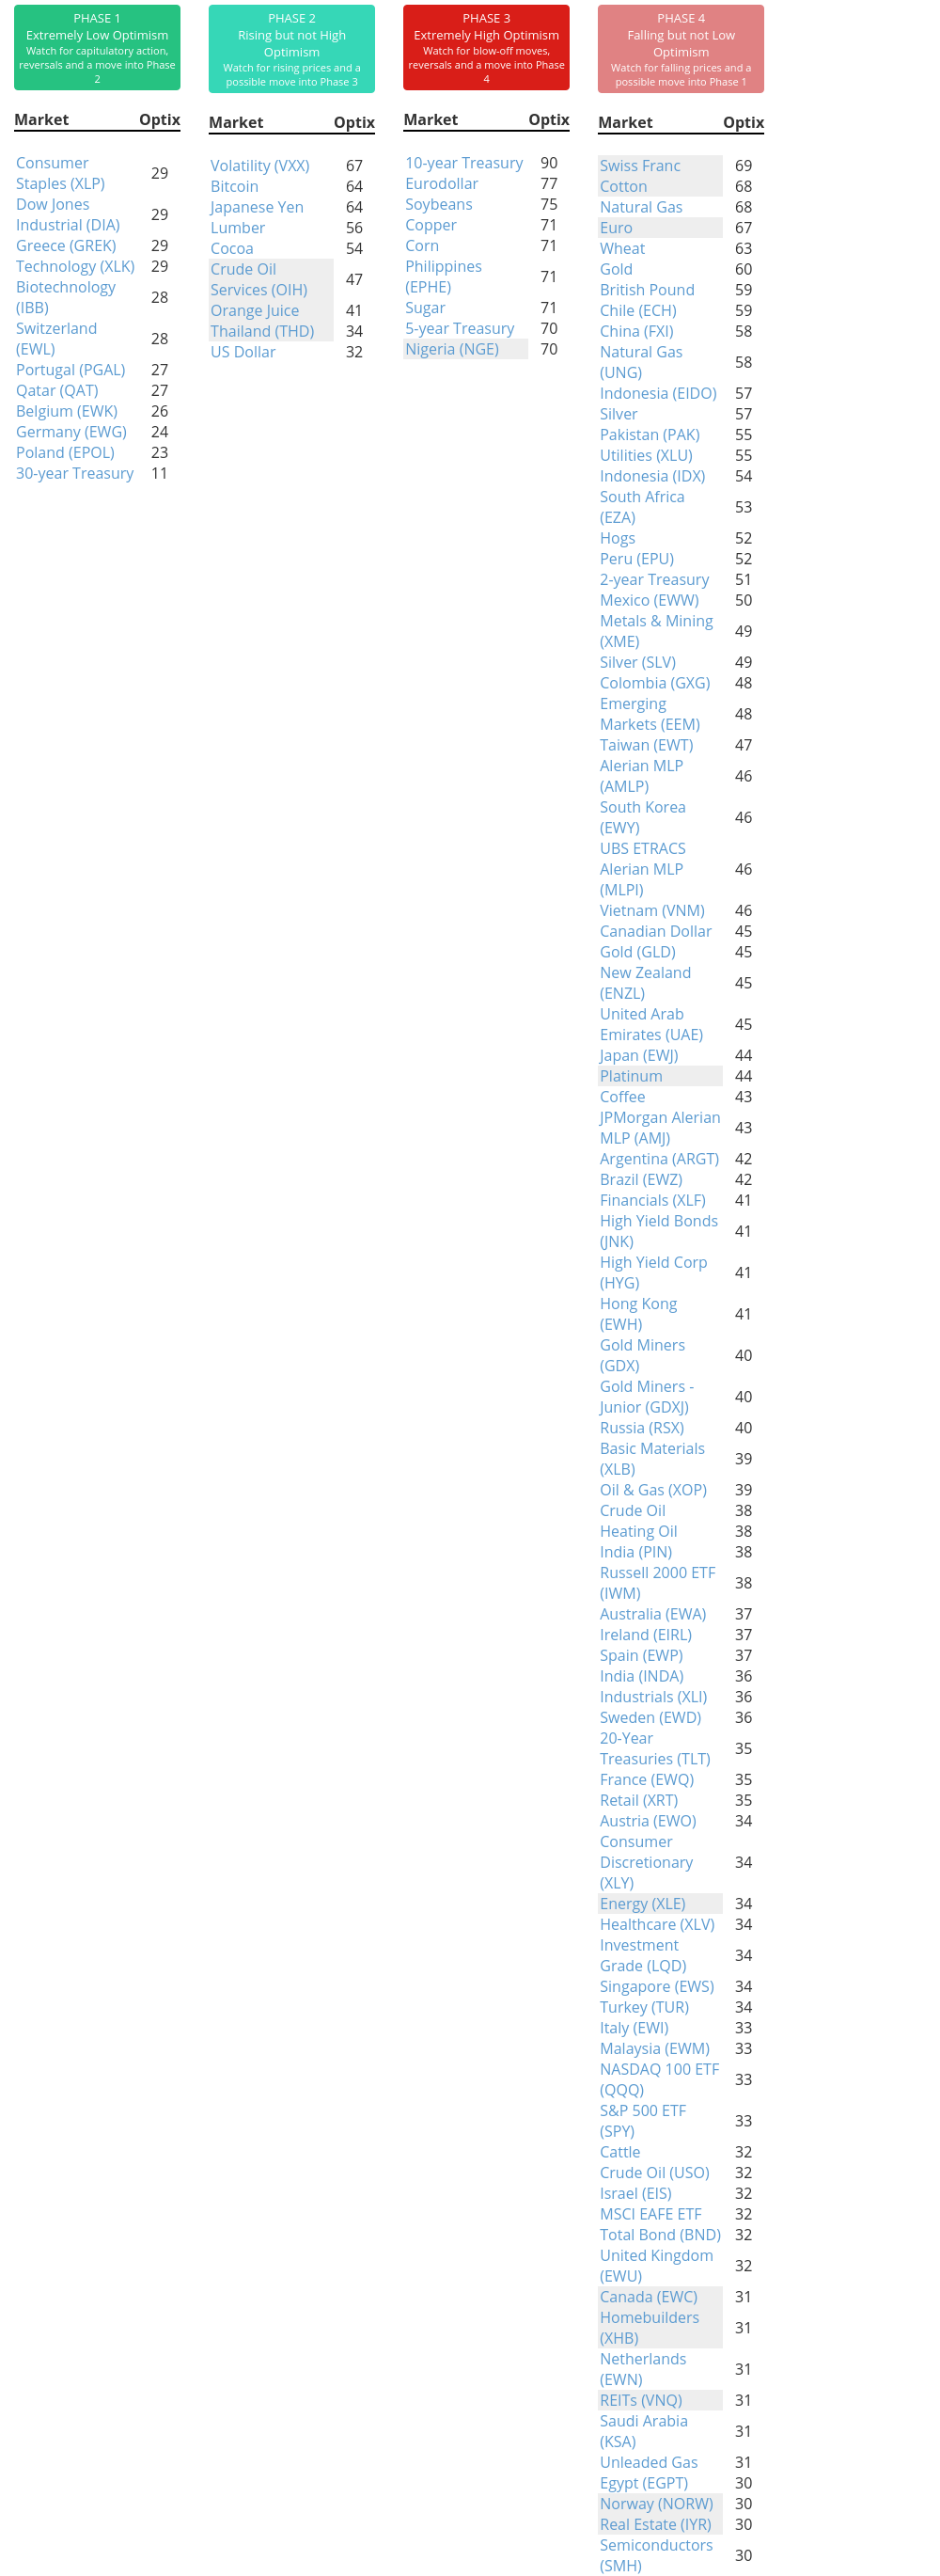
Phase Table
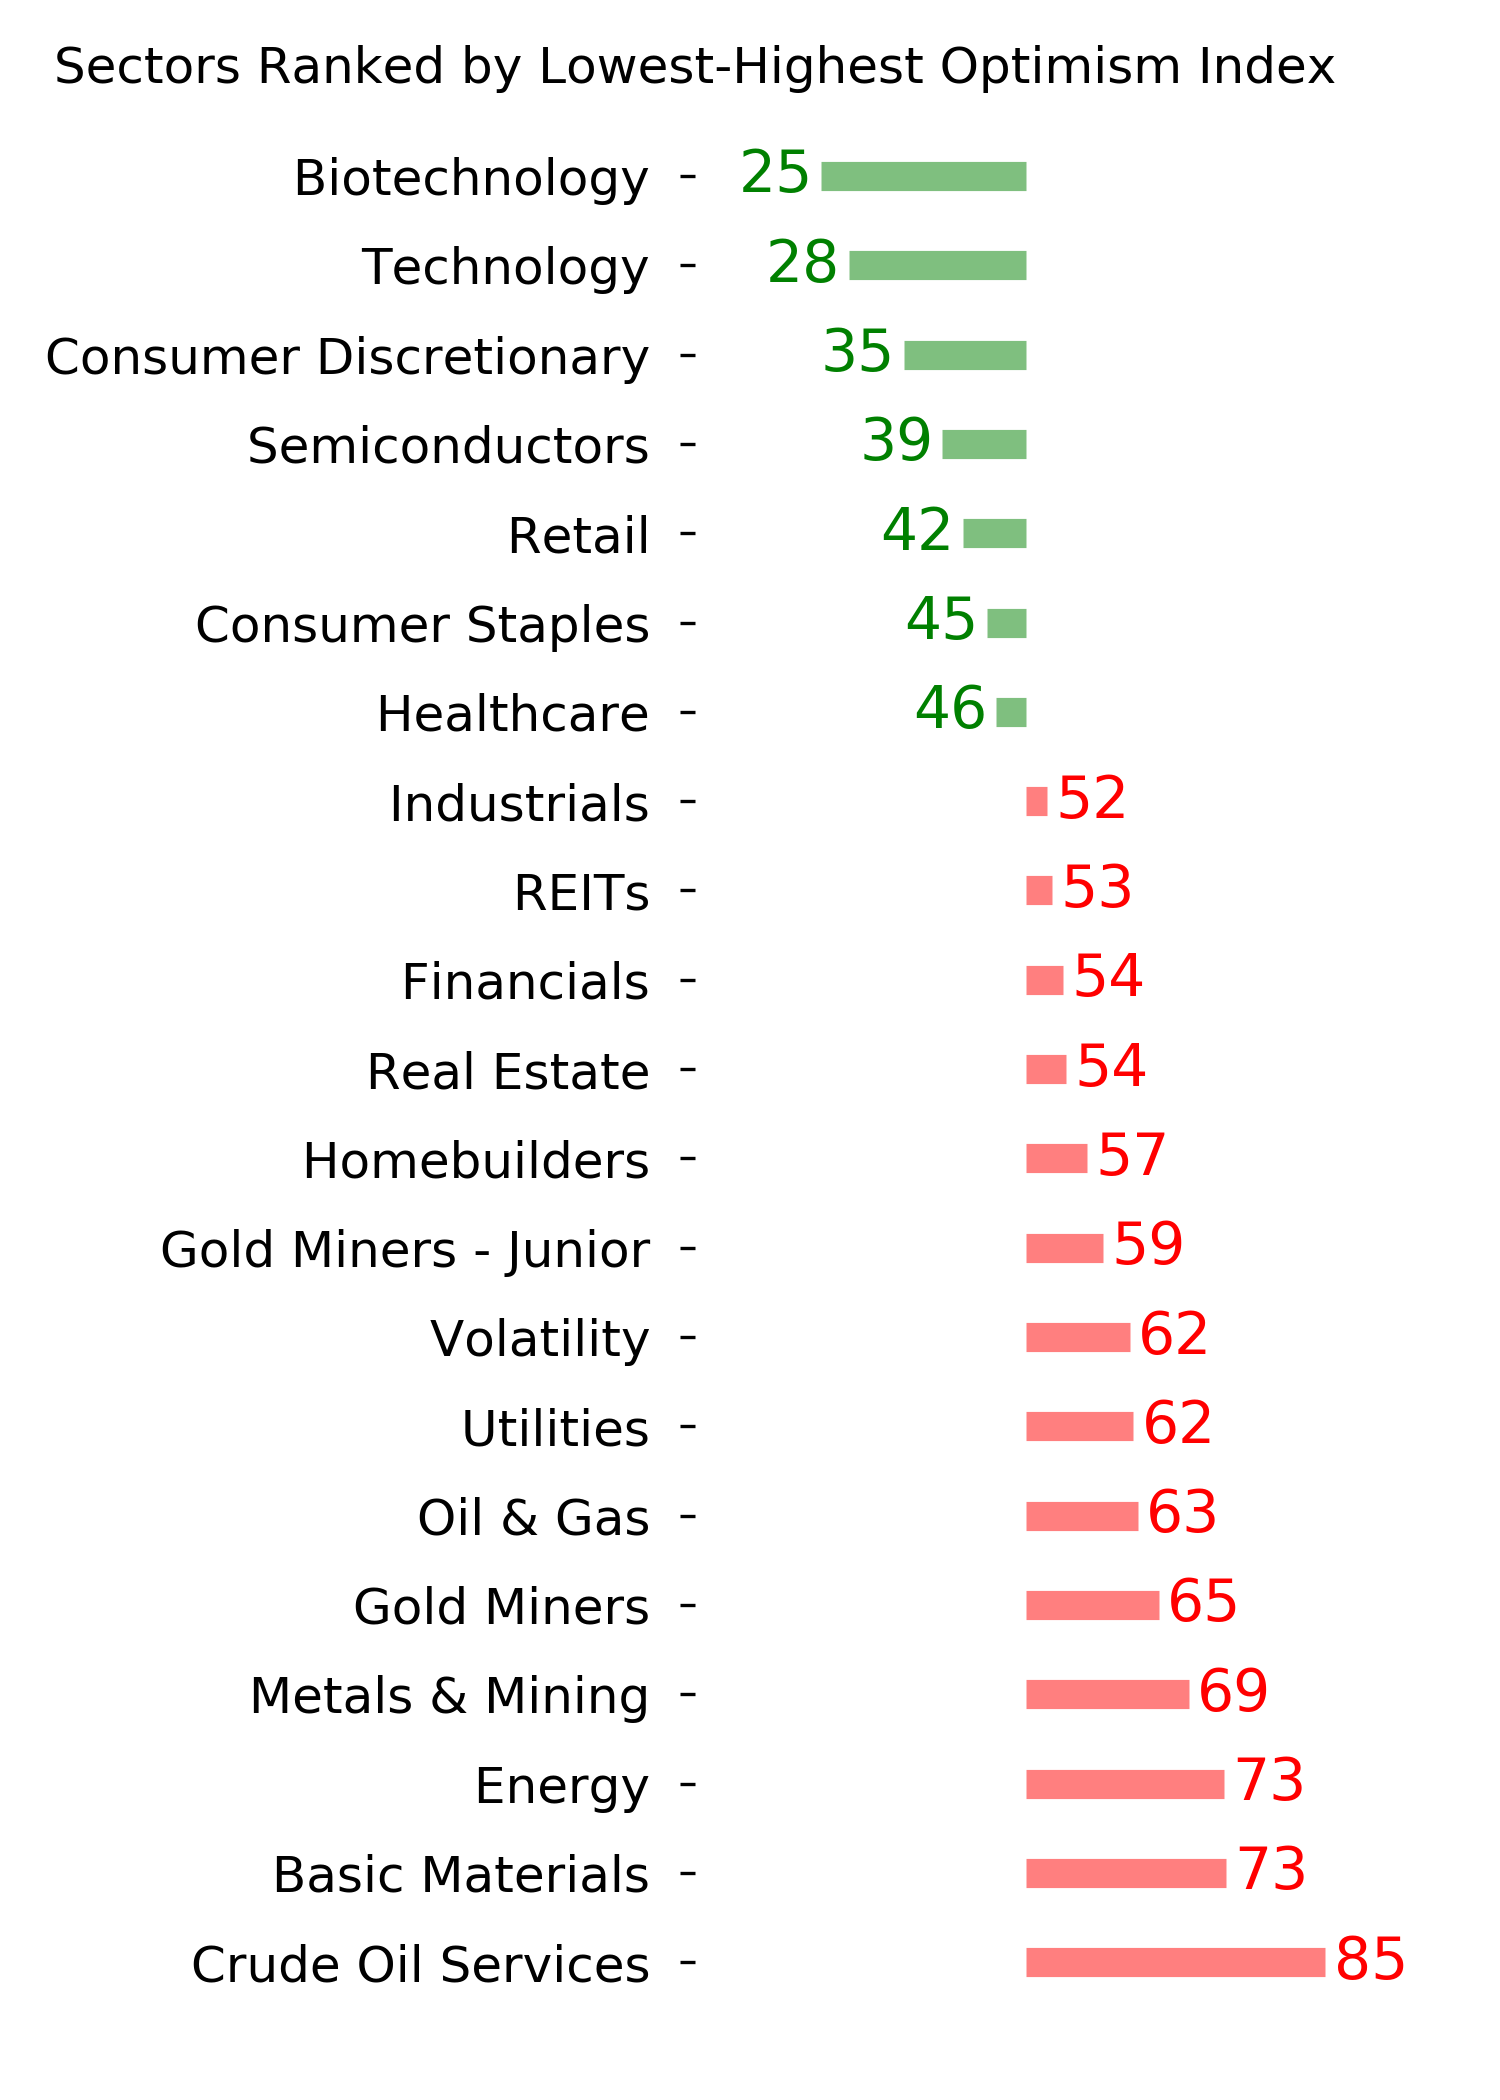
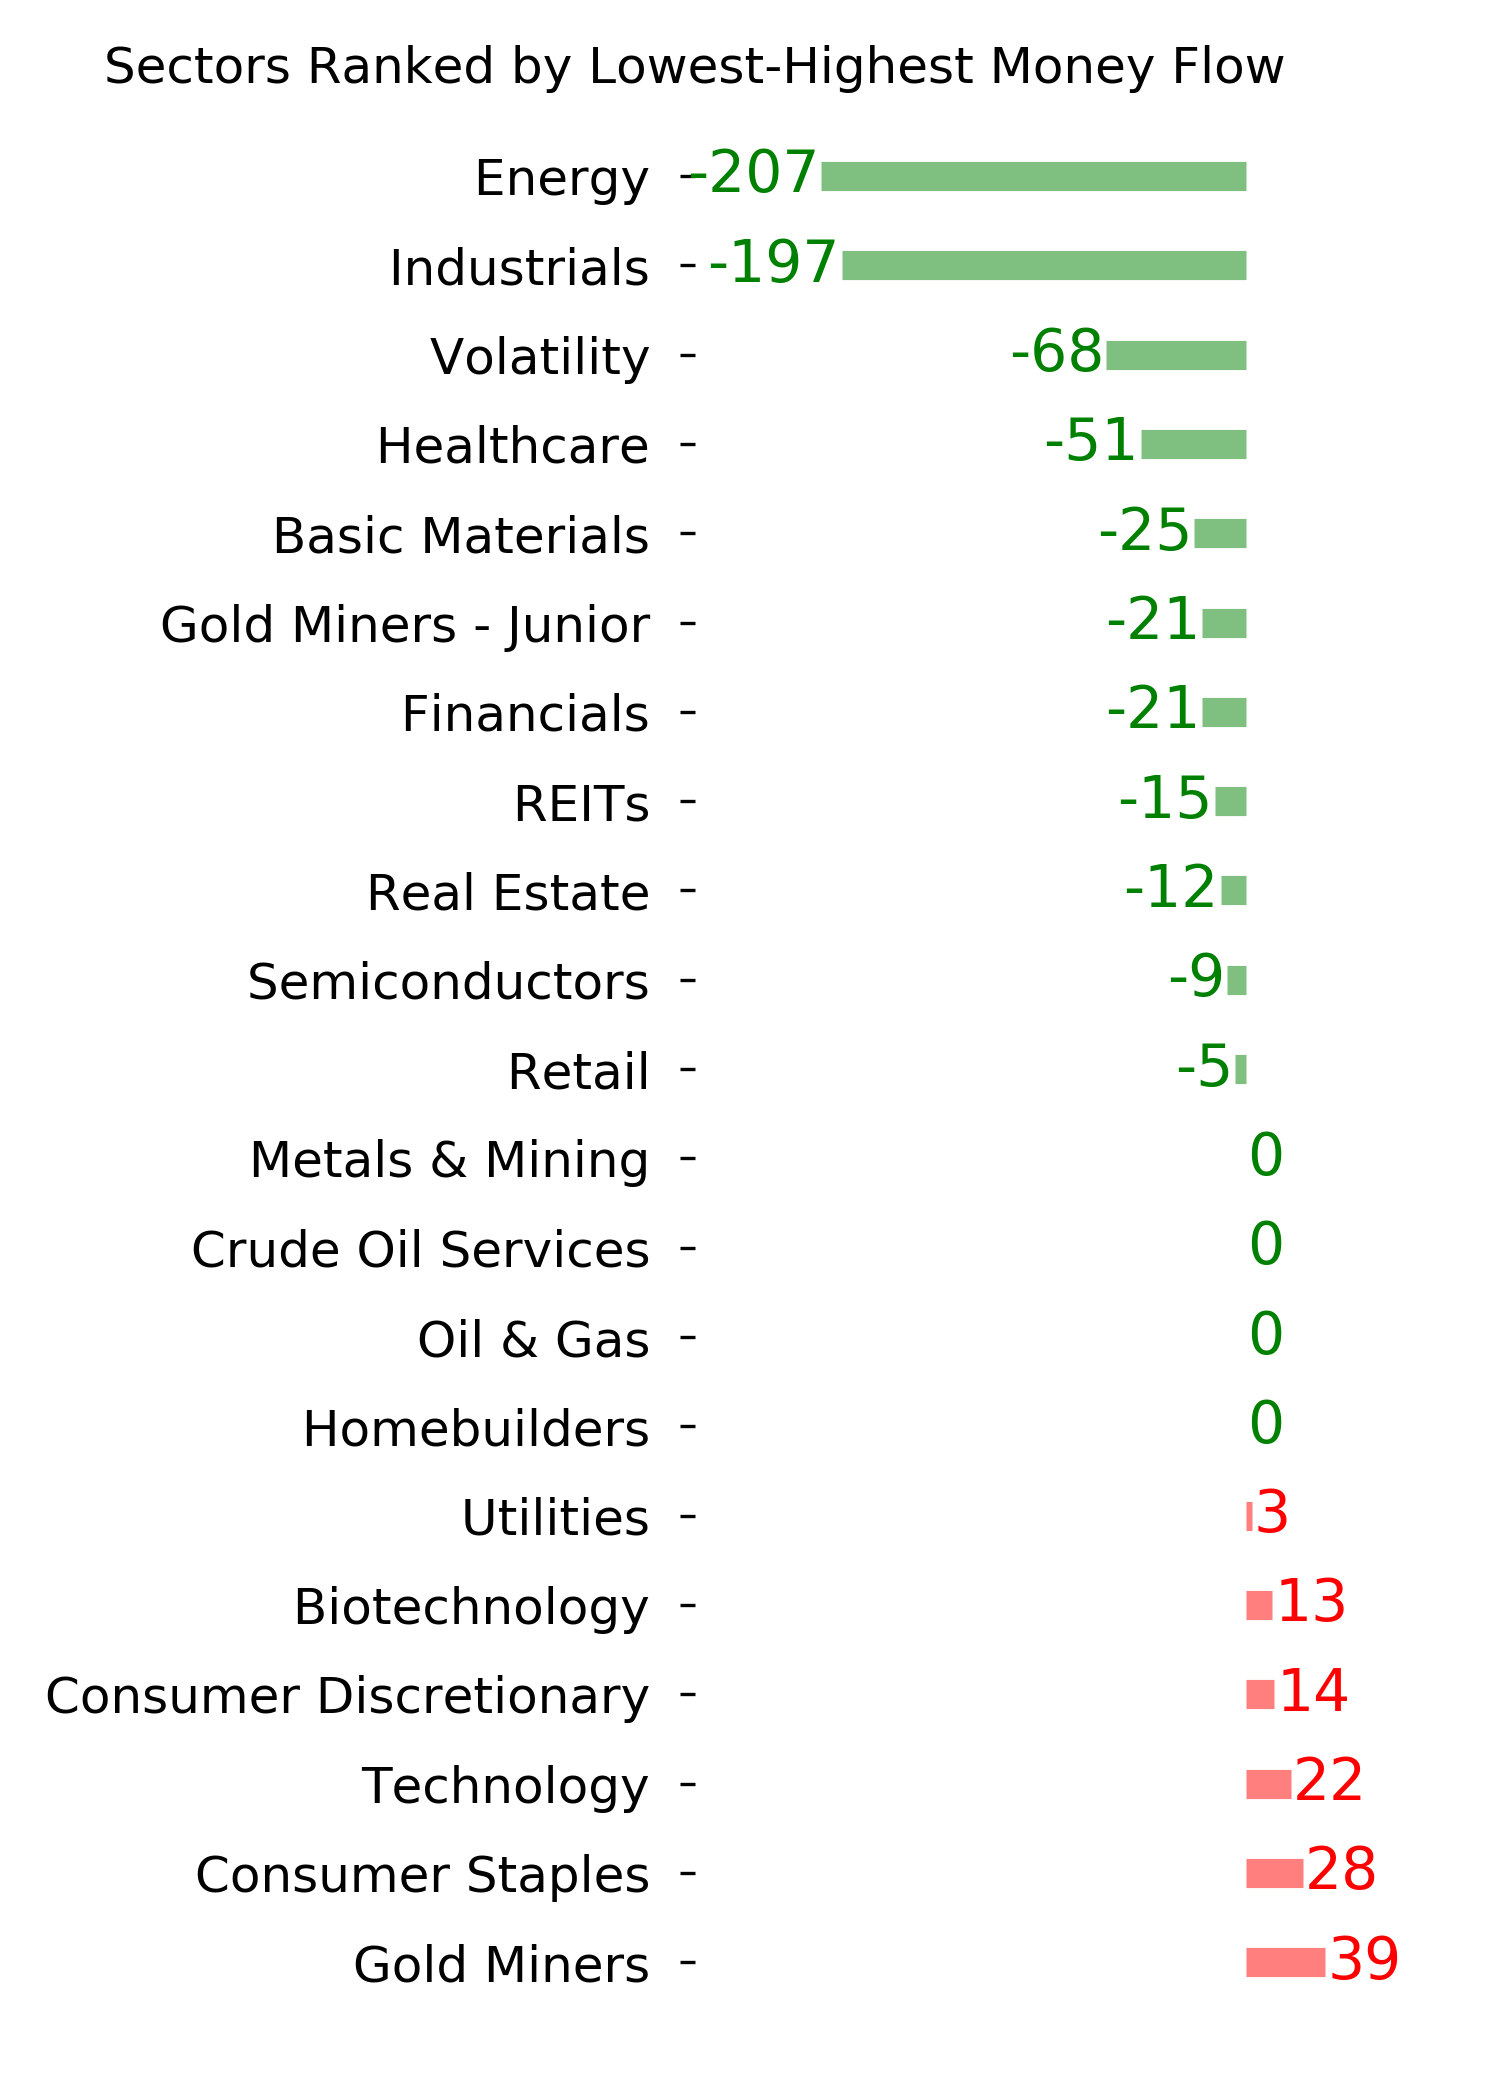
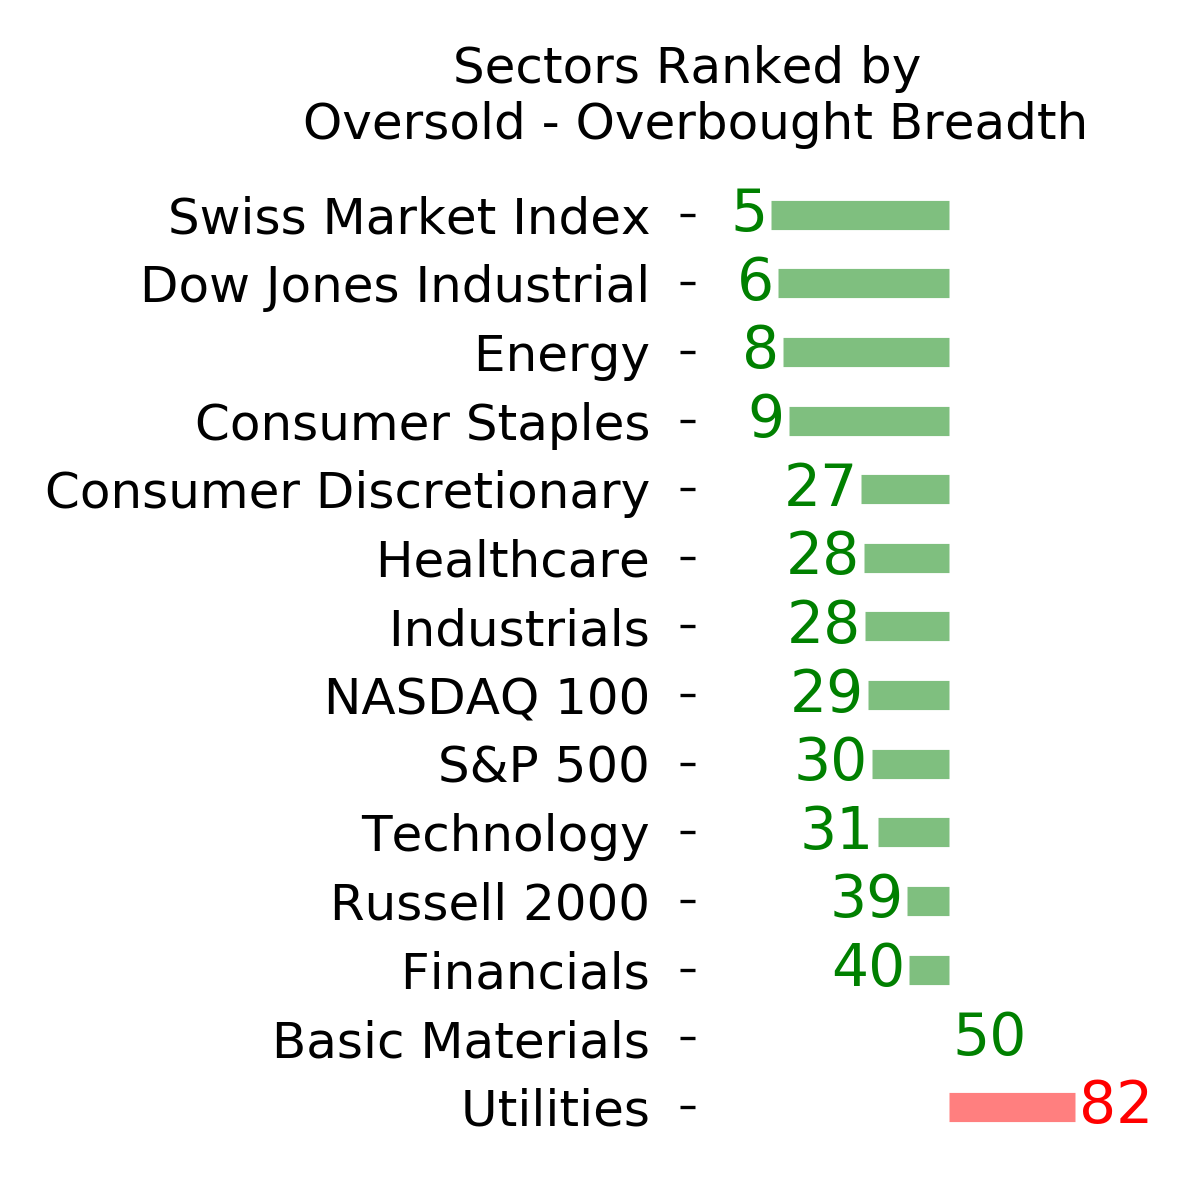
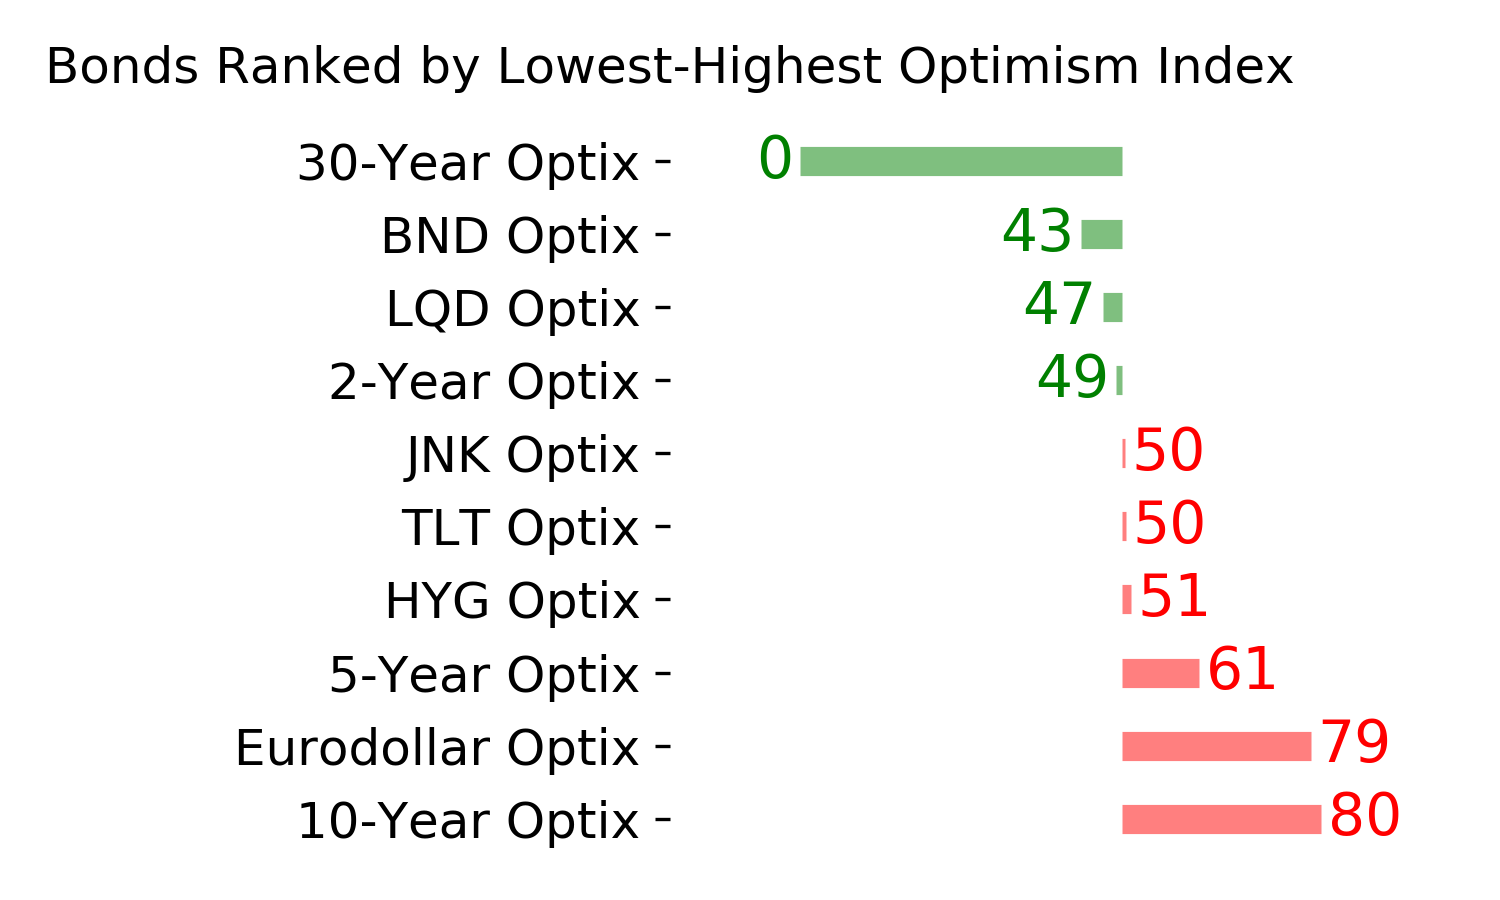
Ranks
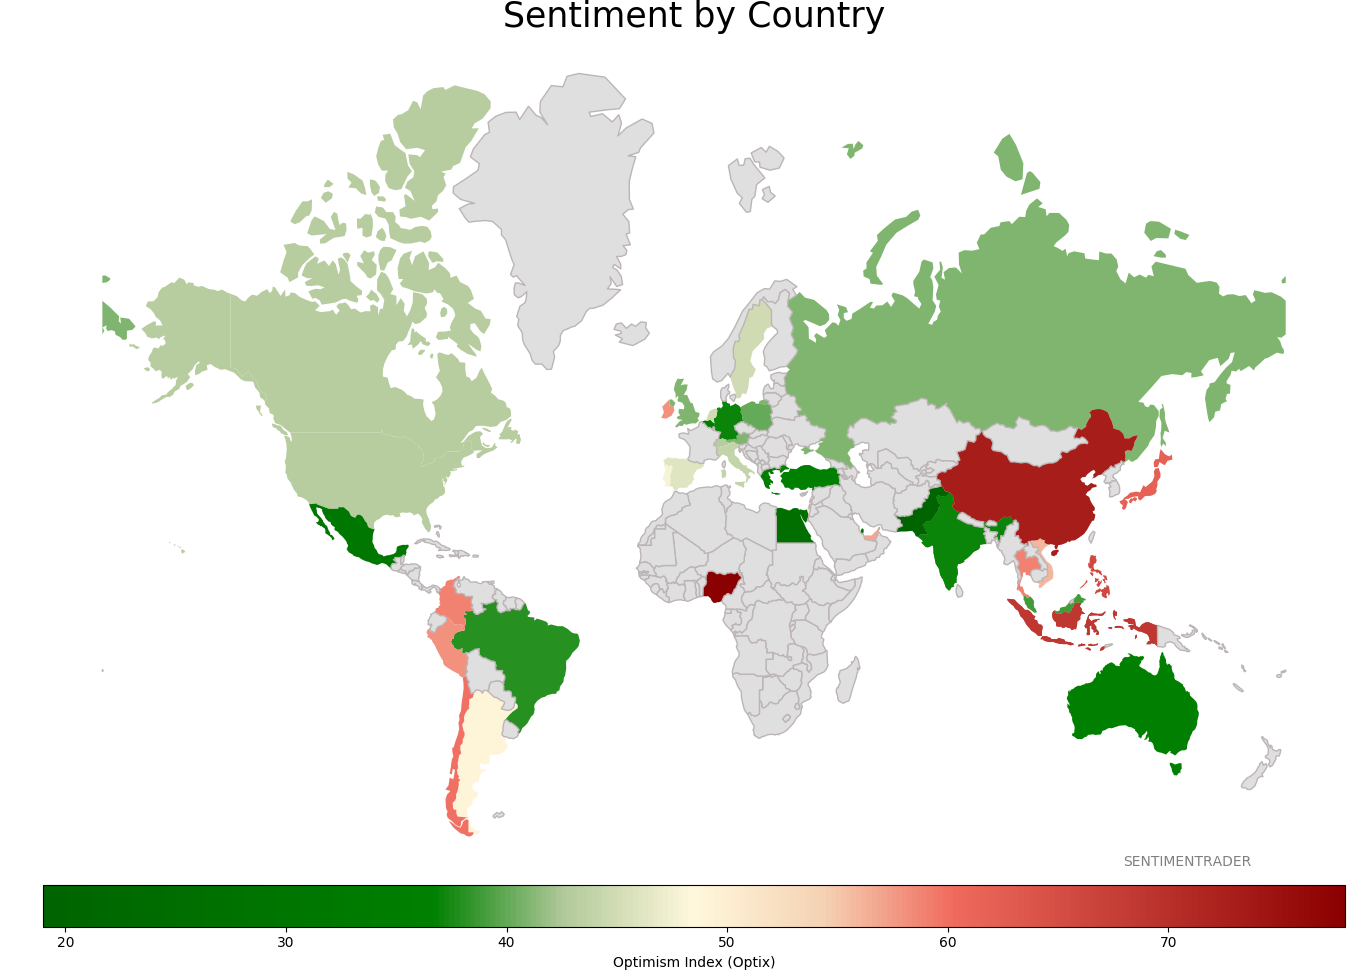
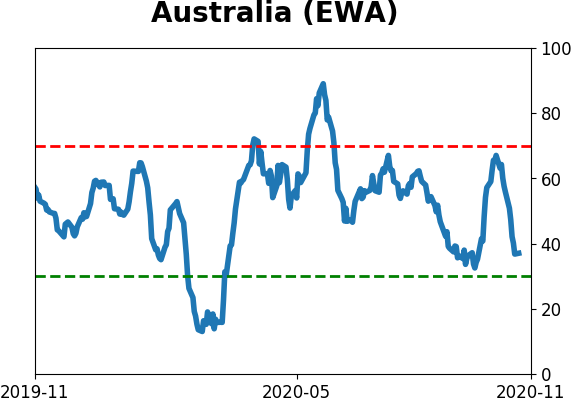
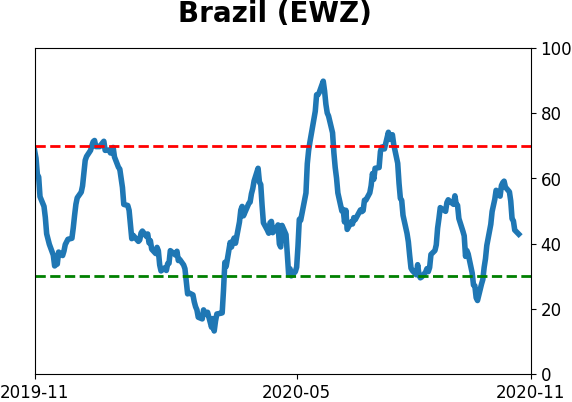
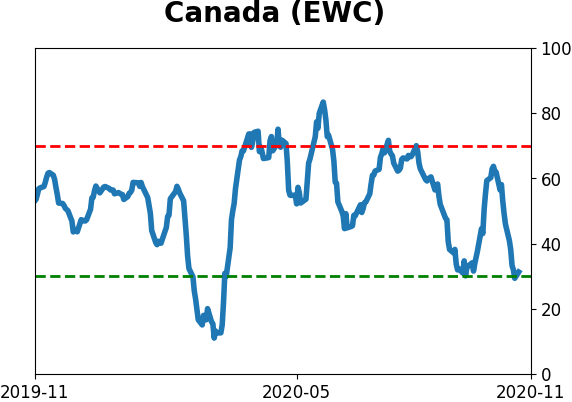
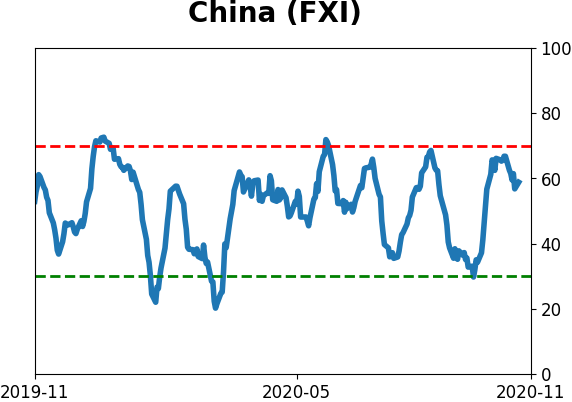
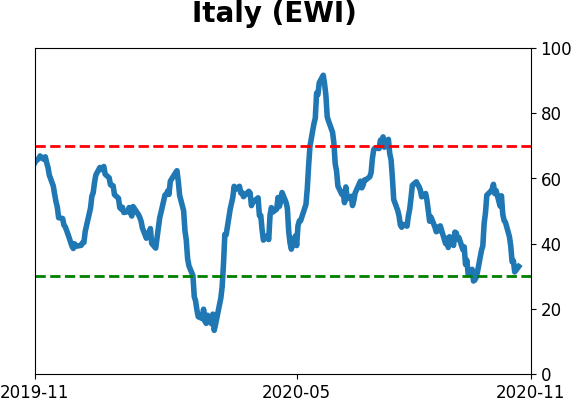
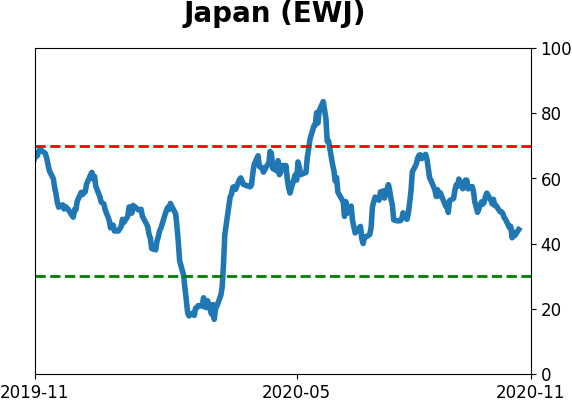
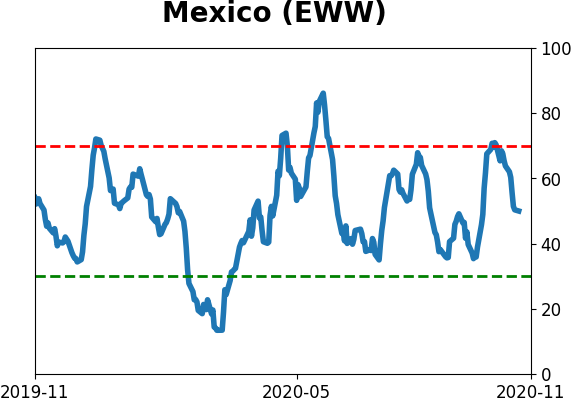
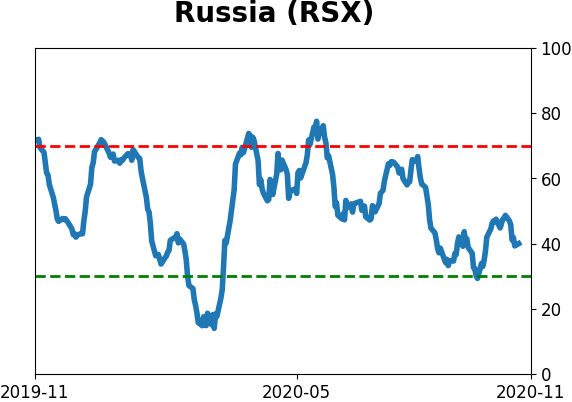
Sentiment Around The World
Optimism Index Thumbnails
|
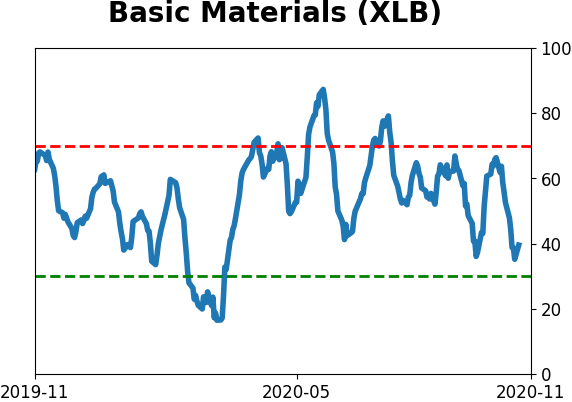
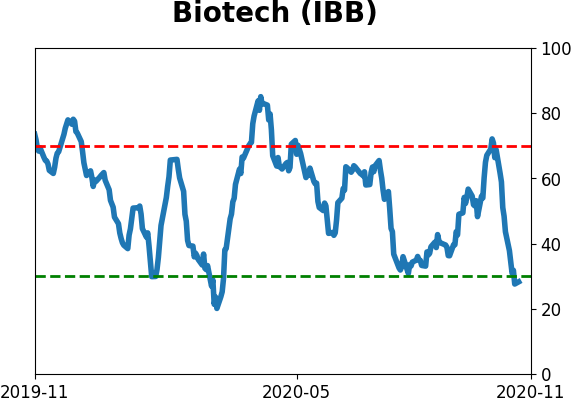
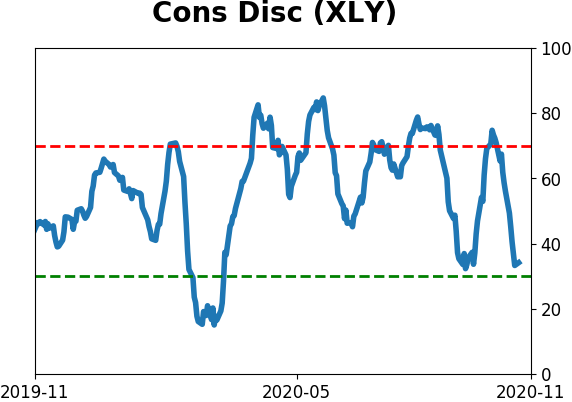
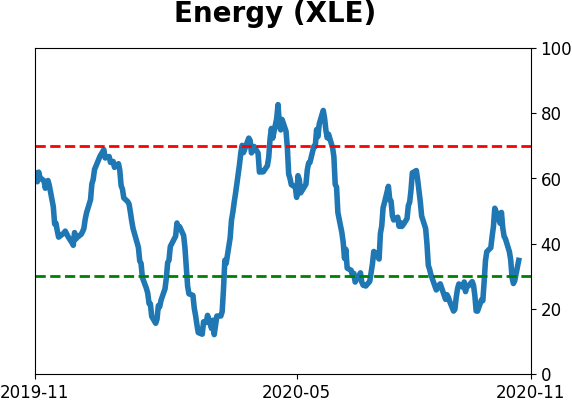
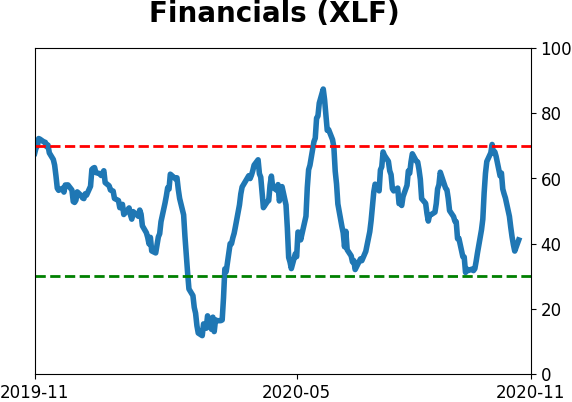
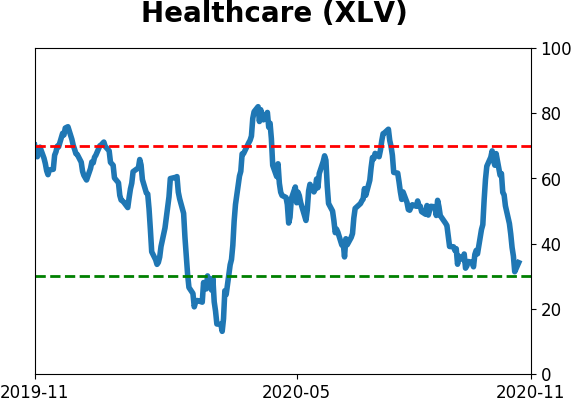
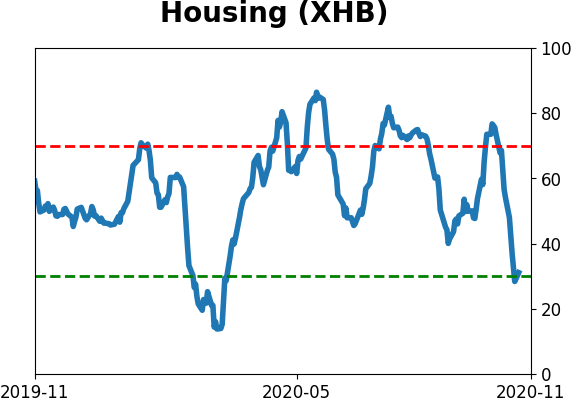
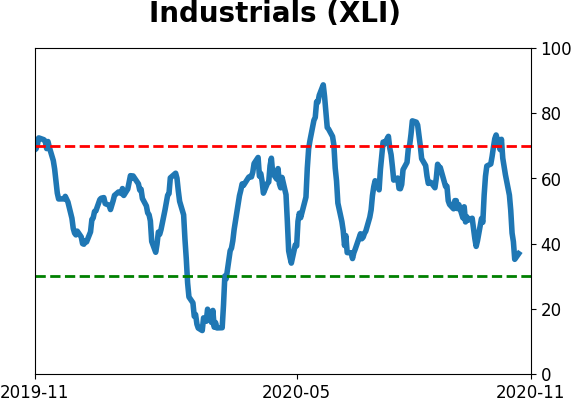
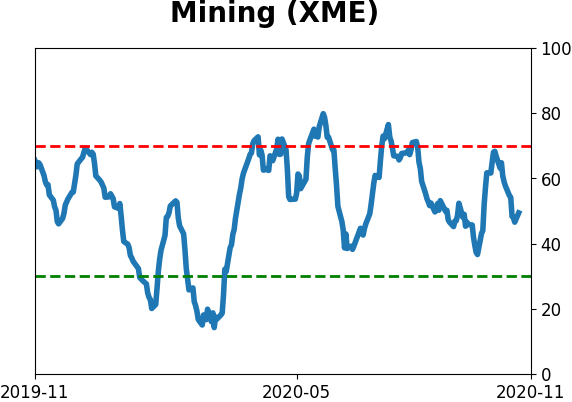
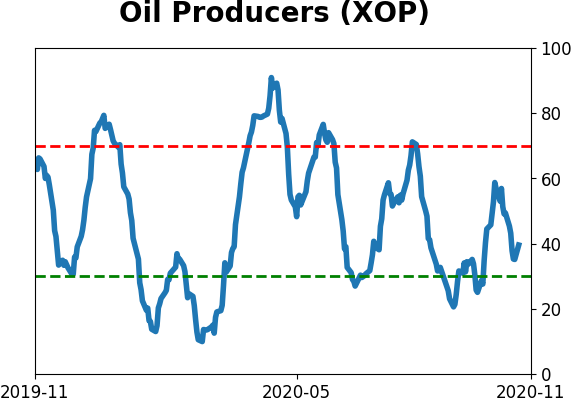
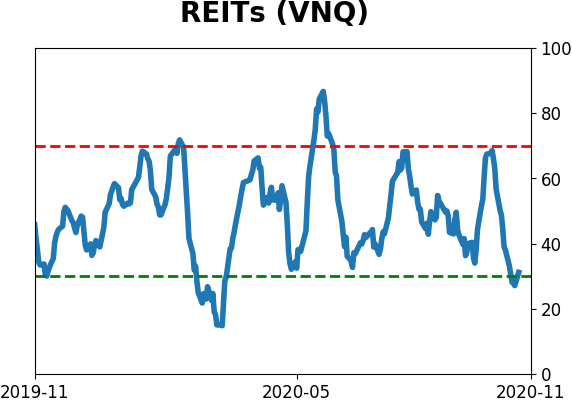
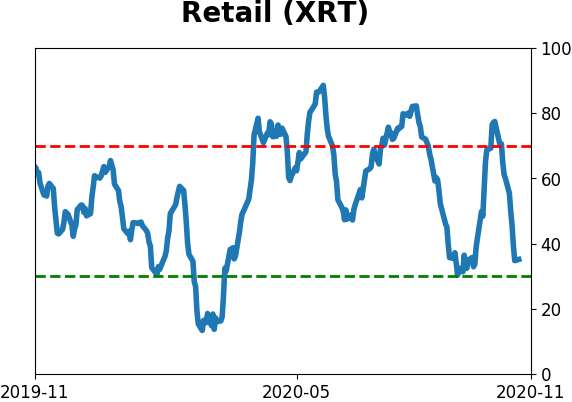
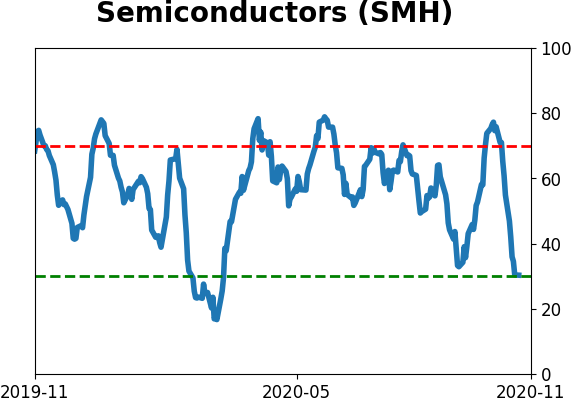
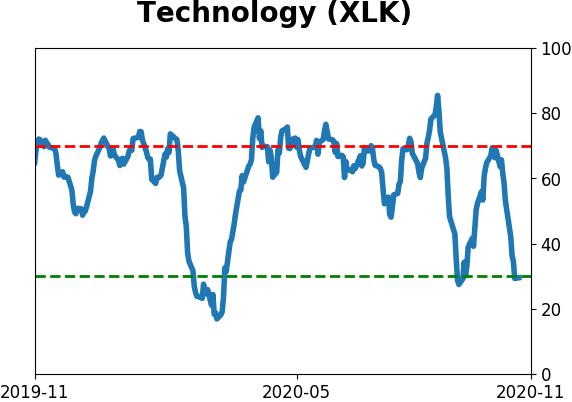
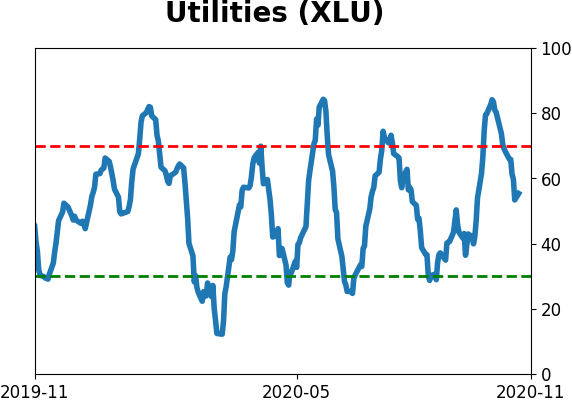
Sector ETF's - 10-Day Moving Average
|
|
|
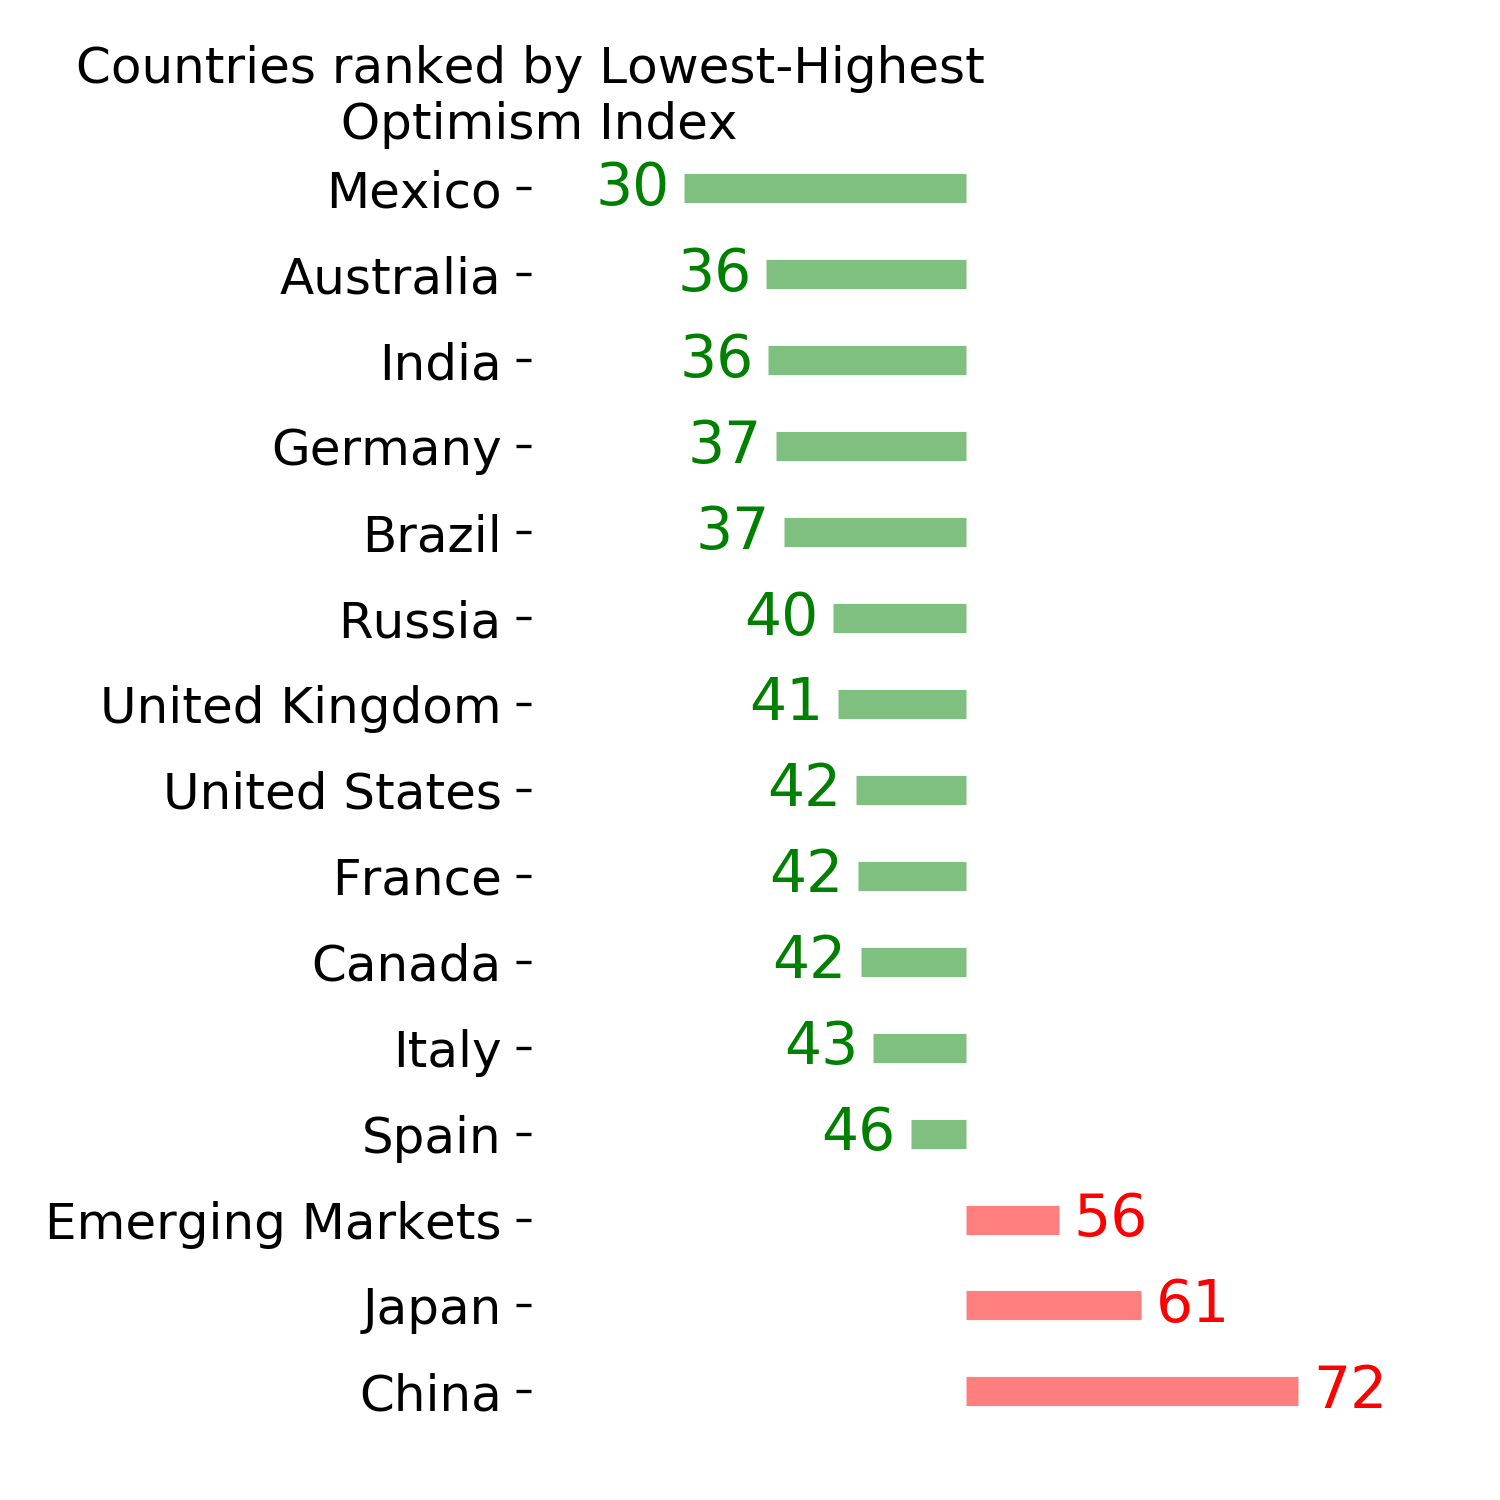
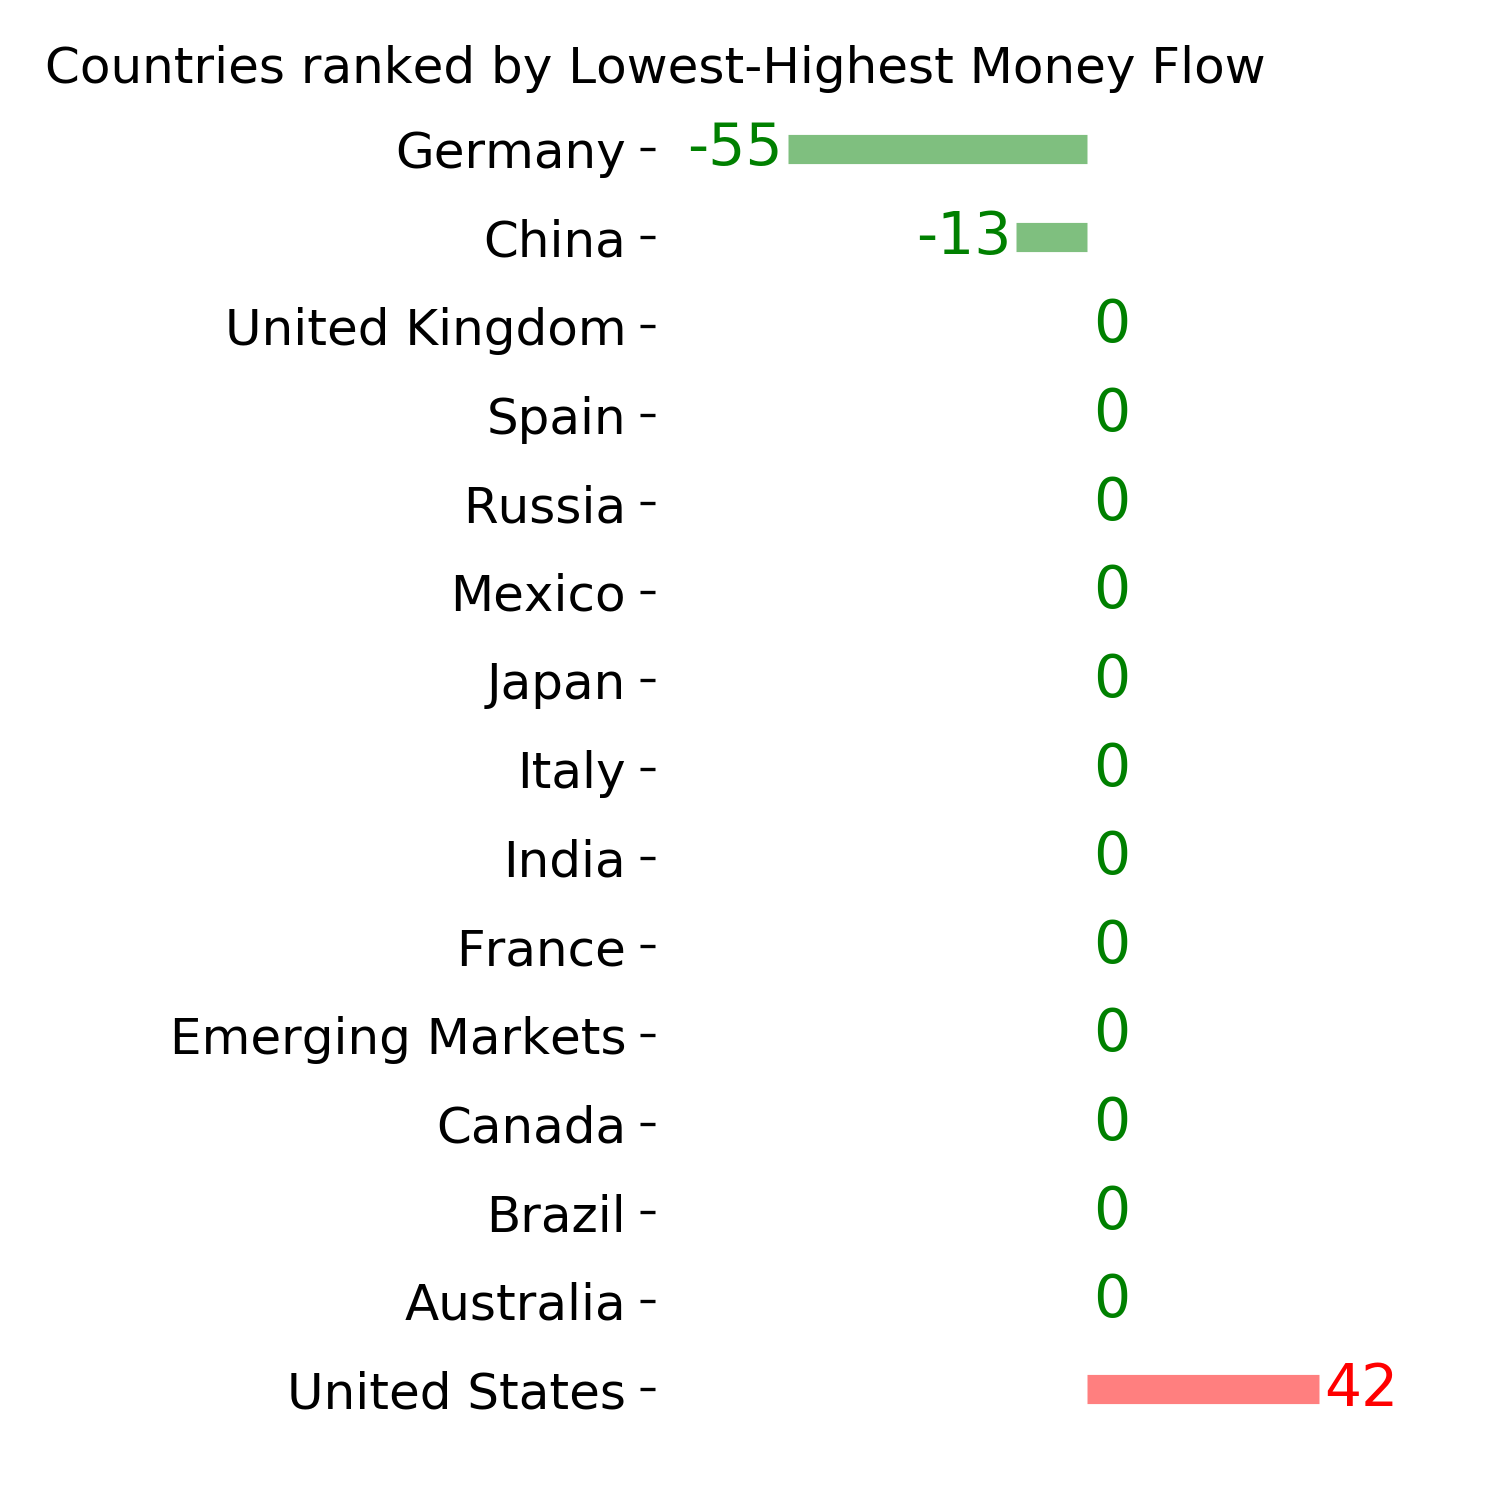
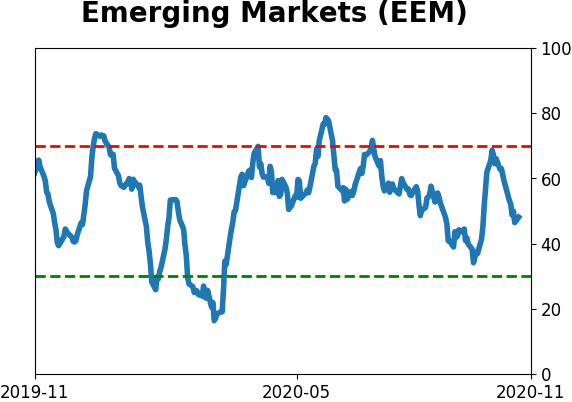
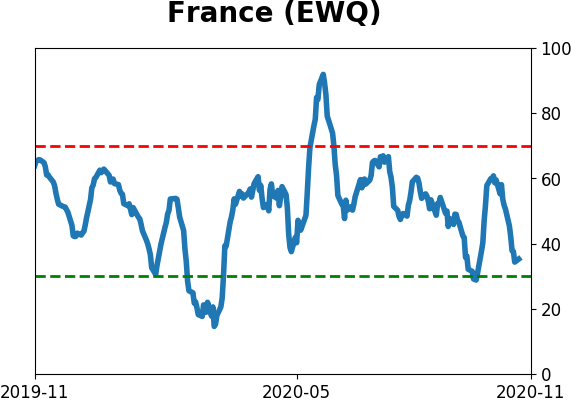
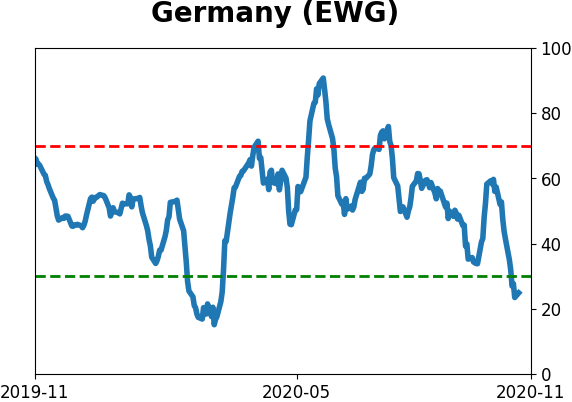
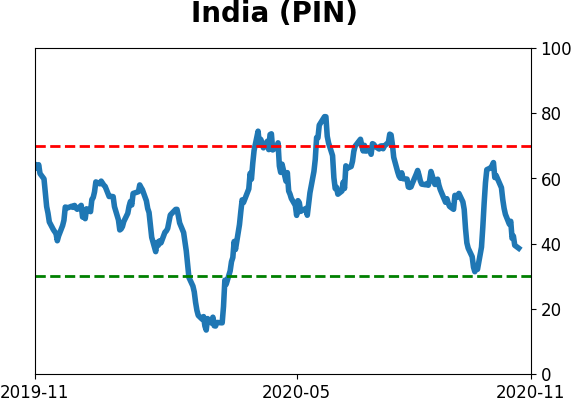
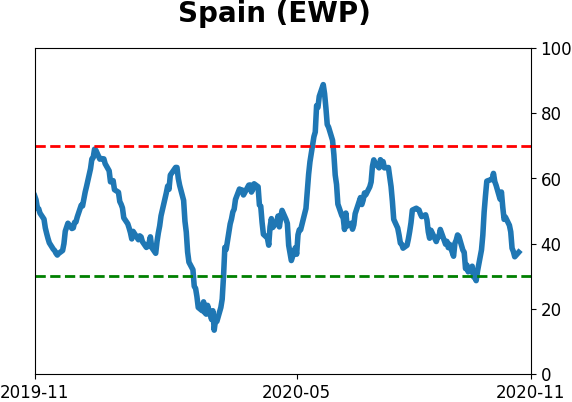
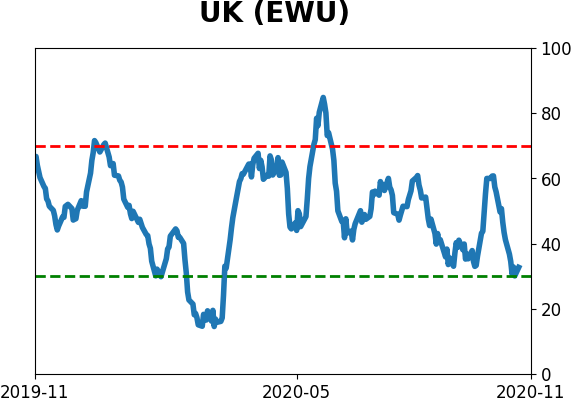
Country ETF's - 10-Day Moving Average
|
|
|
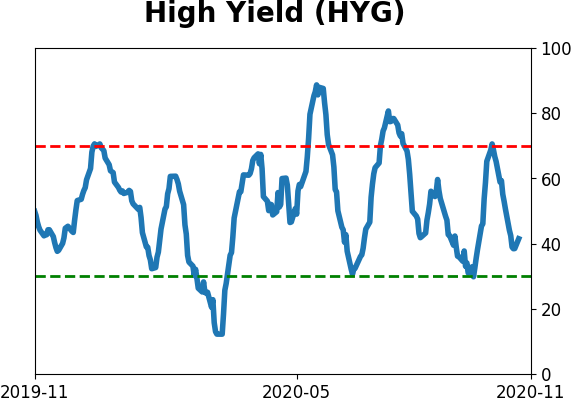
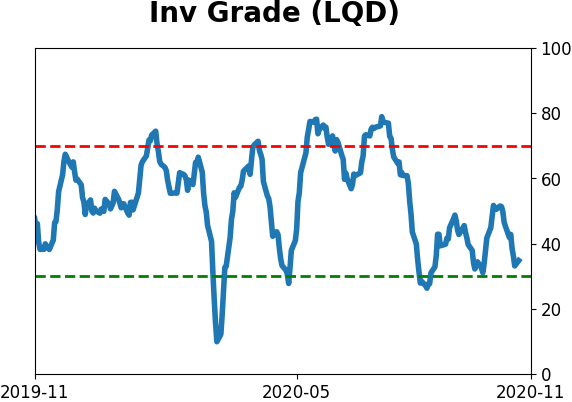
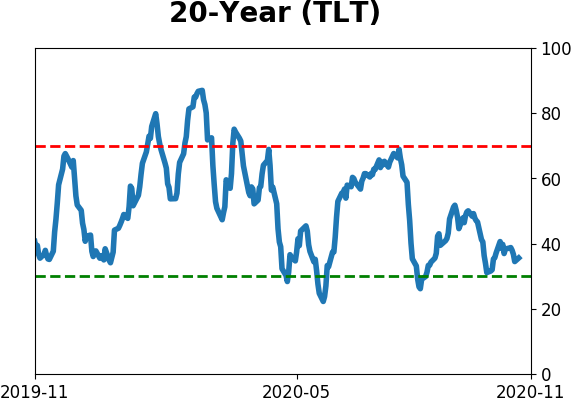
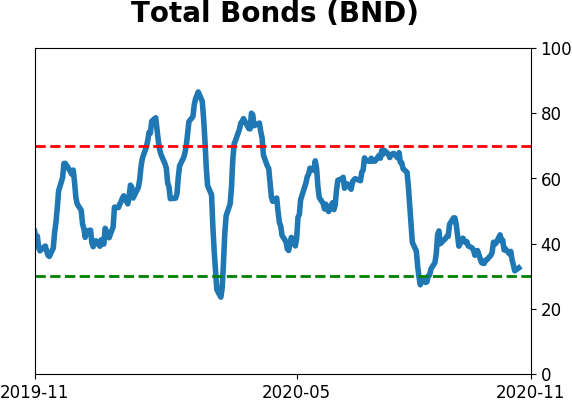
Bond ETF's - 10-Day Moving Average
|
|
|
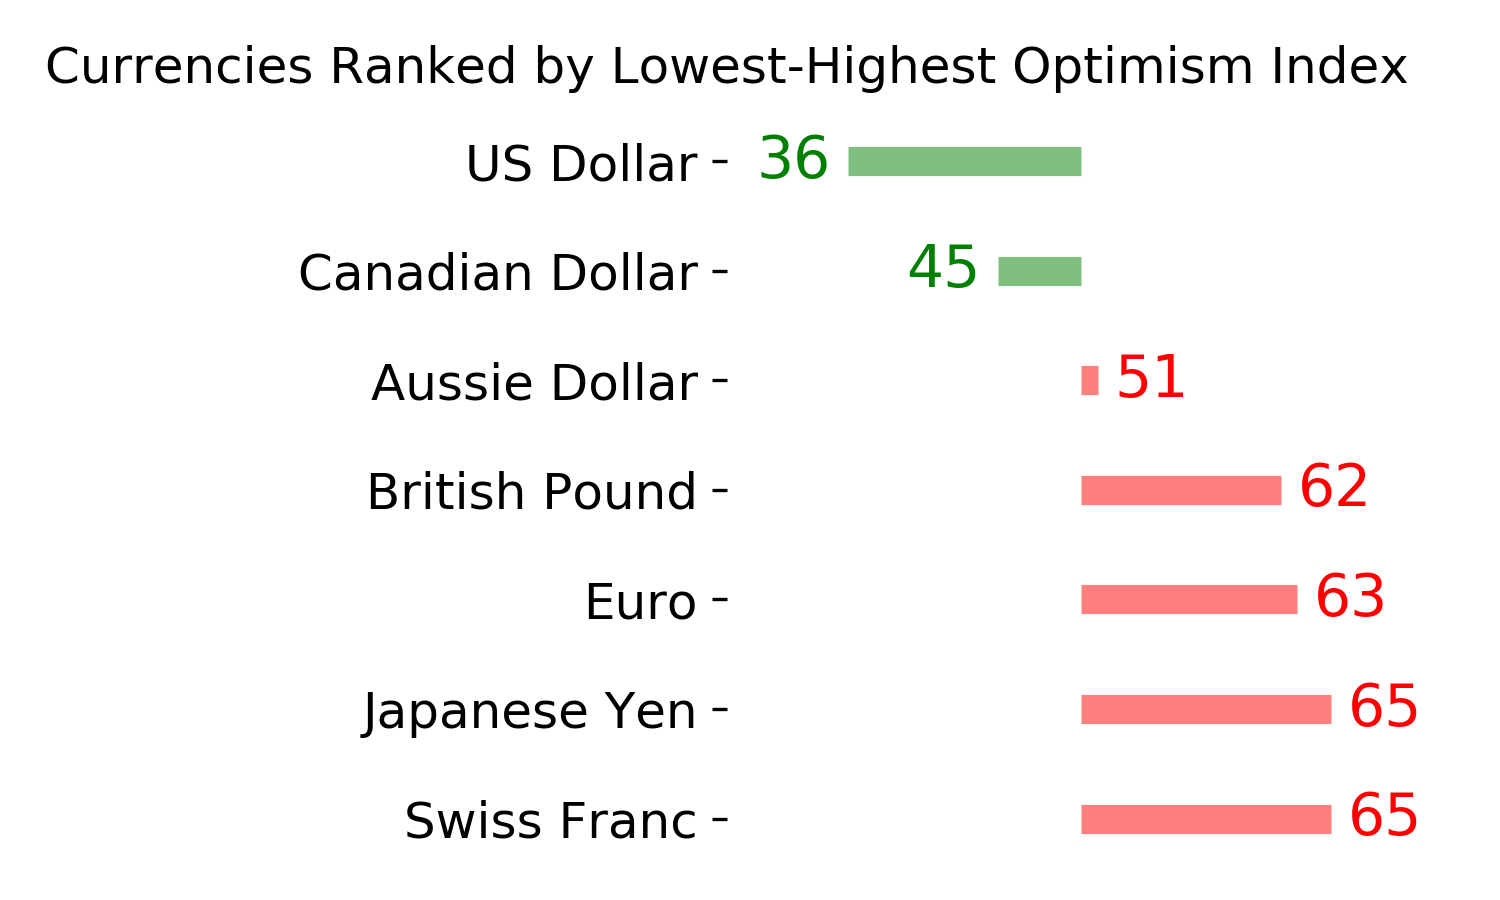
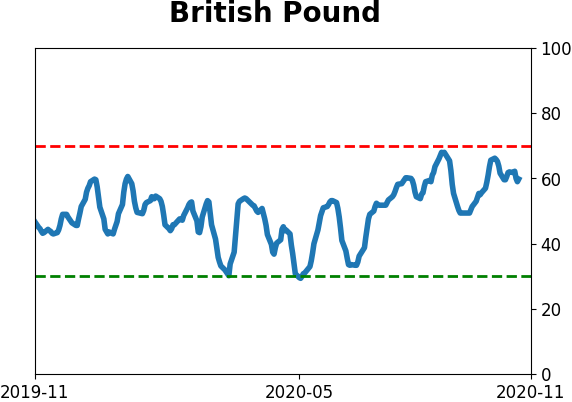
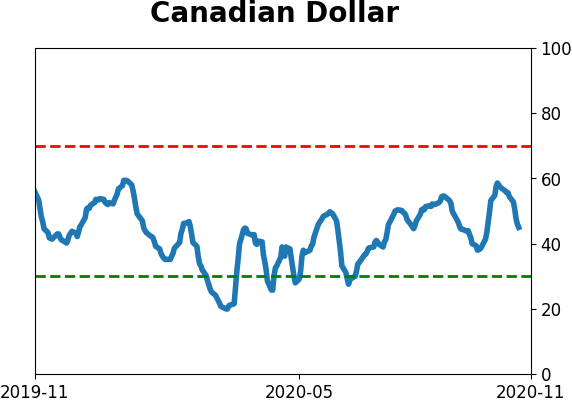
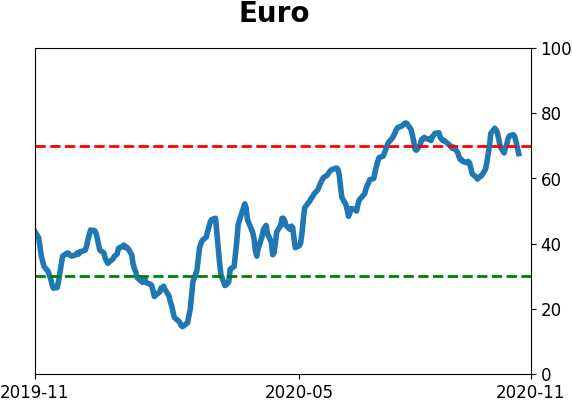
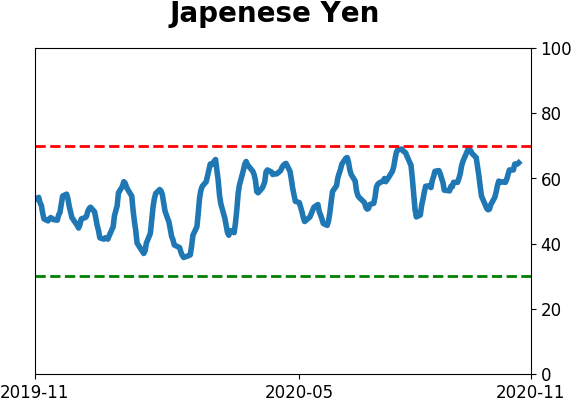
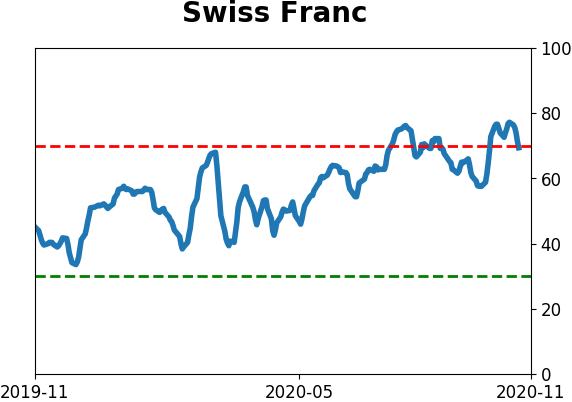
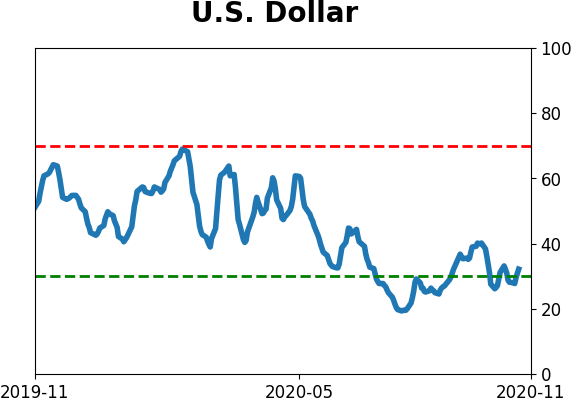
Currency ETF's - 5-Day Moving Average
|
|
|
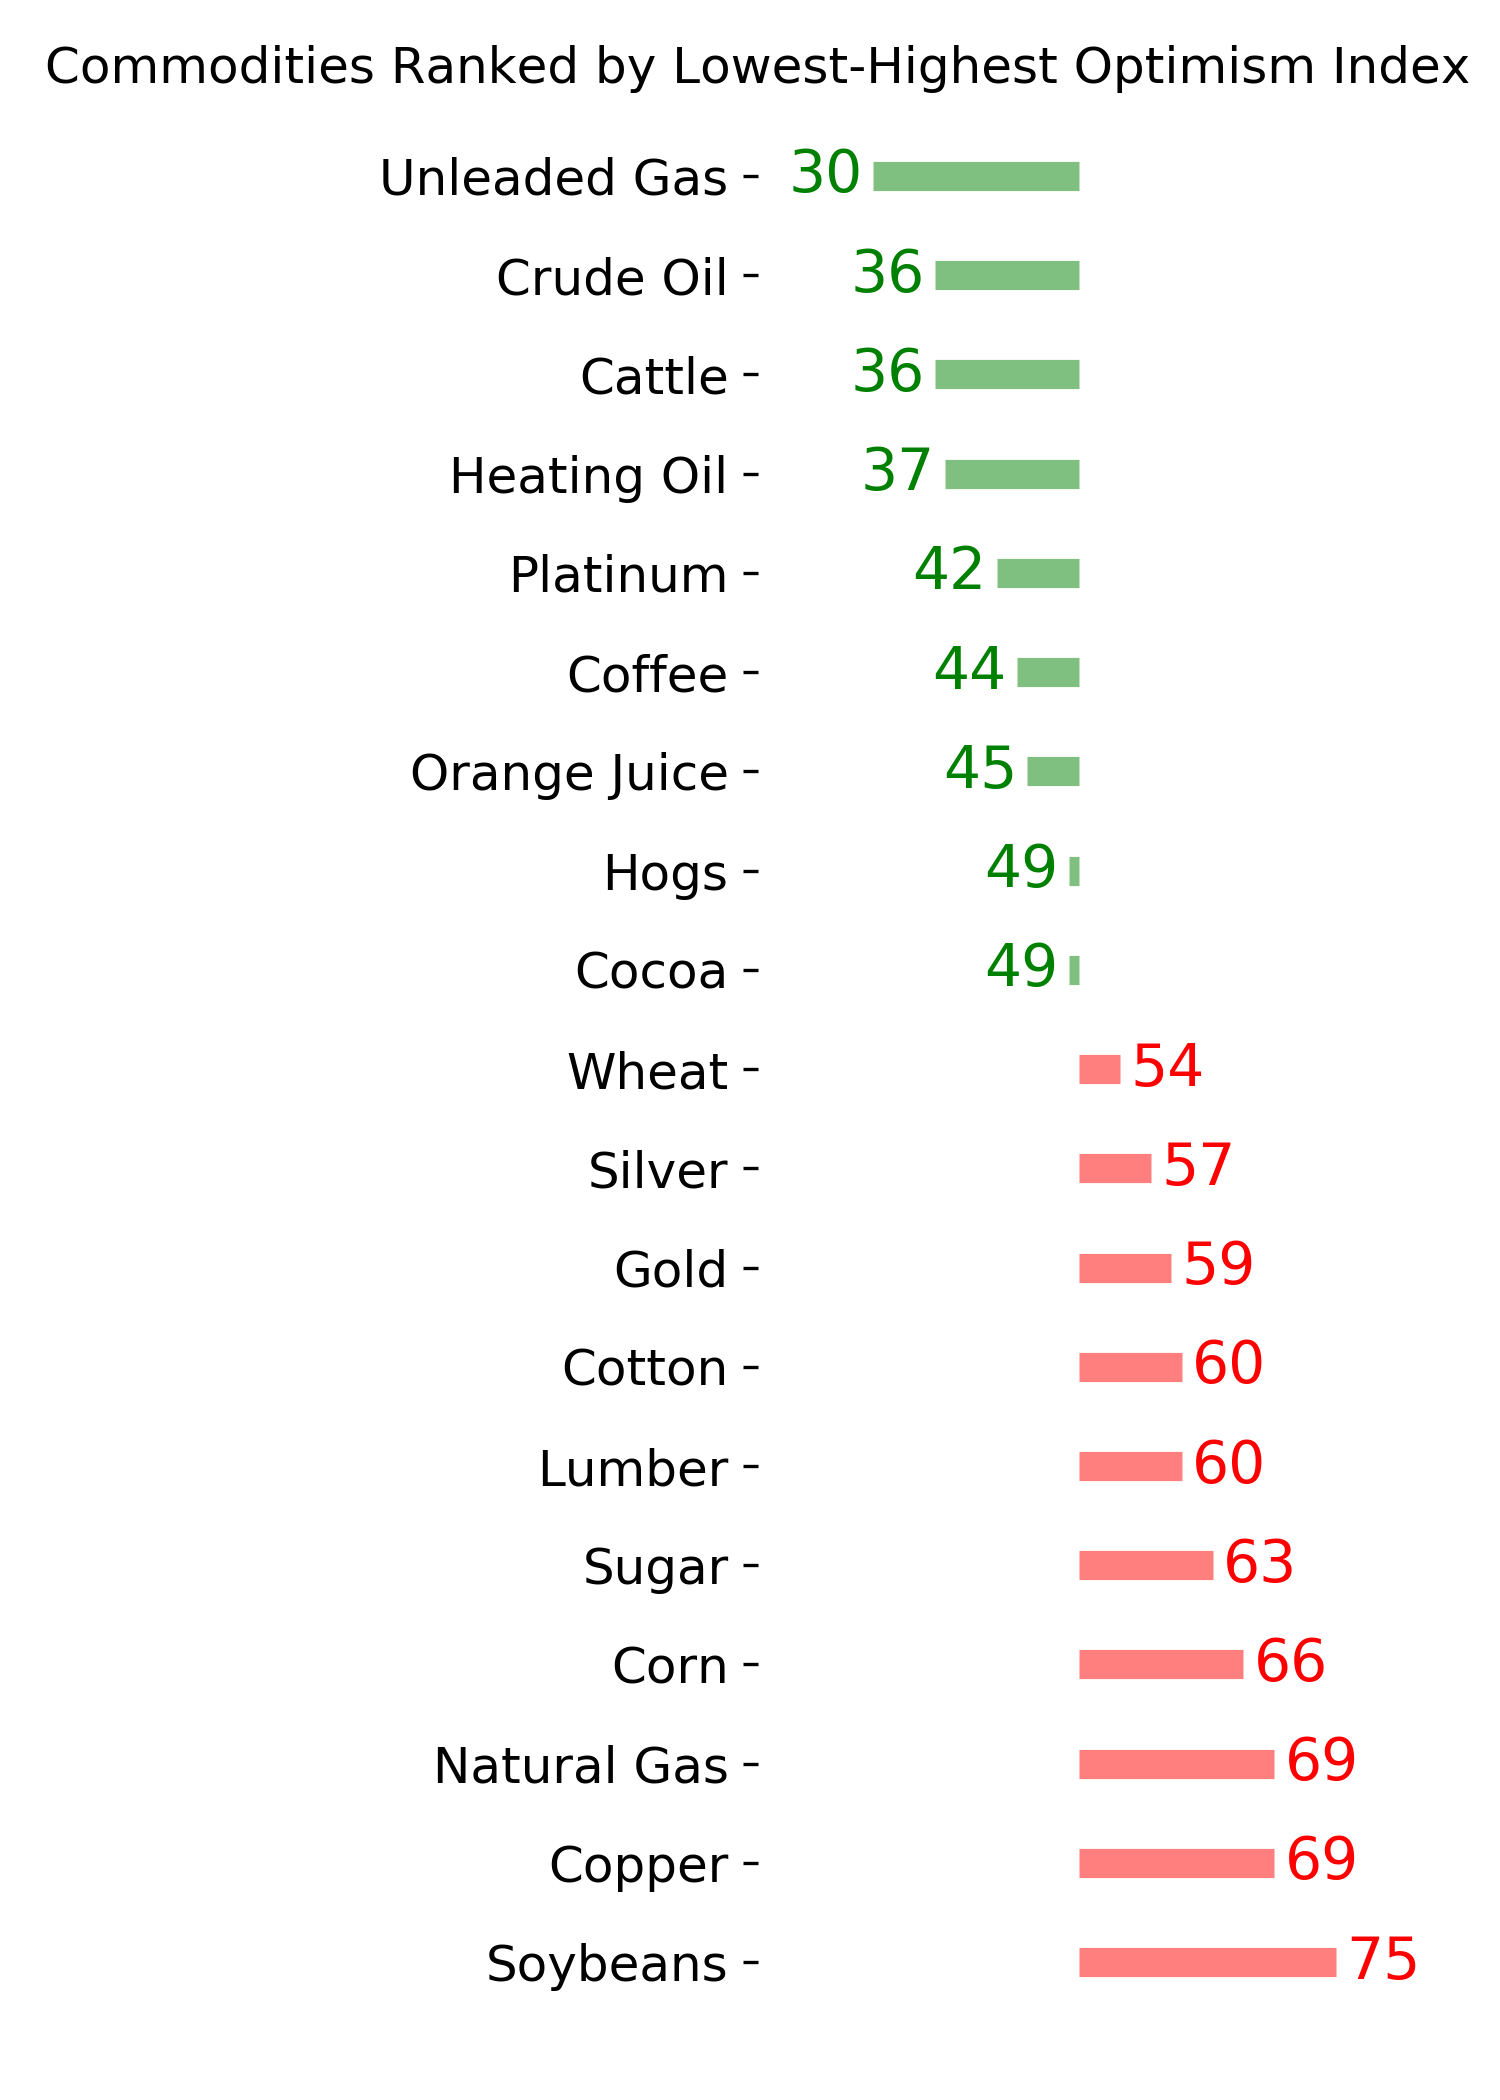
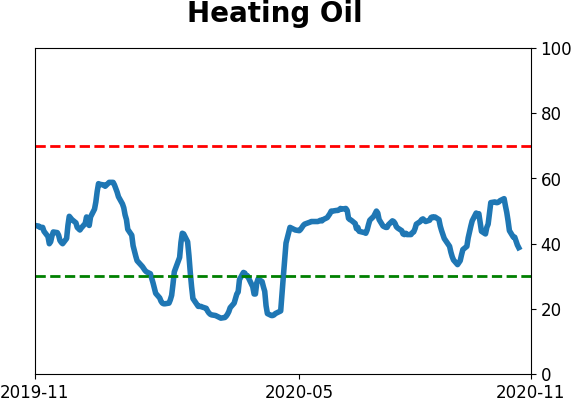
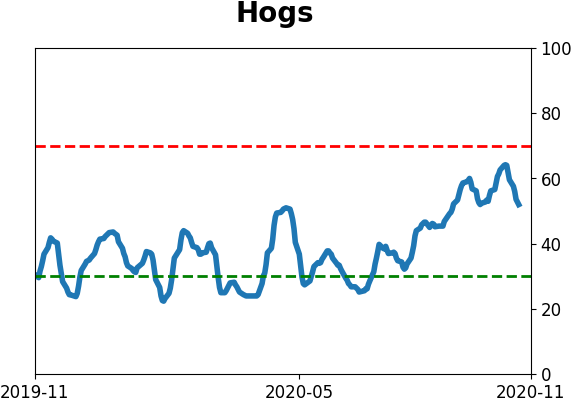
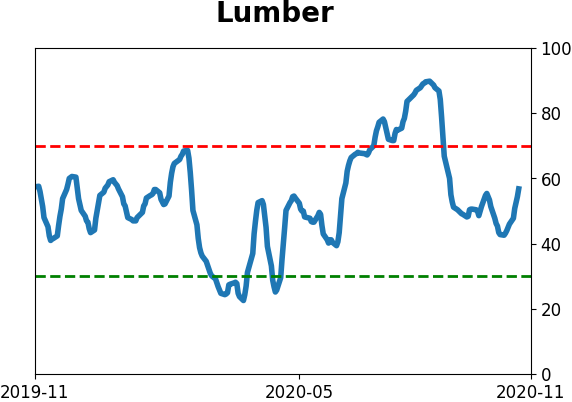
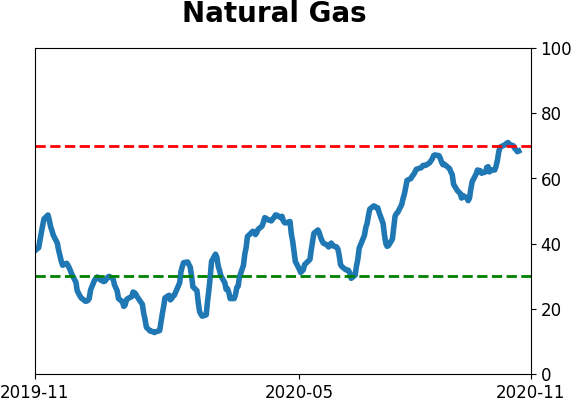
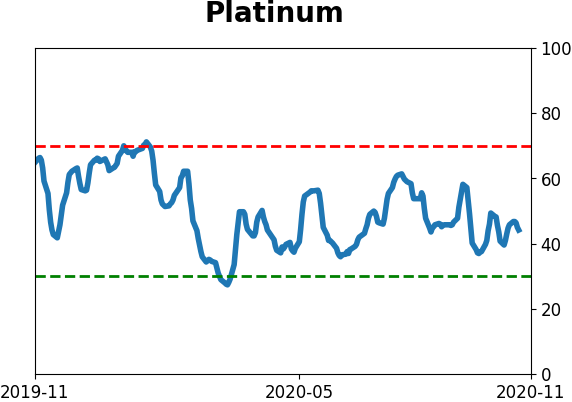
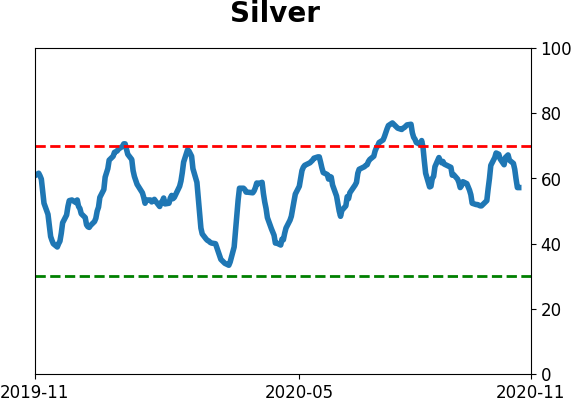
Commodity ETF's - 5-Day Moving Average
|
|