Headlines
|
|
VIX sentiment shows "smart money" betting against volatility:
Options data shows that "smart money" traders are increasingly betting against a persistent rise in the VIX "fear gauge". When the VIX Sentiment model is as high as it is now, the VIX almost always declined in the months ahead.
Fear and loathing: Wednesday's selling pressure was heavy and persistent. By the end of the day, the VIX "fear gauge" spiked more than 20% when it was already at a high level. That was its first close above 40 in months. And 2 out of the past 3 days saw such overwhelming selling that both NYSE Up Issues and Up Volume were below 15%. These types of behaviors triggered early in the decline in February but otherwise preceded mostly positive returns.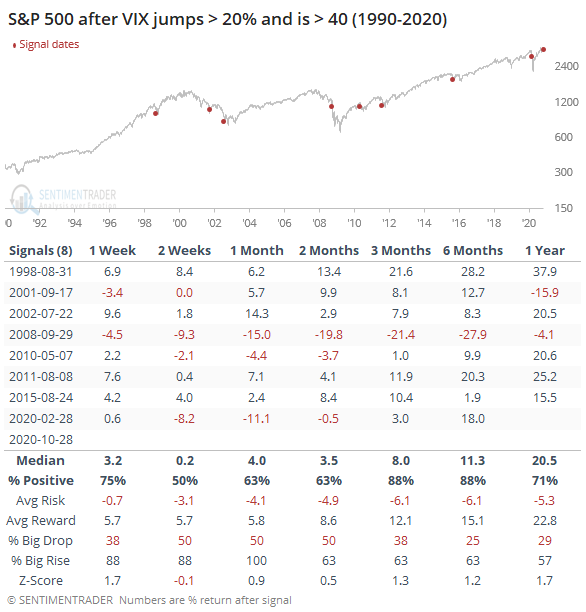 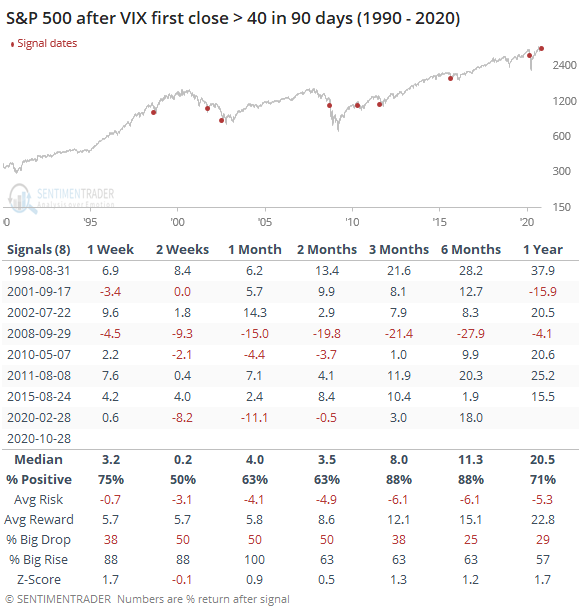 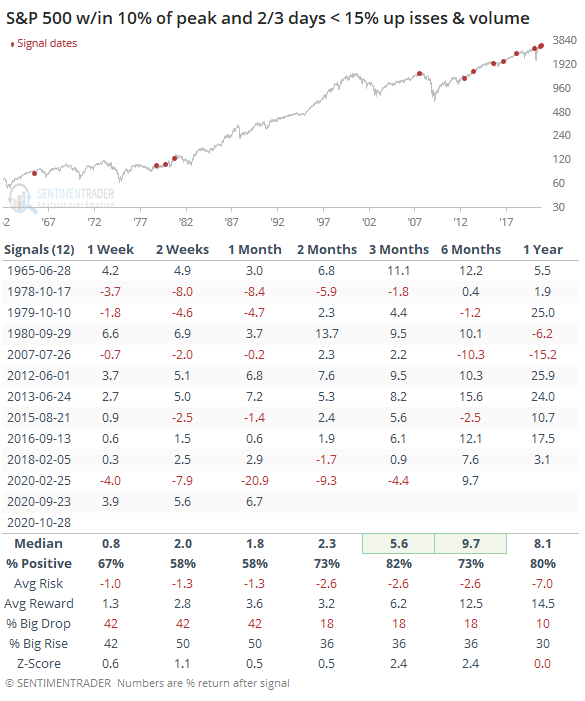
Bottom Line:
- A positive environment favors becoming aggressive on signs of excessive pessimism.
|
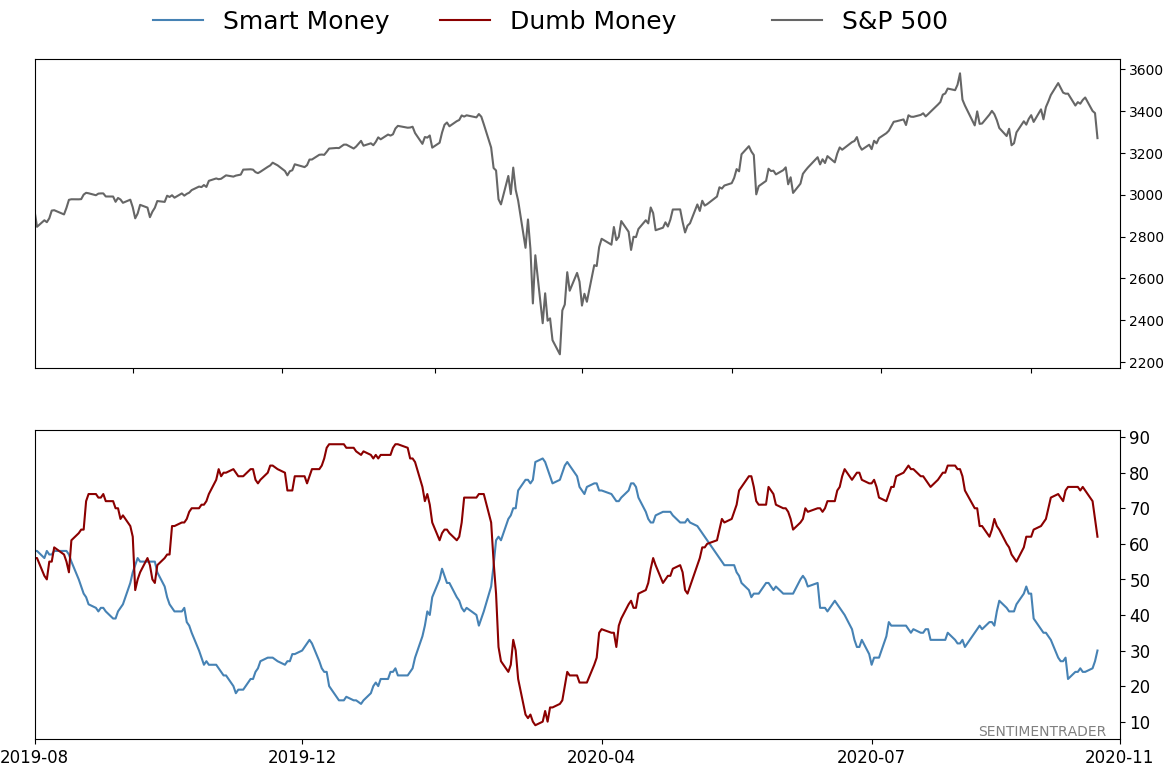
Smart / Dumb Money Confidence
|
Smart Money Confidence: 30%
Dumb Money Confidence: 62%
|
|
Risk Levels
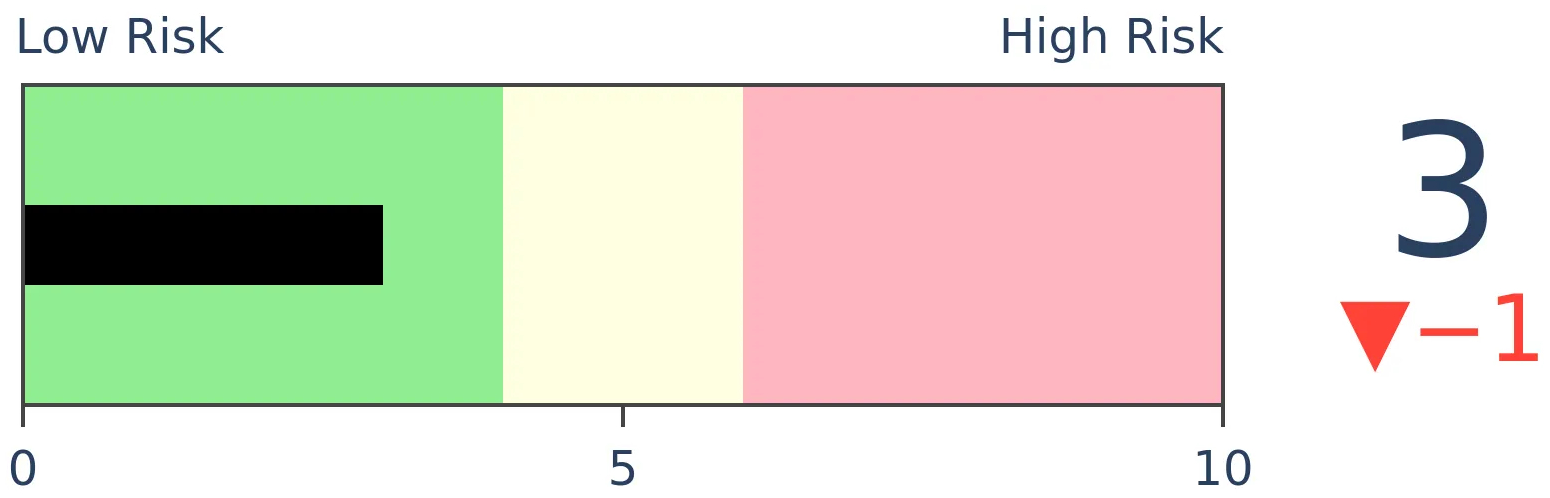
Stocks Short-Term
|
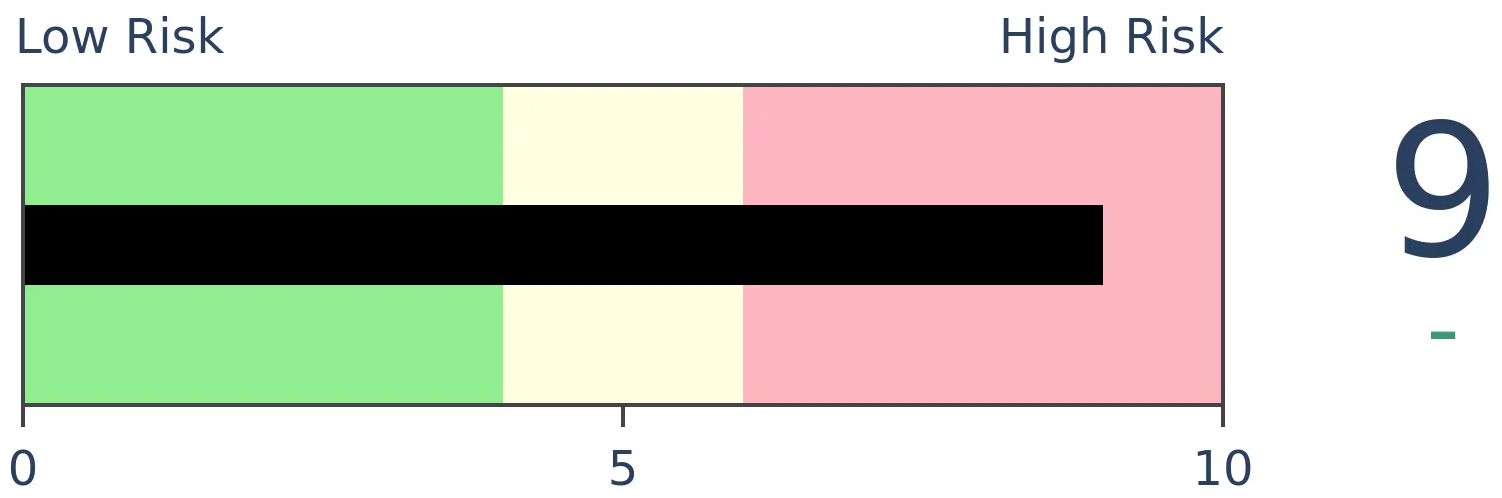
Stocks Medium-Term
|
|
Bonds
|
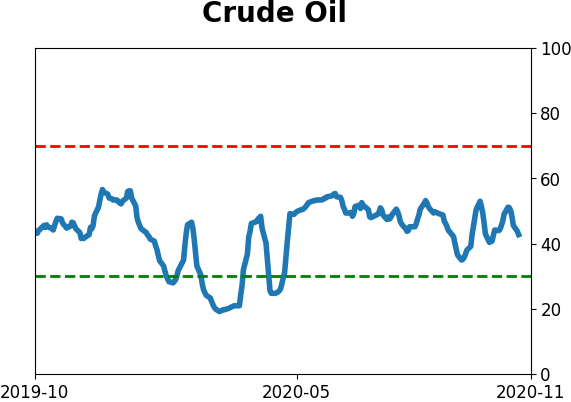
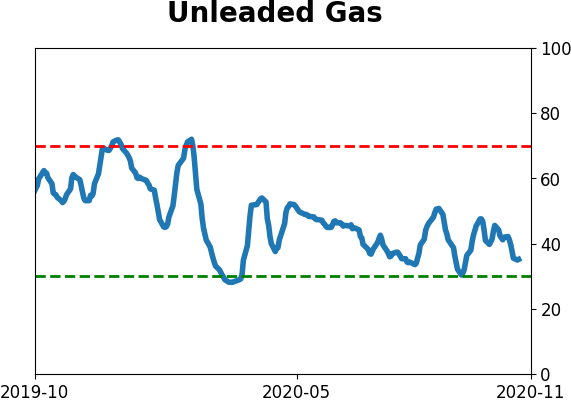
Crude Oil

|
|
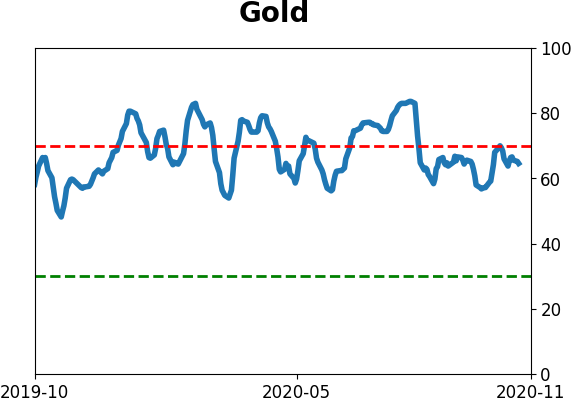
Gold
|
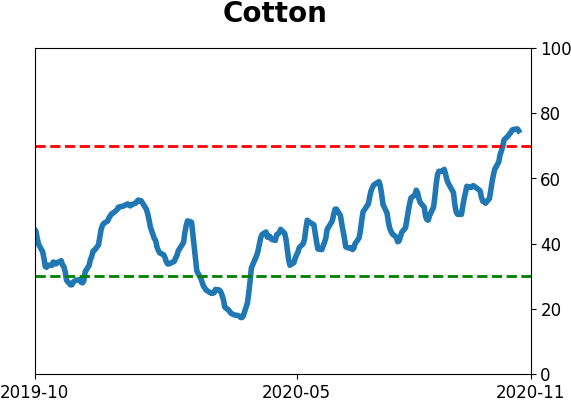
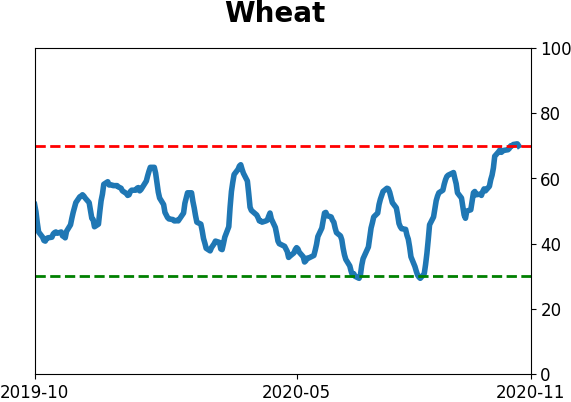
Agriculture
|
|
Research
BOTTOM LINE
Options data shows that "smart money" traders are increasingly betting against a persistent rise in the VIX "fear gauge". When the VIX Sentiment model is as high as it is now, the VIX almost always declined in the months ahead.
FORECAST / TIMEFRAME
VIX -- Down, Medium-Term
|
Thanks to heightened concerns about the looming presidential election, uncertainty about upcoming earnings reports, and negative developments in the fight against coronavirus, options traders have continued to price in wide swings in stocks.
Even though bond volatility has been pushing higher, it's been relatively muted in stocks. But it's been muted at a much higher-than-average level, with a VIX "fear gauge" that has been persistently stuck above 25. At the peak of intraday concern, the VIX has jumped more than 10% on two out of the past three sessions.
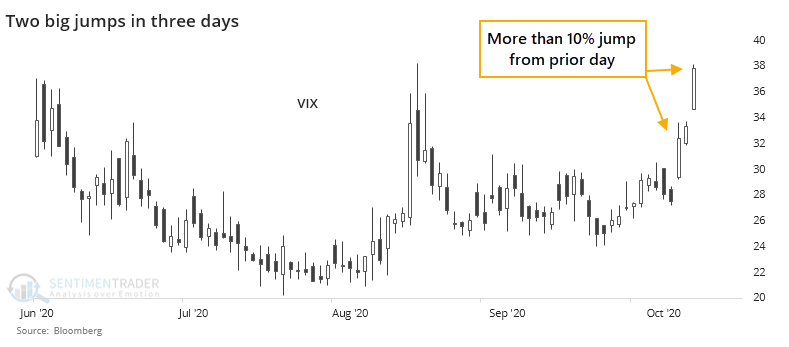
It's easier to see big jumps in the VIX when it's at a low level. It's much rarer to see it when the VIX is already high, especially when stocks aren't even in a correction at the time.
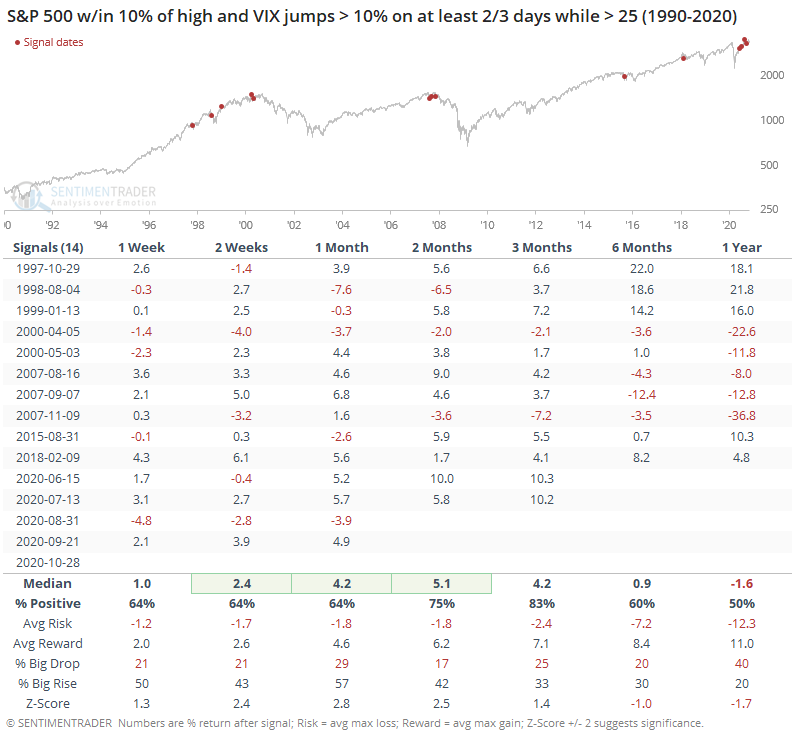
The other times this triggered, stocks typically rallied over the next 1-3 months, with only 2 losses out of 12 signals three months later. After that risk rose as two of the clusters triggered as the bull markets were nearing their peaks in 2000 and 2007.
Over the past couple of weeks, more and more traders seem to be betting that it's too high. The 10-day average of the VIX Put/Call Ratio has climbed above 1.5, the highest in more than 13 years.
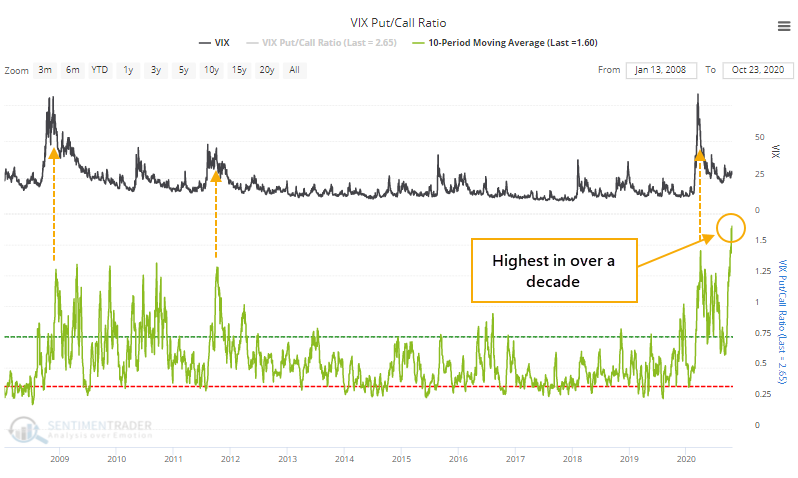
This means that on an average day, 50% more puts are being traded than calls. While we don't know whether the underlying trades are betting on increasing or decreasing volatility, the assumption is that the heavy put volume reflects bets that the VIX will decline. And usually, that's what's happened.
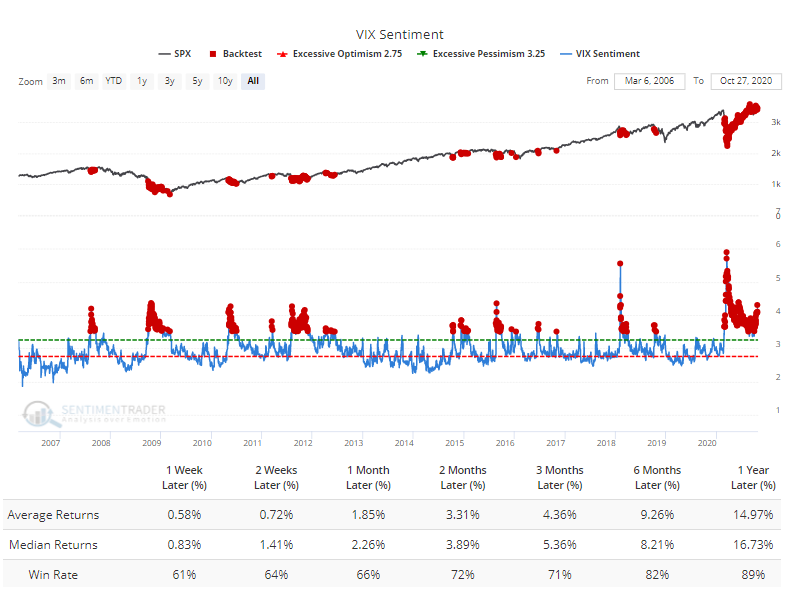
Trading activity in puts versus calls is one of the inputs of the VIX Sentiment model, which has climbed above 4.
From the site:
"VIX Sentiment looks at the skew in VIX options, the ratio of outstanding puts to calls, the term structure of VIX futures and the volatility of the VIX itself to gauge how traders are positioned in volatility. For the most part, they are "smart money" traders. When VIX Sentiment is high it means that they are aggressively betting against a rise in volatility, which is what usually happens as stocks rise. When VIX Sentiment is low it means that they are betting on an increase in volatility in the coming weeks, and that's what we usually see along with a decline in stocks."
Any time that VIX Sentiment was above 3.5, the Backtest Engine shows that stocks usually reacted by rising in the months ahead.
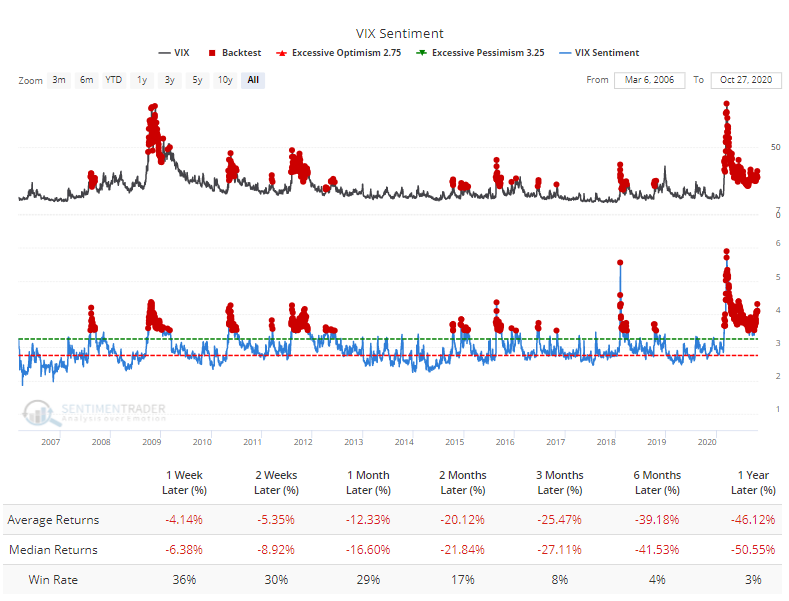
For the VIX itself, this almost invariably led to a lower level going forward.
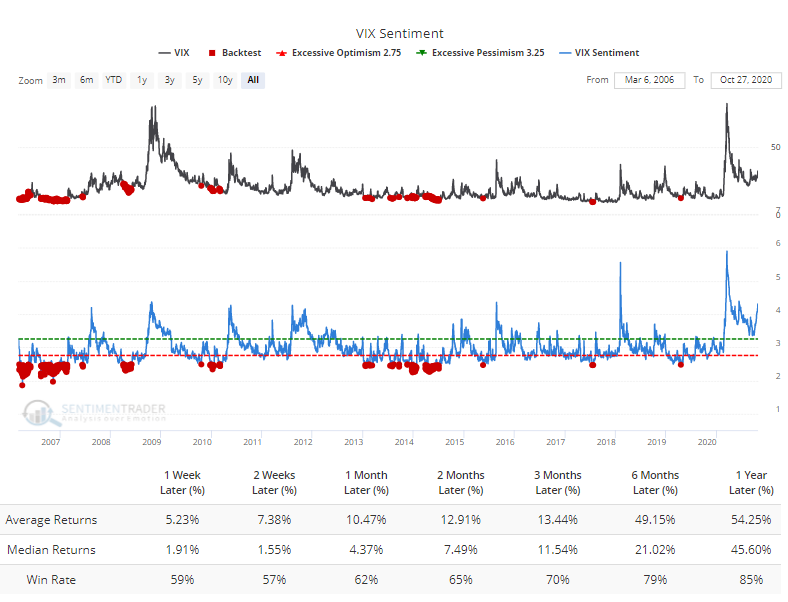
Contrast that to times when VIX Sentiment was below 2.5. After these signals, the VIX had a strong tendency to rise going forward.
There seems to be a pretty clear flow of upcoming events which has prompted traders to price in high volatility. But more and more, options traders are betting that it won't last much longer, and these traders have typically been proven correct. It suggests that despite the many seemingly legitimate concerns, volatility in stocks should decline in the months ahead.
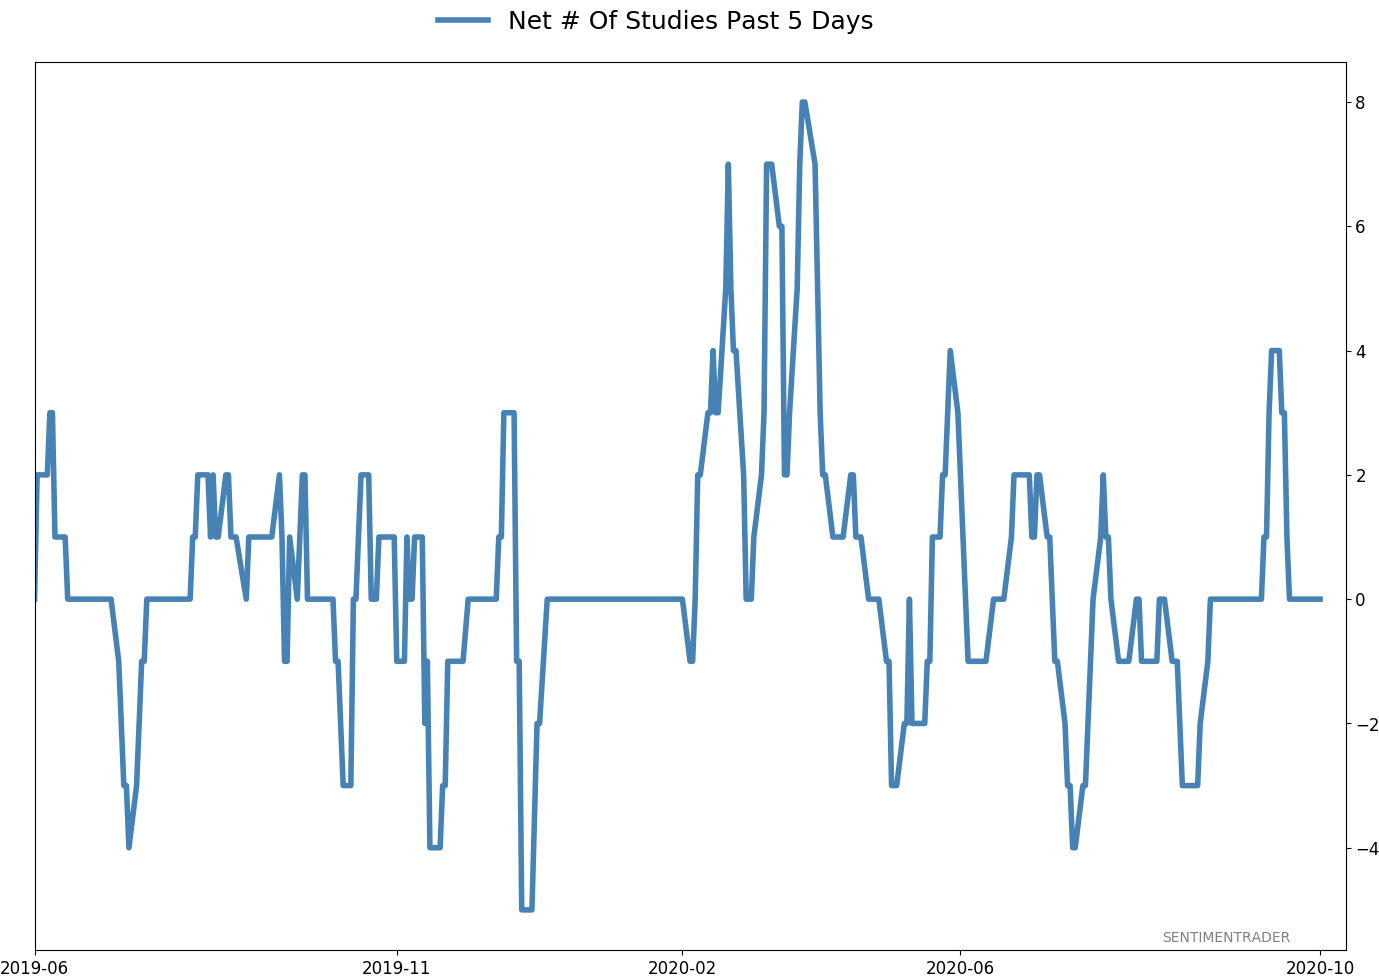
Active Studies
| Time Frame | Bullish | Bearish | | Short-Term | 0 | 0 | | Medium-Term | 4 | 8 | | Long-Term | 48 | 2 |
|
Indicators at Extremes
Portfolio
| Position | Description | Weight % | Added / Reduced | Date | | Stocks | 15.6% RSP, 10.1% VWO, 7.5% XLE, 5.1% PSCE | 38.2 | Added 5% | 2020-10-15 | | Bonds | 10% BND, 10% SCHP, 10% ANGL | 29.7 | Reduced 0.1% | 2020-10-02 | | Commodities | GCC | 2.4 | Reduced 2.1%
| 2020-09-04 | | Precious Metals | GDX | 4.7 | Added 5% | 2020-09-09 | | Special Situations | | 0.0 | Reduced 5% | 2020-10-02 | | Cash | | 25.0 | | |
|
Updates (Changes made today are underlined)
After the September swoon wrung some of the worst of the speculation out of stocks, there are some signs that it's returning, especially in the options market. It's helped to push Dumb Money Confidence above 70%. A big difference between now and August is that in August, there was a multitude of days with exceptionally odd breadth readings. Some of the biggest stocks were masking underlying weakness. Combined with heavy speculative activity, it was a dangerous setup. Now, we've seen very strong internal strength, in the broad market, as well as tech and small-cap stocks. Prior signals almost invariably led to higher prices. That's hard to square with the idea that forward returns tend to be subdued when Confidence is high, but that's less reliable during healthy market conditions, which we're seeing now (for the most part). I added some risk with small-cap energy stocks, due to an increasing number of positive signs in both small-caps and energy. This is intended as a long-term position.
RETURN YTD: -3.0% 2019: 12.6%, 2018: 0.6%, 2017: 3.8%, 2016: 17.1%, 2015: 9.2%, 2014: 14.5%, 2013: 2.2%, 2012: 10.8%, 2011: 16.5%, 2010: 15.3%, 2009: 23.9%, 2008: 16.2%, 2007: 7.8%
|
|
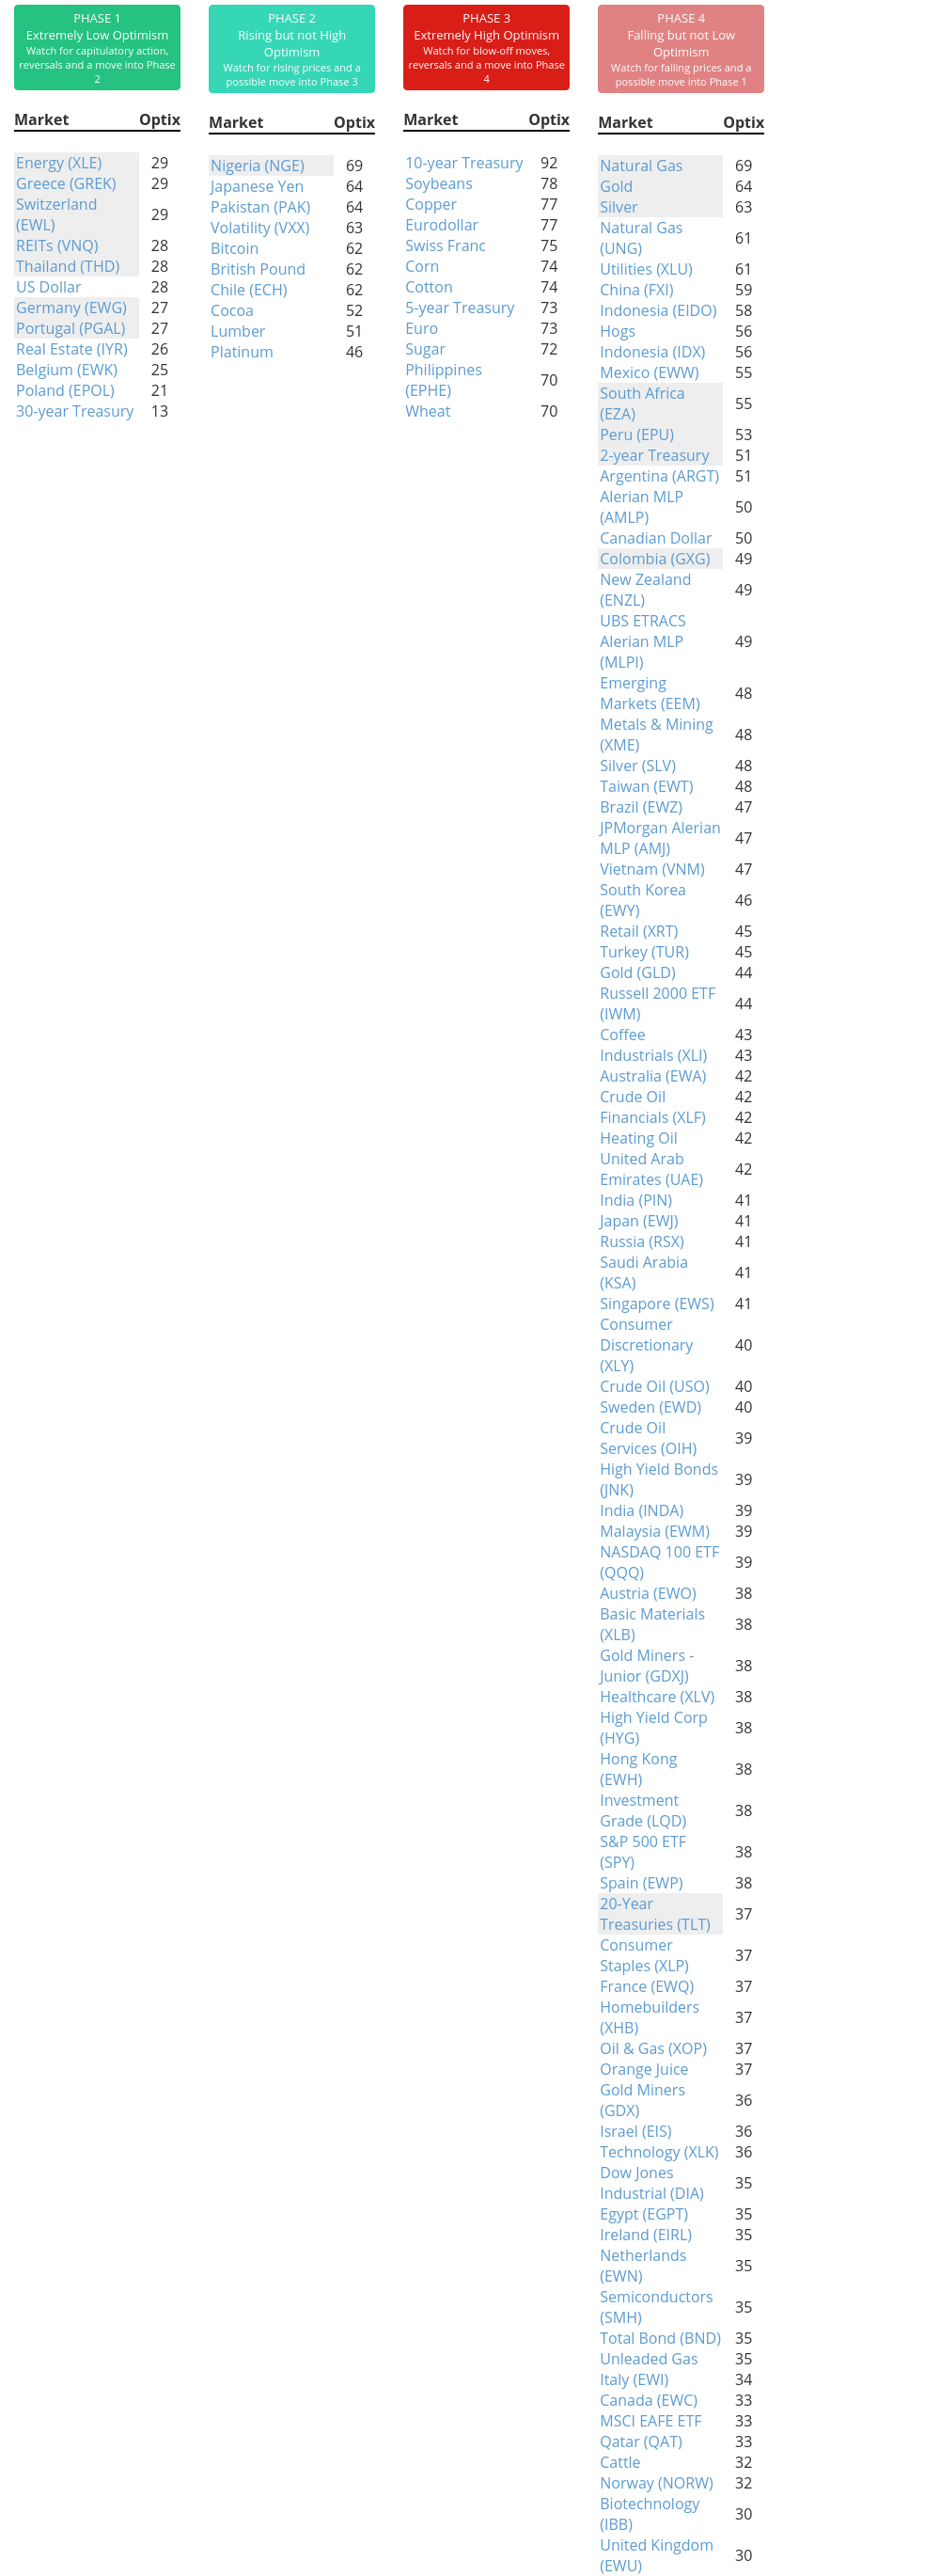
Phase Table
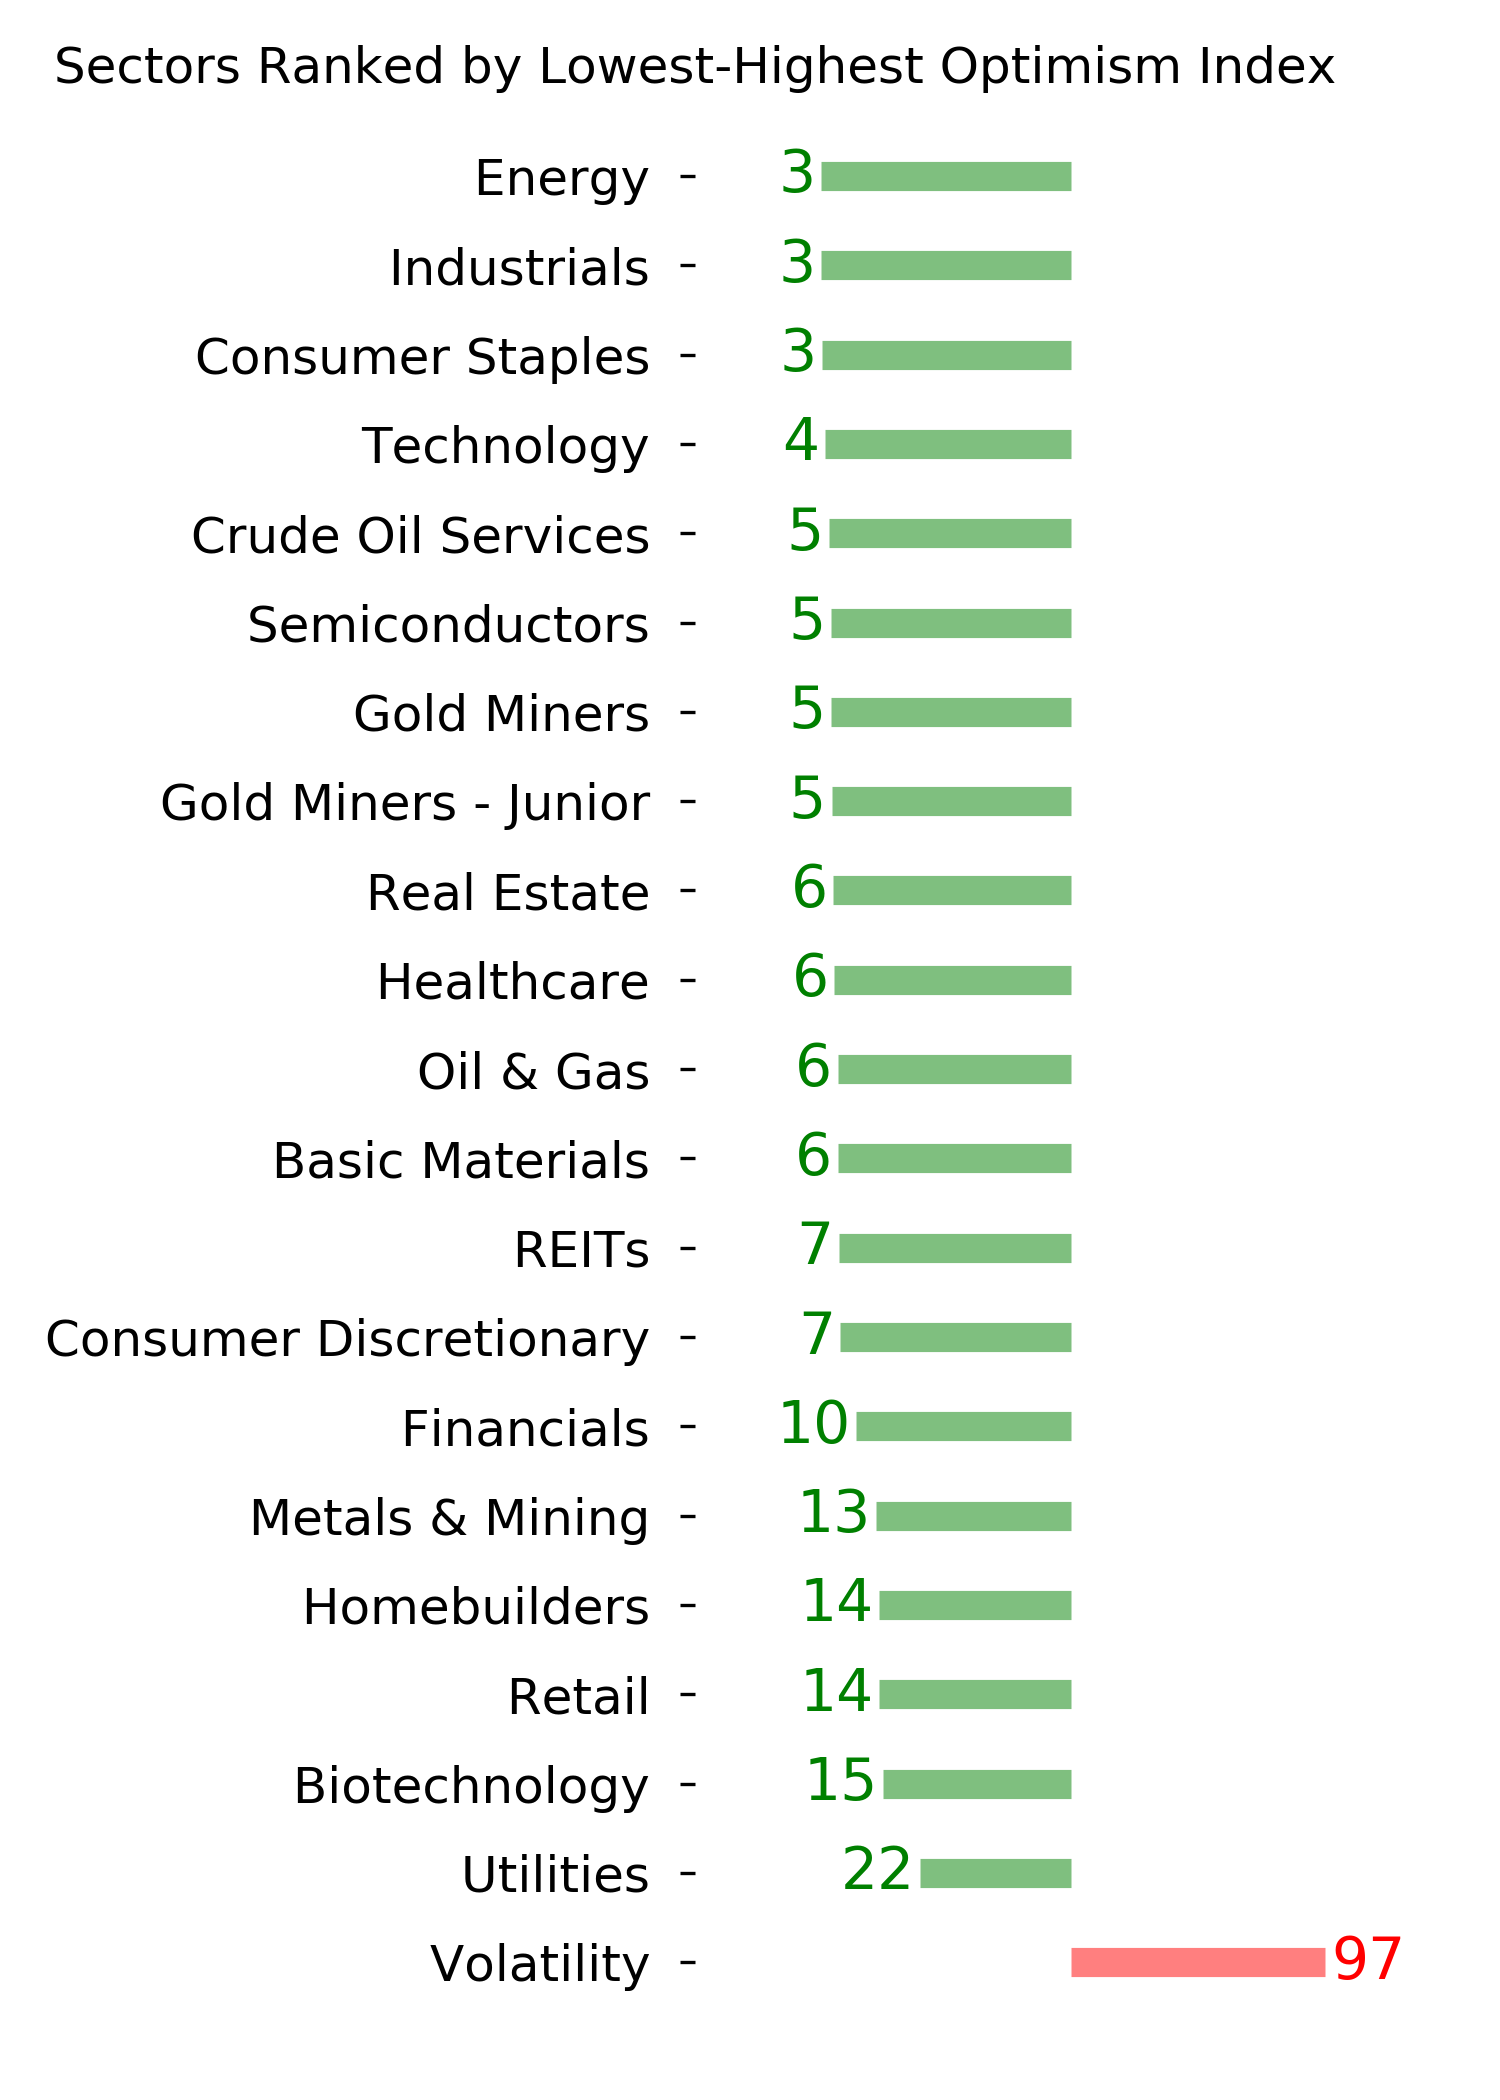
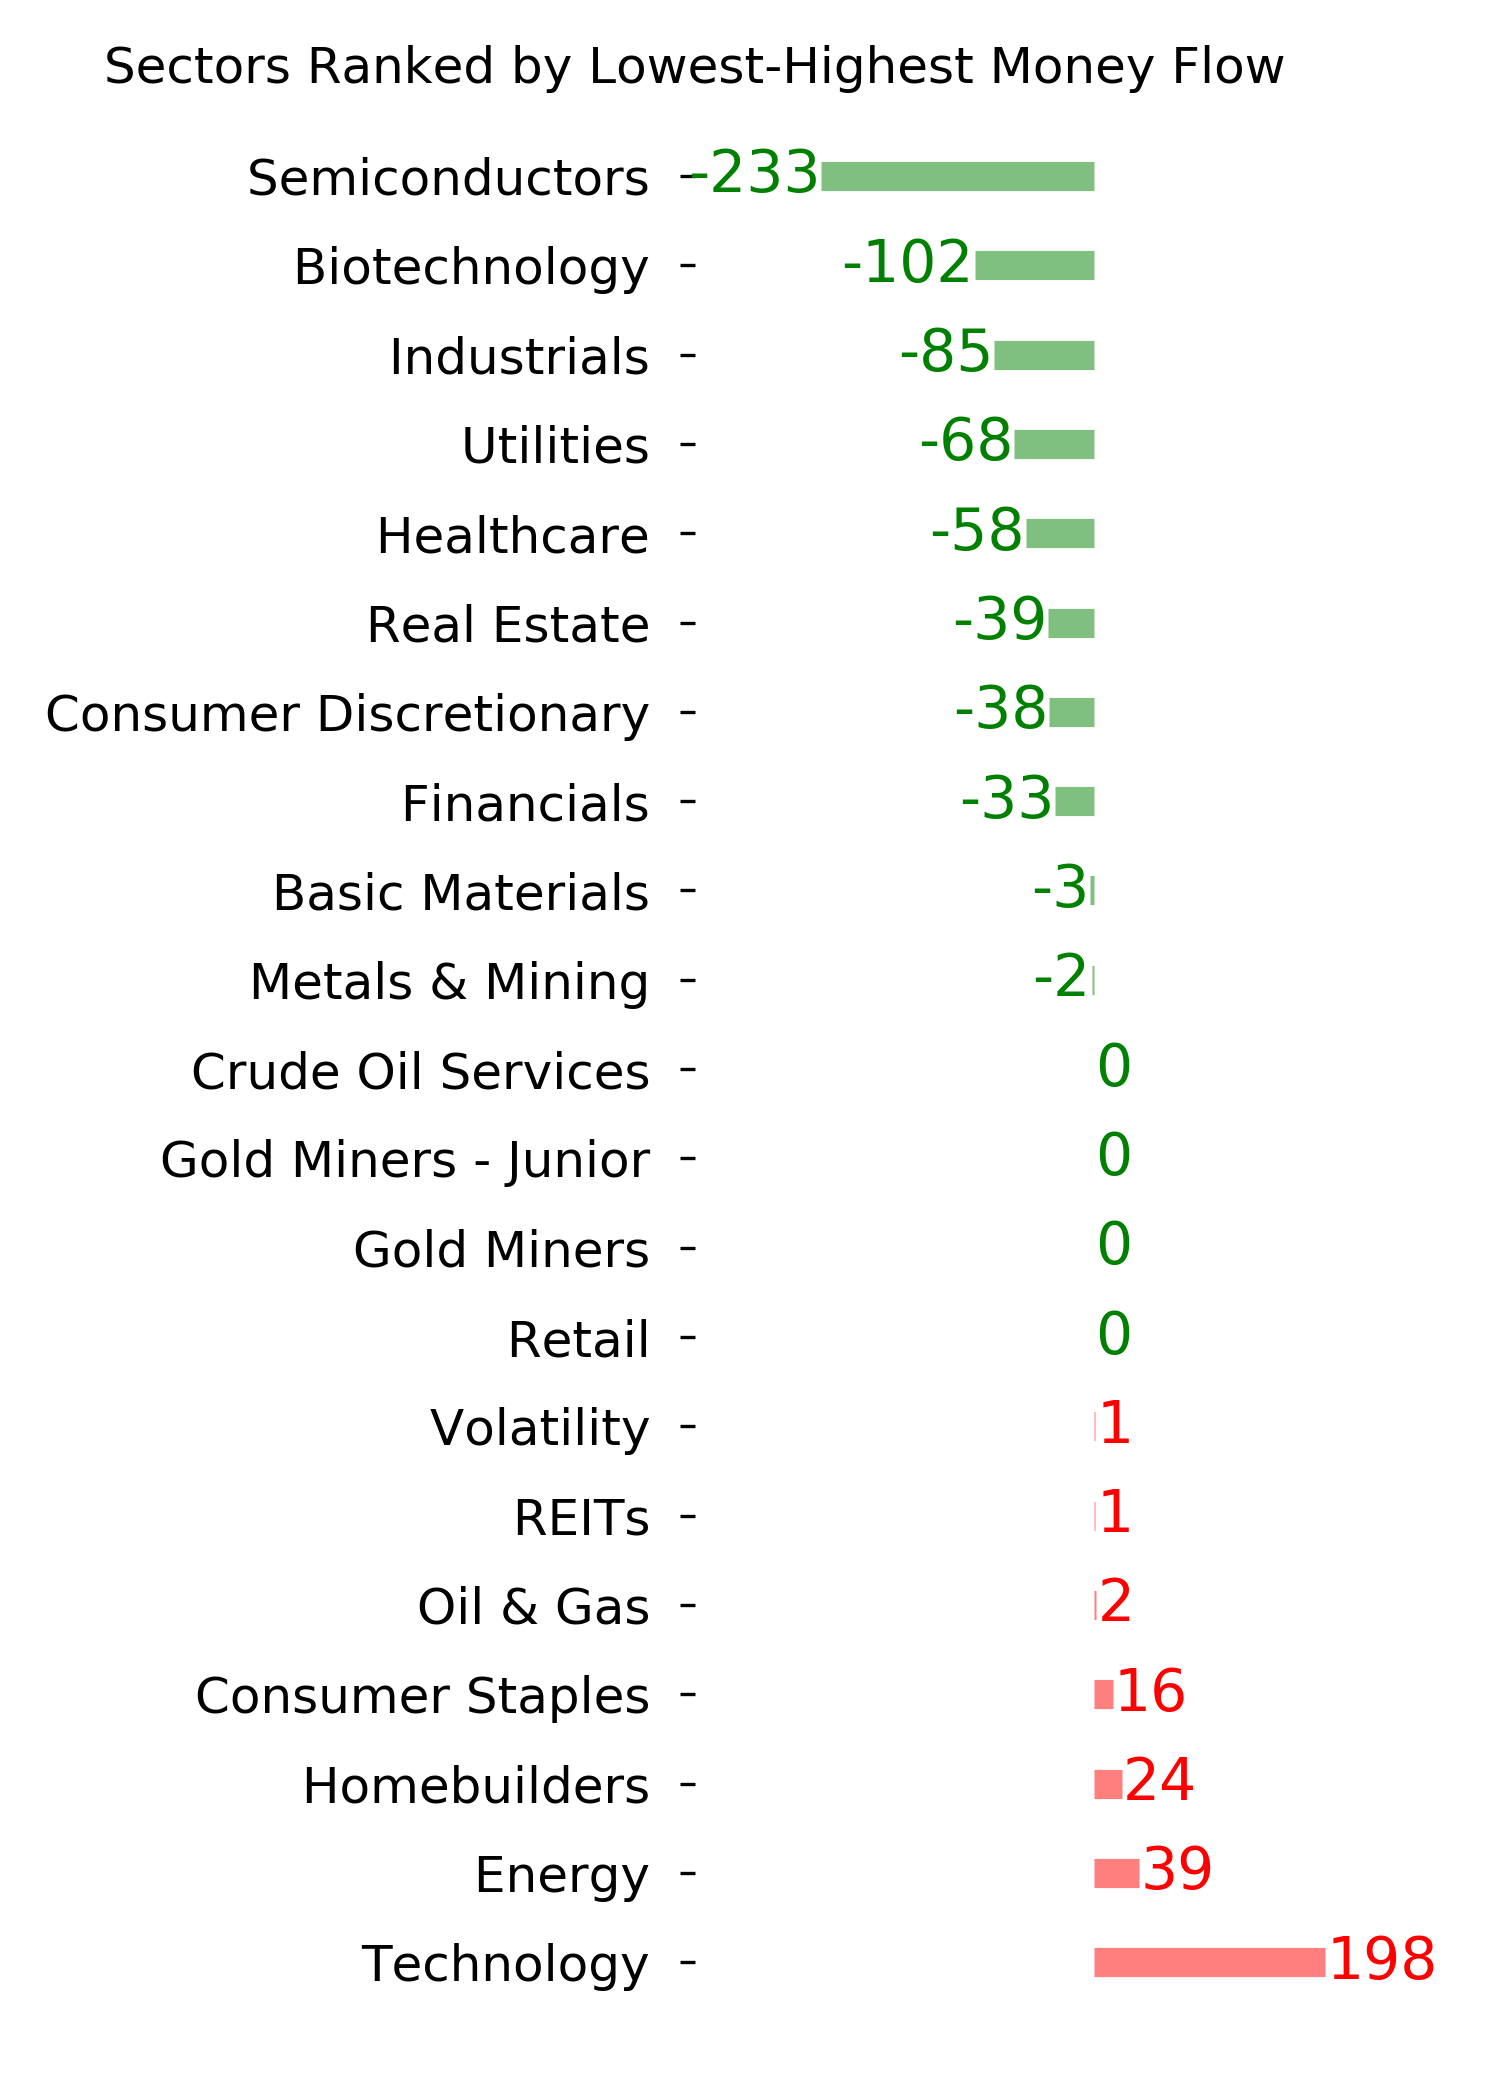
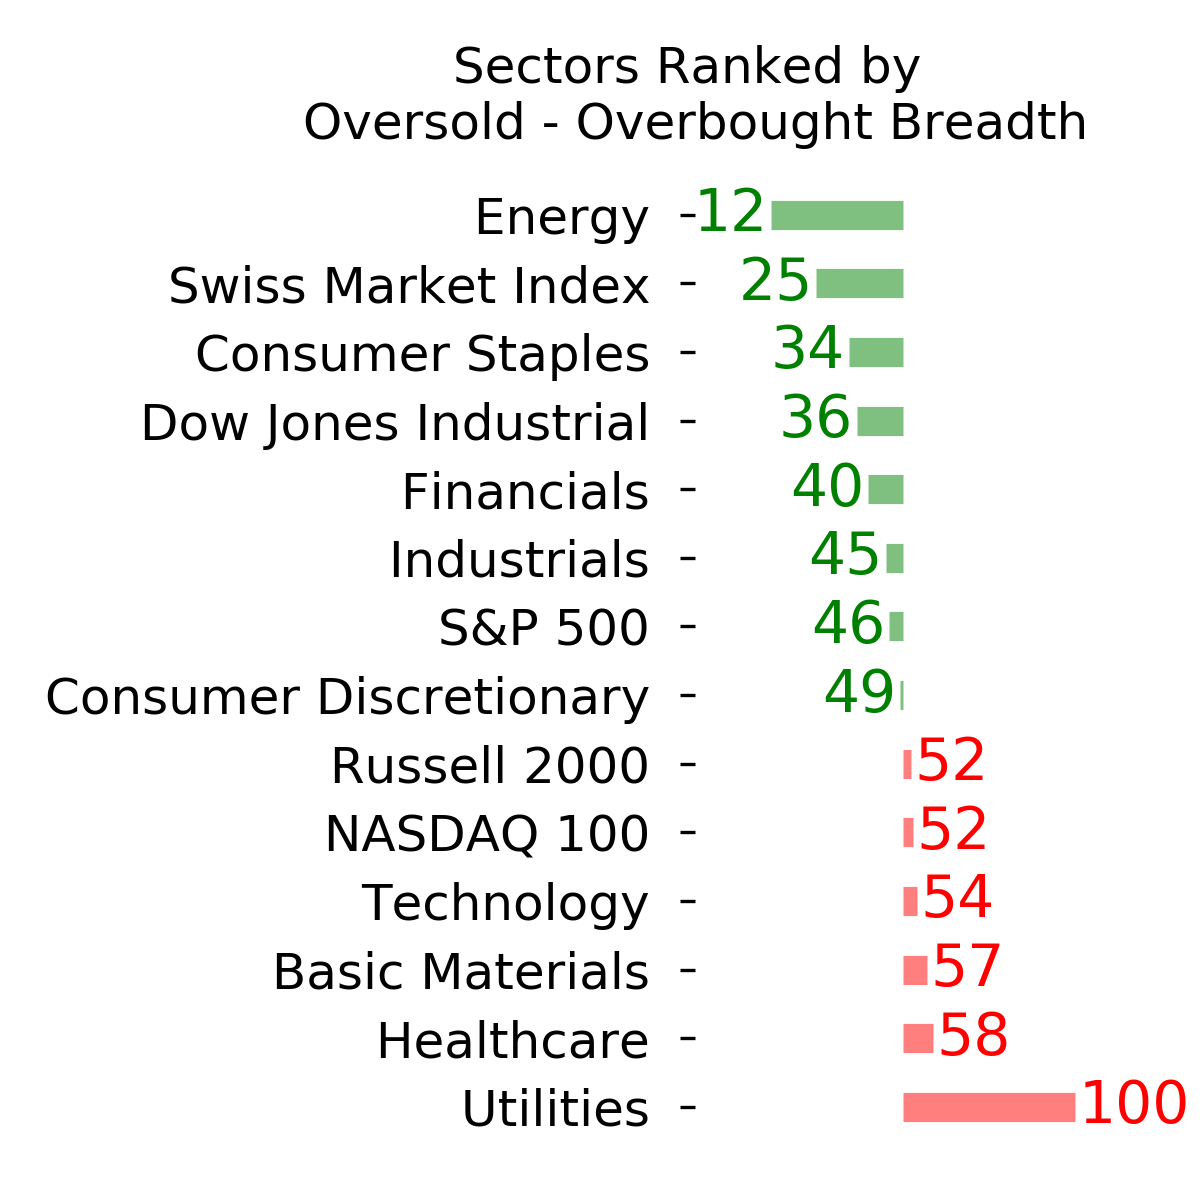
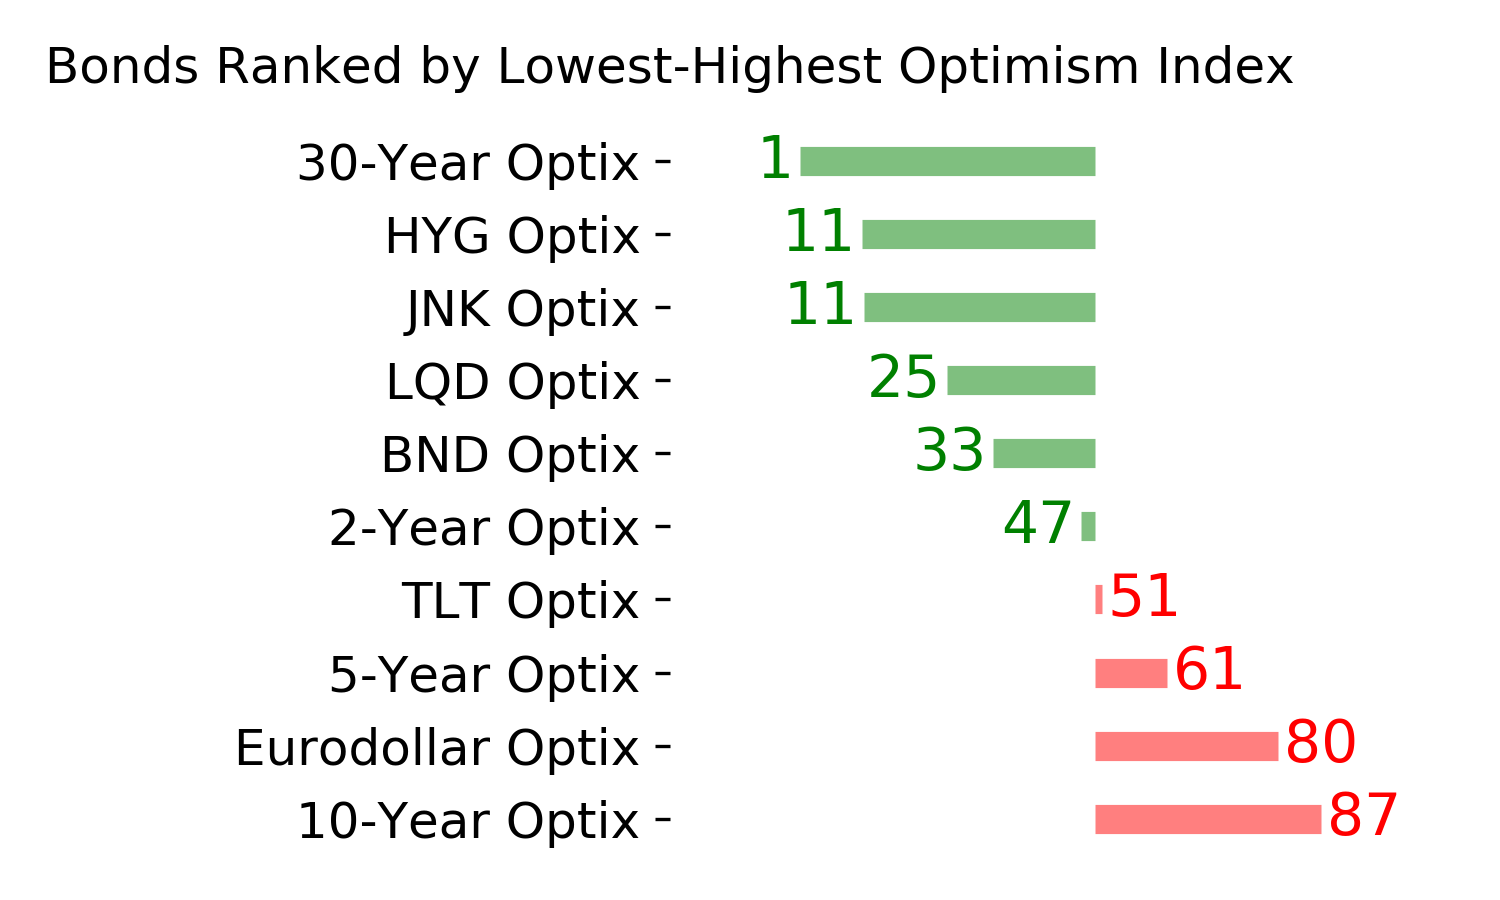
Ranks
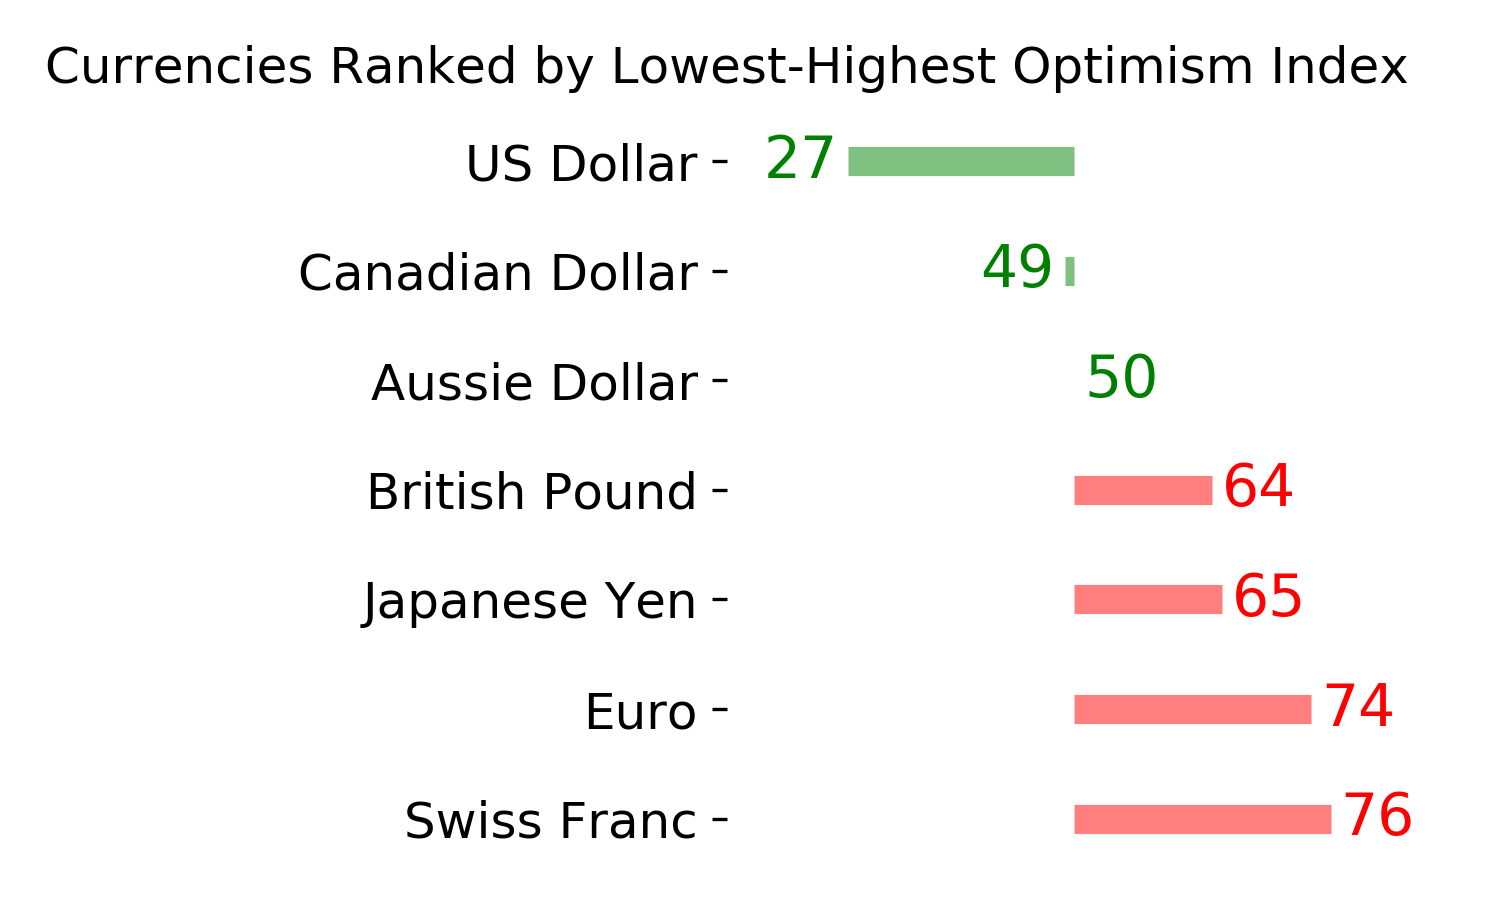
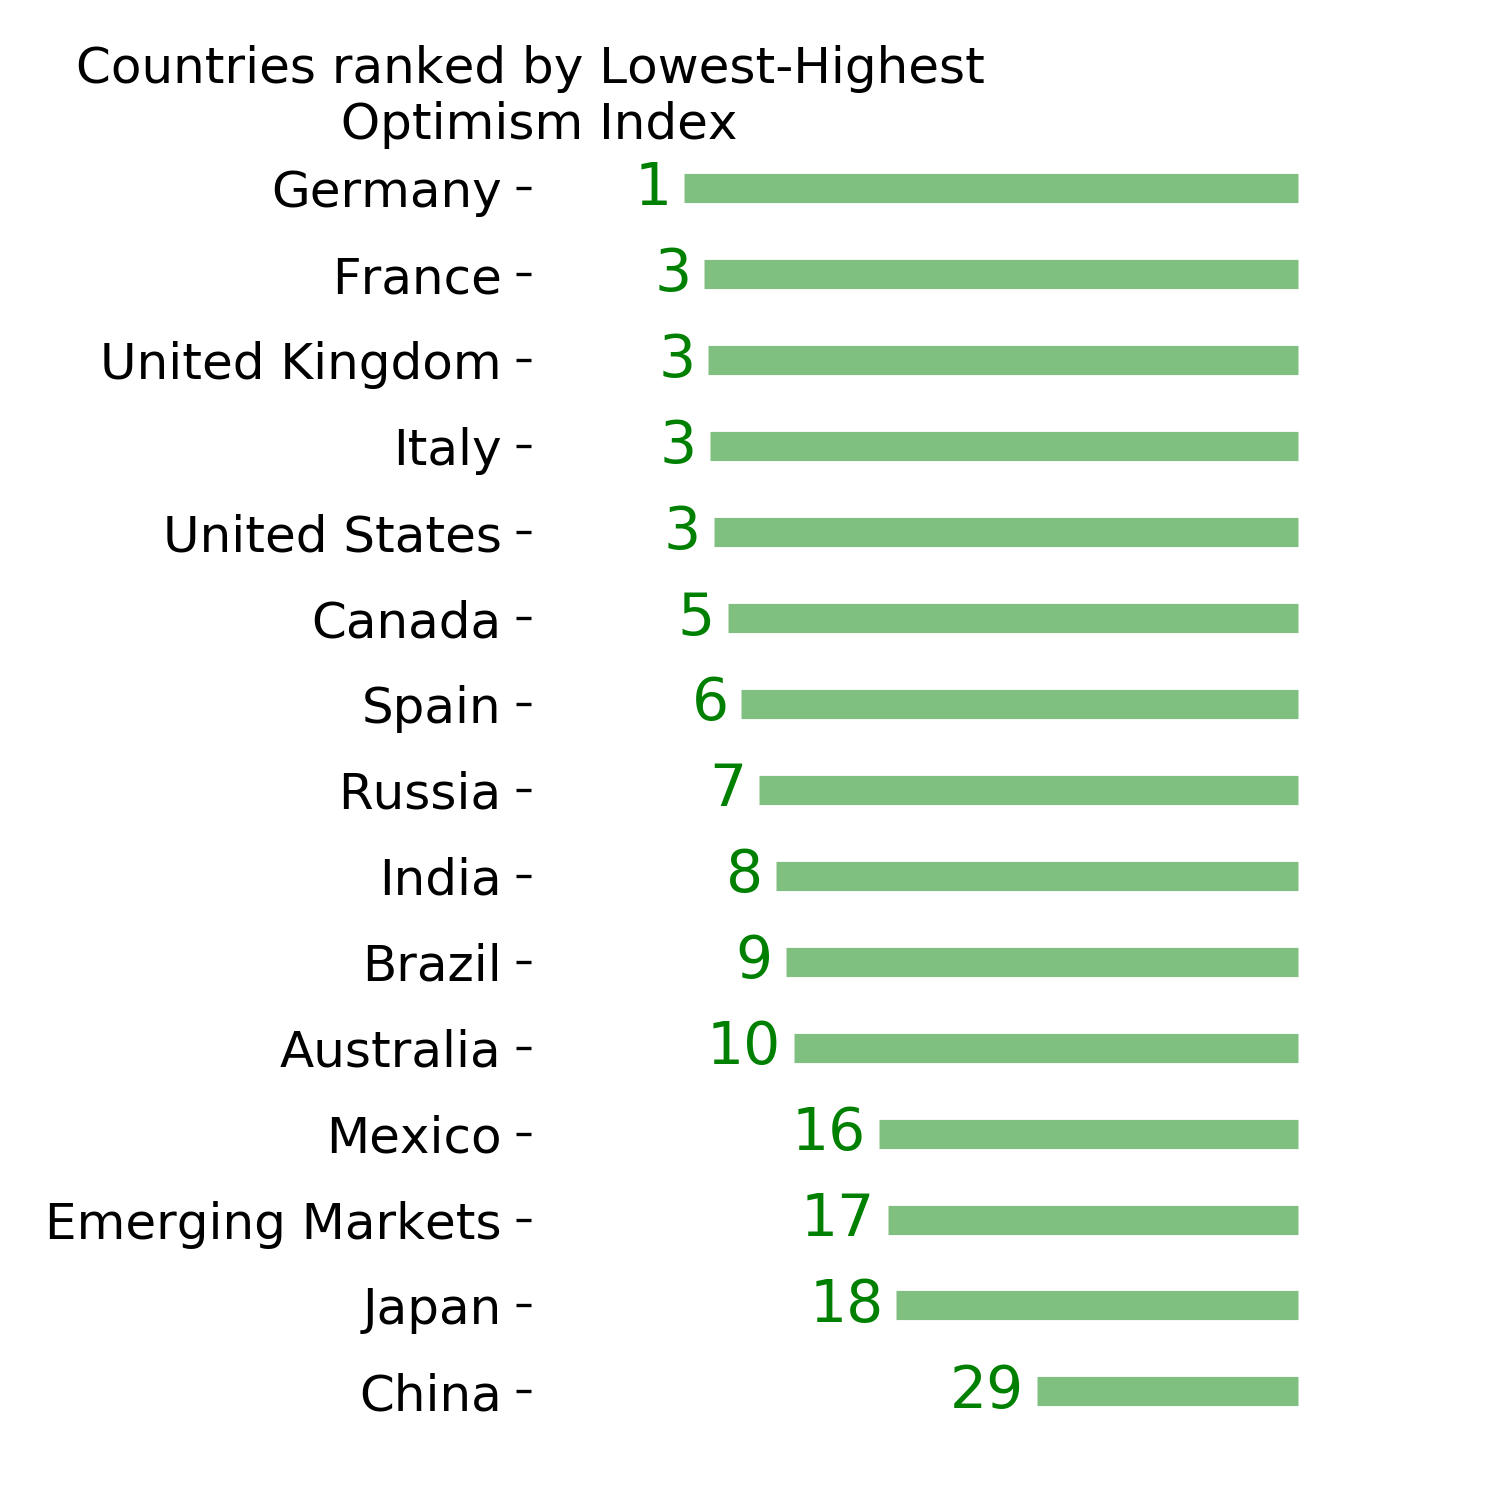
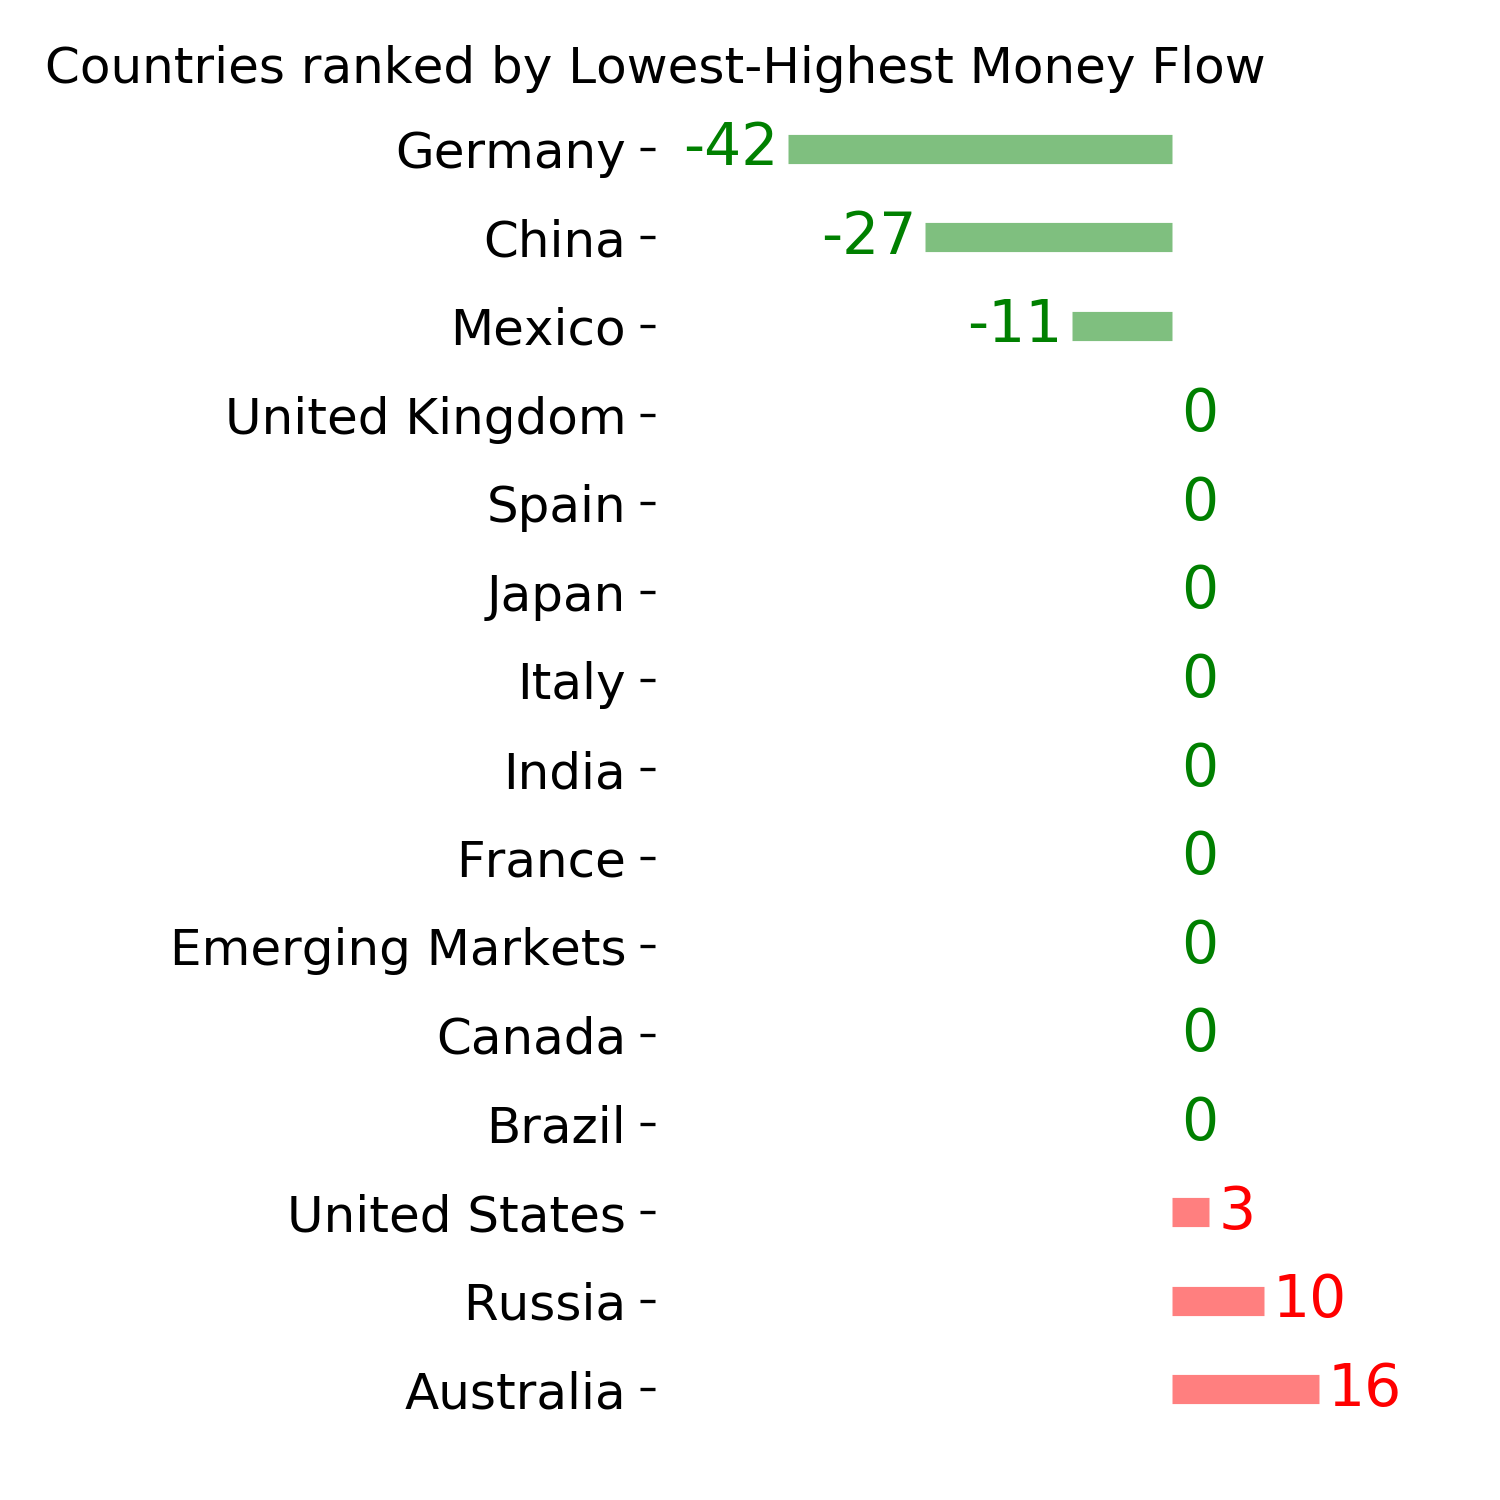
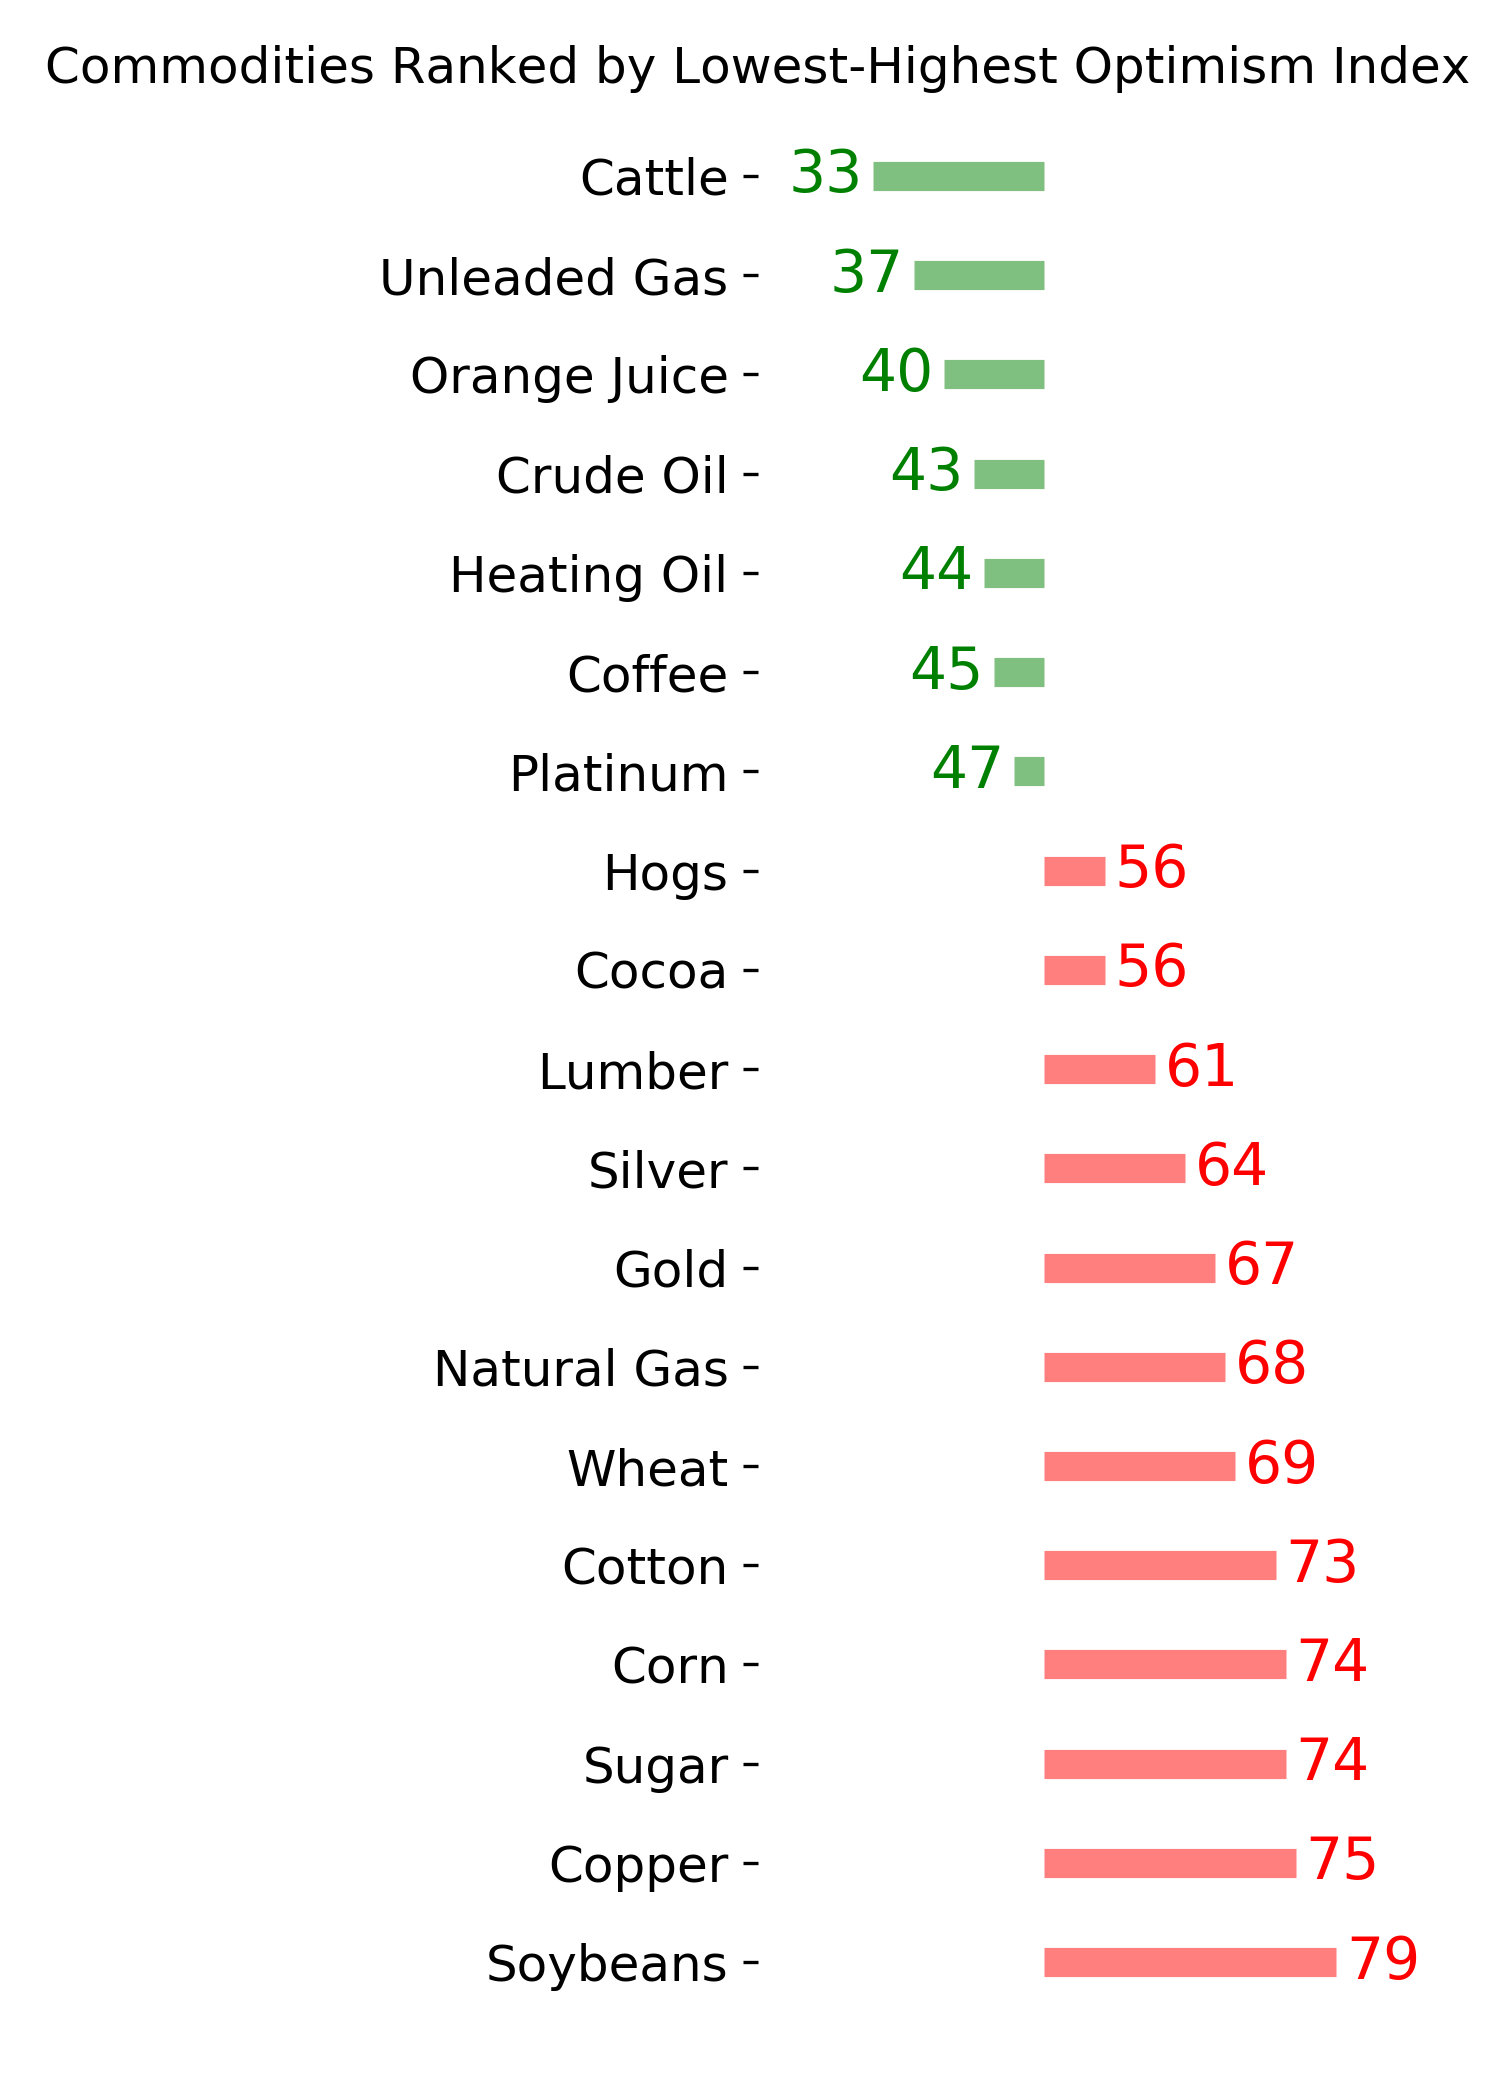
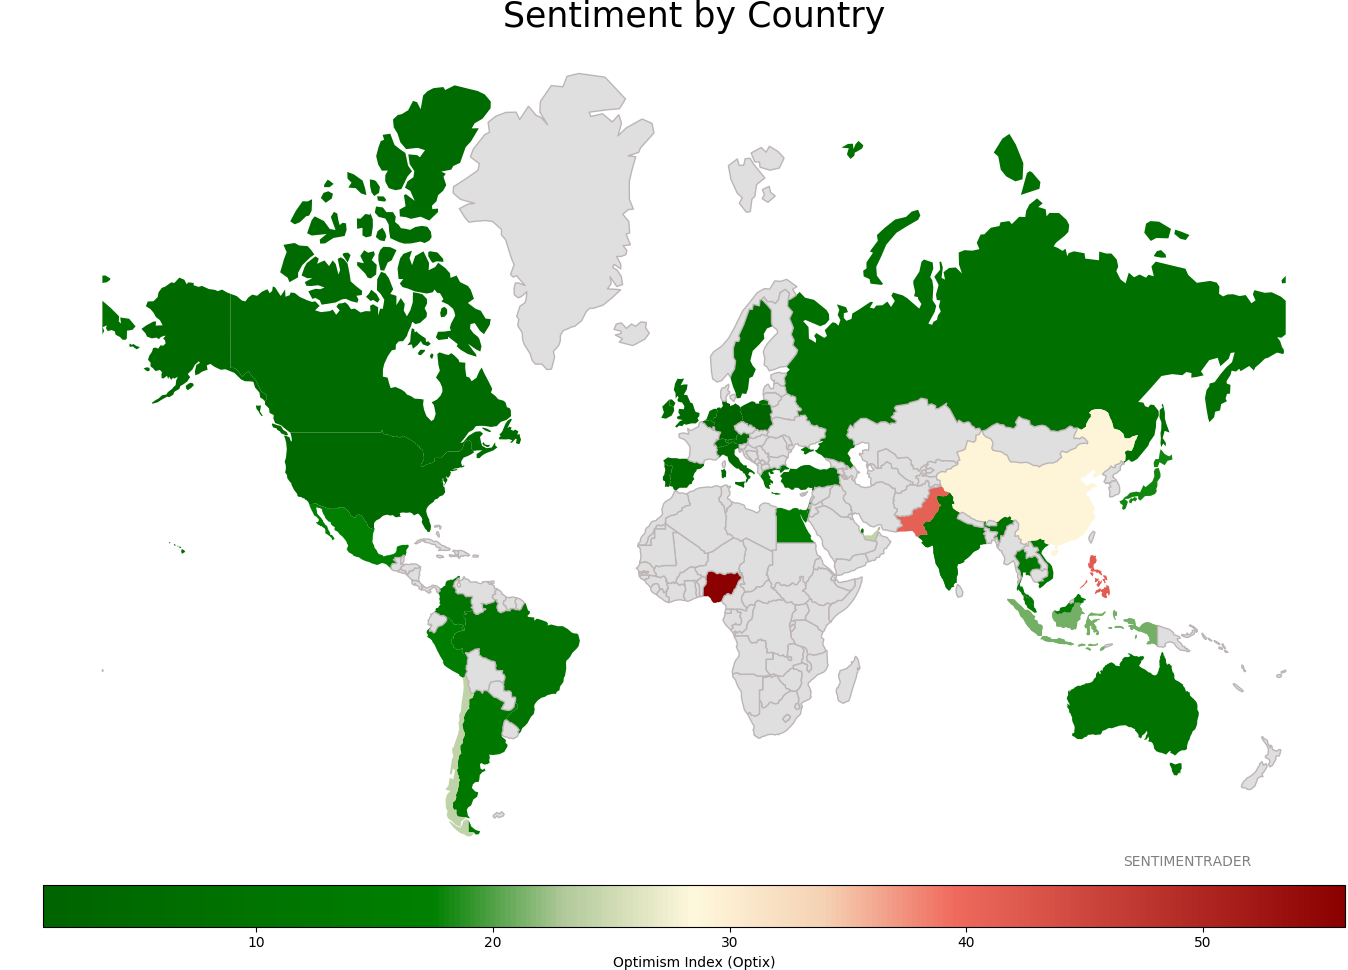
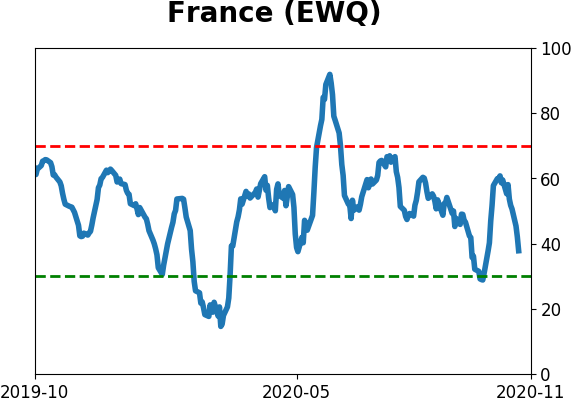
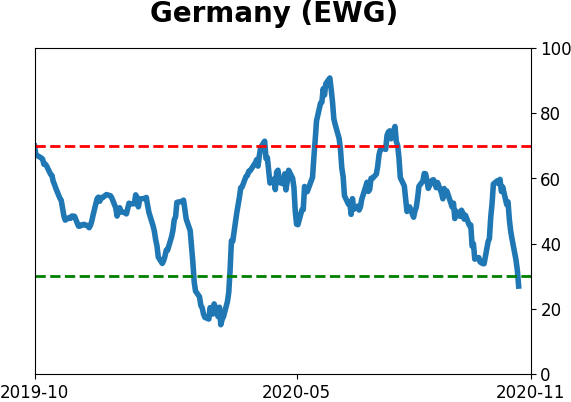
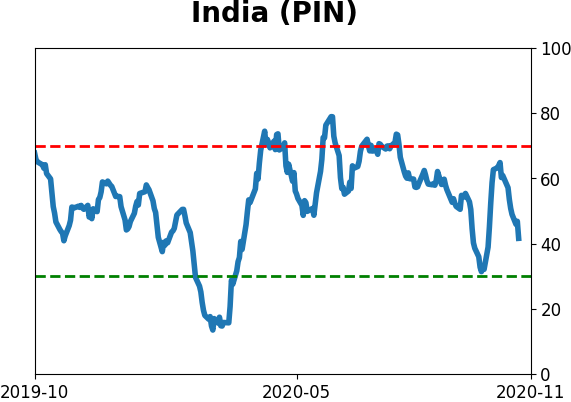
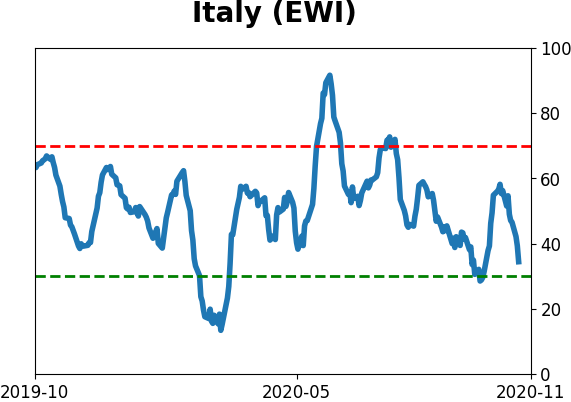
Sentiment Around The World
Optimism Index Thumbnails
|
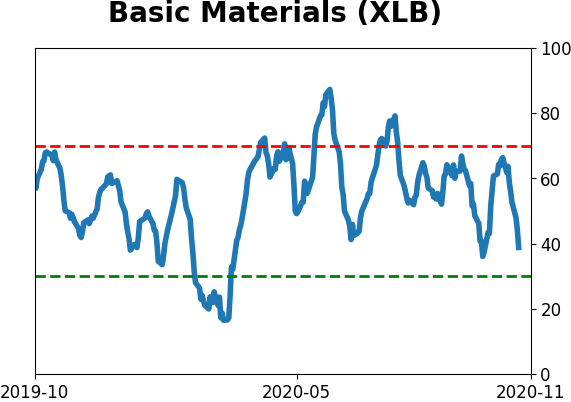
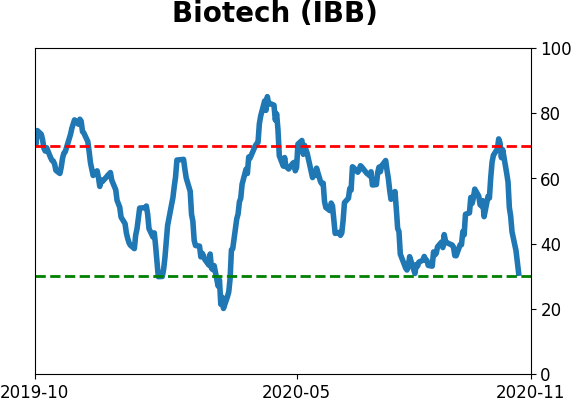
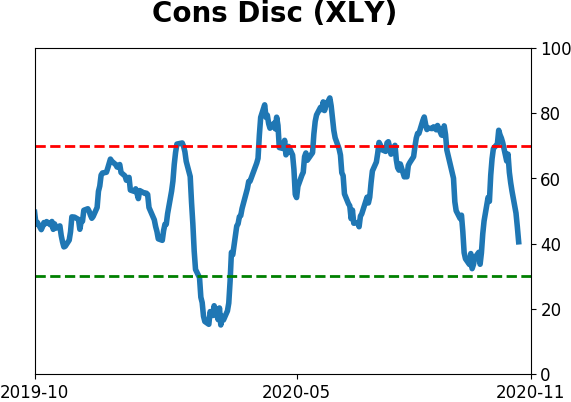
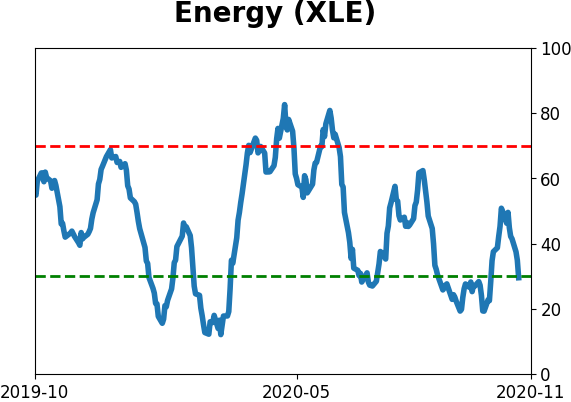
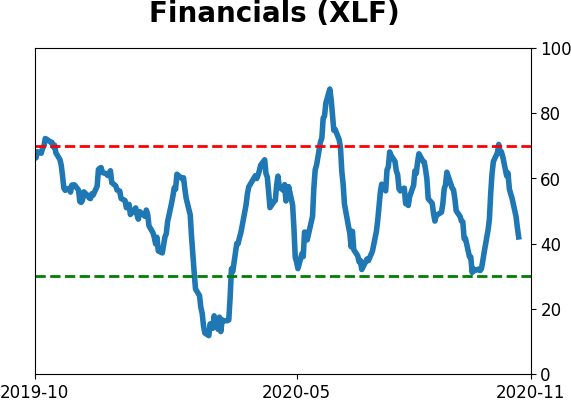
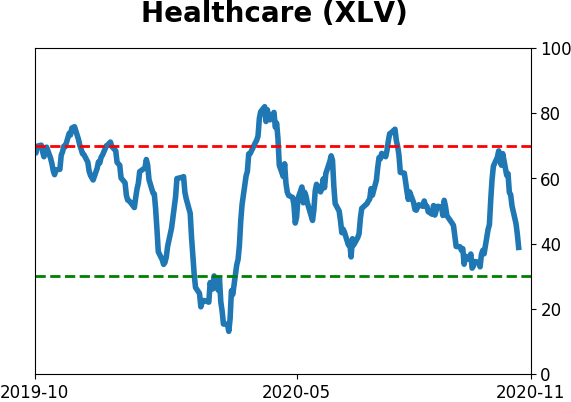
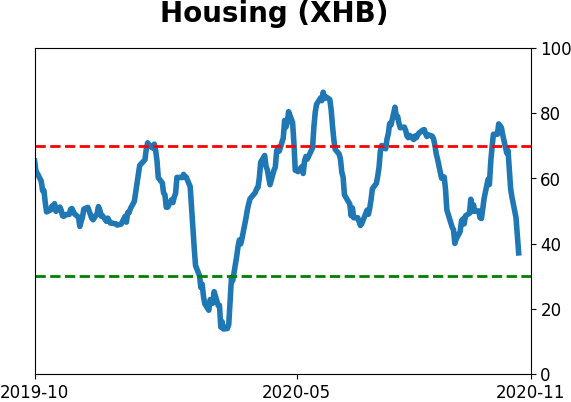
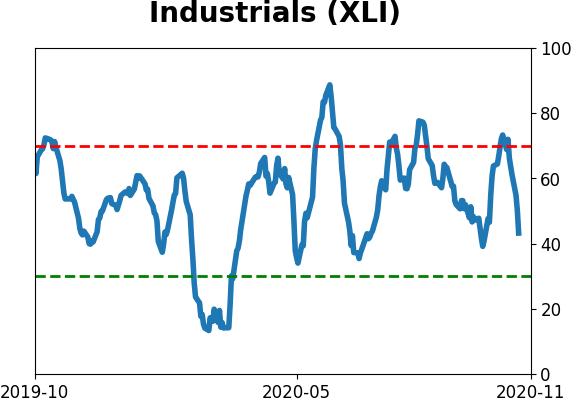
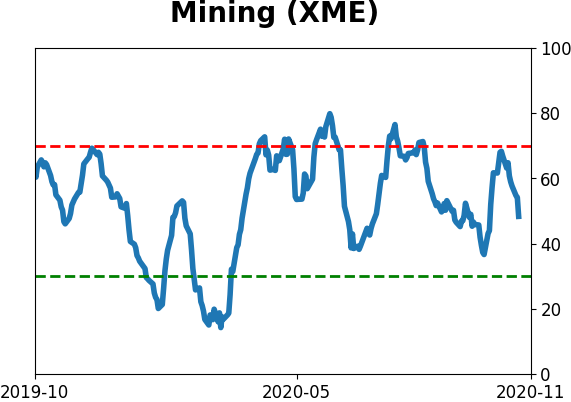
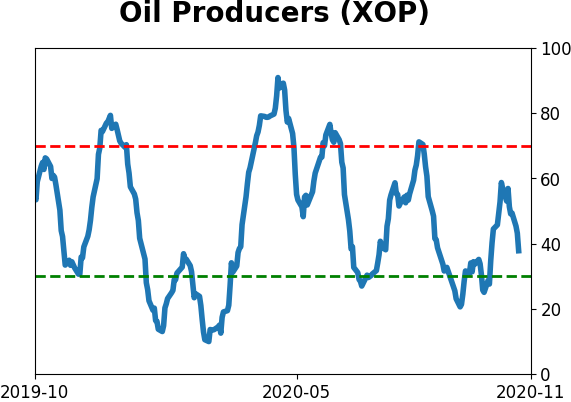
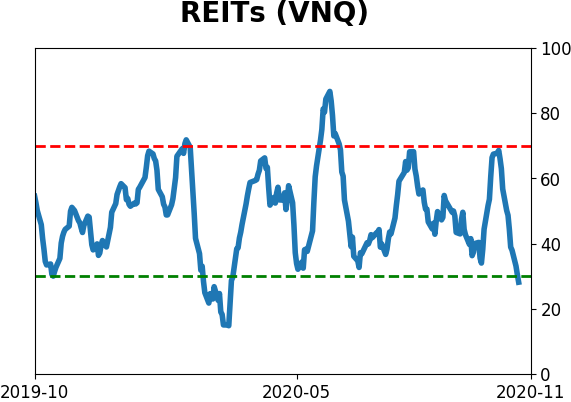
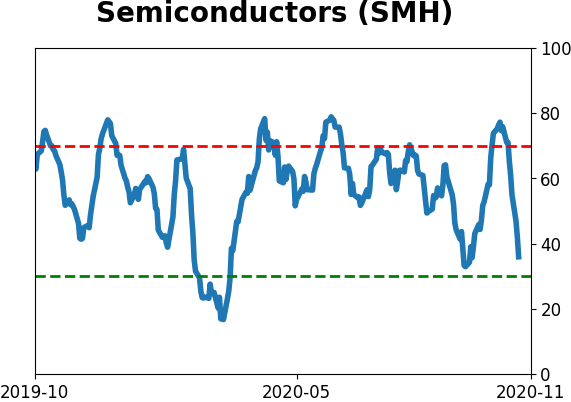
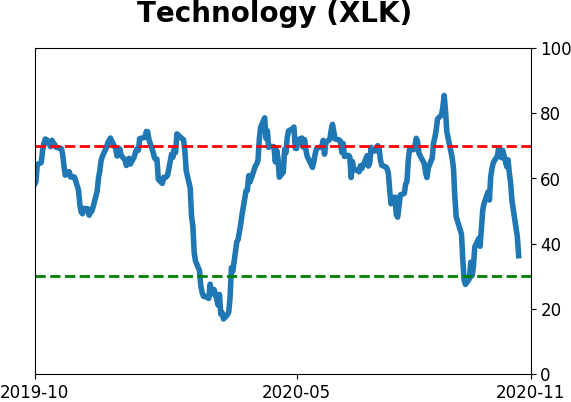
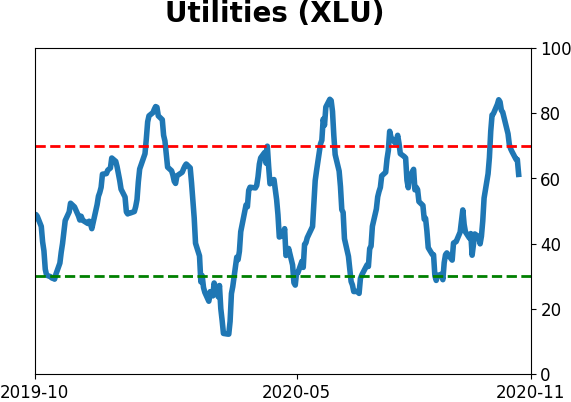
Sector ETF's - 10-Day Moving Average
|
|
|
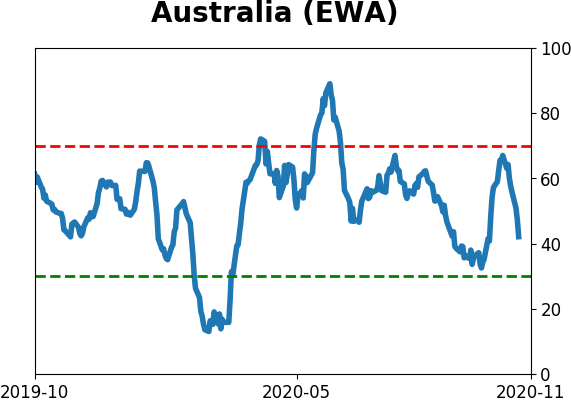
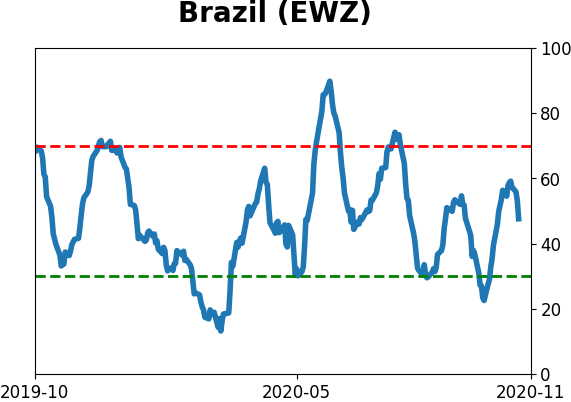
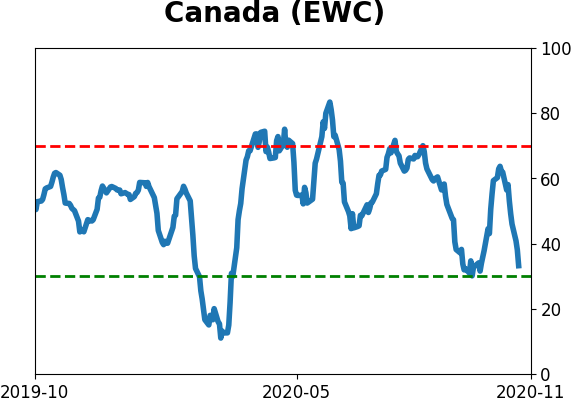
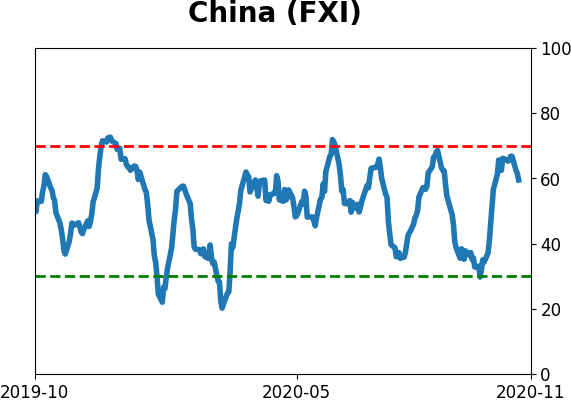
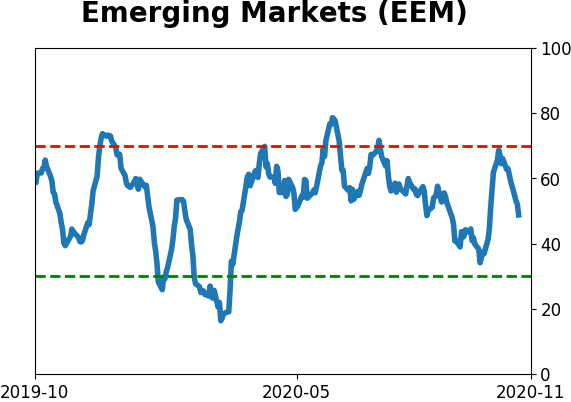
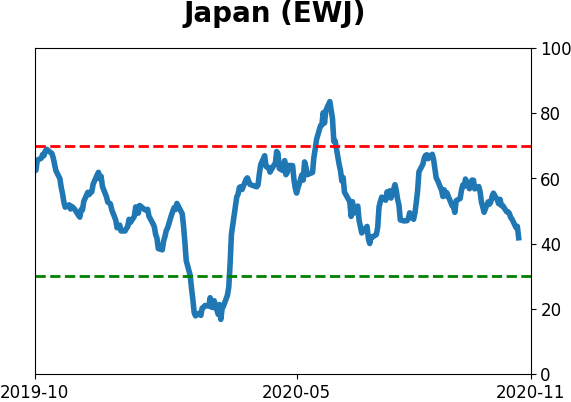
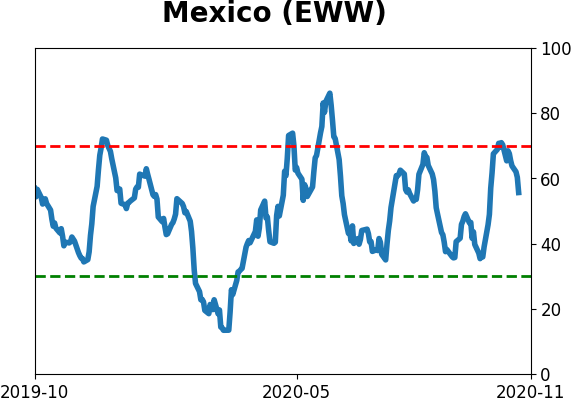
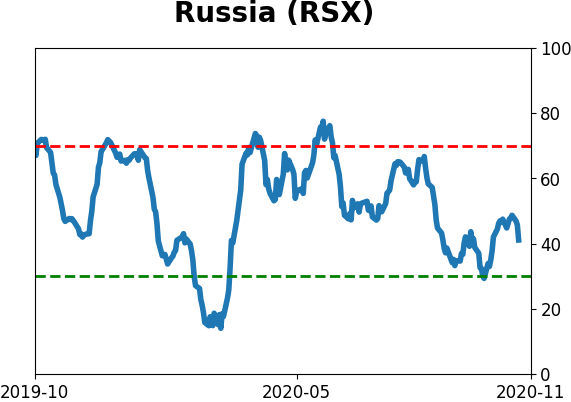
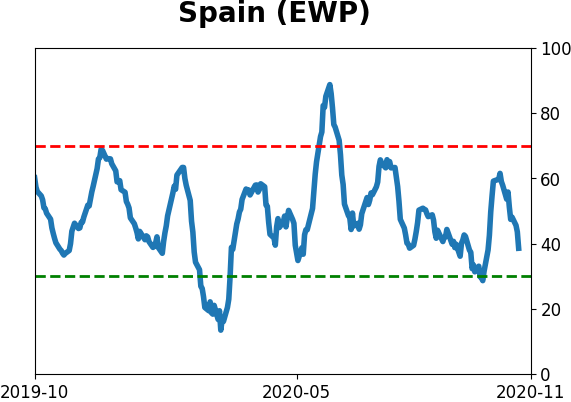
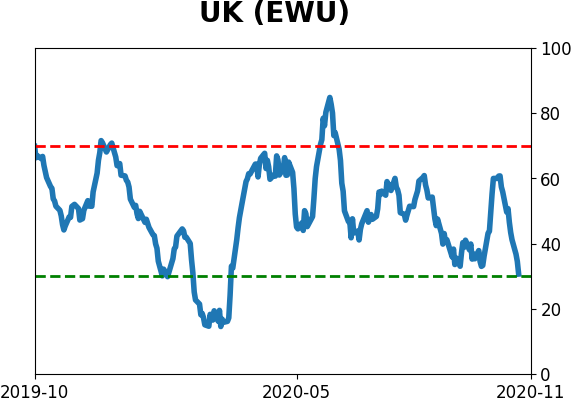
Country ETF's - 10-Day Moving Average
|
|
|
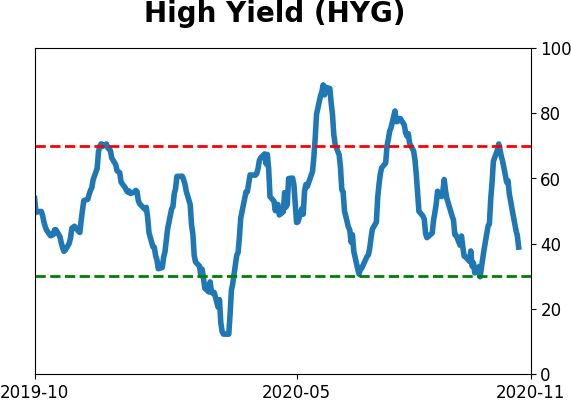
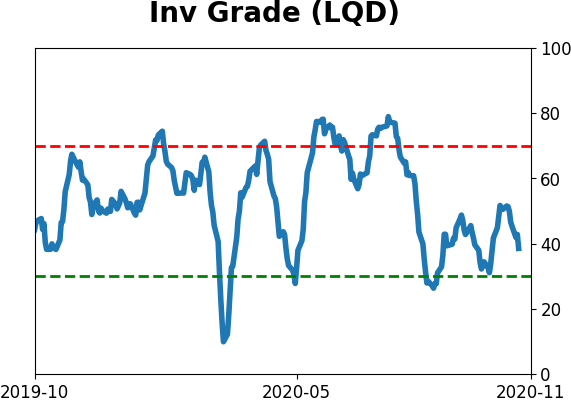
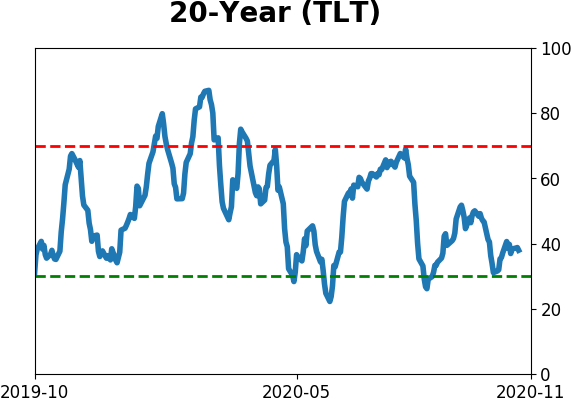
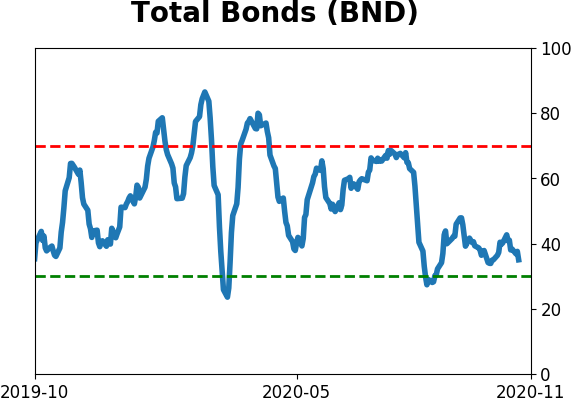
Bond ETF's - 10-Day Moving Average
|
|
|
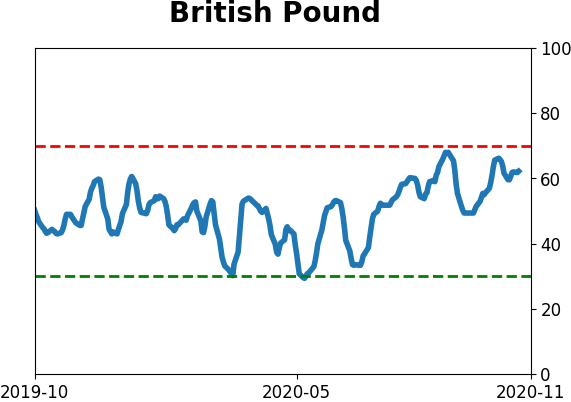
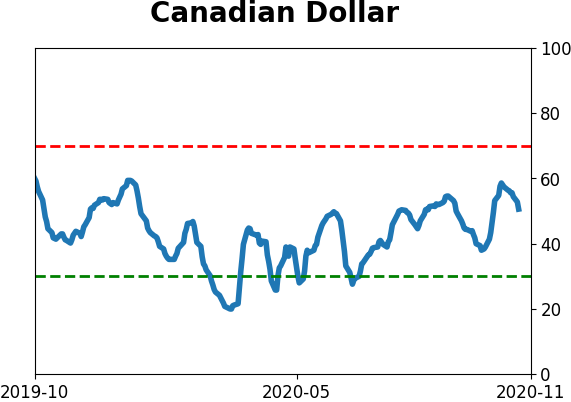
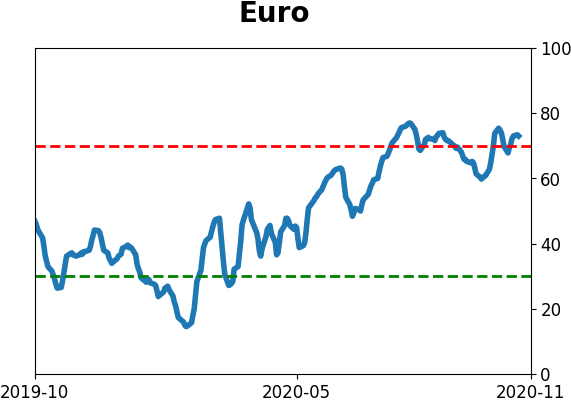
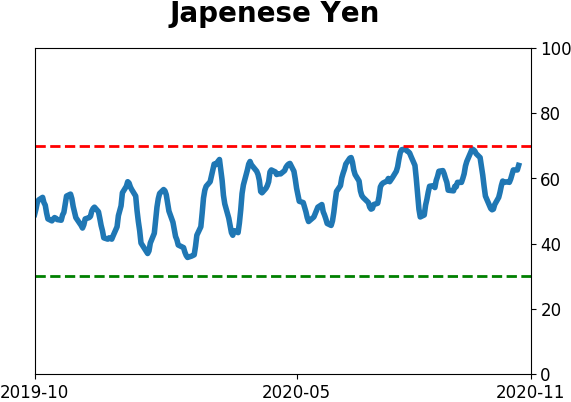
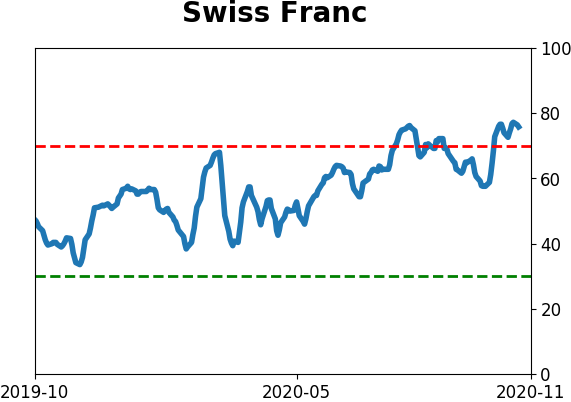
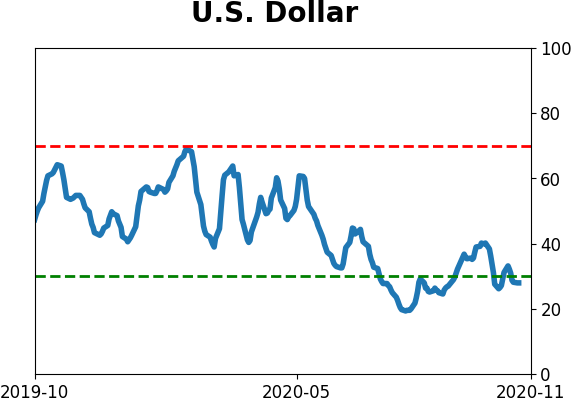
Currency ETF's - 5-Day Moving Average
|
|
|
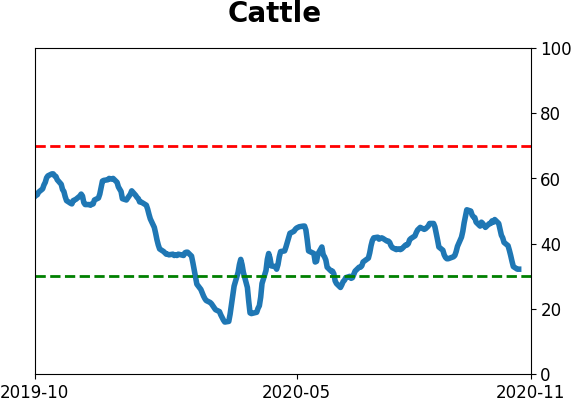
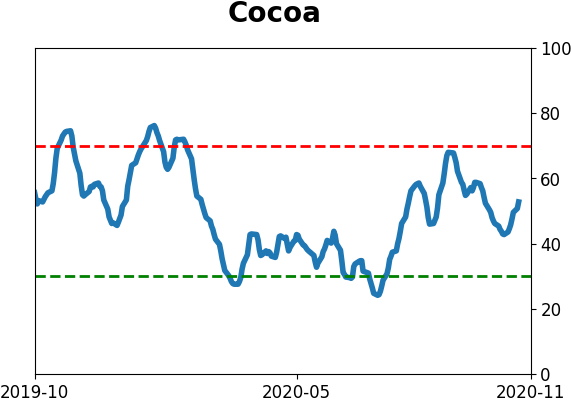
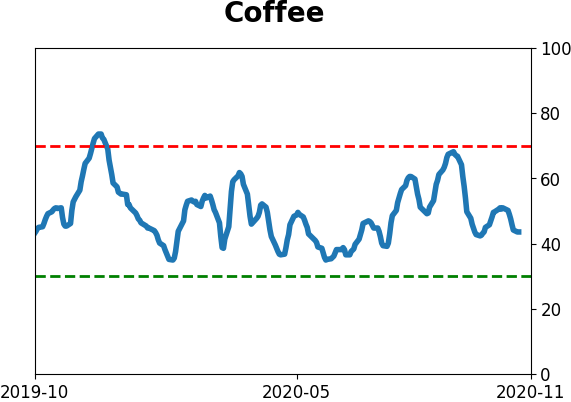
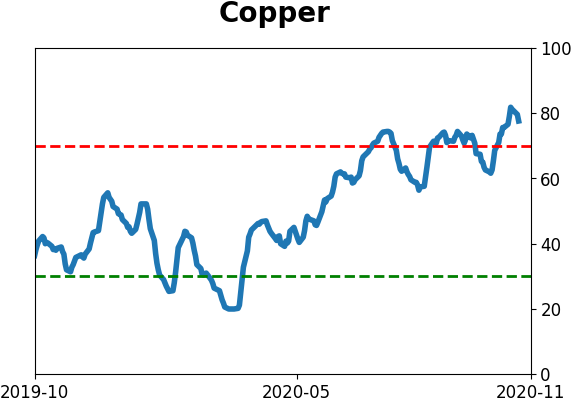
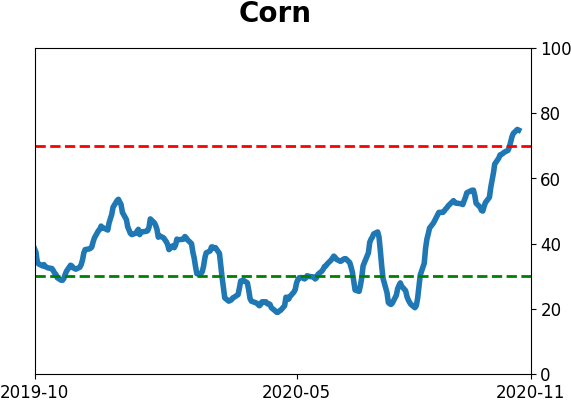
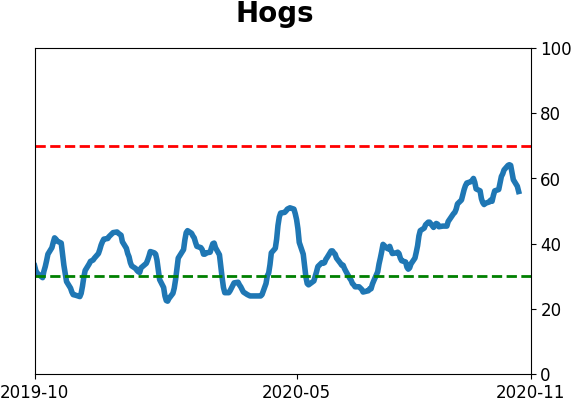
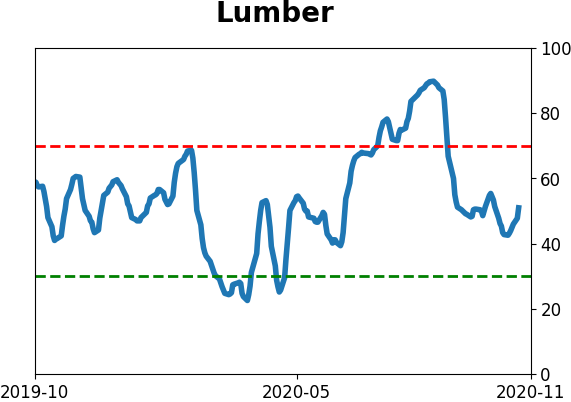
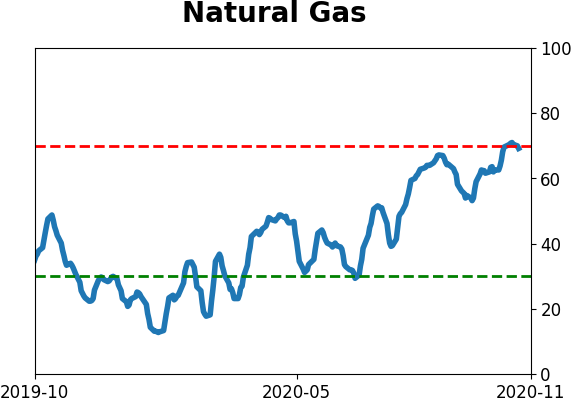
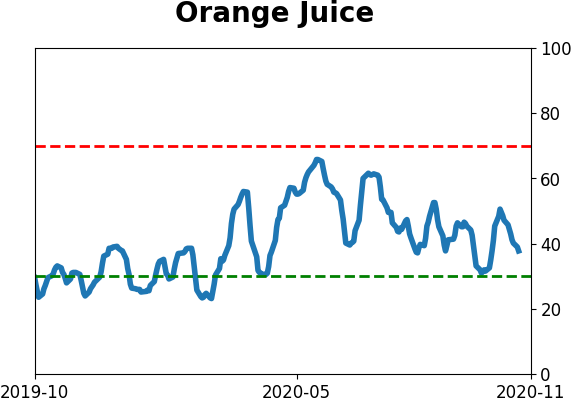
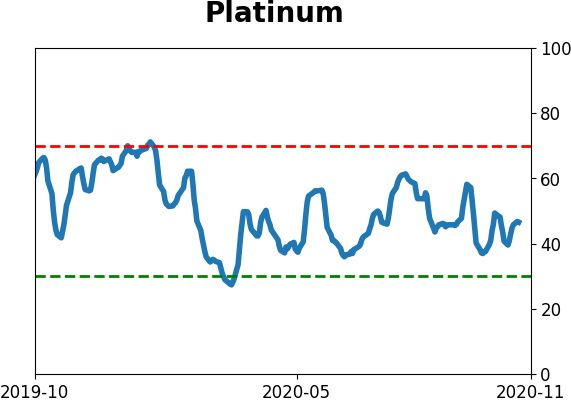
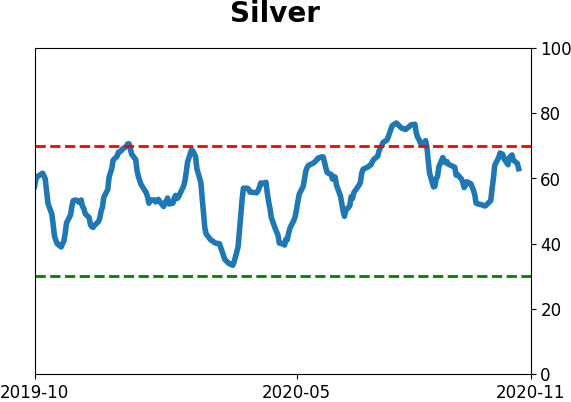
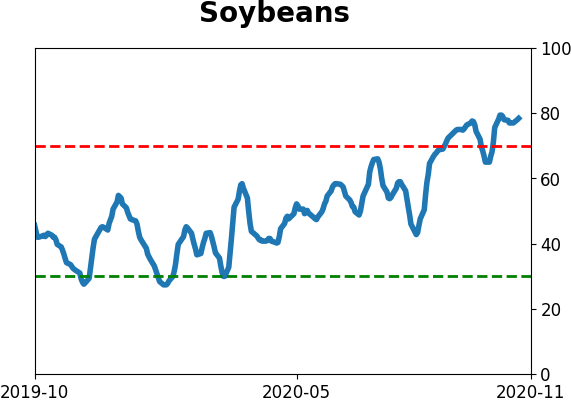
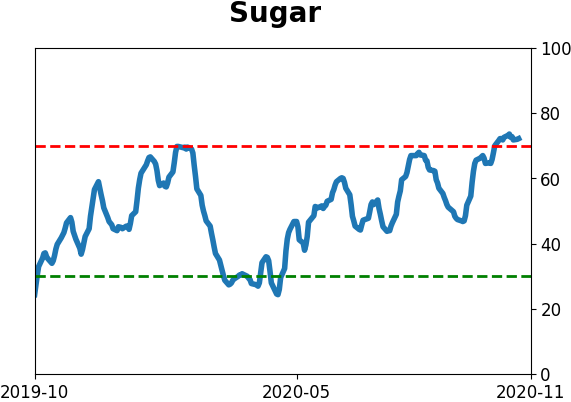
Commodity ETF's - 5-Day Moving Average
|
|