Headlines
|
|
Energy company mergers hit a 17-year low:
Over the past 6 months, mergers and acquisitions among oil & gas companies have tailed off enough to reach a 17-year low. Relative to all M&A activity, it's declined to a 20-year low.
Despite losses, investors borrow more against stocks:
In September, investors borrowed more against their stock holdings, despite those holdings losing value. As a result, total margin debt increased to a near-record level, jumping more than 35% from the spring lows.
Selling pressure drying up: The most important ETF in the world, SPY, closed at a 2-week low on Tuesday, but on the smallest intraday range in over a week. An old technical pattern titled NR7 looks for times when a stock or index has the smallest intraday high-to-low range in 7 sessions. The idea is that it shows a drying up of buying or selling pressure. Below, we can see every time when SPY was above its long-term average and then fell to a 10-day low, but on the narrowest range in 7 days. This did tend to lead to a rebound in the very short-term.
Bottom Line:
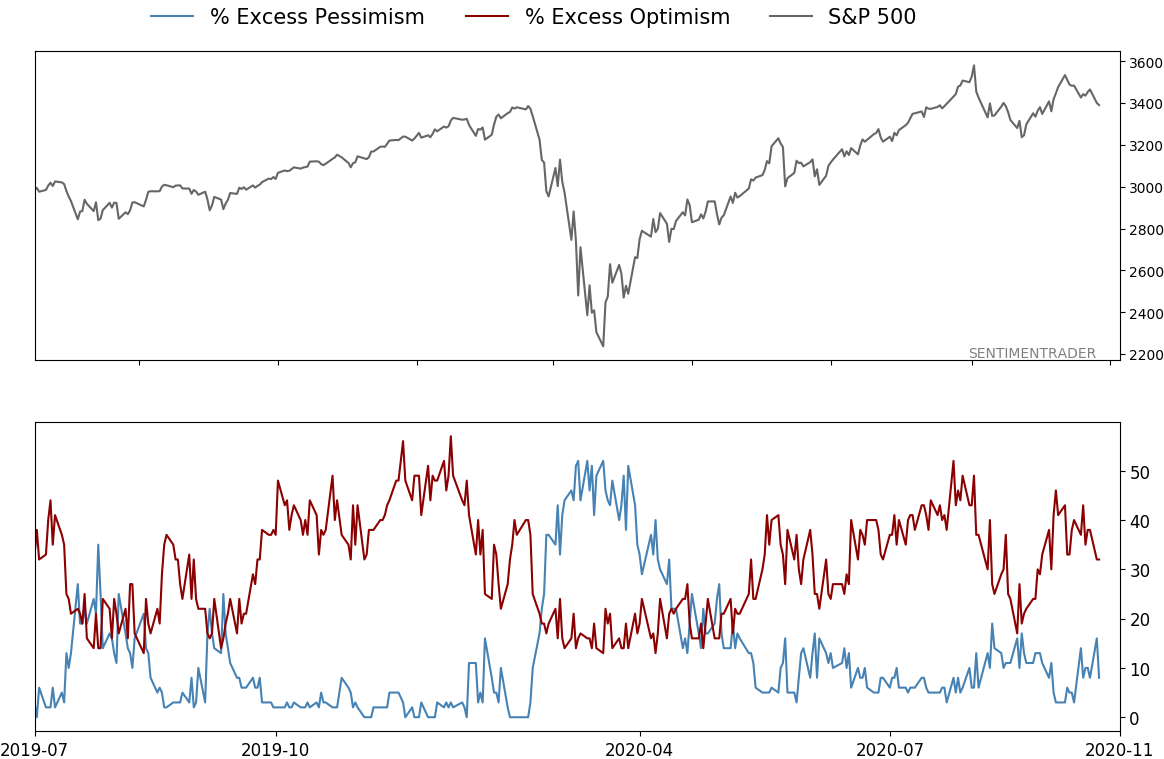
- A positive environment favors becoming aggressive on signs of excessive pessimism.
|
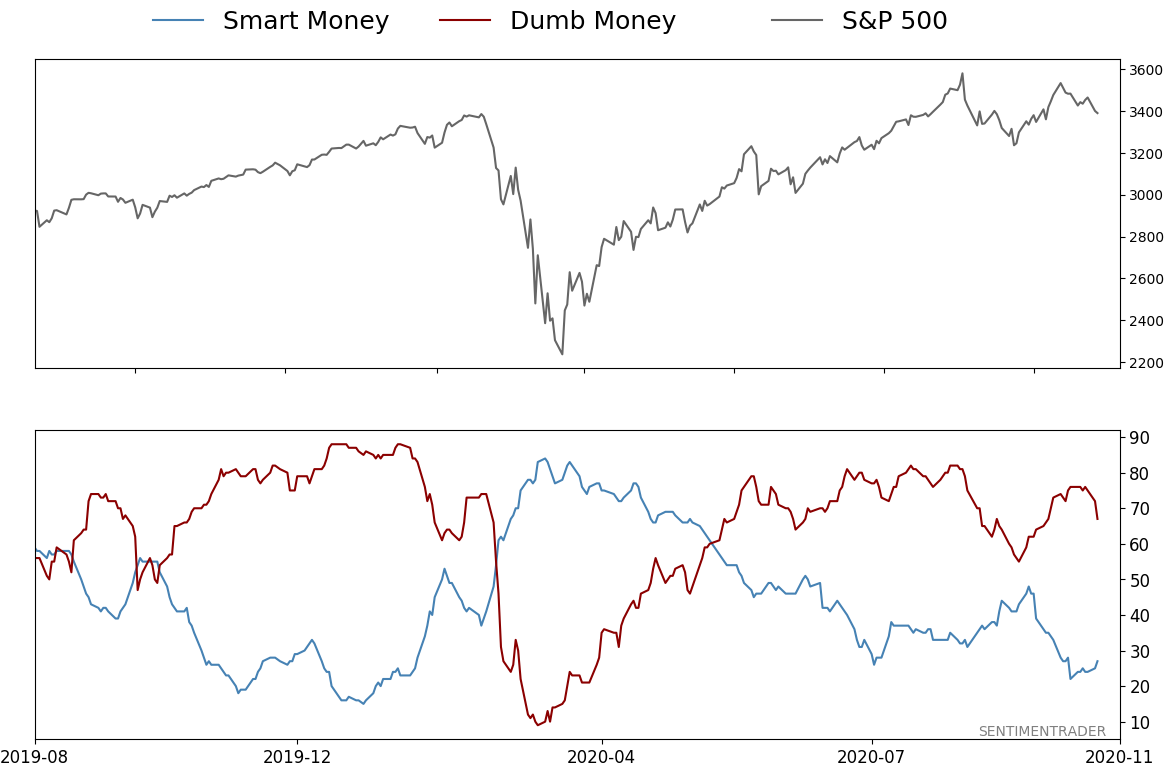
Smart / Dumb Money Confidence
|
Smart Money Confidence: 27%
Dumb Money Confidence: 67%
|
|
Risk Levels
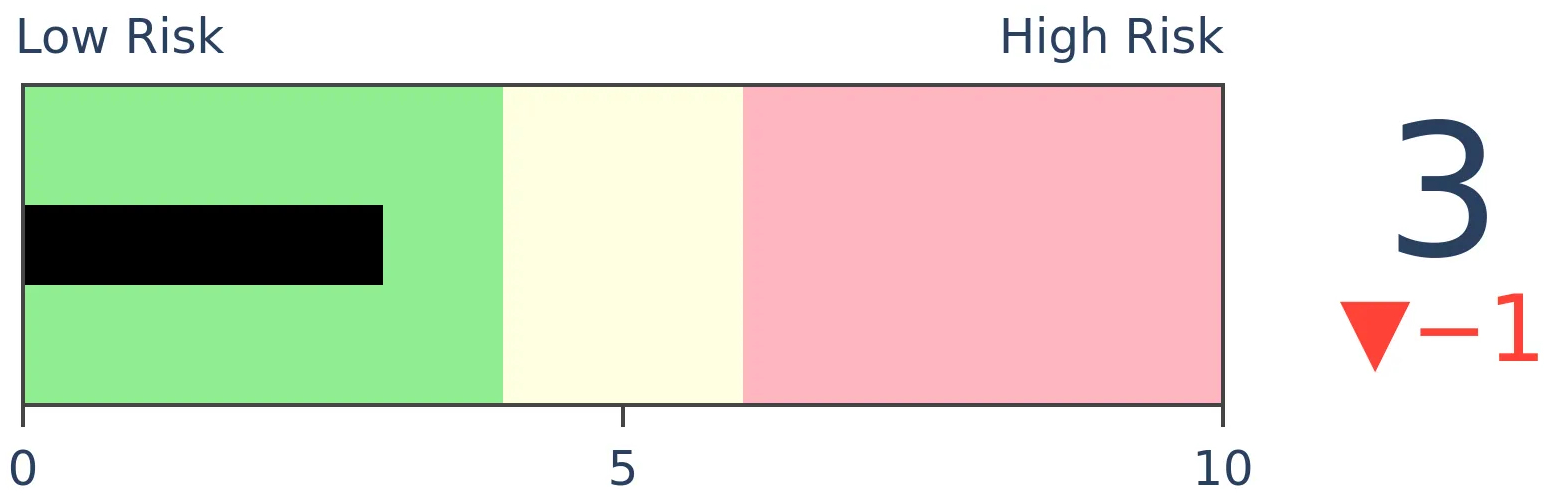
Stocks Short-Term
|
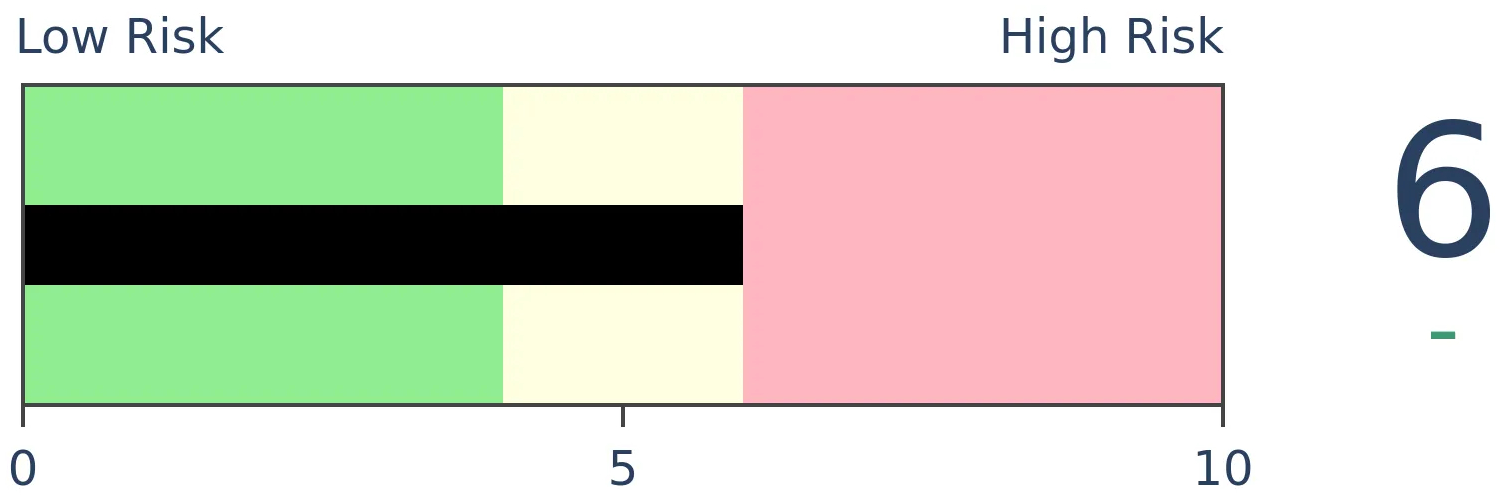
Stocks Medium-Term
|
|
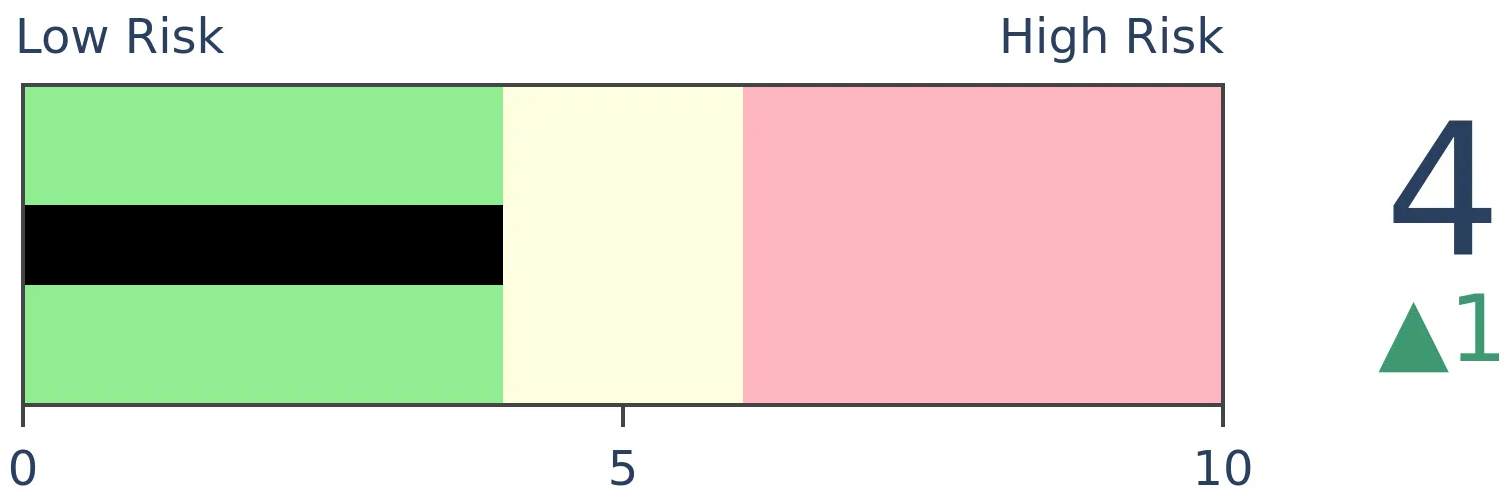
Bonds
|
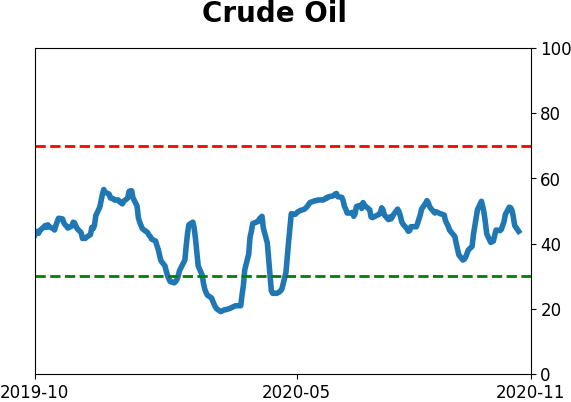
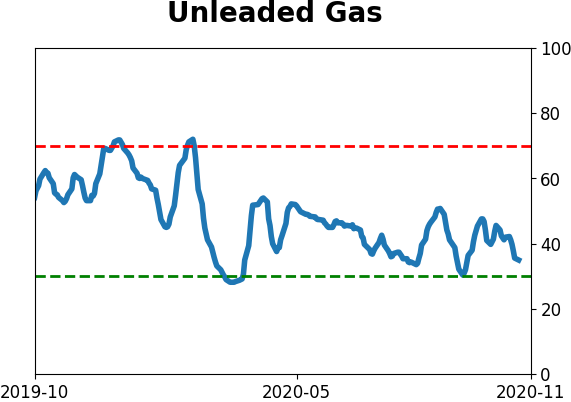
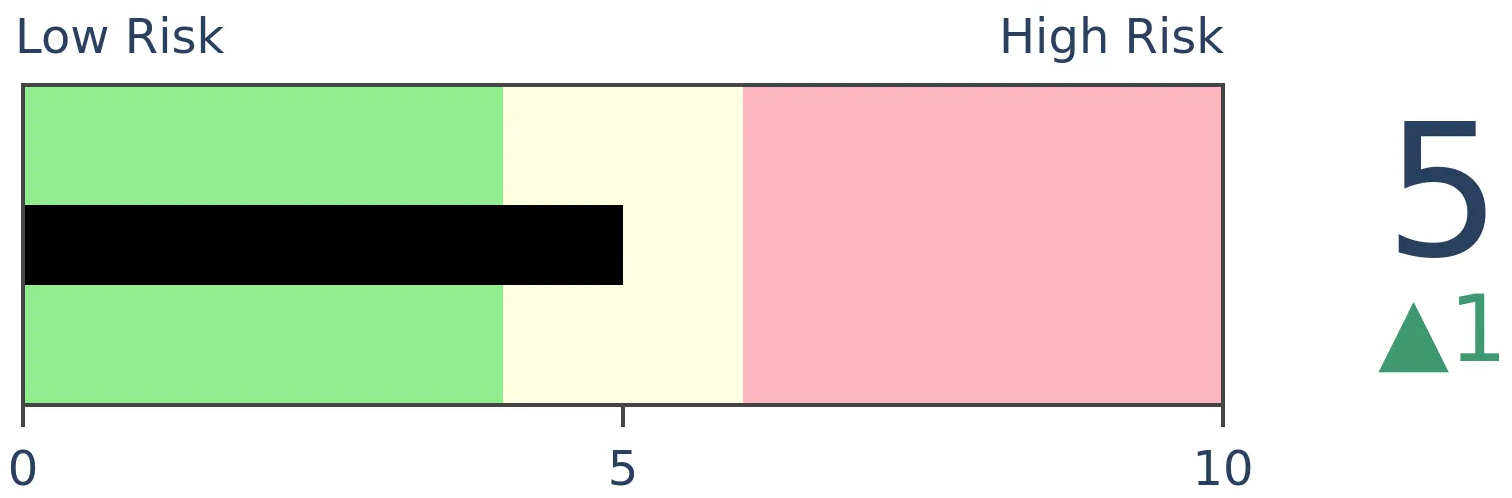
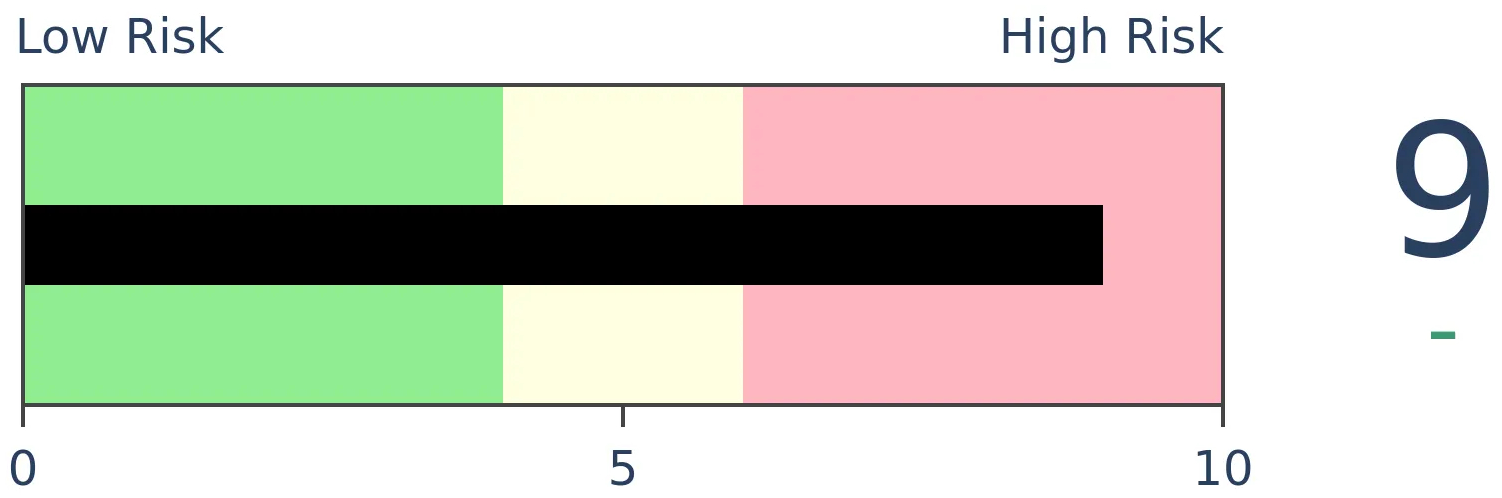
Crude Oil
|
|
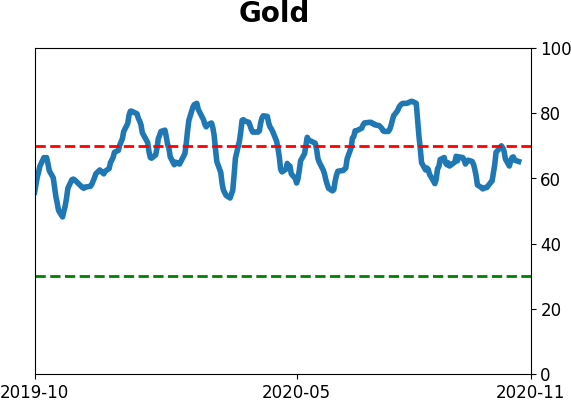
Gold
|
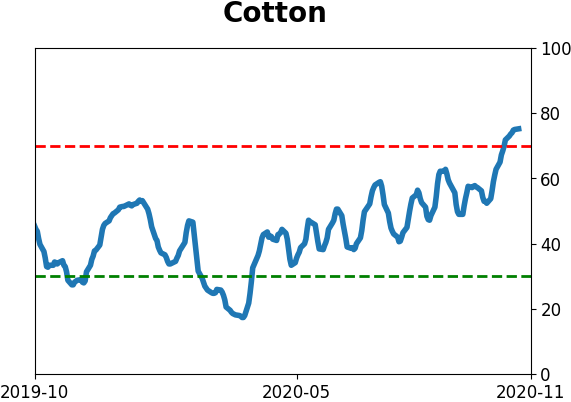
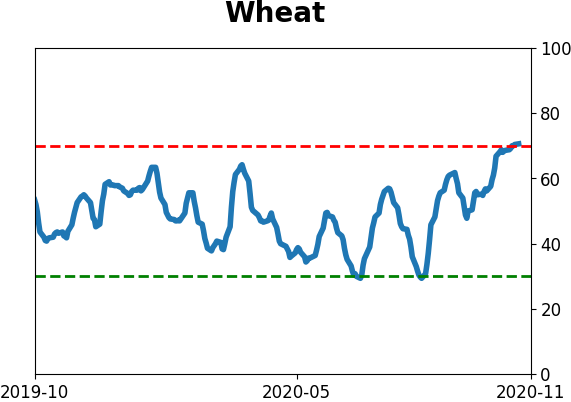
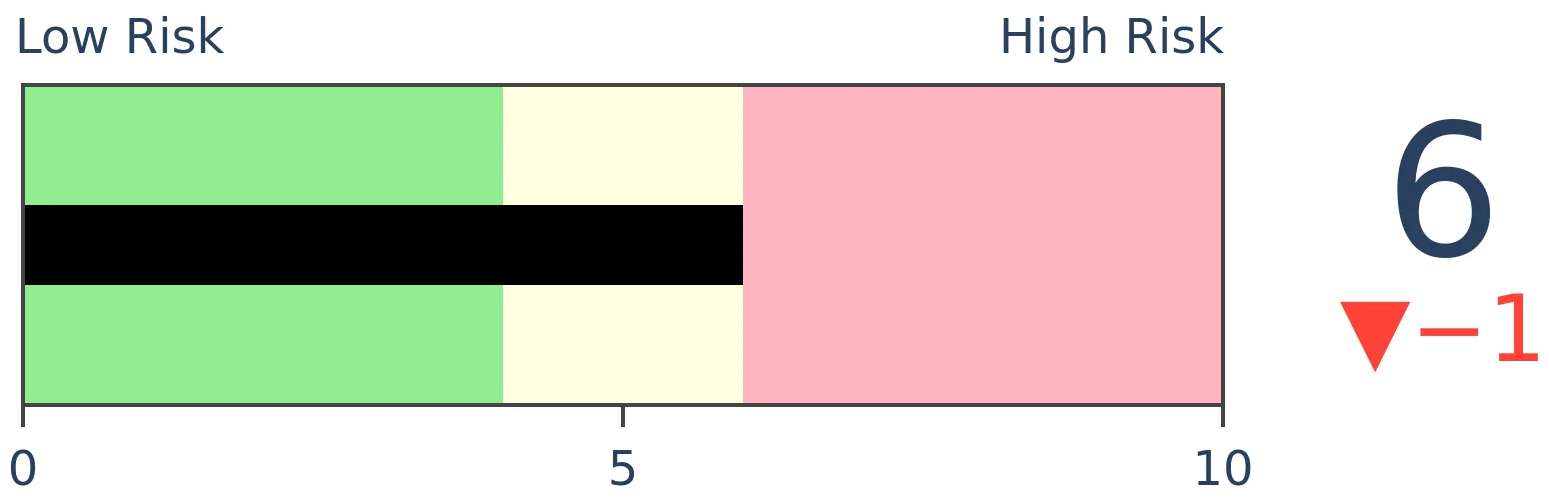
Agriculture
|
|
Research
BOTTOM LINE
Over the past 6 months, mergers and acquisitions among oil & gas companies have tailed off enough to reach a 17-year low. Relative to all M&A activity, it's declined to a 20-year low.
FORECAST / TIMEFRAME
None
|
The energy sector is in a depression.
Losses in the sector have been among the worst in any sector in 90 years, companies are cutting employees and dividends, active oil rigs collapsed faster than just about any time in 30 years, and most of their share prices have dropped so much that they trade for less than a cup of coffee.
It's no wonder few of them want to marry.
At least some firms are starting to see some bargains, apparently, with a few mergers announced over the past week. As the Wall Street Journal notes:
"The long-anticipated string of transactions is expected to continue for healthier companies in the country’s most prolific oil fields, investors said, while many smaller, debt-burdened companies that are hoping for a deal may draw few offers."
According to Bloomberg data, there have been just over 300 mergers and acquisitions in the Oil & Gas and Oil & Gas Services industries worldwide over the past 6 months. That sounds like a lot, but it's the lowest in 17 years. It has only recently started to curl higher.
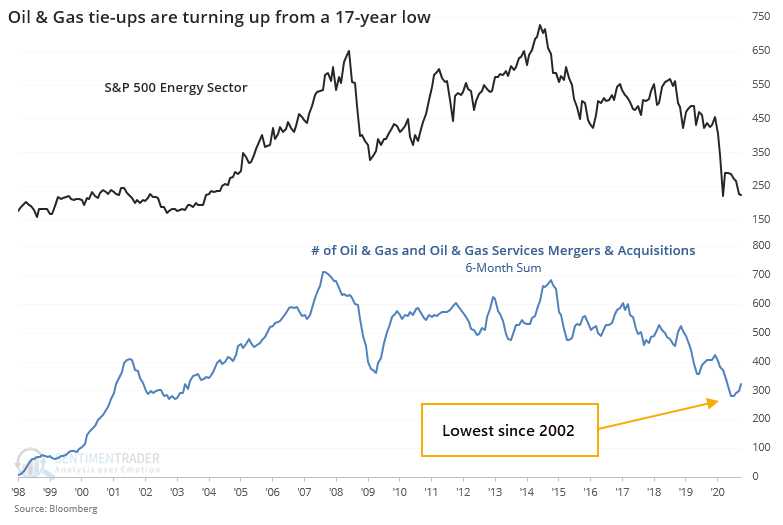
There is a close correlation between a sector's price action and its M&A activity, so it's not really surprising that it's dropped off so much from the peak.
Relative to everything else, it's even more extreme. These mergers accounted for about 1.3% of all M&A activity on average over the past 6 months. That's the lowest in 20 years.
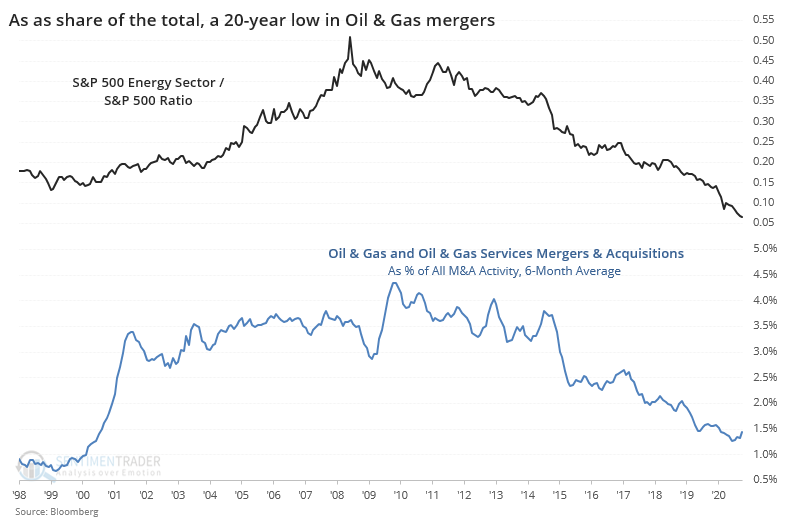
This data only goes back a little over 20 years, so we can't quite see how it would have stacked up prior to energy stocks going on their big run of outperformance versus the broader market from 2000 - 08. Still, the fact that it's dropped so much in recent years - granted, for good reason - is another sign showing just how much these stocks have been abandoned.
BOTTOM LINE
In September, investors borrowed more against their stock holdings, despite those holdings losing value. As a result, total margin debt increased to a near-record level, jumping more than 35% from the spring lows.
FORECAST / TIMEFRAME
None
|
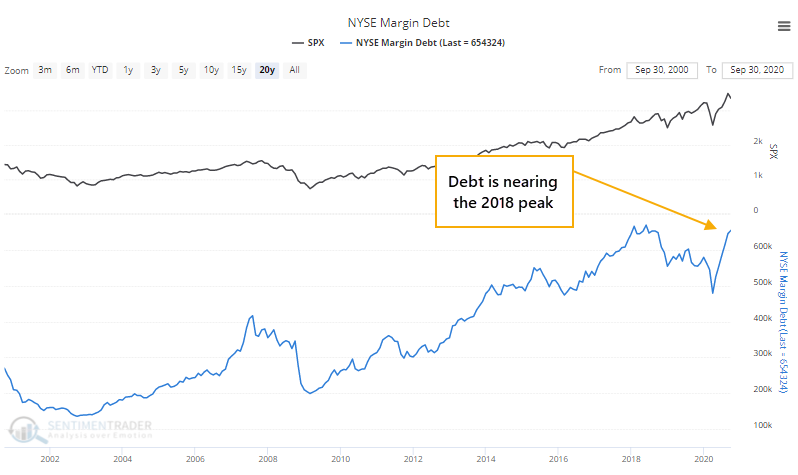
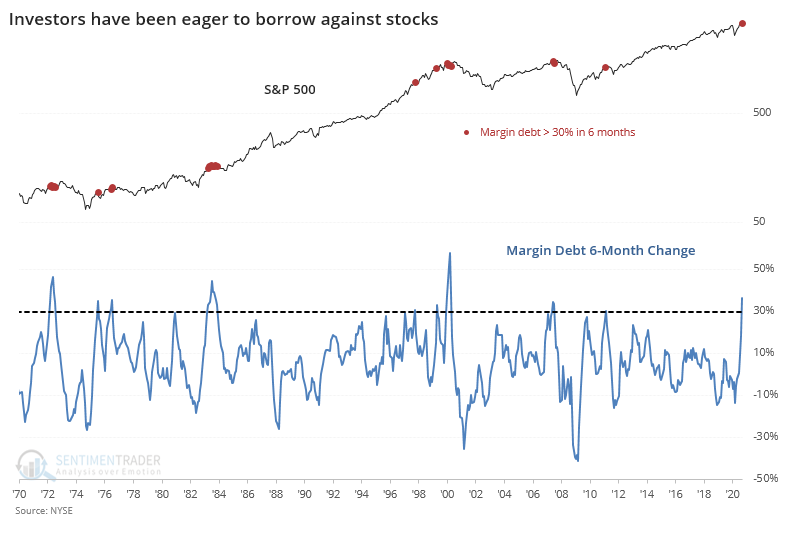
Investors have become pretty willing to borrow against the value of their brokerage accounts.
The latest margin debt figures show that investors have pledged more than $650 billion against their stock holdings as of September. That's up more than 35% from the low in March and is nearing a record high.
This is unusual because in September stocks fell and yet borrowings against those holdings increased.
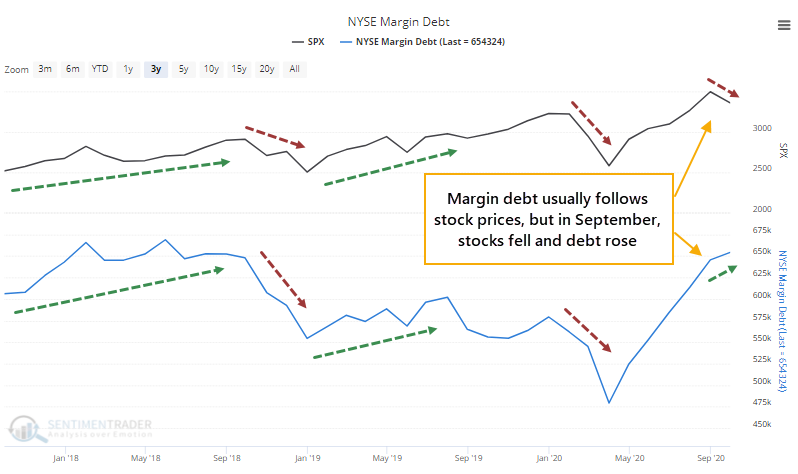
Over the past 70 years, it has been unusual to see the monthly percentage change in the S&P 500 differ much from the change in margin debt. There's a fairly high positive correlation between the two, which September violated.
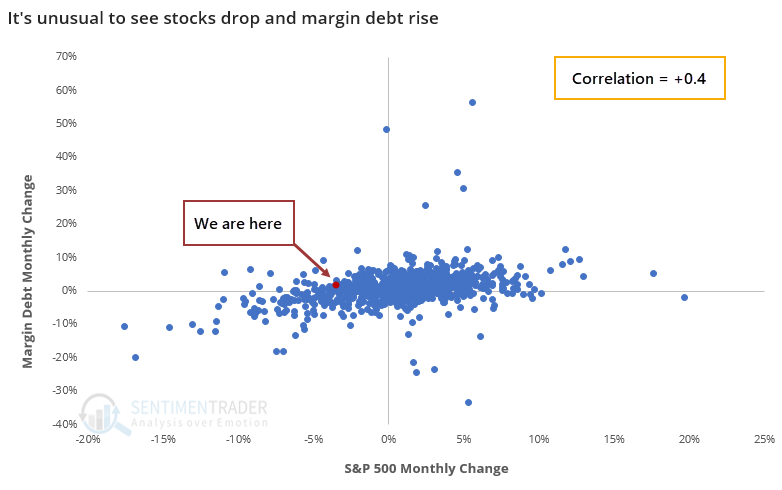
A knee-jerk contrarian would assume this is a bad thing. It suggests that investors are complacent, too willing to increase their leverage despite a market that's not going their way. But it hasn't really proven out that way.
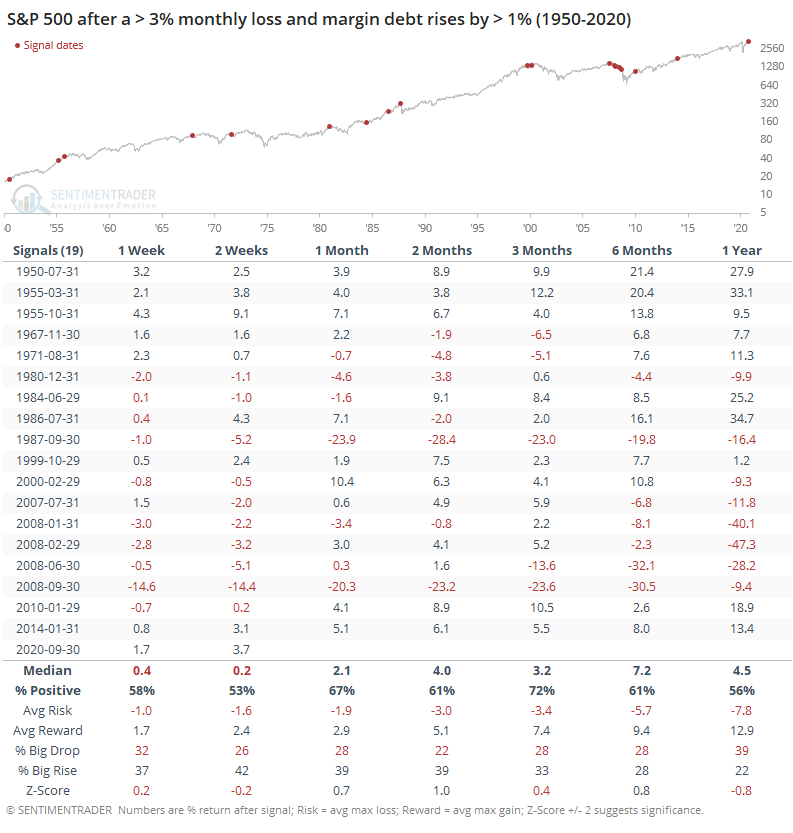
Clearly, there were some trouble spots - most notably in 1987, 2000, and 2007, when longer-term returns suffered greatly. Those were also times when debt had jumped by a large amount, and quickly.
Over the past 6 months, margin debt has jumped by more than 35%, one of the largest rates-of-change since 1950.
That was most definitely not a good sign in 2000 and 2007, but as we've discussed multiple times in recent years, that was coming from a higher base, and the growth in debt was far ahead of the growth rate in stocks. Neither is the case this time around.
Below, we can see the S&P's future returns when debt jumped by more than 25% when it was coming off at least a 3-year low.
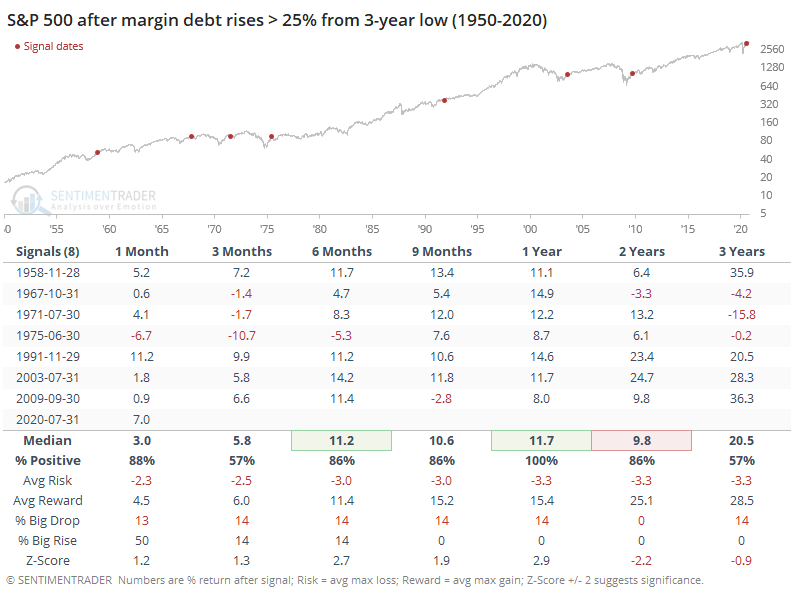
This context is important, as it more accurately reflects investor sentiment at the time. In these cases, stocks had a strong tendency to rally over the next 6-12 months, with no large failures. The risk/reward was skewed impressively to the "reward" side, though there was not a strong bias toward seeing an abnormally large rise versus fall across most time frames.
We'd be more inclined to consider the latest margin debt data as a positive for stocks going forward, but because the rate of change has been so high, and it's so near the prior record level, there are enough concerns that it likely shouldn't be included in the Active Studies.
Active Studies
| Time Frame | Bullish | Bearish | | Short-Term | 0 | 0 | | Medium-Term | 4 | 8 | | Long-Term | 48 | 2 |
|
Indicators at Extremes
Portfolio
| Position | Description | Weight % | Added / Reduced | Date | | Stocks | 15.6% RSP, 10.1% VWO, 7.5% XLE, 5.1% PSCE | 38.2 | Added 5% | 2020-10-15 | | Bonds | 10% BND, 10% SCHP, 10% ANGL | 29.7 | Reduced 0.1% | 2020-10-02 | | Commodities | GCC | 2.4 | Reduced 2.1%
| 2020-09-04 | | Precious Metals | GDX | 4.7 | Added 5% | 2020-09-09 | | Special Situations | | 0.0 | Reduced 5% | 2020-10-02 | | Cash | | 25.0 | | |
|
Updates (Changes made today are underlined)
After the September swoon wrung some of the worst of the speculation out of stocks, there are some signs that it's returning, especially in the options market. It's helped to push Dumb Money Confidence above 70%. A big difference between now and August is that in August, there was a multitude of days with exceptionally odd breadth readings. Some of the biggest stocks were masking underlying weakness. Combined with heavy speculative activity, it was a dangerous setup. Now, we've seen very strong internal strength, in the broad market, as well as tech and small-cap stocks. Prior signals almost invariably led to higher prices. That's hard to square with the idea that forward returns tend to be subdued when Confidence is high, but that's less reliable during healthy market conditions, which we're seeing now (for the most part). I added some risk with small-cap energy stocks, due to an increasing number of positive signs in both small-caps and energy. This is intended as a long-term position.
RETURN YTD: -1.3% 2019: 12.6%, 2018: 0.6%, 2017: 3.8%, 2016: 17.1%, 2015: 9.2%, 2014: 14.5%, 2013: 2.2%, 2012: 10.8%, 2011: 16.5%, 2010: 15.3%, 2009: 23.9%, 2008: 16.2%, 2007: 7.8%
|
|
Phase Table
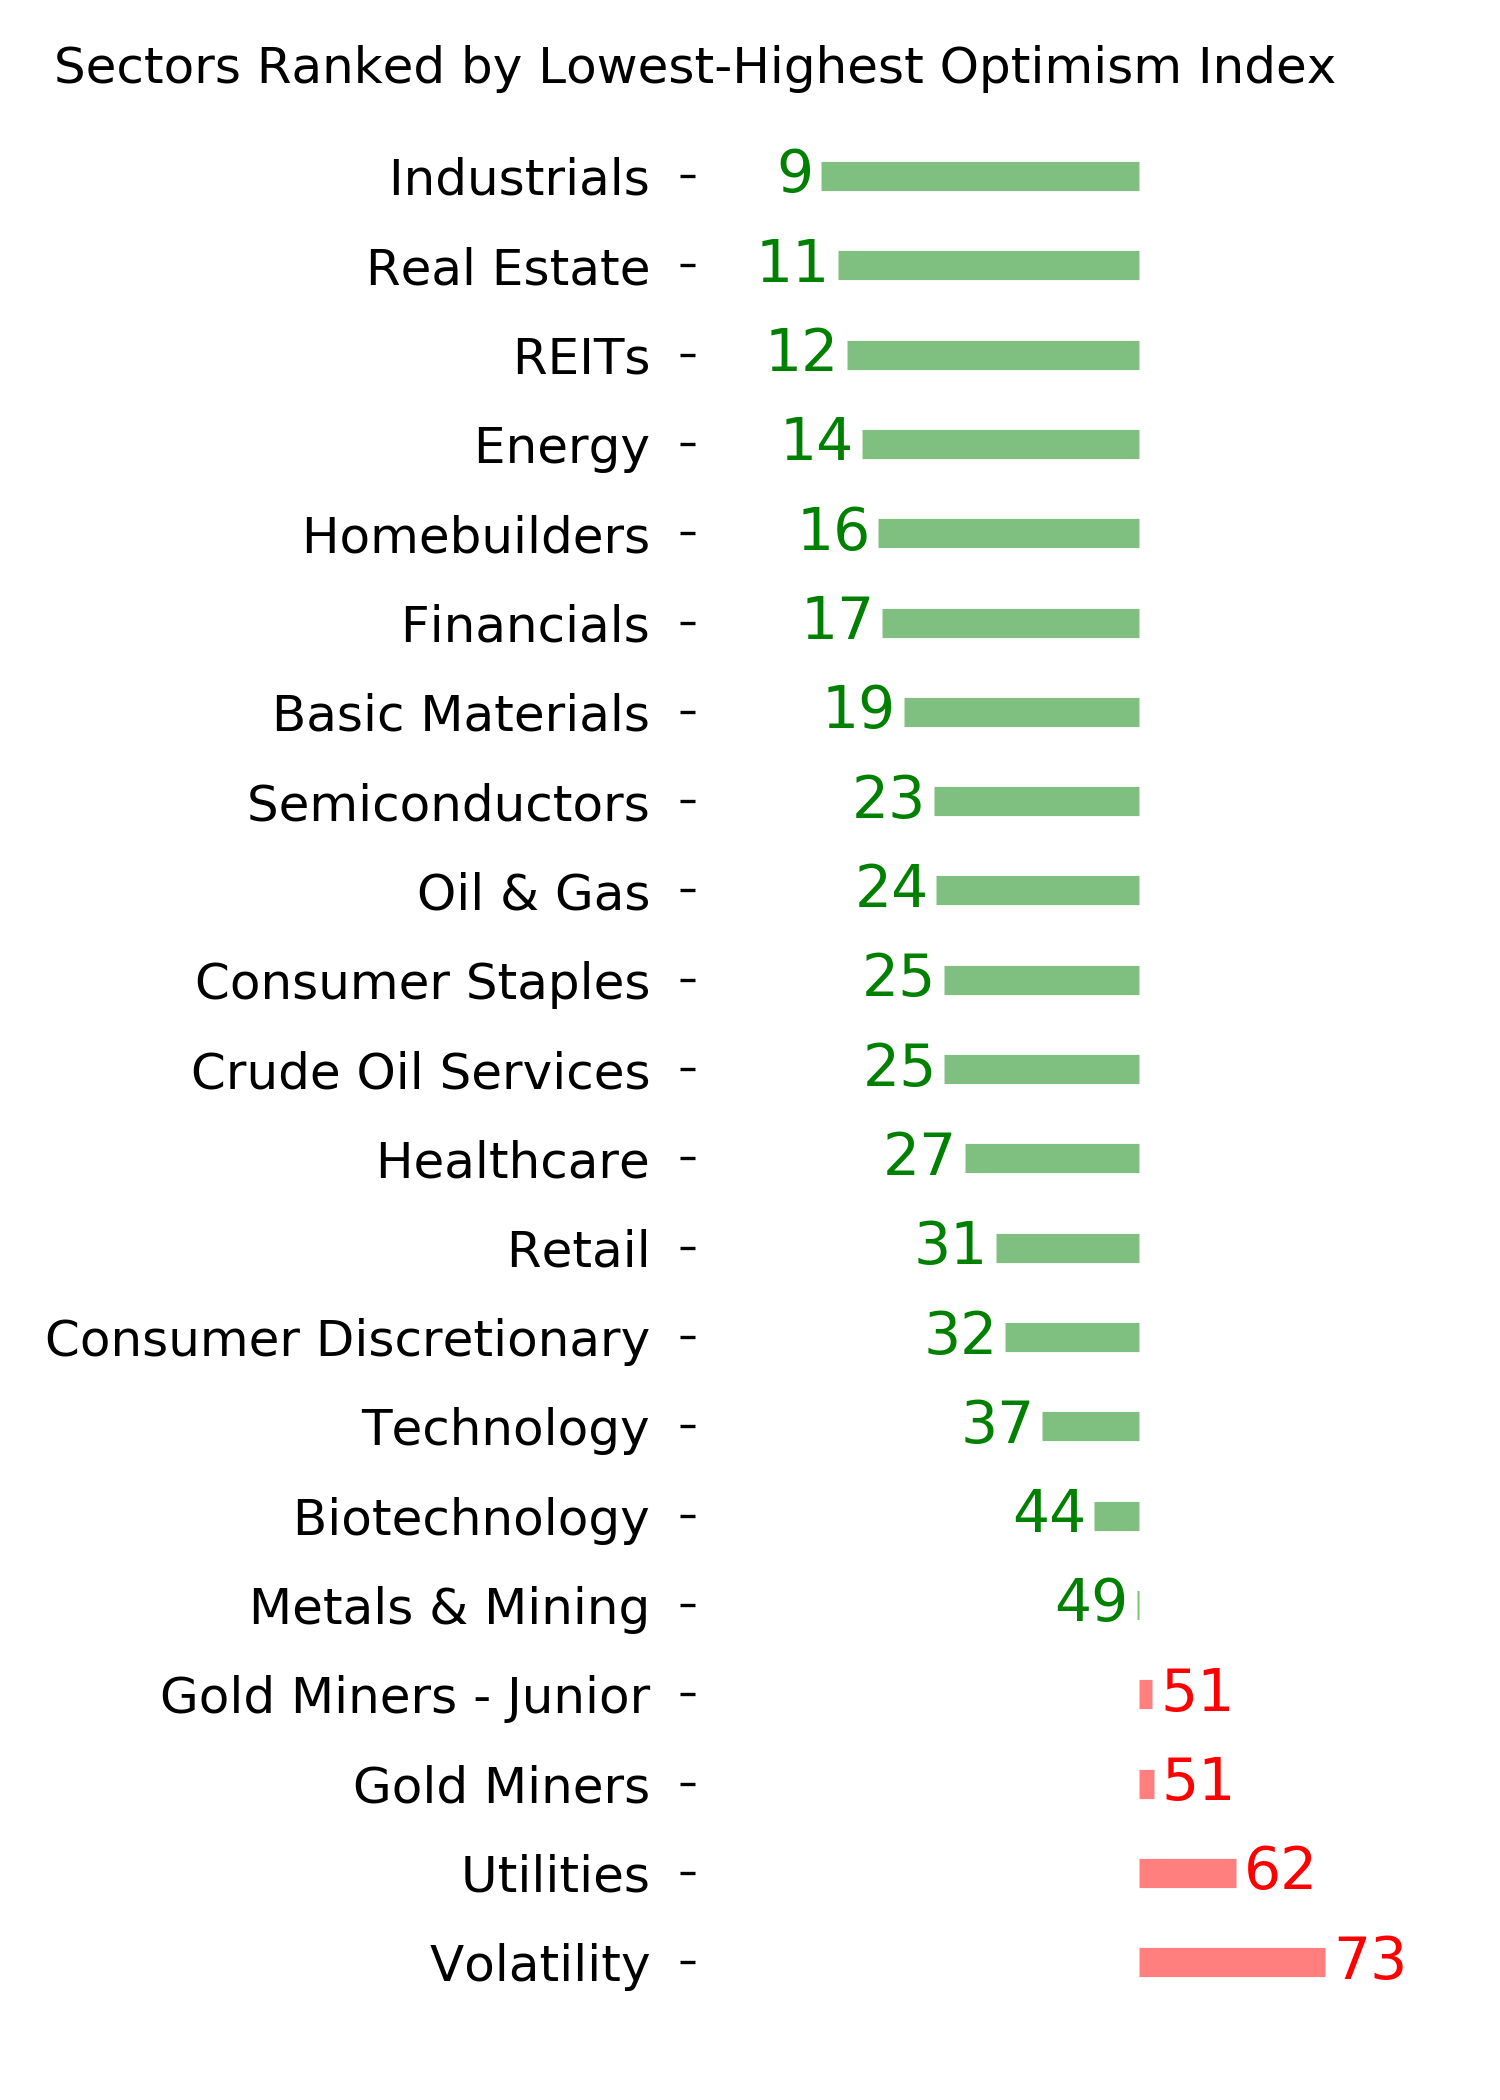
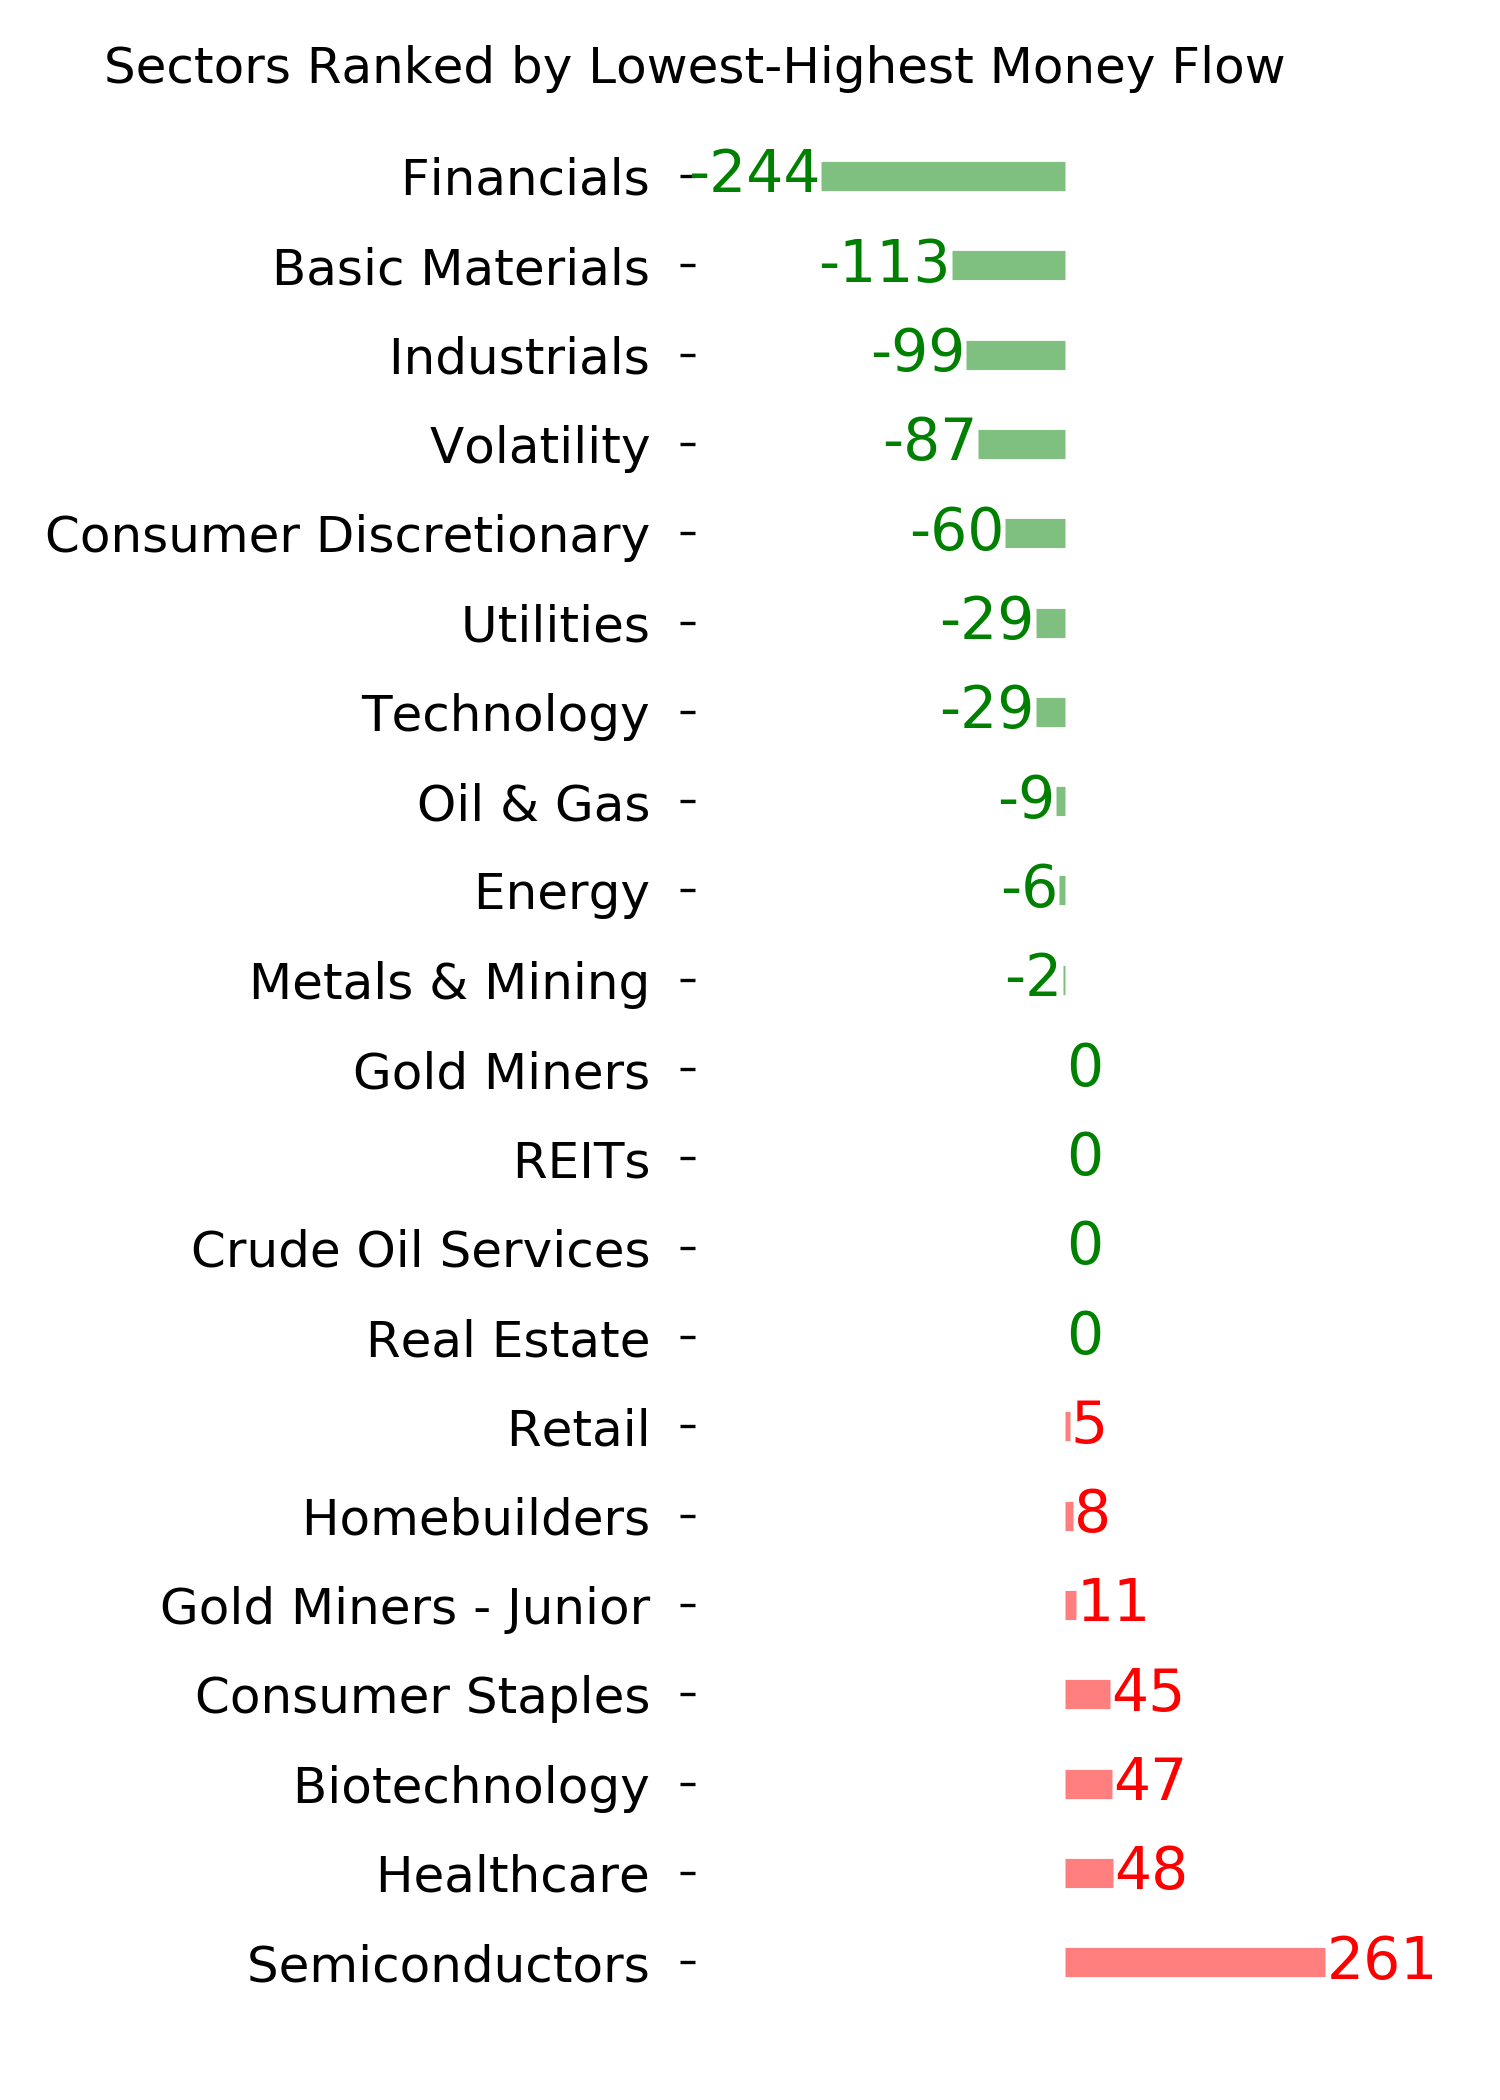
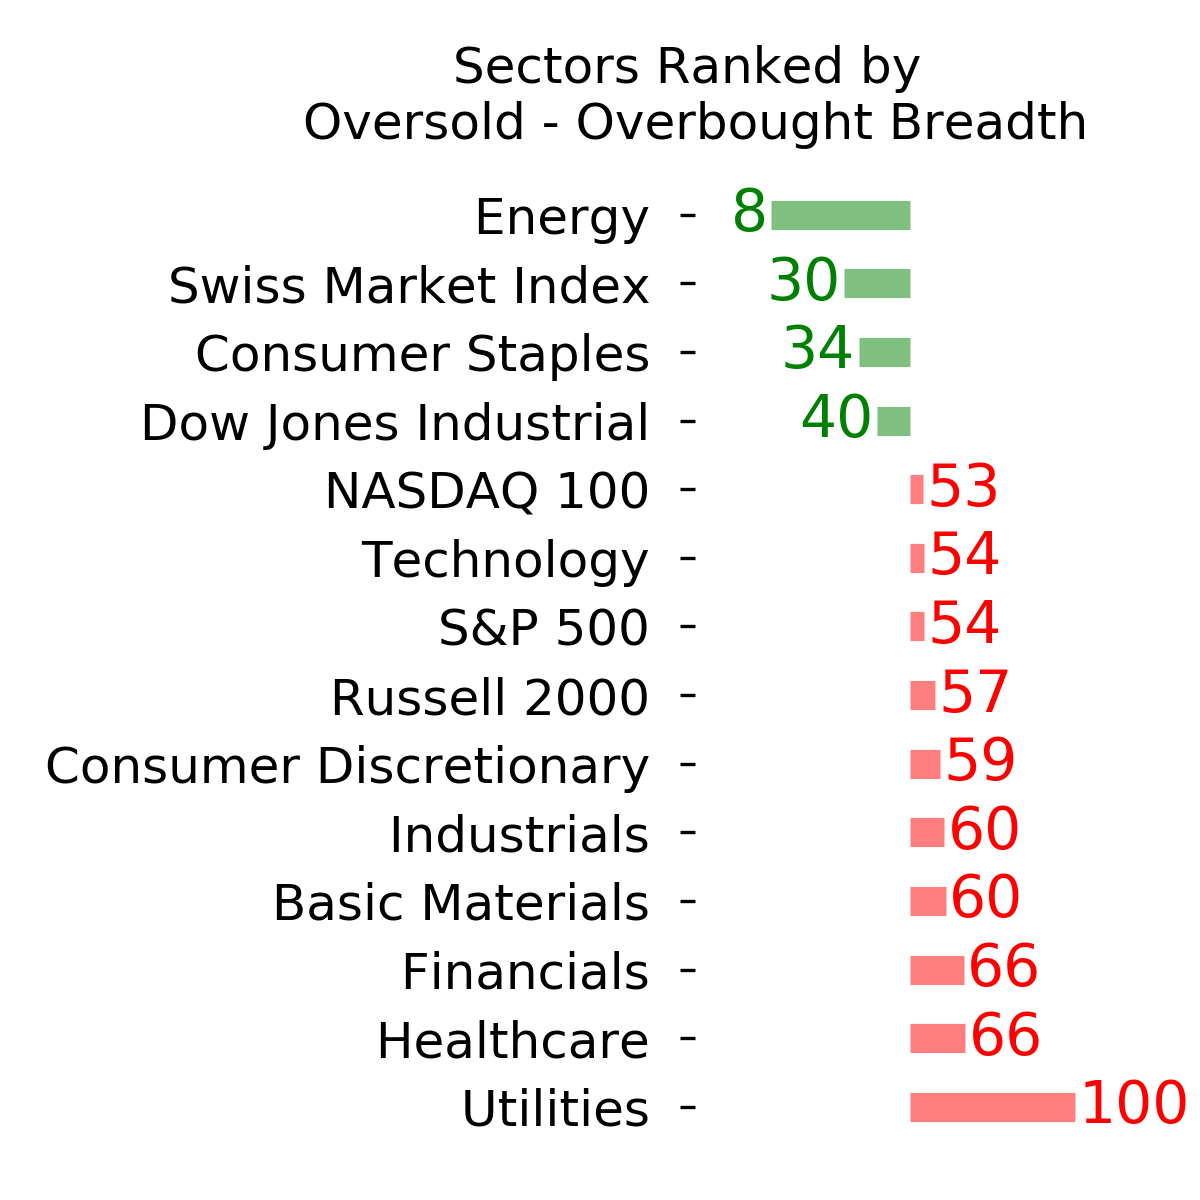
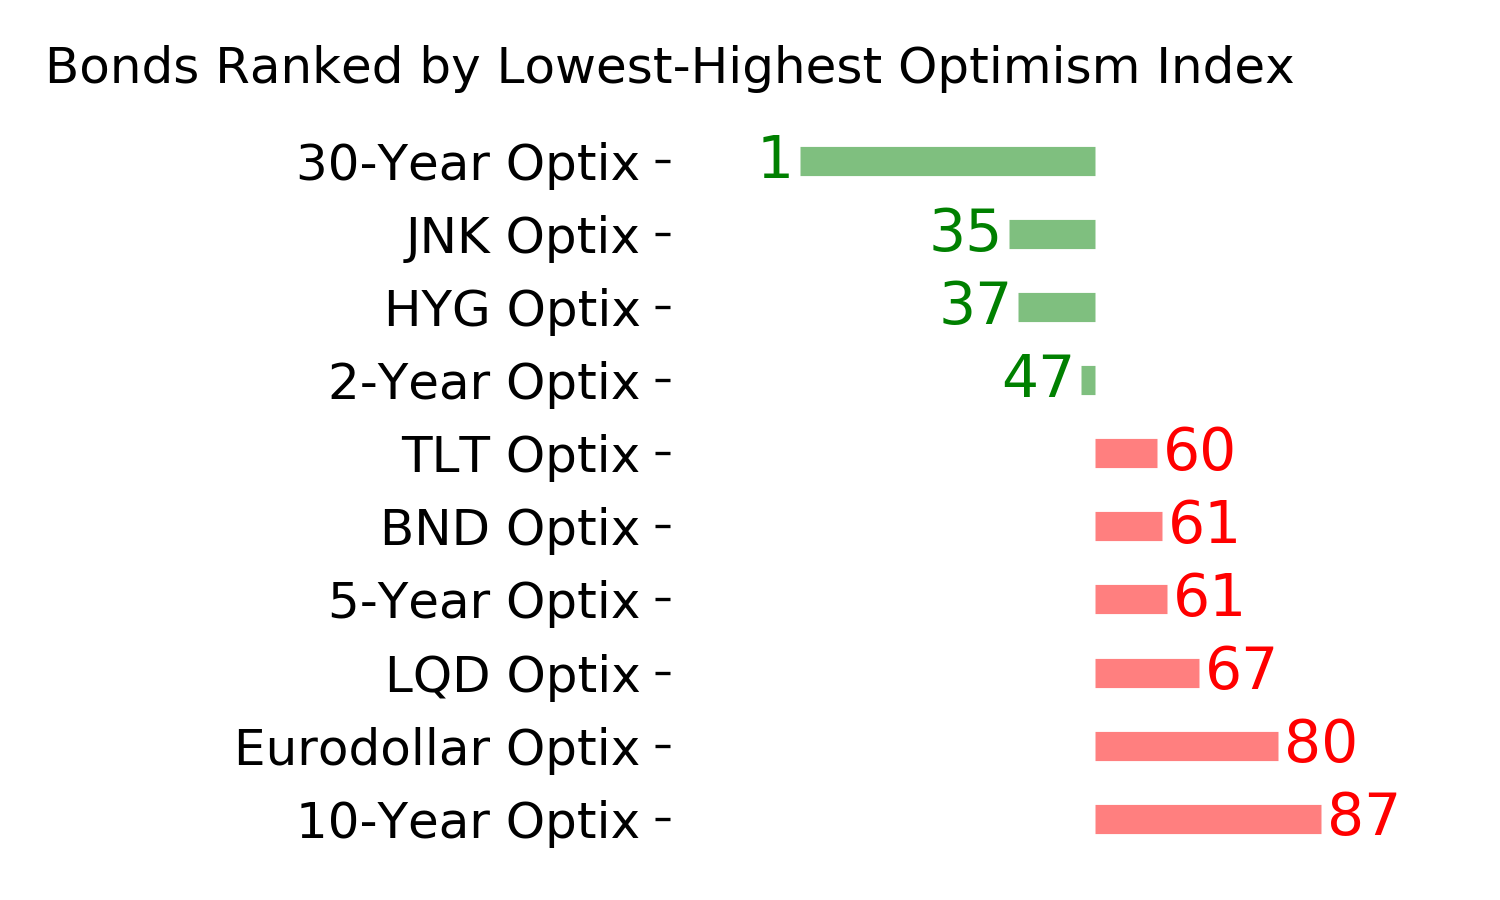
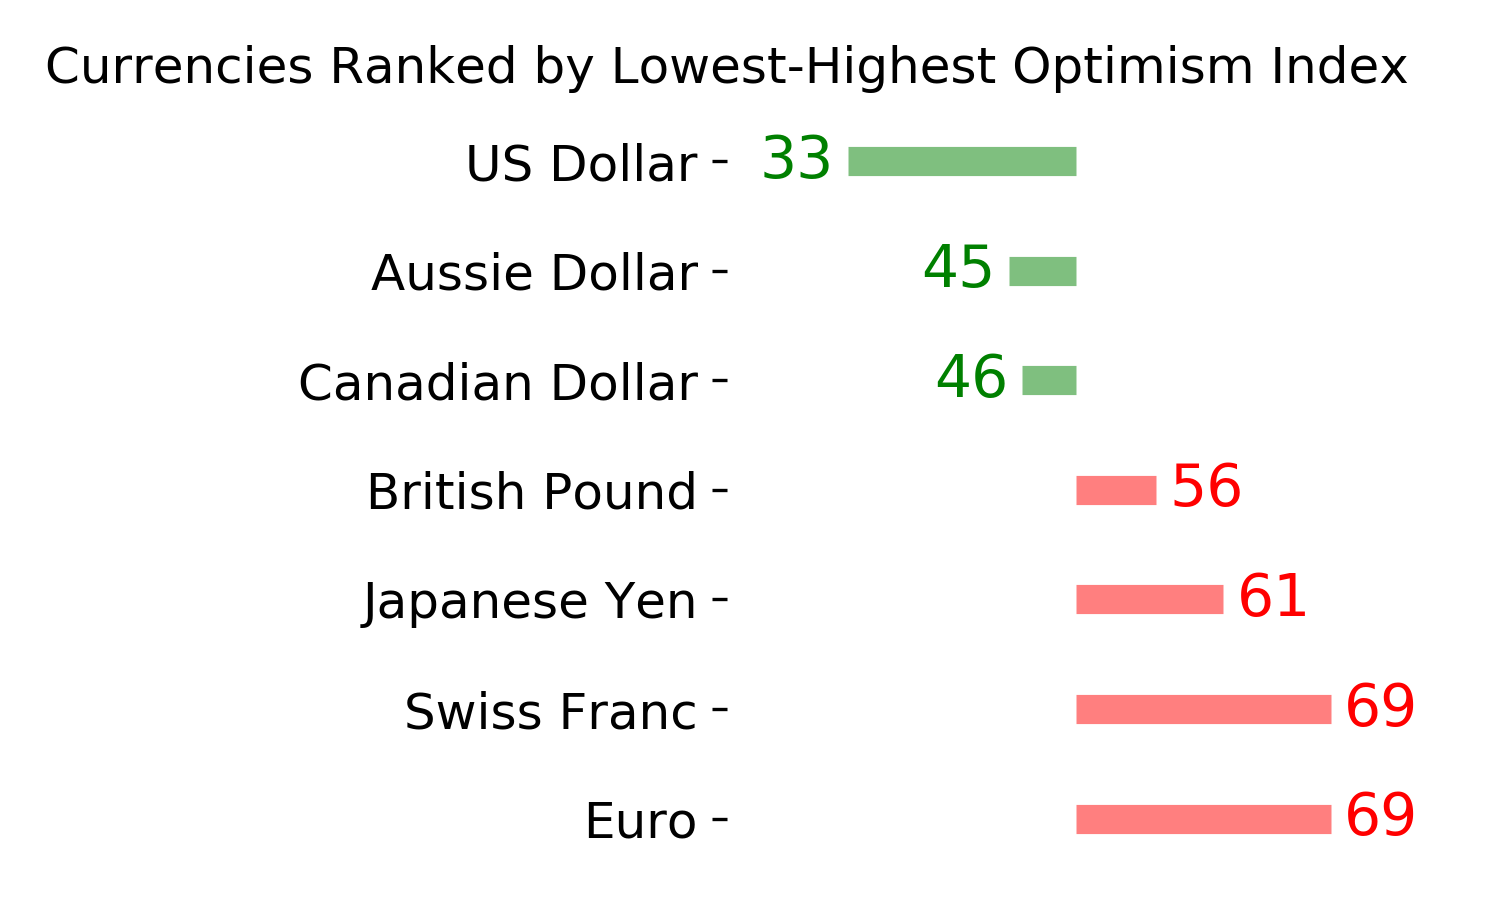
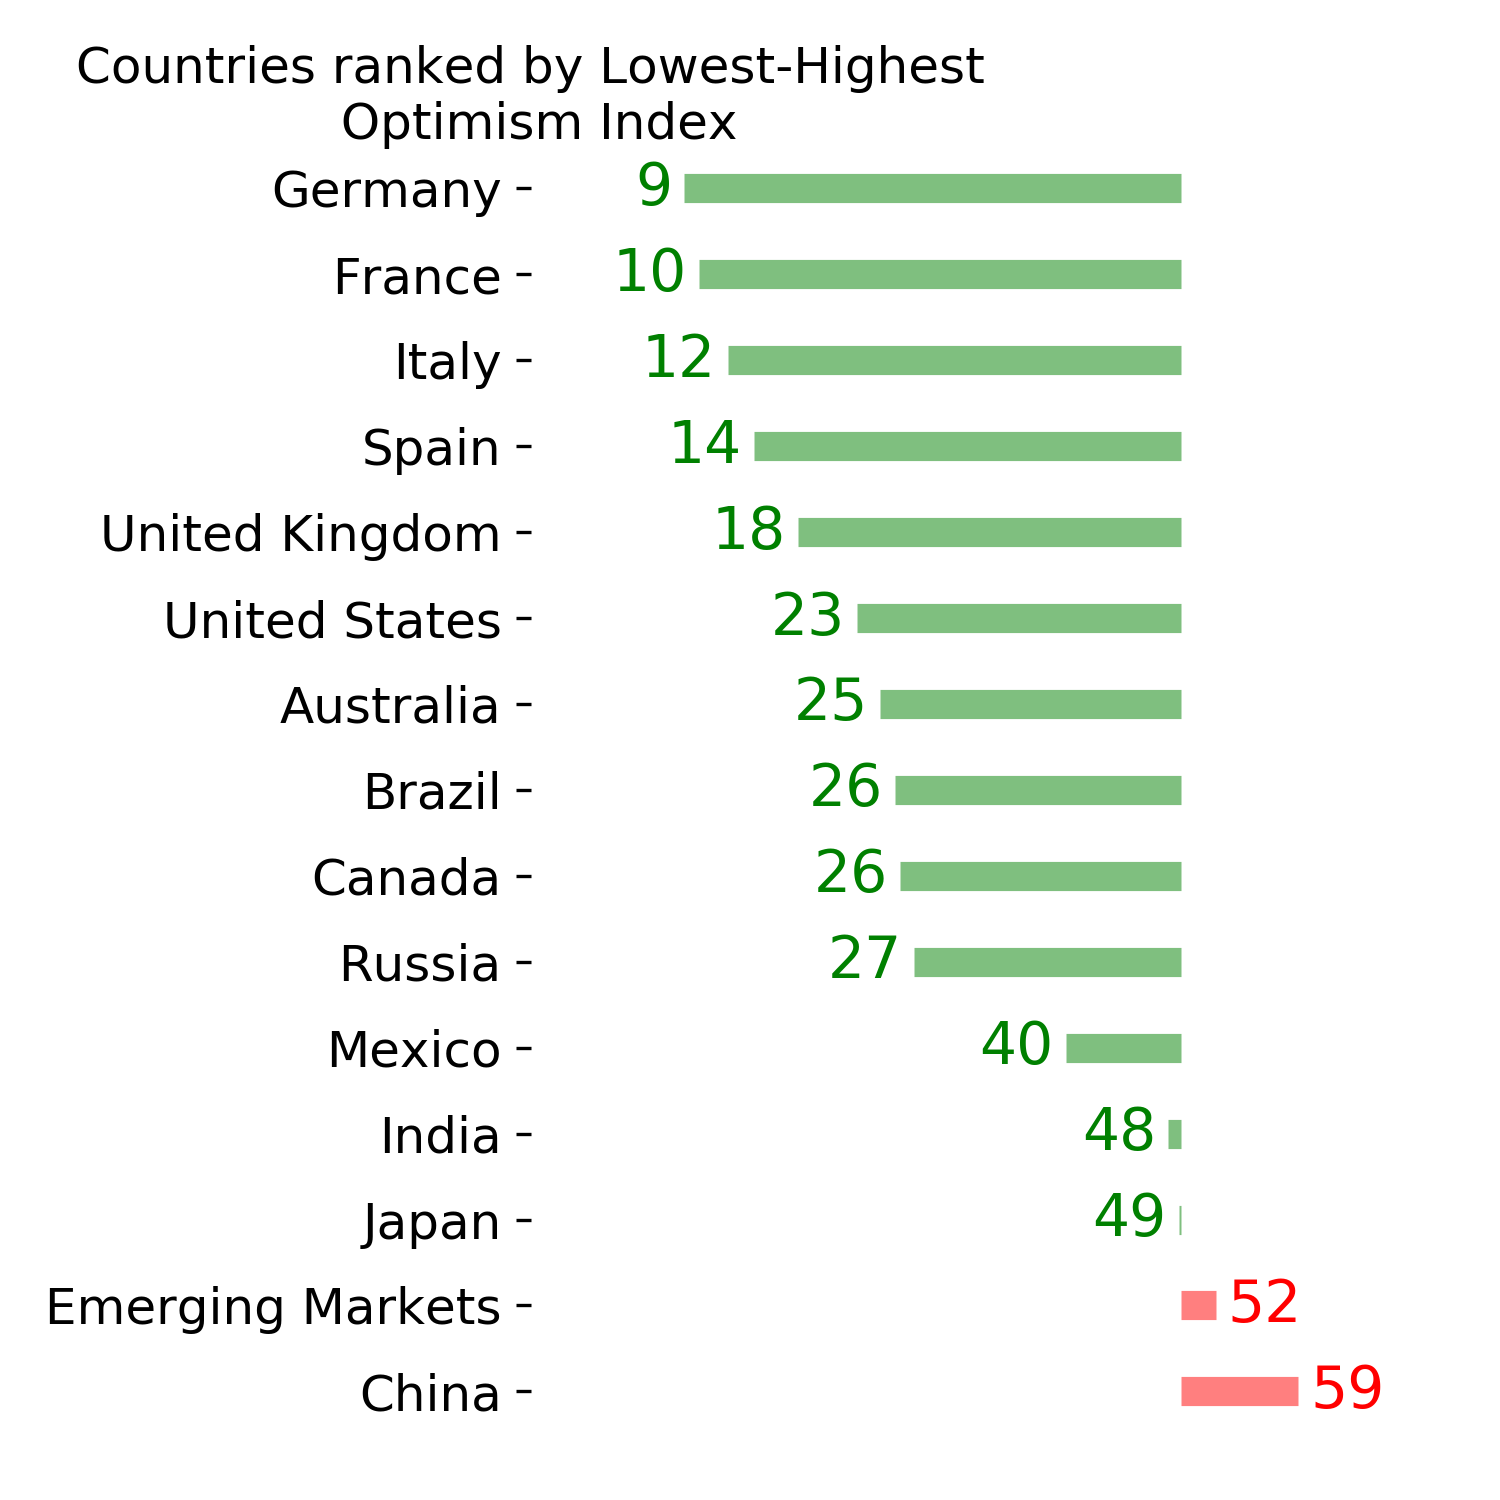
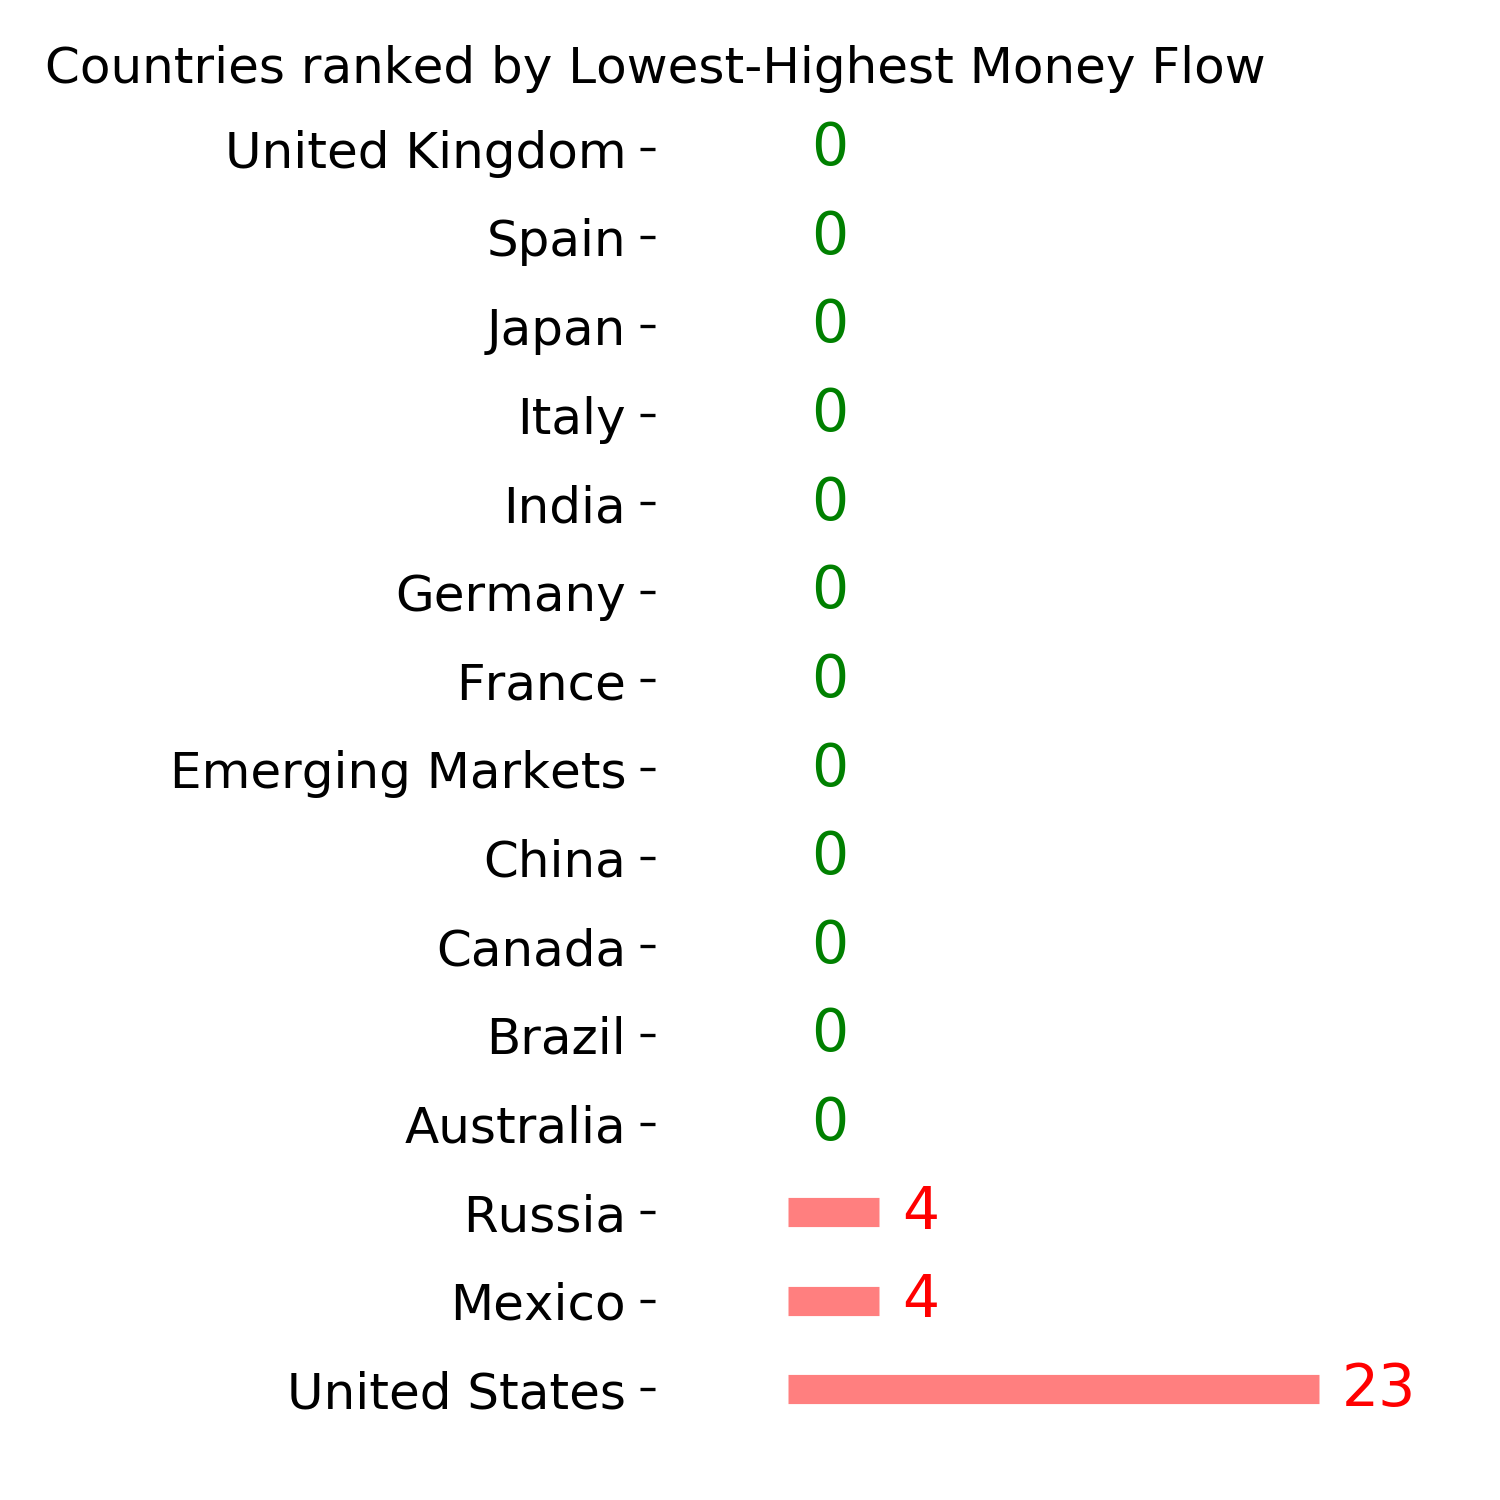
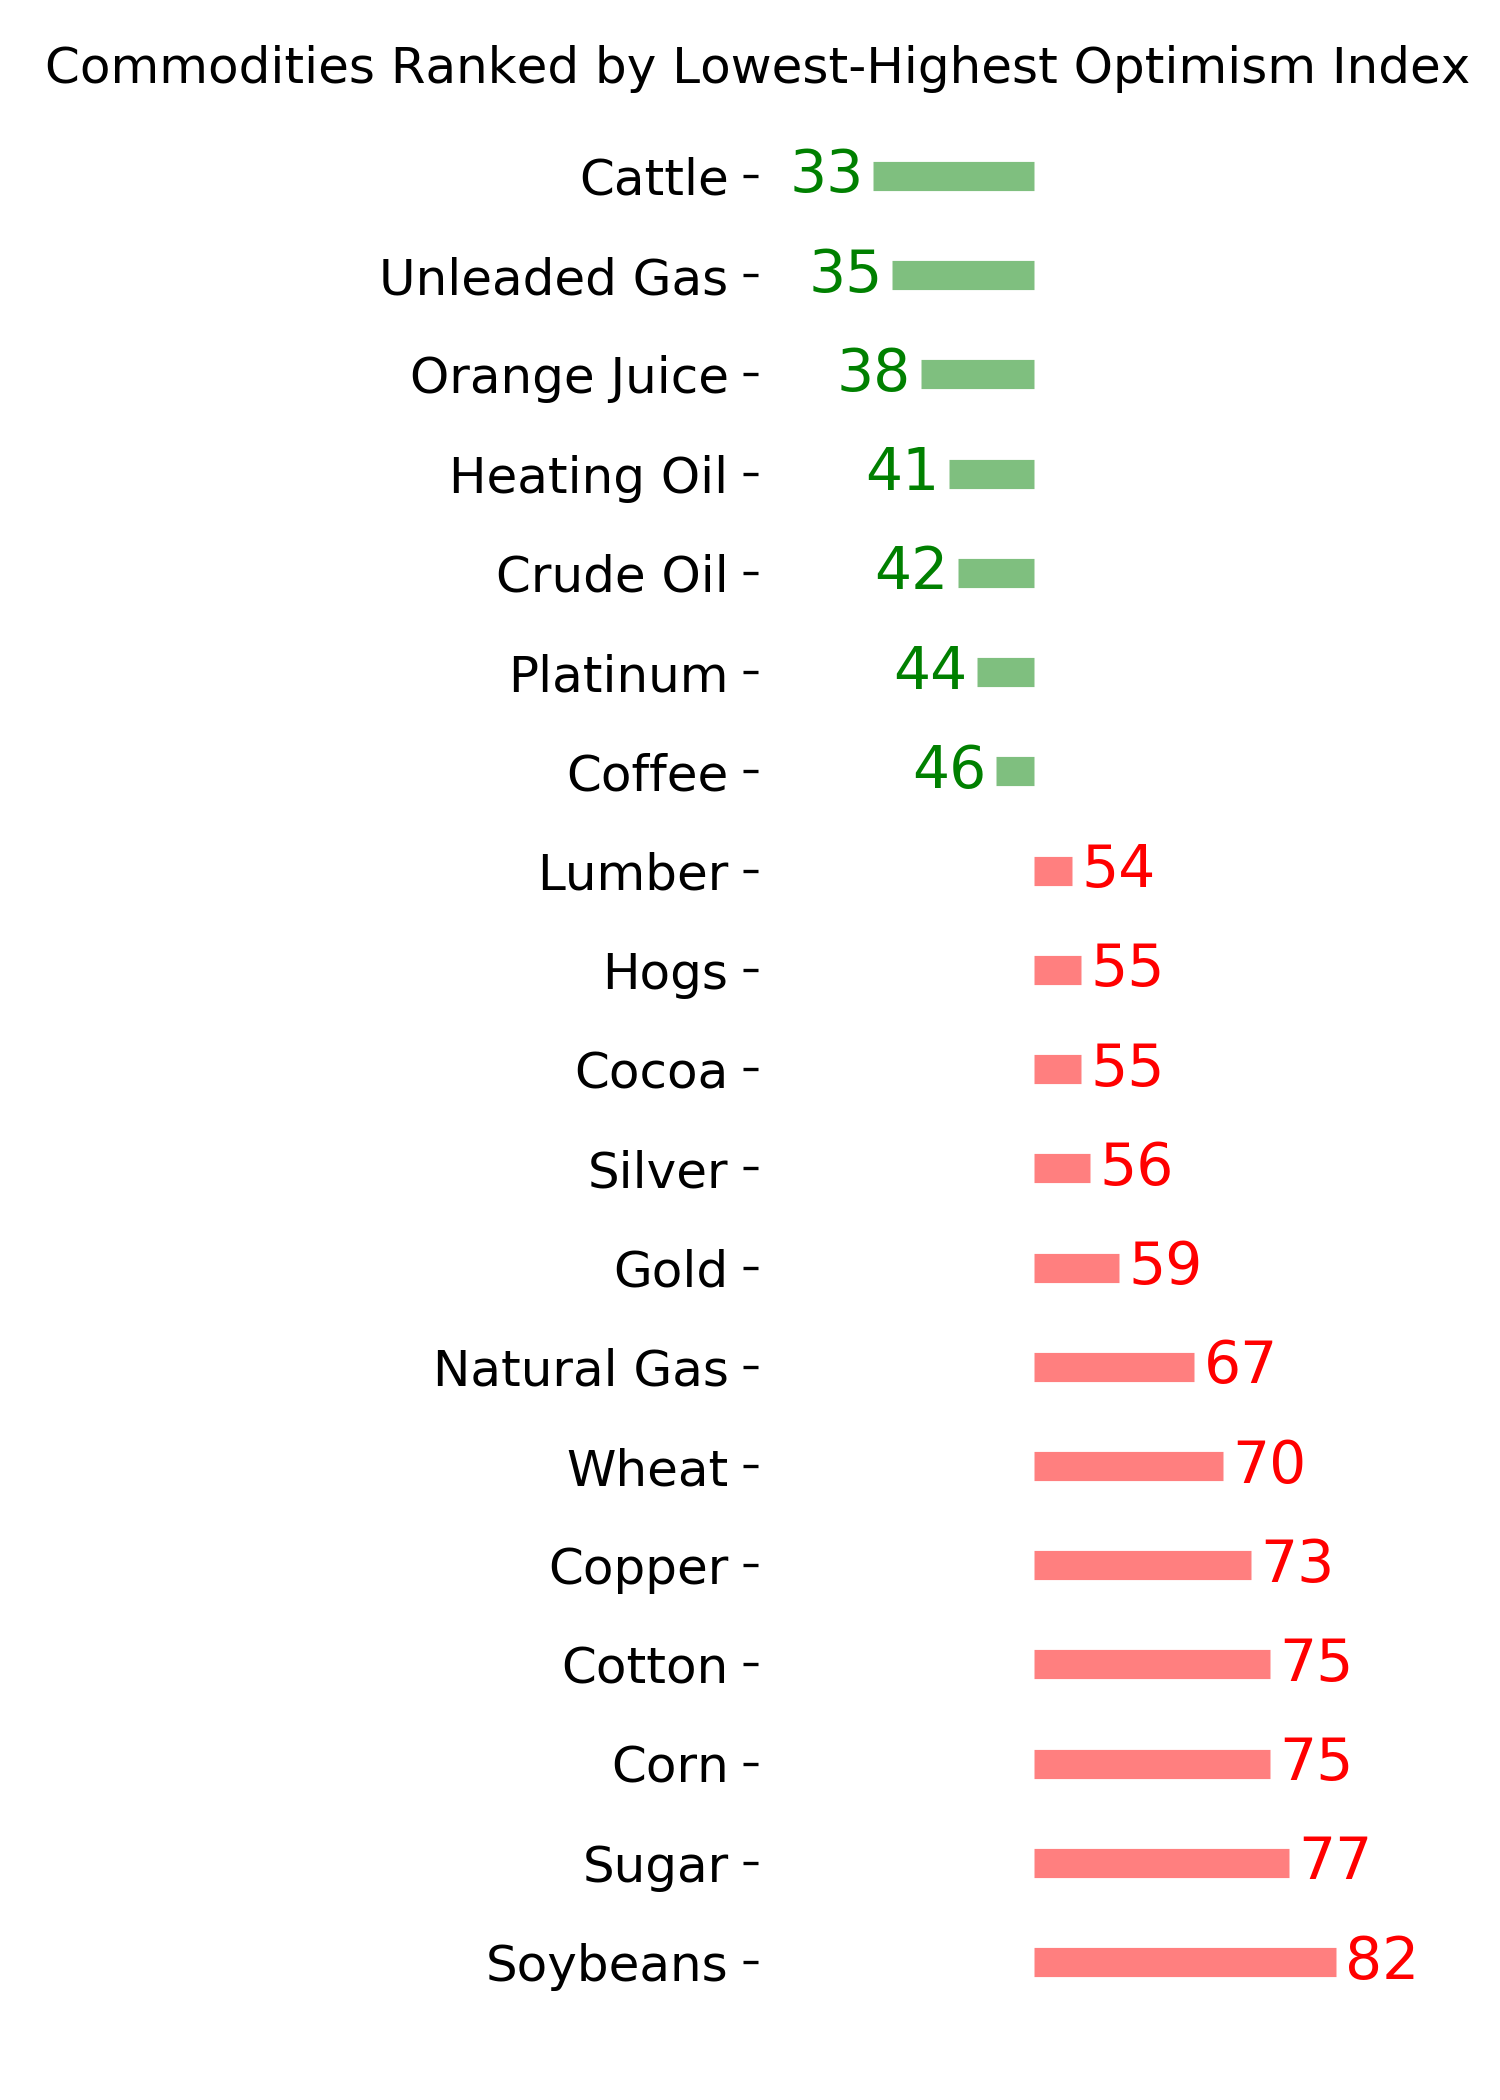
Ranks
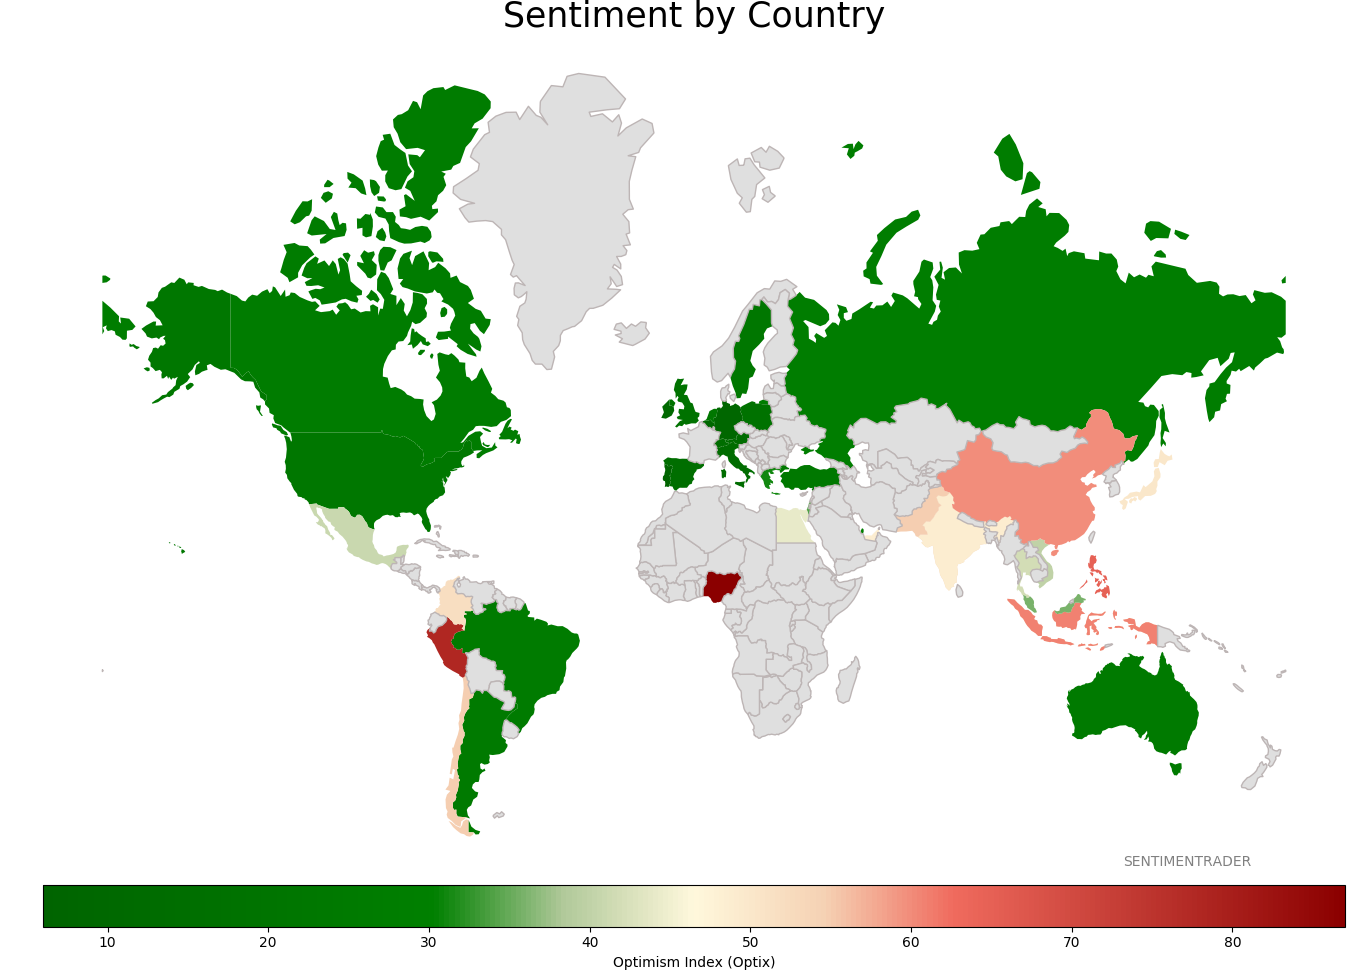
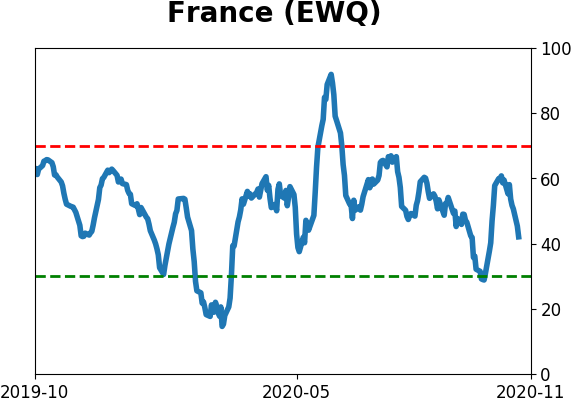
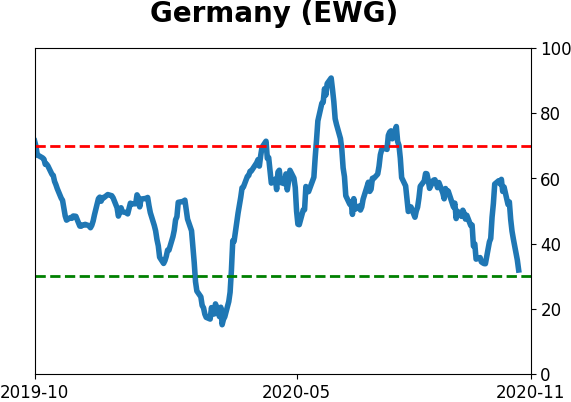
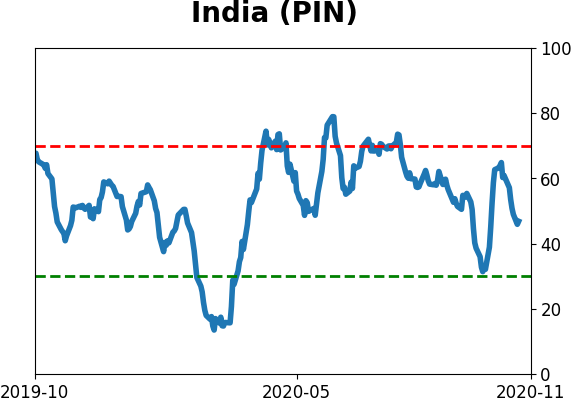
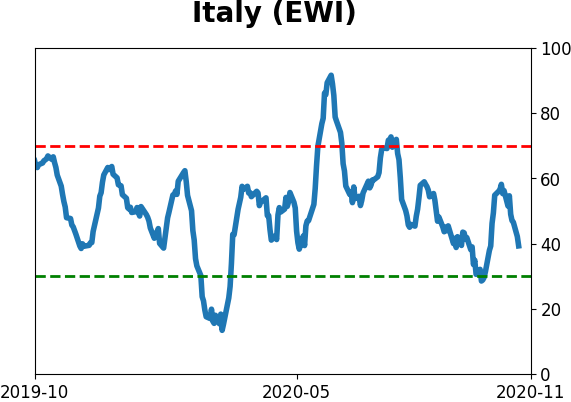
Sentiment Around The World
Optimism Index Thumbnails
|
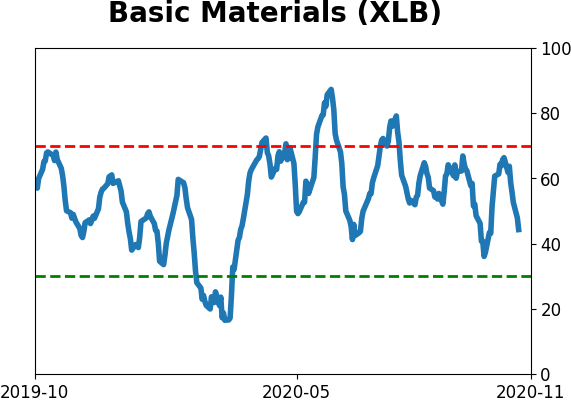
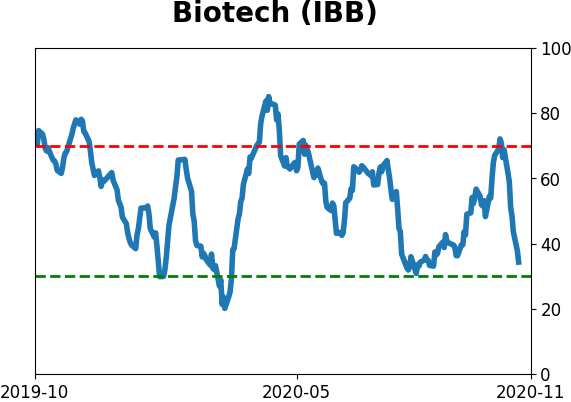
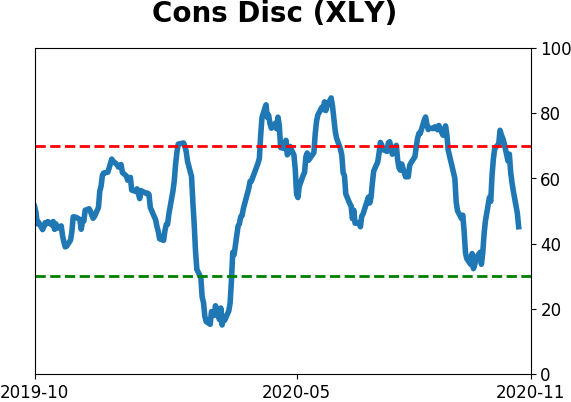
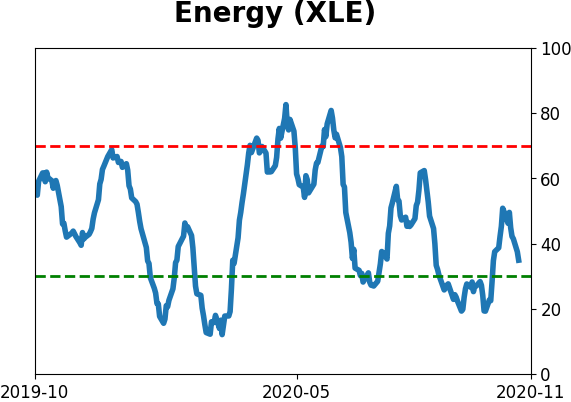
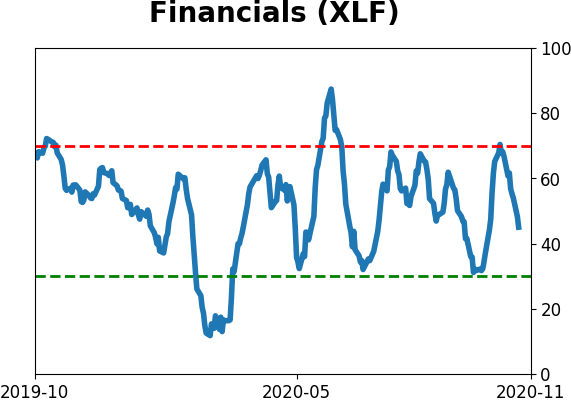
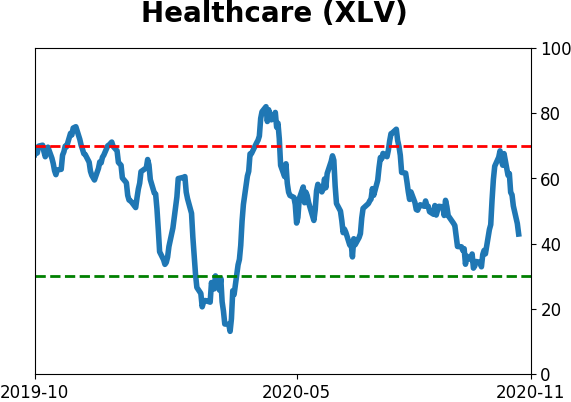
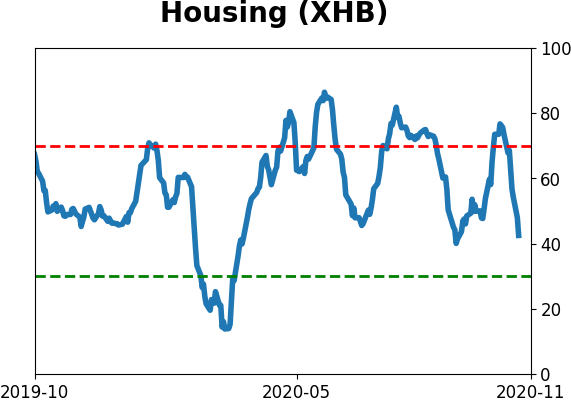
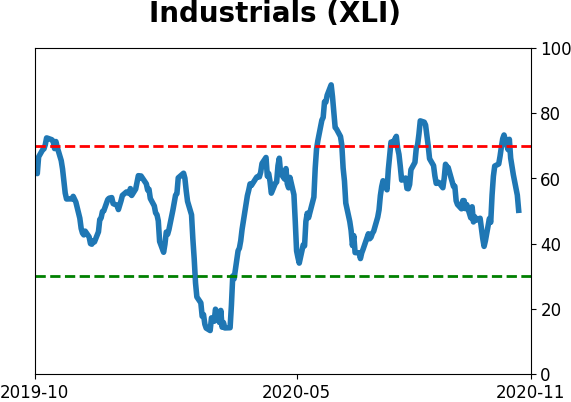
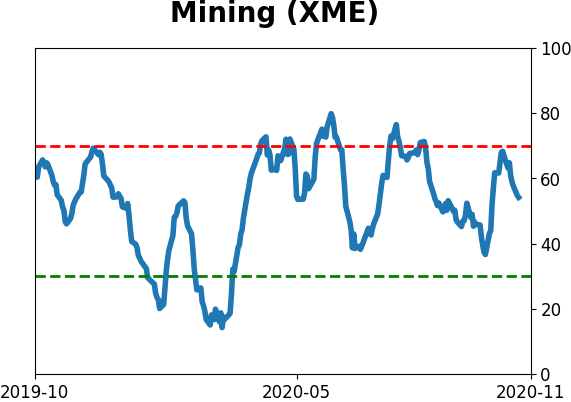
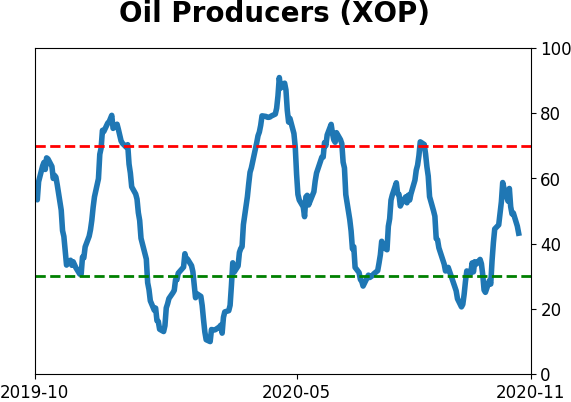
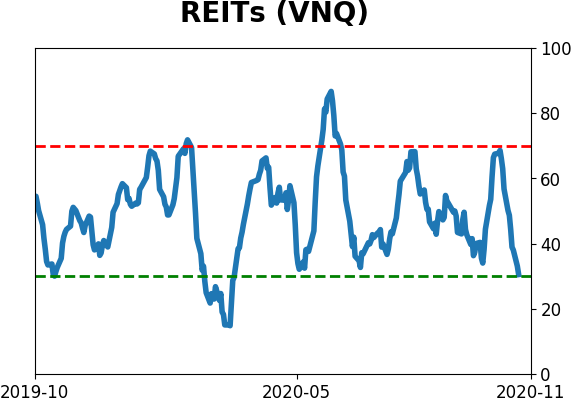
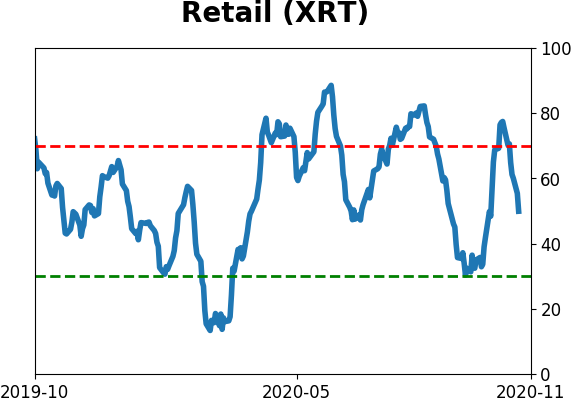
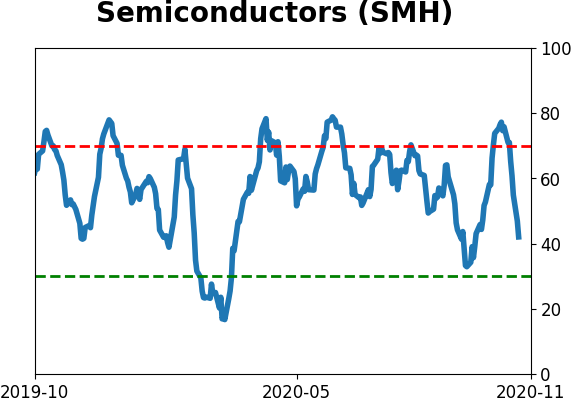
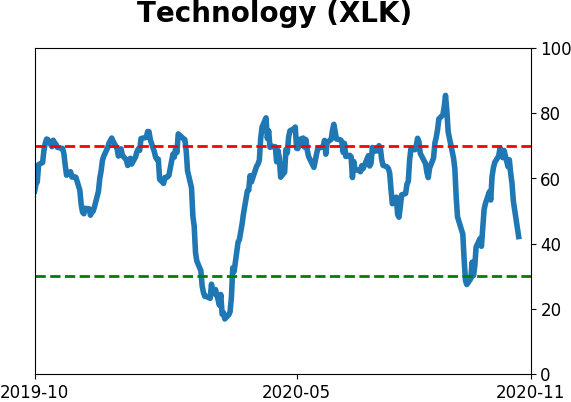
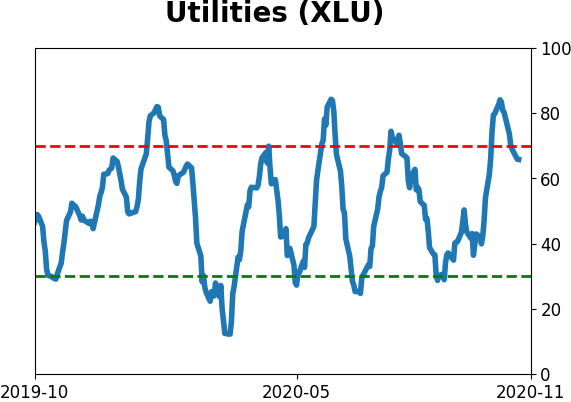
Sector ETF's - 10-Day Moving Average
|
|
|
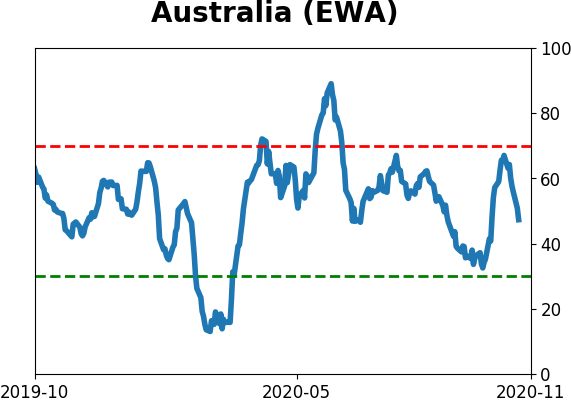
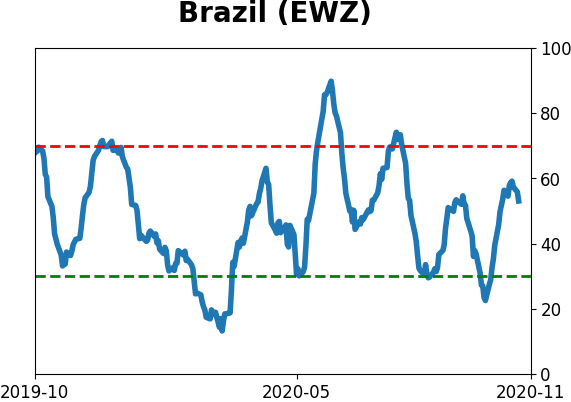
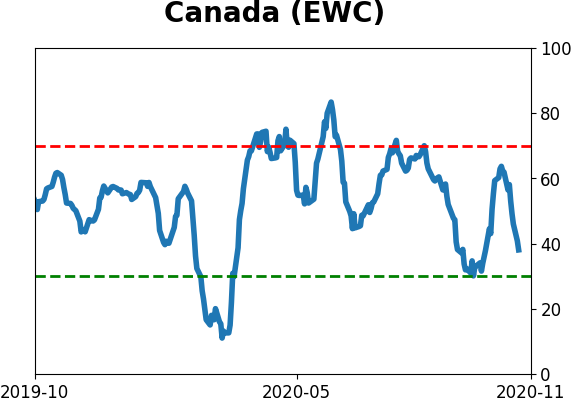
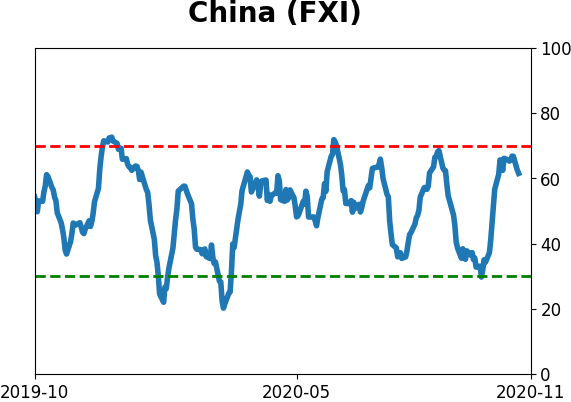
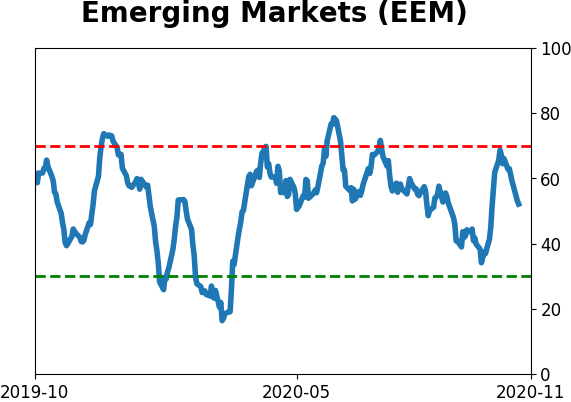
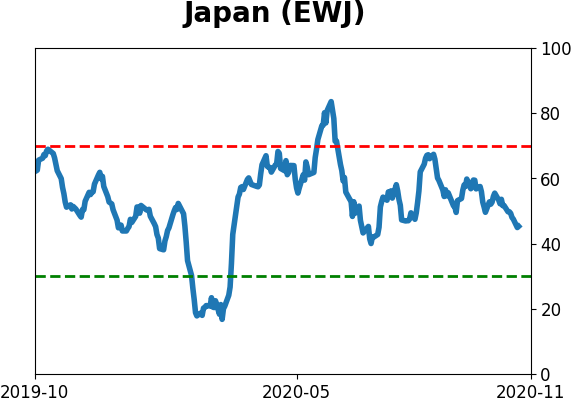
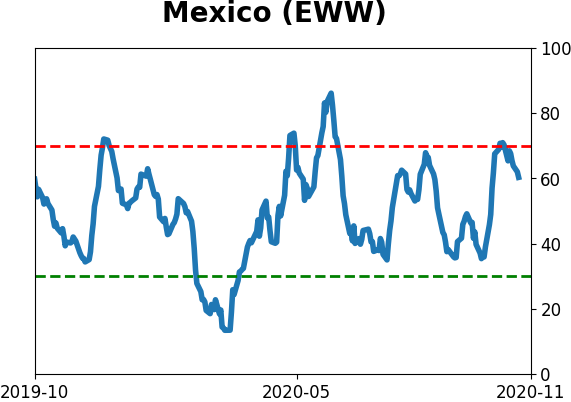
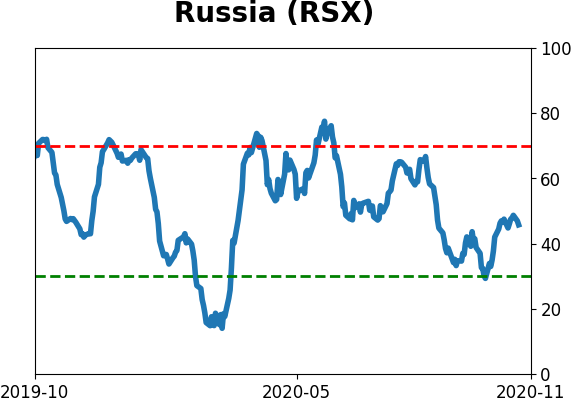
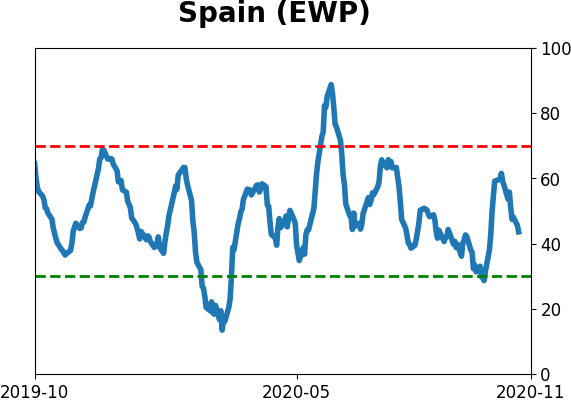
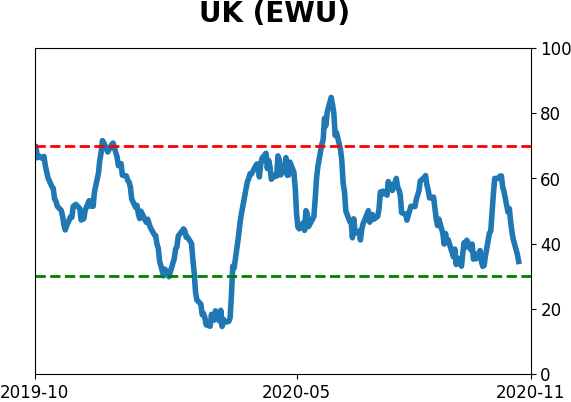
Country ETF's - 10-Day Moving Average
|
|
|
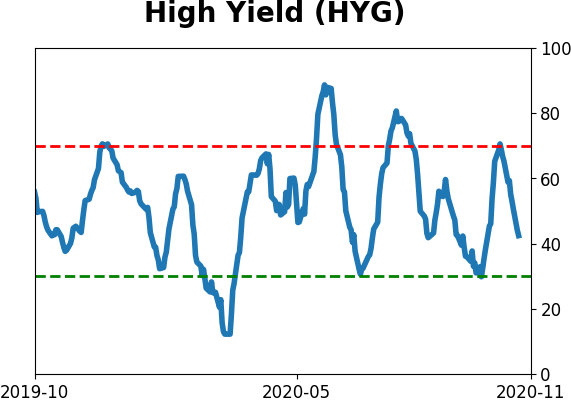
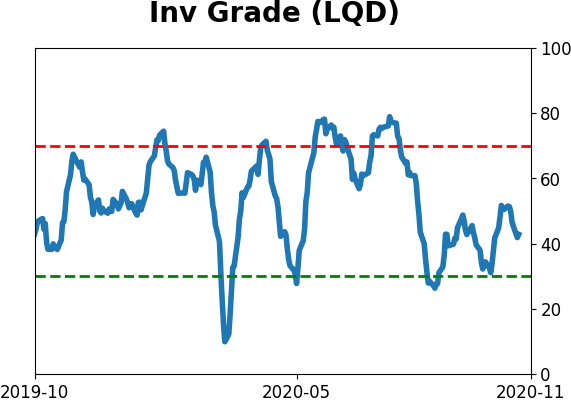
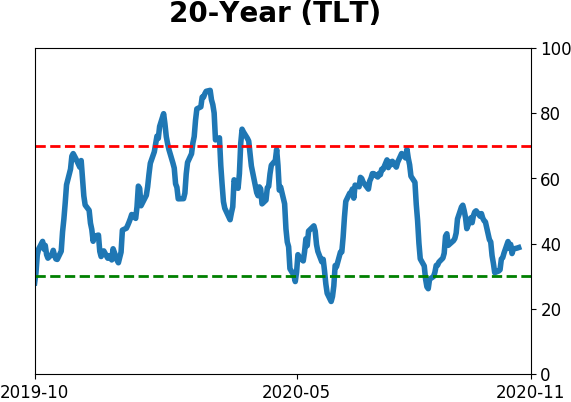
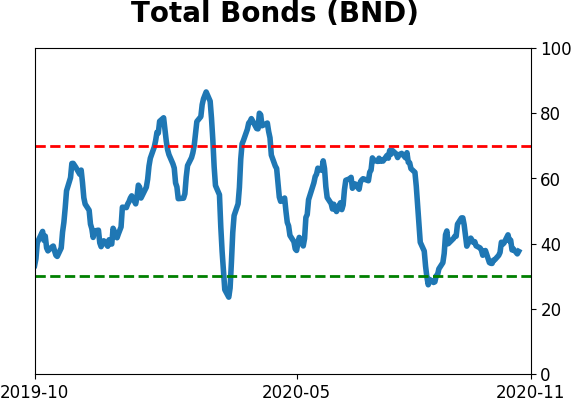
Bond ETF's - 10-Day Moving Average
|
|
|
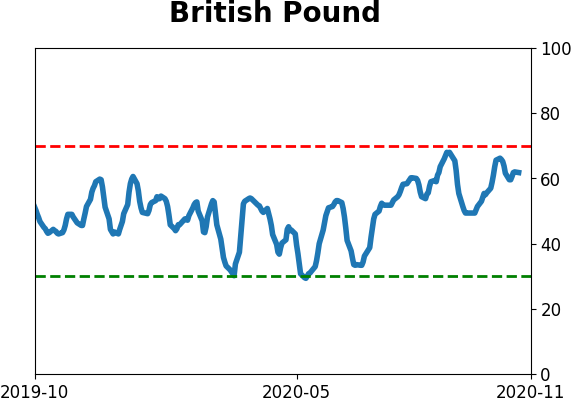
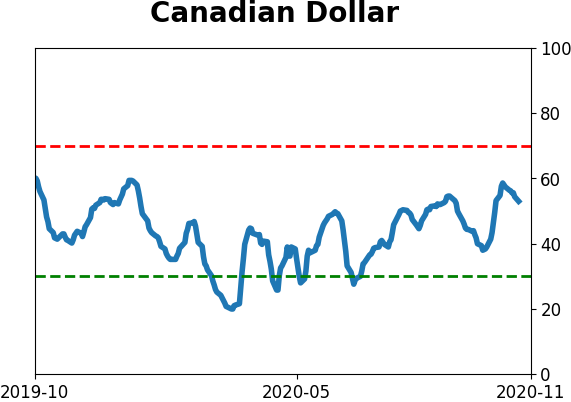
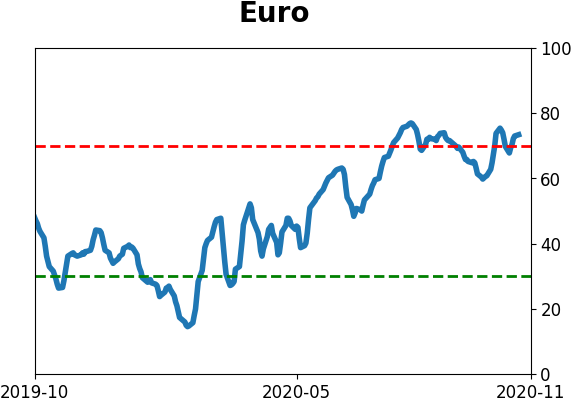
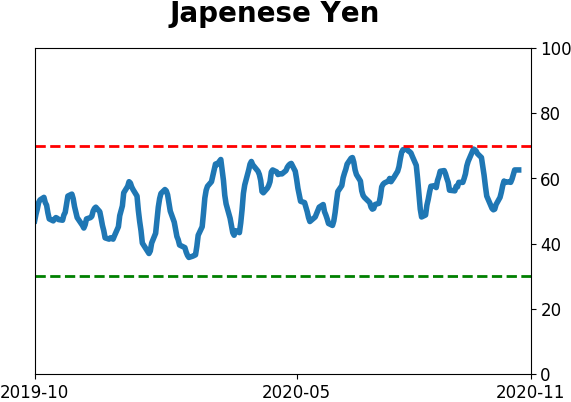
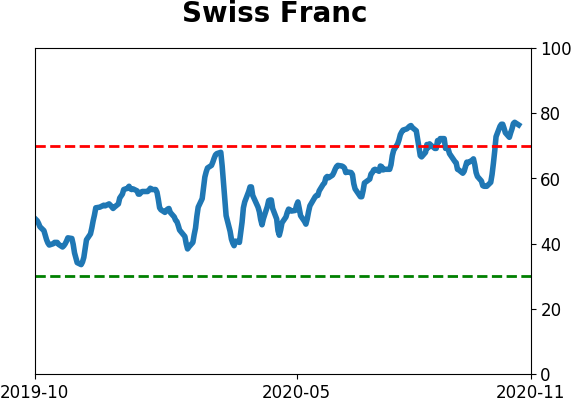
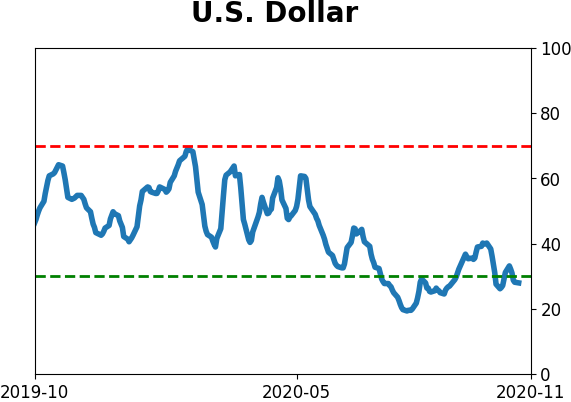
Currency ETF's - 5-Day Moving Average
|
|
|
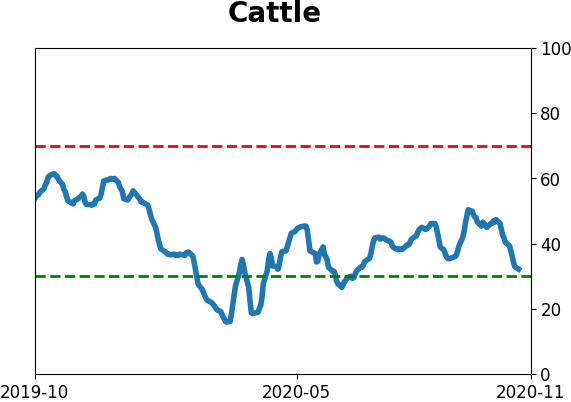
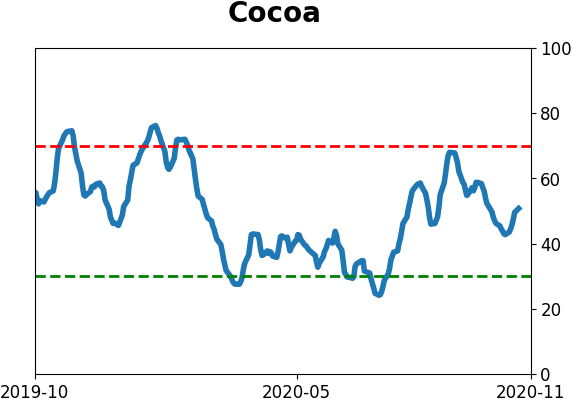
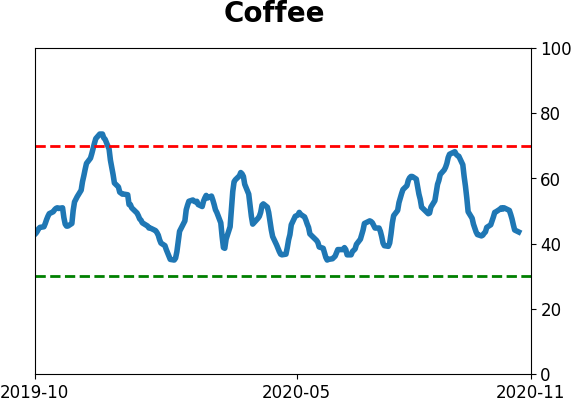
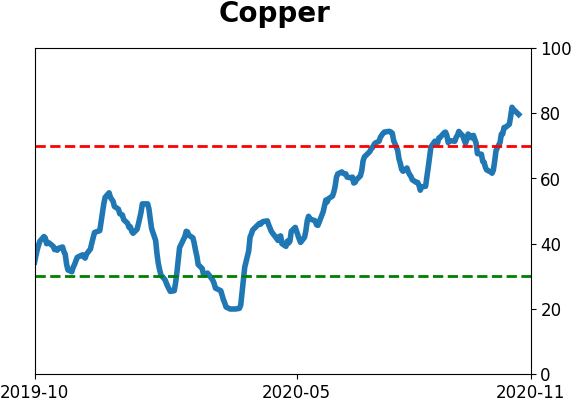
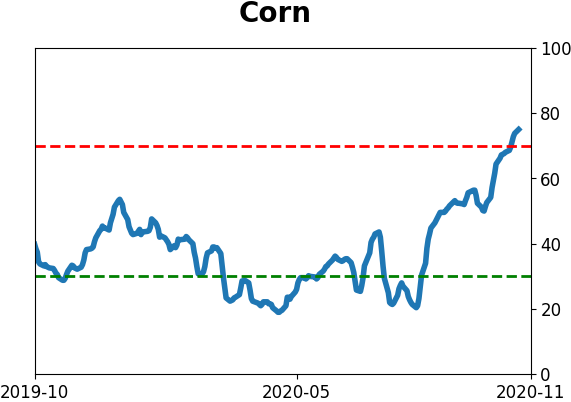
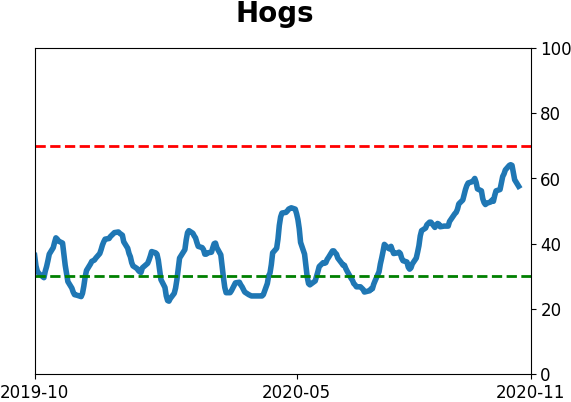
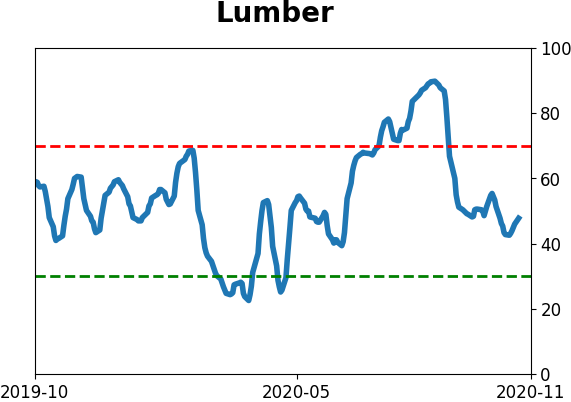
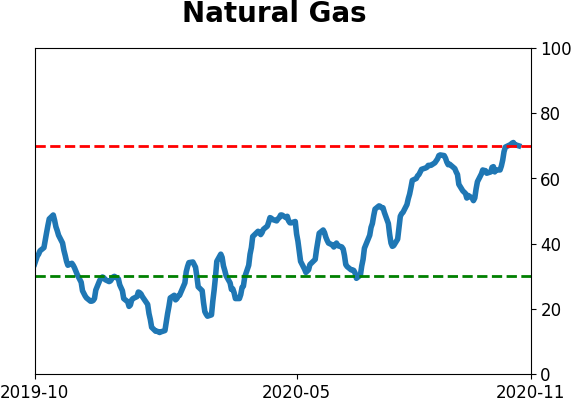
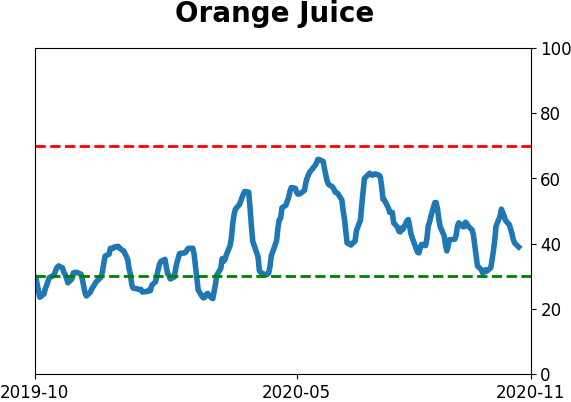
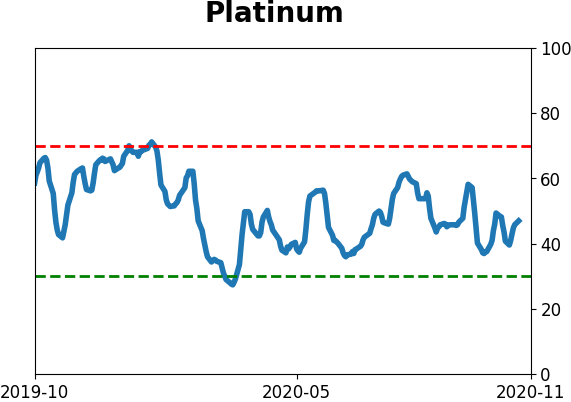
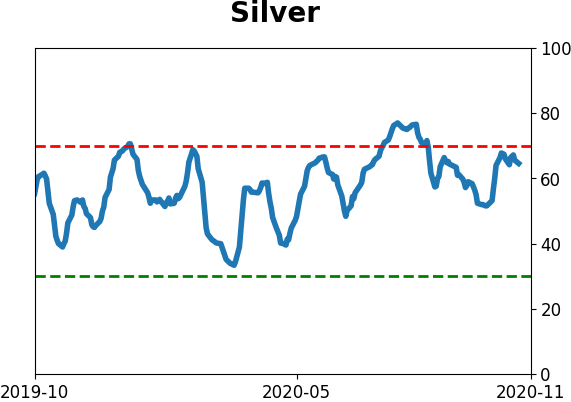
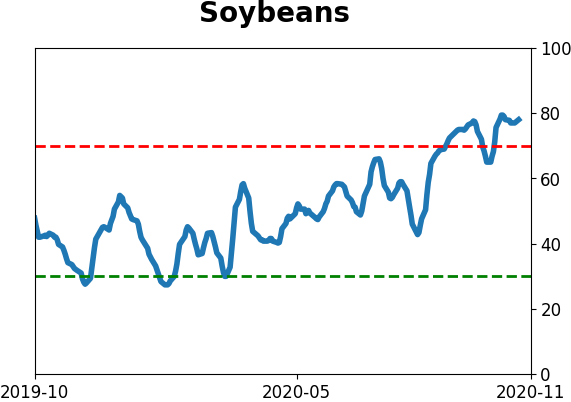
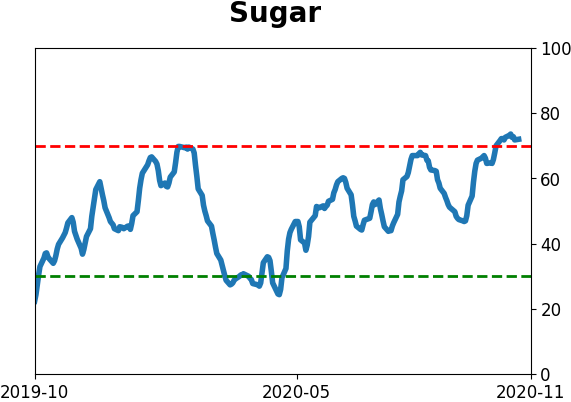
Commodity ETF's - 5-Day Moving Average
|
|