Headlines
|
|
Foreign investors keep plowing money into U.S. stocks:
Over the past year, foreign investors have shoveled nearly $200 billion into U.S. stocks, challenging a 40-year high. As a percentage of total market capitalization, though, it's only modestly extreme and is not enough to indicate excessive optimism and lower forward returns.
Options traders pull back :
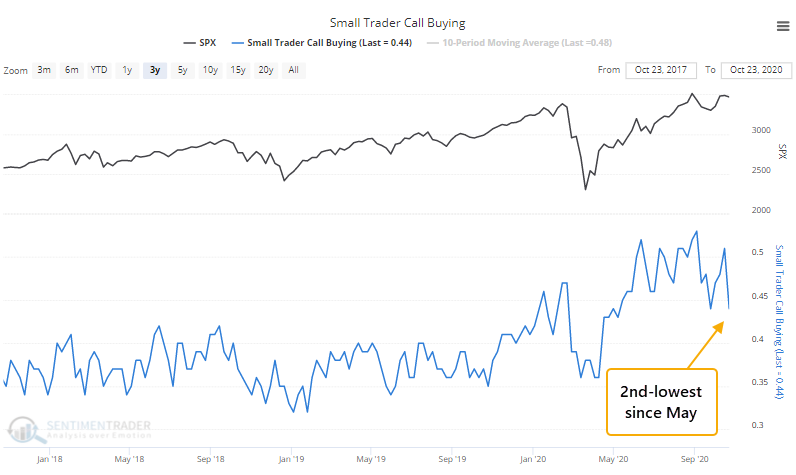
Last week, the smallest of options traders pulled back on their speculative activity. Call buying was less prevalent, but over the past 10 weeks, it still rivals the most aggressive behavior in 20 years.
Panic selling: Stocks had enjoyed nearly 90 days without suffering enough panic that investors were selling everything at the same time. The Up Volume Ratio fell below 10% on Monday for the 1st time since June 24. When the S&P 500 had hit a multi-year high then suffered a 90% down day (more than 90% of volume flowing into securities declining in price on the day) within 10-50 days of the peak, forward returns were good. Over the next 6 months, there was only 1 loss of any consequence.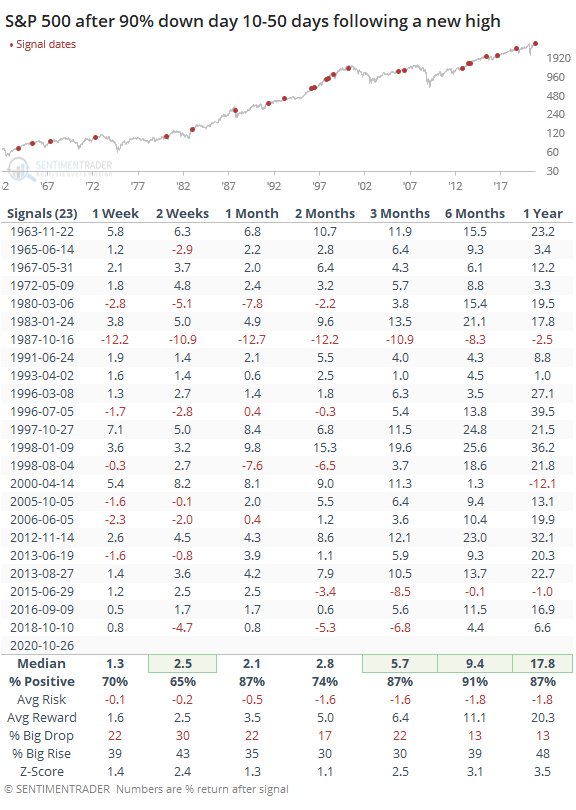
Bottom Line:
- A positive environment favors becoming aggressive on signs of excessive pessimism.
|
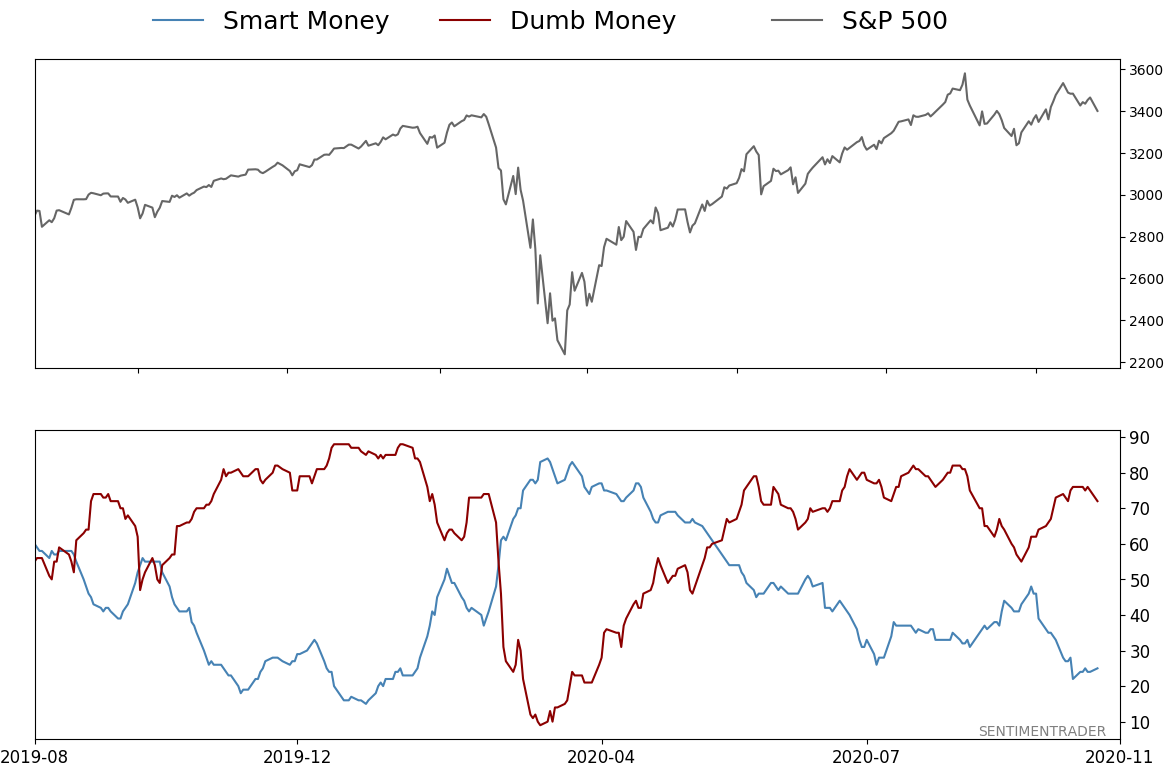
Smart / Dumb Money Confidence
|
Smart Money Confidence: 25%
Dumb Money Confidence: 72%
|
|
Risk Levels
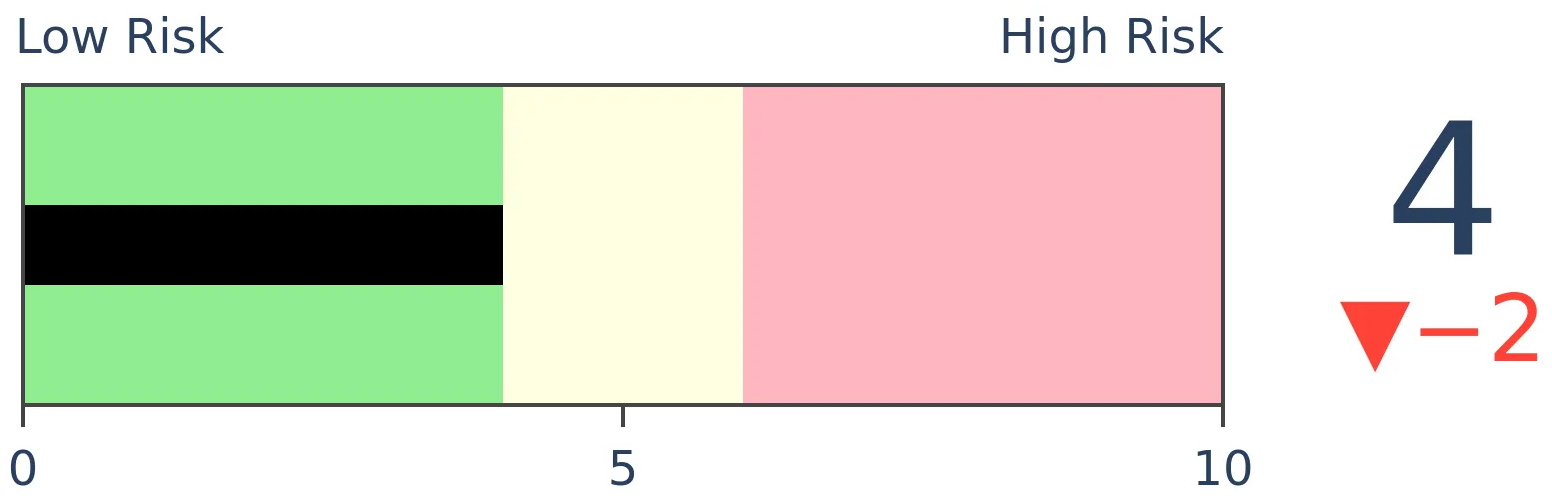
Stocks Short-Term
|
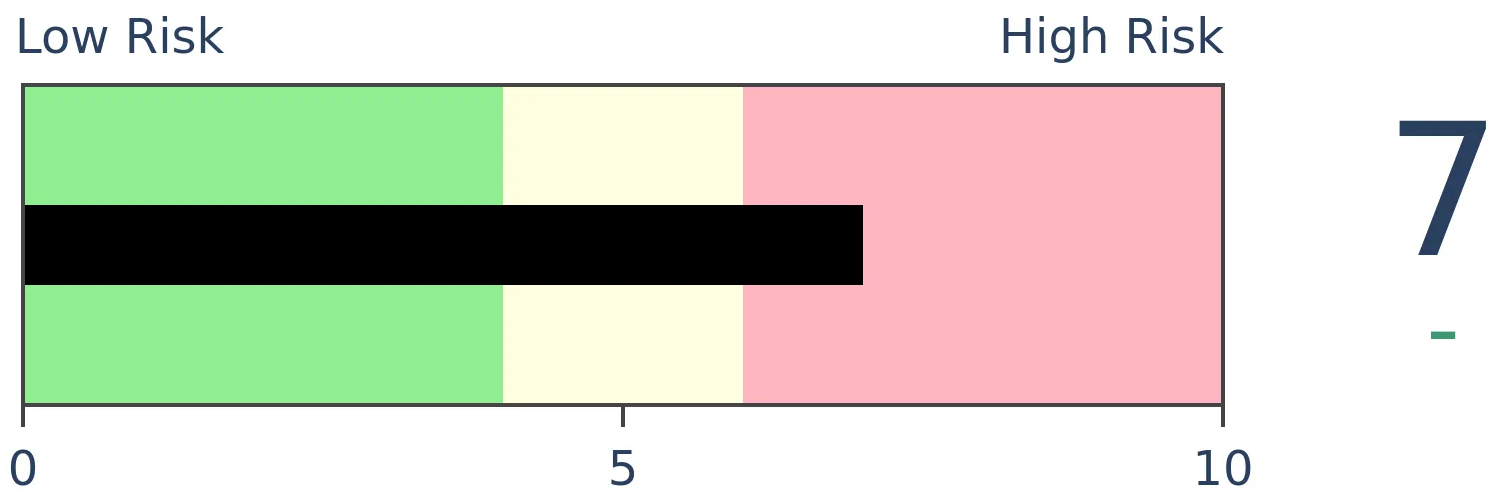
Stocks Medium-Term
|
|
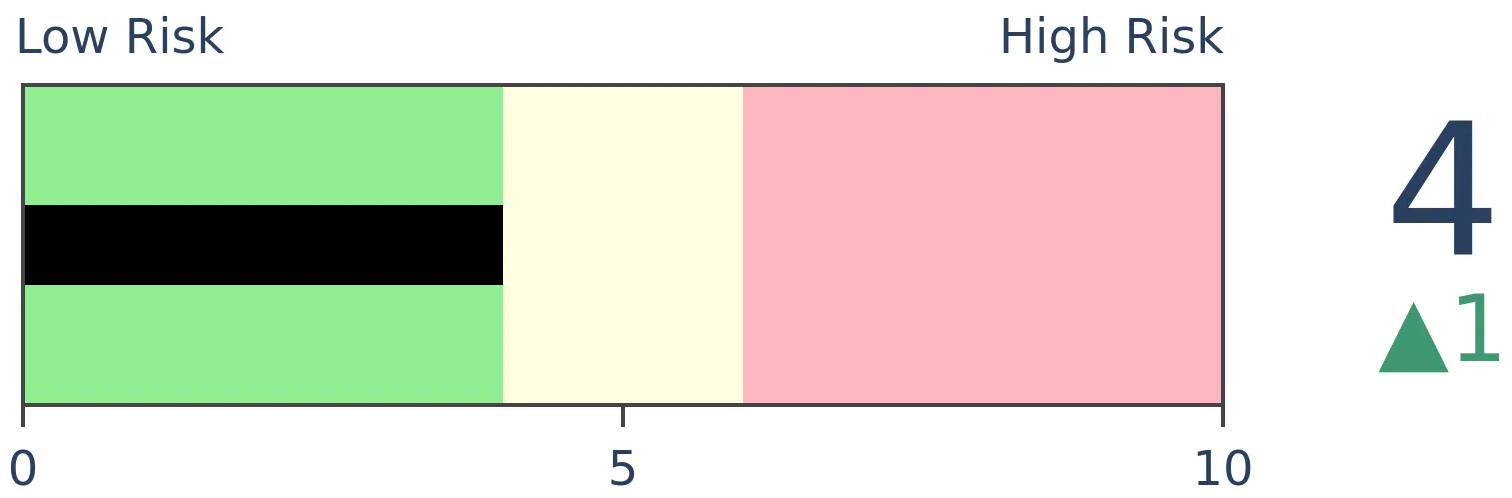
Bonds
|
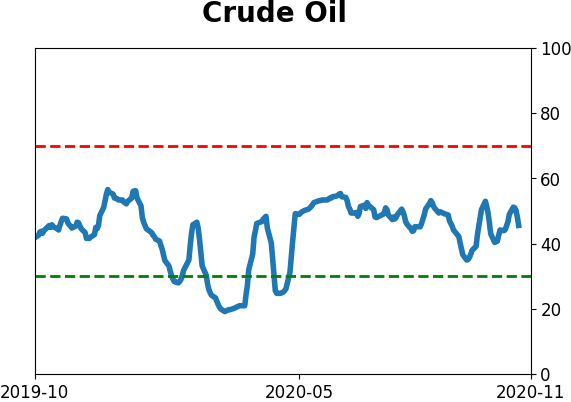
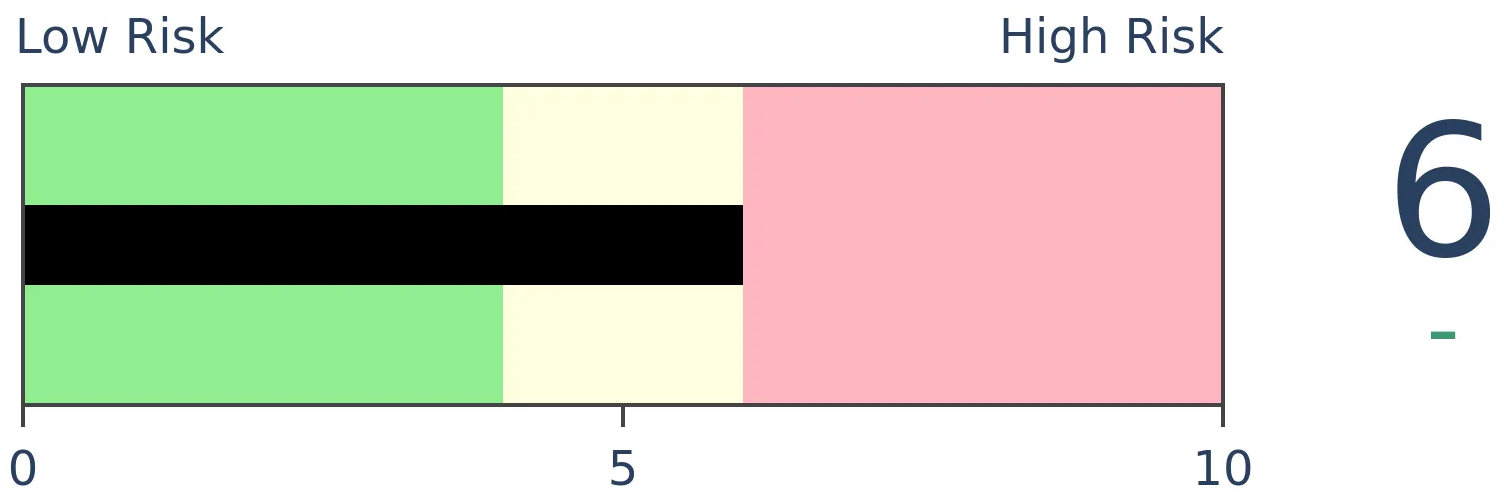
Crude Oil
|
|
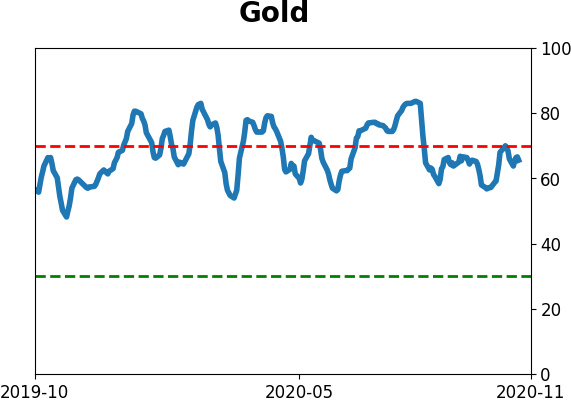
Gold
|
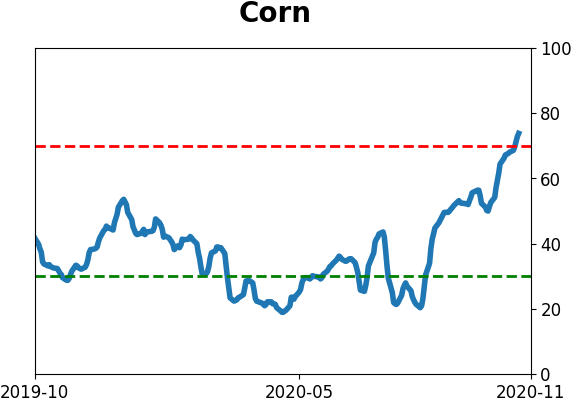
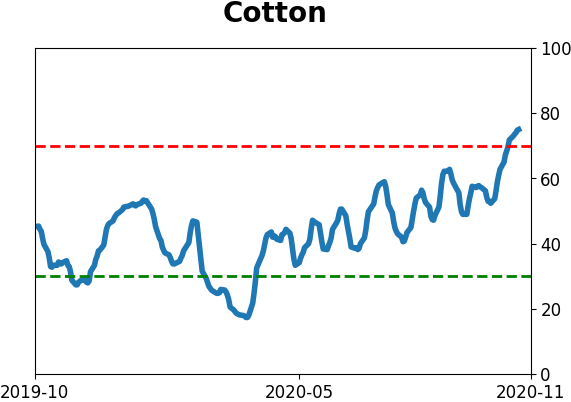
Agriculture
|
|
Research
BOTTOM LINE
Over the past year, foreign investors have shoveled nearly $200 billion into U.S. stocks, challenging a 40-year high. As a percentage of total market capitalization, though, it's only modestly extreme and is not enough to indicate excessive optimism and lower forward returns.
FORECAST / TIMEFRAME
None
|
Almost exactly 5 years ago, we saw what appeared to be outright hatred of U.S. stocks by foreign investors. During the spring and summer of 2015, foreign investors were consistent, and heavy, sellers of U.S. equities.
Times have changed.
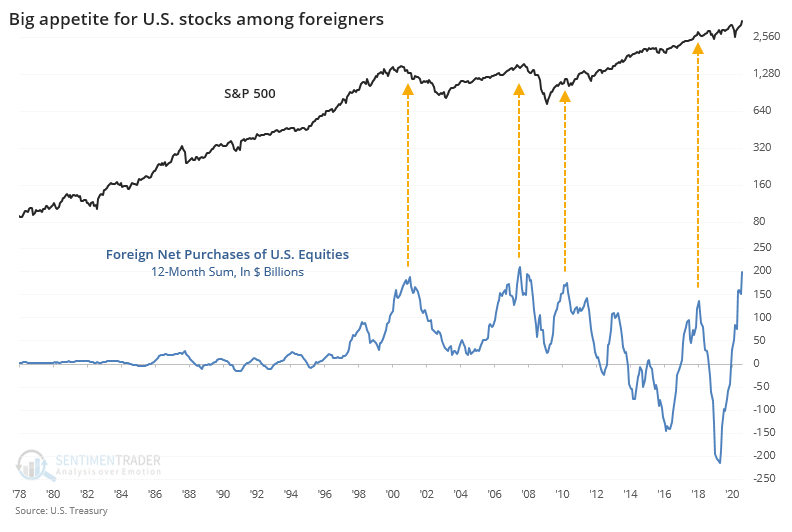
In July, there was a huge inflow from foreign investors. That was the peak month for flows, with nearly $80 billion coming in. While that has come down, flows have still been positive. It's been consistent enough that the 12-month sum of net flows is now just under $200 billion, challenging the highest in more than 40 years. The only months that exceeded the current total are June and July 2007.
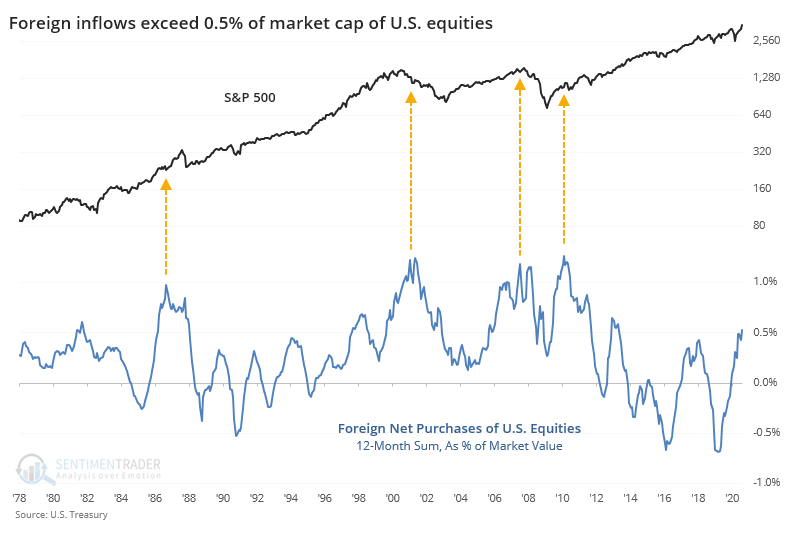
The value of the U.S. equity market has grown substantially since then, however, so when expressed as a percentage of market capitalization, it's not nearly as extreme. Back then, the 12-month inflow accounted for more than 1% of U.S. market cap, versus "only" 0.5% now.
In the past, when there has been a big foreign inflow to domestic stocks, the S&P 500 tended to fare well in the months ahead, even though several of them preceded trouble at some point.
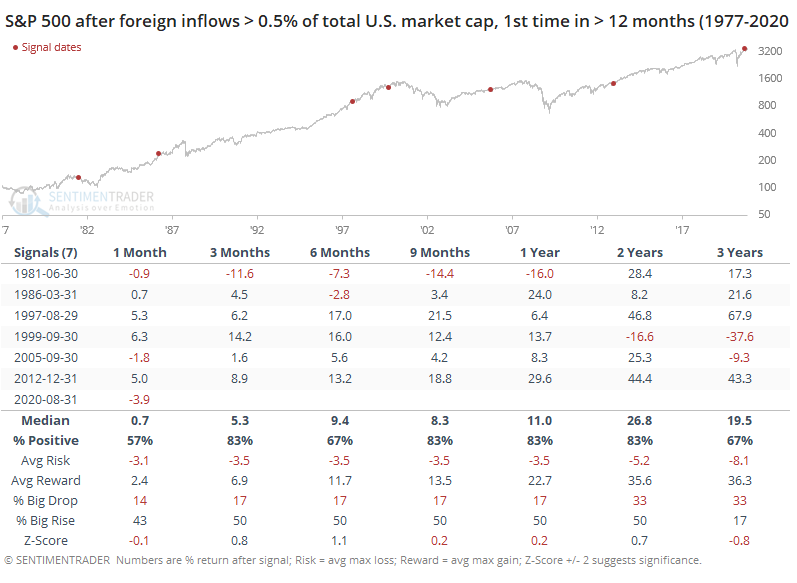
While this data always looks troubling on a chart, when we look at the numbers, it hasn't been a reliable reason to become cautious about future returns. By the time foreign inflows reached 0.5% of market cap over the trailing 12 months, the S&P 500's risk/reward over the next 1-2 years was heavily positive, with a greater chance for an abnormally large gain than loss up to 2 years later. While its average return wasn't anything special, it showed only a single loss across most time frames.
If and when this inflow reaches 1% or so of the value of all U.S. stocks, then it might be time to become more concerned.
BOTTOM LINE
Last week, the smallest of options traders pulled back on their speculative activity. Call buying was less prevalent, but over the past 10 weeks, it still rivals the most aggressive behavior in 20 years.
FORECAST / TIMEFRAME
None
|
We've been checking regularly on the behavior of options traders over the past couple of months because their activity had been speculative to a record degree.
Last week, they became a bit less aggressive. The smallest of traders, those buying or selling 10 contracts or fewer at a time, spent 44% of their volume buying call options to open. That's down from over 50% the prior week and is the 2nd-lowest percentage since May.
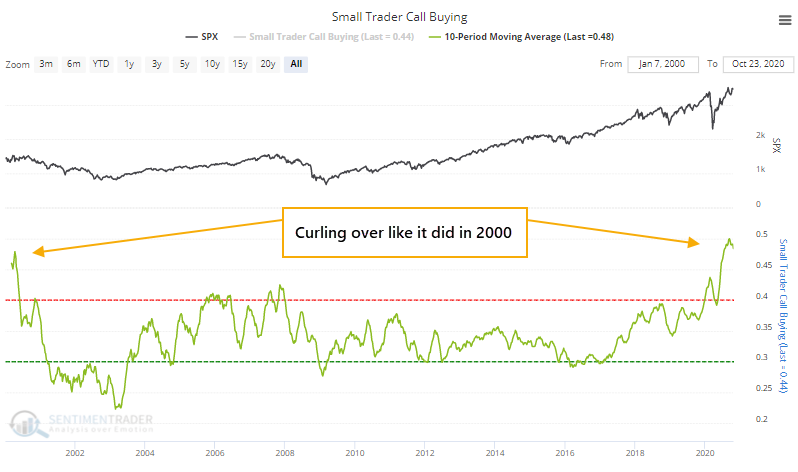
Because they've been so aggressive for so long, the 10-week average hit a record high and is now curling over.
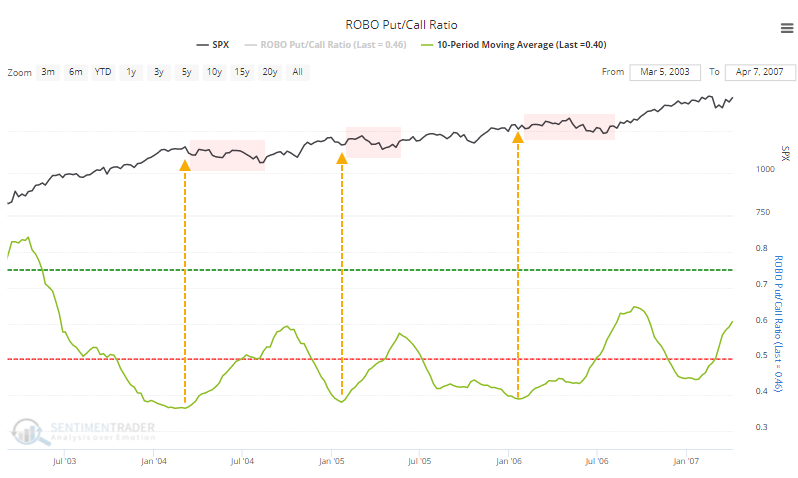
They hadn't been buying many protective puts as hedges, either, so the ROBO Put/Call Ratio neared its lowest level in 20 years and is also curling on a 10-week moving average basis.
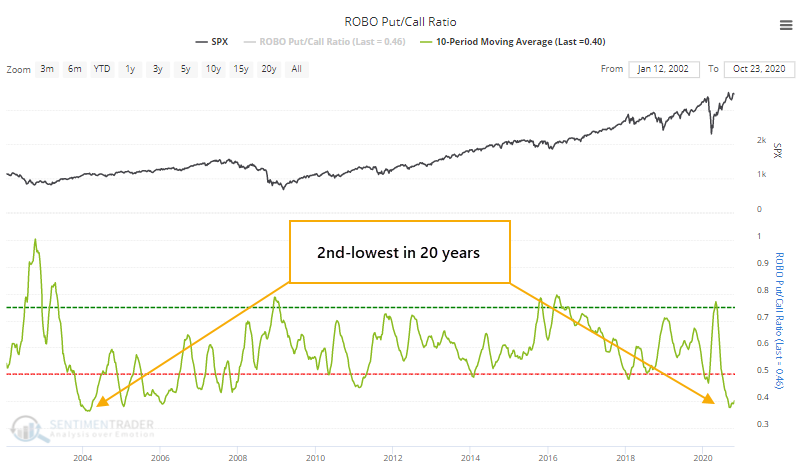
When this ratio dropped below 0.4 and curled higher between 2004-06, stocks went into a holding pattern.
Because they'd been paying so much for call option premiums, and not much for puts, the Put/Call Premium also dropped to a very low level and has since started to move higher. The Backtest Engine shows mixed forward returns after the other times in the past decade when this happened.
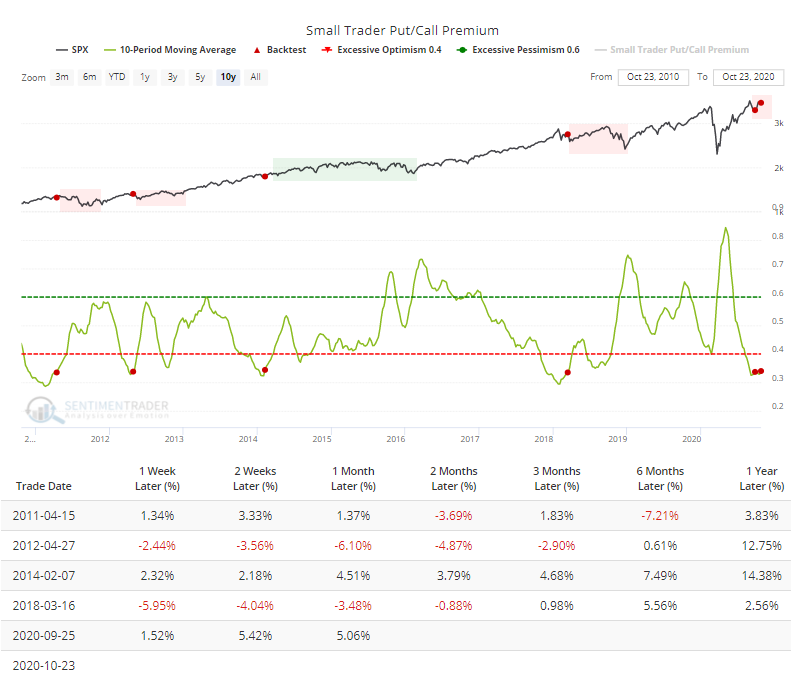
Stocks sold off in 2011, 2012, and 2018, but in 2014, the S&P 500 managed to climb for months on end. Most of those gains were eventually given back temporarily during late 2015 - early 2016, but that's little solace to those who sold too early.
The average started to curl up last month, too, and stocks have rebounded strongly since then.
Overall, there was little that happened last week to change the suggestions from the options market - trading behavior still rivals the most speculative periods in 20 years. It has eased back a bit from the height of the mania in late August, but there isn't much here that could be considered a positive for stocks.
Active Studies
| Time Frame | Bullish | Bearish | | Short-Term | 0 | 0 | | Medium-Term | 4 | 8 | | Long-Term | 48 | 2 |
|
Indicators at Extremes
Portfolio
| Position | Description | Weight % | Added / Reduced | Date | | Stocks | 15.6% RSP, 10.1% VWO, 7.5% XLE, 5.1% PSCE | 38.2 | Added 5% | 2020-10-15 | | Bonds | 10% BND, 10% SCHP, 10% ANGL | 29.7 | Reduced 0.1% | 2020-10-02 | | Commodities | GCC | 2.4 | Reduced 2.1%
| 2020-09-04 | | Precious Metals | GDX | 4.7 | Added 5% | 2020-09-09 | | Special Situations | | 0.0 | Reduced 5% | 2020-10-02 | | Cash | | 25.0 | | |
|
Updates (Changes made today are underlined)
After the September swoon wrung some of the worst of the speculation out of stocks, there are some signs that it's returning, especially in the options market. It's helped to push Dumb Money Confidence above 70%. A big difference between now and August is that in August, there was a multitude of days with exceptionally odd breadth readings. Some of the biggest stocks were masking underlying weakness. Combined with heavy speculative activity, it was a dangerous setup. Now, we've seen very strong internal strength, in the broad market, as well as tech and small-cap stocks. Prior signals almost invariably led to higher prices. That's hard to square with the idea that forward returns tend to be subdued when Confidence is high, but that's less reliable during healthy market conditions, which we're seeing now (for the most part). I added some risk with small-cap energy stocks, due to an increasing number of positive signs in both small-caps and energy. This is intended as a long-term position.
RETURN YTD: -1.1% 2019: 12.6%, 2018: 0.6%, 2017: 3.8%, 2016: 17.1%, 2015: 9.2%, 2014: 14.5%, 2013: 2.2%, 2012: 10.8%, 2011: 16.5%, 2010: 15.3%, 2009: 23.9%, 2008: 16.2%, 2007: 7.8%
|
|
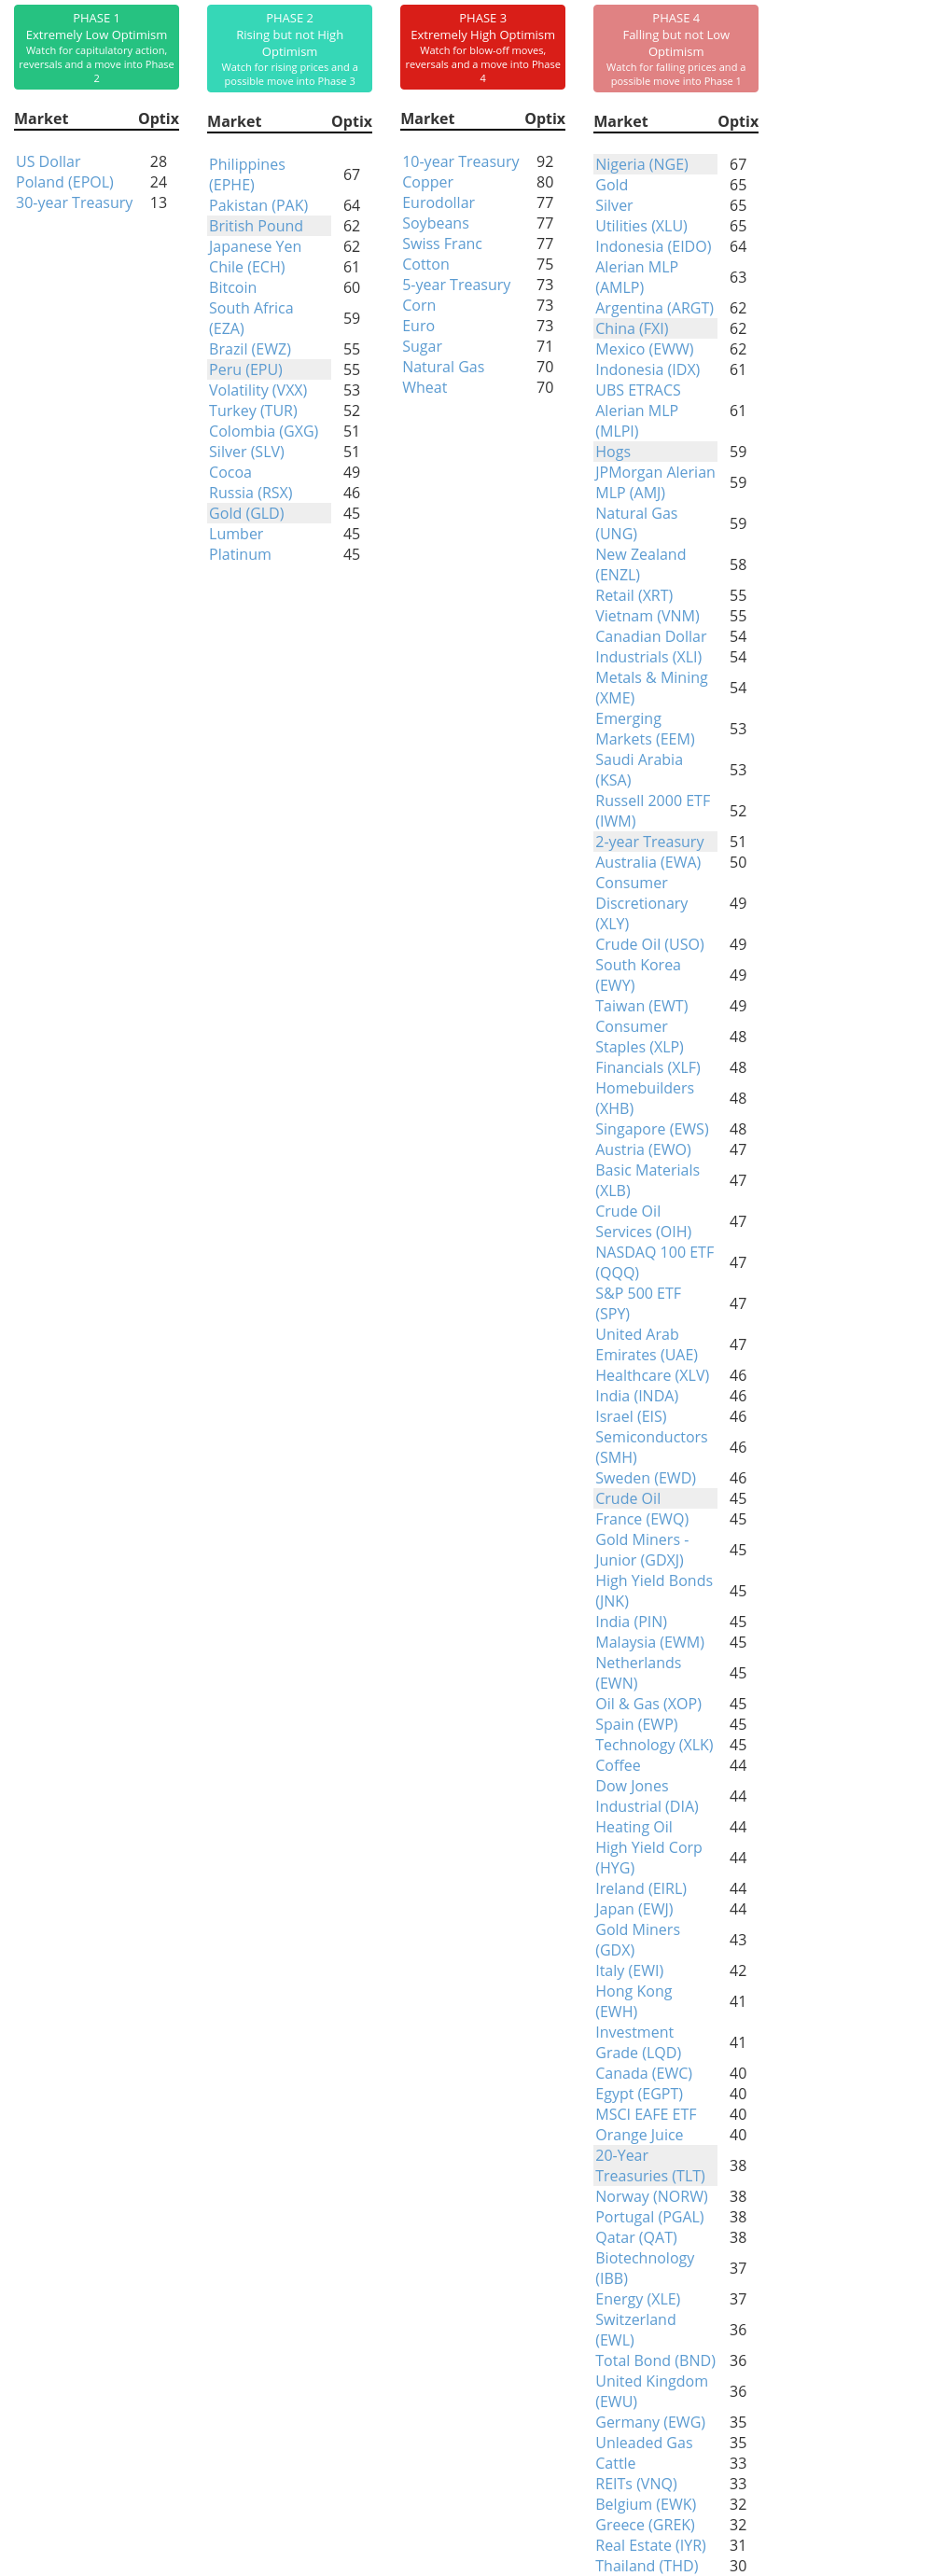
Phase Table
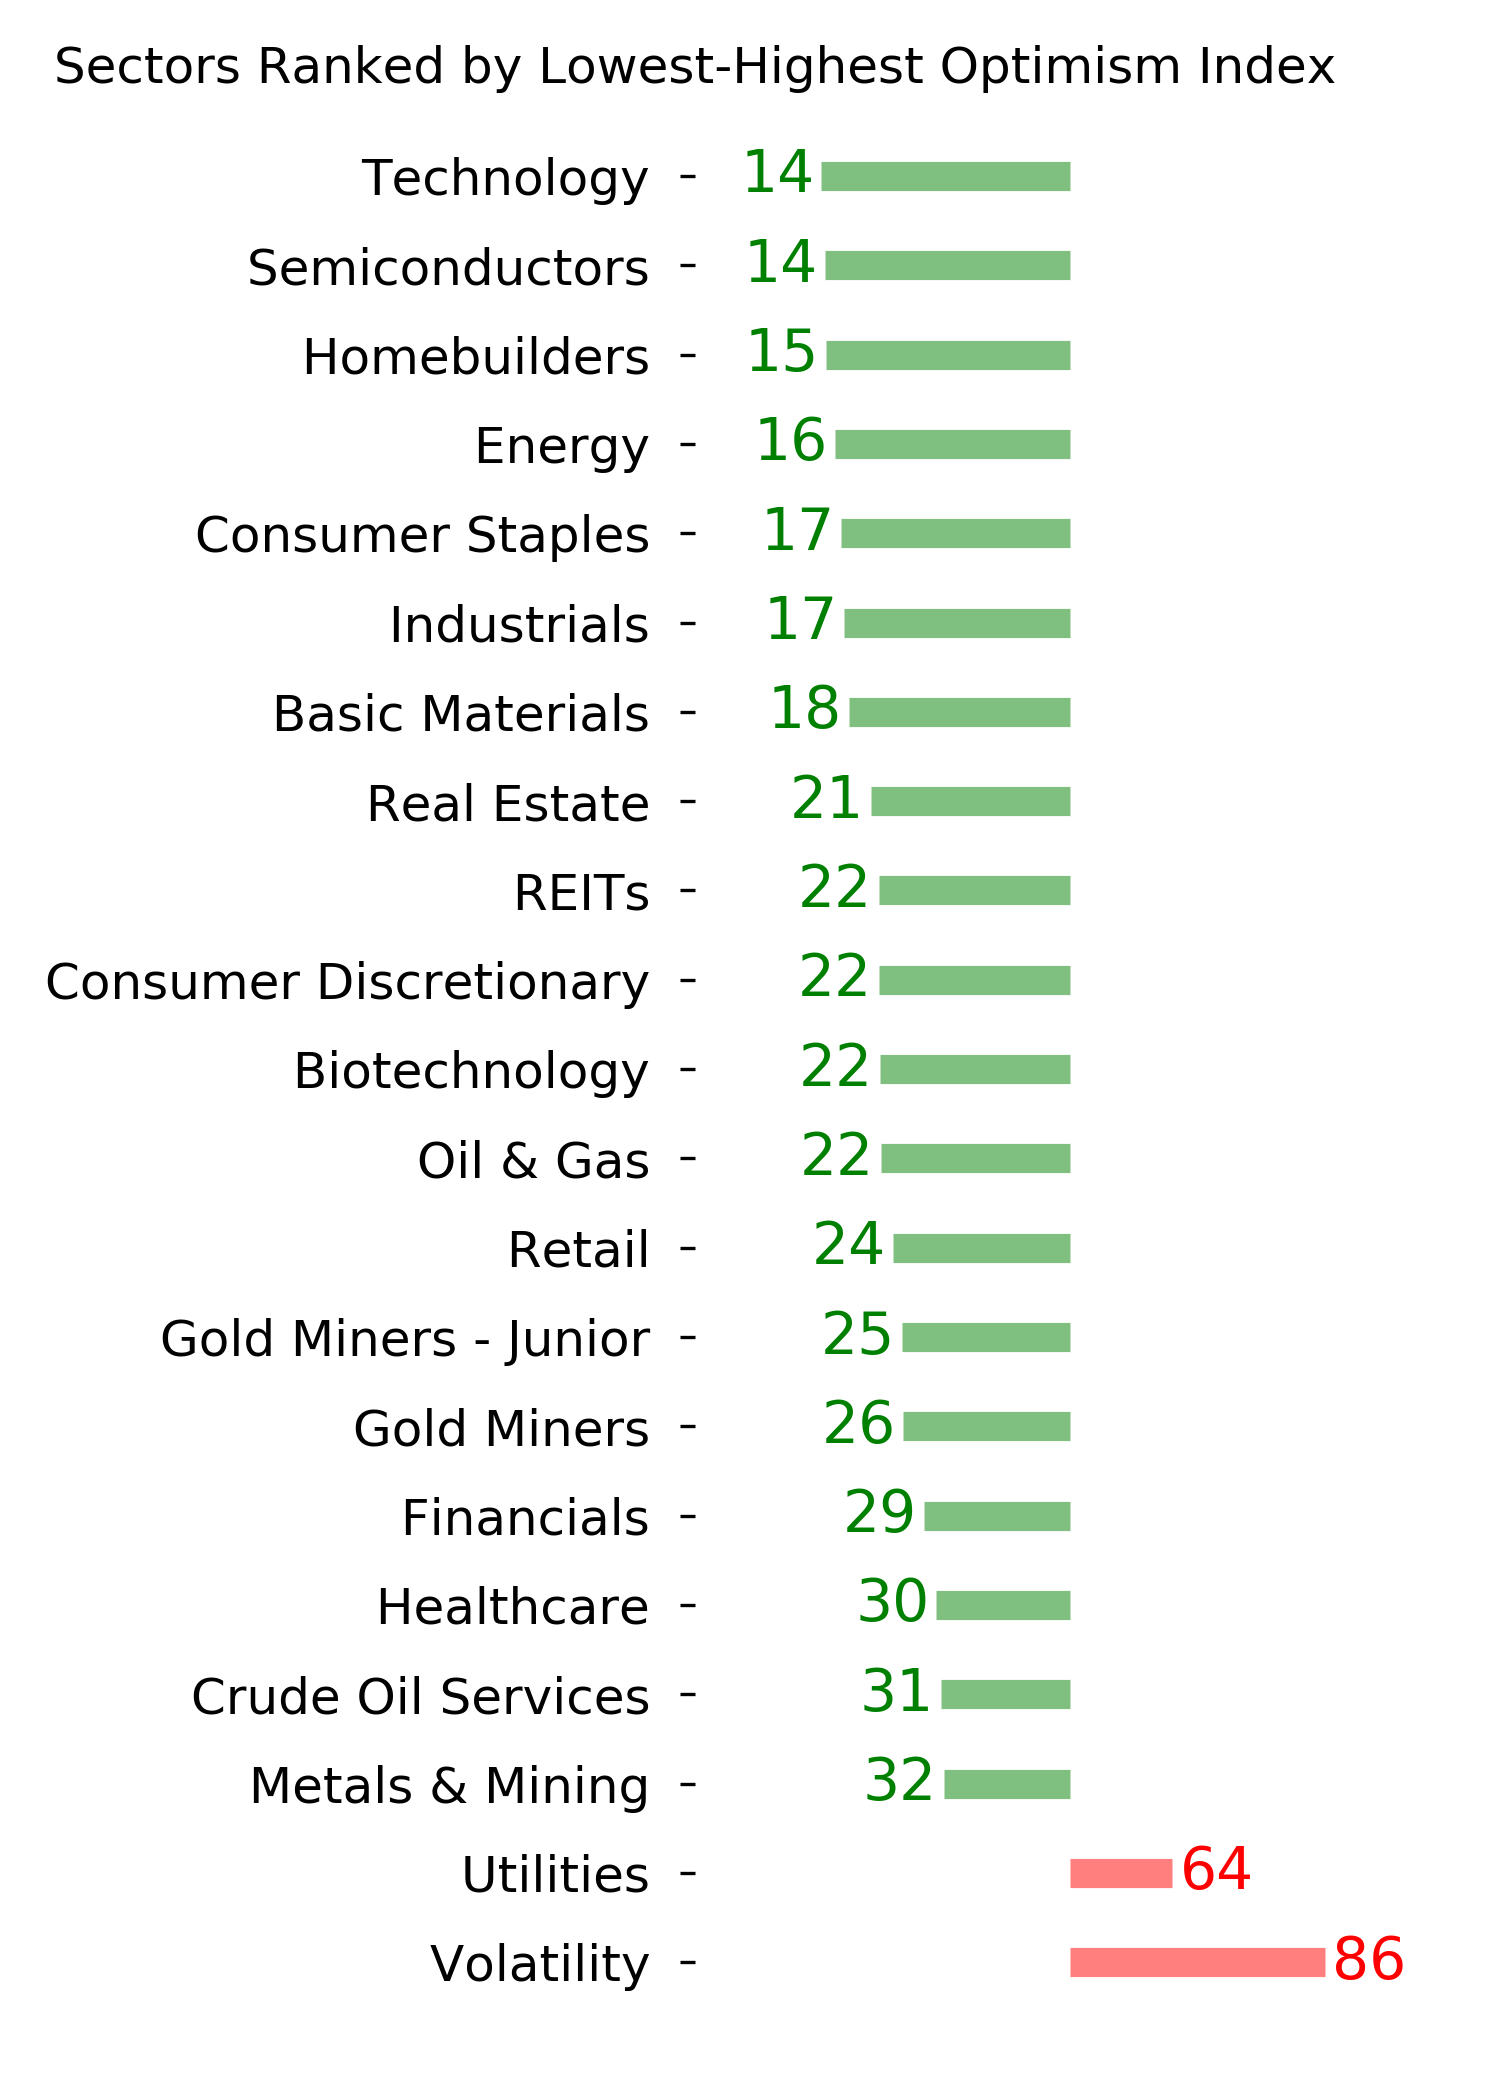
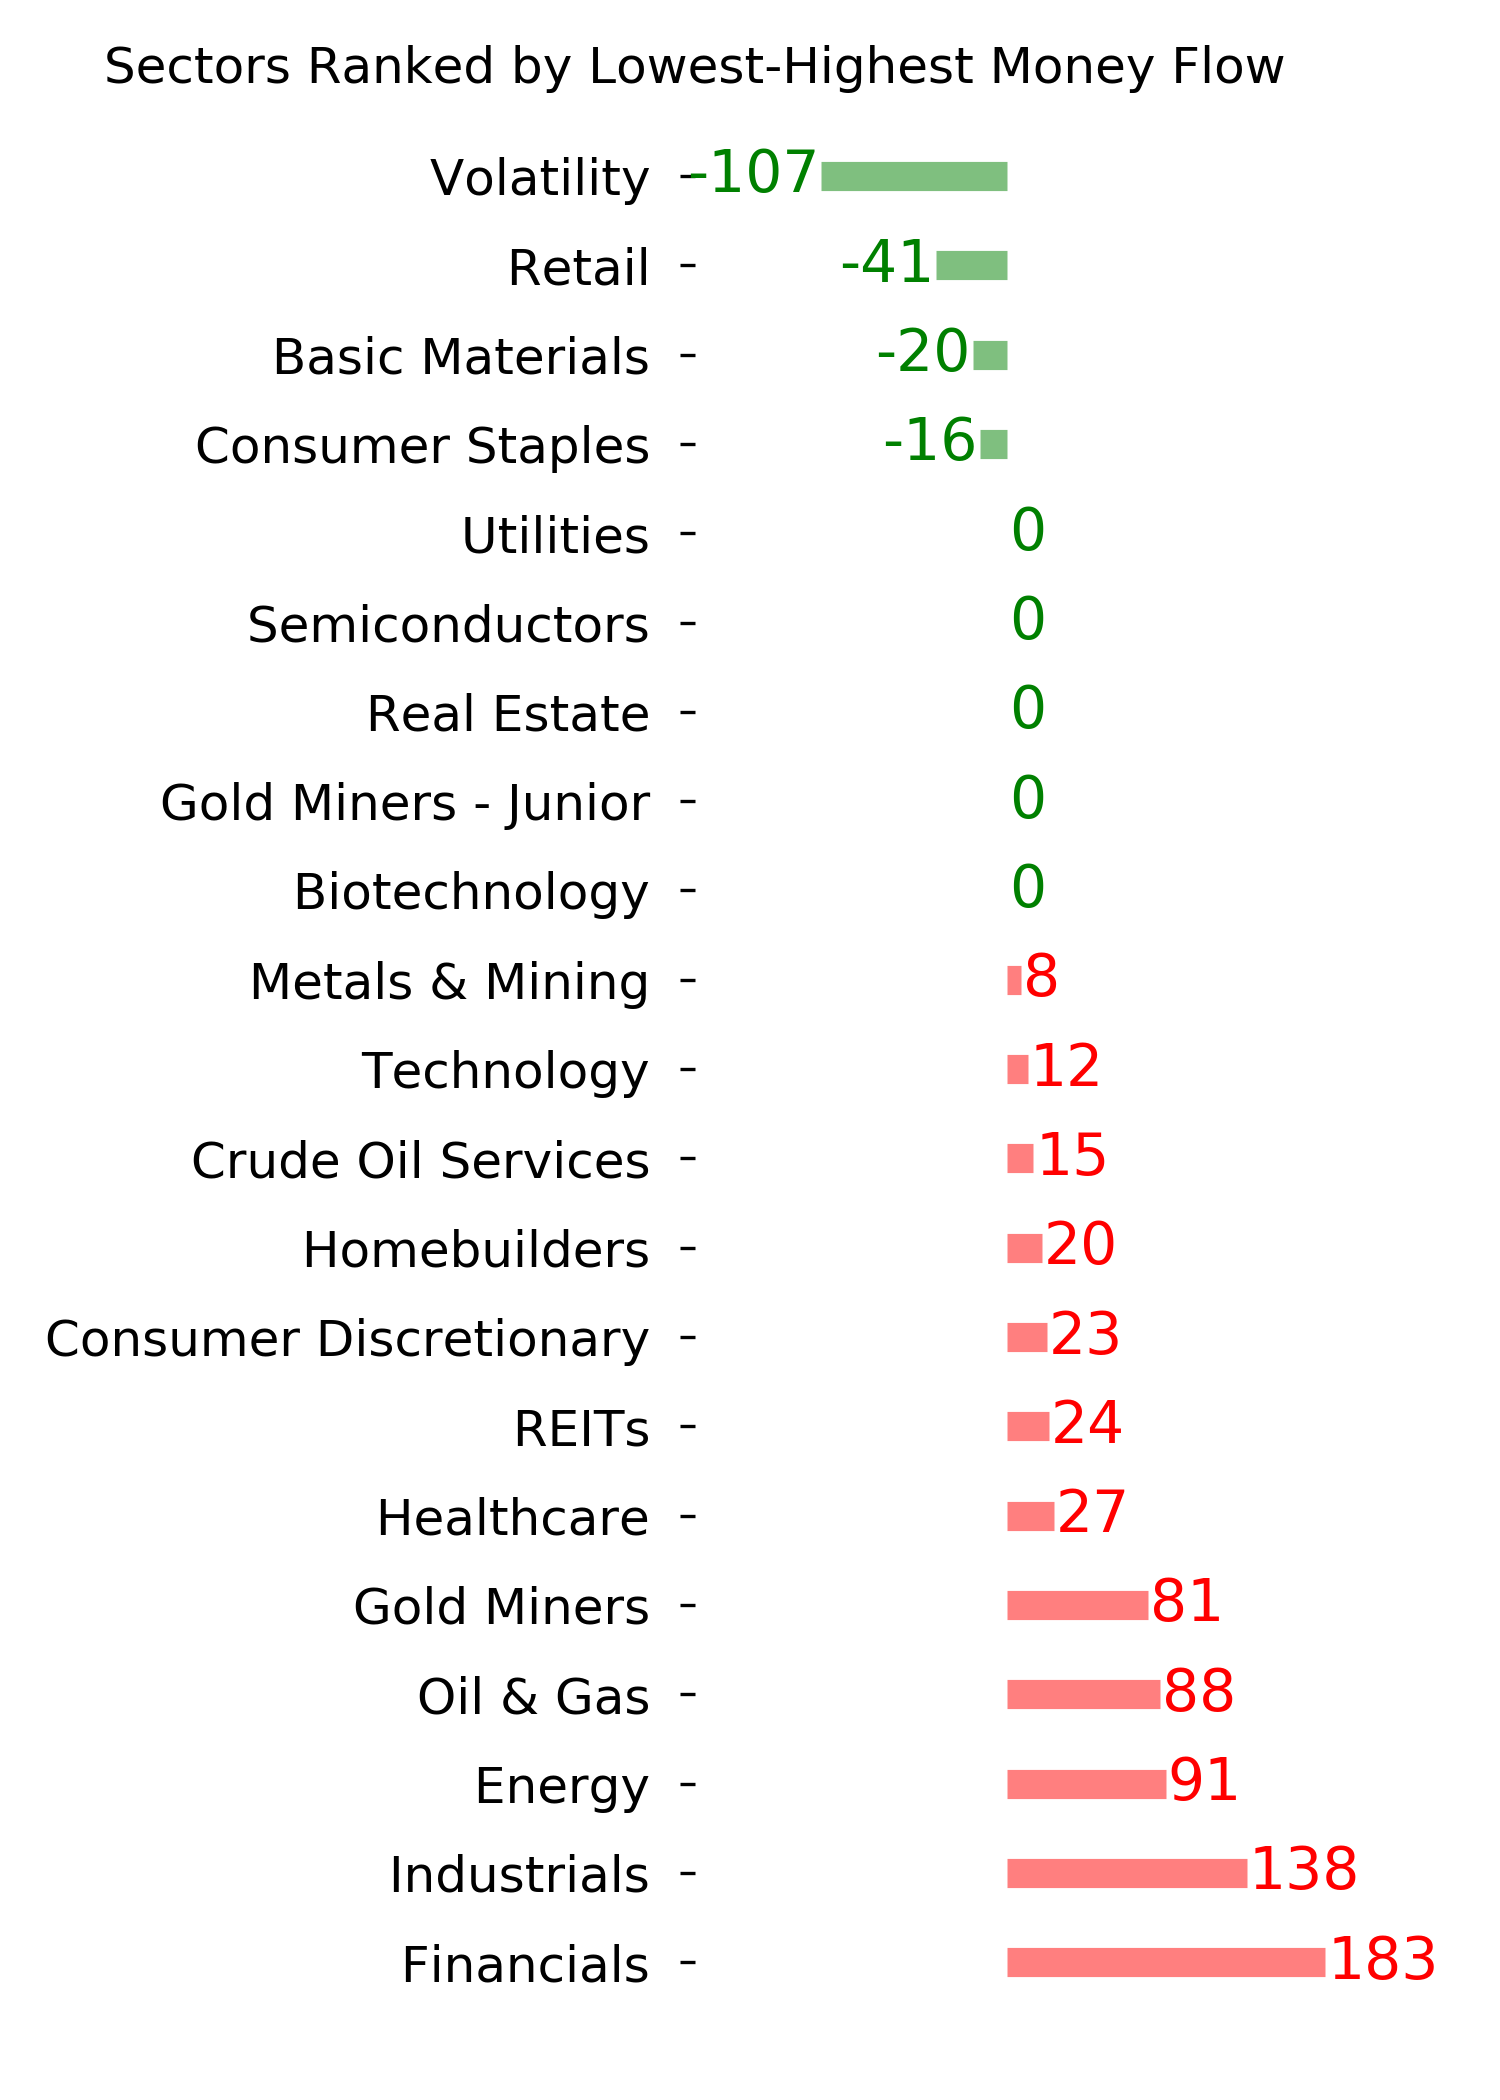
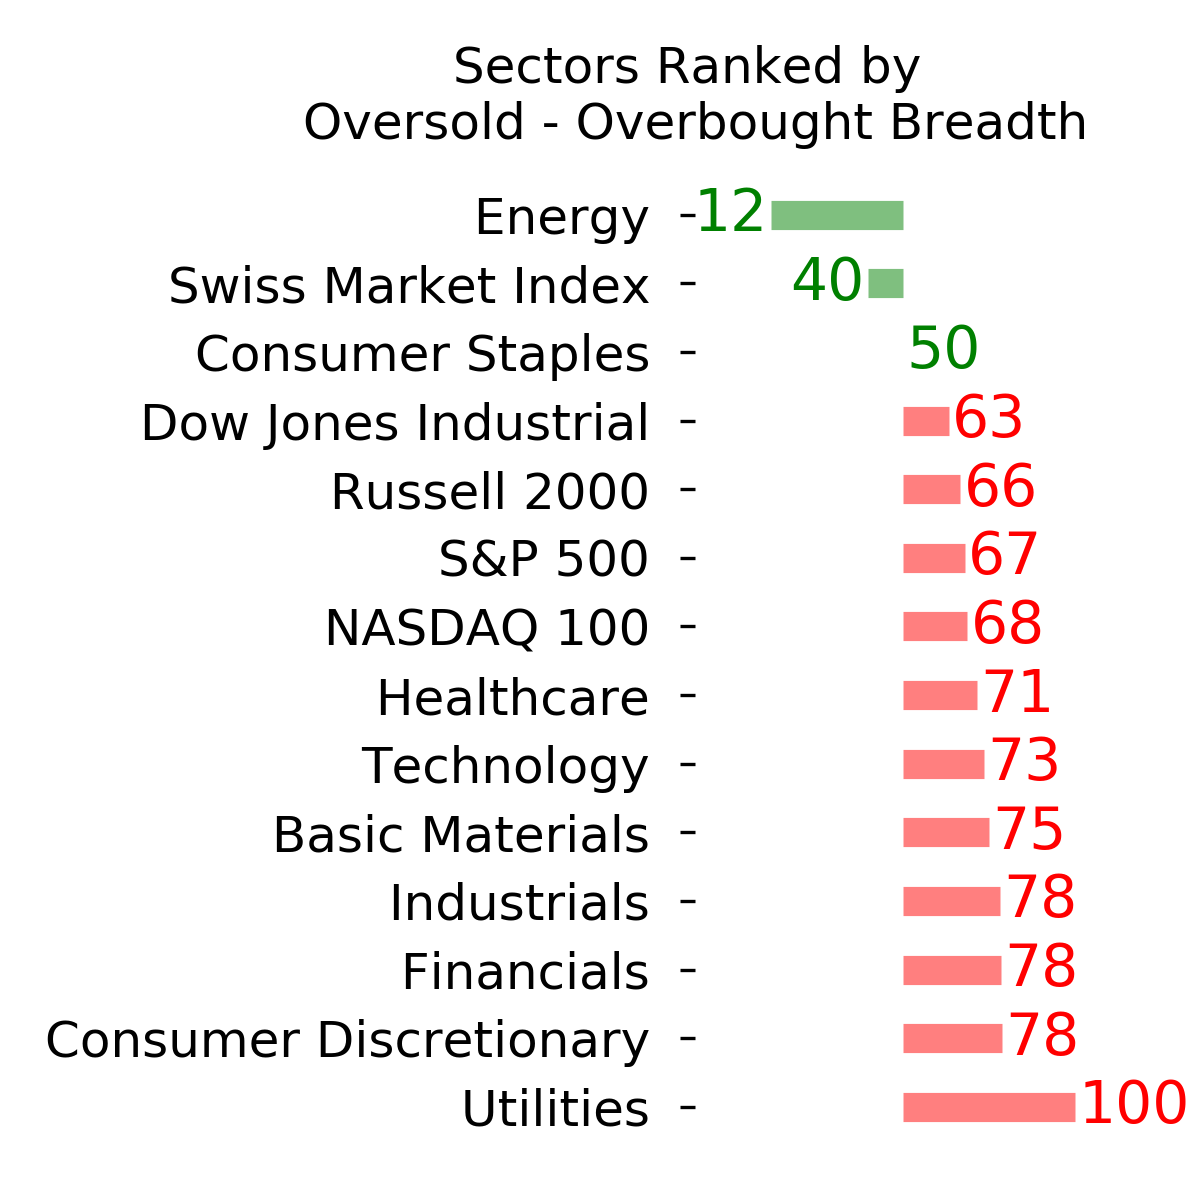
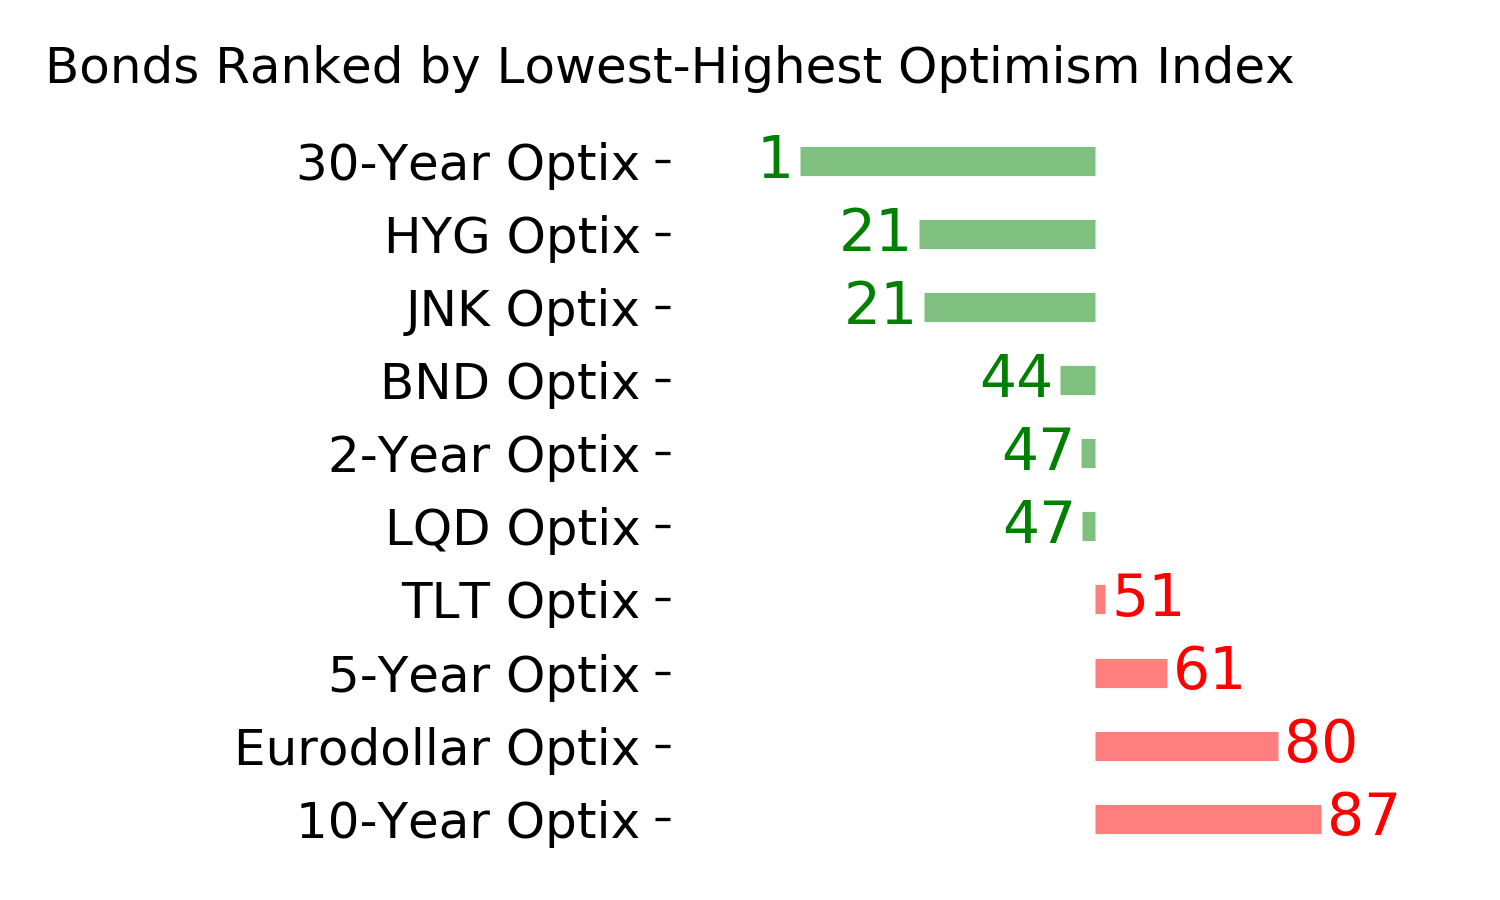
Ranks
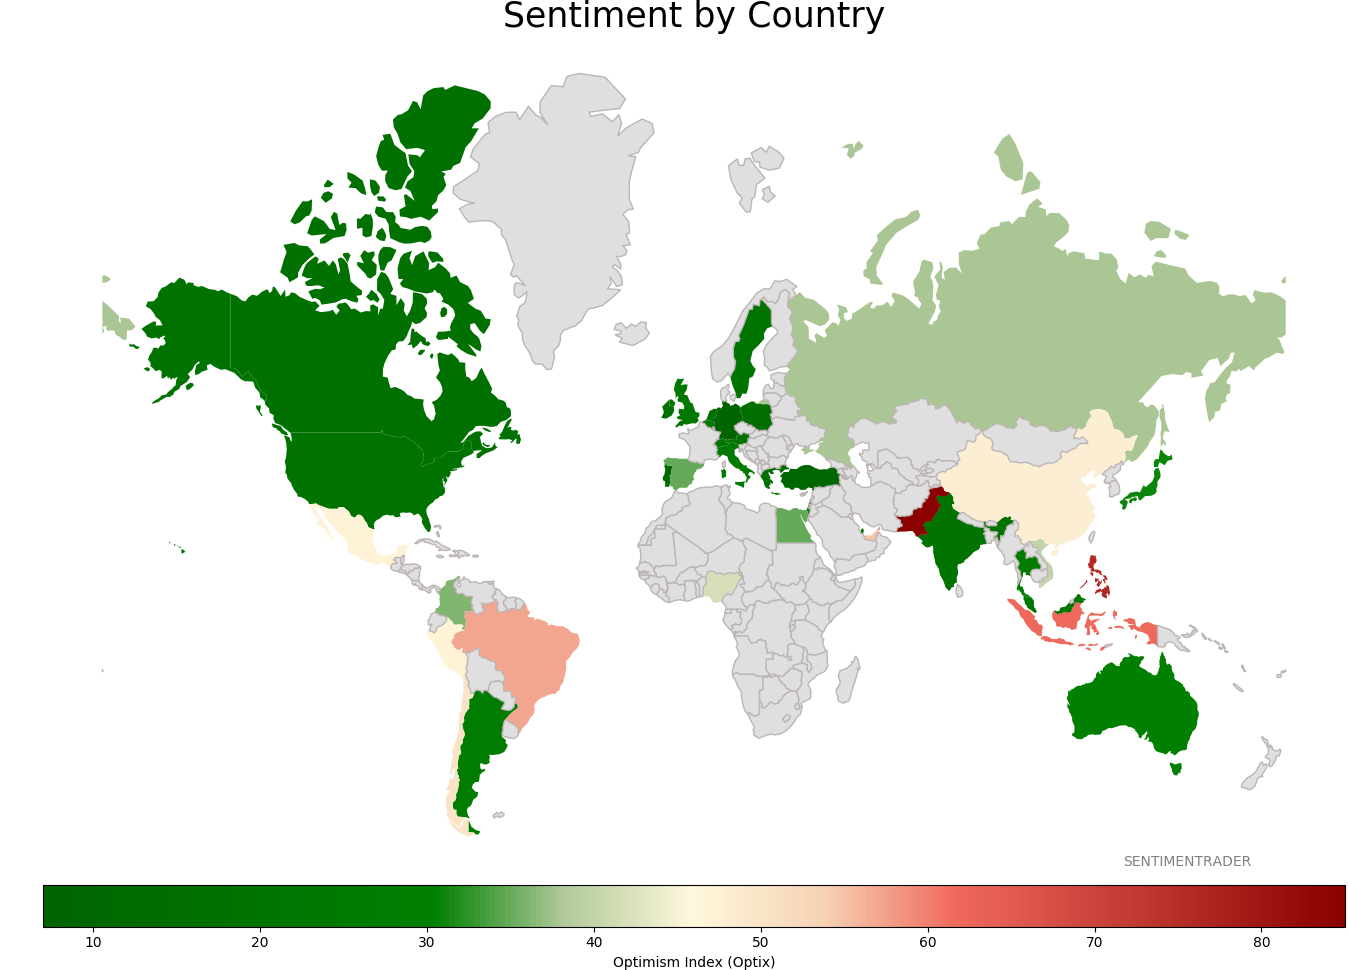
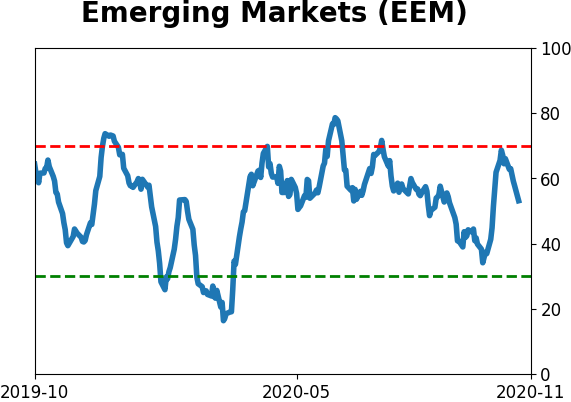
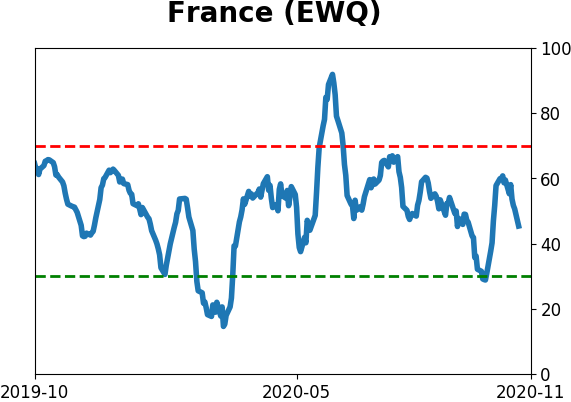
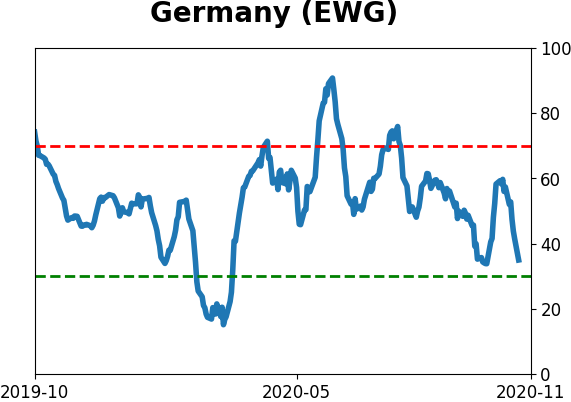
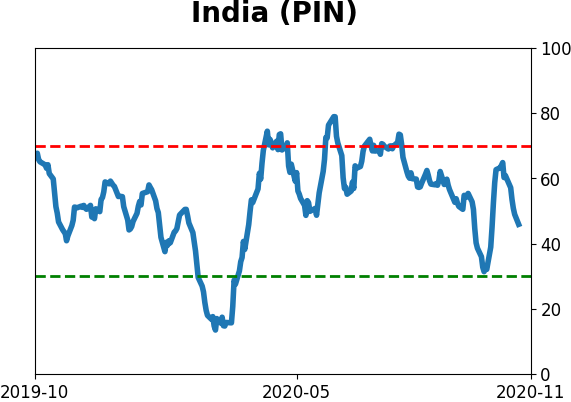
Sentiment Around The World
Optimism Index Thumbnails
|
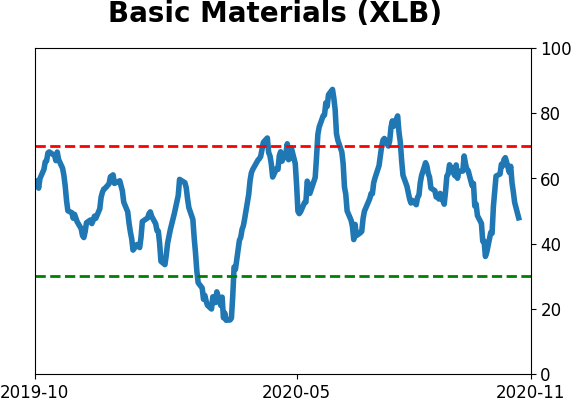
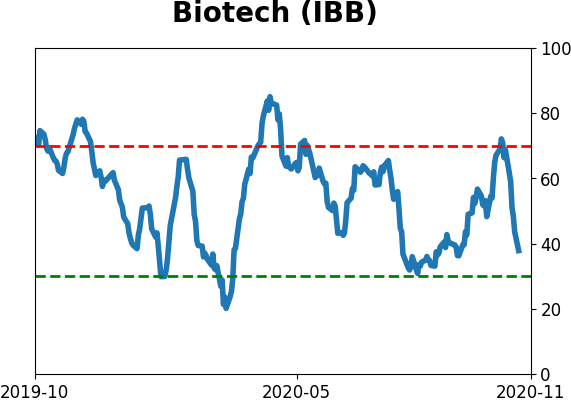
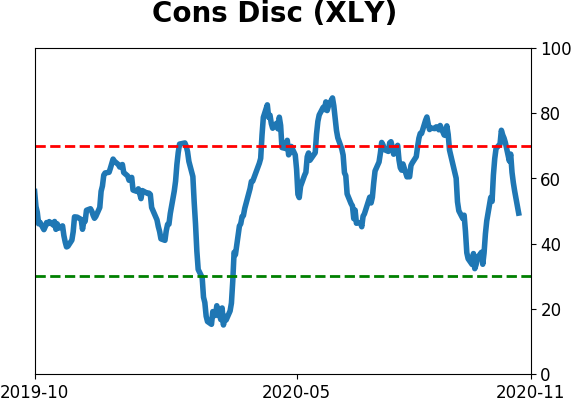
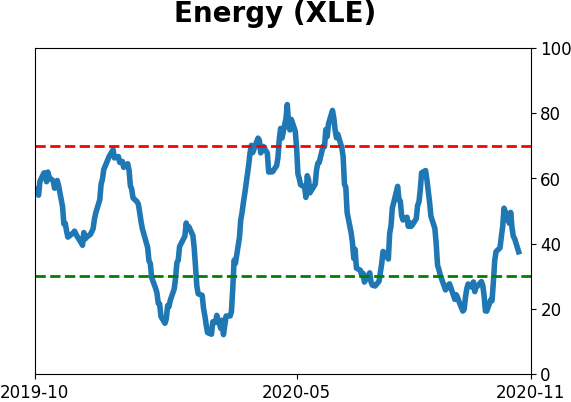
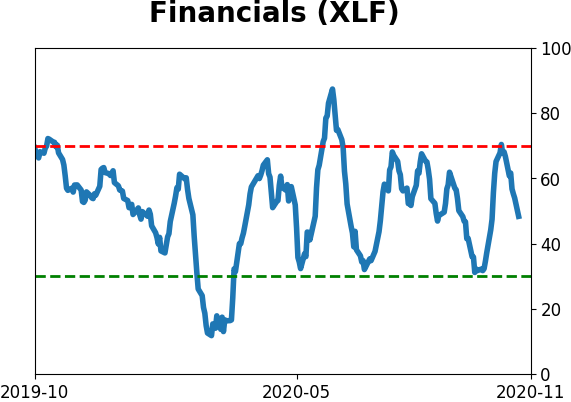
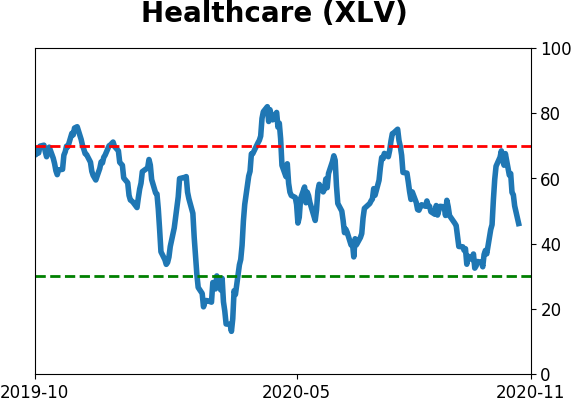
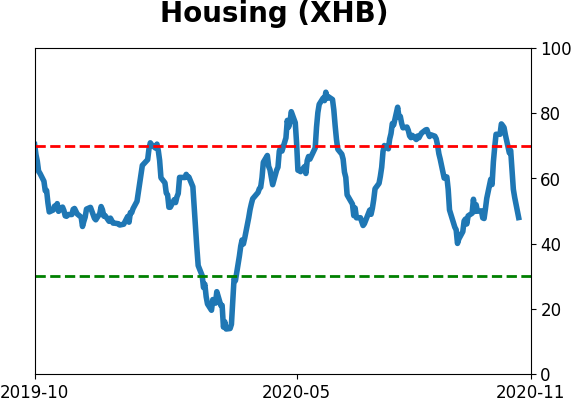
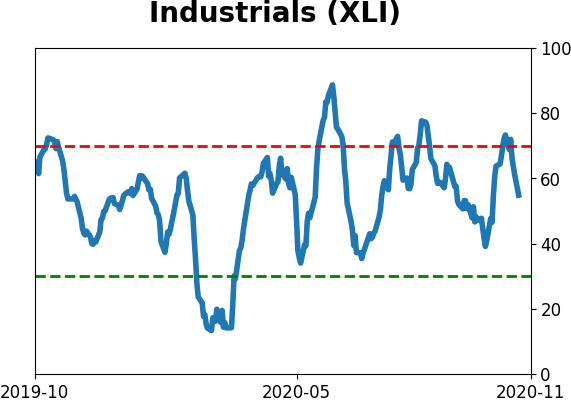
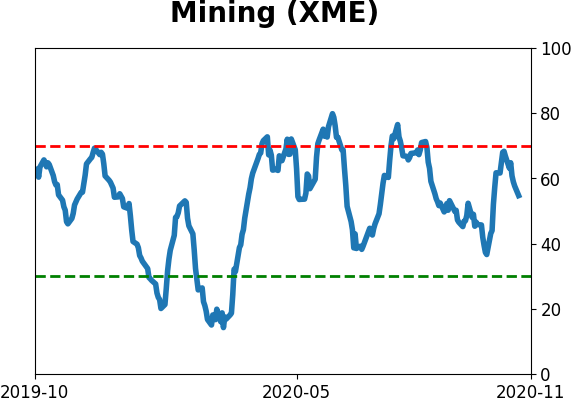
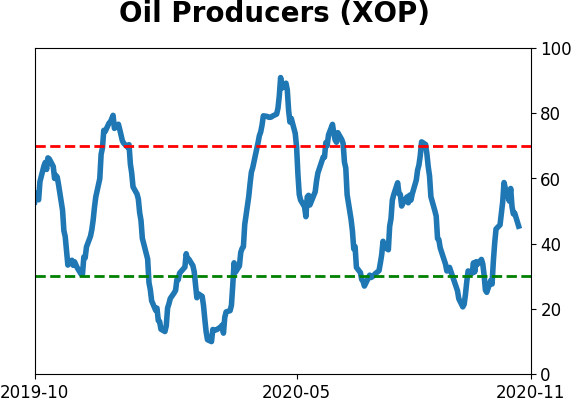
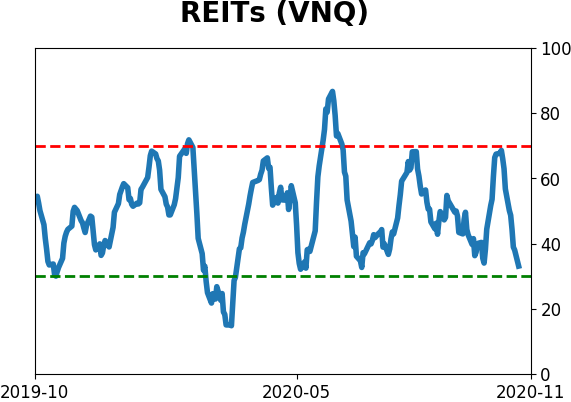
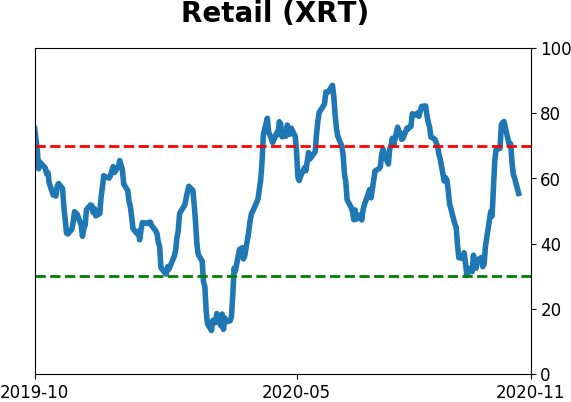
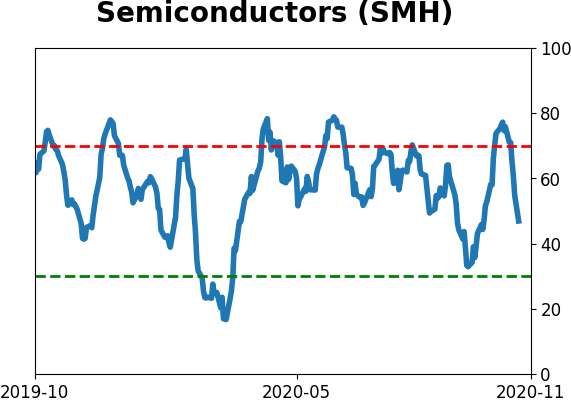
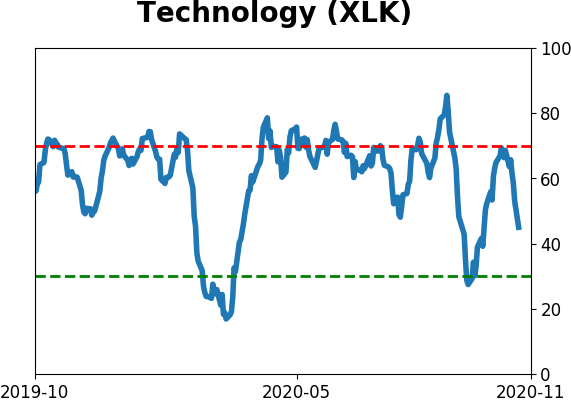
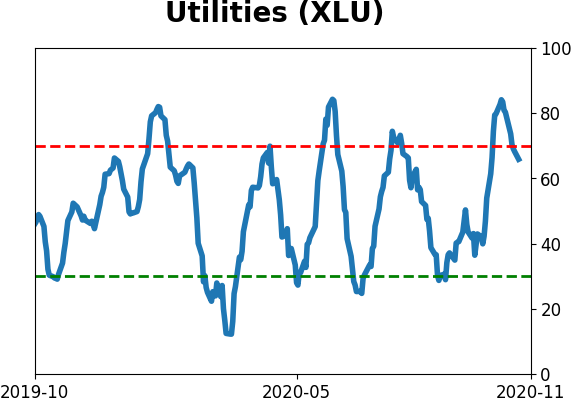
Sector ETF's - 10-Day Moving Average
|
|
|
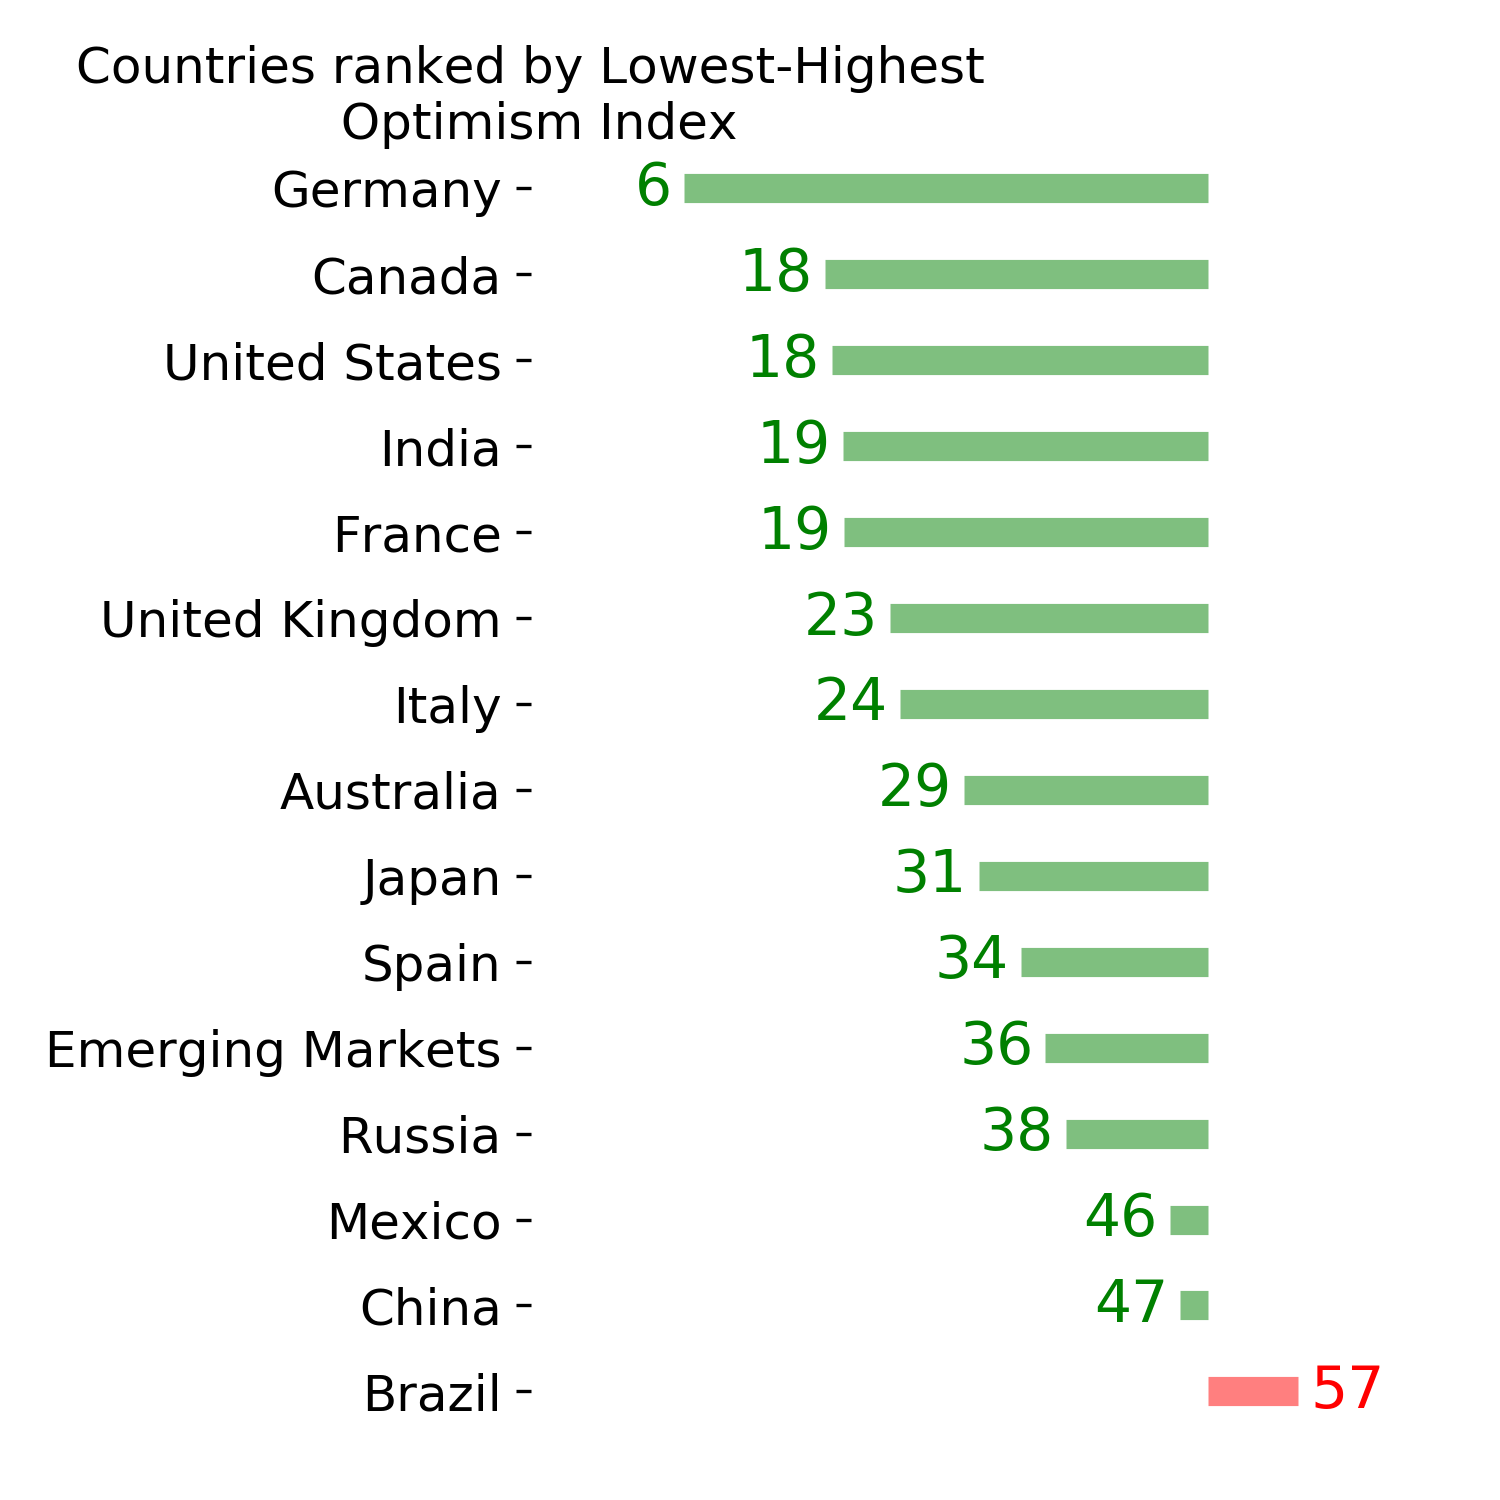
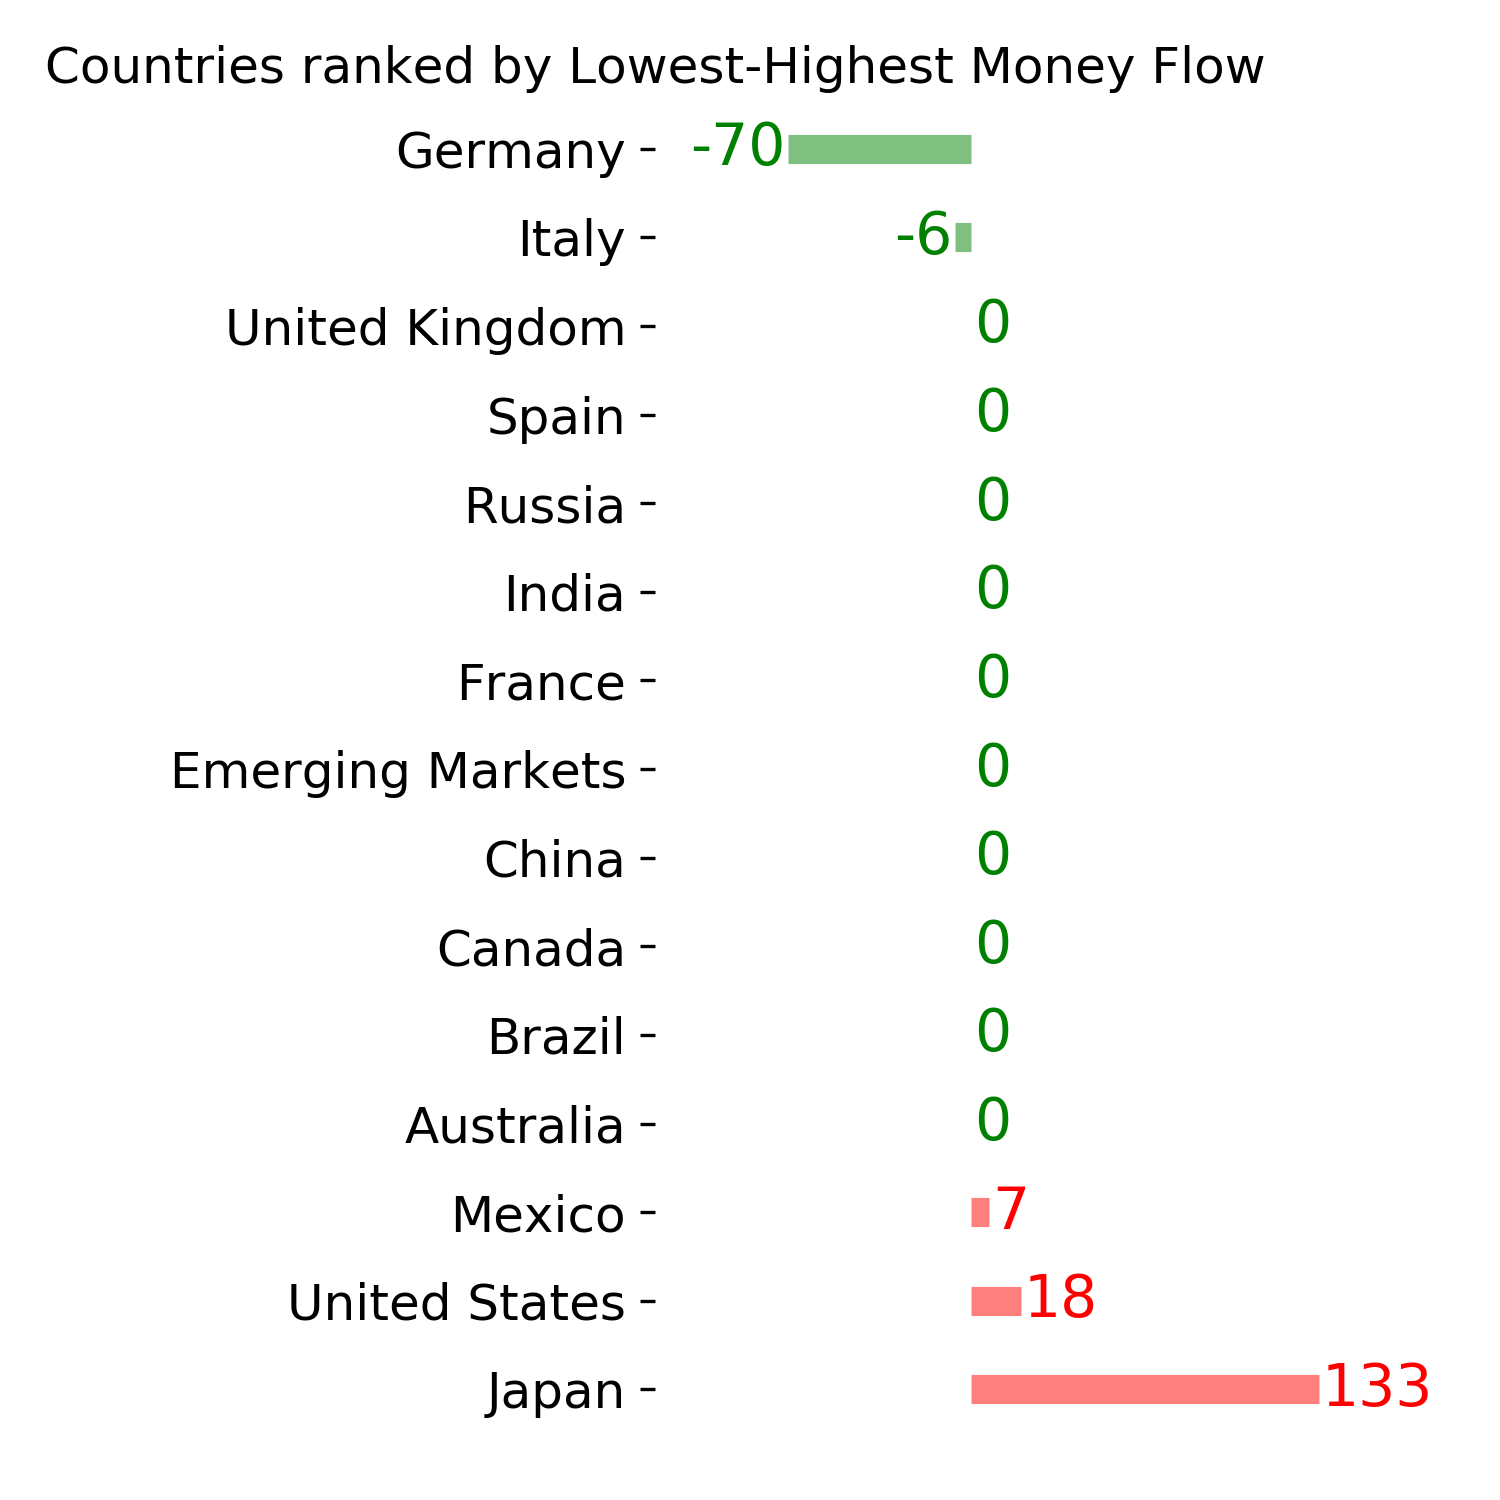
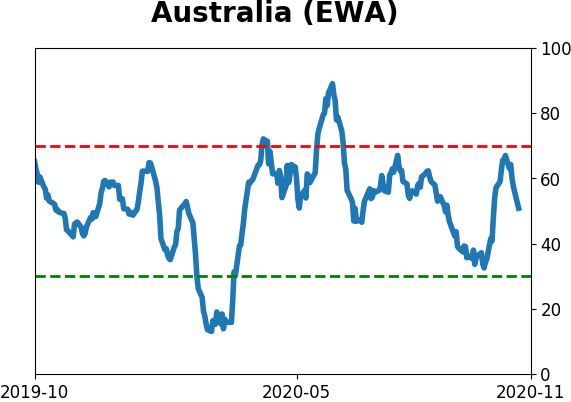
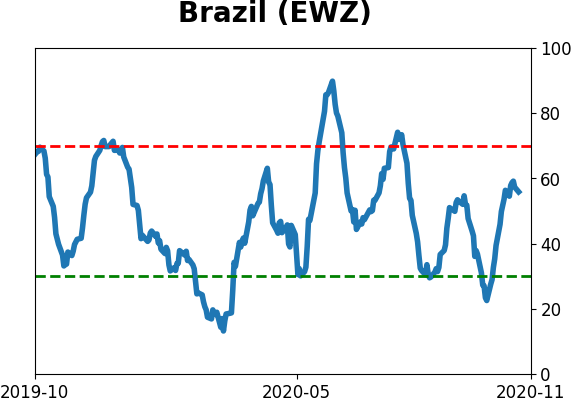
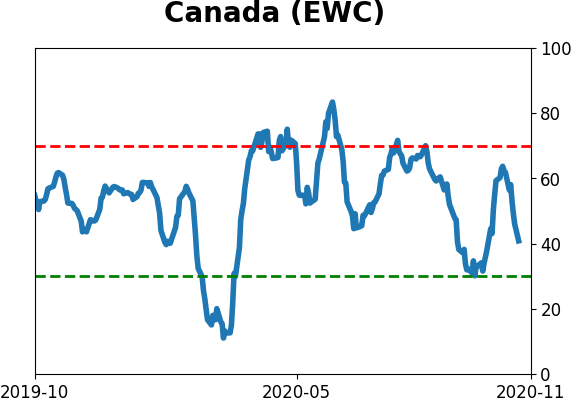
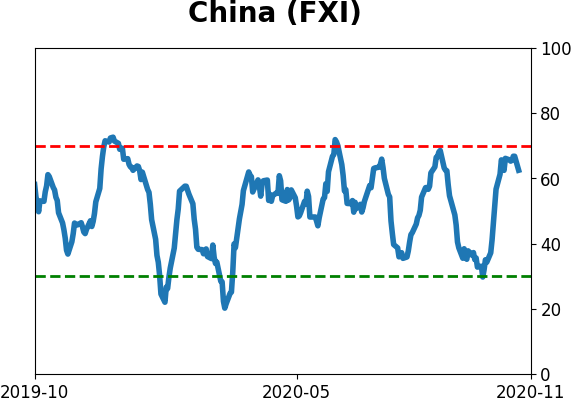
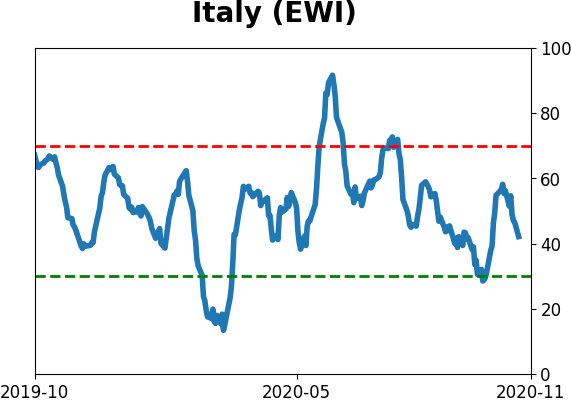
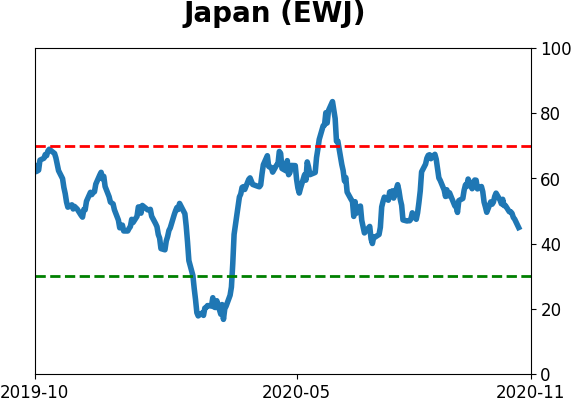
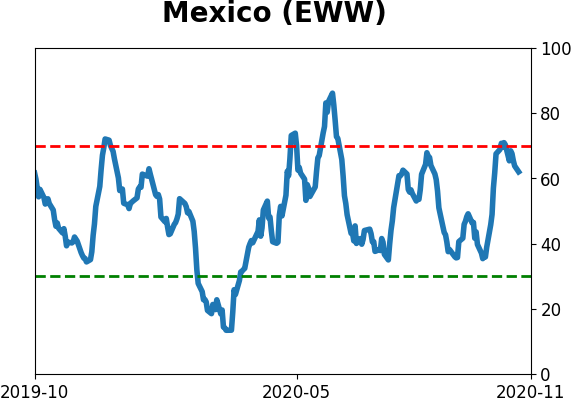
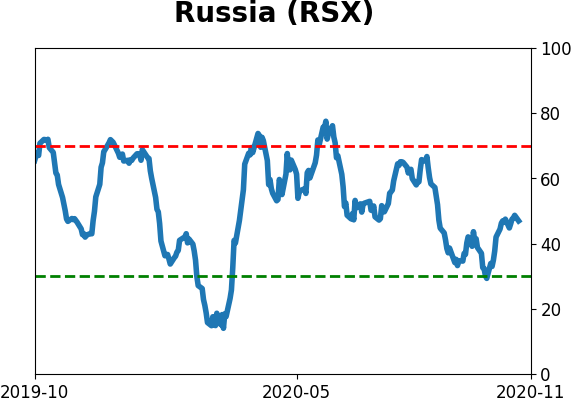
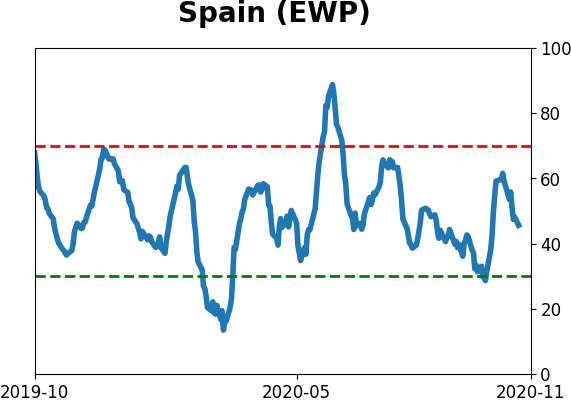
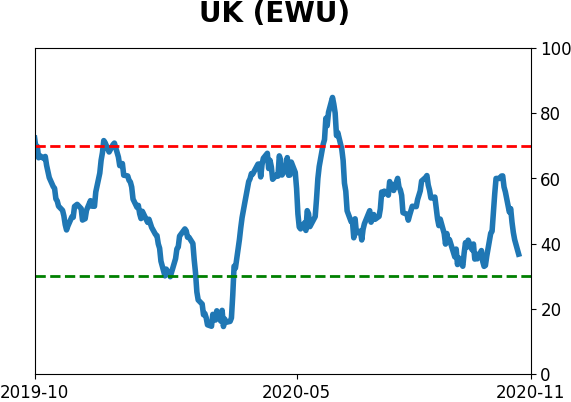
Country ETF's - 10-Day Moving Average
|
|
|
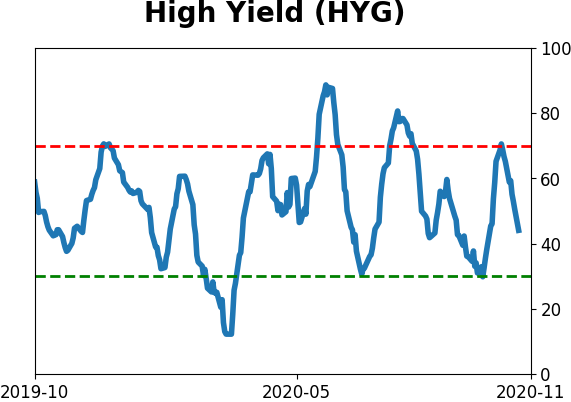
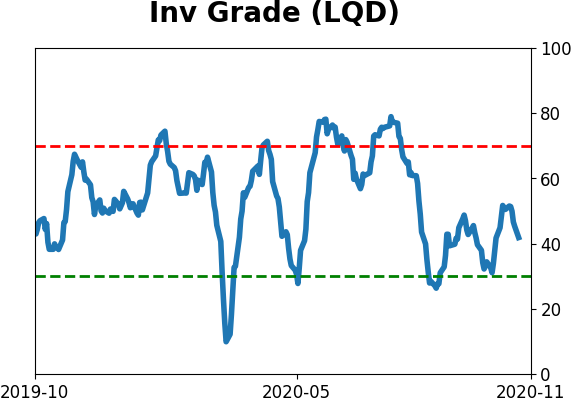
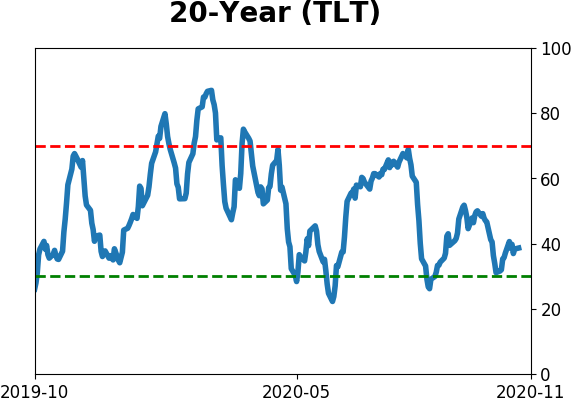
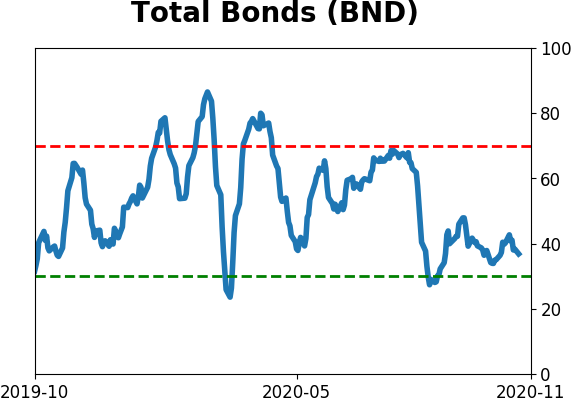
Bond ETF's - 10-Day Moving Average
|
|
|
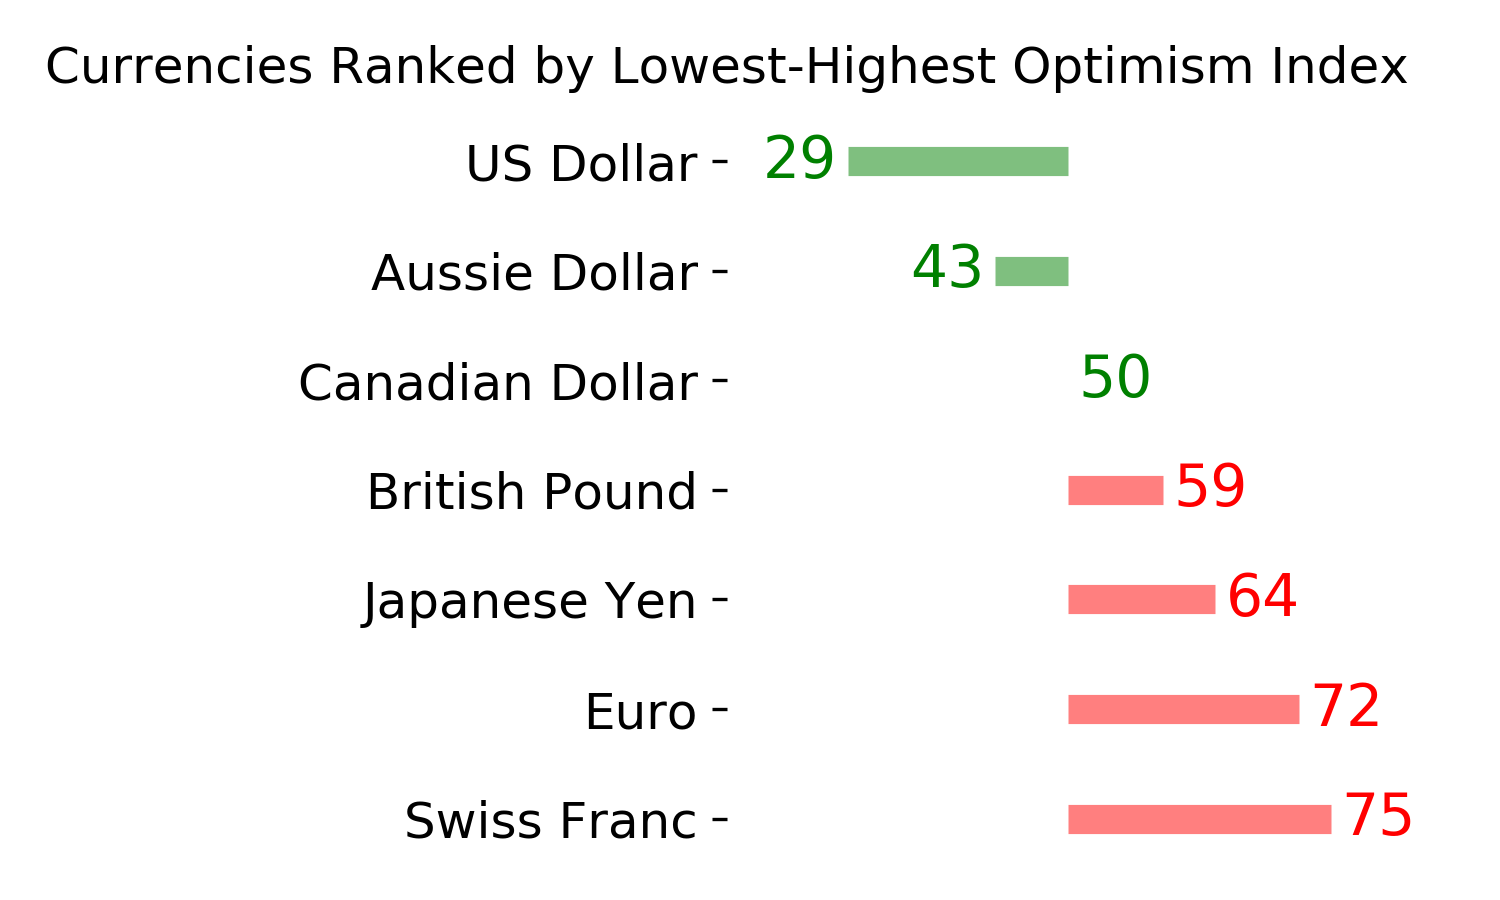
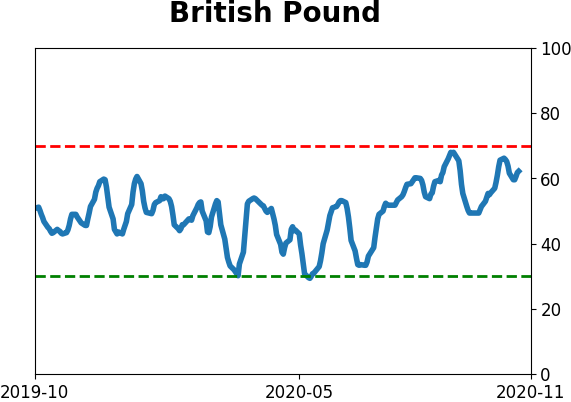
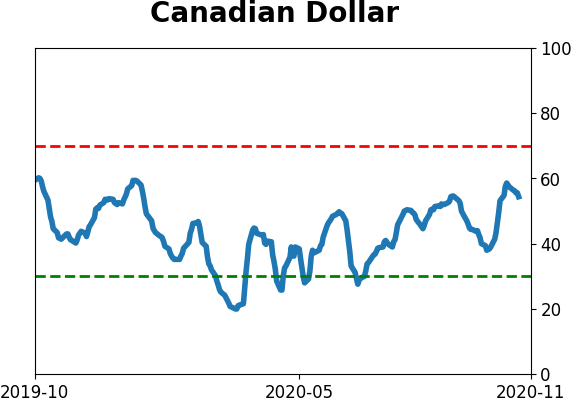
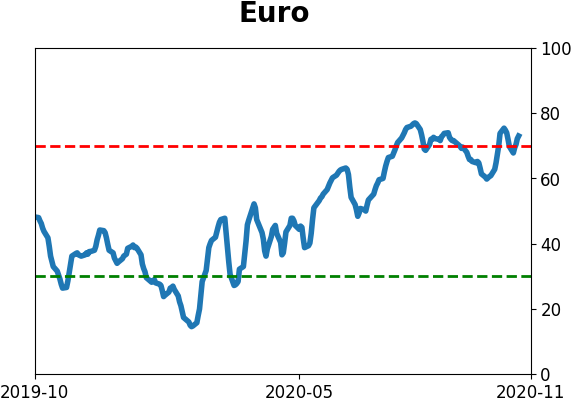
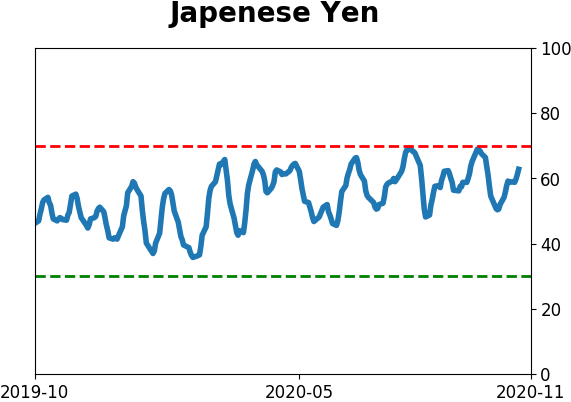
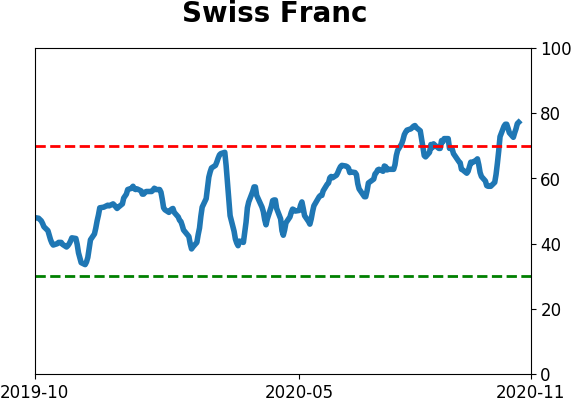
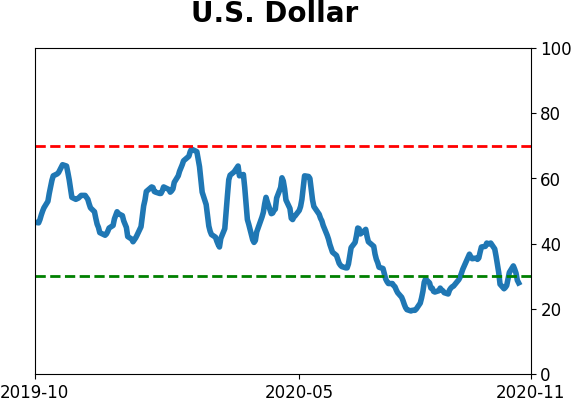
Currency ETF's - 5-Day Moving Average
|
|
|
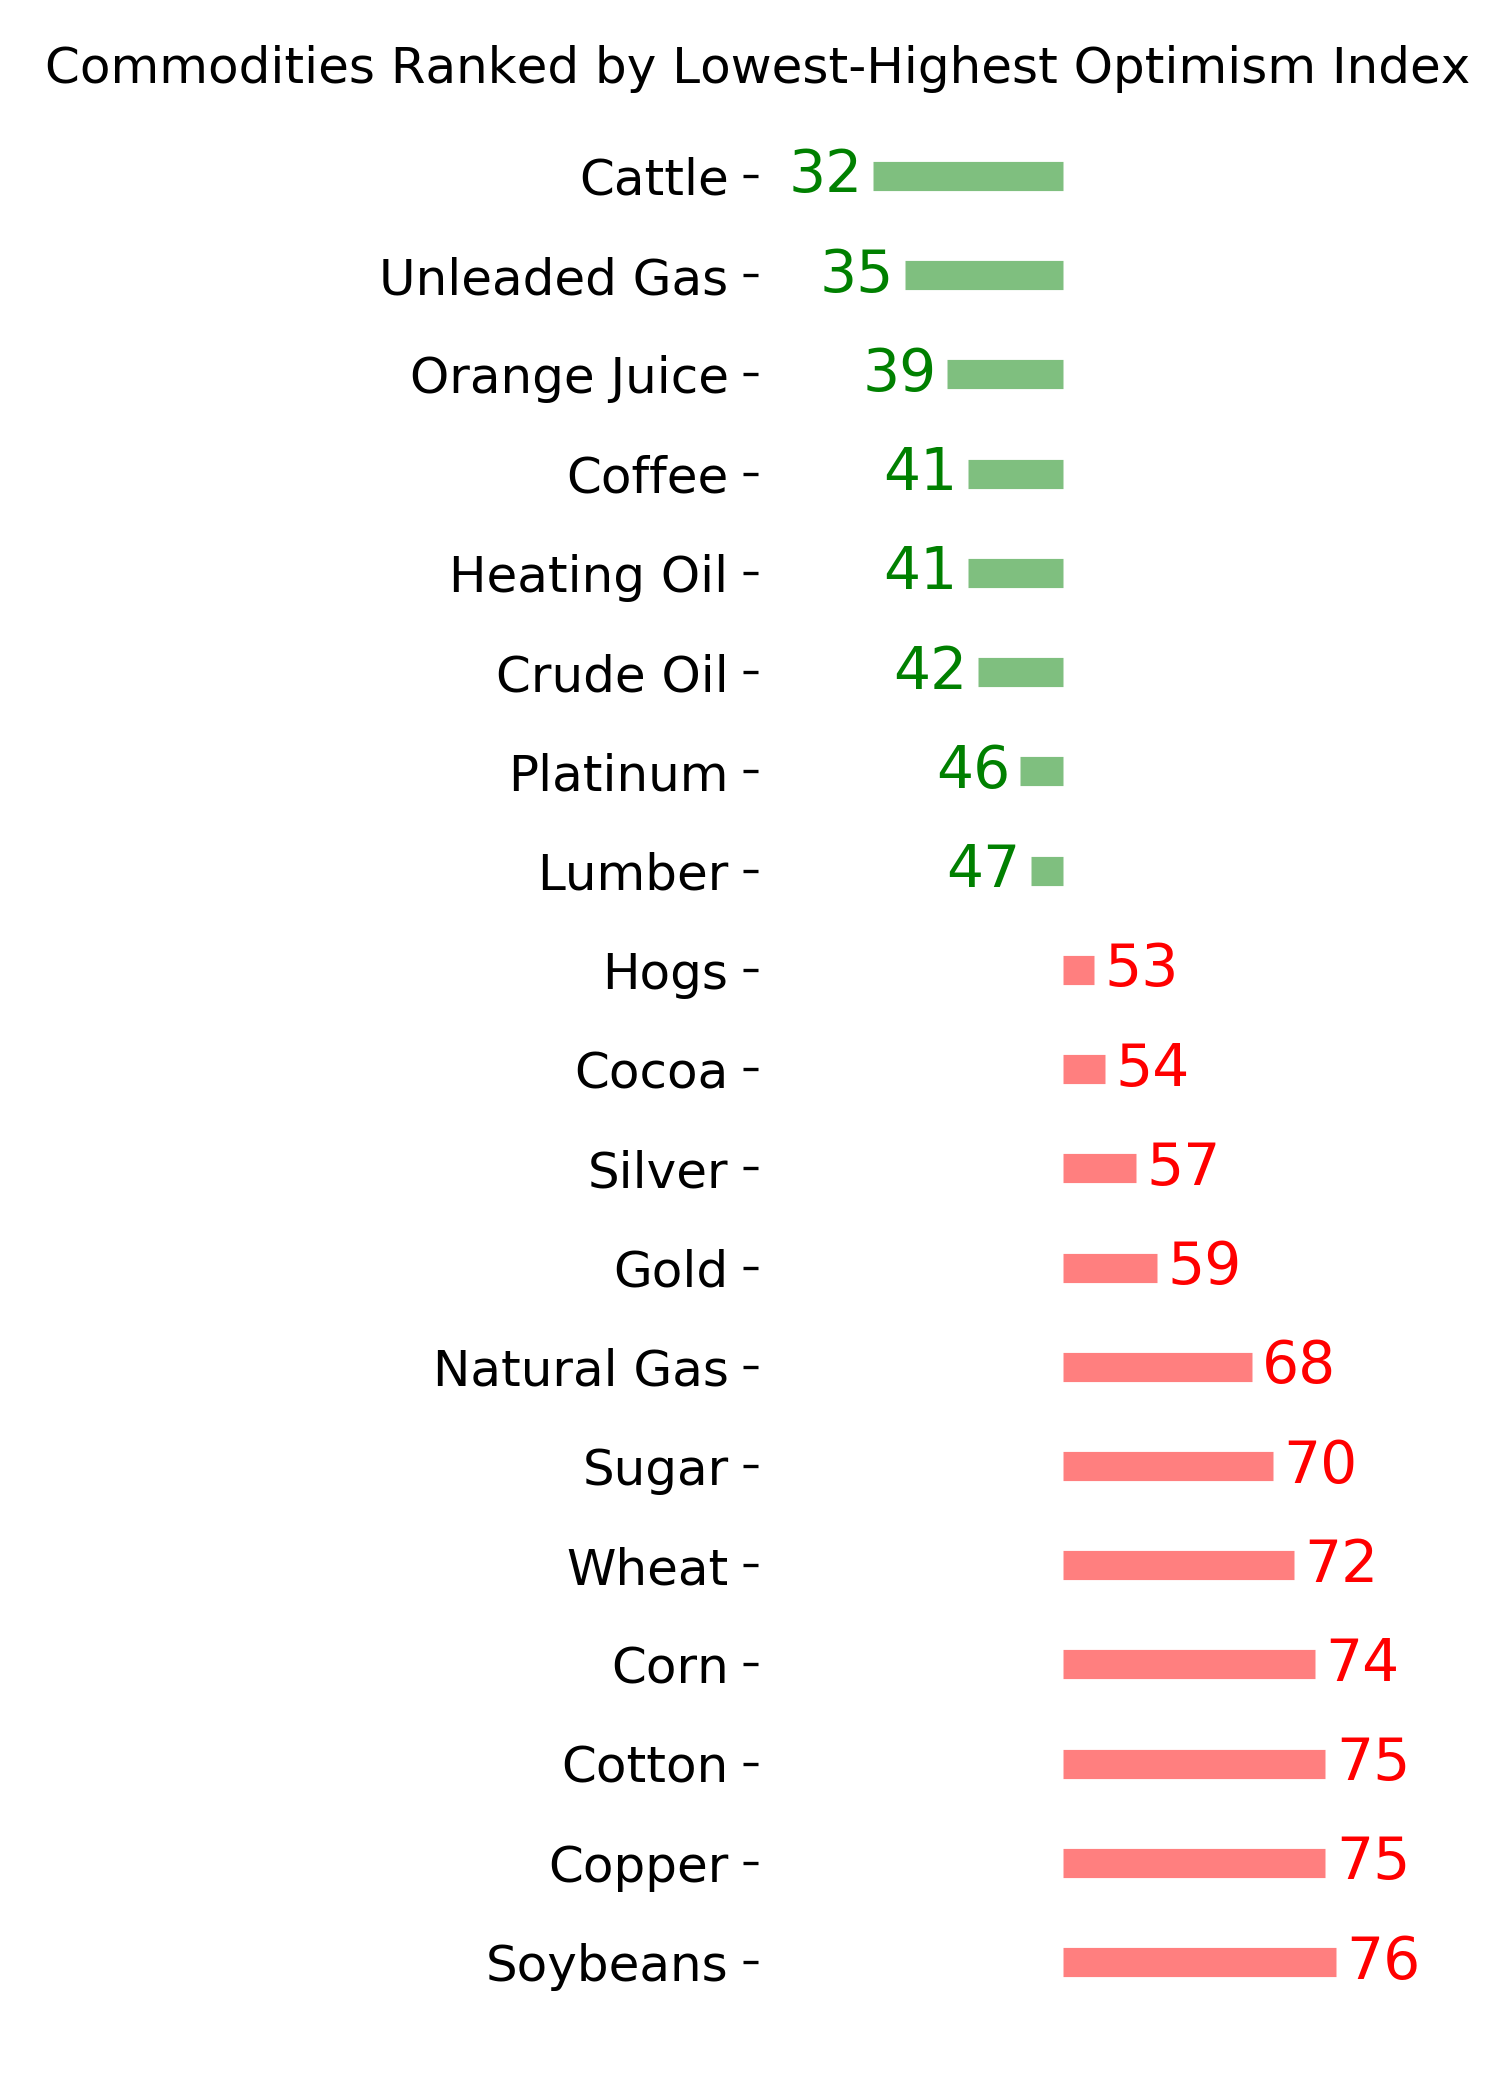
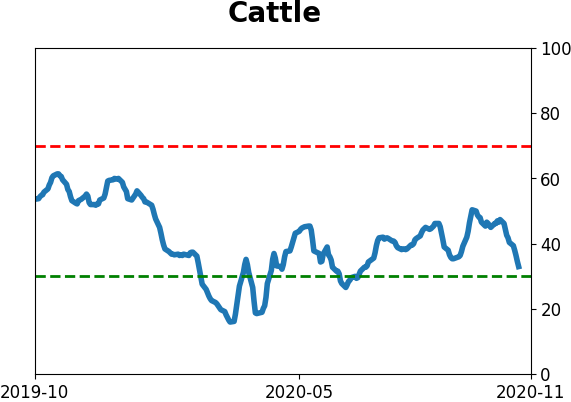
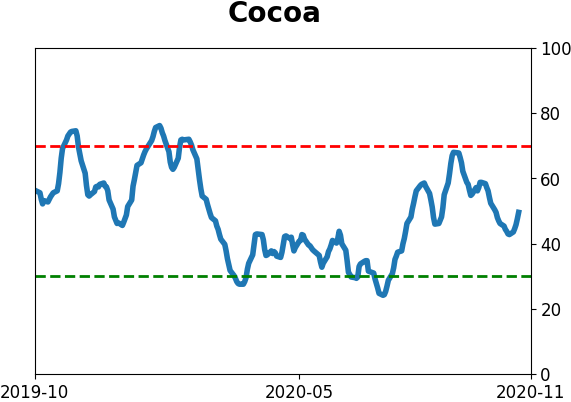
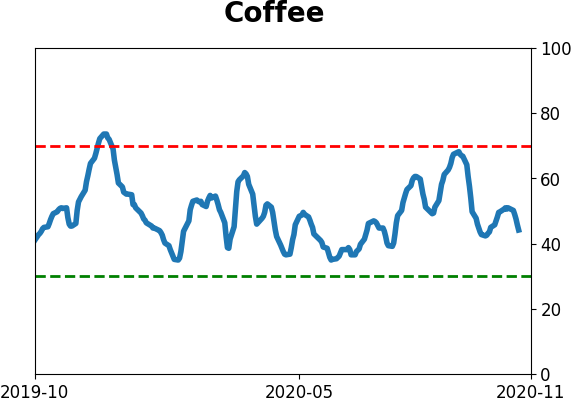
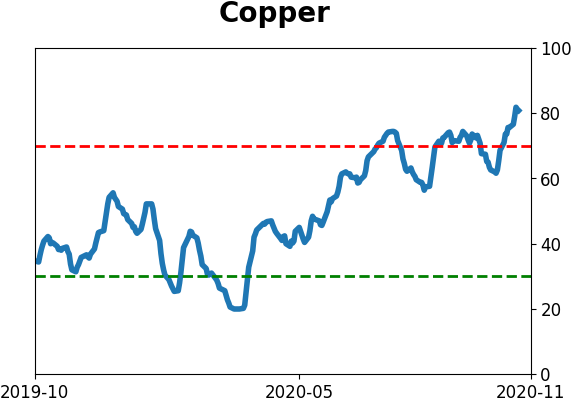
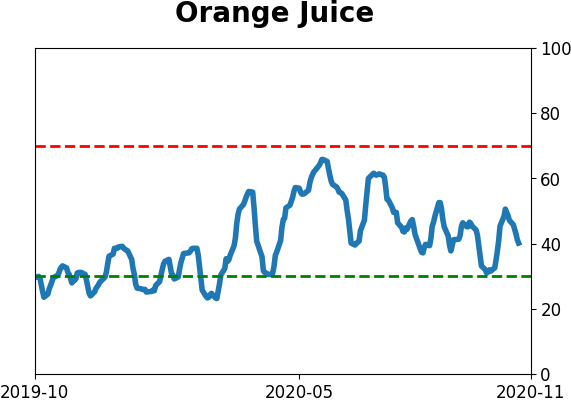
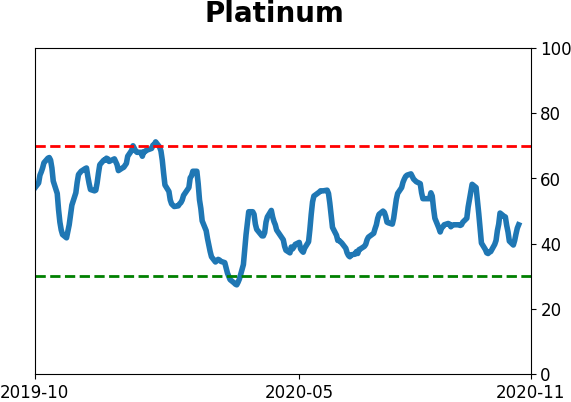
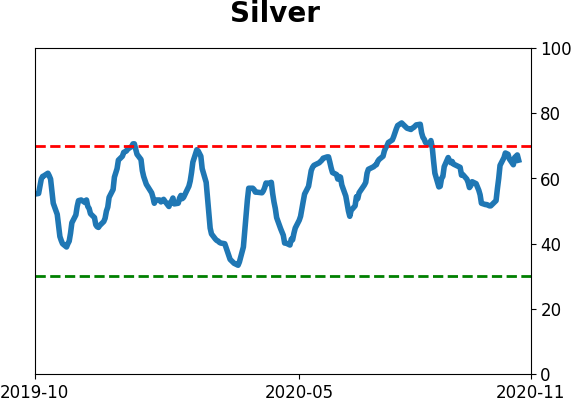
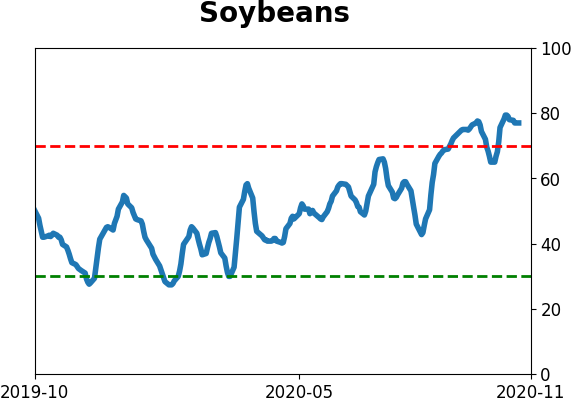
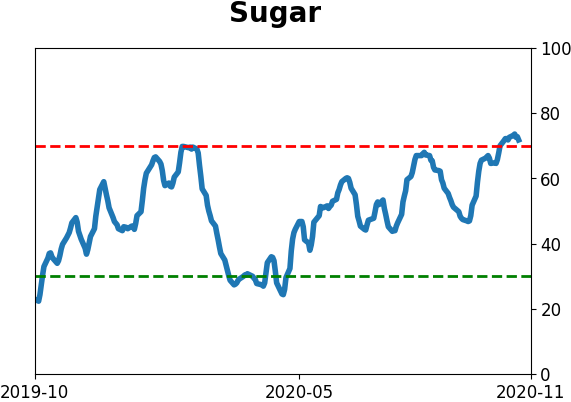
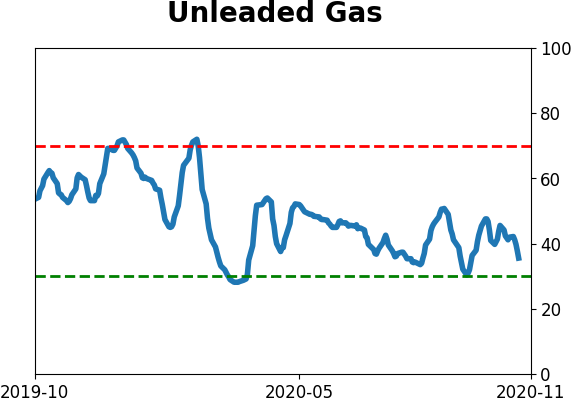
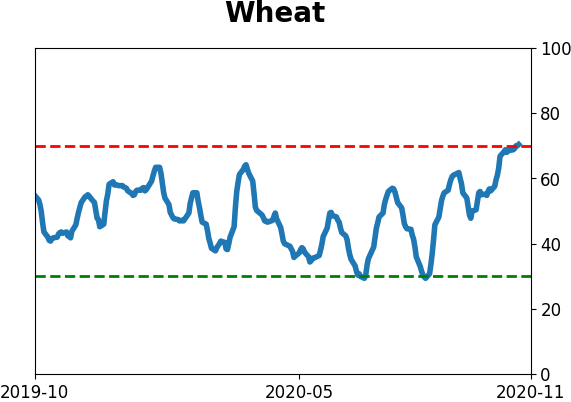
Commodity ETF's - 5-Day Moving Average
|
|