Headlines
|
|
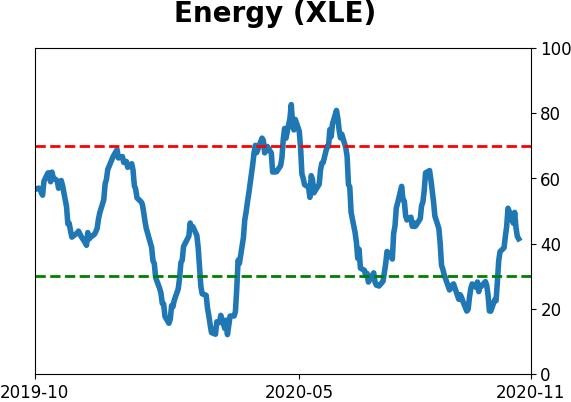
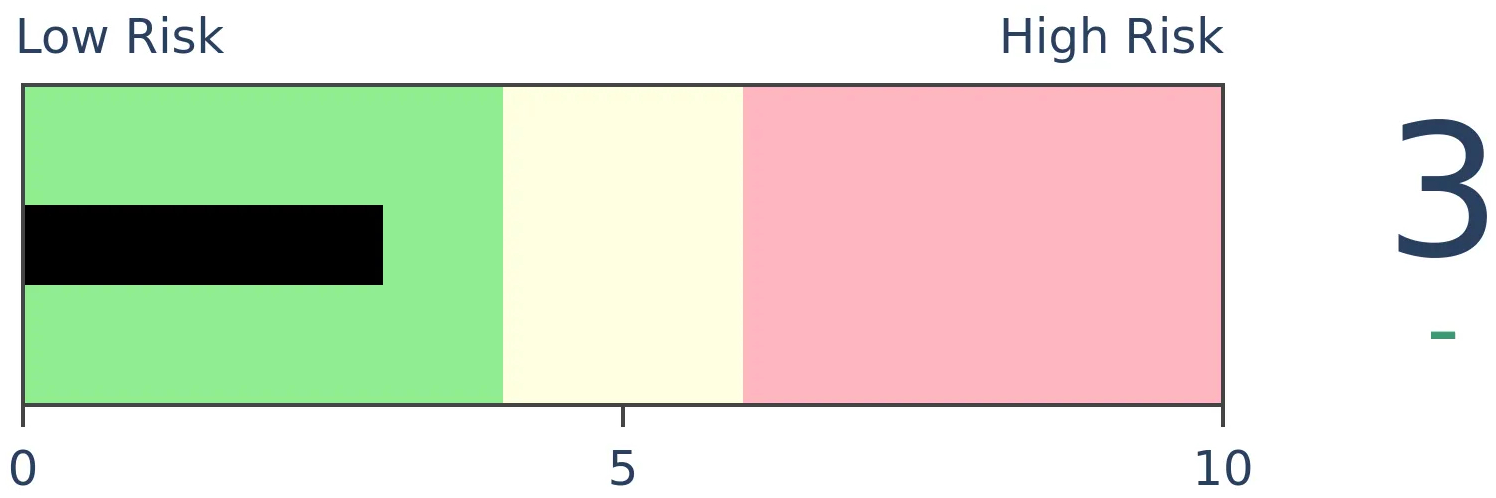
Most energy shares trade for less than $5 (even $2):
In March, almost all U.S. energy companies had a share price below $5. It hasn't changed much since then. A majority have share prices even below $2. This is beyond any other extreme over the past 20 years.
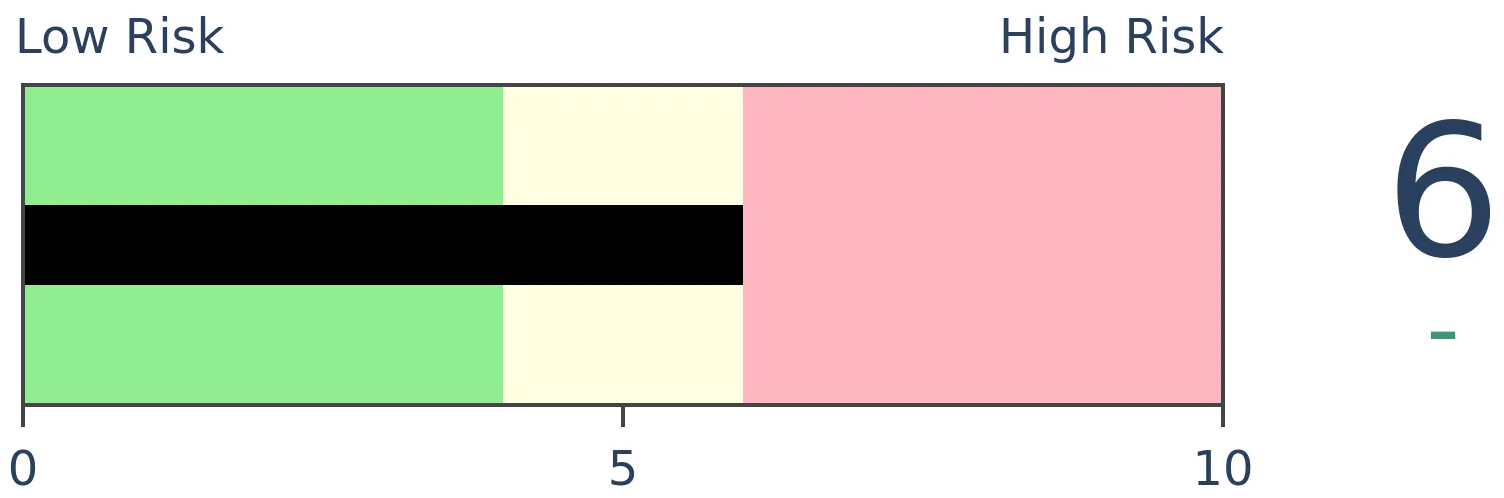
Bond investors start to price in more risk:
There has been a sudden and large increase in implied volatility in bond options. While this concerns some investors who worry about this bleeding into the stock market, historically a quick rise in bond volatility has not done so. There was a consistent pattern of the VIX dropping in the months ahead, while stocks rose.
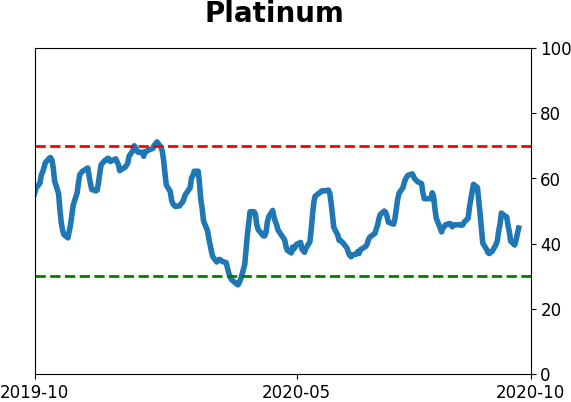
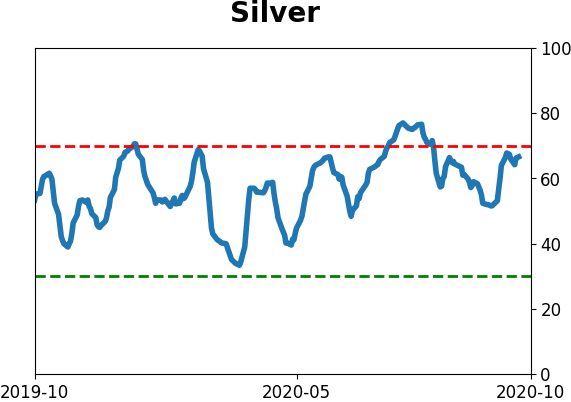
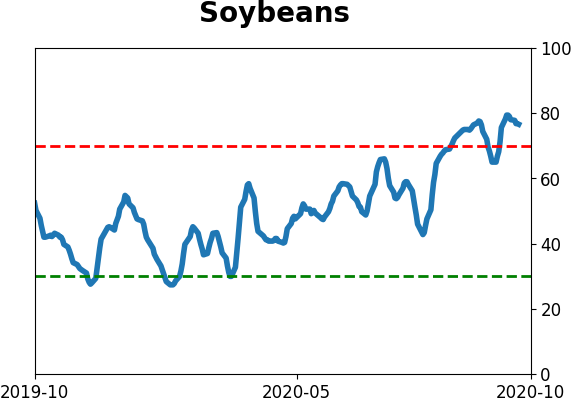
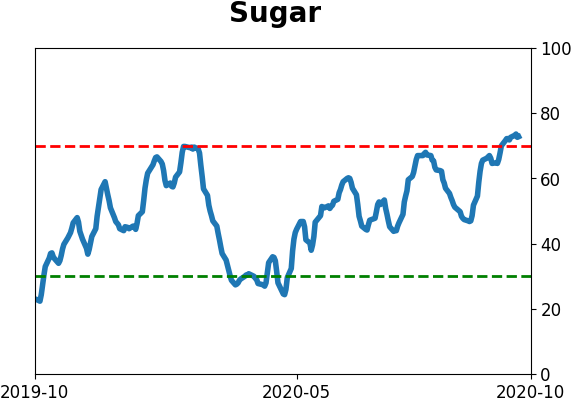
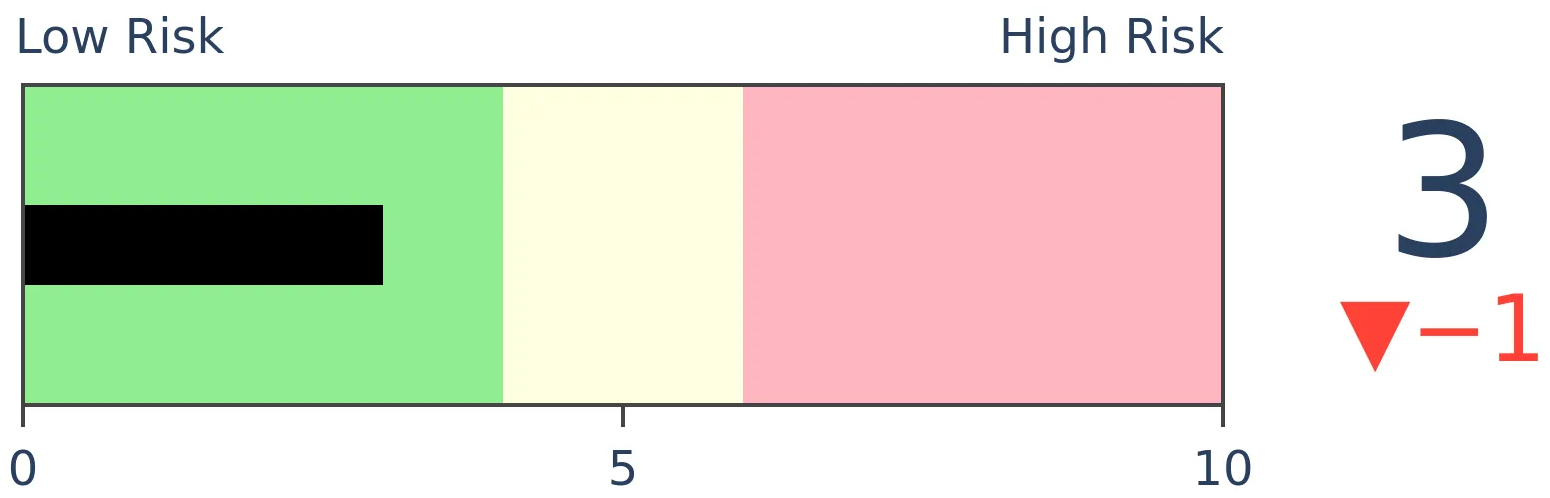
The latest Commitments of Traders report was released, covering positions through Tuesday: The 3-Year Min/Max Screen shows mostly the same trends in "smart money" positioning as prior weeks. Large, commercial hedgers continue to accumulate multi-year or record short exposure against many commodity contracts such as soybeans, sugar, and natural gas. Their exposure against commodities in general and agriculture in particular continue to move to new extremes. They started to reverse their shorts in 10-year Treasury futures but have a long way to go before even hitting neutral. In stocks, there was essentially no movement as they held a net short position worth about $37 billion.
Bottom Line:
- A positive environment favors becoming aggressive on signs of excessive pessimism.
|
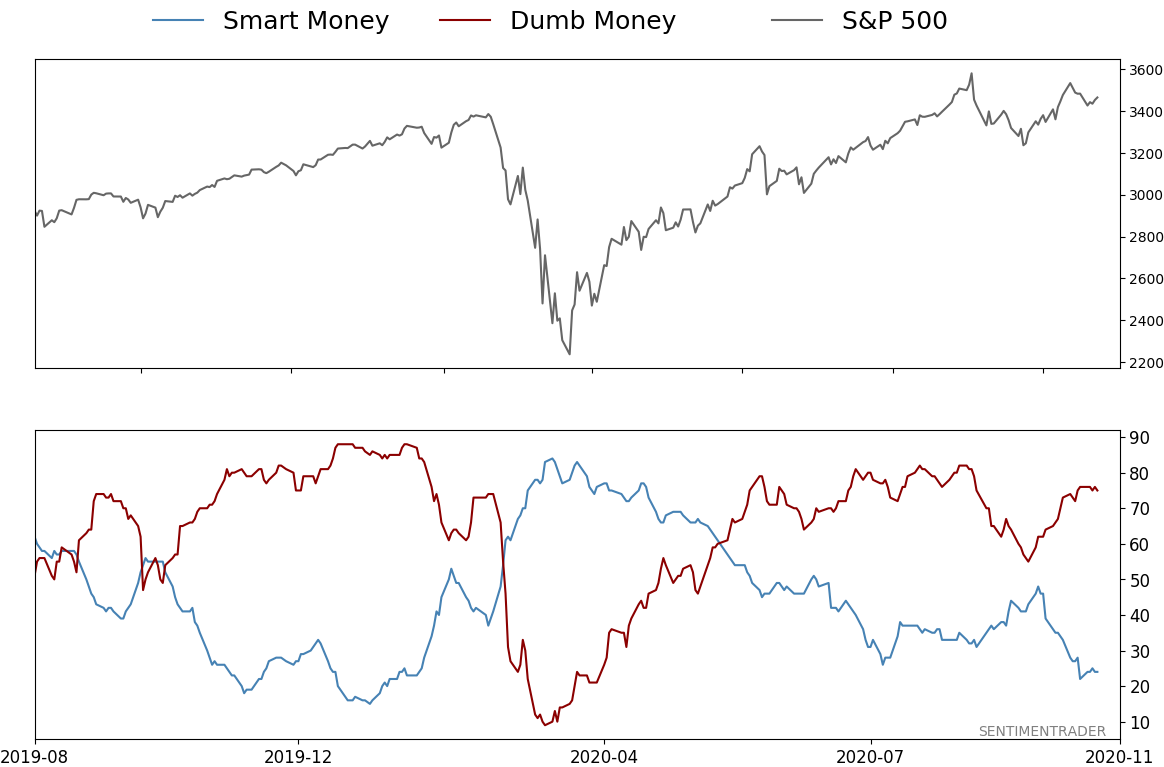
Smart / Dumb Money Confidence
|
Smart Money Confidence: 24%
Dumb Money Confidence: 75%
|
|
Risk Levels
Stocks Short-Term
|
Stocks Medium-Term
|
|
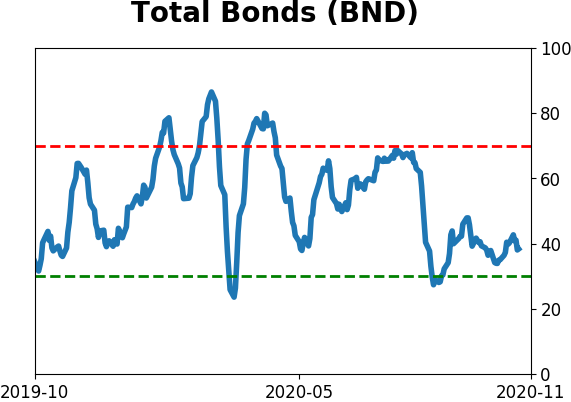
Bonds
|
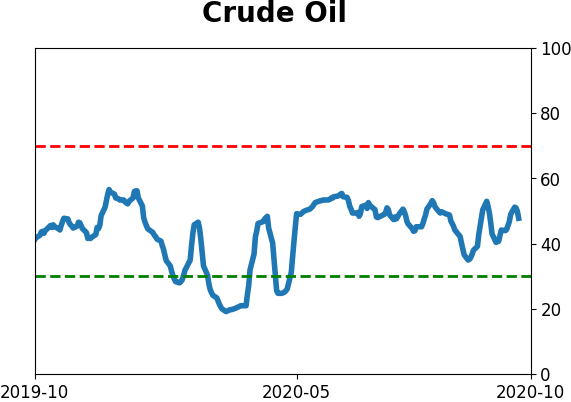
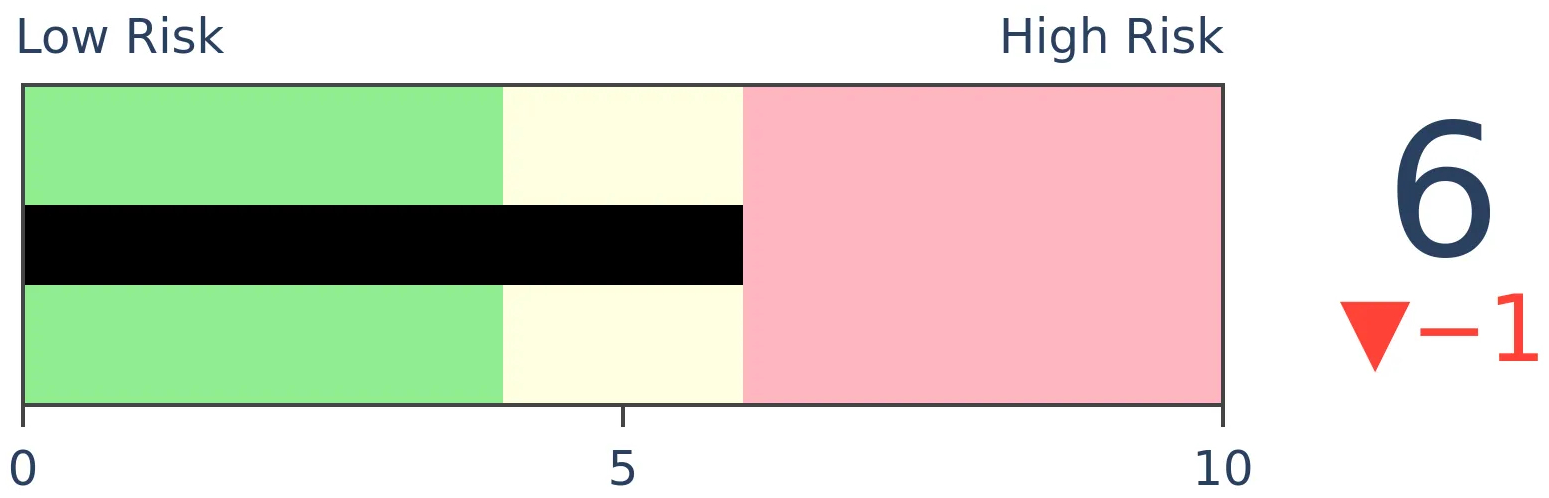
Crude Oil
|
|
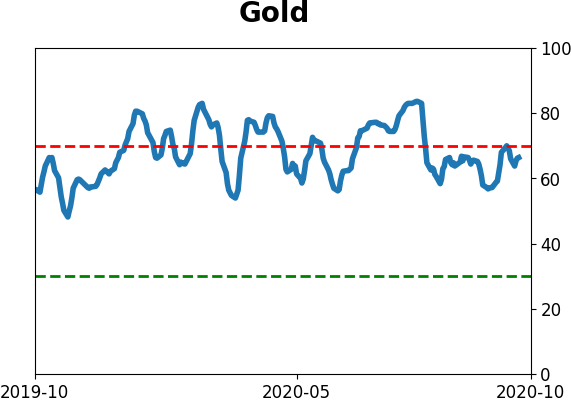
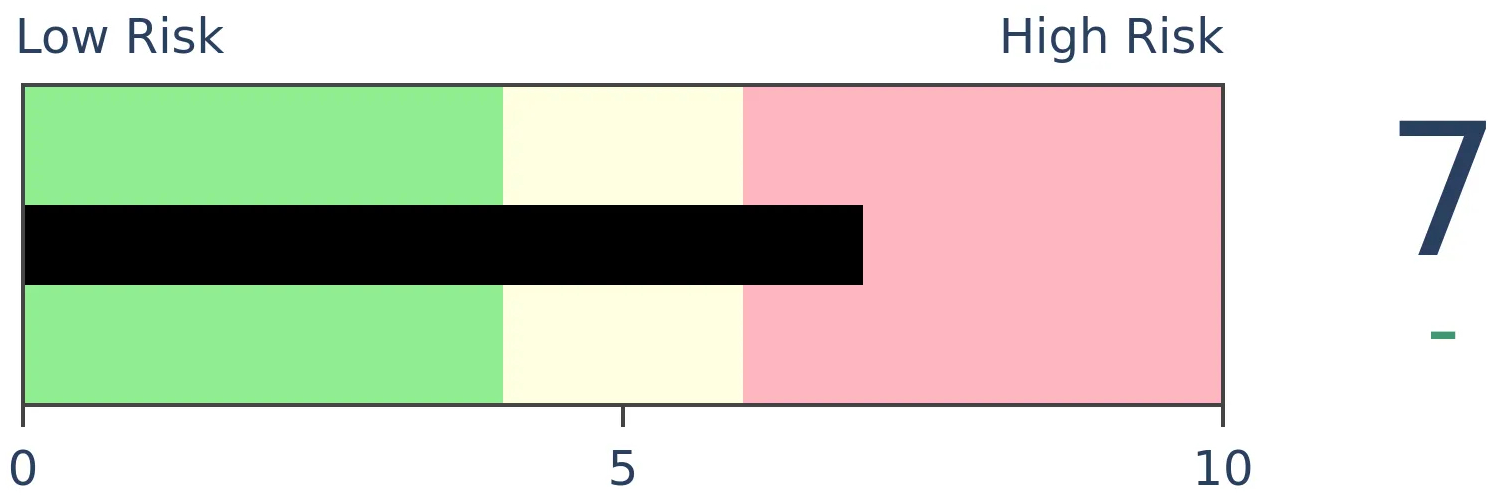
Gold
|
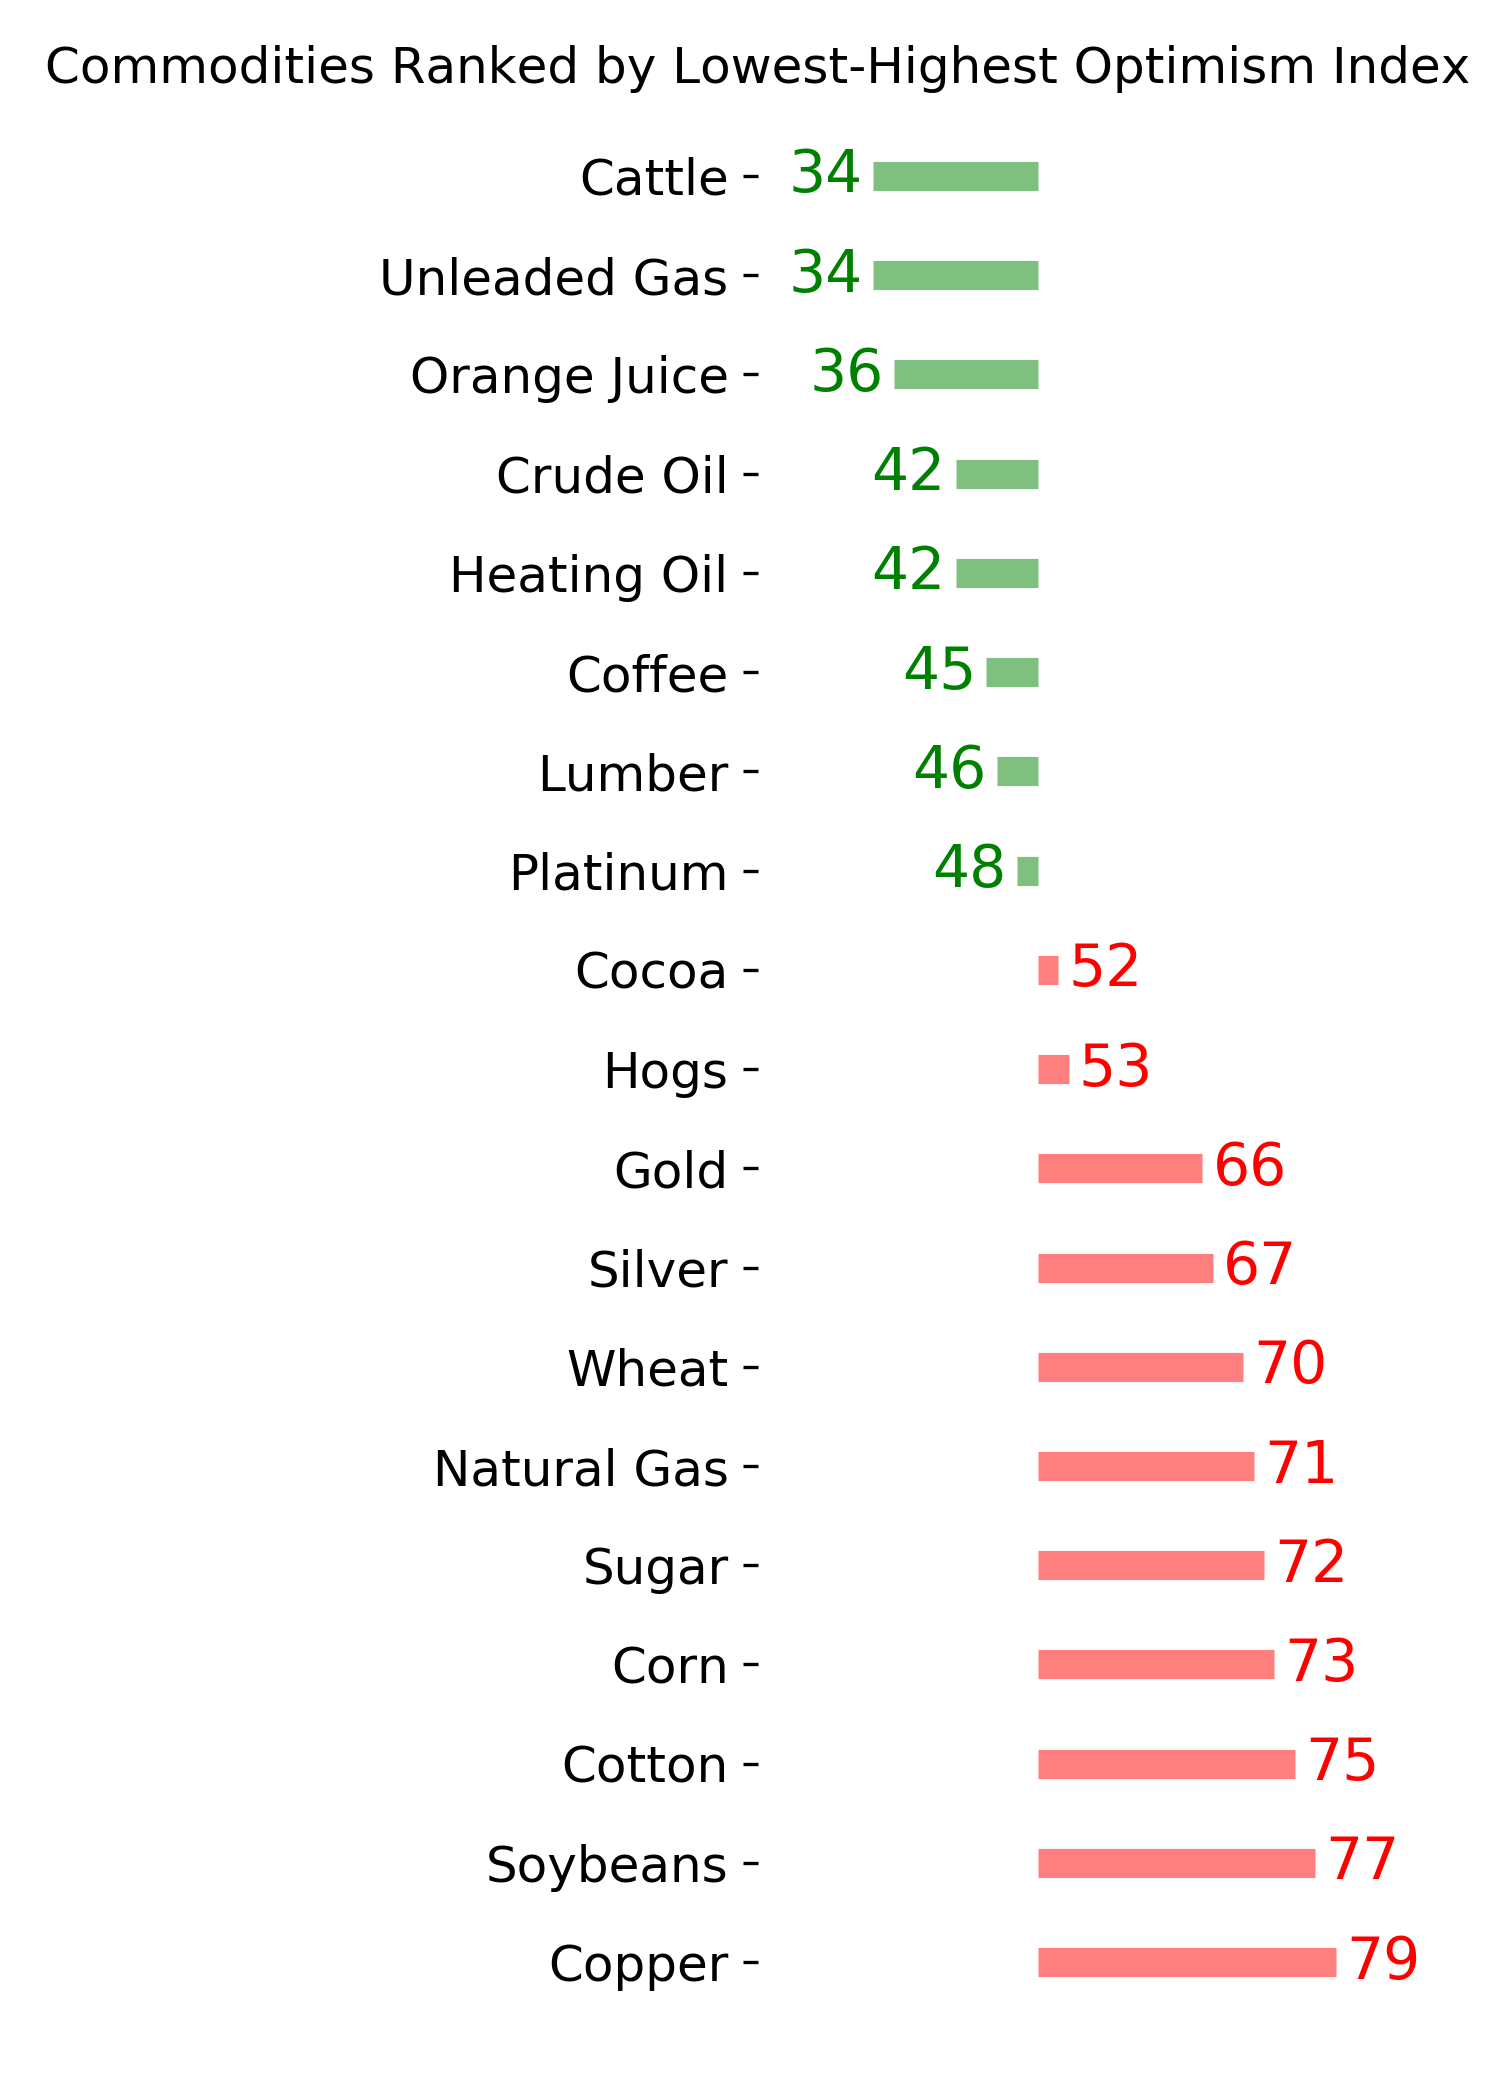
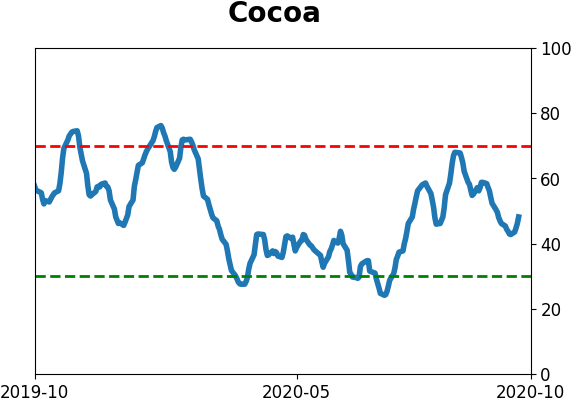
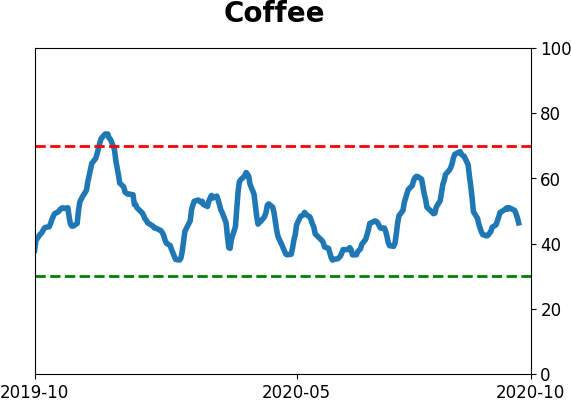
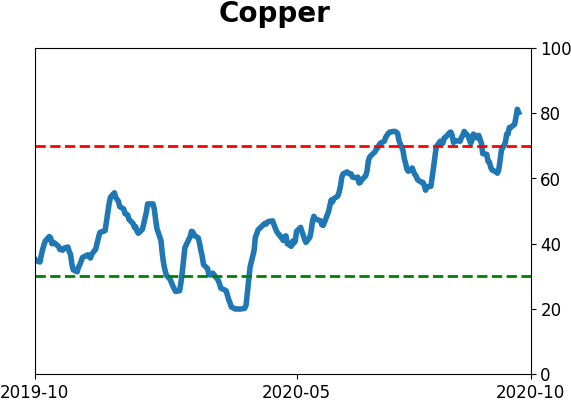
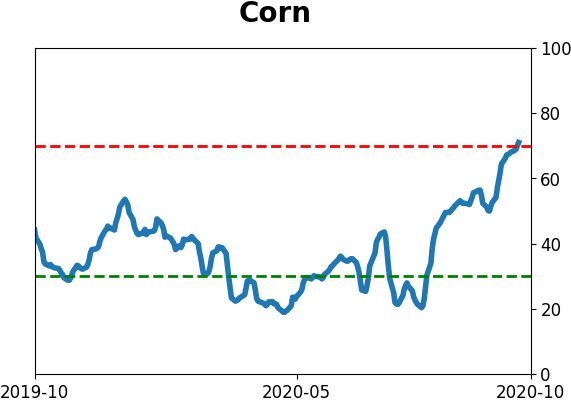
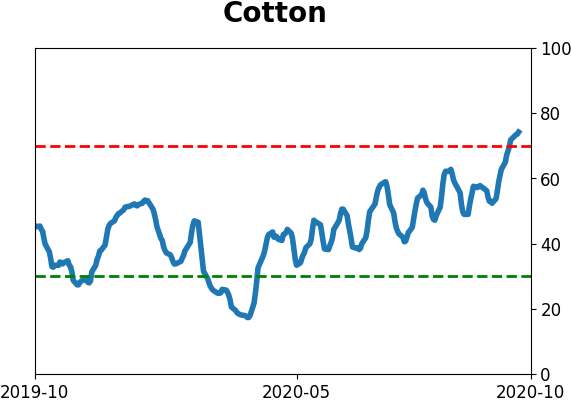
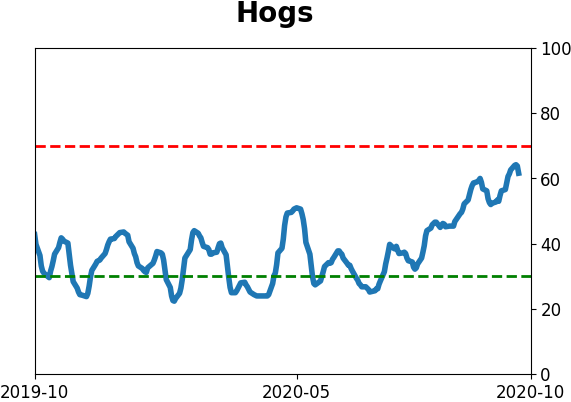
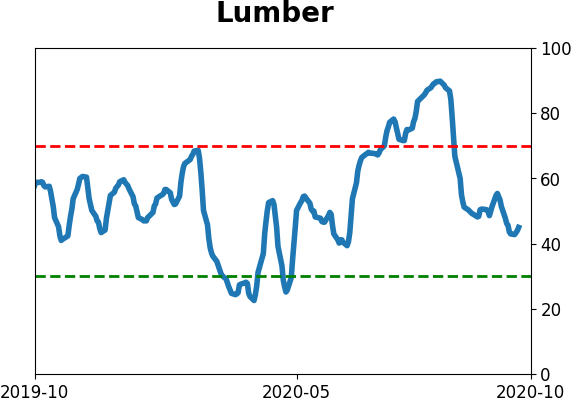
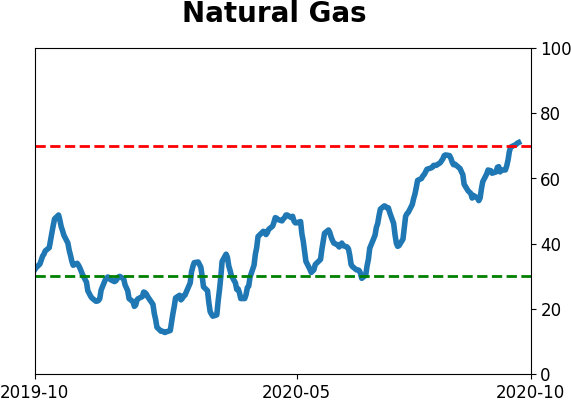
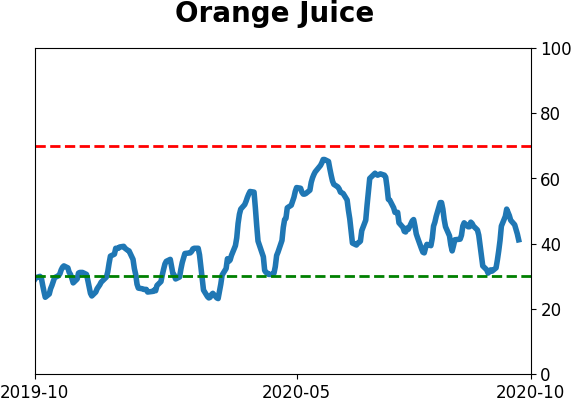
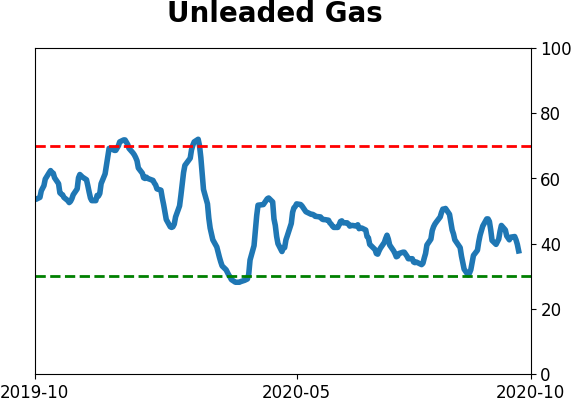
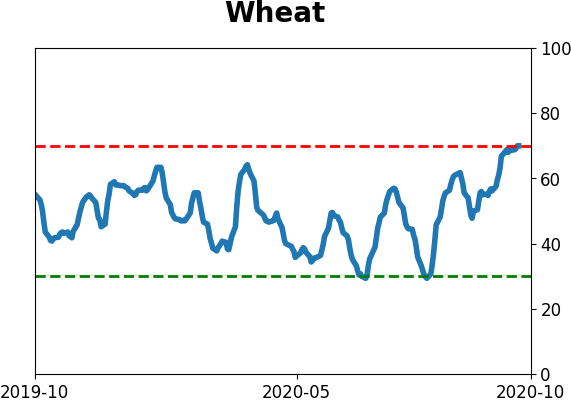
Agriculture
|
|
Research
BOTTOM LINE
In March, almost all U.S. energy companies had a share price below $5. It hasn't changed much since then. A majority have share prices even below $2. This is beyond any other extreme over the past 20 years.
FORECAST / TIMEFRAME
XLE -- Up, Long-Term
|
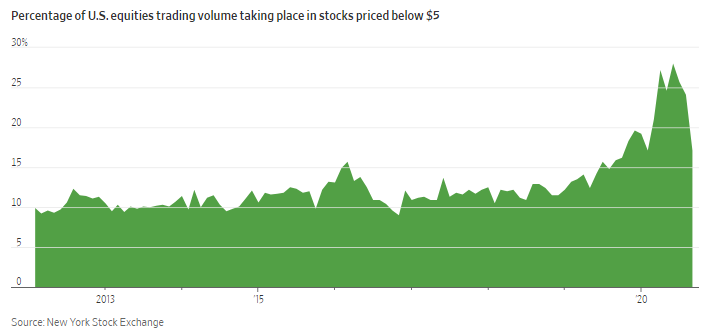
Thanks to free commissions and an increasingly democratized investing landscape, more and more trading activity has occurred in low-priced stocks.
As the Wall Street Journal notes, earlier this summer the volume in stocks priced below $5 more than doubled:
"Trading in speculative stocks with low share prices has surged this year, fueled by a huge influx of individuals using zero-commission investing apps and online brokerages. During several months this spring and summer, more than 25% of the shares traded in the U.S. stock market were in companies with a share price below $5, according to data from the New York Stock Exchange. From 2012 to 2019, that percentage mostly hovered between 10% and 15%, the NYSE data show."
We can see just how extreme this volume jumped in 2020.
One sector that has seen this increased volume flow is energy. Not because investors are in love with it, quite the contrary. Rather, it's because stocks in the sector have fallen so much that many of them have become cheap by default. Cheap in price, not necessarily valuation.
According to data compiled by Portfolio123, out of 663 U.S. listed stocks in the energy sector, 470 of them have a share price under $5.
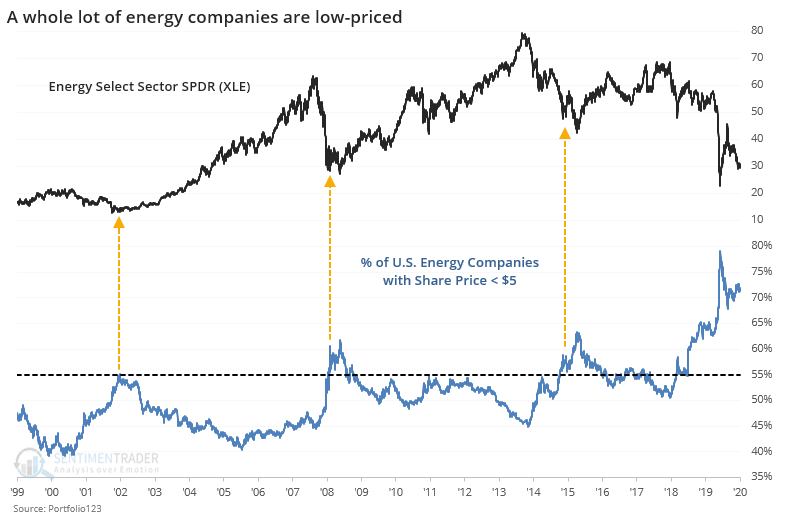
This is kind of insane. And it's down from a peak of nearly 80% of these companies in March. No other energy bust in the past 20+ years saw more than 65% of these firms with a share price under 5 bucks.
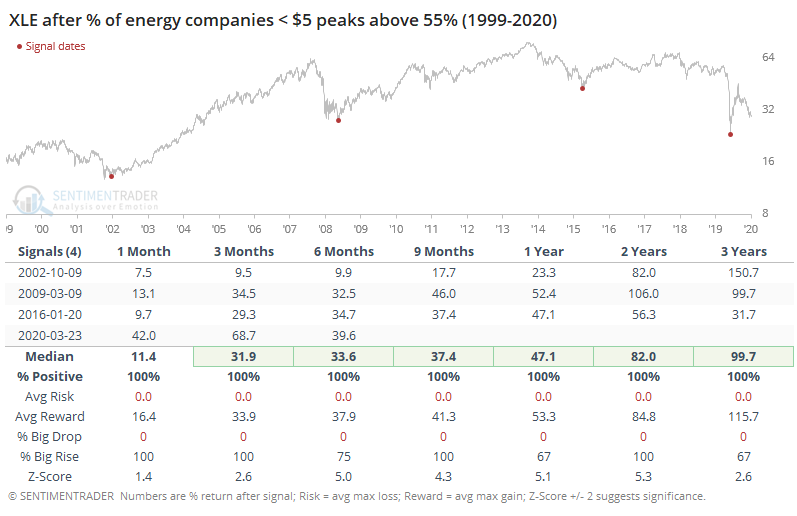
The only other times when there was a peak with more than 55% of energy companies below $5, the long-term returns in XLE were abnormally positive.
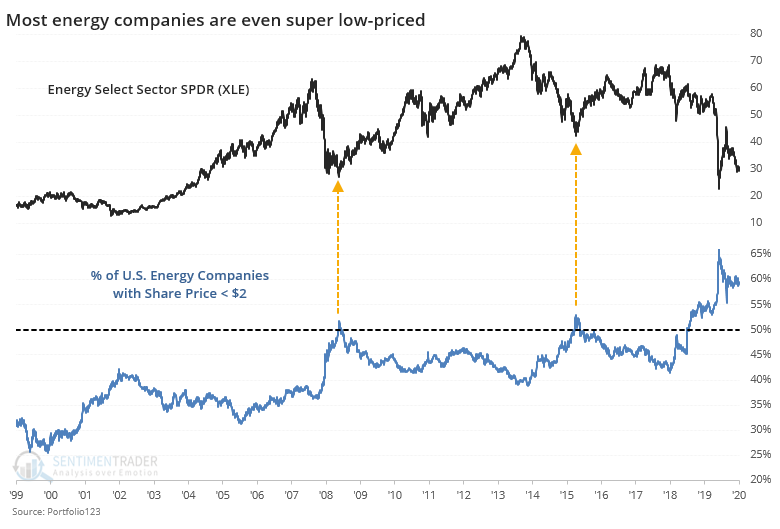
 It gets even more extreme. More than 390 of them have shares that you could buy with a 2 dollar bill.
Again, forward returns were heavily skewed to the positive after peaks above 50%.
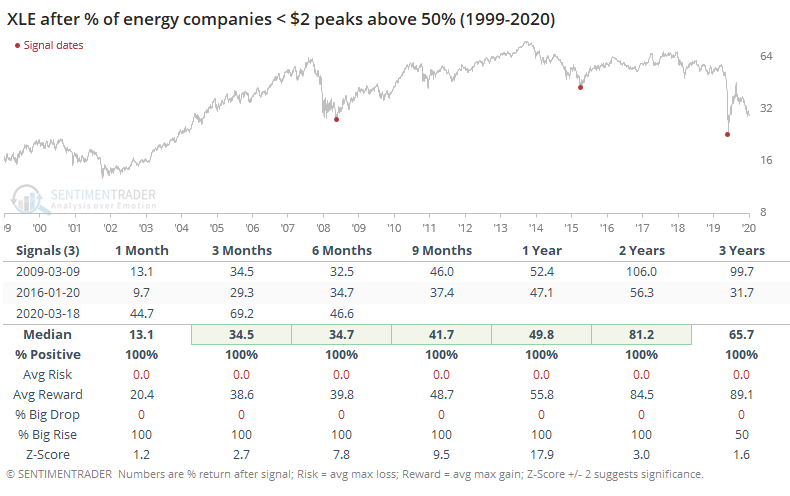
This appears absurdly positive for long-term returns in many of these shares.
The biggest caveats are that the 2020 readings are so extreme that there's simply no real precedent over the available data history. And even though these shares became low-priced to an extreme degree in the summer of 2019, the sector continued to suffer tremendous selling pressure, unlike the last two times when it marked the ends of the bear markets.
BOTTOM LINE
There has been a sudden and large increase in implied volatility in bond options. While this concerns some investors who worry about this bleeding into the stock market, historically a quick rise in bond volatility has not done so. There was a consistent pattern of the VIX dropping in the months ahead, while stocks rose.
FORECAST / TIMEFRAME
None
|
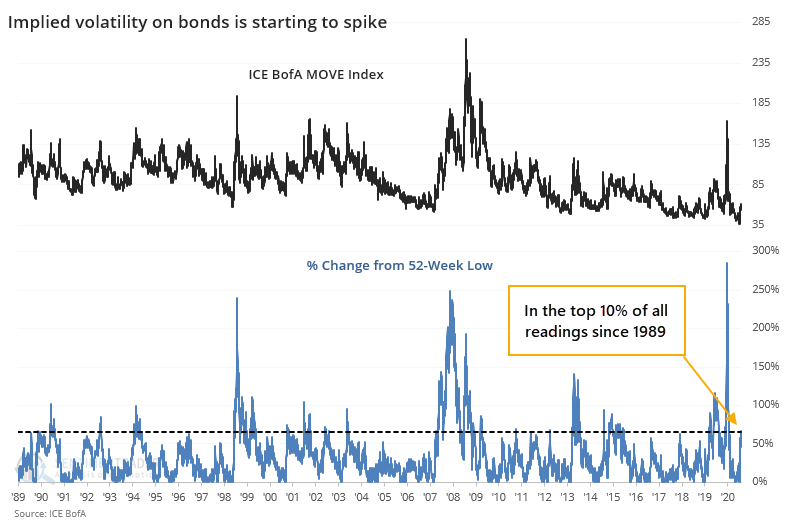
The world is awash in debt, it's only getting worse, and many investors seem to think that this is where the next great crisis will arise.
Within the bond market, it's been relatively smooth sailing. Volatility has been exceptionally low, and options traders were recently pricing in a record amount of calm.
But after the ICE BofA MOVE Index of bond implied volatility hit a record low on September 29, it has spiked more than 65%. That's a relatively large jump for this index in a relatively short amount of time.
If we go back over the past 30+ years and look for other times when there was a sudden spike in bond implied volatility from a 52-week low, then we can see that it typically did not result in even higher volatility going forward.
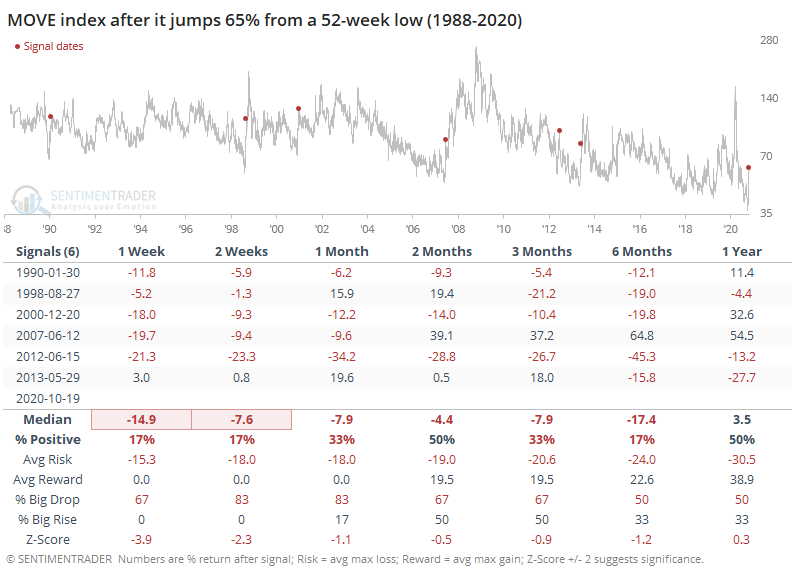
Across all time frames, the MOVE index declined most of the time. On a shorter-term basis, there was a strong tendency for lower volatility to get priced in, as well as over the next 3-6 months. Only once, in June 2007, did an initial drop in the MOVE index precede a large, sustained rise in the months ahead.
For bond prices, which move opposite to yields, it was a mixed sign.
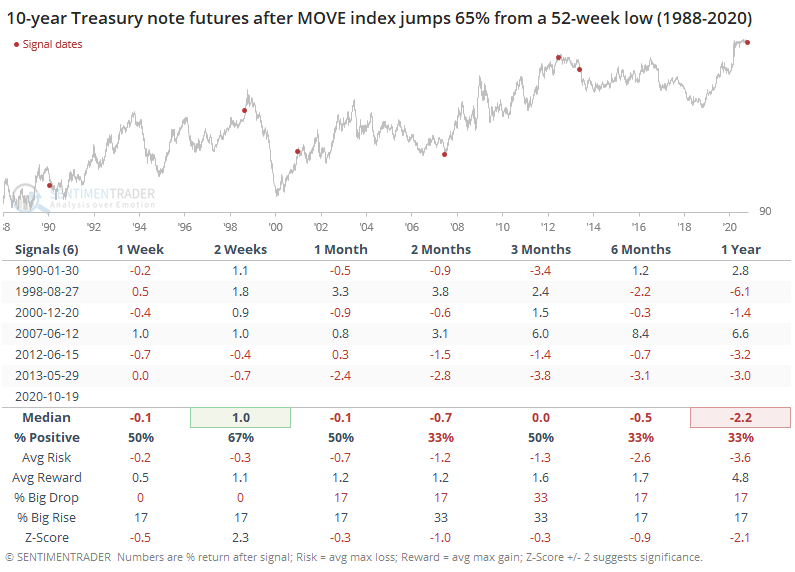
Even though implied volatility tended to decline after these spikes, it didn't necessarily help bond prices to rise, at least not consistently. Over the next 2 months, there were only 2 gains and 4 losses.
These jumps in bond volatility almost never ended up bleeding over into implied volatility for stocks.
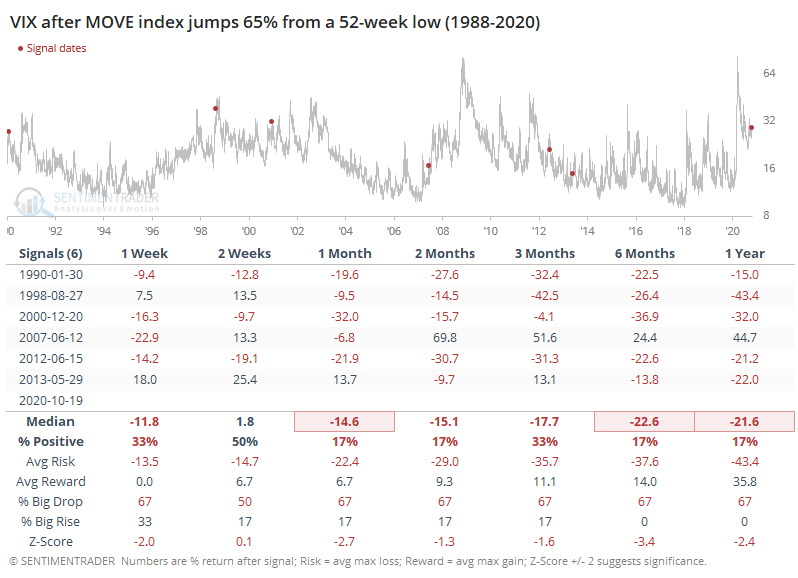
In some respects, when traders got nervous about renewed volatility in bonds, it ended up being even more negative for implied volatility in stocks. This is the exact opposite of the concern that's currently percolating.
These declines in the VIX were due in large part to a rising stock market.
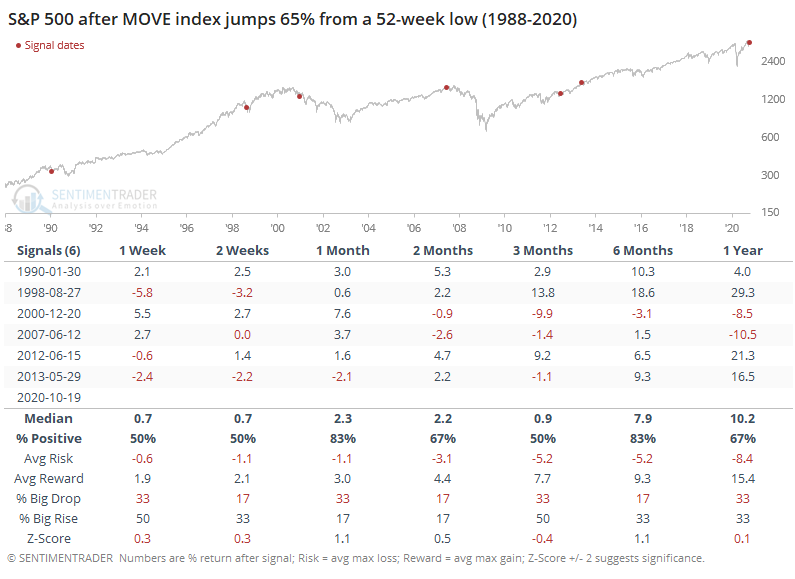
While forward returns in the S&P 500 weren't dramatic, they were mostly positive. Either 1 or 2 months later, the S&P showed a gain every time. It's not like there was no risk, but it was relatively contained and was smaller than the reward.
Of course, this time is different from the others. It always is. And maybe the debt load will prove to be crushing, and this initial rise in bond volatility will give way to a total breakdown of the most important market in the world, ultimately freezing credit and crashing stocks. All we can say so far is that other times bond traders have suddenly woken up to the potential for increased volatility, it didn't lead to much.
Active Studies
| Time Frame | Bullish | Bearish | | Short-Term | 0 | 0 | | Medium-Term | 4 | 8 | | Long-Term | 48 | 2 |
|
Indicators at Extremes
Portfolio
| Position | Description | Weight % | Added / Reduced | Date | | Stocks | 15.6% RSP, 10.1% VWO, 7.5% XLE, 5.1% PSCE | 38.2 | Added 5% | 2020-10-15 | | Bonds | 10% BND, 10% SCHP, 10% ANGL | 29.7 | Reduced 0.1% | 2020-10-02 | | Commodities | GCC | 2.4 | Reduced 2.1%
| 2020-09-04 | | Precious Metals | GDX | 4.7 | Added 5% | 2020-09-09 | | Special Situations | | 0.0 | Reduced 5% | 2020-10-02 | | Cash | | 25.0 | | |
|
Updates (Changes made today are underlined)
After the September swoon wrung some of the worst of the speculation out of stocks, there are some signs that it's returning, especially in the options market. It's helped to push Dumb Money Confidence above 70%. A big difference between now and August is that in August, there was a multitude of days with exceptionally odd breadth readings. Some of the biggest stocks were masking underlying weakness. Combined with heavy speculative activity, it was a dangerous setup. Now, we've seen very strong internal strength, in the broad market, as well as tech and small-cap stocks. Prior signals almost invariably led to higher prices. That's hard to square with the idea that forward returns tend to be subdued when Confidence is high, but that's less reliable during healthy market conditions, which we're seeing now (for the most part). I added some risk with small-cap energy stocks, due to an increasing number of positive signs in both small-caps and energy. This is intended as a long-term position.
RETURN YTD: 0.0% 2019: 12.6%, 2018: 0.6%, 2017: 3.8%, 2016: 17.1%, 2015: 9.2%, 2014: 14.5%, 2013: 2.2%, 2012: 10.8%, 2011: 16.5%, 2010: 15.3%, 2009: 23.9%, 2008: 16.2%, 2007: 7.8%
|
|
Phase Table
Ranks
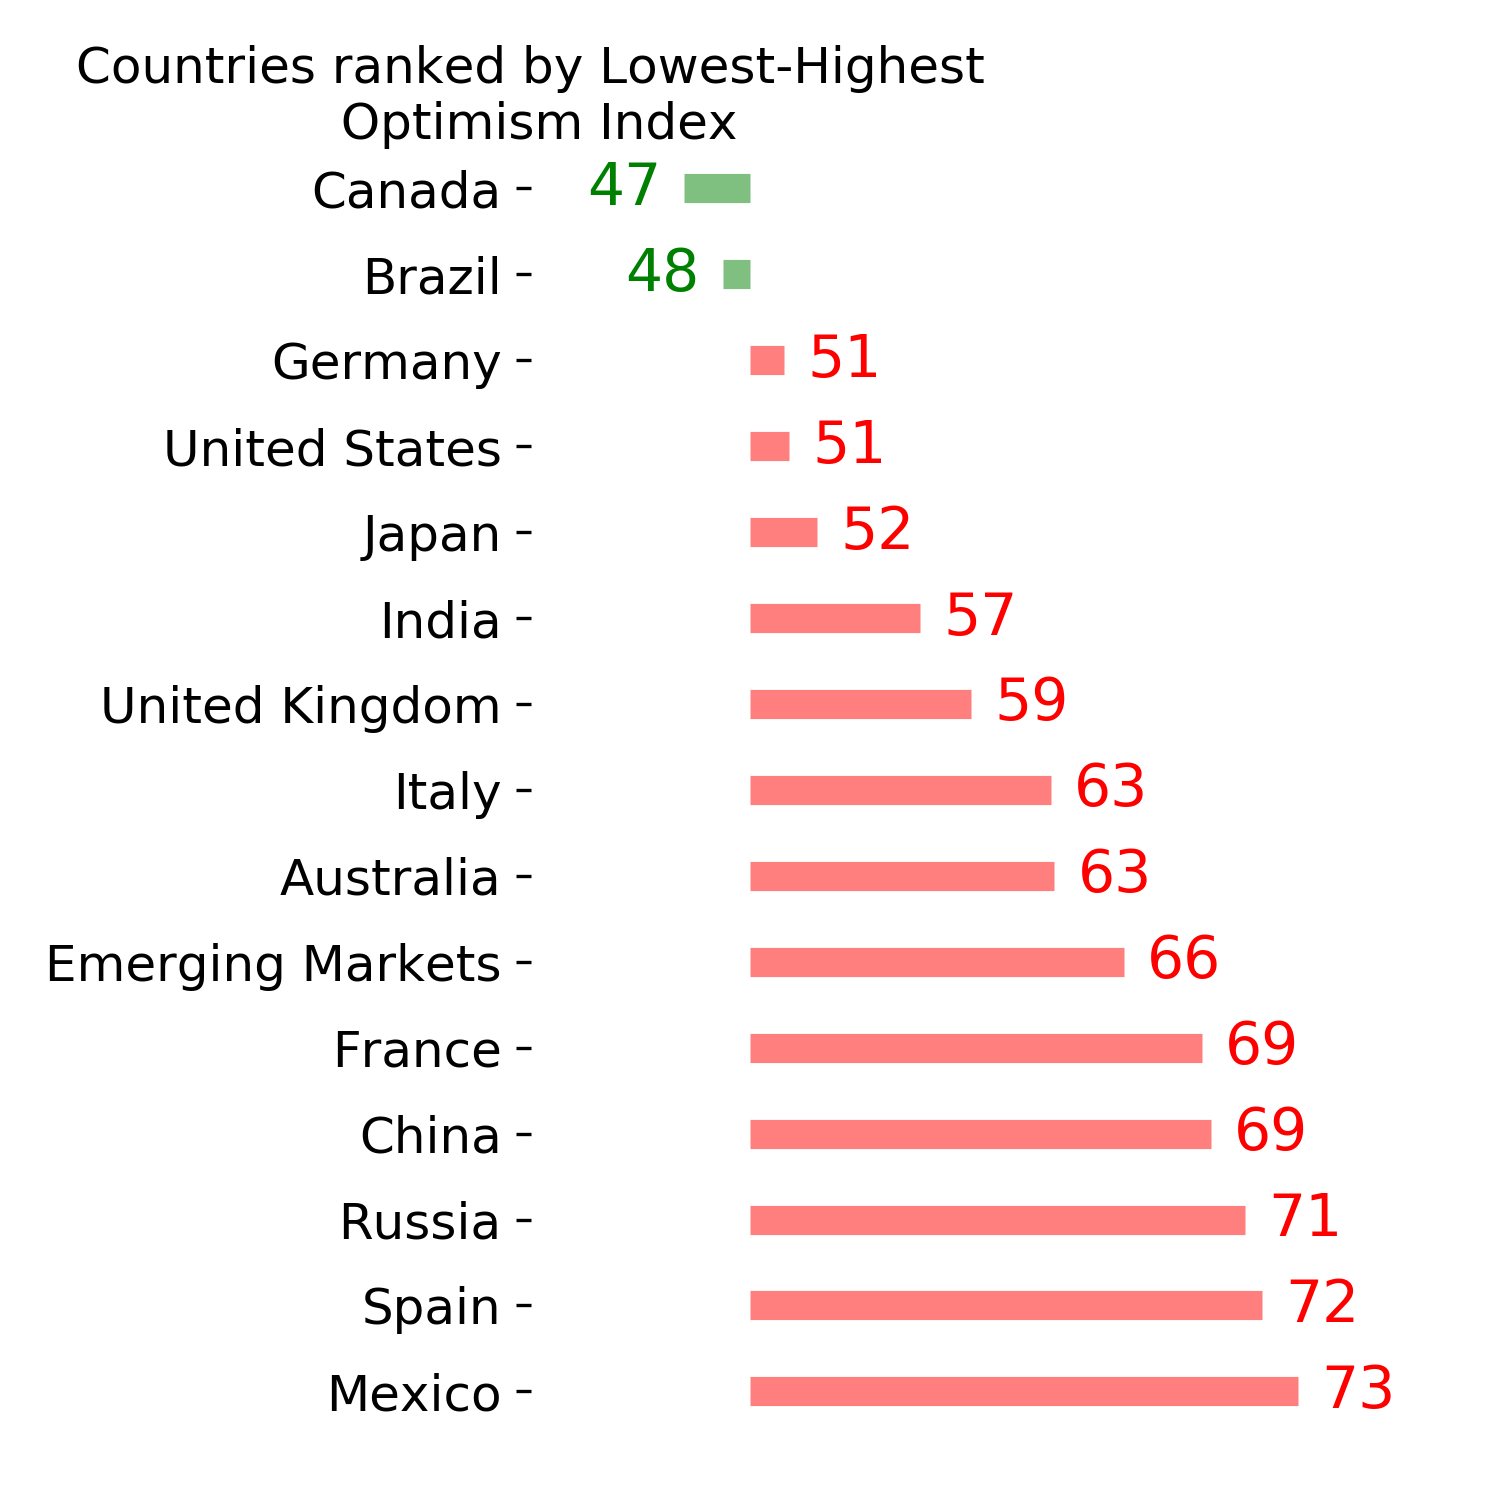
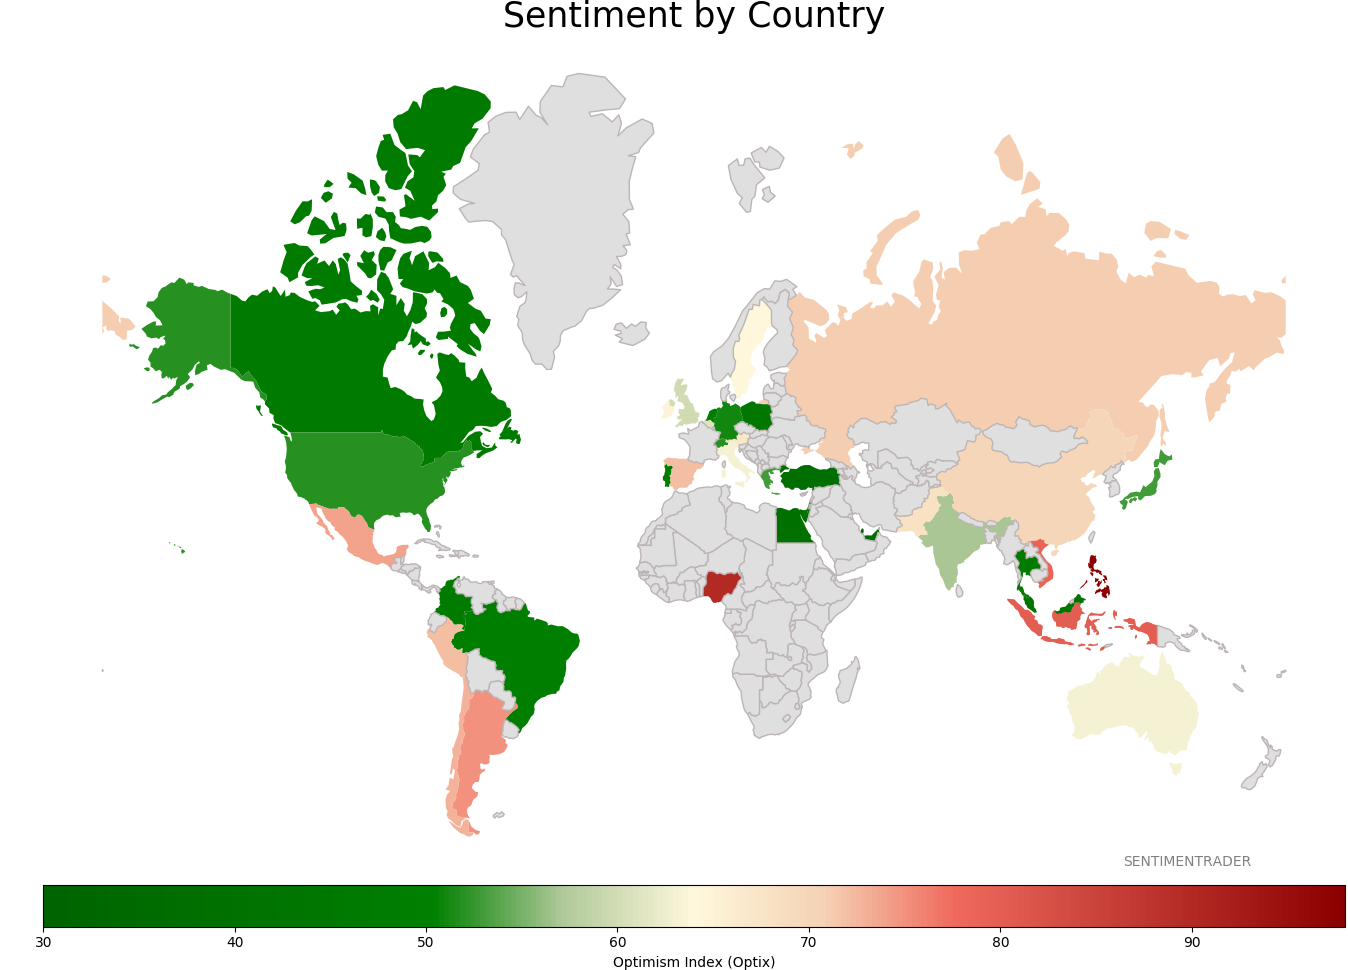
Sentiment Around The World
Optimism Index Thumbnails
|
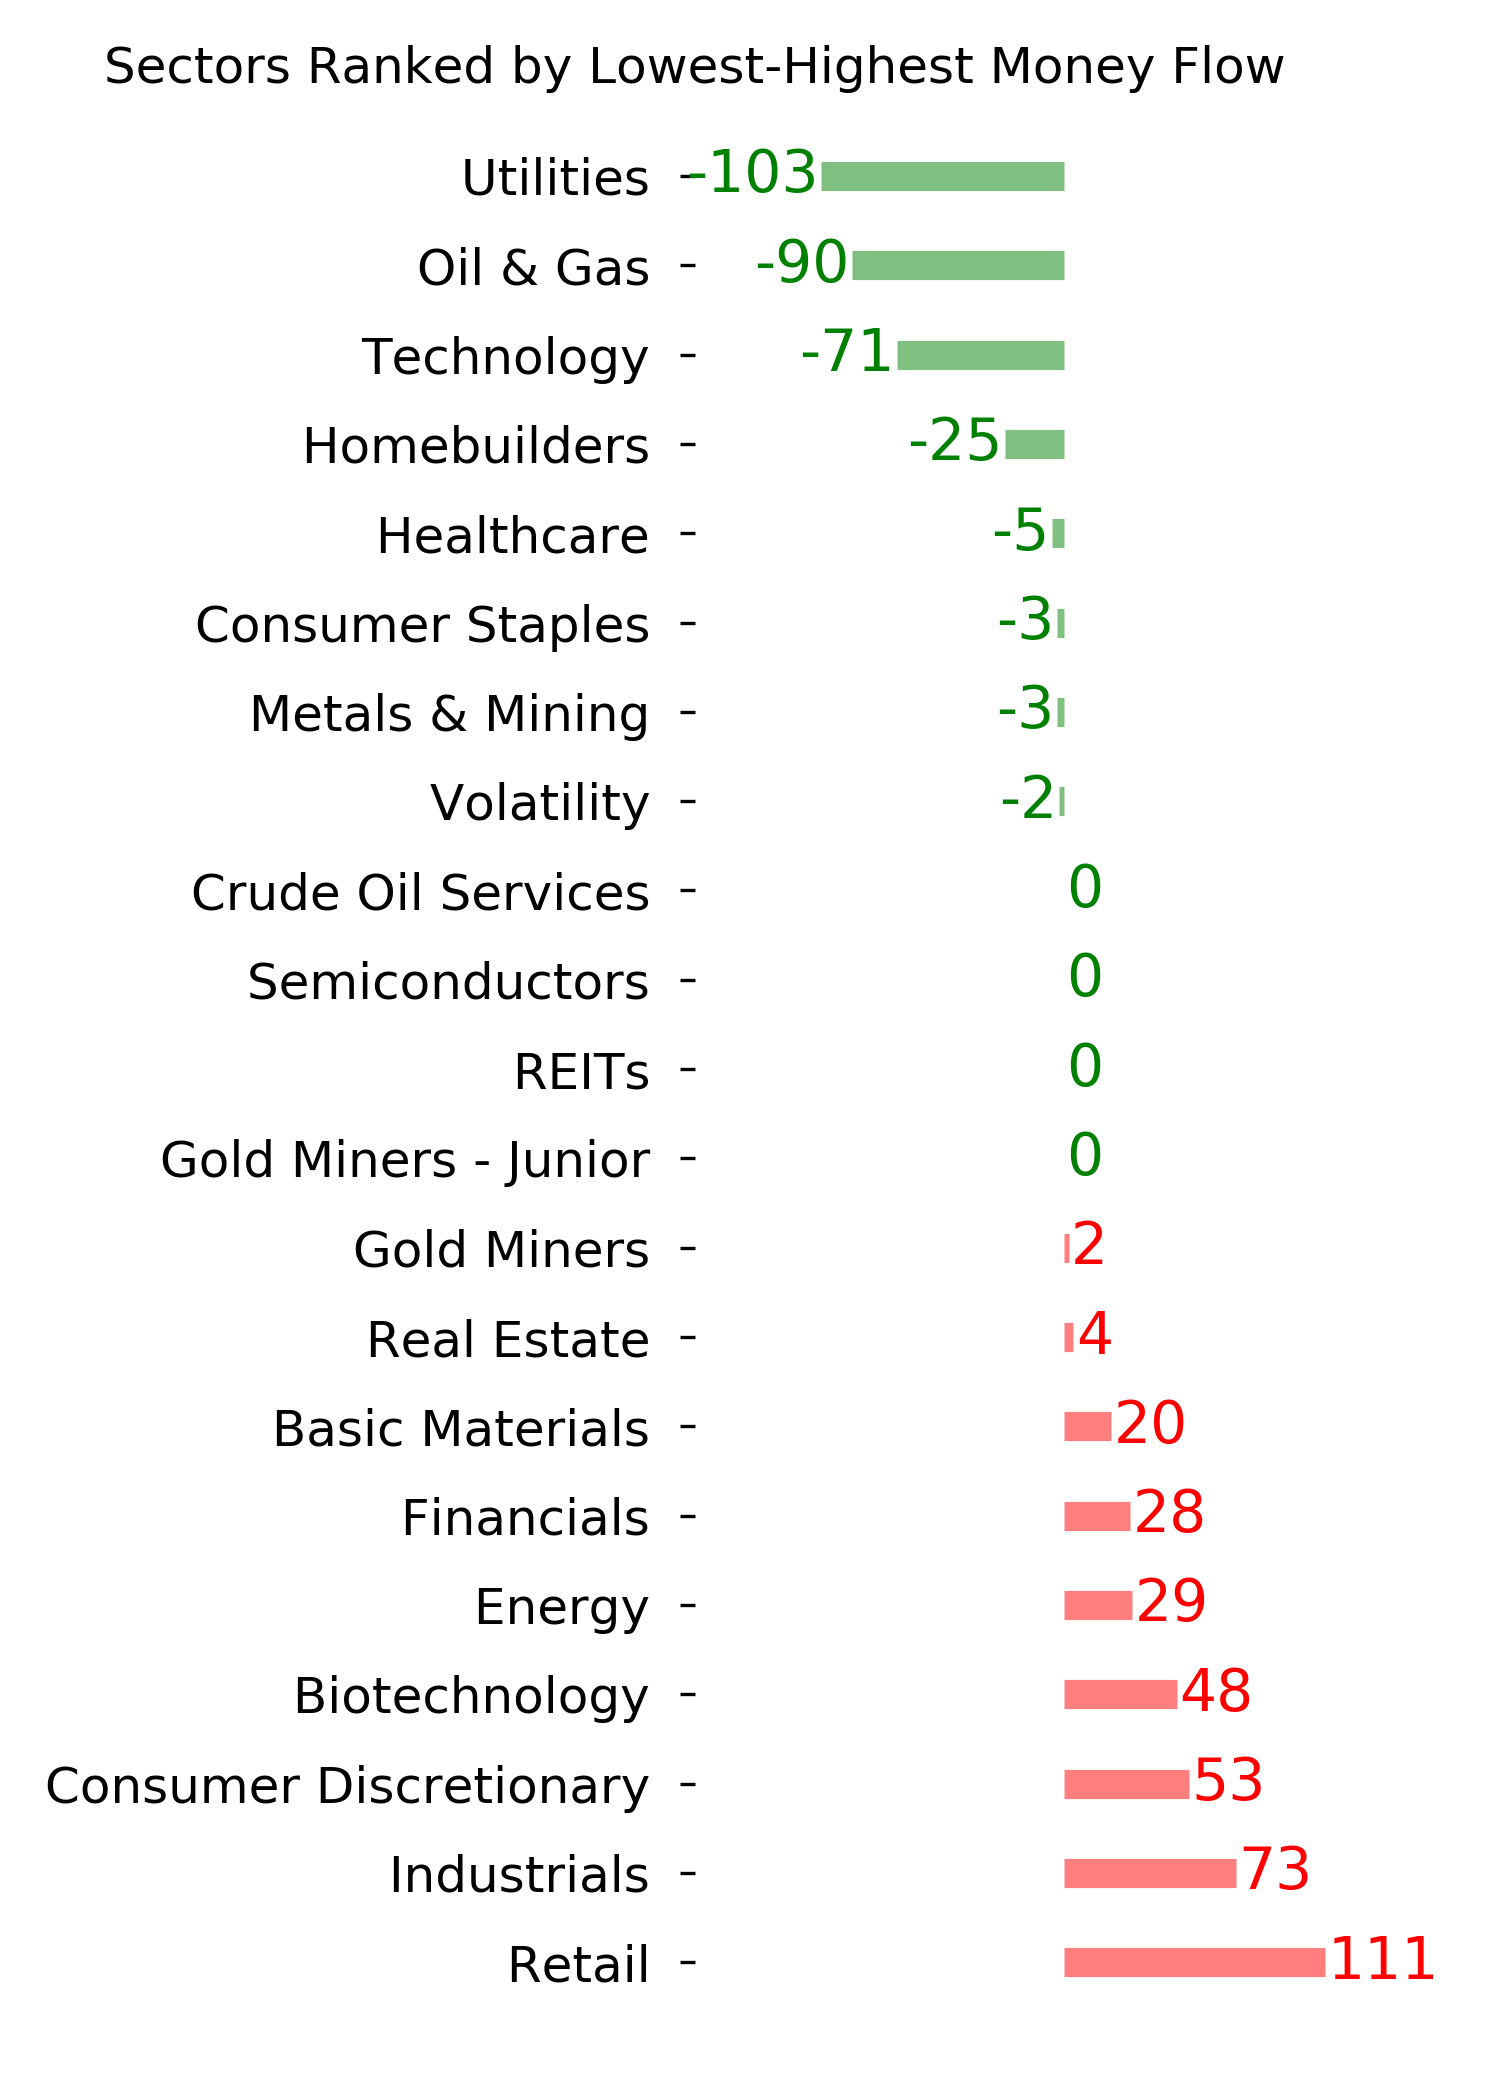
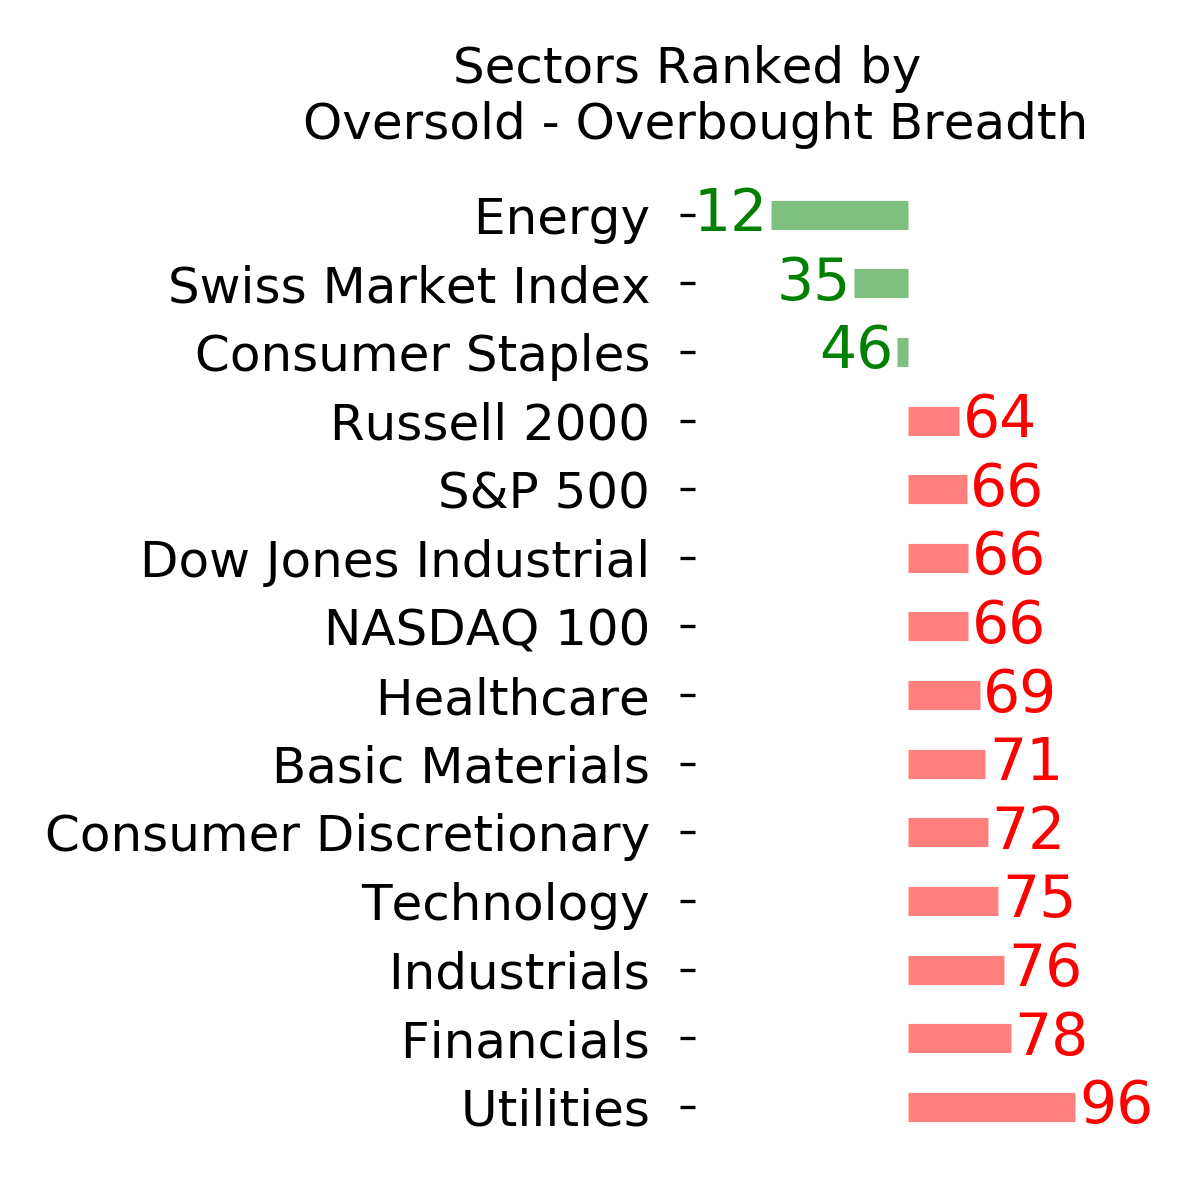
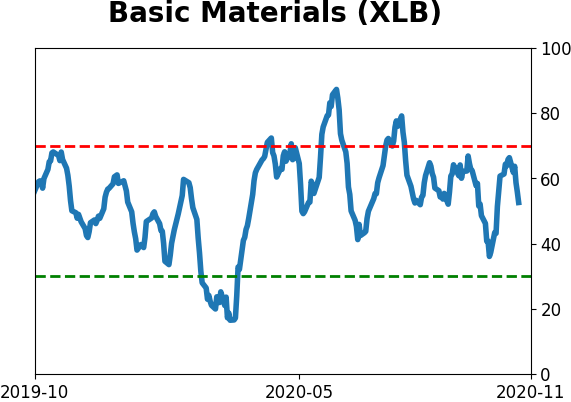
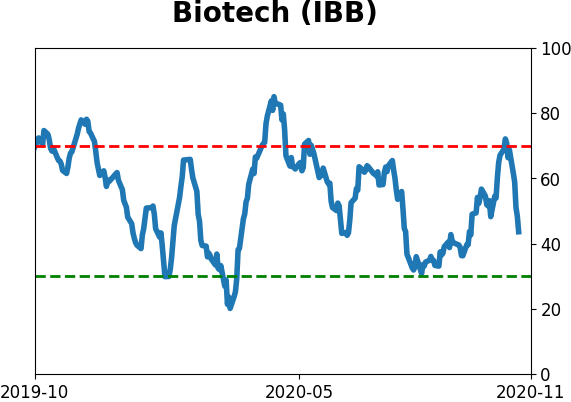
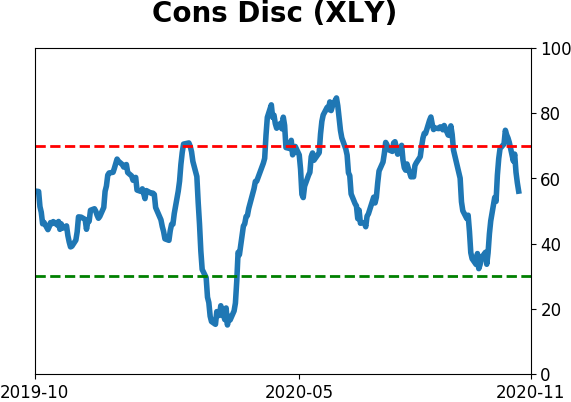
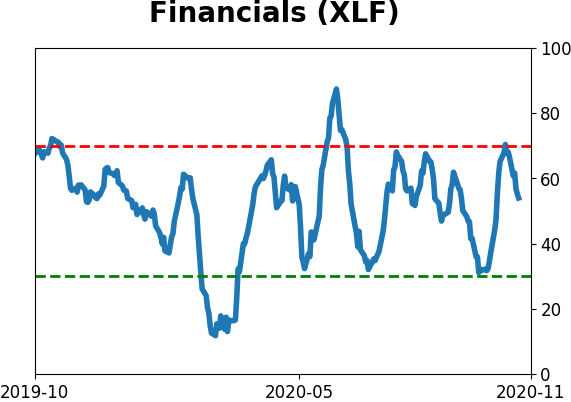
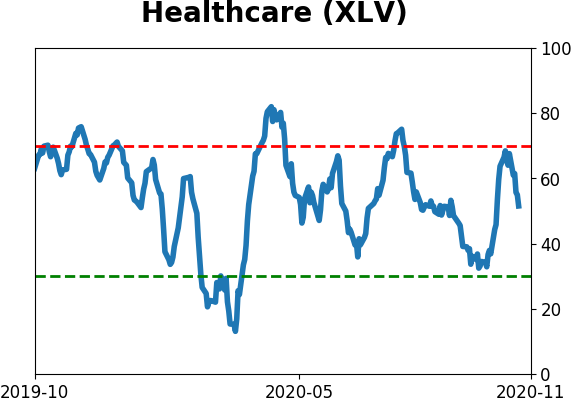
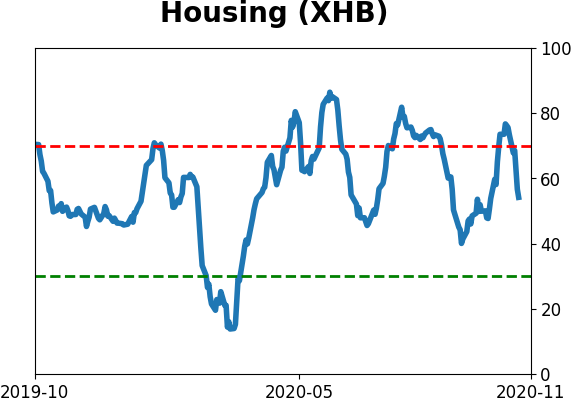
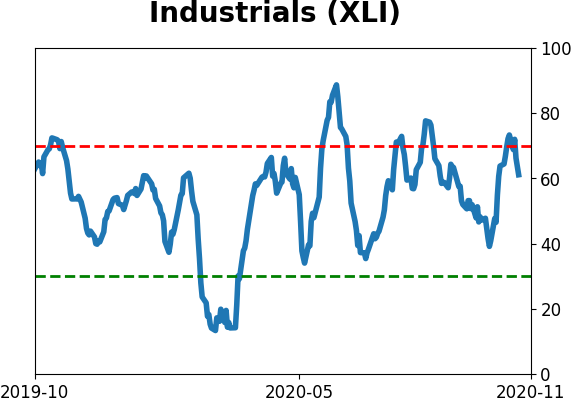
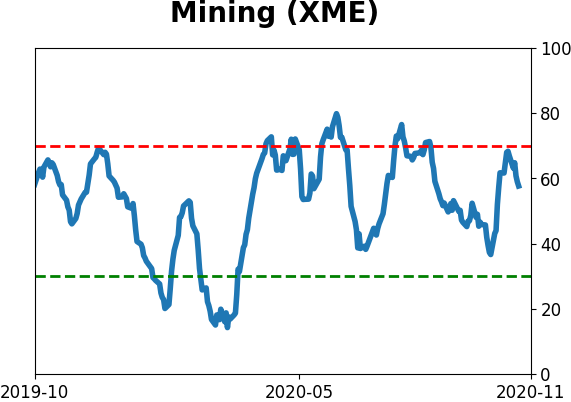
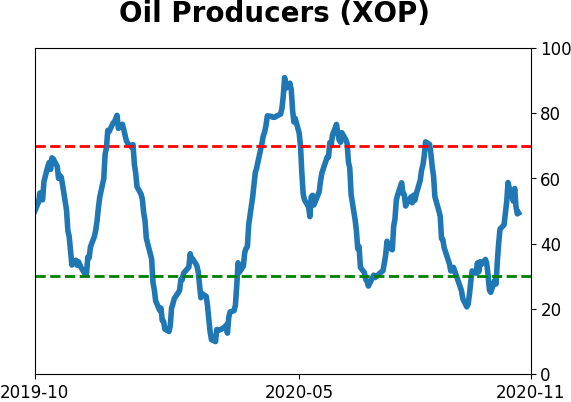
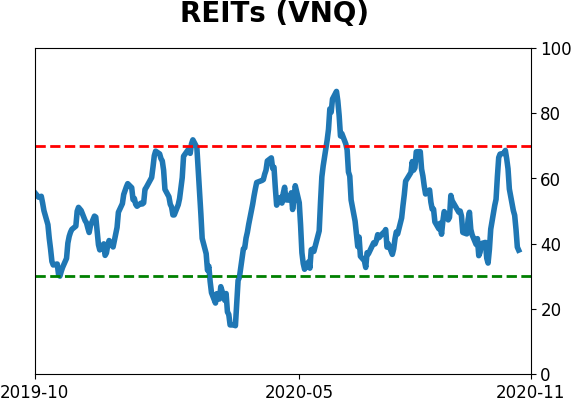
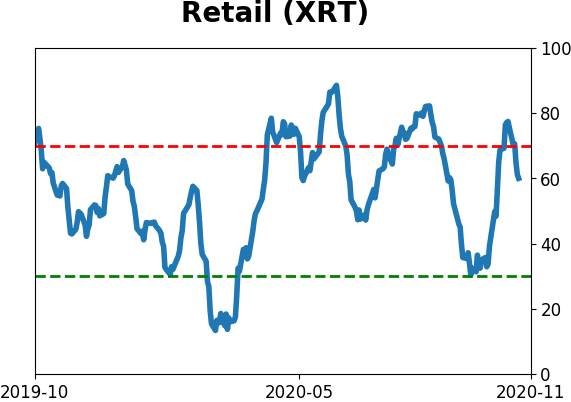
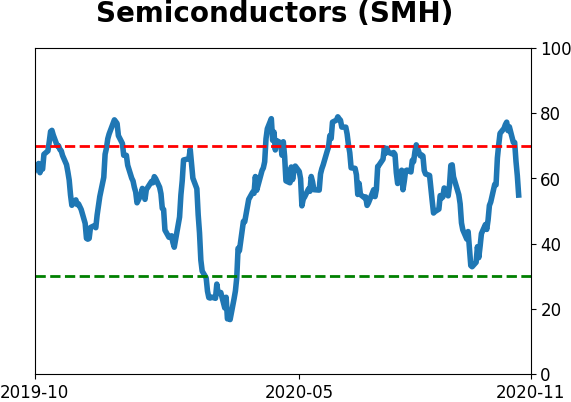
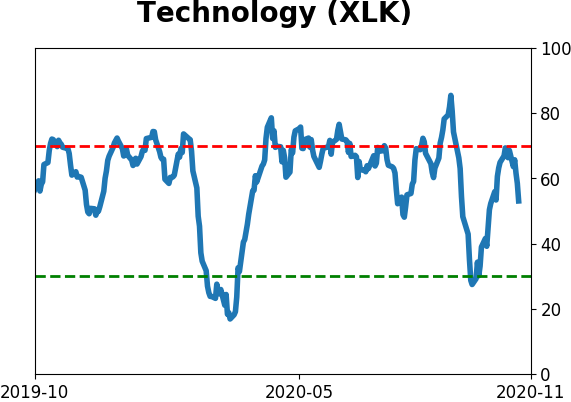
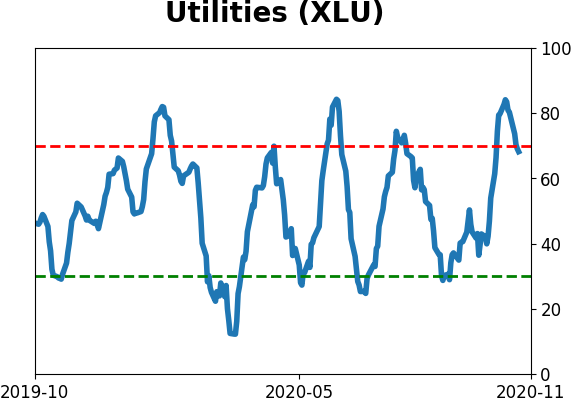
Sector ETF's - 10-Day Moving Average
|
|
|
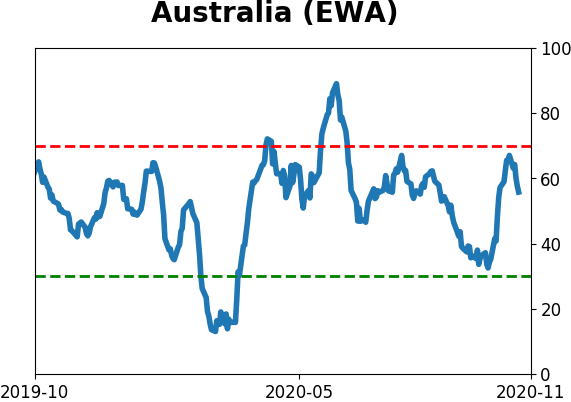
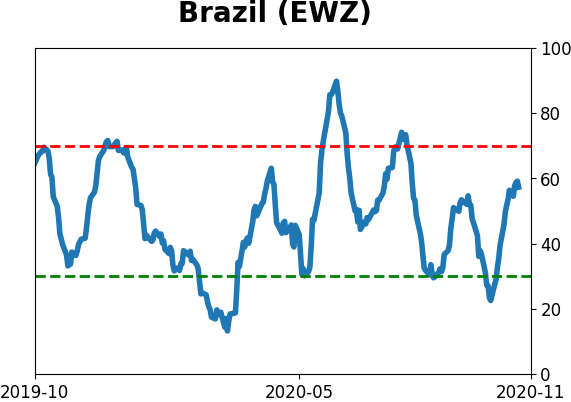
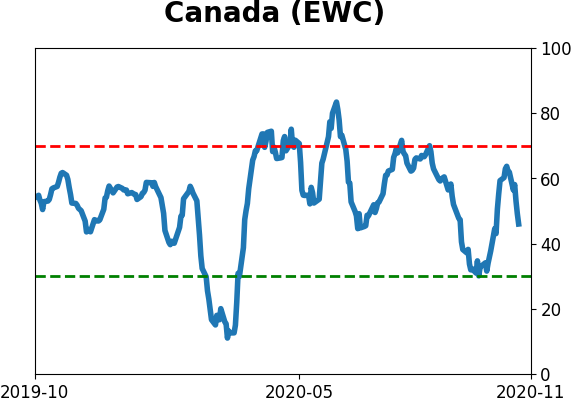
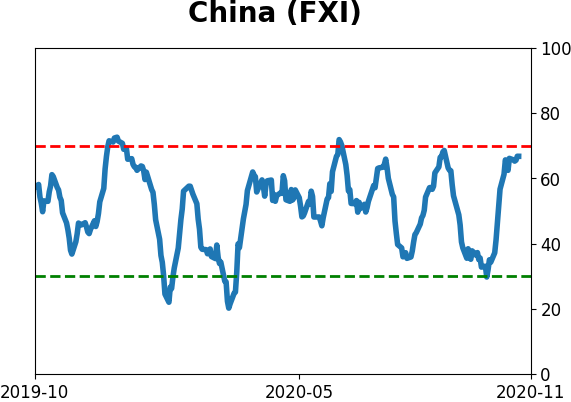
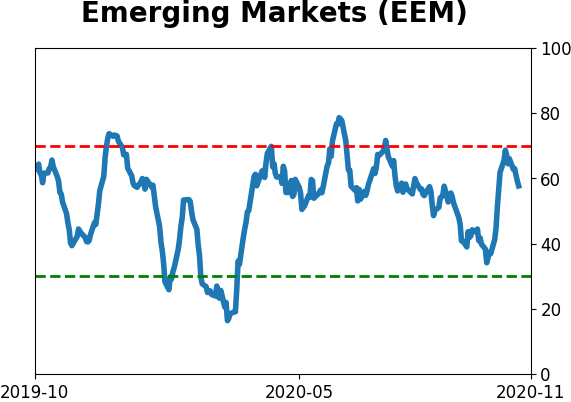
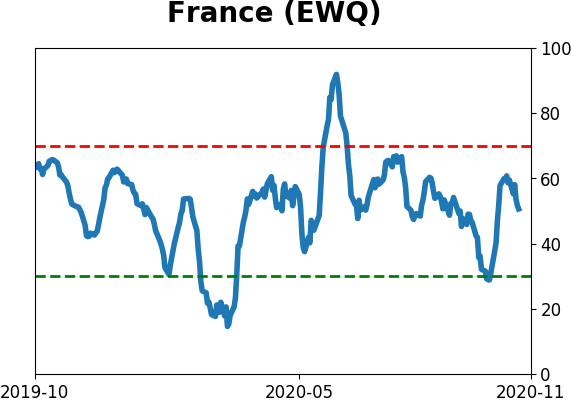
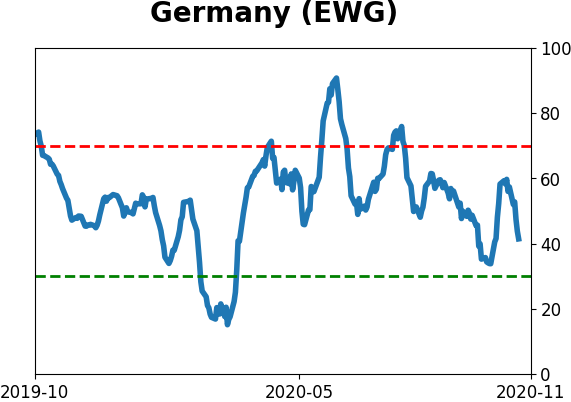
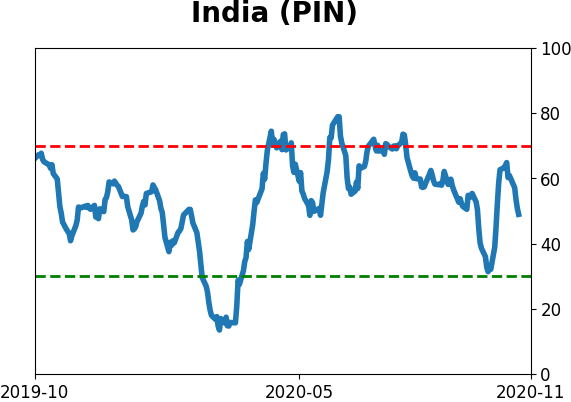
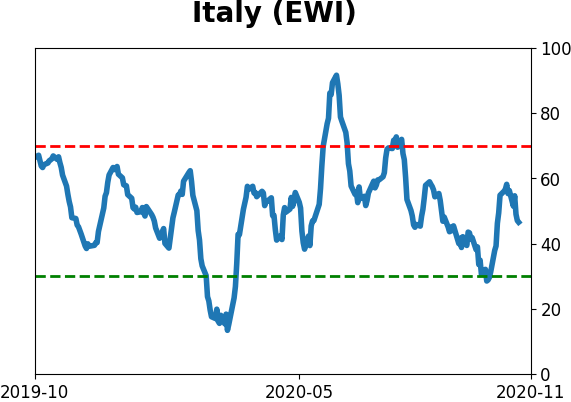
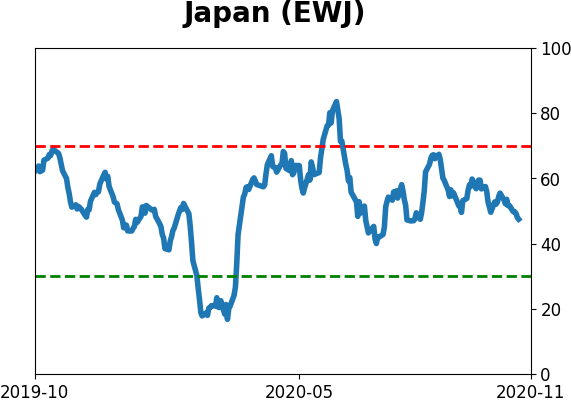
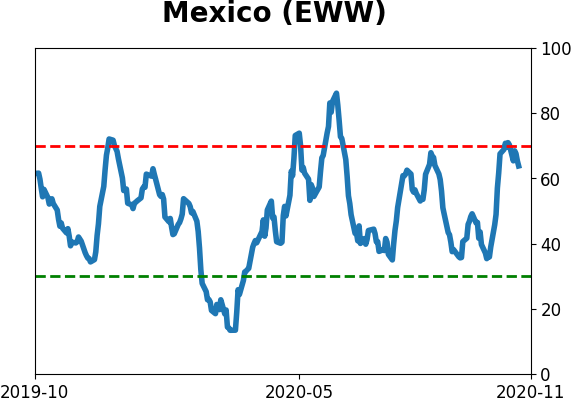
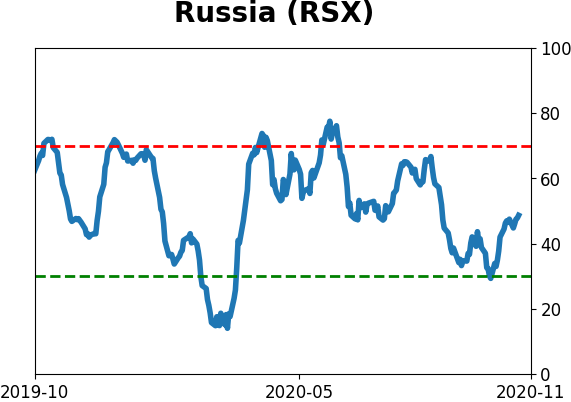
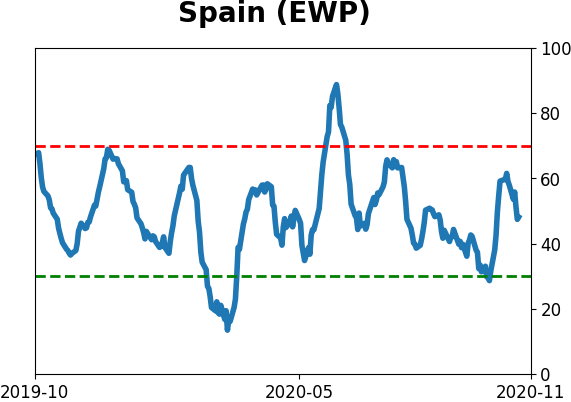
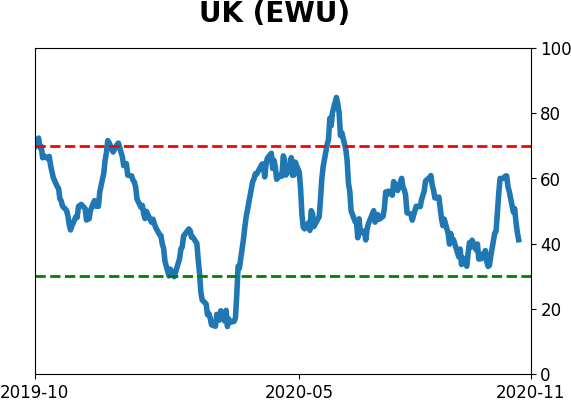
Country ETF's - 10-Day Moving Average
|
|
|
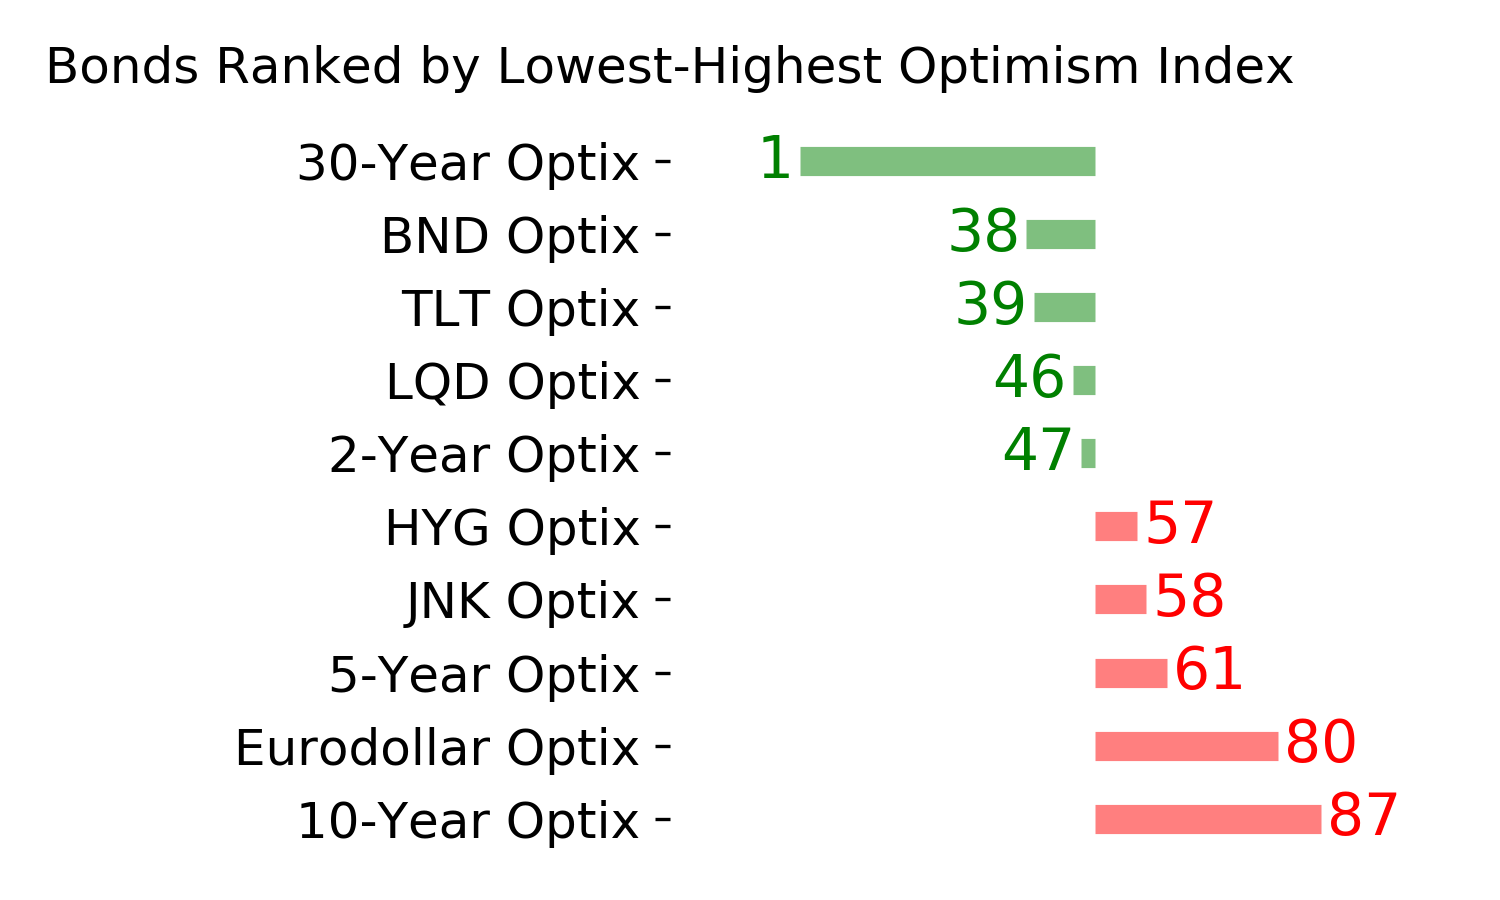
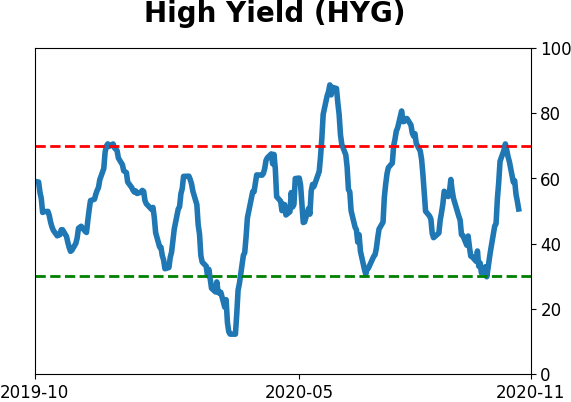
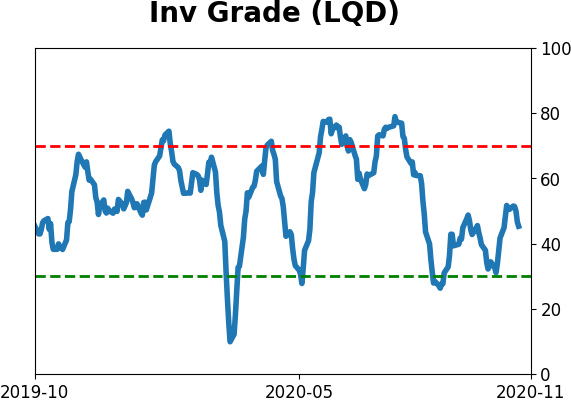
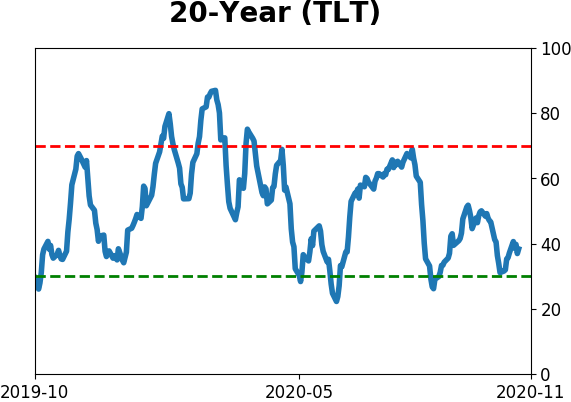
Bond ETF's - 10-Day Moving Average
|
|
|
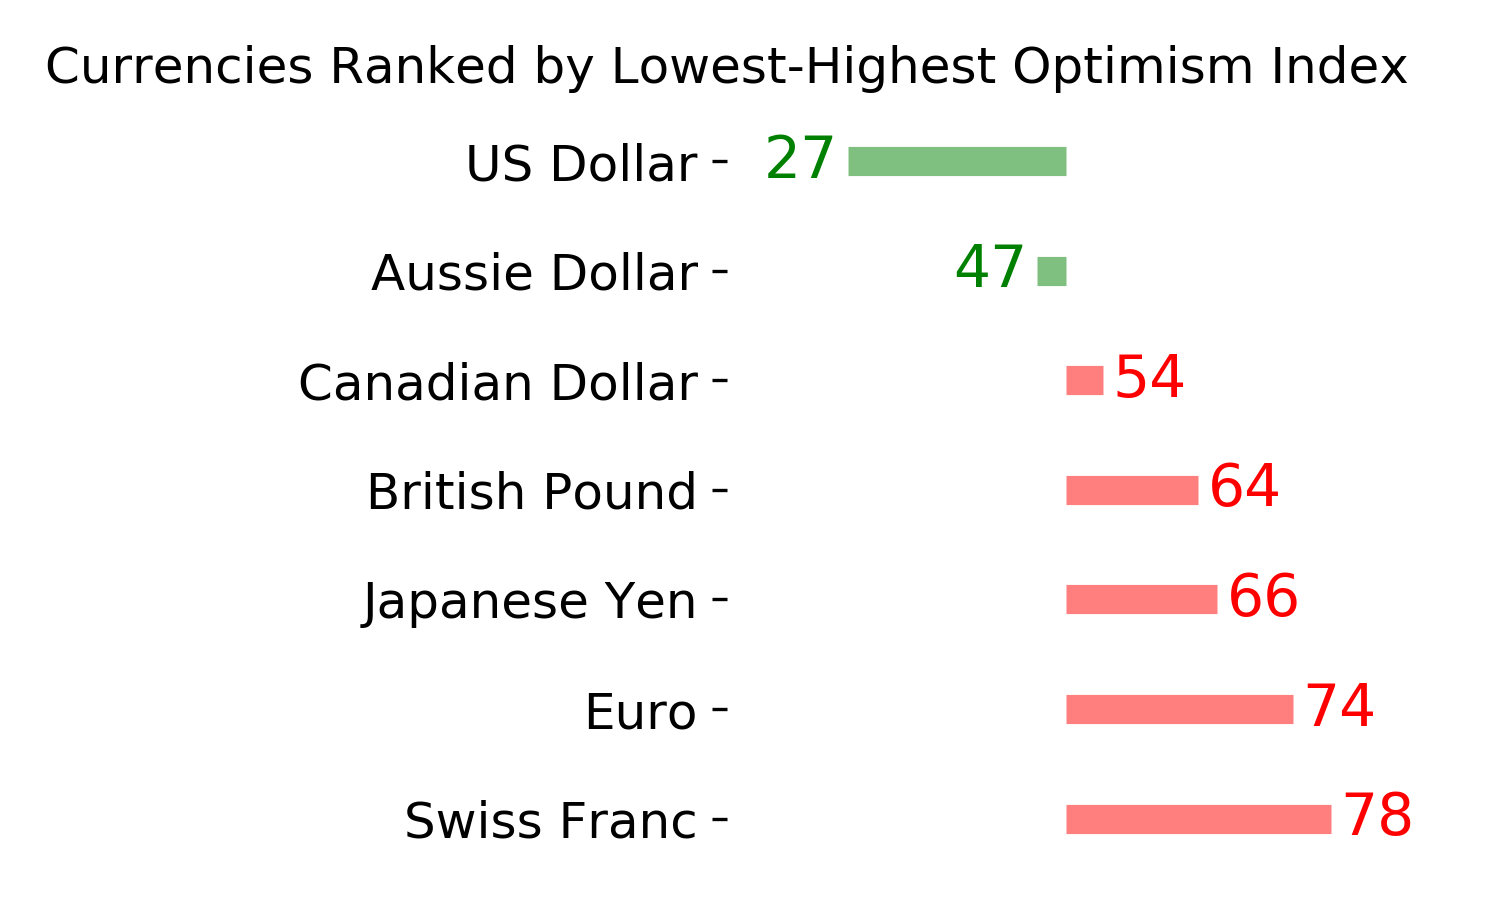
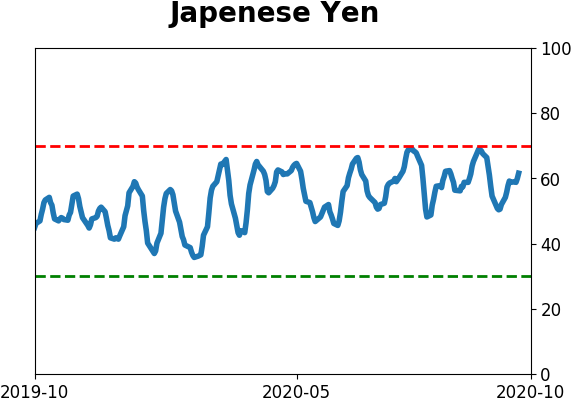
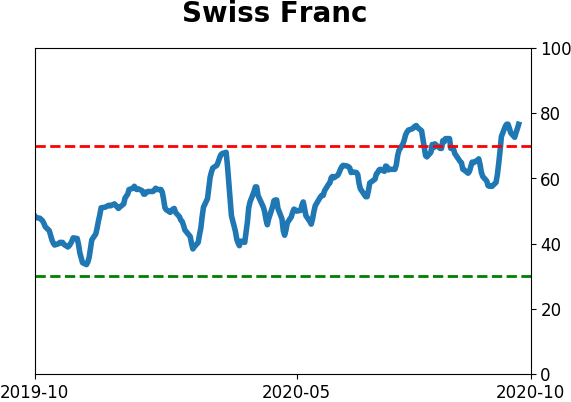
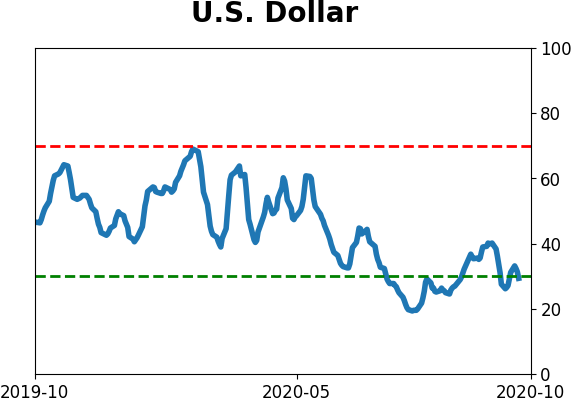
Currency ETF's - 5-Day Moving Average
|
|
|
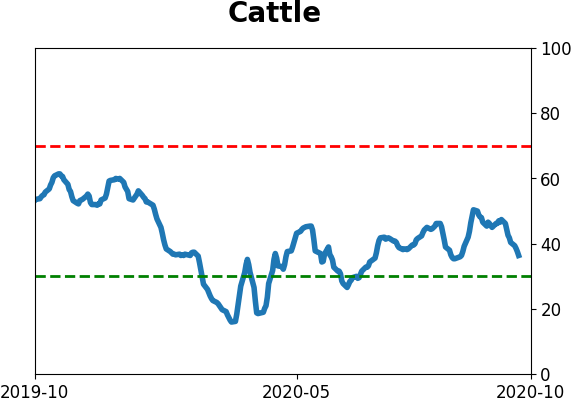
Commodity ETF's - 5-Day Moving Average
|
|