Headlines
|
|
The ratio of gold to copper shows returning risk appetite:
For the first time in well over a year, the ratio of gold to copper has dropped to a 6-month low. This suggests that traders see more value in economic growth (copper) than safety (gold). After other times the ratio hit a 6-month low, stocks did okay, while bonds, and the metals themselves, tended to drop.
Fund managers can't catch a break: The Investment Company Institute reports that mutual fund investors pulled nearly $20 billion from domestic equities in the week ended October 14. That's the 7th-largest weekly outflow since at least 2007. After other > $19 billion outflows, the Backtest Engine shows this was not an automatic contrary buy signal. Over the next month, the S&P 500 rose four times and dropped more than 6% twice.
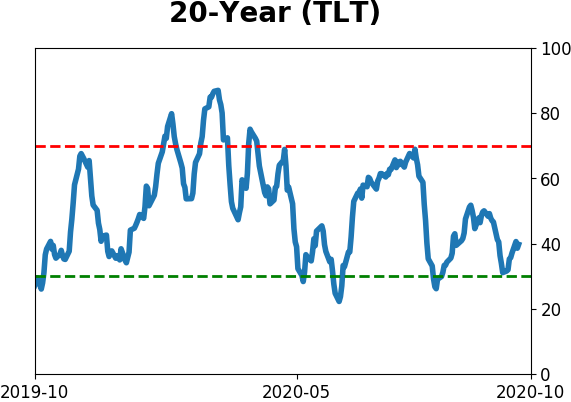
2-to-1 bets against bonds: There were more than 500,000 puts traded on 10-year Treasury notes on the CME exchange on Tuesday. That's in the top 1.5% of all readings since 1999. Over the past 20 days, there has been an average of more than twice as many puts traded as calls on 10-year notes. This is only the 2nd time in 5 years that the 10-Year Treasury Put/Call Ratio has been above 2 (the other was December 2016). The Backtest Engine shows that when the ratio was this high, for this long of a stretch, then over the next 2 months, the TLT fund showed a positive return after 91 out of 100 days.
Bottom Line:
- A positive environment favors becoming aggressive on signs of excessive pessimism.
|
Smart / Dumb Money Confidence
|
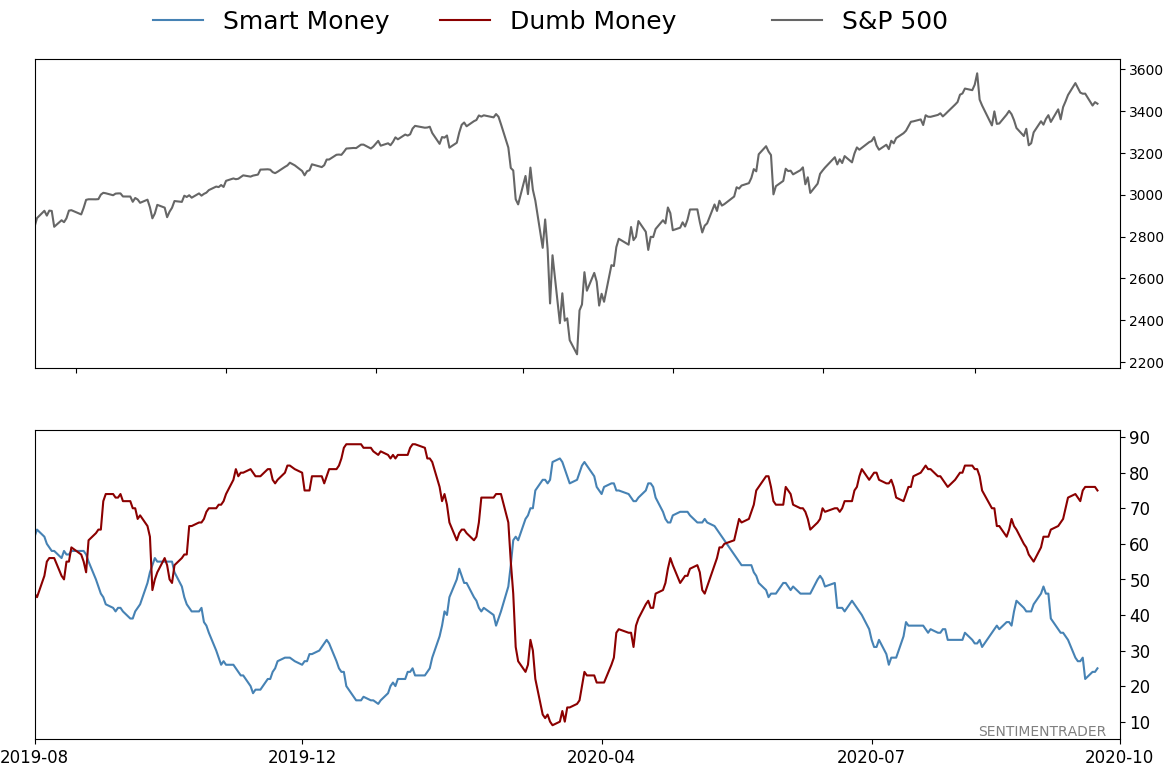
Smart Money Confidence: 25%
Dumb Money Confidence: 75%
|
|
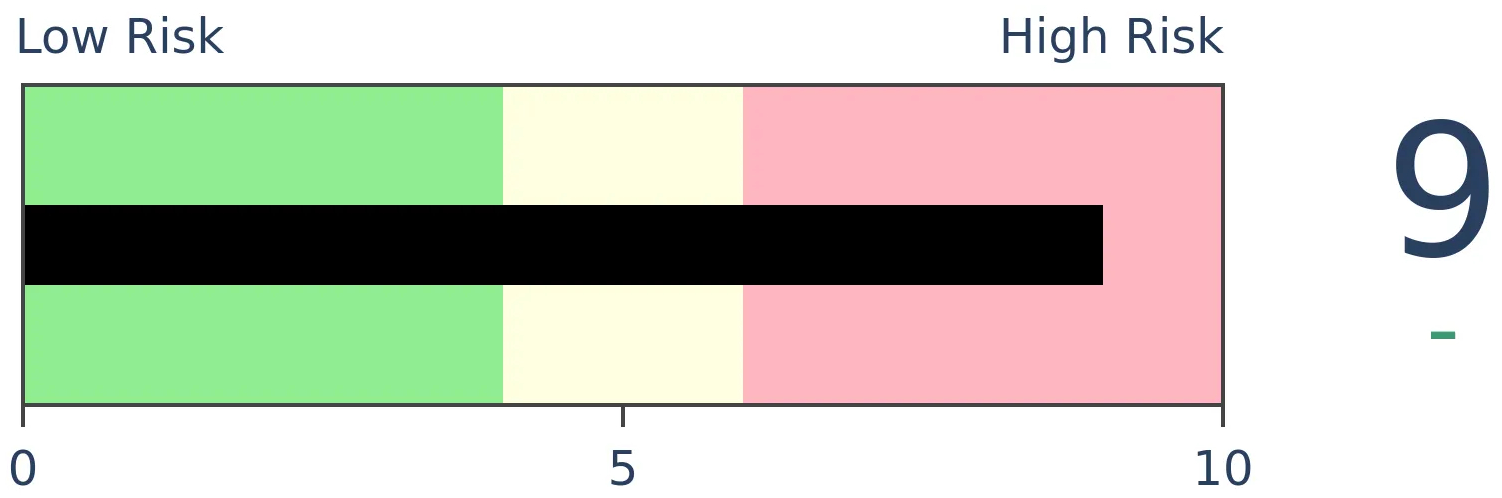
Risk Levels
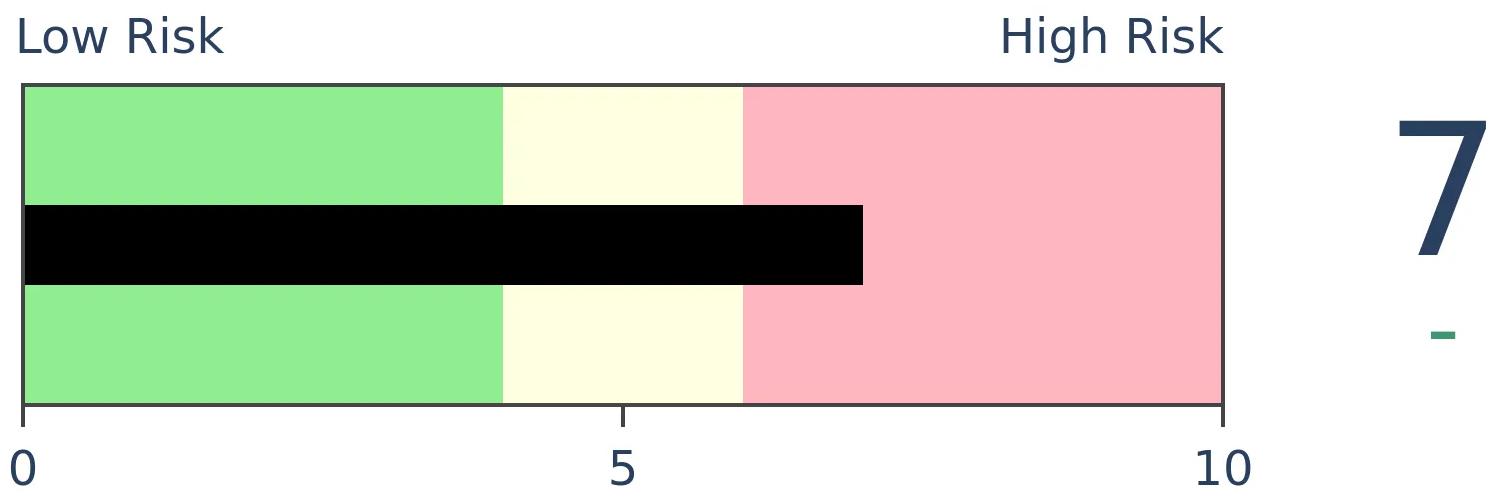
Stocks Short-Term
|
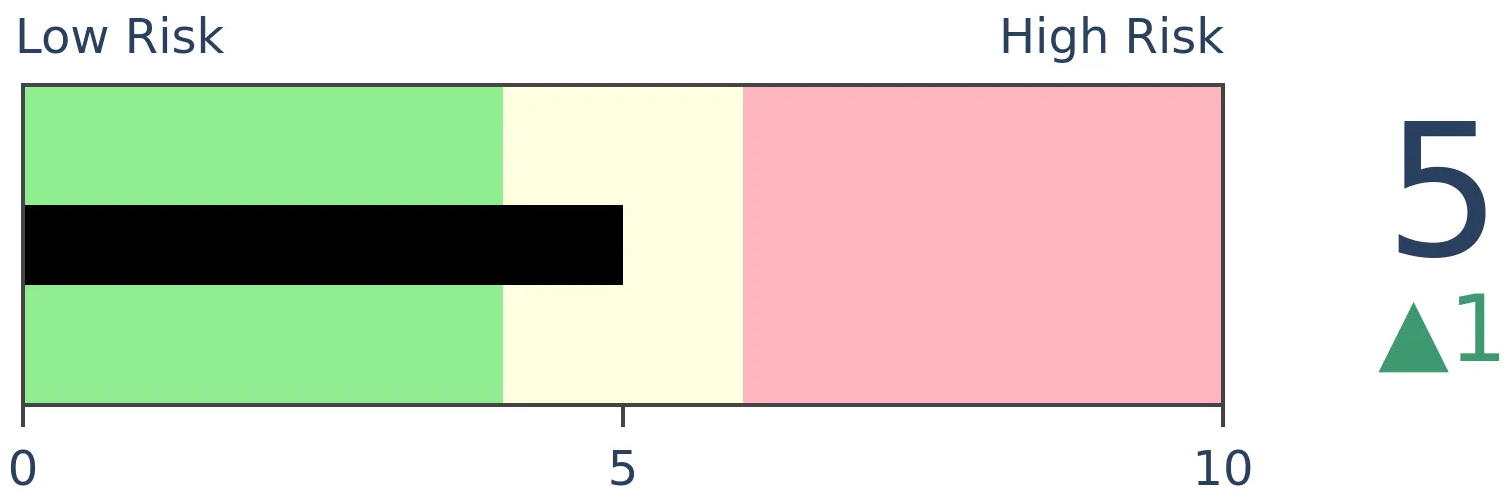
Stocks Medium-Term
|
|
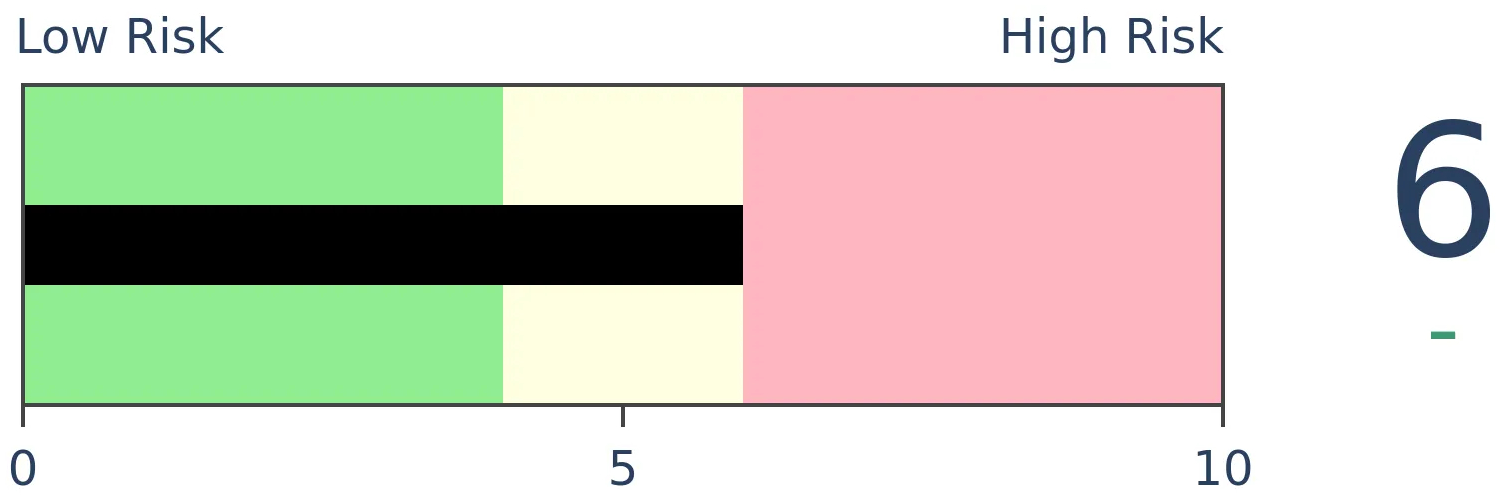
Bonds
|
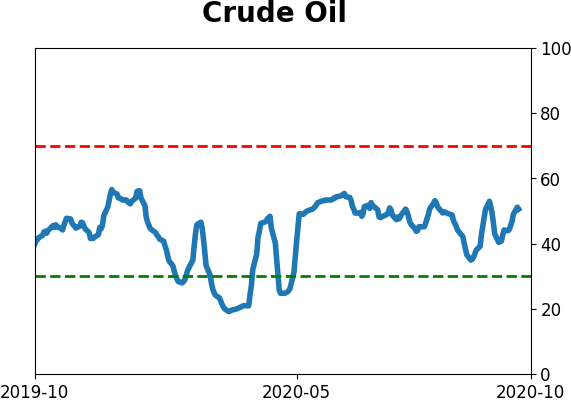
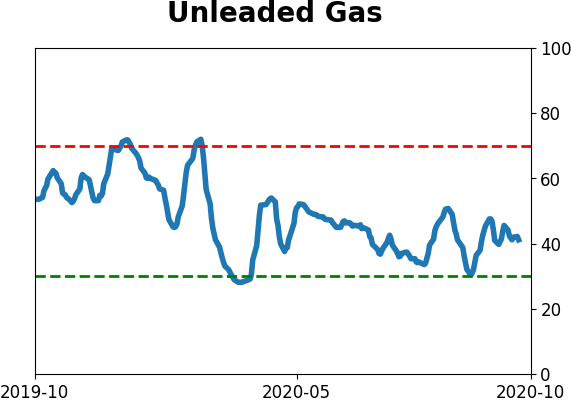
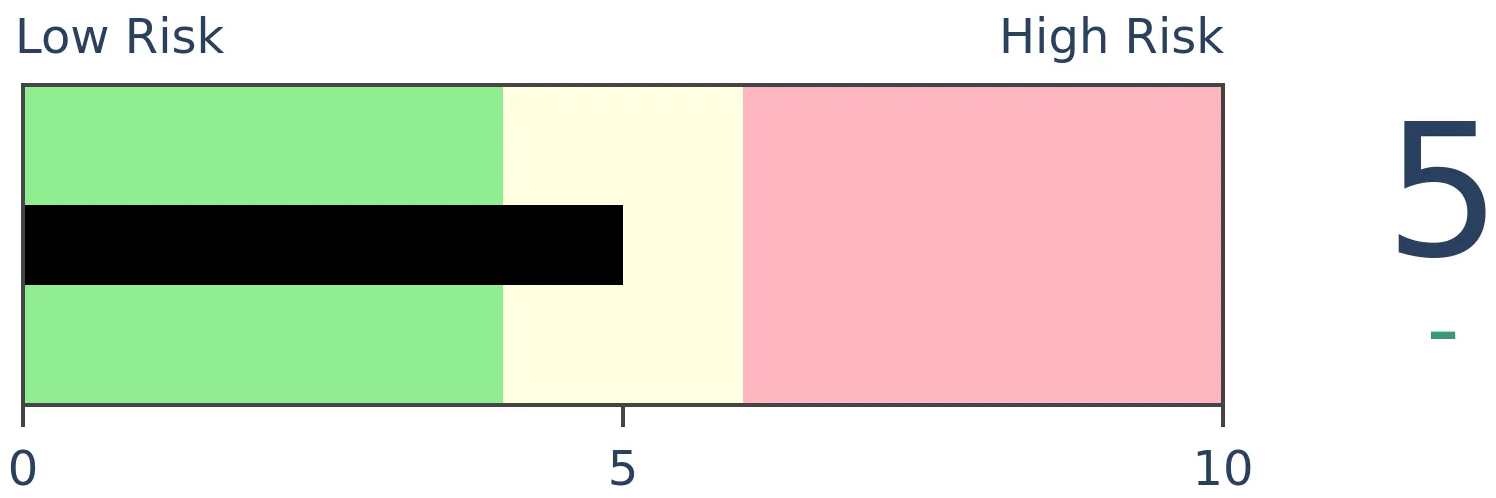
Crude Oil
|
|
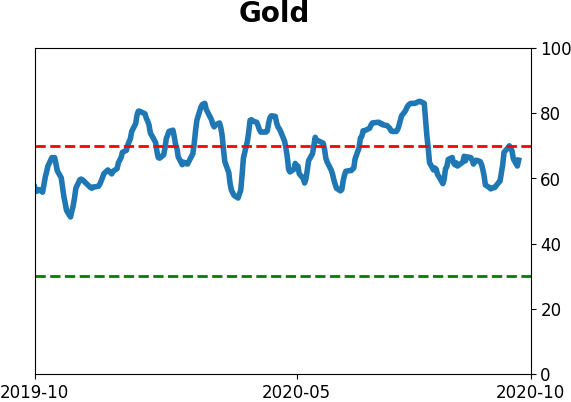
Gold
|
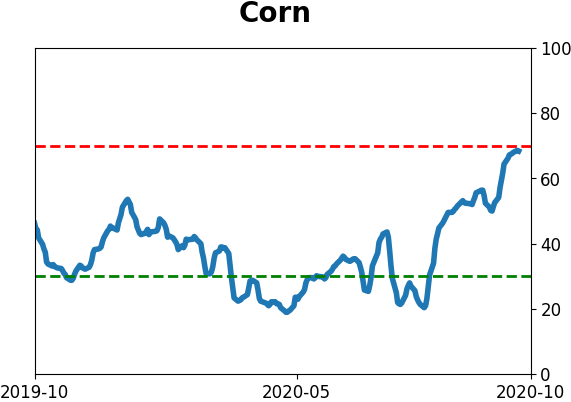
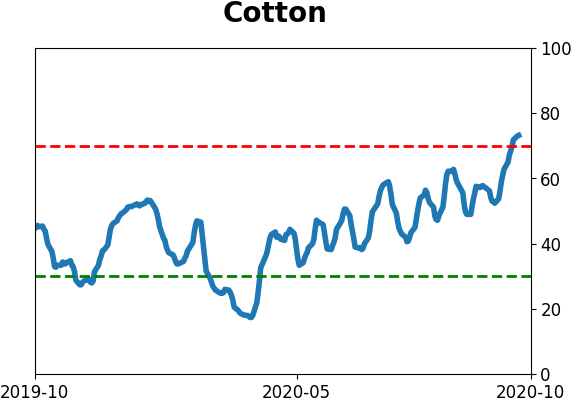
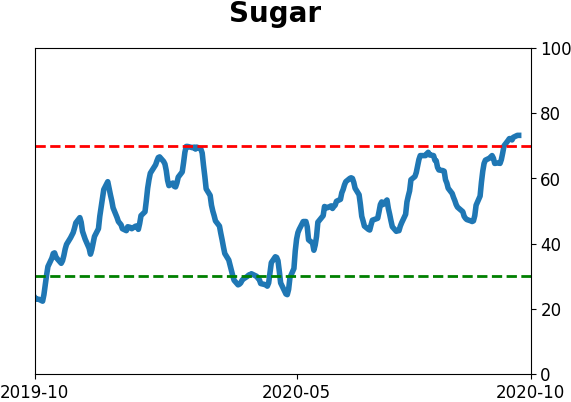
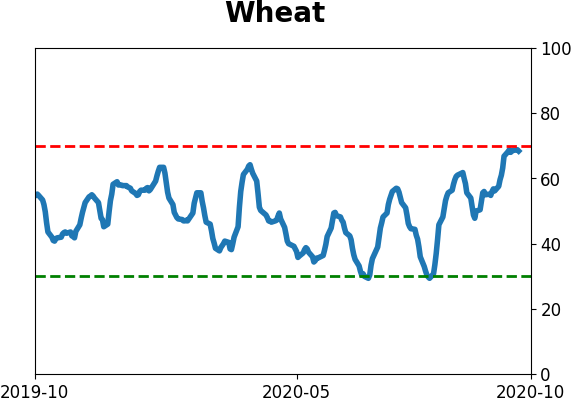
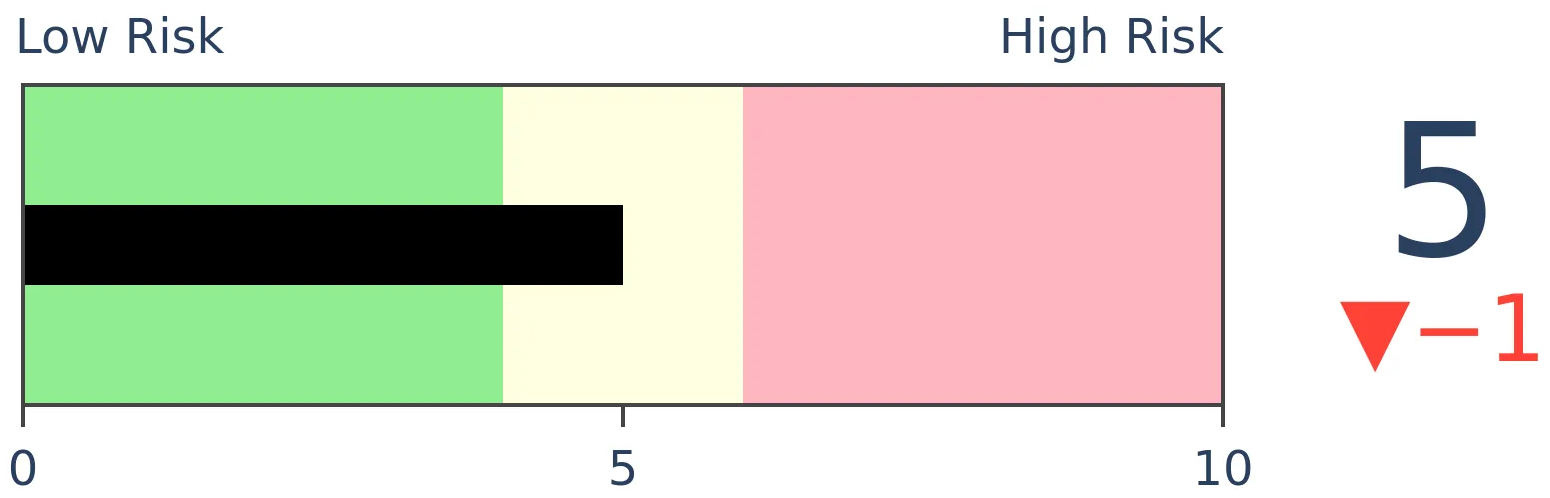
Agriculture
|
|
Research
BOTTOM LINE
For the first time in well over a year, the ratio of gold to copper has dropped to a 6-month low. This suggests that traders see more value in economic growth (copper) than safety (gold). After other times the ratio hit a 6-month low, stocks did okay, while bonds, and the metals themselves, tended to drop.
FORECAST / TIMEFRAME
None
|
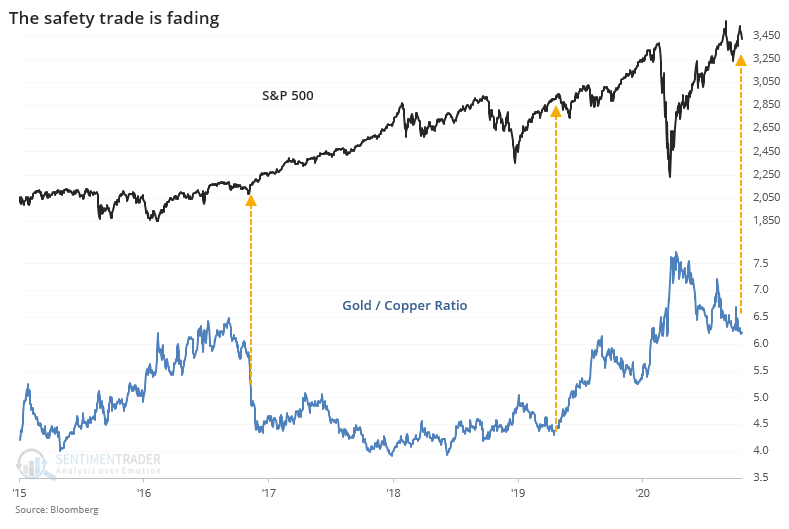
The safety trade is starting to fade.
During times of duress, traders often flee to the perceived safety of gold. During economic booms, they gravitate toward copper, which has more industrial utility. So, watching the ratio of gold to copper can provide a sense of whether traders are looking for safety or a play on economic growth. That's the theory, anyway.
According to Bloomberg, the ratio of gold to copper has dropped to its lowest level in months, as traders shift from safety to growth. The last couple of times the ratio fell to a 6-month low for the first time in more than 200 sessions, stocks rallied hard in the months ahead.
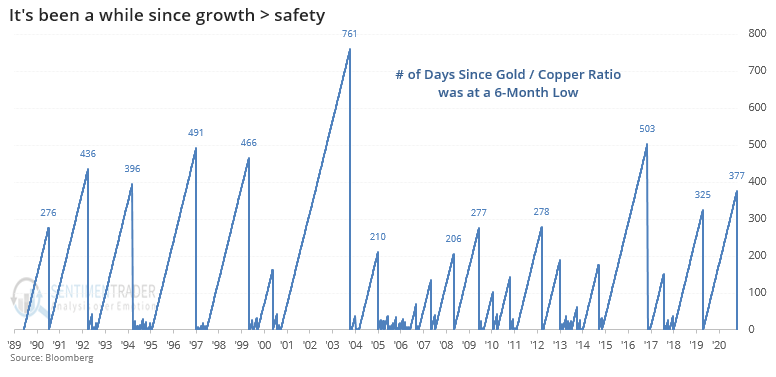
If we believe in the theory behind this ratio, then traders have been anxious for a while. The recent drop in the ratio marked the first time in nearly a year and a half that it had been at a 6-month low, one of the longest streaks in over 30 years.
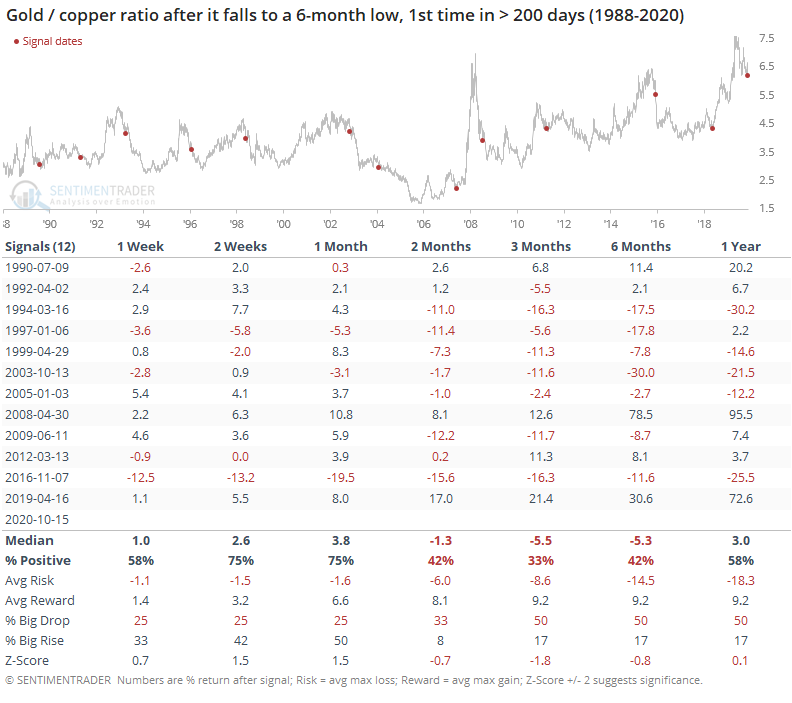
Other times the ratio ended a long streak without a 6-month low, gold prices tended to keep falling.
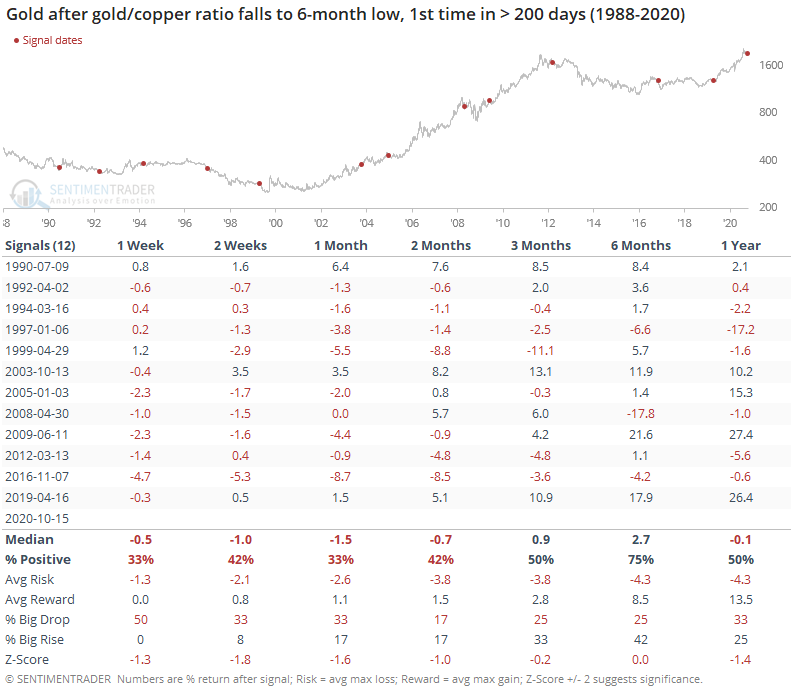
Over the short- to medium-term, gold struggled to show a gain. The win rate, average return, and risk/reward skew were all negative up to 2 months later. About the only solace for bulls was the 6-month window when it finally turned positive.
Copper also tended to struggle. Weakness here was mostly shorter-term, with an especially poor risk/reward ratio over the next month.
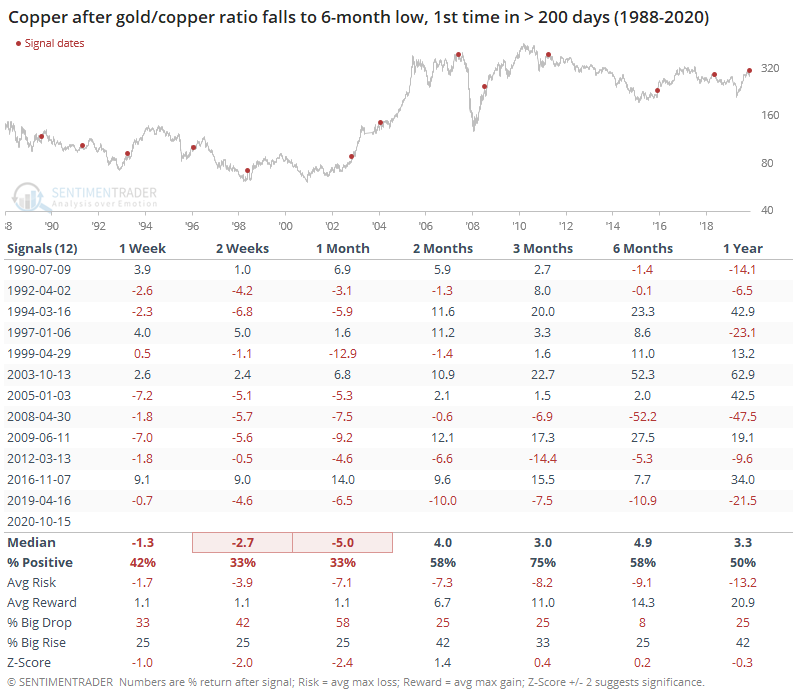
Even so, gold tended to drop more than copper over the medium-term, so the ratio between them continued to decline. The ratio rebounded about 3 times out of 4 during the next 2-4 weeks, but after that the longer-term trend asserted itself.
For other markets, it was a modestly good longer-term sign for stocks, not so much for the dollar or Treasuries over the medium-term.
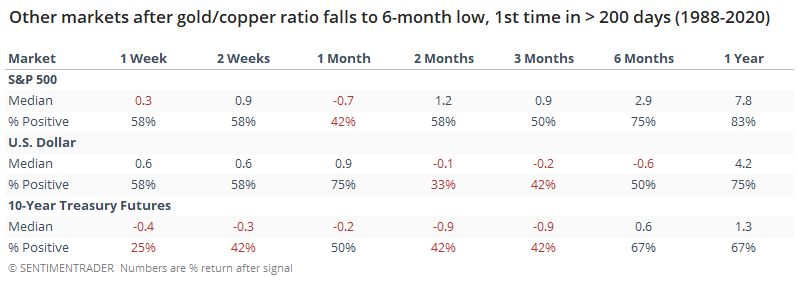
Over the next 6-12 months, the S&P 500 showed consistent gains, with a good average return, but nothing much beyond random. Shorter-term returns were even a bit below random, so assuming that this risk-on signal meant gains ahead for stocks wasn't very useful. It was modestly successful at preceding declines in T-notes over the next 2-3 months, meaning interest rates rose.
A breakout in copper is supposed to be a particularly good sign for emerging markets, but when the gold / copper ratio fell to a 6-month low, emerging markets had a strong tendency to show a loss over the next month, gradually working toward breakeven over the next several months.
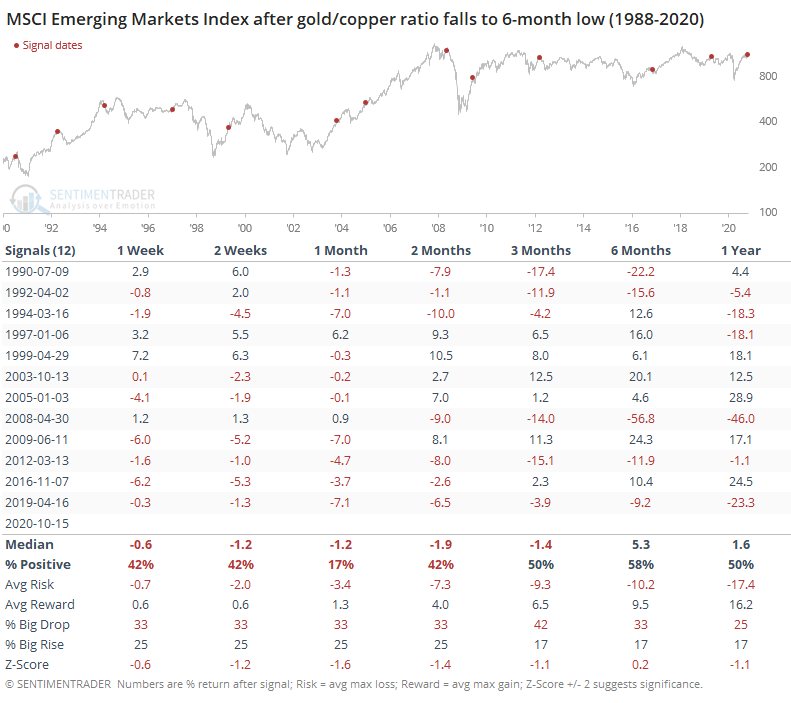
If we forget gold for a moment and just look at any day when copper hit a 2-year high, it was still not a consistent reason to buy emerging markets.
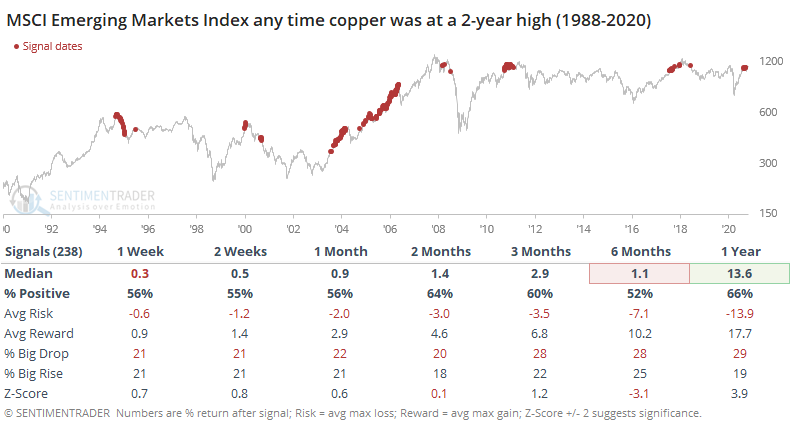
It should be a good sign that risk aversion is receding, but based on this ratio's measurement of it, not consistent enough to put a lot of weight behind.
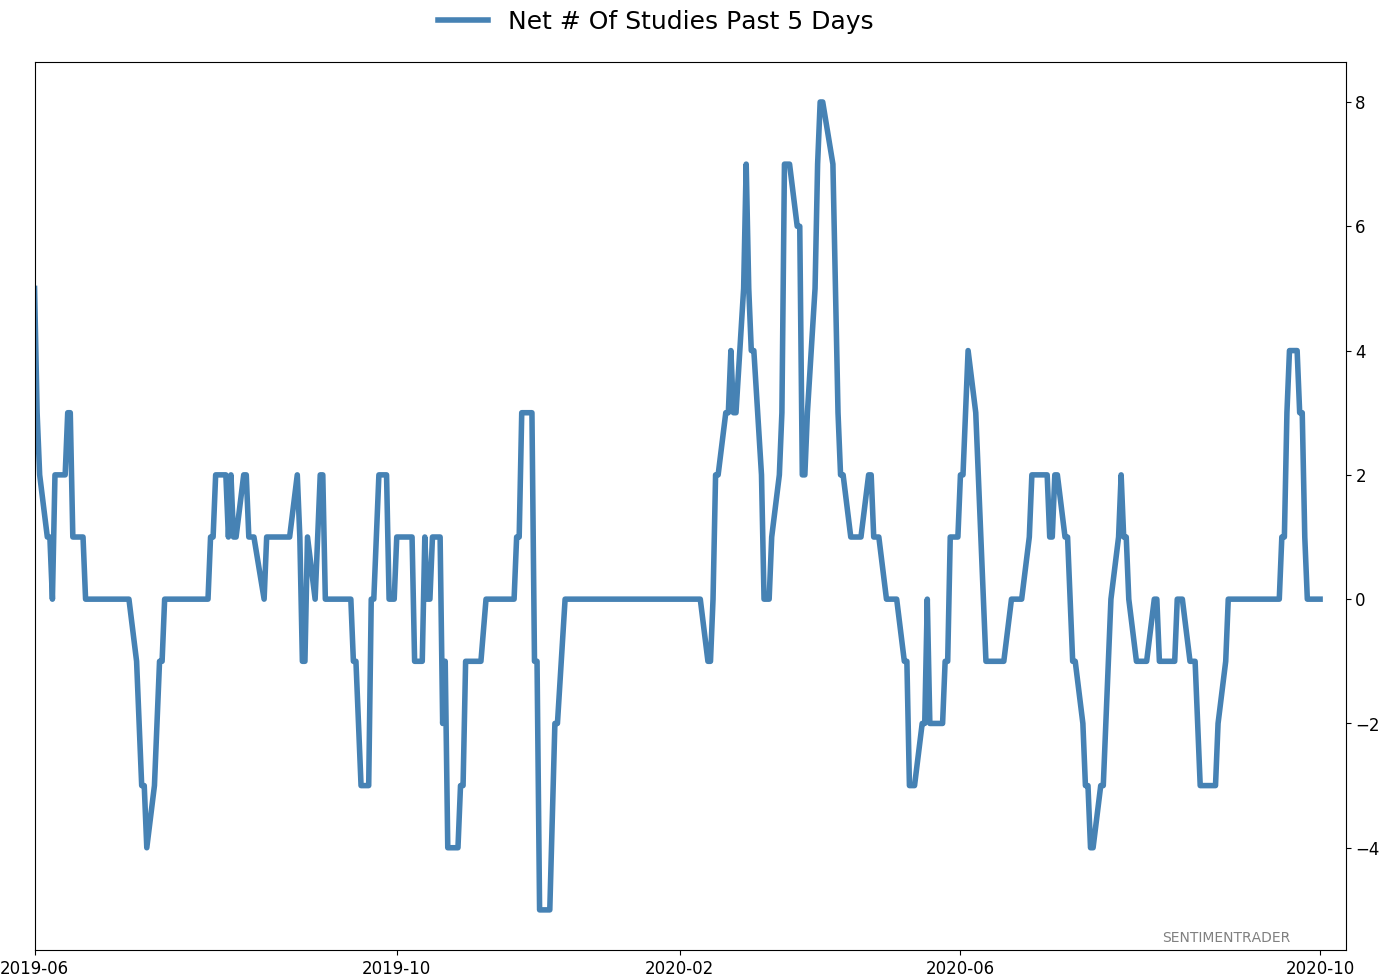
Active Studies
| Time Frame | Bullish | Bearish | | Short-Term | 0 | 0 | | Medium-Term | 4 | 8 | | Long-Term | 48 | 2 |
|
Indicators at Extremes
Portfolio
| Position | Description | Weight % | Added / Reduced | Date | | Stocks | 15.6% RSP, 10.1% VWO, 7.5% XLE, 5.1% PSCE | 38.2 | Added 5% | 2020-10-15 | | Bonds | 10% BND, 10% SCHP, 10% ANGL | 29.7 | Reduced 0.1% | 2020-10-02 | | Commodities | GCC | 2.4 | Reduced 2.1%
| 2020-09-04 | | Precious Metals | GDX | 4.7 | Added 5% | 2020-09-09 | | Special Situations | | 0.0 | Reduced 5% | 2020-10-02 | | Cash | | 25.0 | | |
|
Updates (Changes made today are underlined)
After the September swoon wrung some of the worst of the speculation out of stocks, there are some signs that it's returning, especially in the options market. It's helped to push Dumb Money Confidence above 70%. A big difference between now and August is that in August, there was a multitude of days with exceptionally odd breadth readings. Some of the biggest stocks were masking underlying weakness. Combined with heavy speculative activity, it was a dangerous setup. Now, we've seen very strong internal strength, in the broad market, as well as tech and small-cap stocks. Prior signals almost invariably led to higher prices. That's hard to square with the idea that forward returns tend to be subdued when Confidence is high, but that's less reliable during healthy market conditions, which we're seeing now (for the most part). I added some risk with small-cap energy stocks, due to an increasing number of positive signs in both small-caps and energy. This is intended as a long-term position.
RETURN YTD: -0.7% 2019: 12.6%, 2018: 0.6%, 2017: 3.8%, 2016: 17.1%, 2015: 9.2%, 2014: 14.5%, 2013: 2.2%, 2012: 10.8%, 2011: 16.5%, 2010: 15.3%, 2009: 23.9%, 2008: 16.2%, 2007: 7.8%
|
|
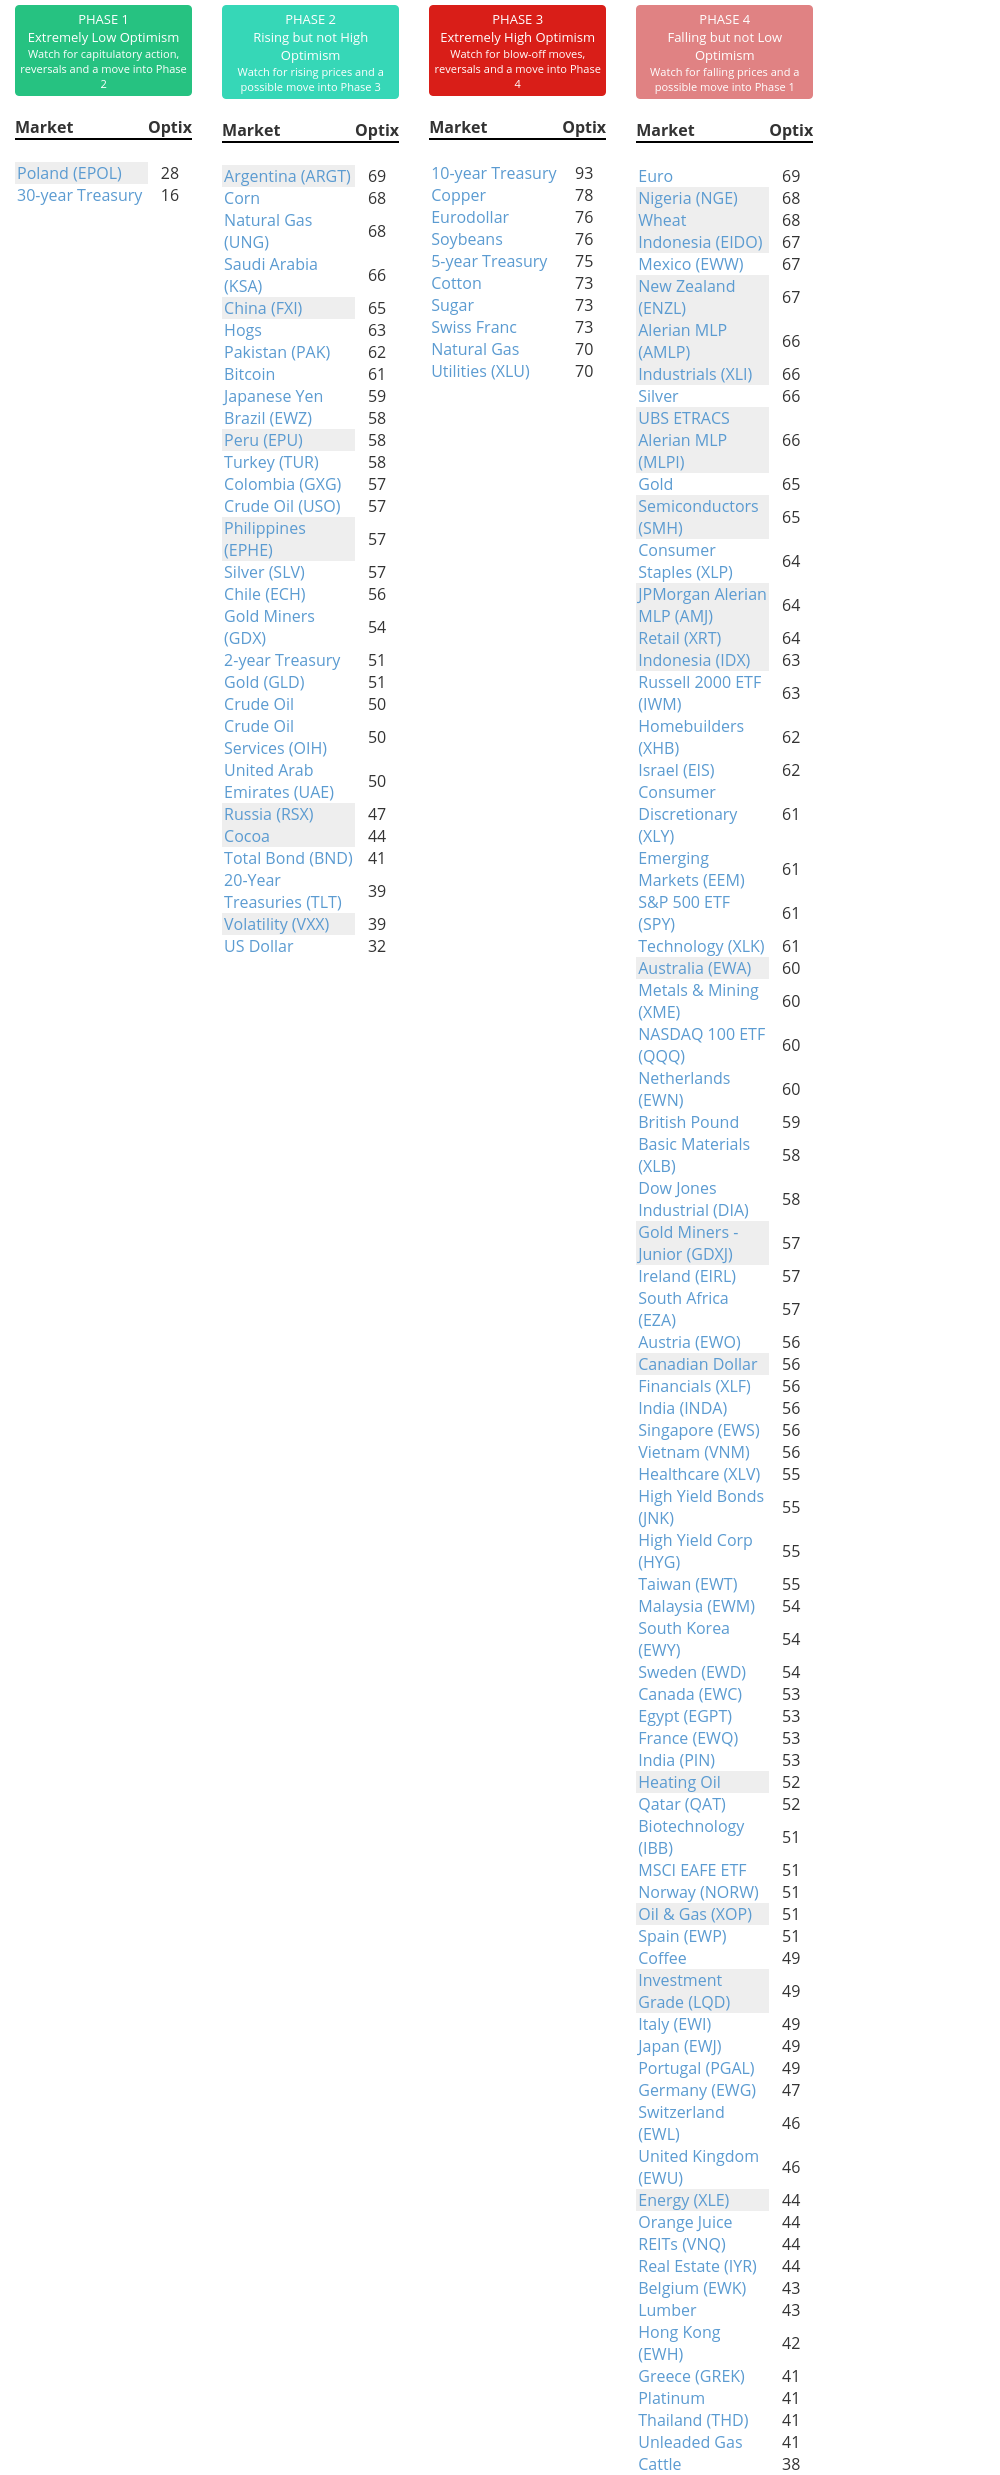
Phase Table
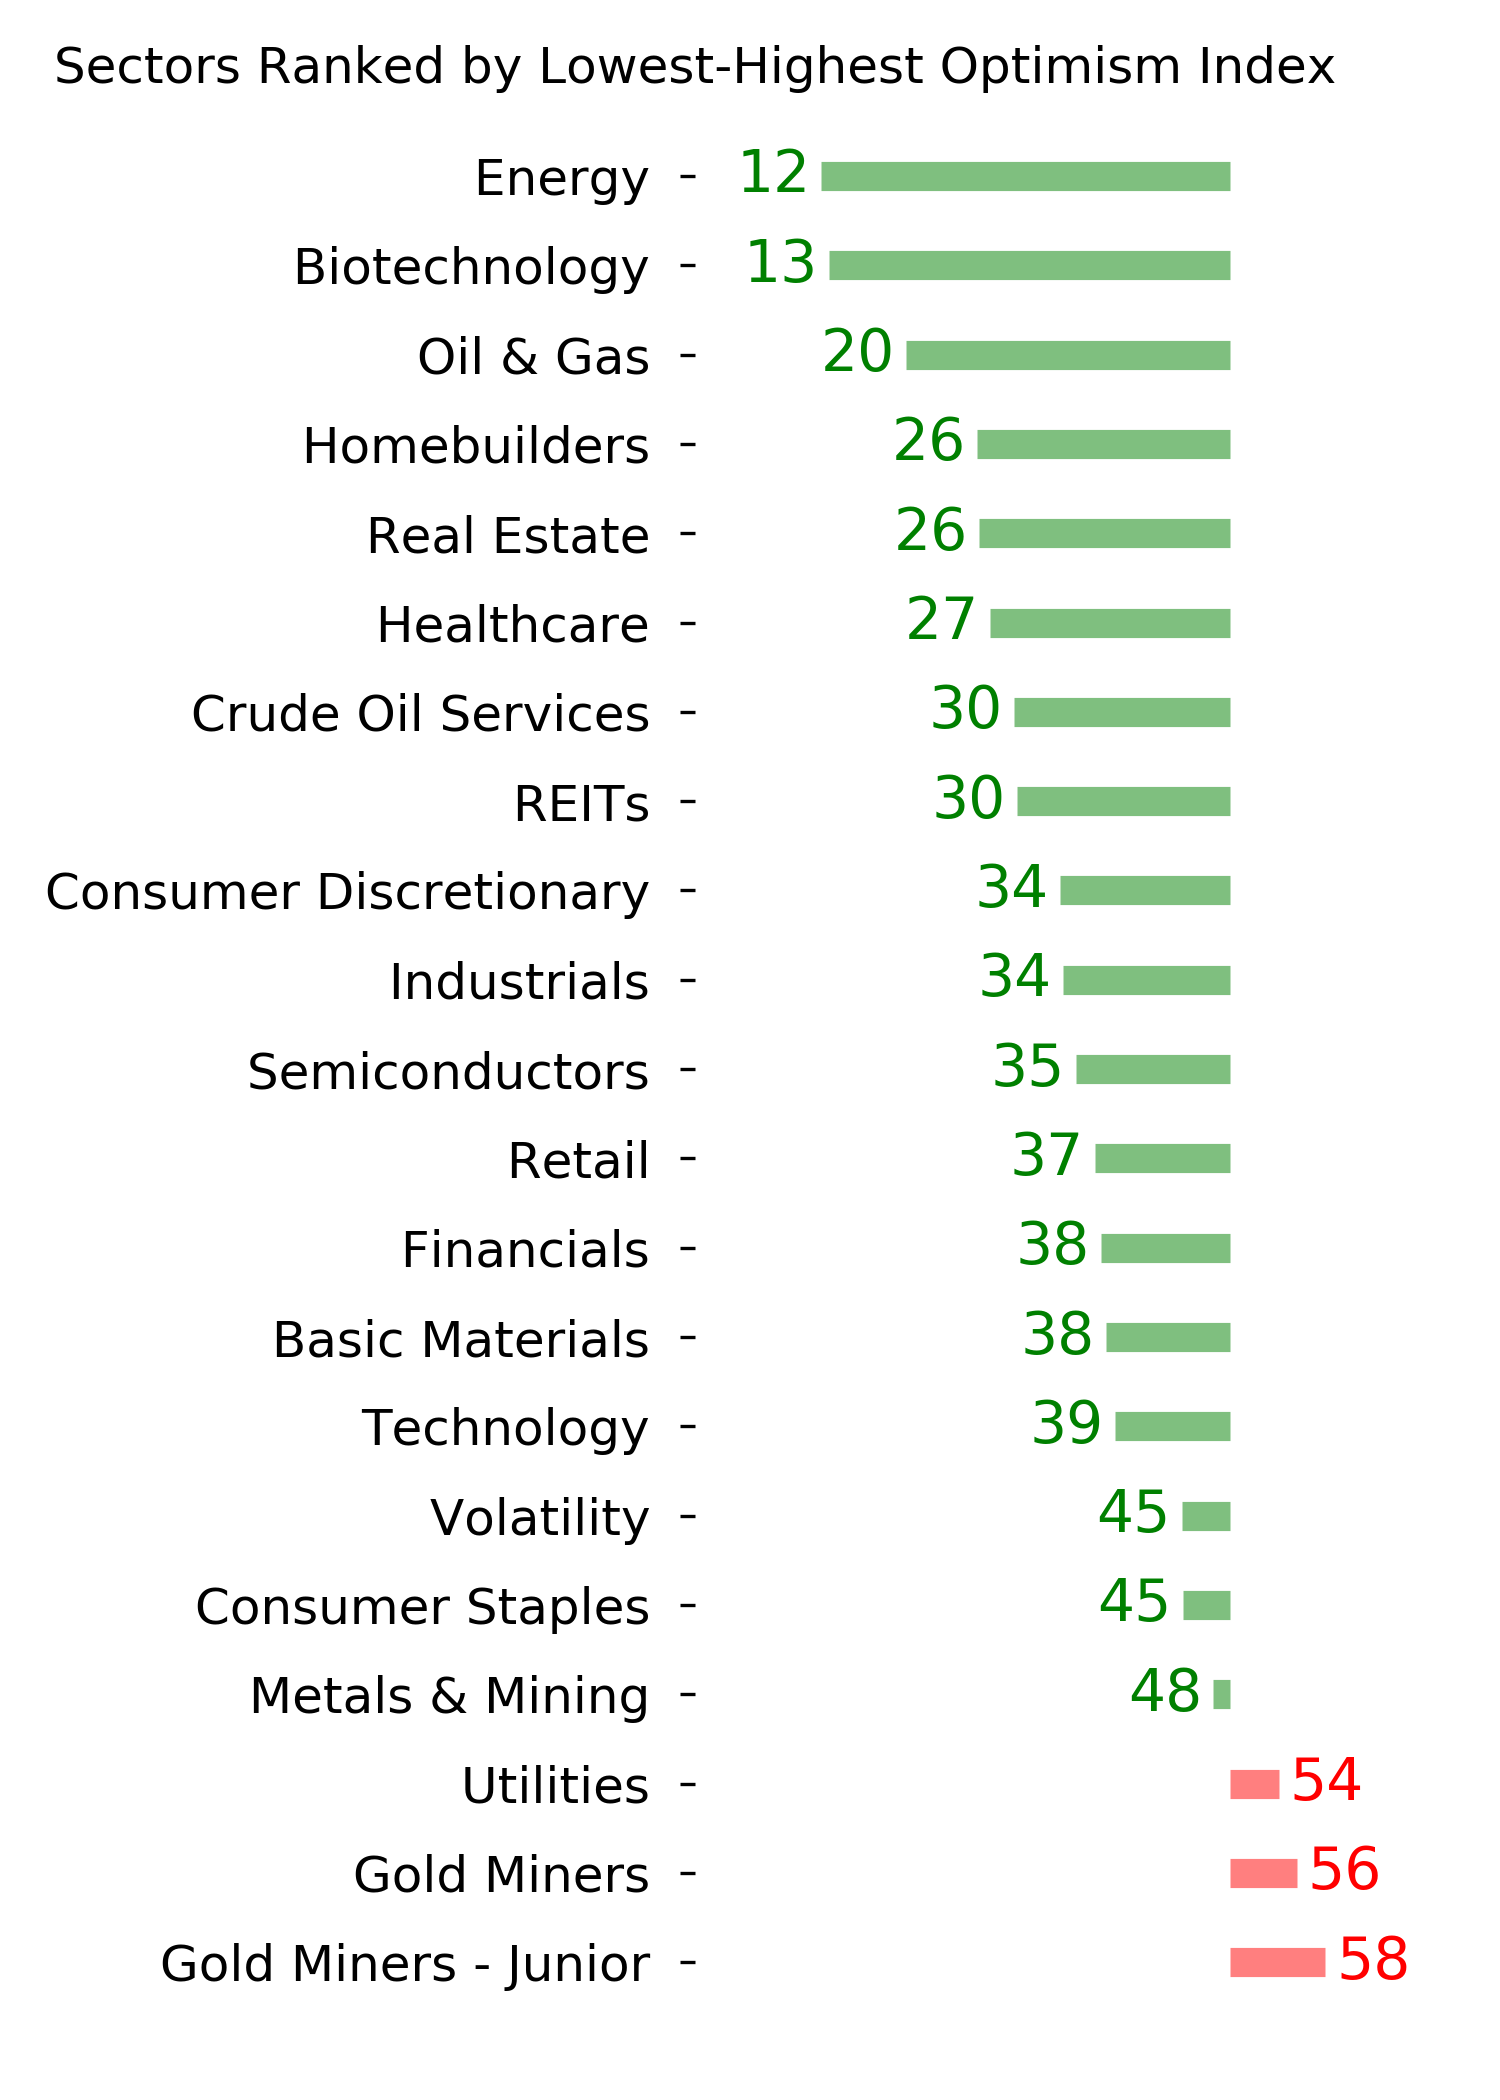
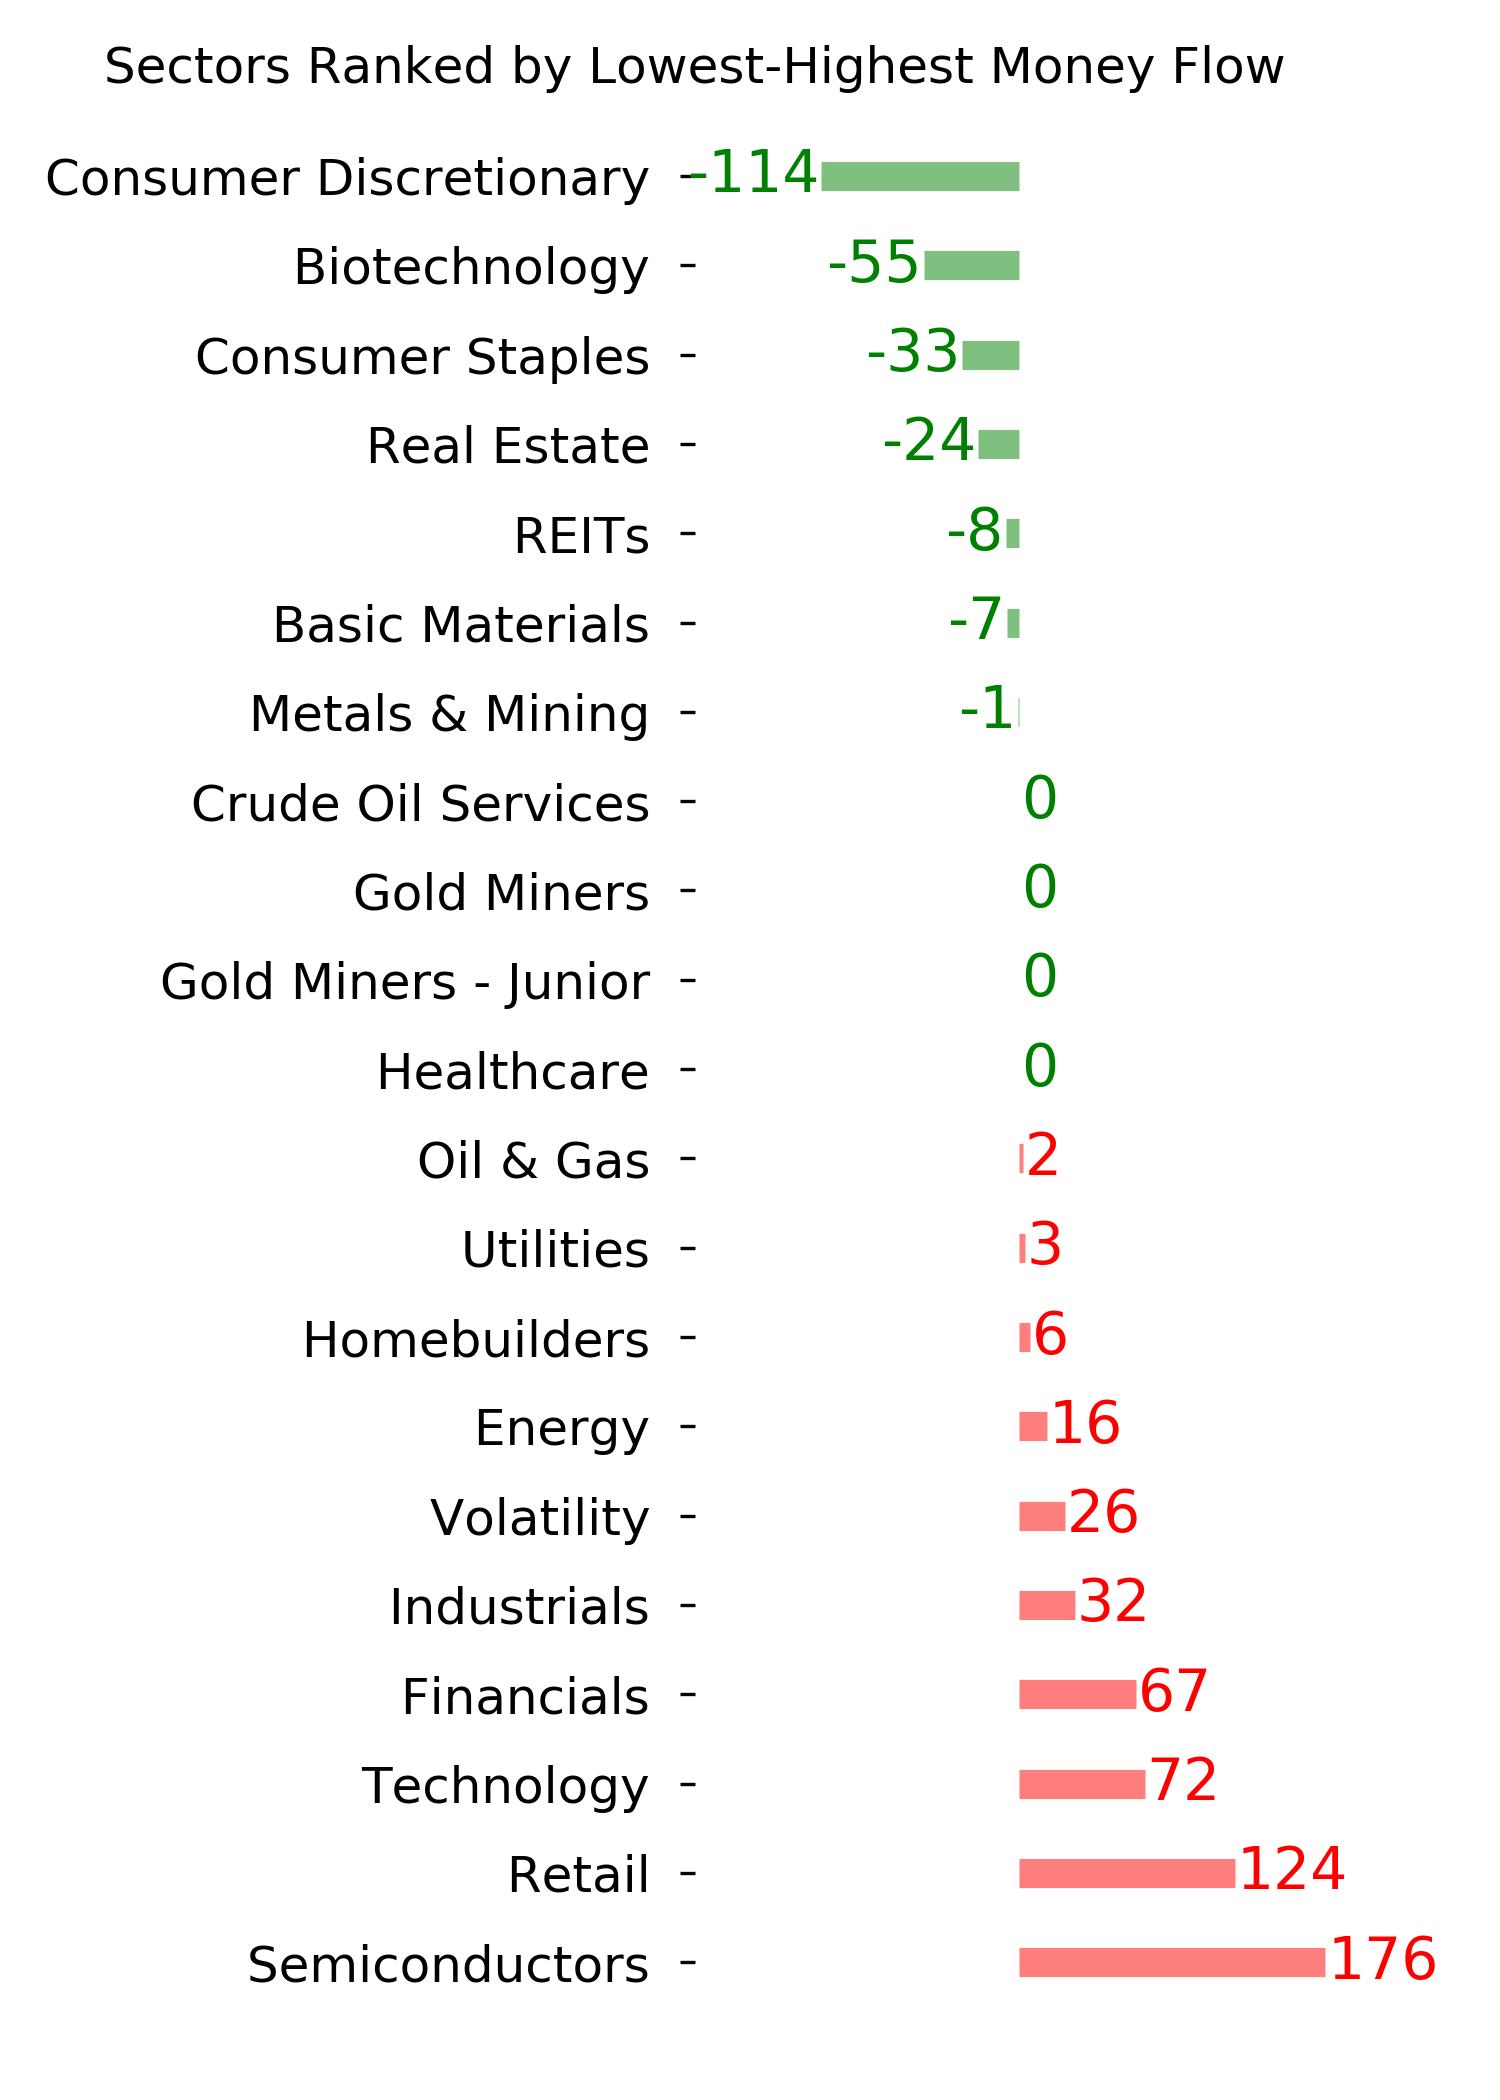
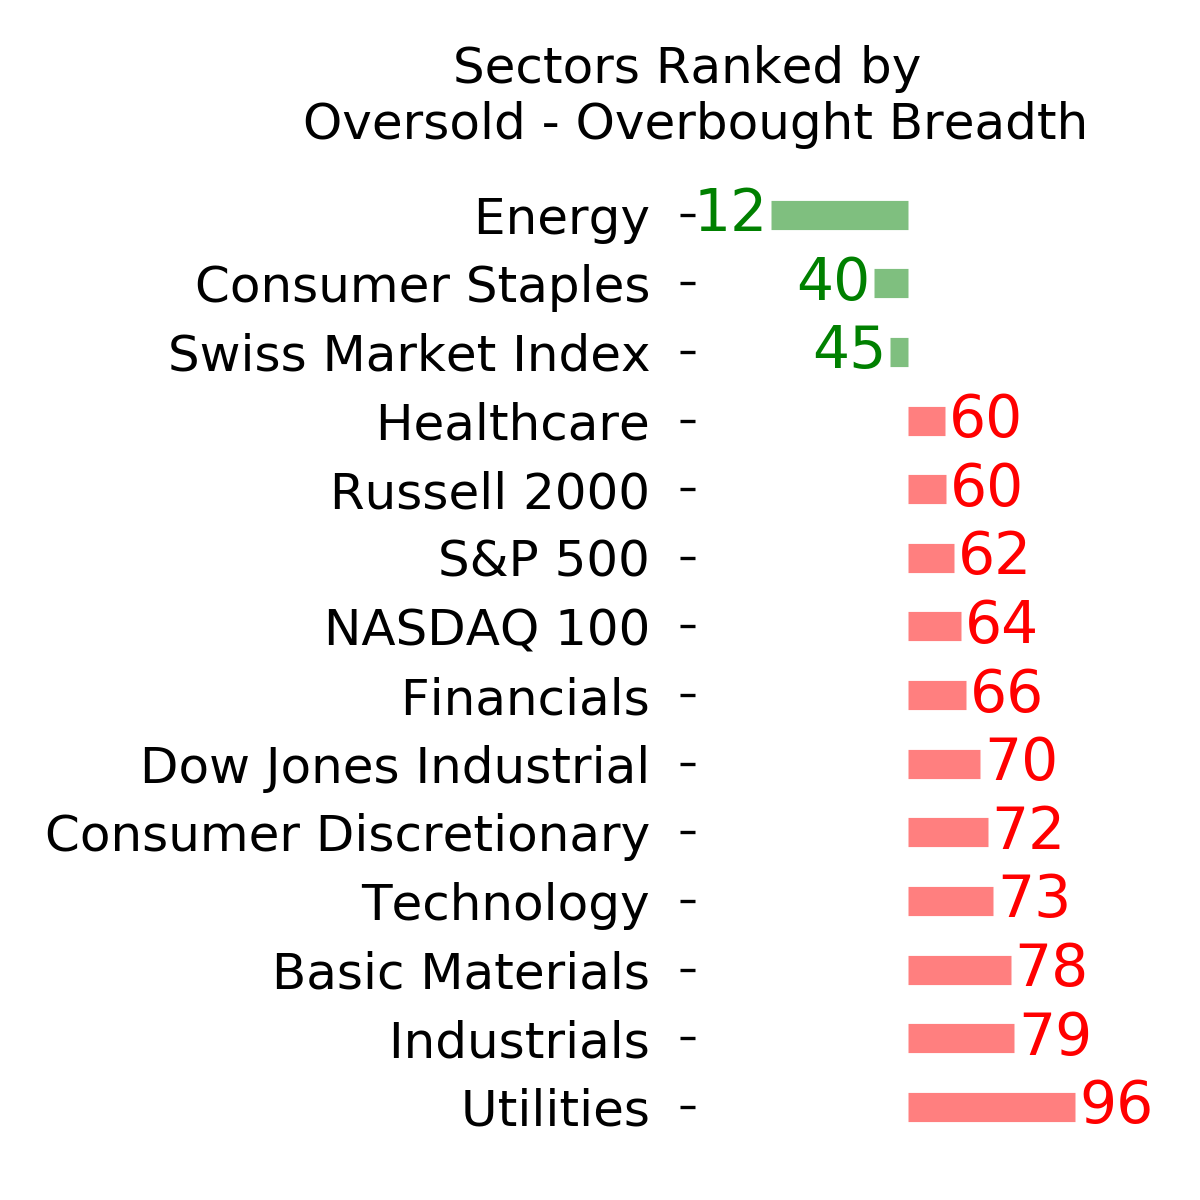
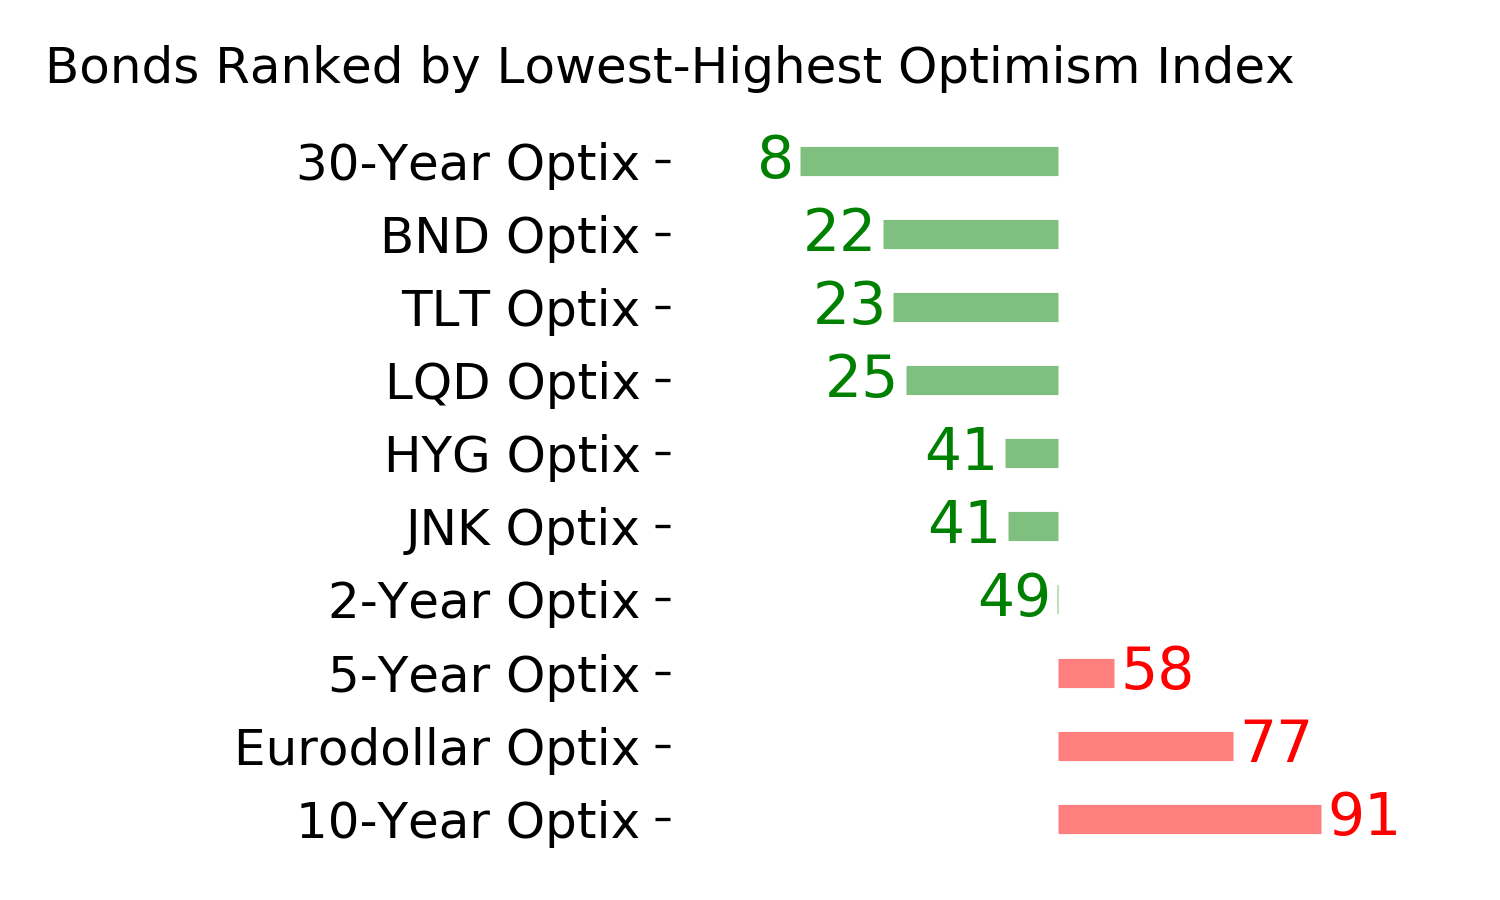
Ranks
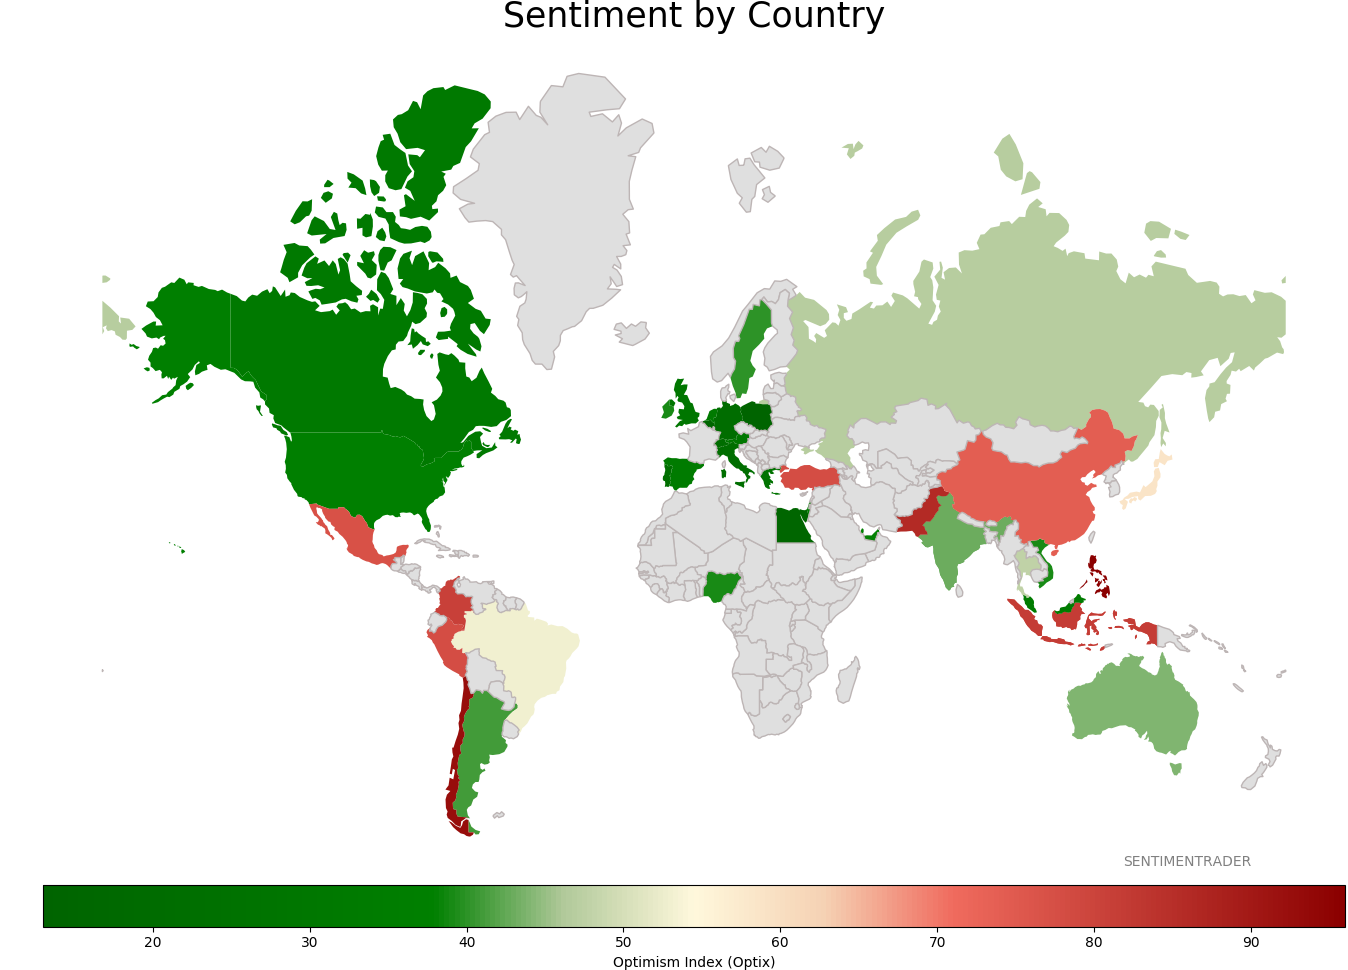
Sentiment Around The World
Optimism Index Thumbnails
|
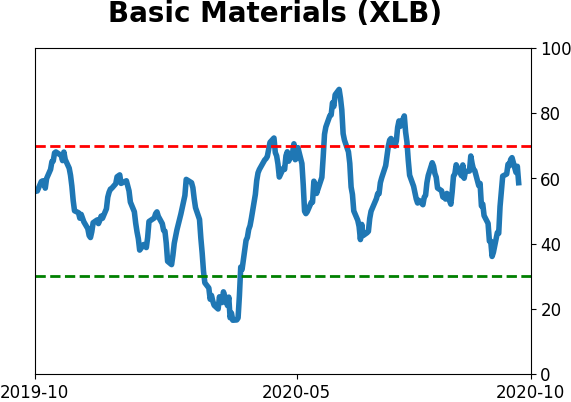
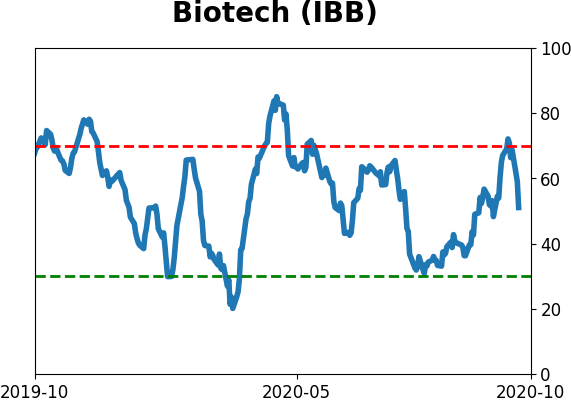
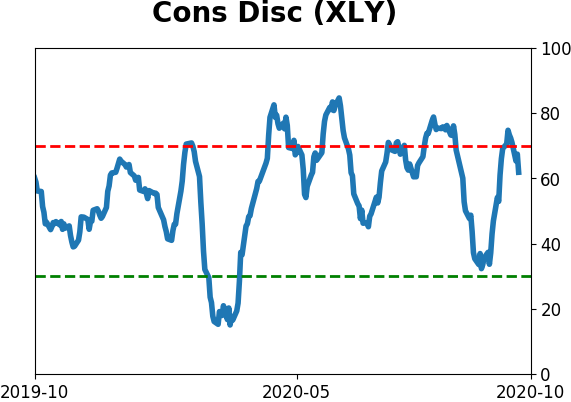
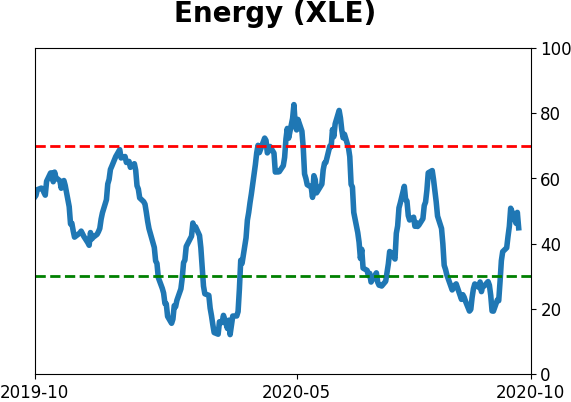
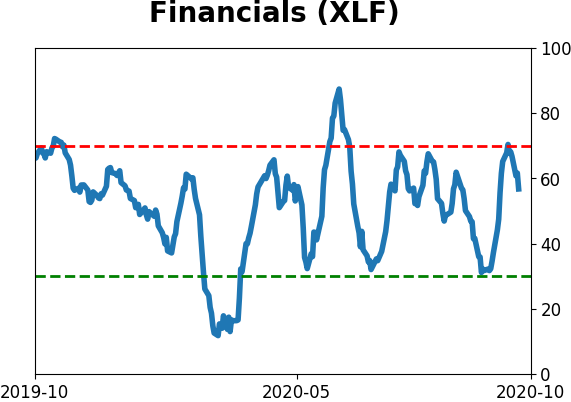
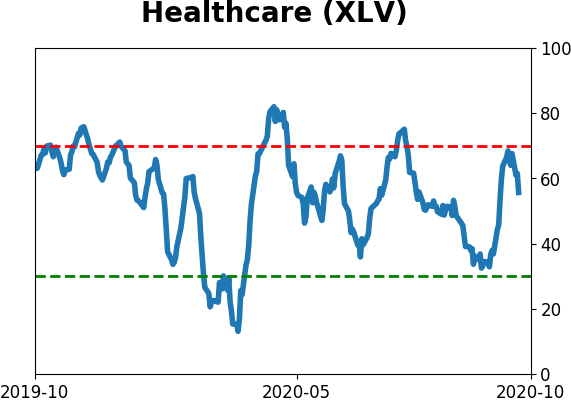
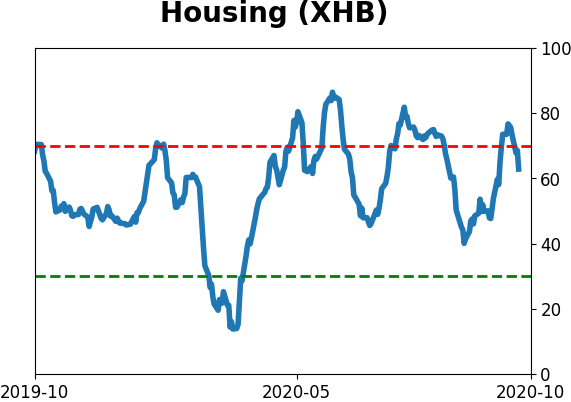
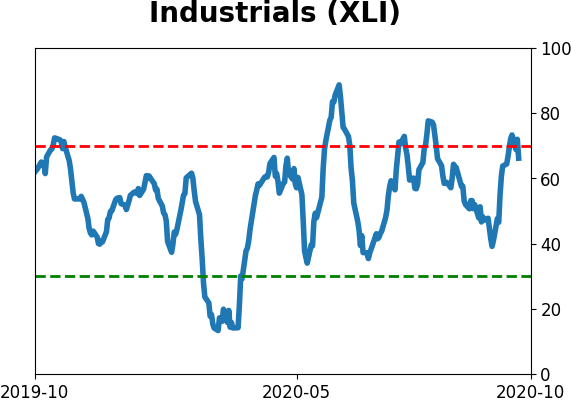
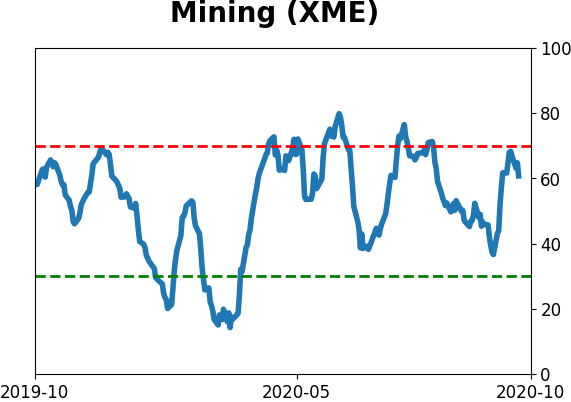
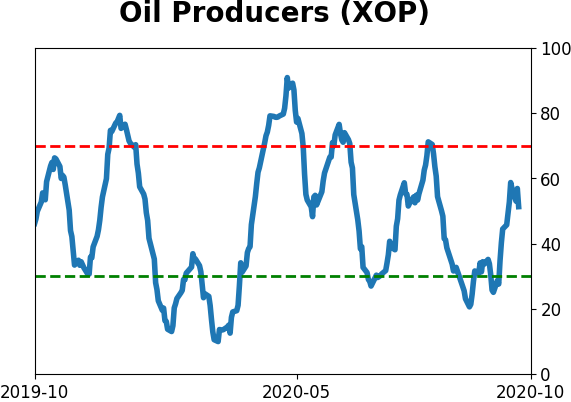
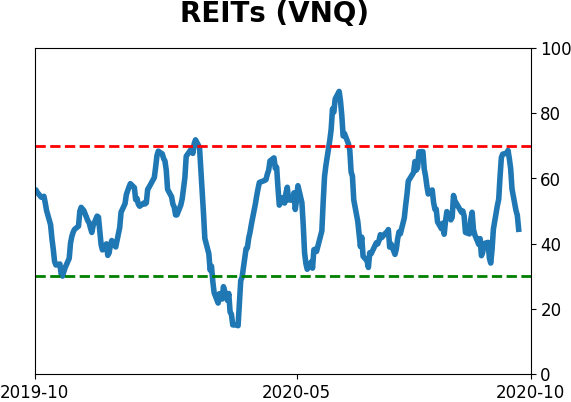
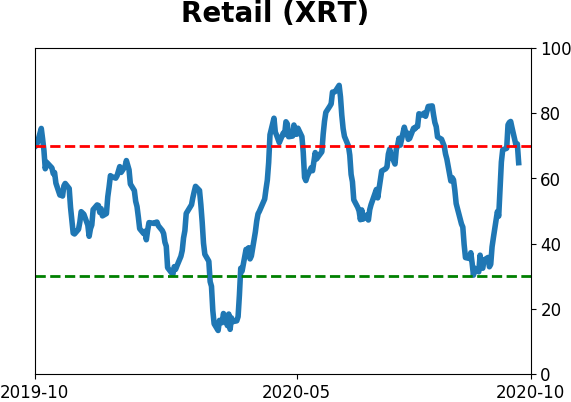
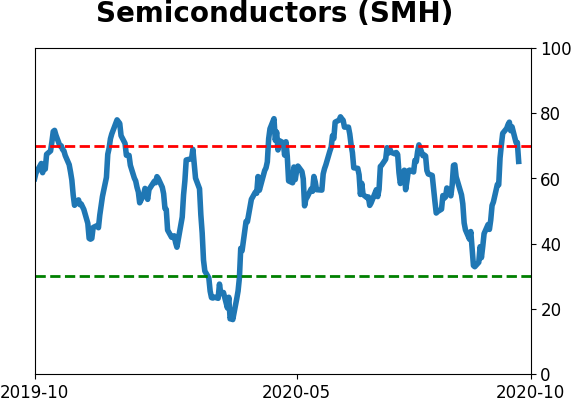
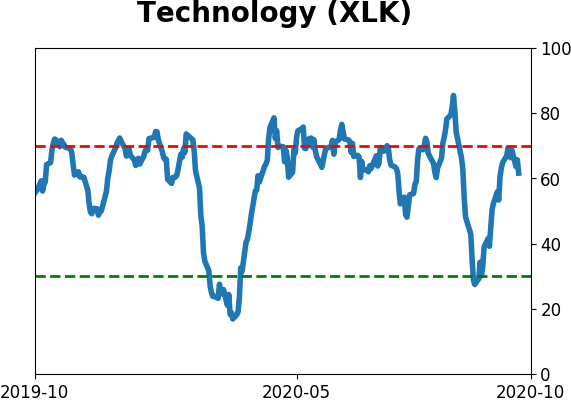
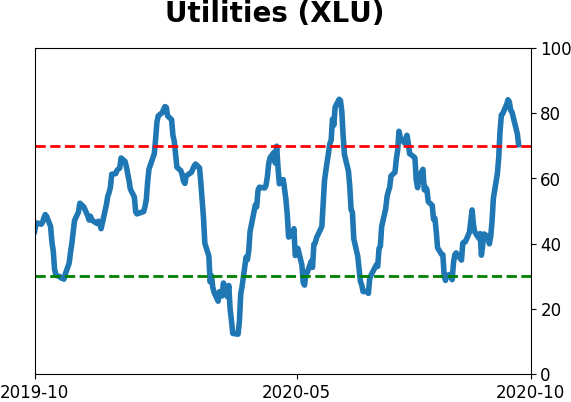
Sector ETF's - 10-Day Moving Average
|
|
|
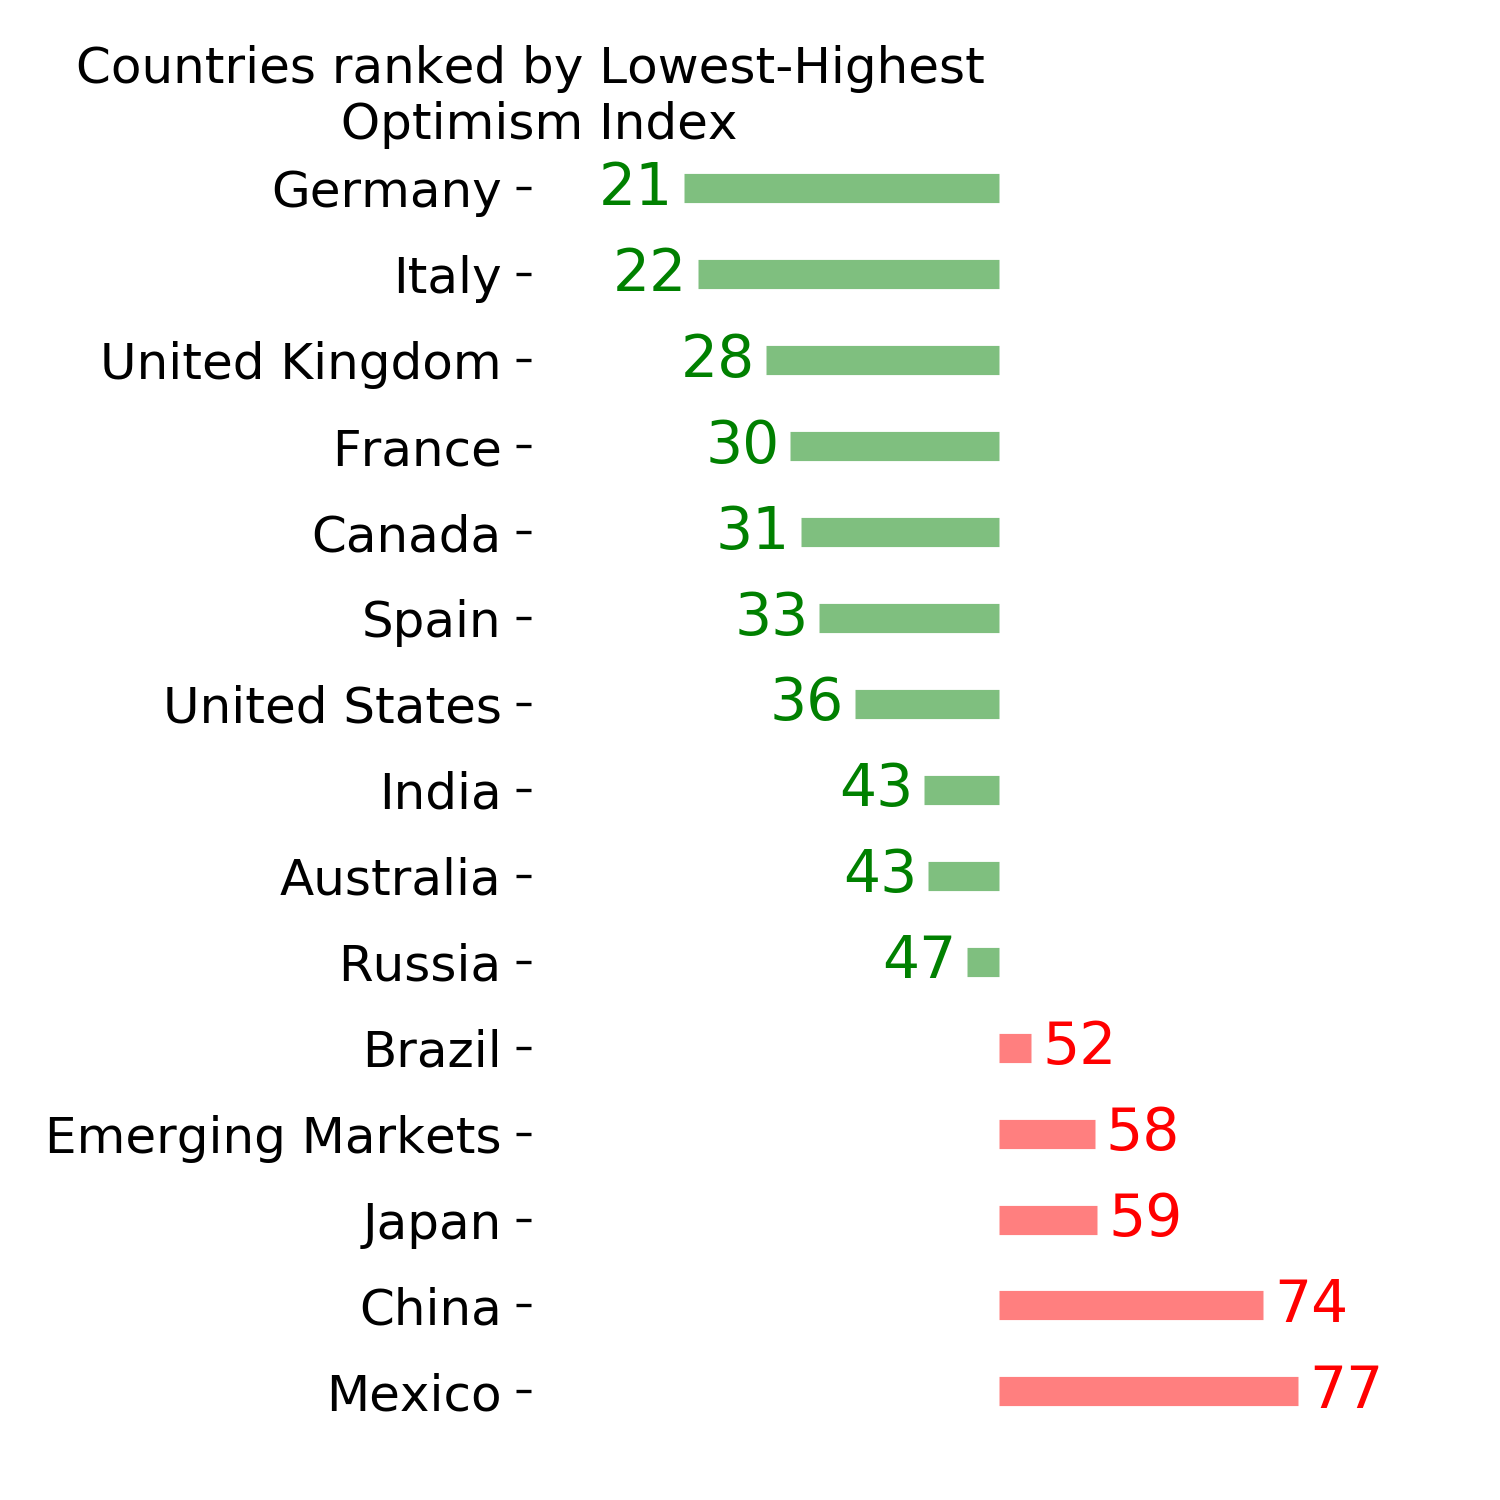
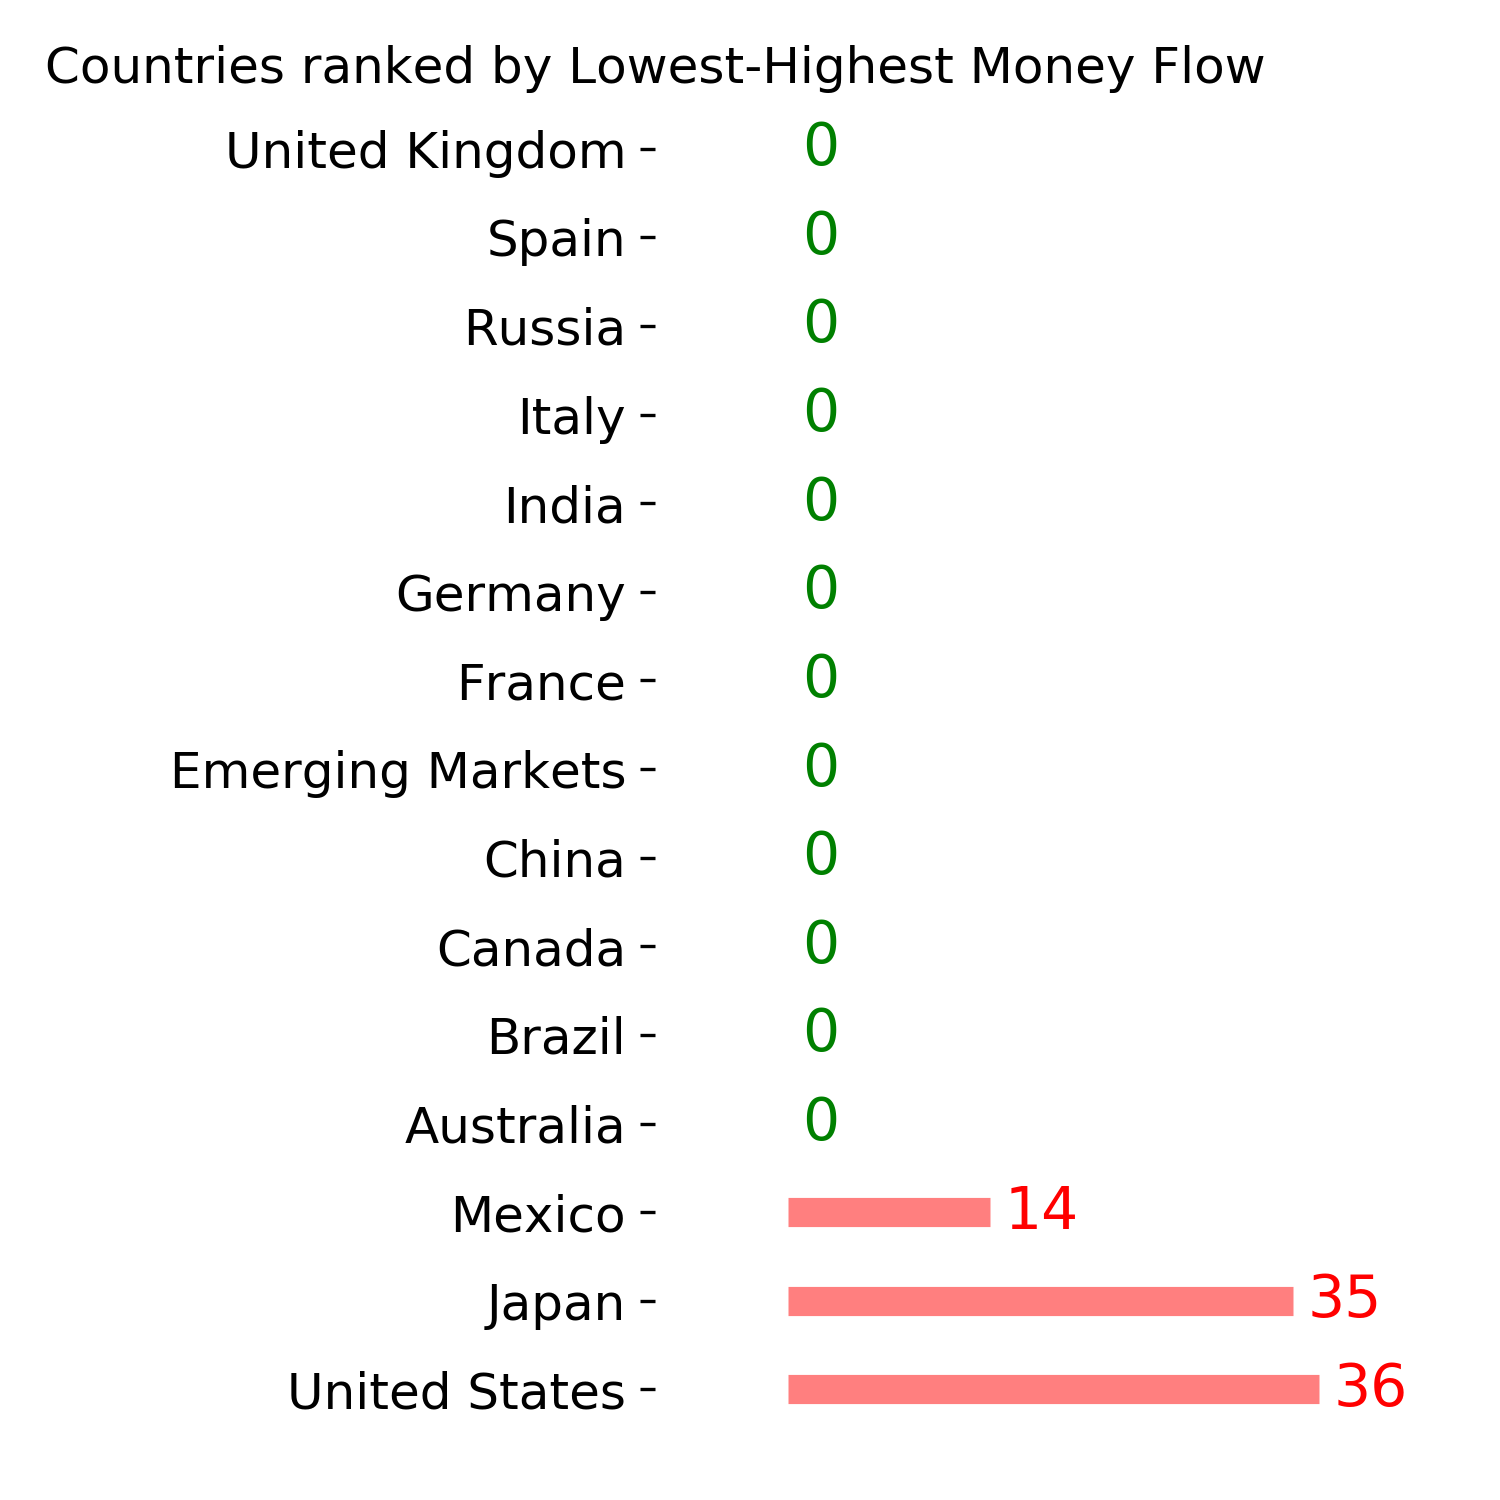
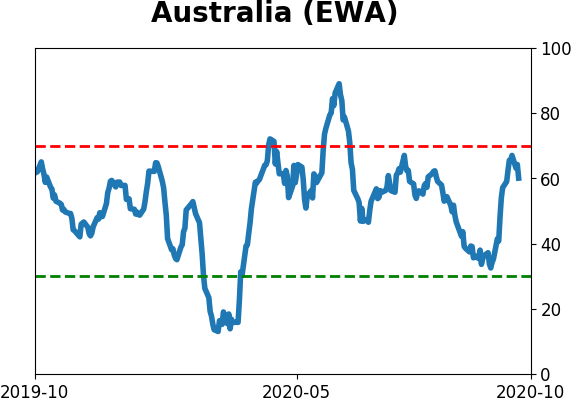
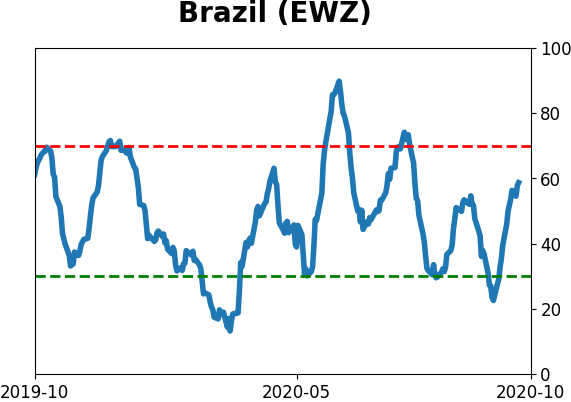
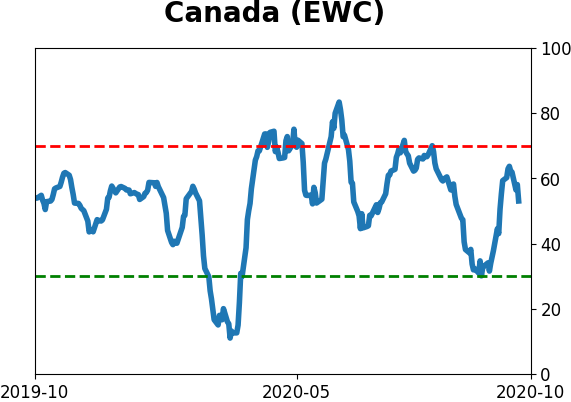
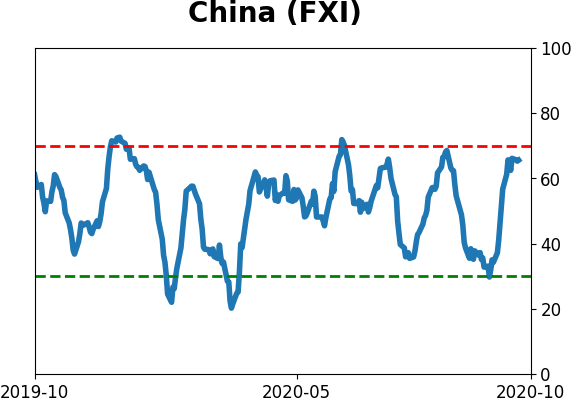
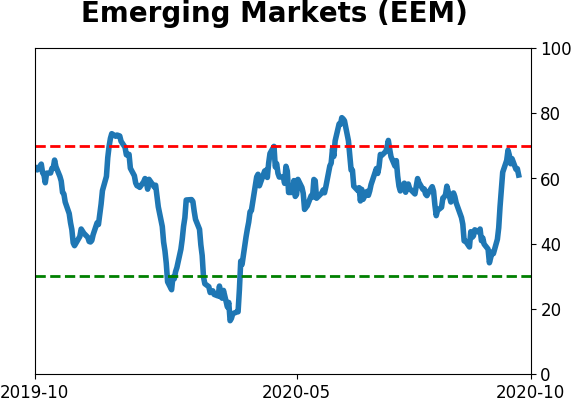
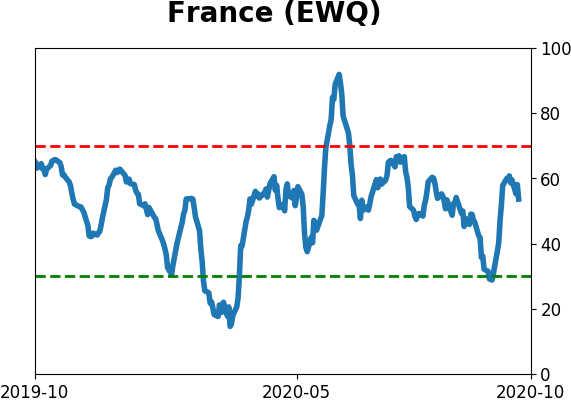
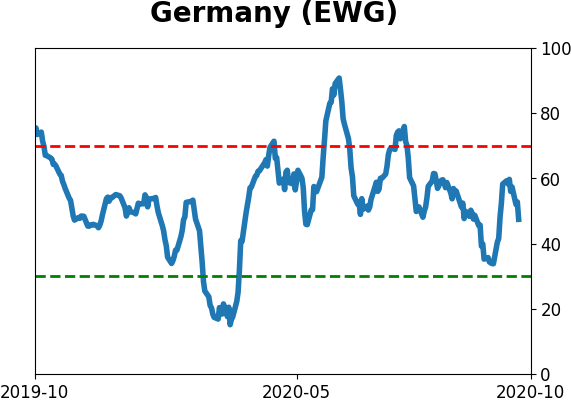
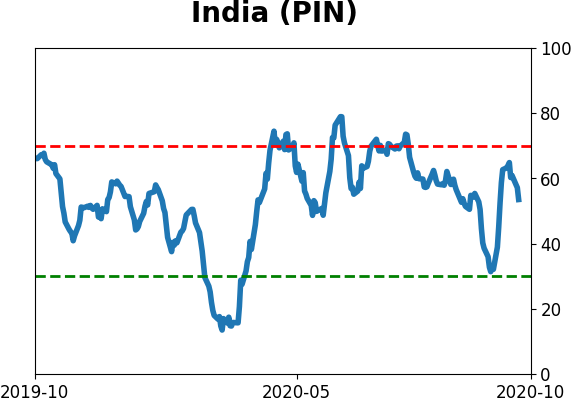
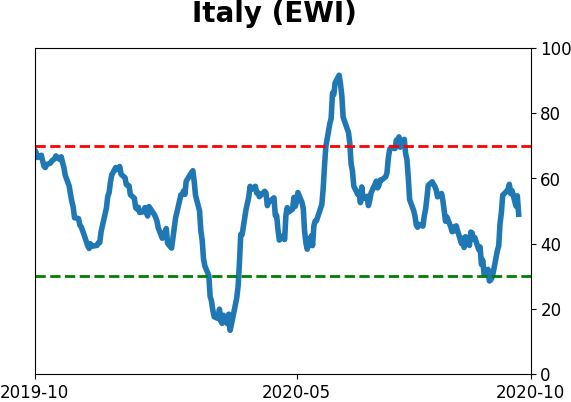
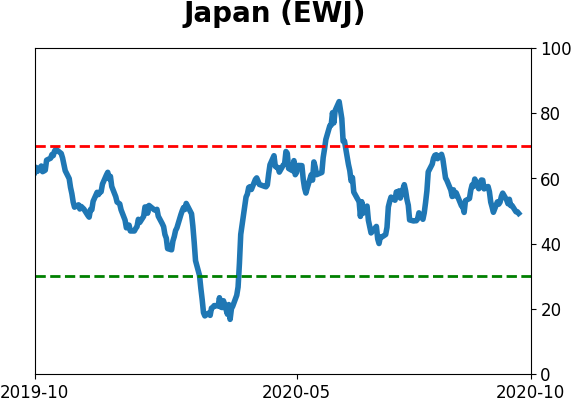
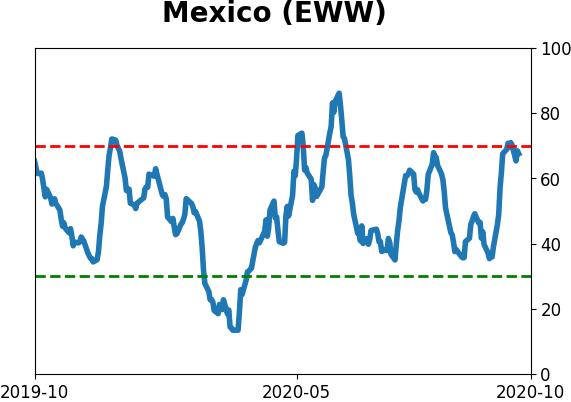
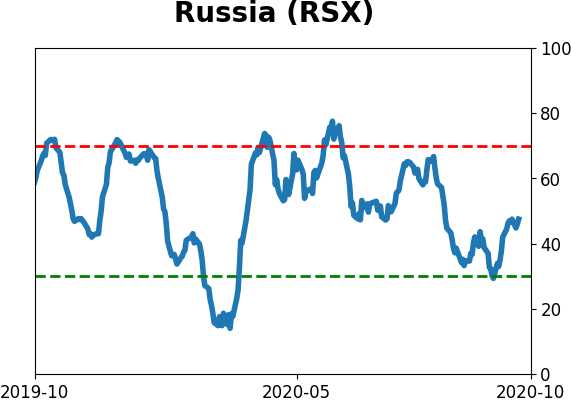
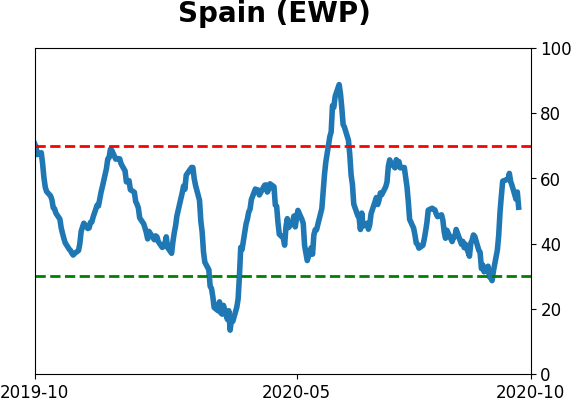
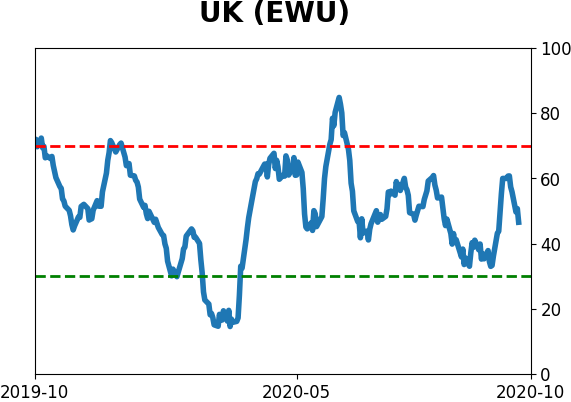
Country ETF's - 10-Day Moving Average
|
|
|
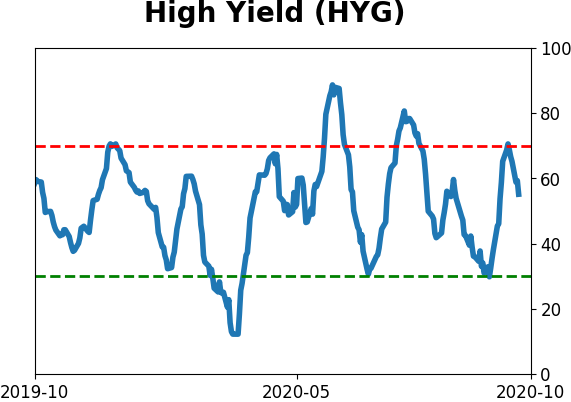
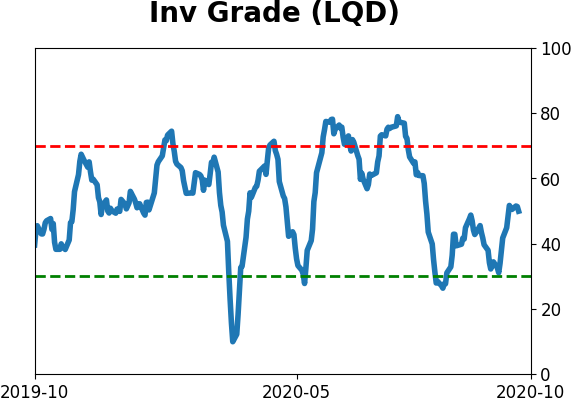
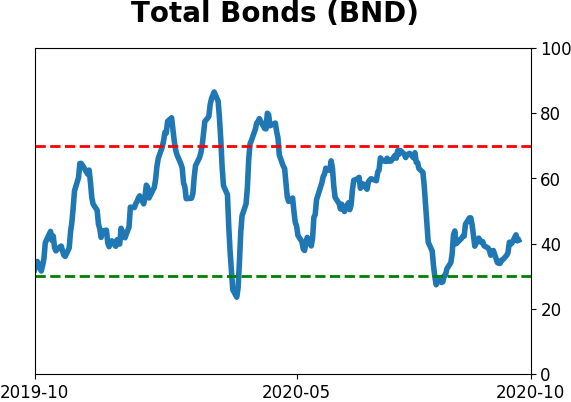
Bond ETF's - 10-Day Moving Average
|
|
|
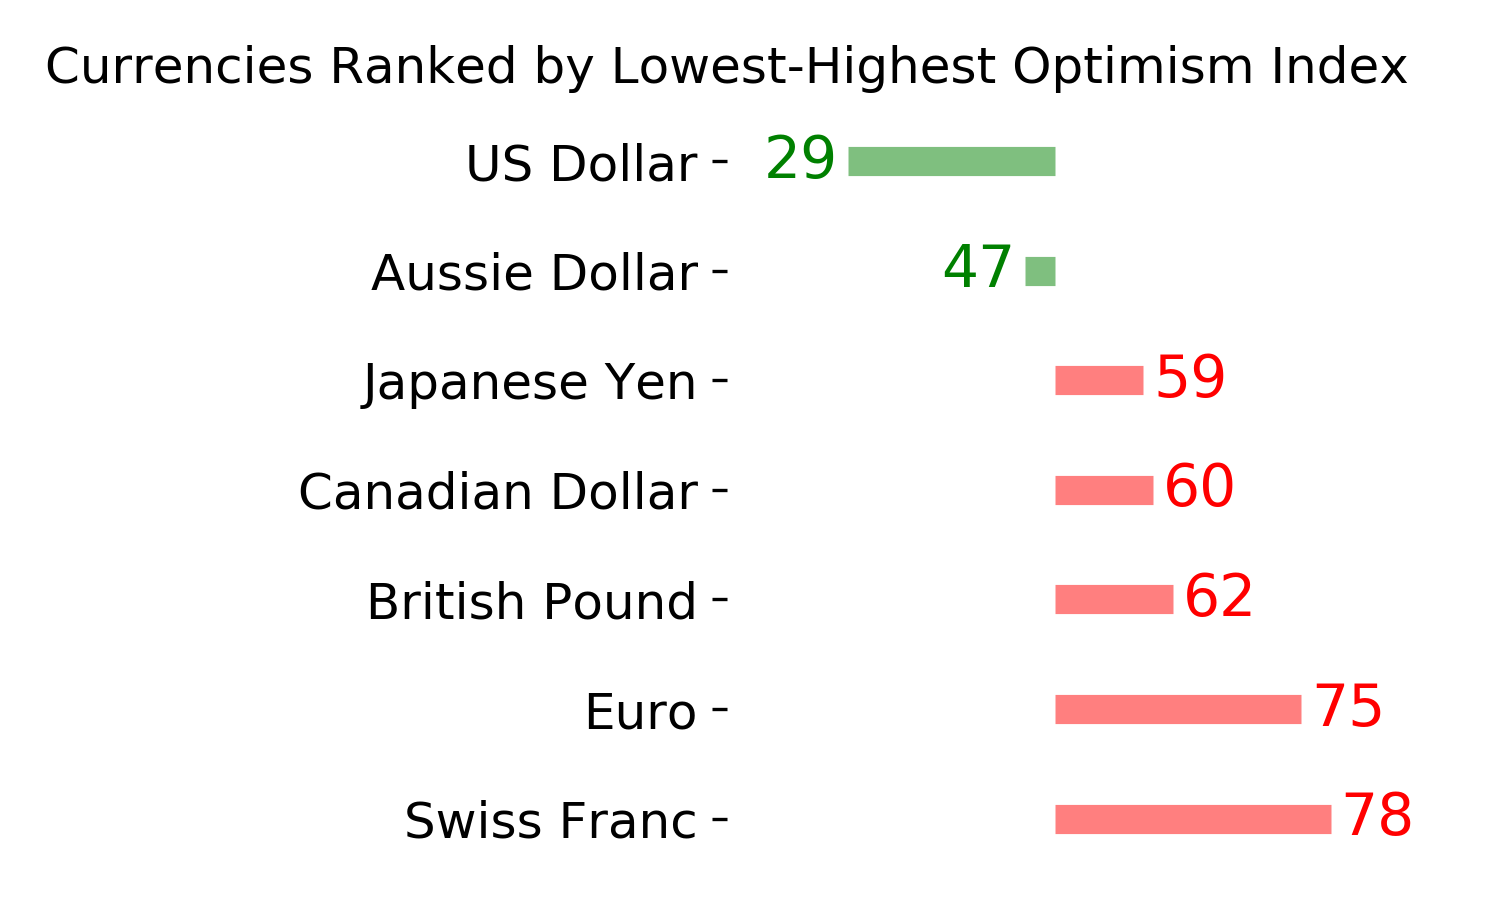
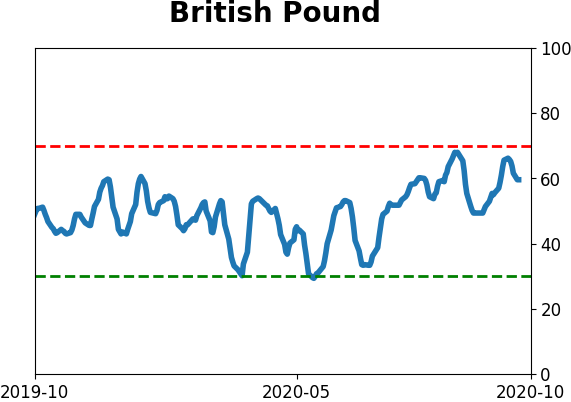
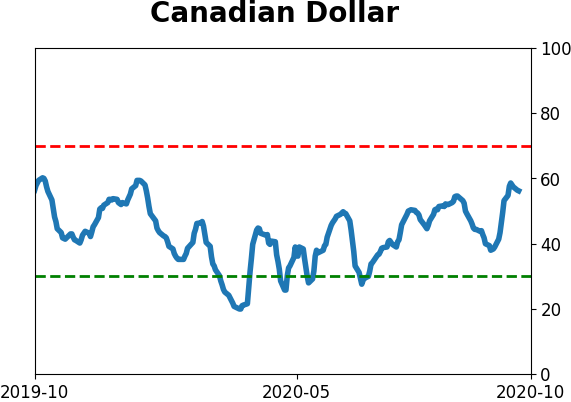
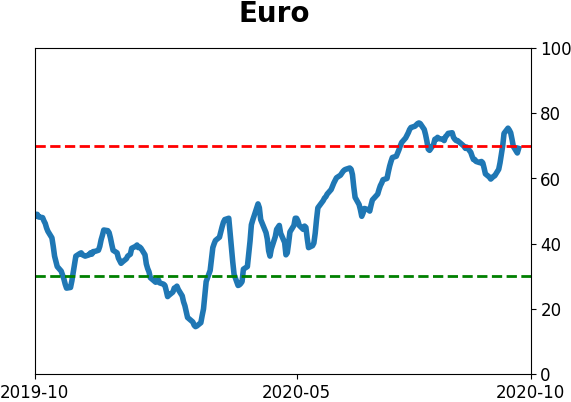
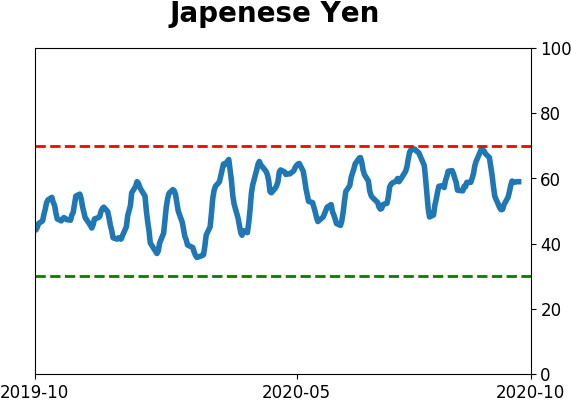
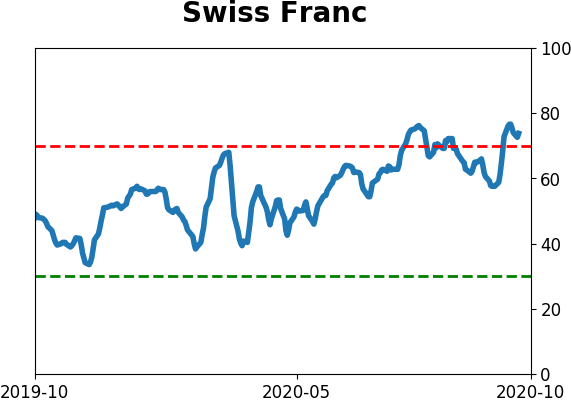
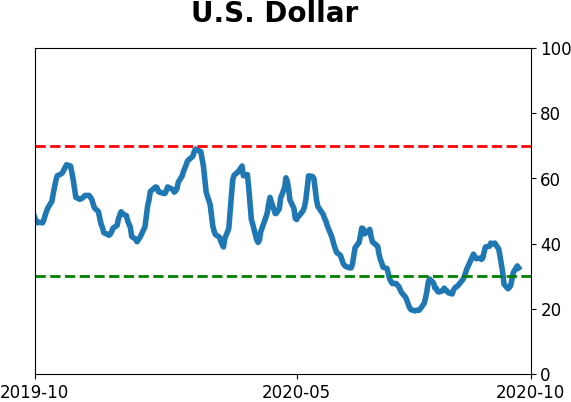
Currency ETF's - 5-Day Moving Average
|
|
|
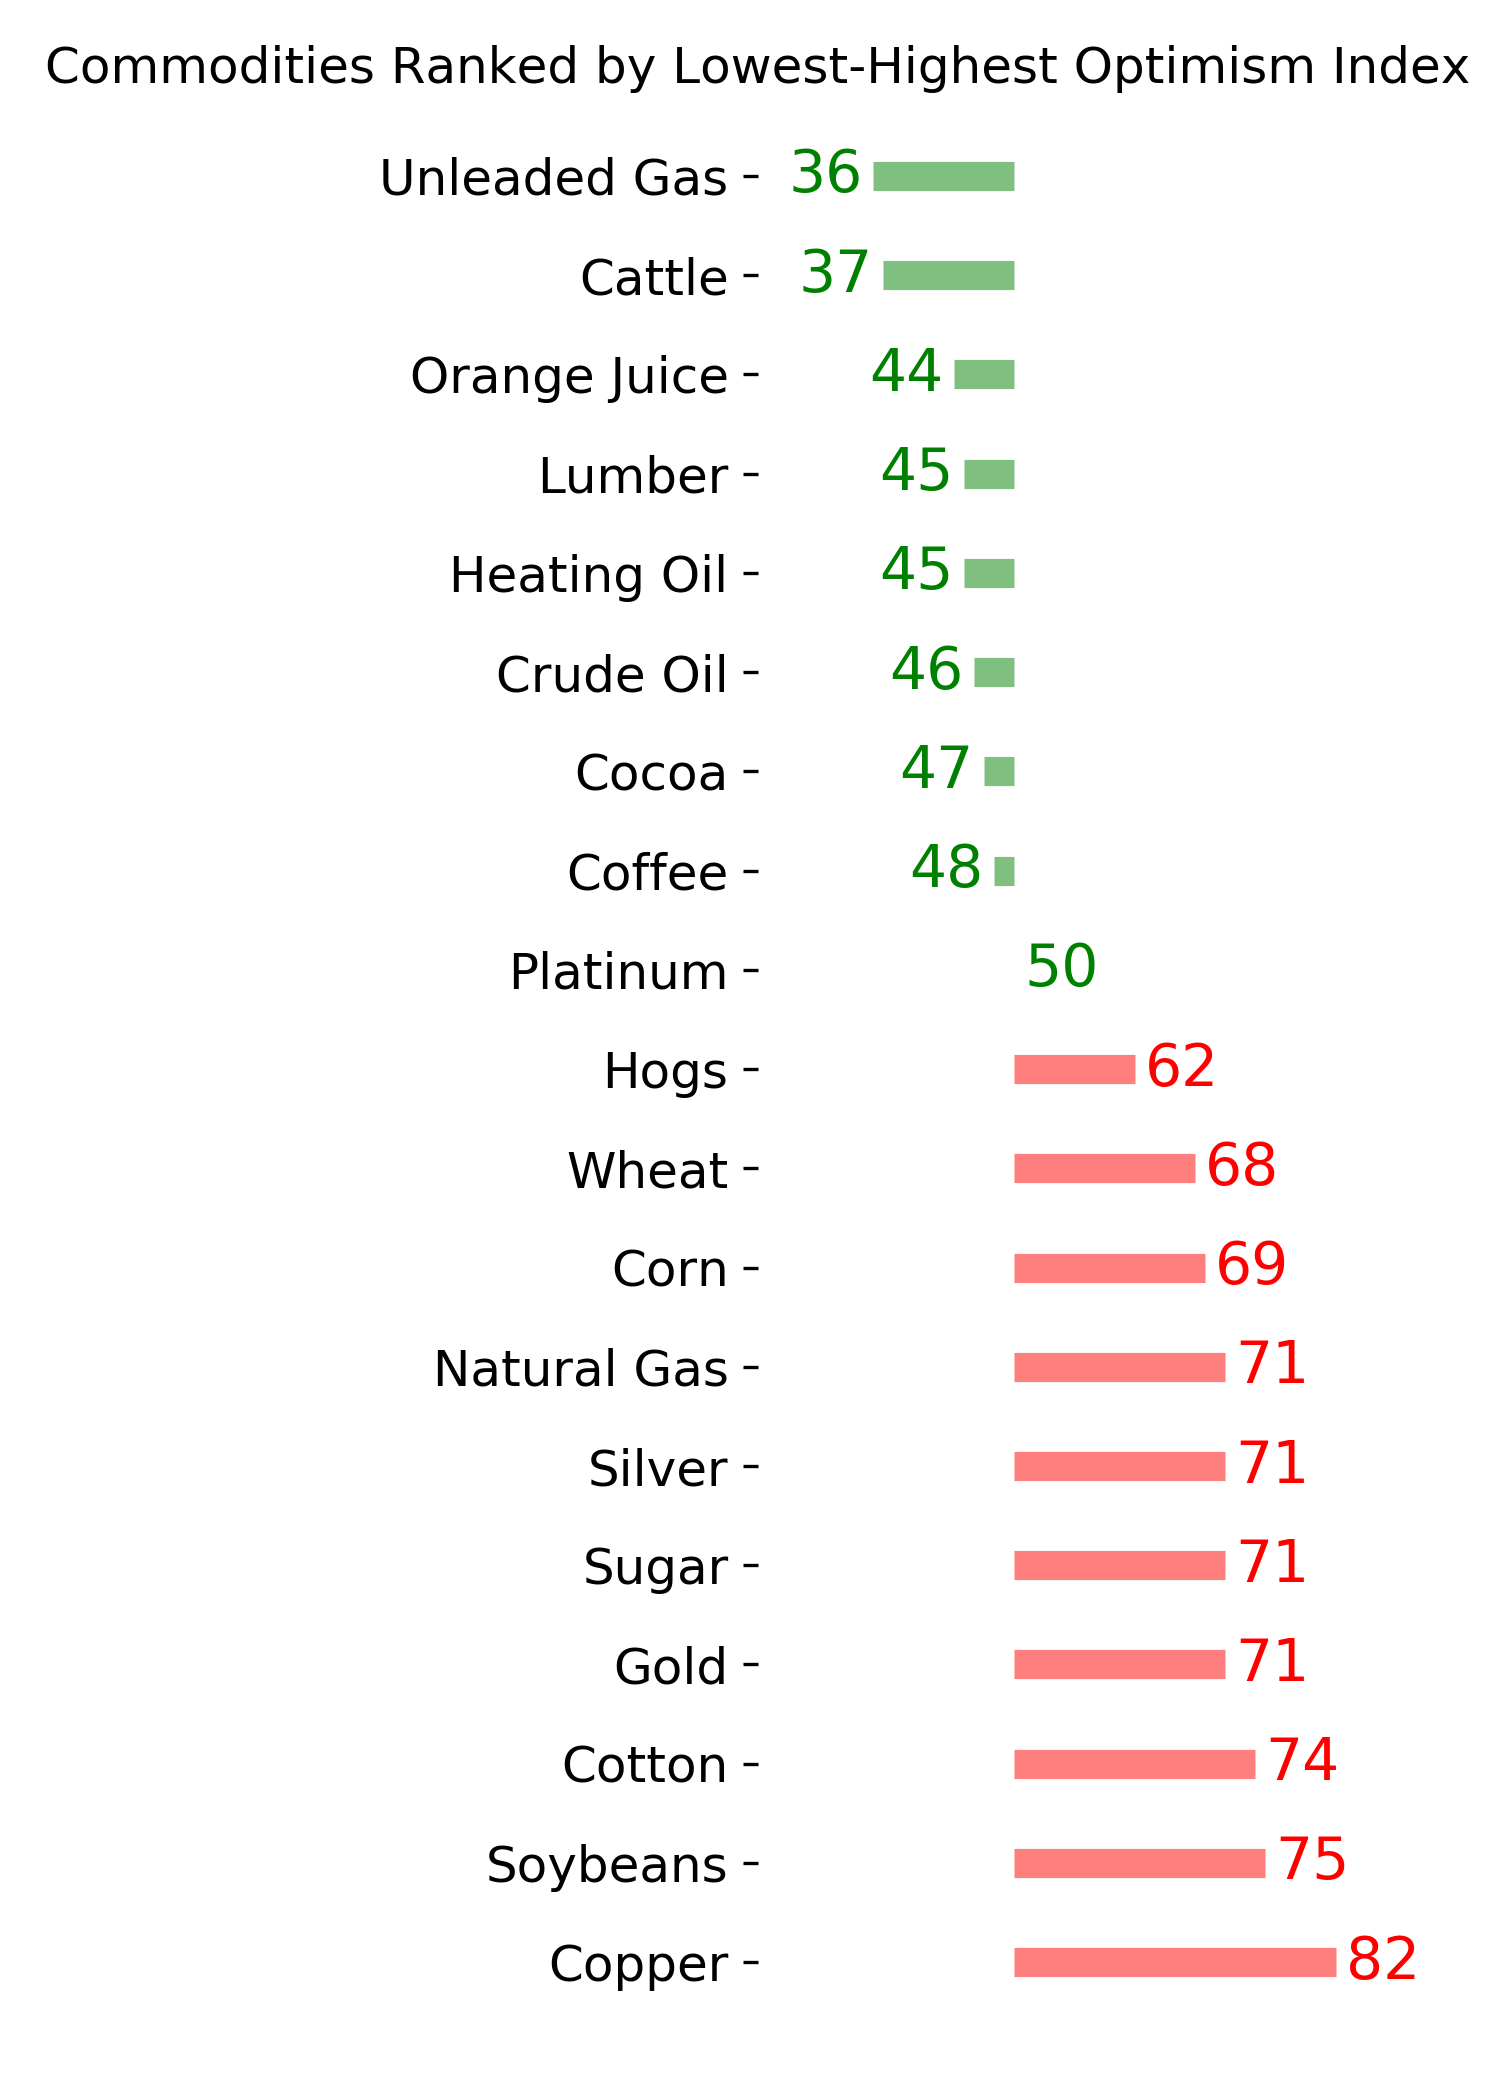
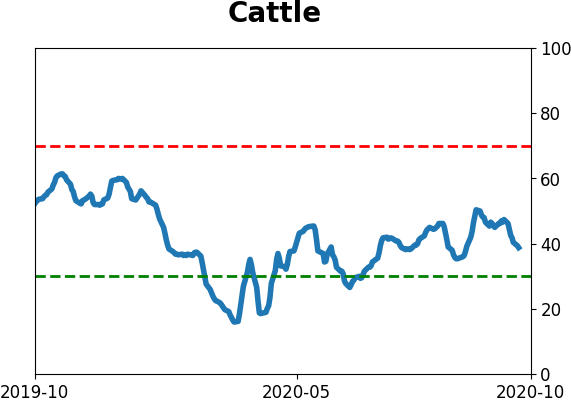
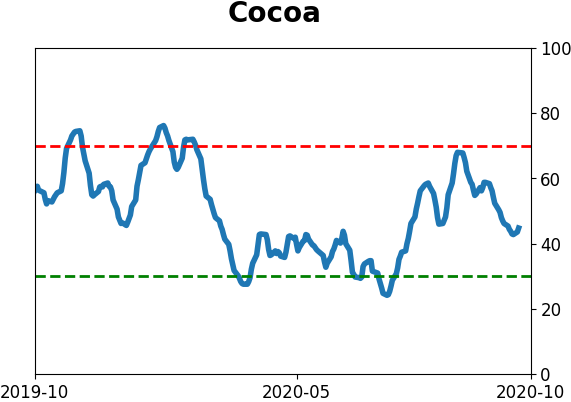
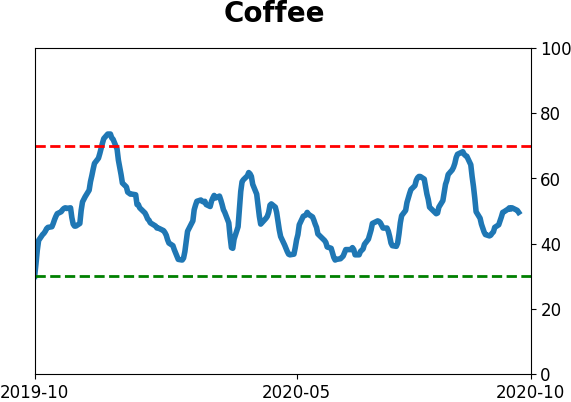
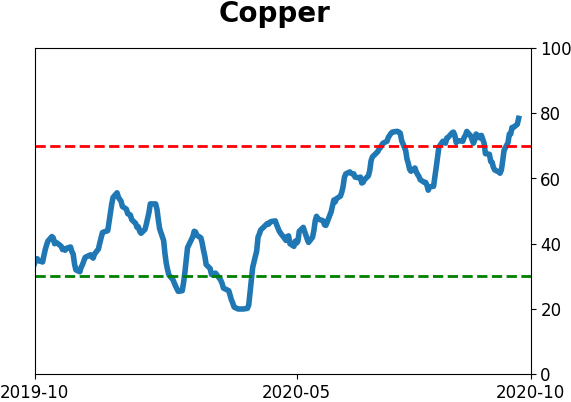
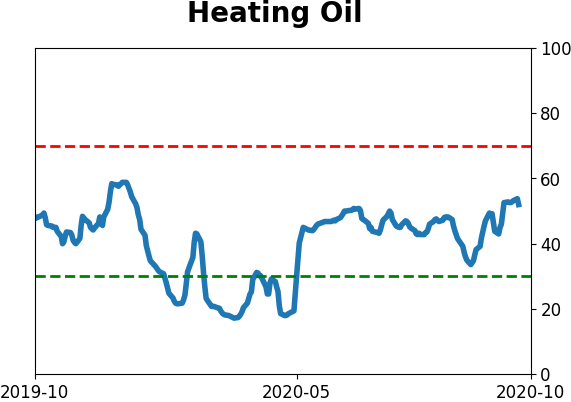
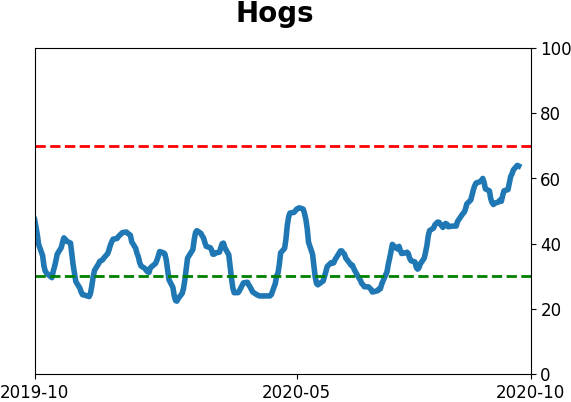
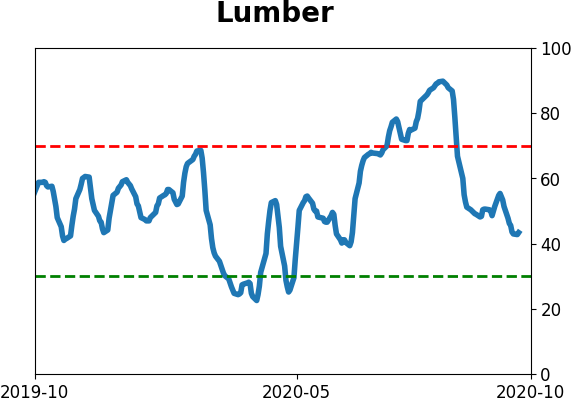
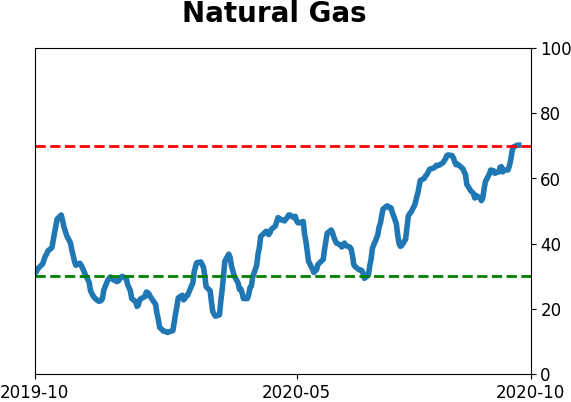
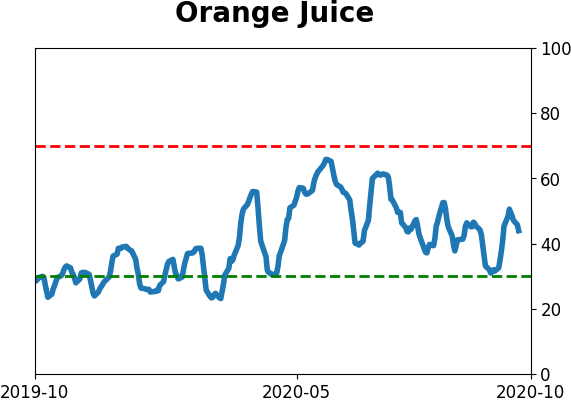
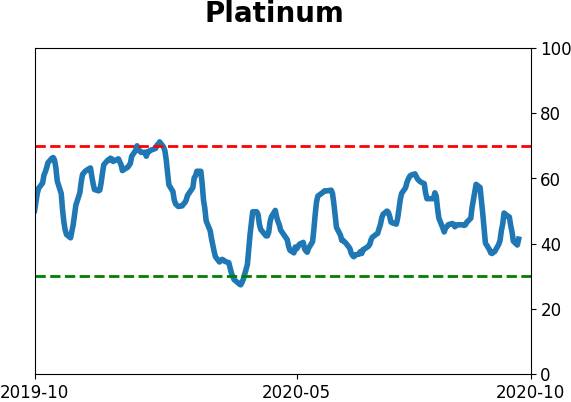
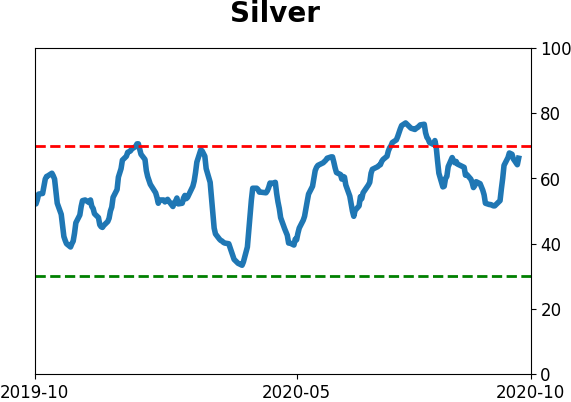
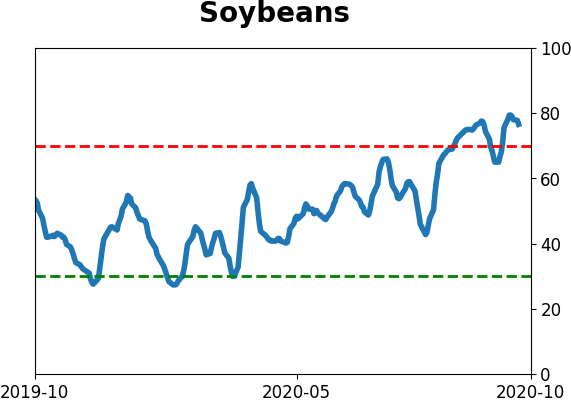
Commodity ETF's - 5-Day Moving Average
|
|