Headlines
|
|
Big Money turns positive for the 1st time in 2 years:
The latest Barron's survey of big money managers shows that they've turned optimistic on stocks for the 1st time since October 2018. Stocks have shown better forward returns when these managers were optimistic than when they were pessimistic.
Smart money turns negative on the dollar:
For the first time in months, commercial hedgers turned negative on the dollar. They'd been net long for more than three months, the longest stretch in almost a decade. Other times when hedgers flipped from net long to short, the dollar struggled in the months ahead.
Bottom Line:
- A positive environment favors becoming aggressive on signs of excessive pessimism.
|
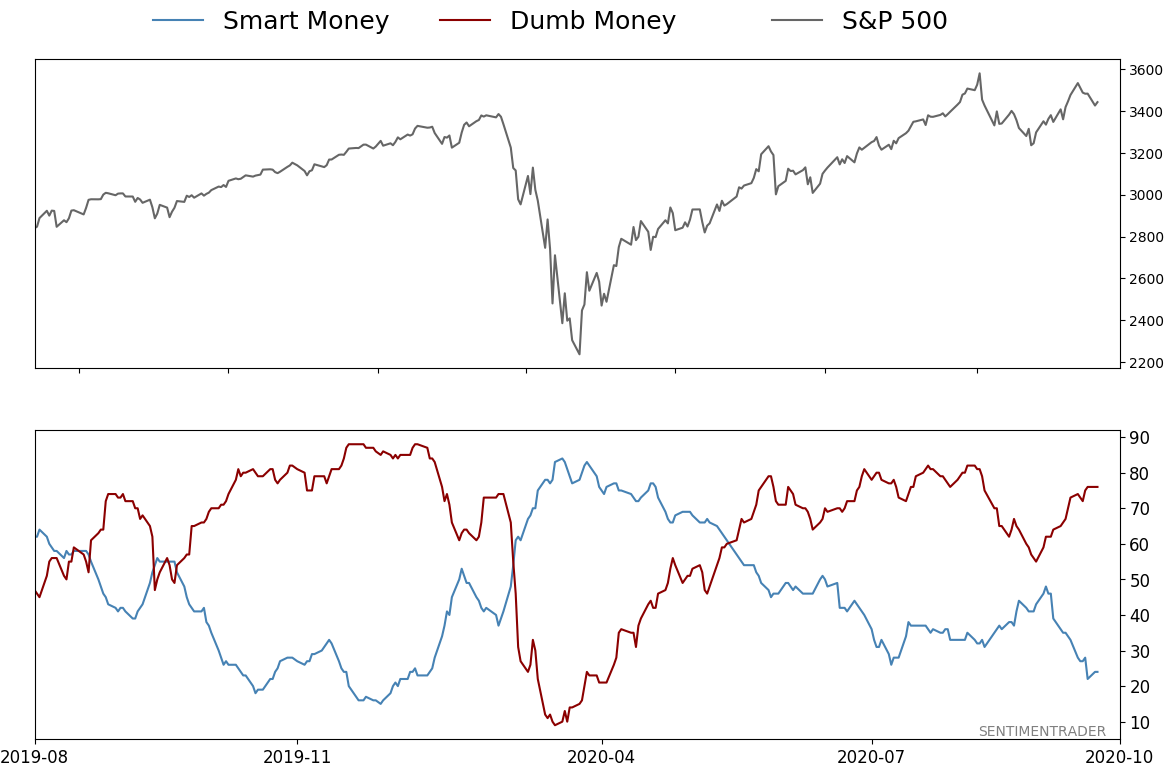
Smart / Dumb Money Confidence
|
Smart Money Confidence: 24%
Dumb Money Confidence: 76%
|
|
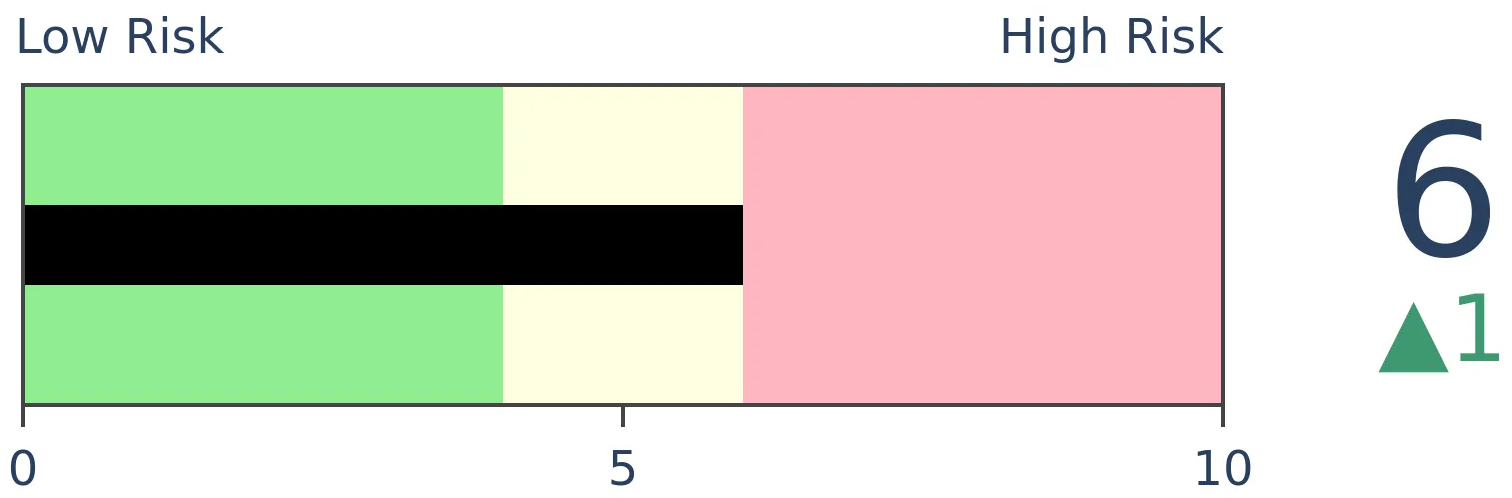
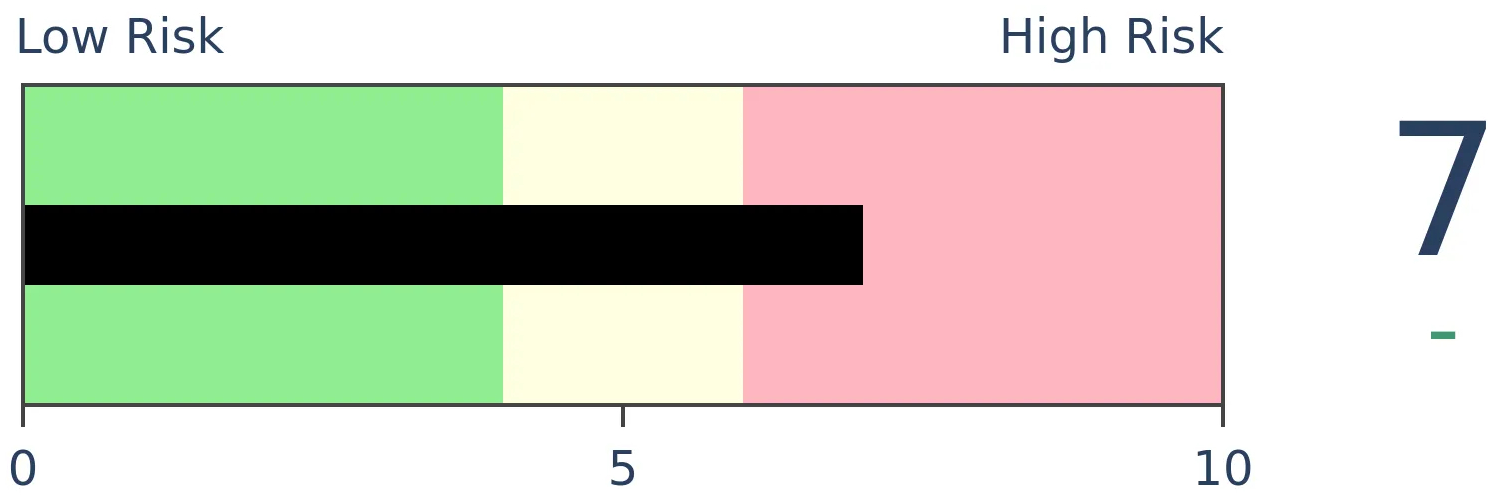
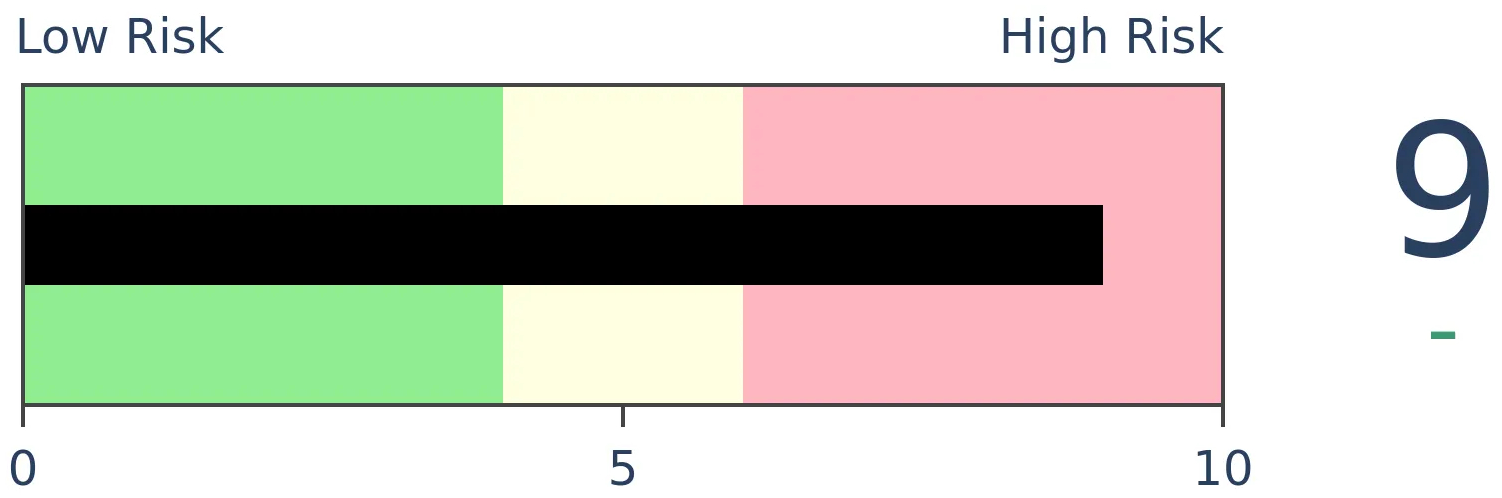
Risk Levels
Stocks Short-Term
|
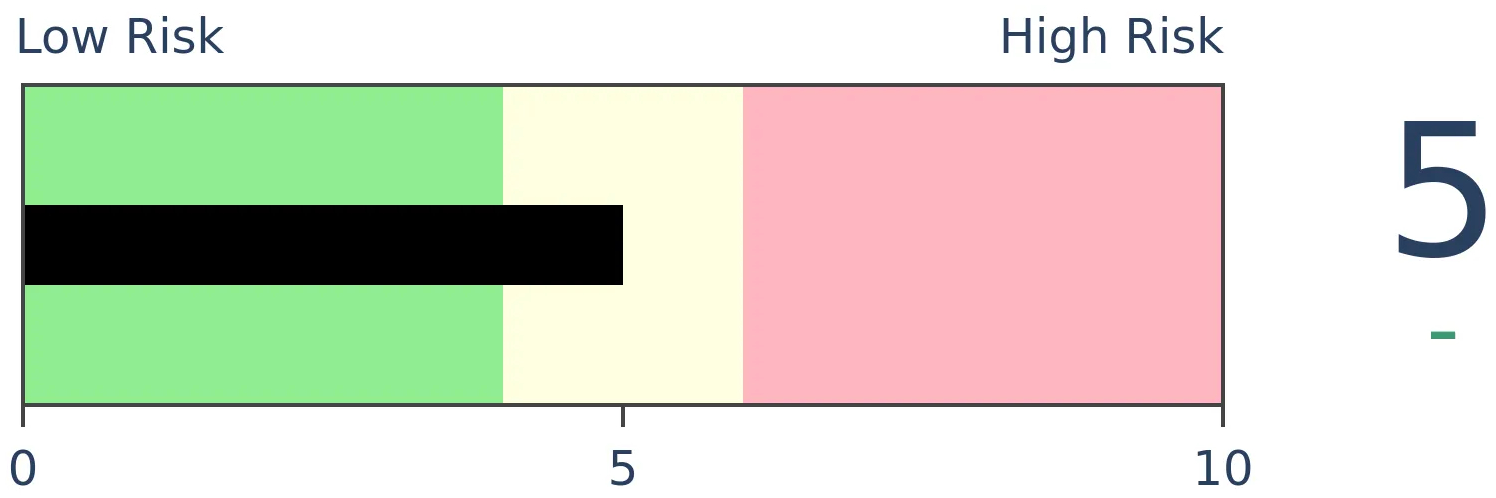
Stocks Medium-Term
|
|
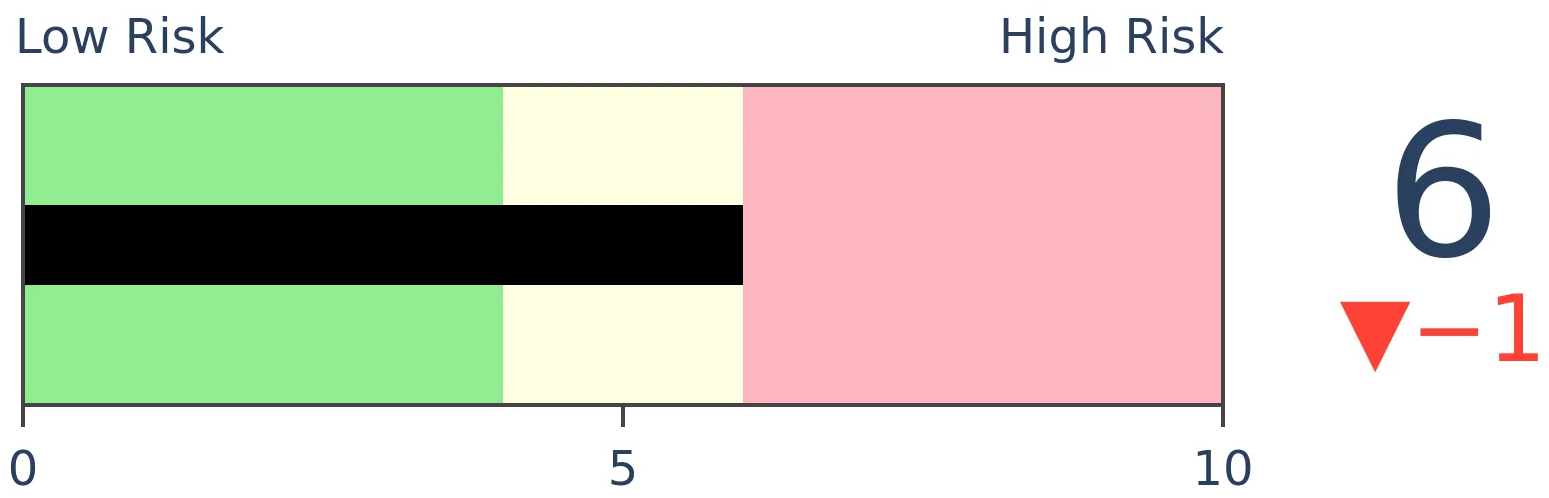
Bonds
|
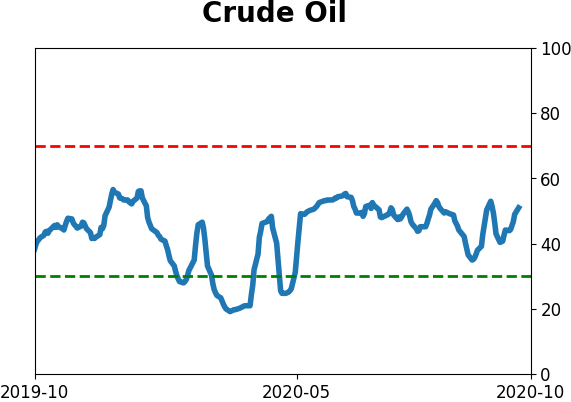
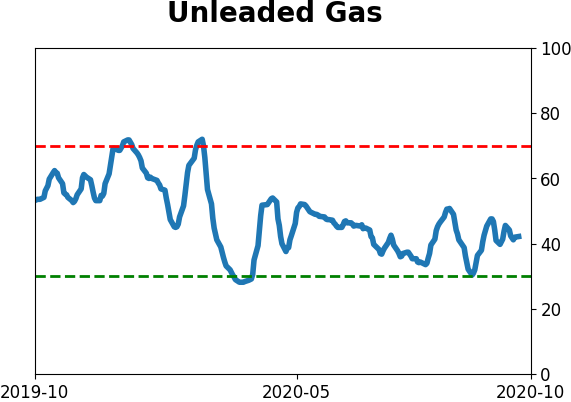
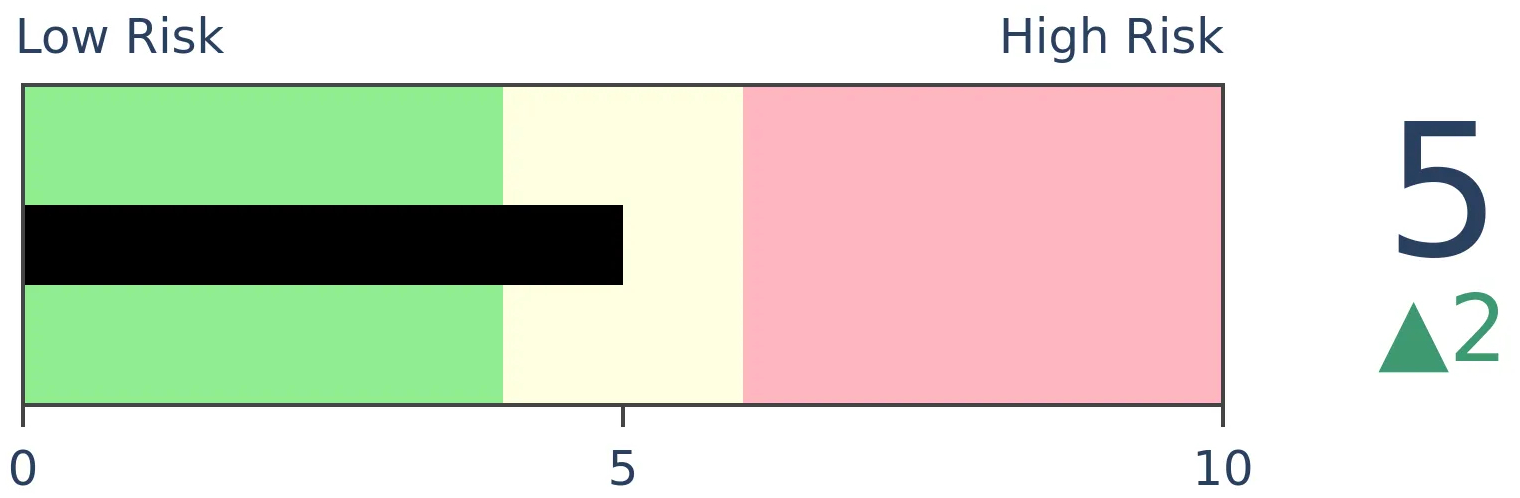
Crude Oil
|
|
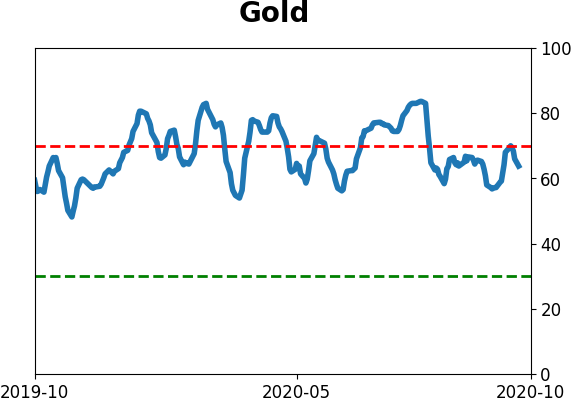
Gold
|
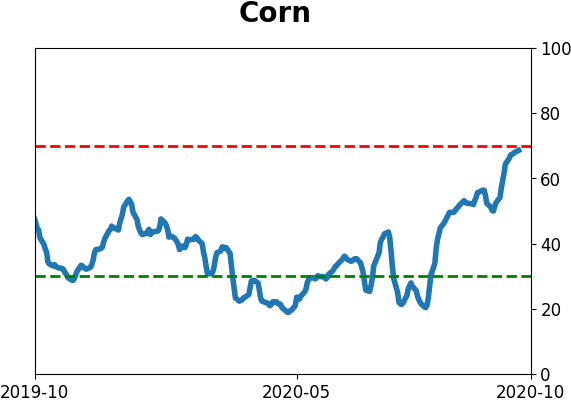
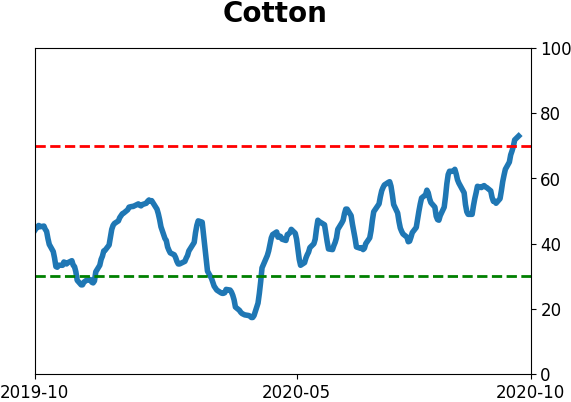
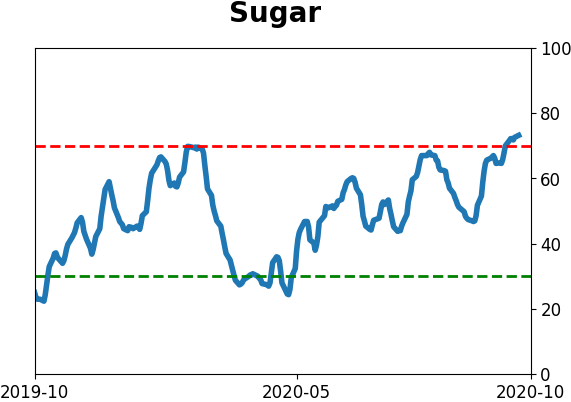
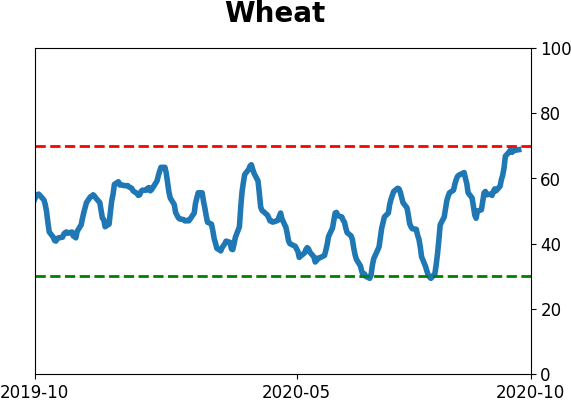
Agriculture
|
|
Research
BOTTOM LINE
The latest Barron's survey of big money managers shows that they've turned optimistic on stocks for the 1st time since October 2018. Stocks have shown better forward returns when these managers were optimistic than when they were pessimistic.
FORECAST / TIMEFRAME
None
|
Over the past 20 years, we've seen ample evidence that equating "big money" with "smart money" is often a mistake. Institutional investors can fall prey to the same biases caused by group-think as mom-and-pop.
The latest Big Money poll by Barron's shows that large money managers have turned positive again. After 3 straight semi-annual polls showing a bullish percentage below 50%, the latest results show a majority of bulls.
In the spring, this group had been very negative on stocks, with fewer than 40% of managers expecting stocks to rise over the next 6 months. Optimism that low tended to be a good sign for forward returns. Now the percentage of optimistic managers is the highest since October 2018.
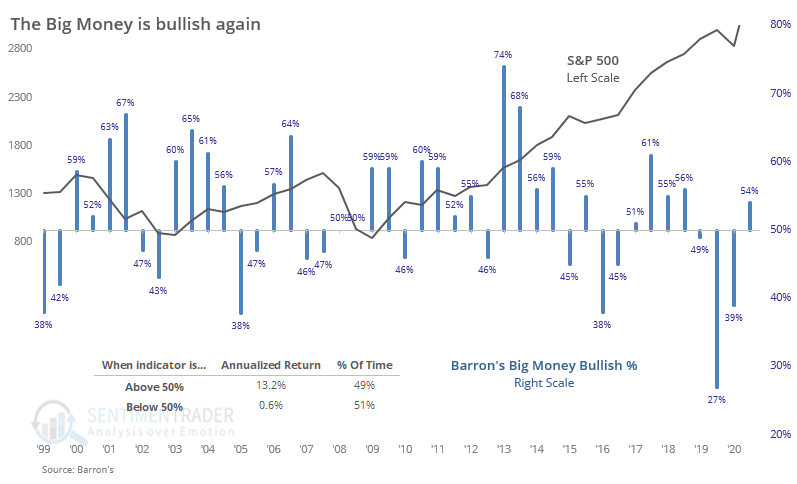
In general, the S&P 500 has performed better when more than half of the managers were bullish. The S&P 500's annualized return was +13.2% following those surveys, versus a lowly +0.6% when less than half of managers were bullish.
Like we saw in the spring, the exception is when they're really pessimistic, then returns turn more positive. That's true with many sentiment indicators - whey they're showing a risk-off attitude, it's bad for stocks until it gets to the point of showing extreme pessimism, then they're more useful as contrary indicators.
In the decades that we've been covering this survey, it has proved only modestly useful. It's a good sign when managers are bullish and a very mild warning (if even that) when managers are extremely bullish. It's a modest negative when managers are pessimistic, but quite bullish when they're extremely pessimistic.
This suggests that their current attitude of mild optimism is a slight positive for stocks going forward.
BOTTOM LINE
For the first time in months, commercial hedgers turned negative on the dollar. They'd been net long for more than three months, the longest stretch in almost a decade. Other times when hedgers flipped from net long to short, the dollar struggled in the months ahead.
FORECAST / TIMEFRAME
DOLLAR -- Down, Medium-Term
|
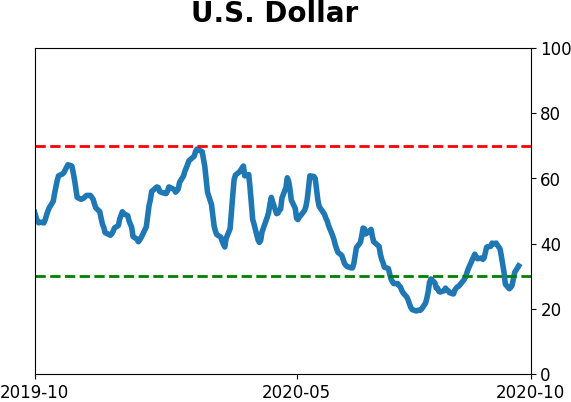
The smart money has gone net short stocks for the first time in months. They've also started to short the U.S. dollar.
The last two times they flirted with longs in the dollar and then flipped to short, the buck proceeded to rally strongly. Commercial hedgers have underlying exposure to the contracts they're trading, so while it always seems like they're fighting the primary trend, they're not. They're just constantly adjusting their exposure and should never truly be net short any market.
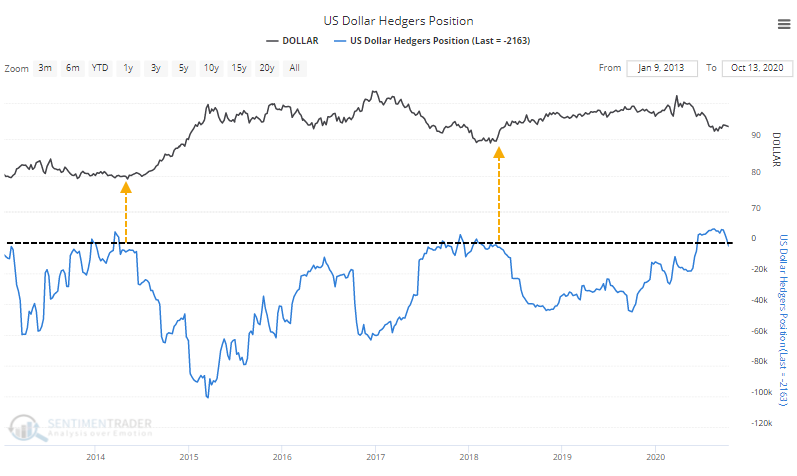
Those last two instances are a bit different from what we've seen in recent months because hedgers only flirted with being net long, and not for any more than a few weeks at a time. This time, they were net long for several months.
When hedgers have flipped to net short after at least 12 weeks of being net long, the dollar suffered going forward, thanks to all of the signals triggering during a terrible decade.
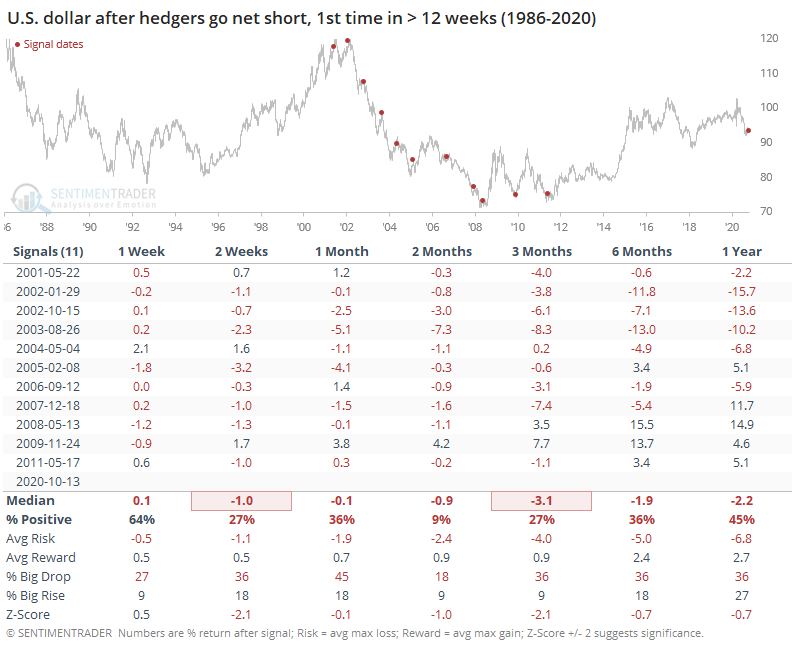
Since all of the signals occurred from 2001- 2011, the dollar had a tough time showing a positive return on almost any time frame. Between 2-3 months, it sported a negative return every time.
While they're not perfectly inverse, the dollar does tend to influence markets like precious metals. So the weakness in the buck also meant consistent gains for gold.
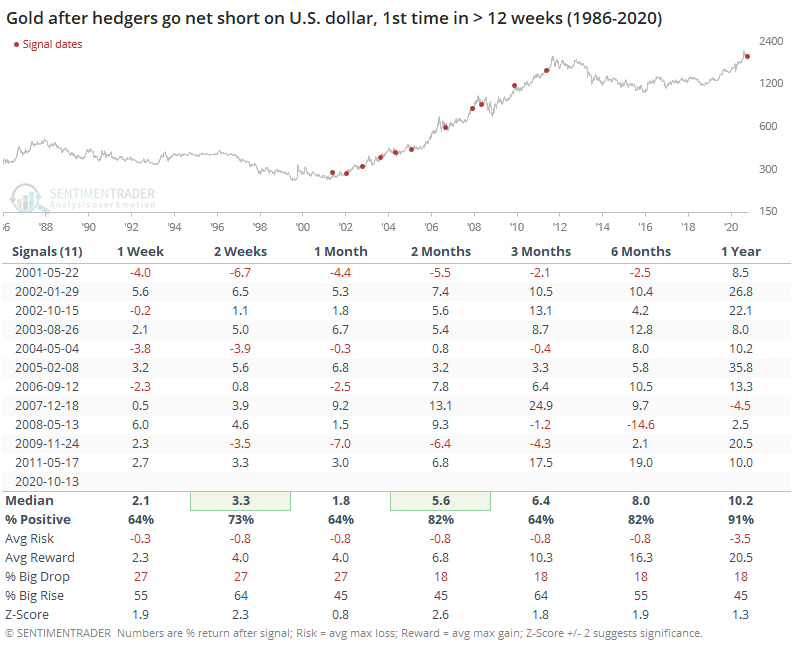
Because these signals triggered during one of the best decades for gold, its risk/reward going forward was exceptional. On average, it suffered no more than a -0.8% loss over the next several months, while enjoying double-digit maximum gains.
The dollar's correlation with stocks is inconsistent, but these signals proved tough for stocks.
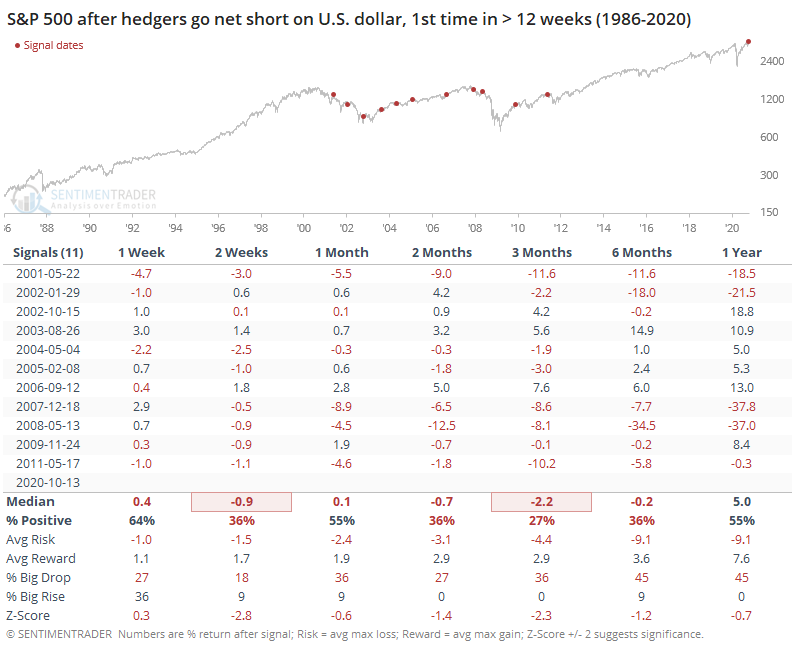
Over the next three months, the S&P showed a positive return only 27% of the time, with a poor risk/reward and much larger probability of a big drop than a big rise.
We'd have more confidence in these outcomes if they were scattered over more cycles instead of clustered during a single decade. It still appears to be a modest negative for the dollar, at least.
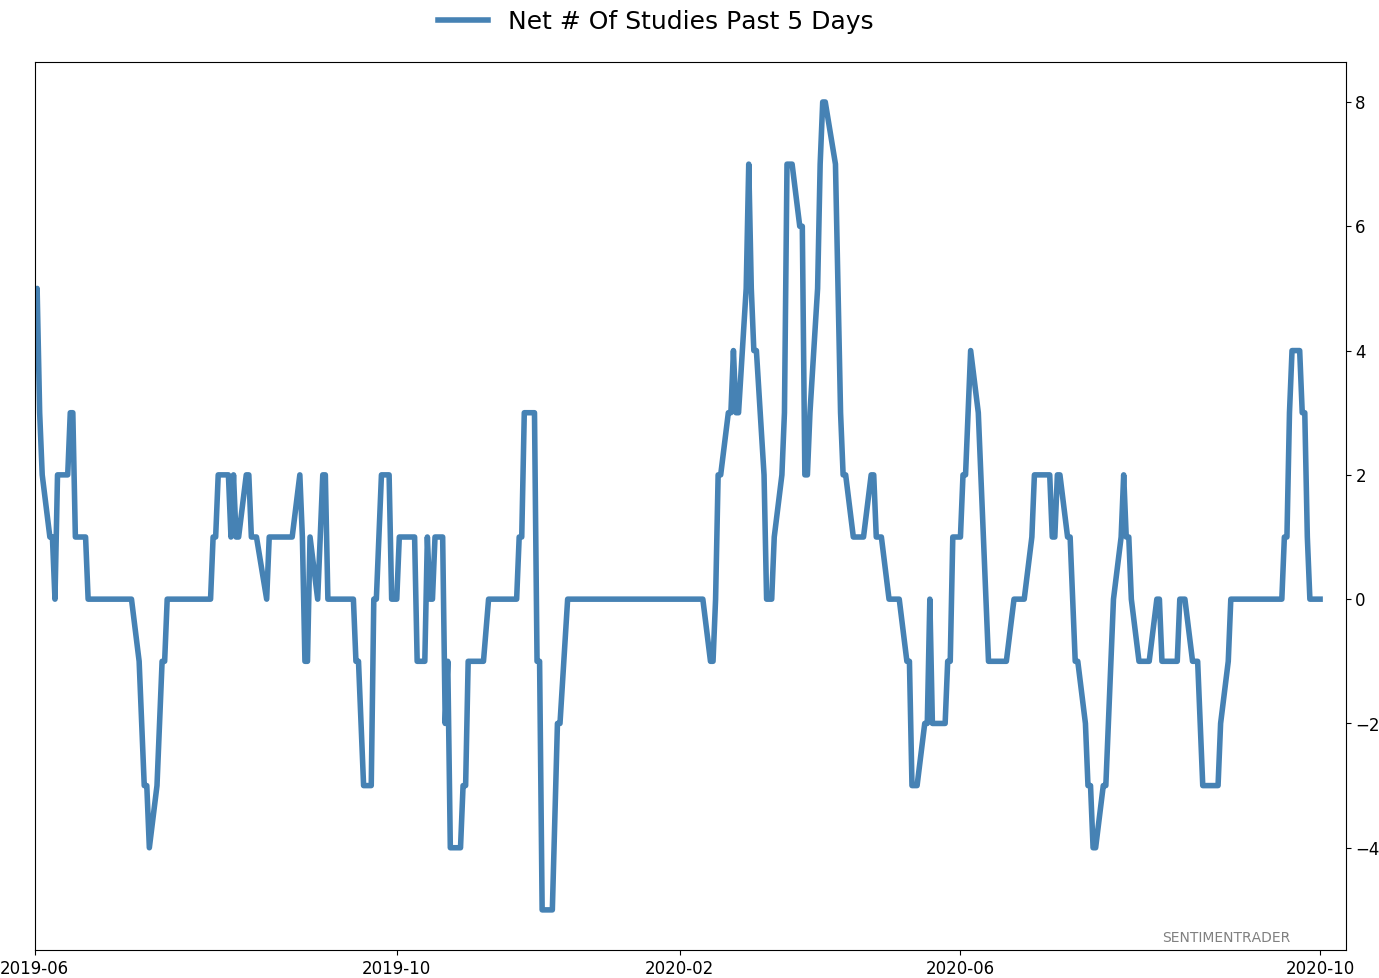
Active Studies
| Time Frame | Bullish | Bearish | | Short-Term | 0 | 0 | | Medium-Term | 4 | 8 | | Long-Term | 48 | 2 |
|
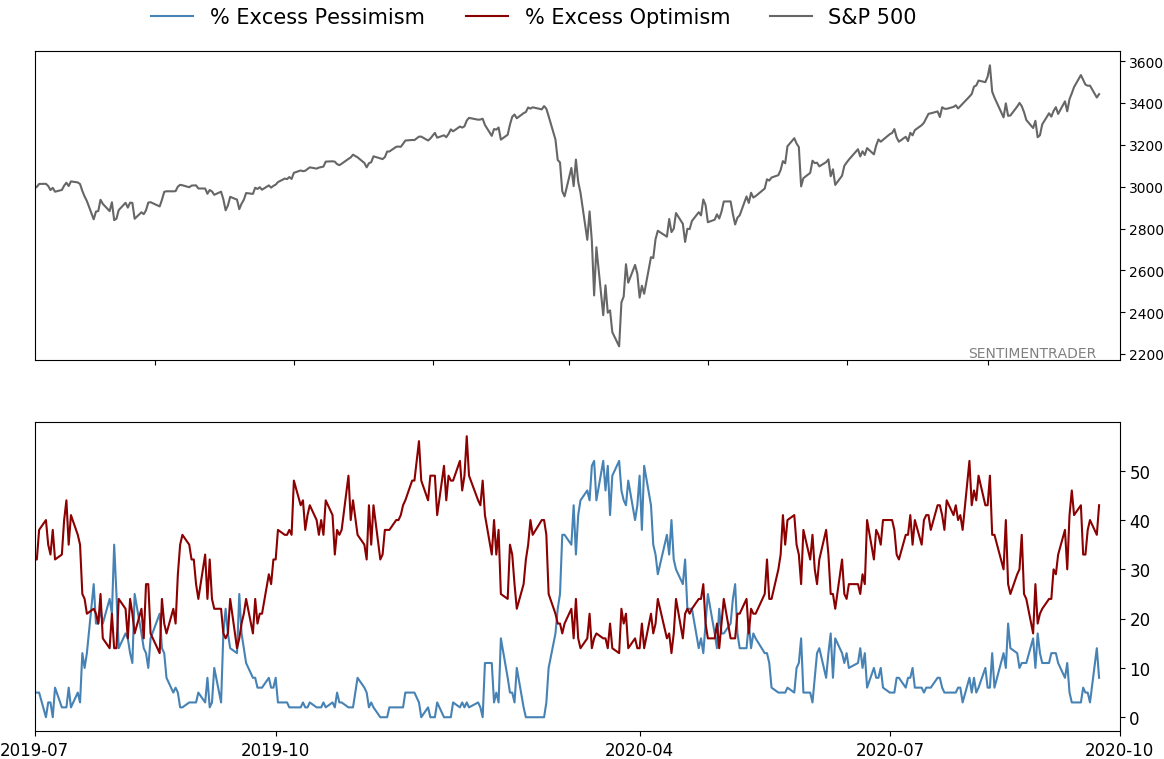
Indicators at Extremes
Portfolio
| Position | Description | Weight % | Added / Reduced | Date | | Stocks | 15.6% RSP, 10.1% VWO, 7.5% XLE, 5.1% PSCE | 38.2 | Added 5% | 2020-10-15 | | Bonds | 10% BND, 10% SCHP, 10% ANGL | 29.7 | Reduced 0.1% | 2020-10-02 | | Commodities | GCC | 2.4 | Reduced 2.1%
| 2020-09-04 | | Precious Metals | GDX | 4.7 | Added 5% | 2020-09-09 | | Special Situations | | 0.0 | Reduced 5% | 2020-10-02 | | Cash | | 25.0 | | |
|
Updates (Changes made today are underlined)
After the September swoon wrung some of the worst of the speculation out of stocks, there are some signs that it's returning, especially in the options market. It's helped to push Dumb Money Confidence above 70%. A big difference between now and August is that in August, there was a multitude of days with exceptionally odd breadth readings. Some of the biggest stocks were masking underlying weakness. Combined with heavy speculative activity, it was a dangerous setup. Now, we've seen very strong internal strength, in the broad market, as well as tech and small-cap stocks. Prior signals almost invariably led to higher prices. That's hard to square with the idea that forward returns tend to be subdued when Confidence is high, but that's less reliable during healthy market conditions, which we're seeing now (for the most part). I added some risk with small-cap energy stocks, due to an increasing number of positive signs in both small-caps and energy. This is intended as a long-term position.
RETURN YTD: -0.6% 2019: 12.6%, 2018: 0.6%, 2017: 3.8%, 2016: 17.1%, 2015: 9.2%, 2014: 14.5%, 2013: 2.2%, 2012: 10.8%, 2011: 16.5%, 2010: 15.3%, 2009: 23.9%, 2008: 16.2%, 2007: 7.8%
|
|
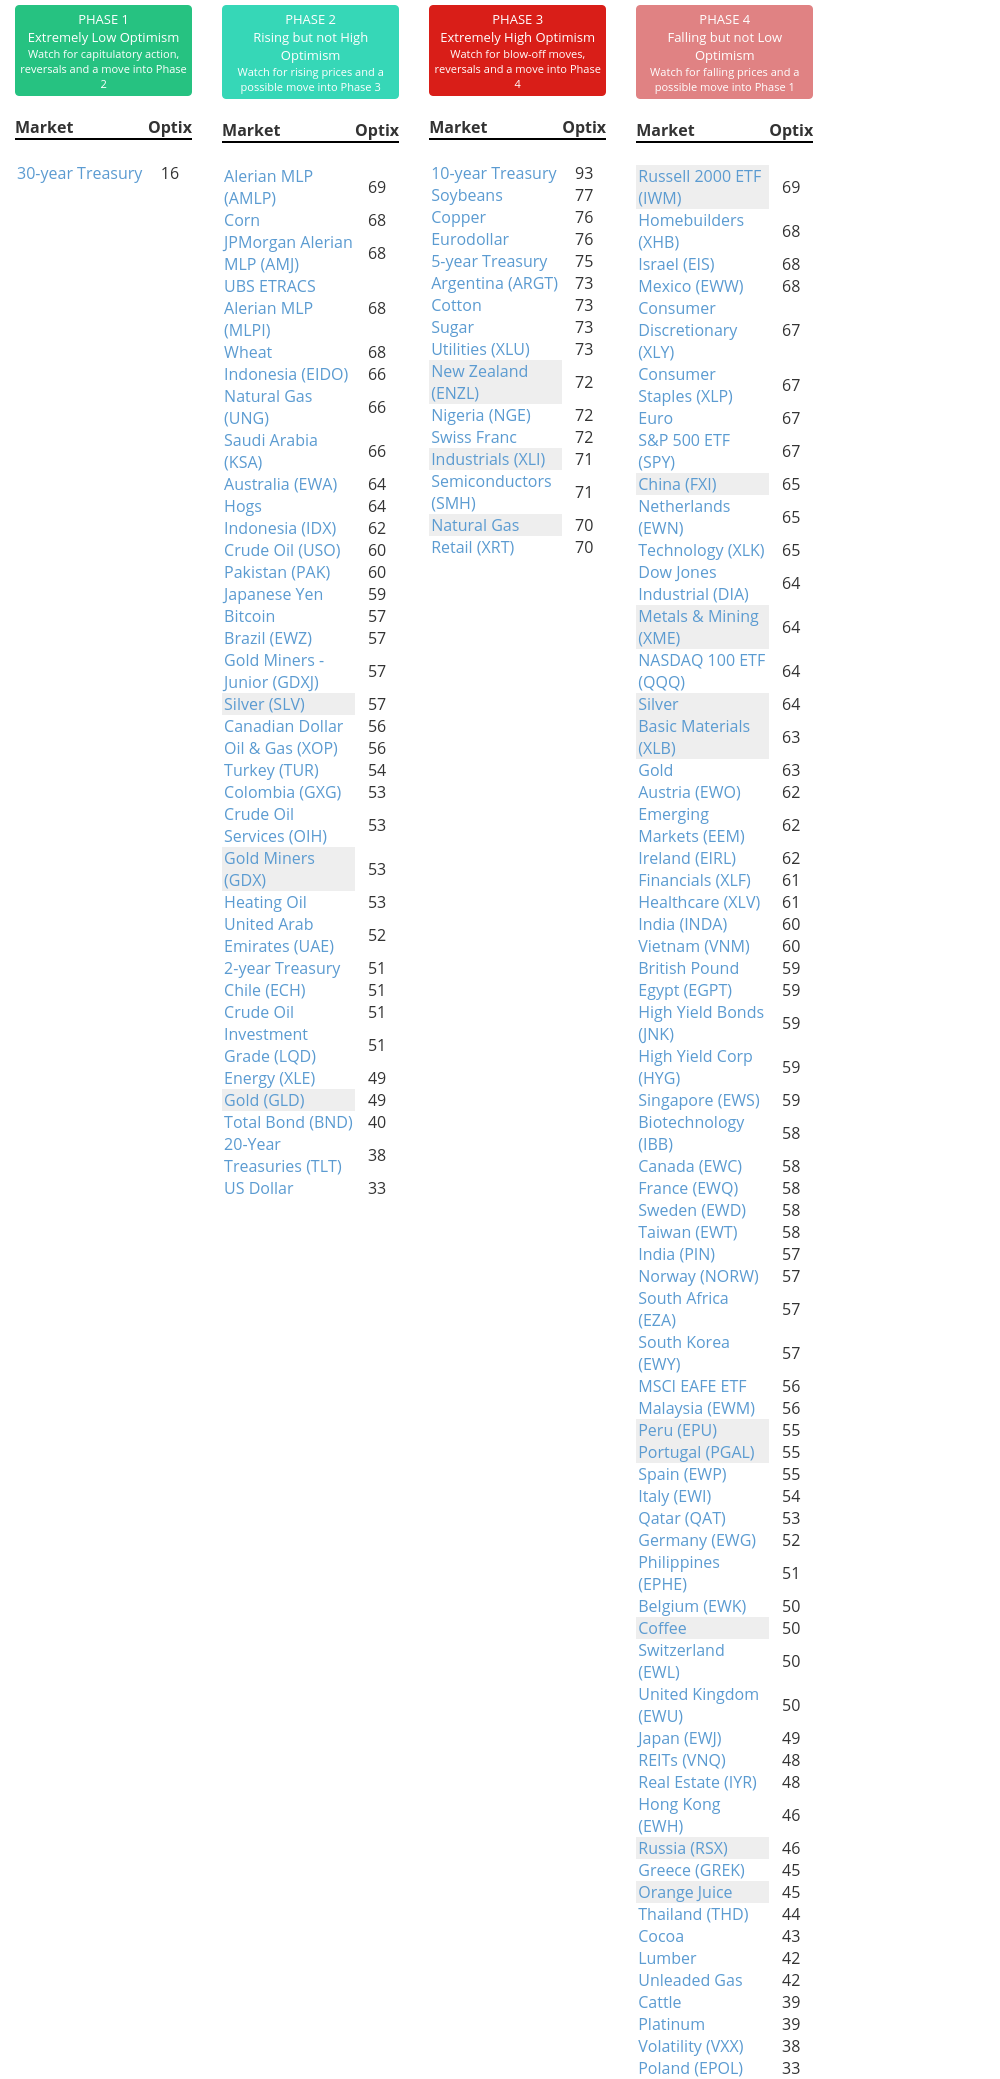
Phase Table
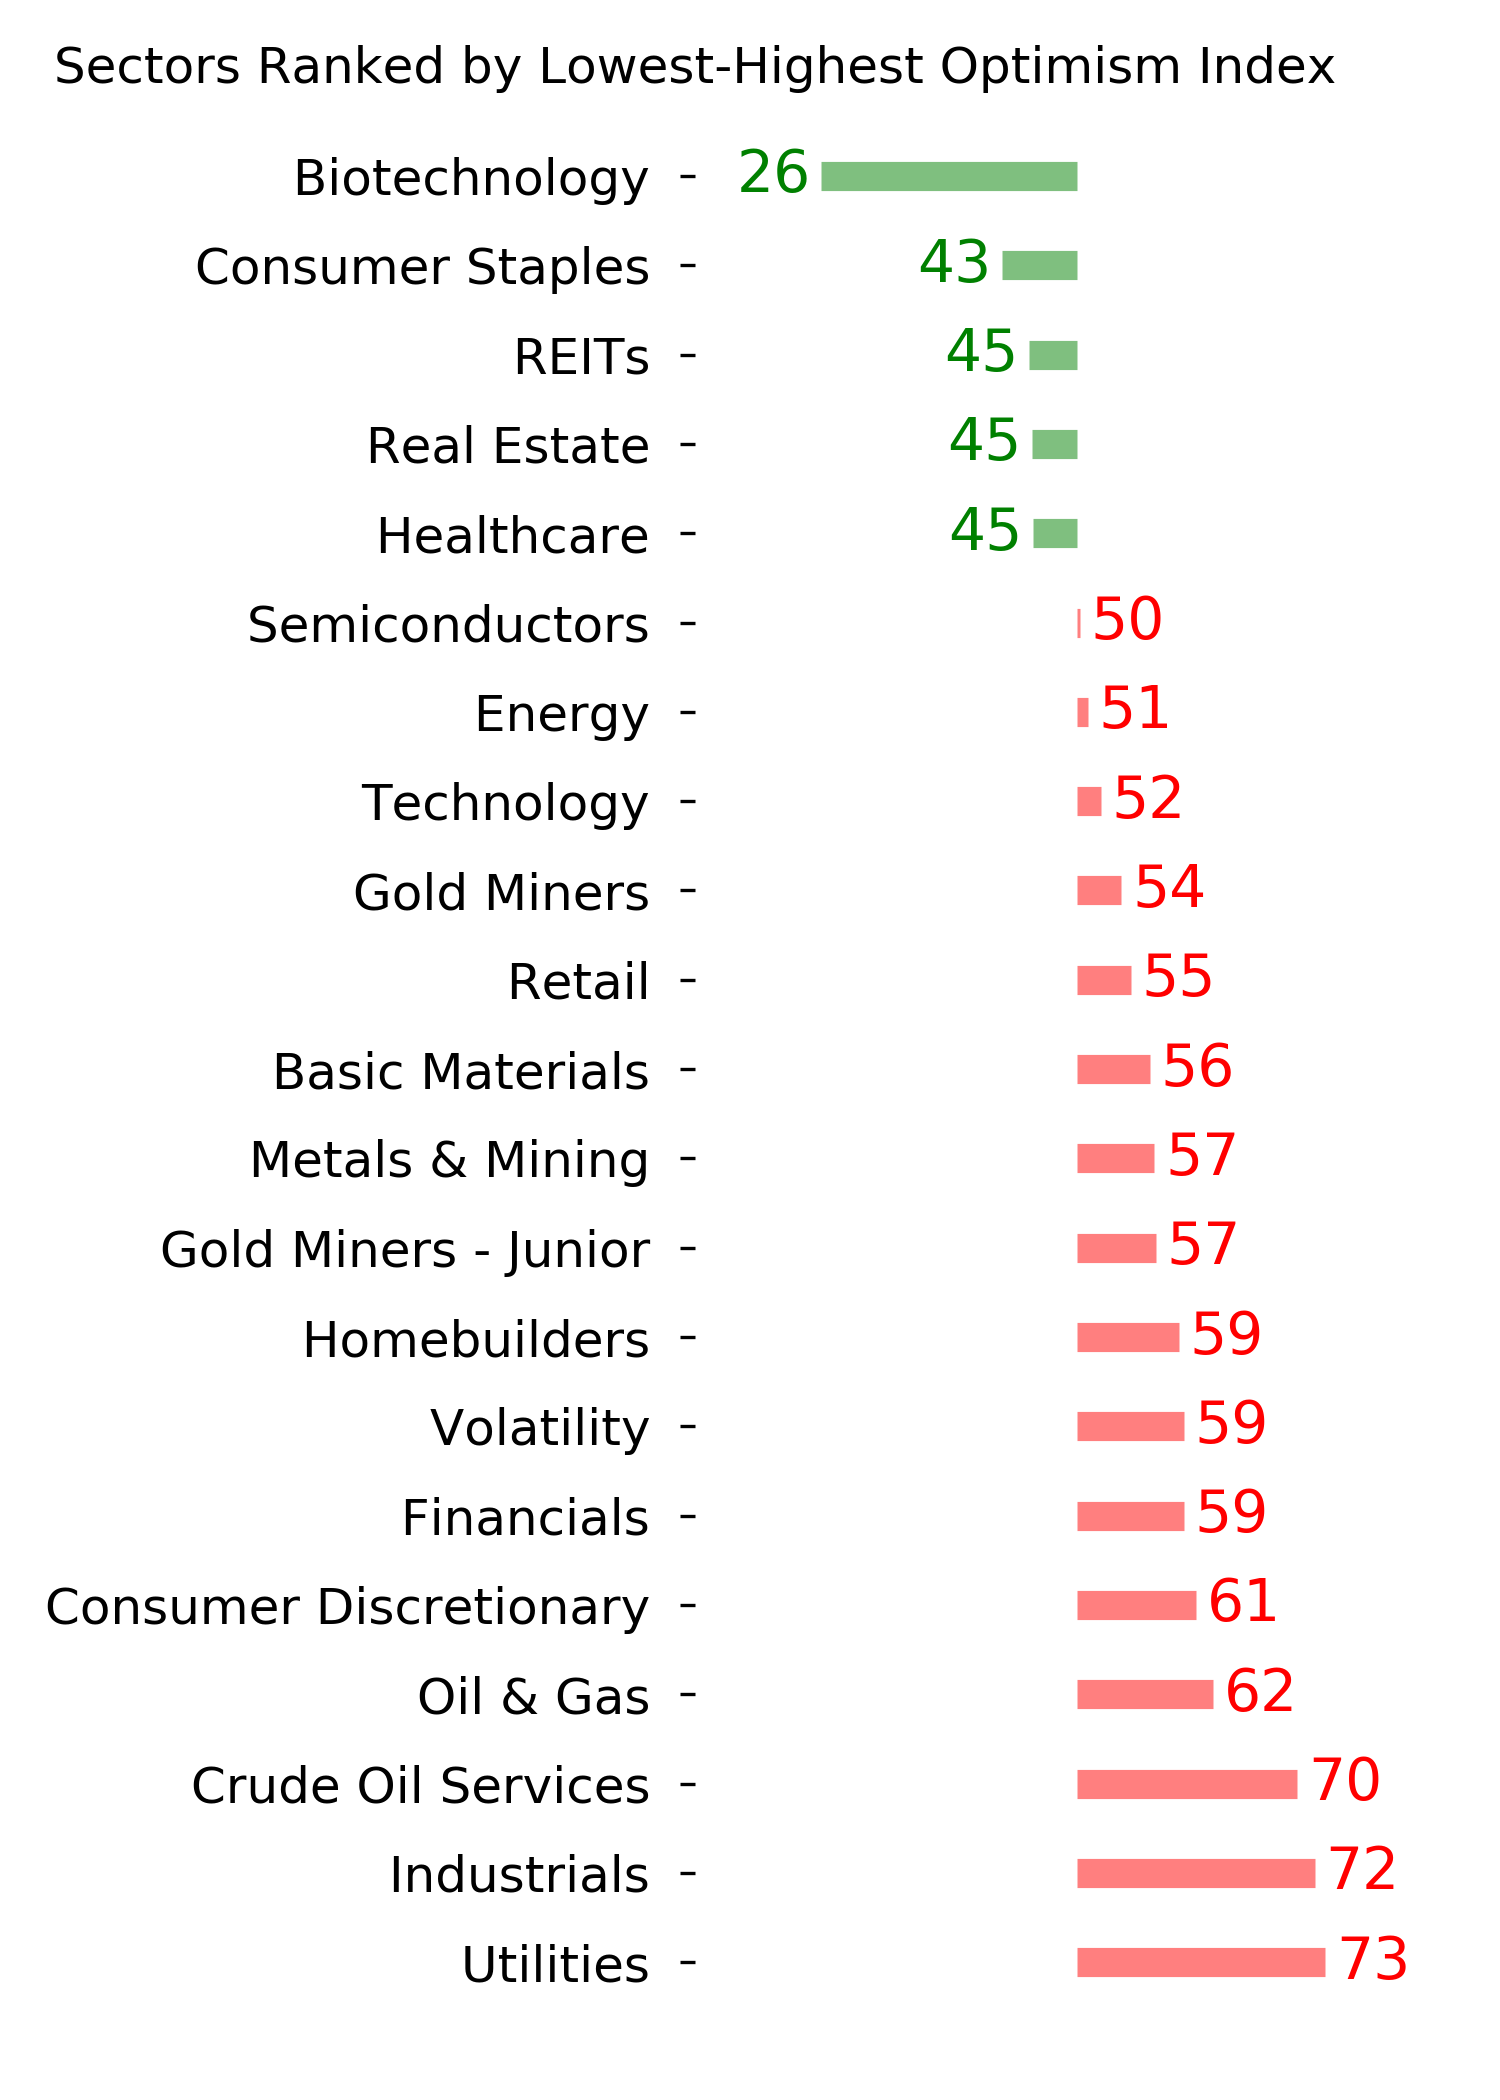
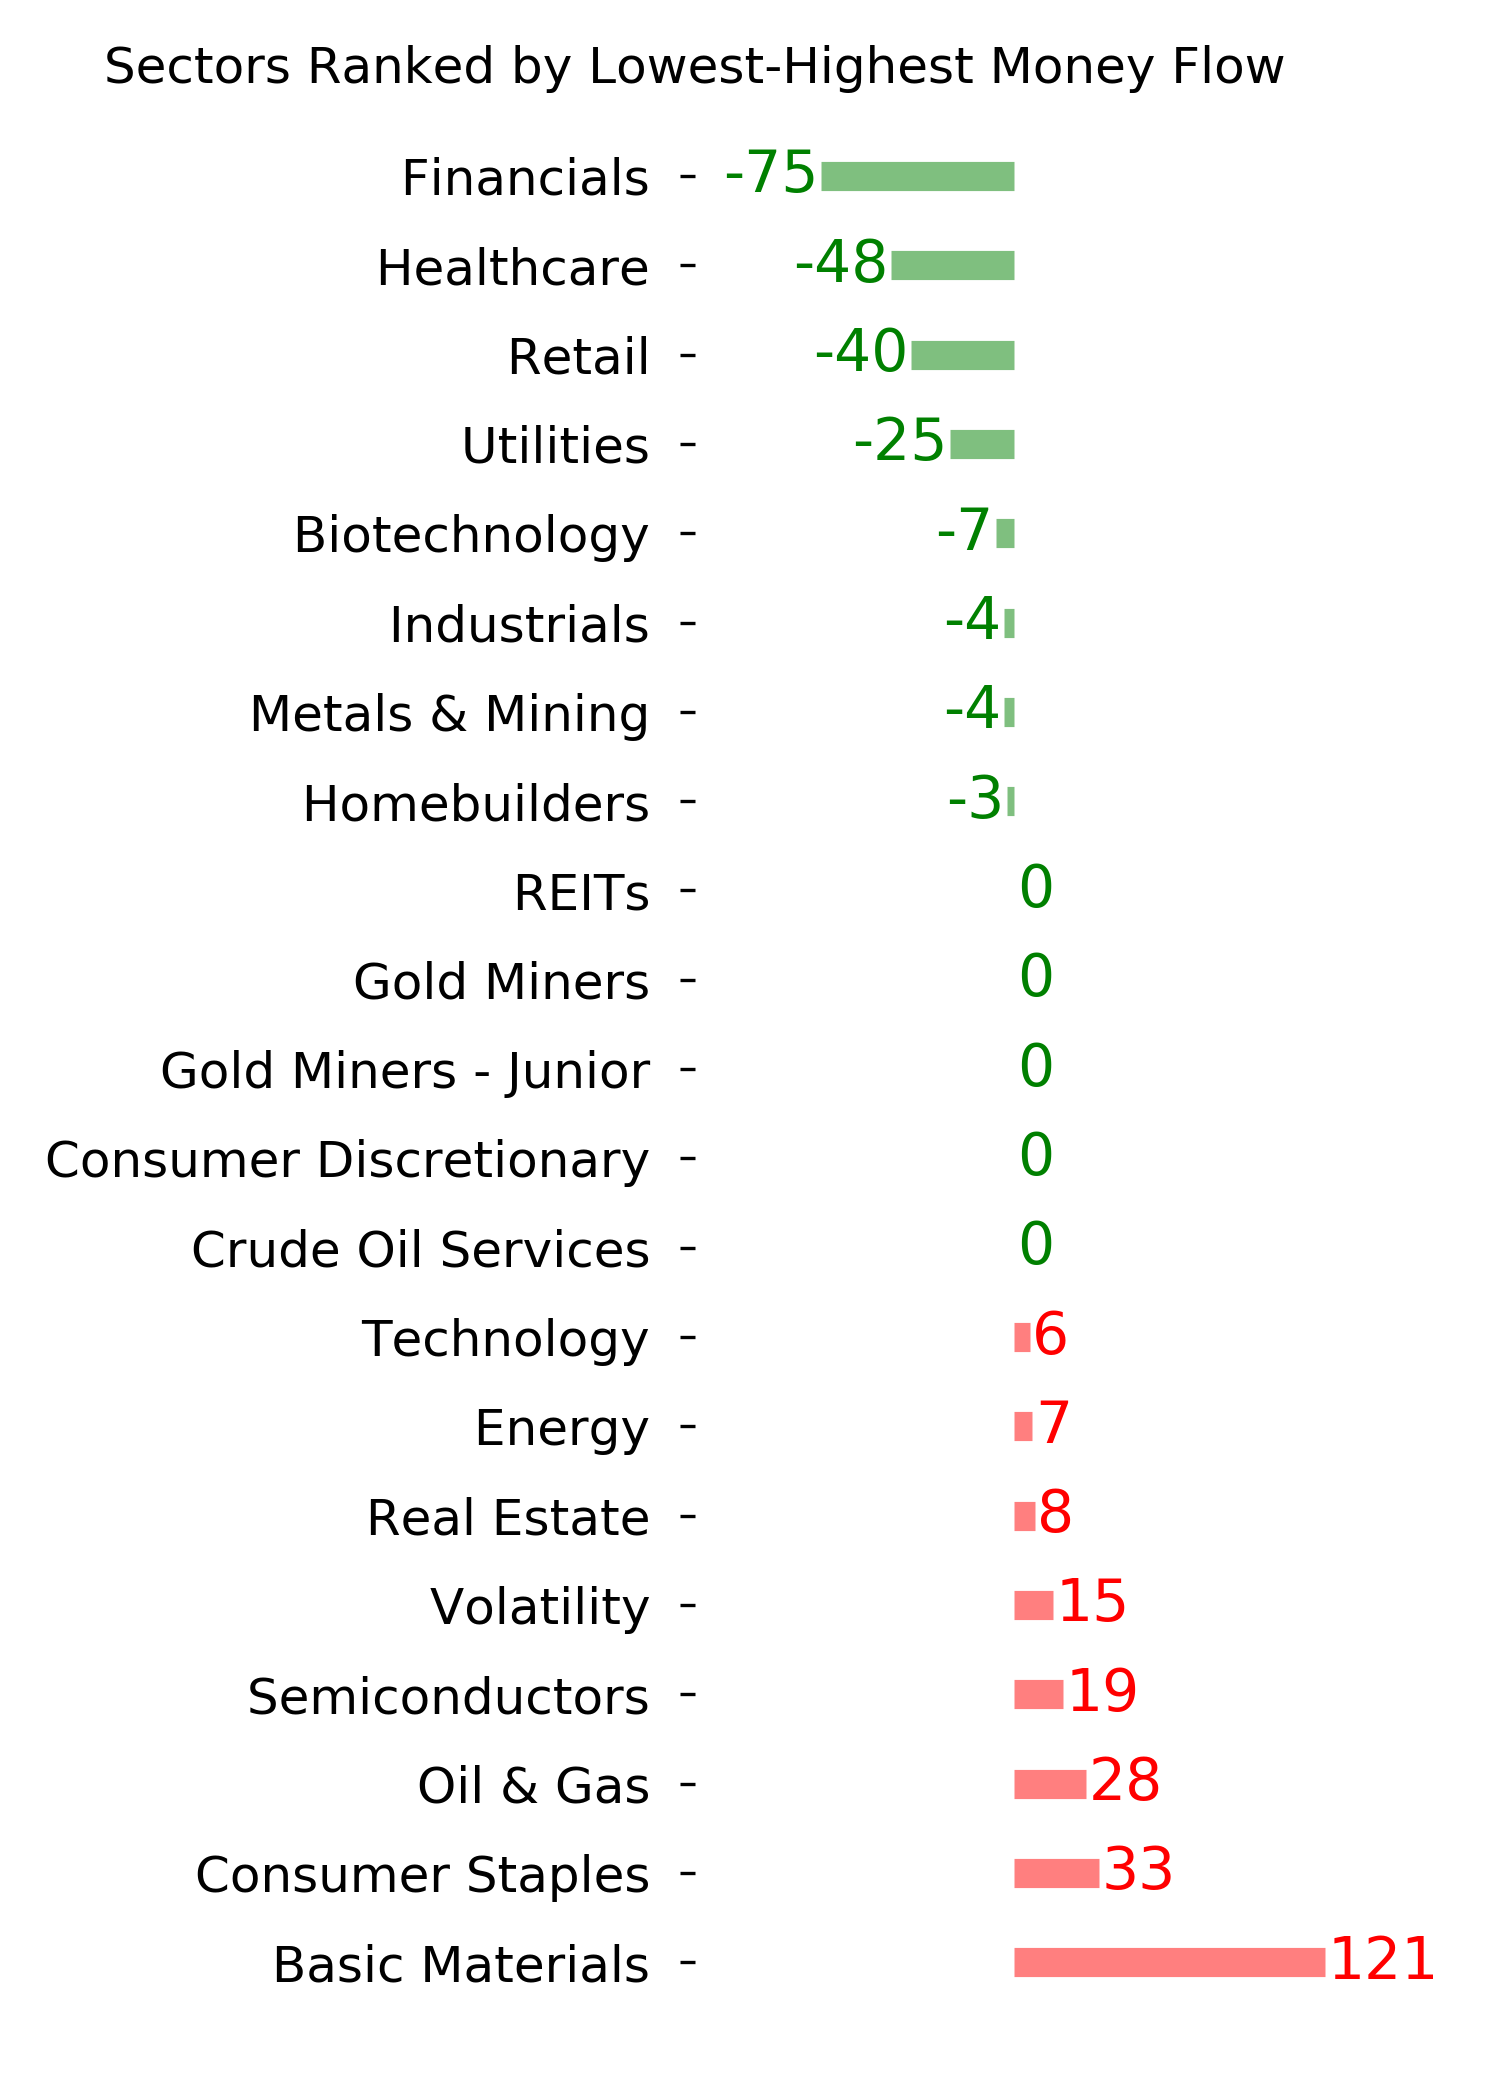
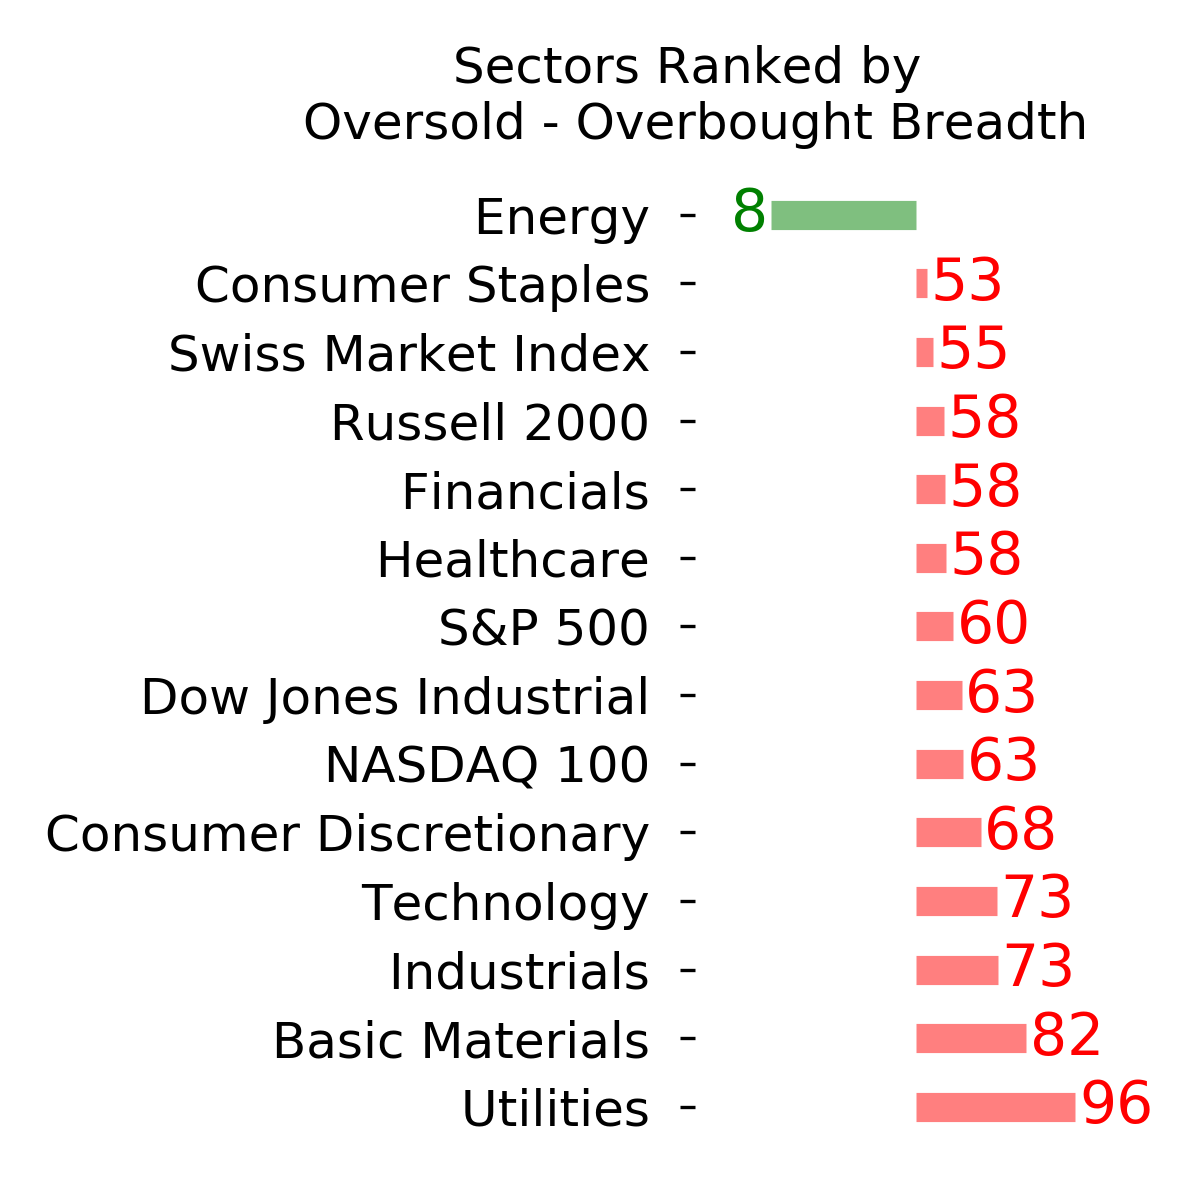
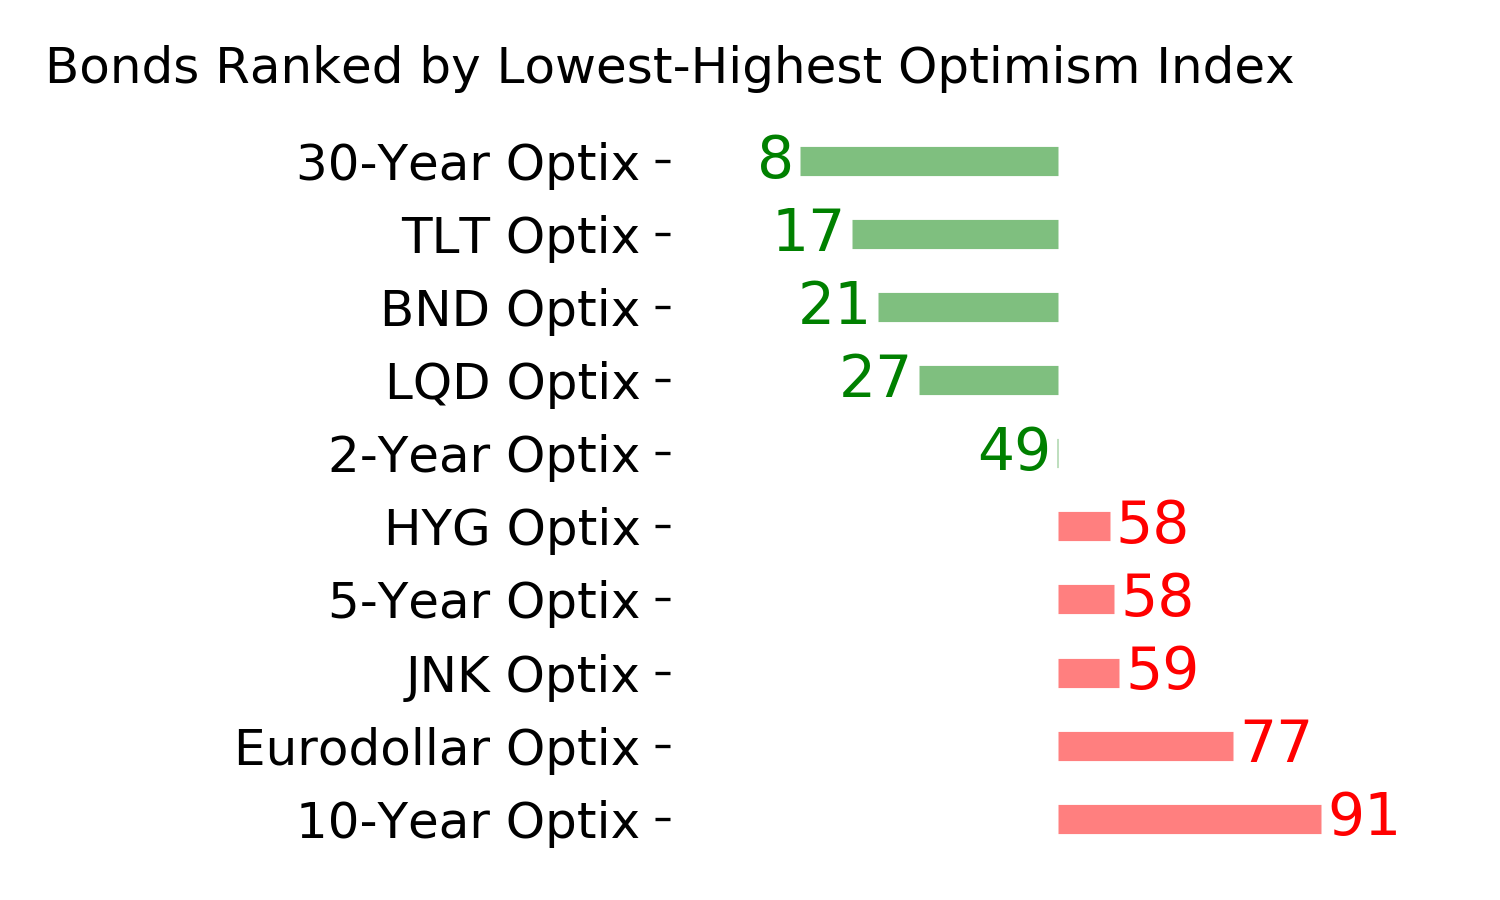
Ranks
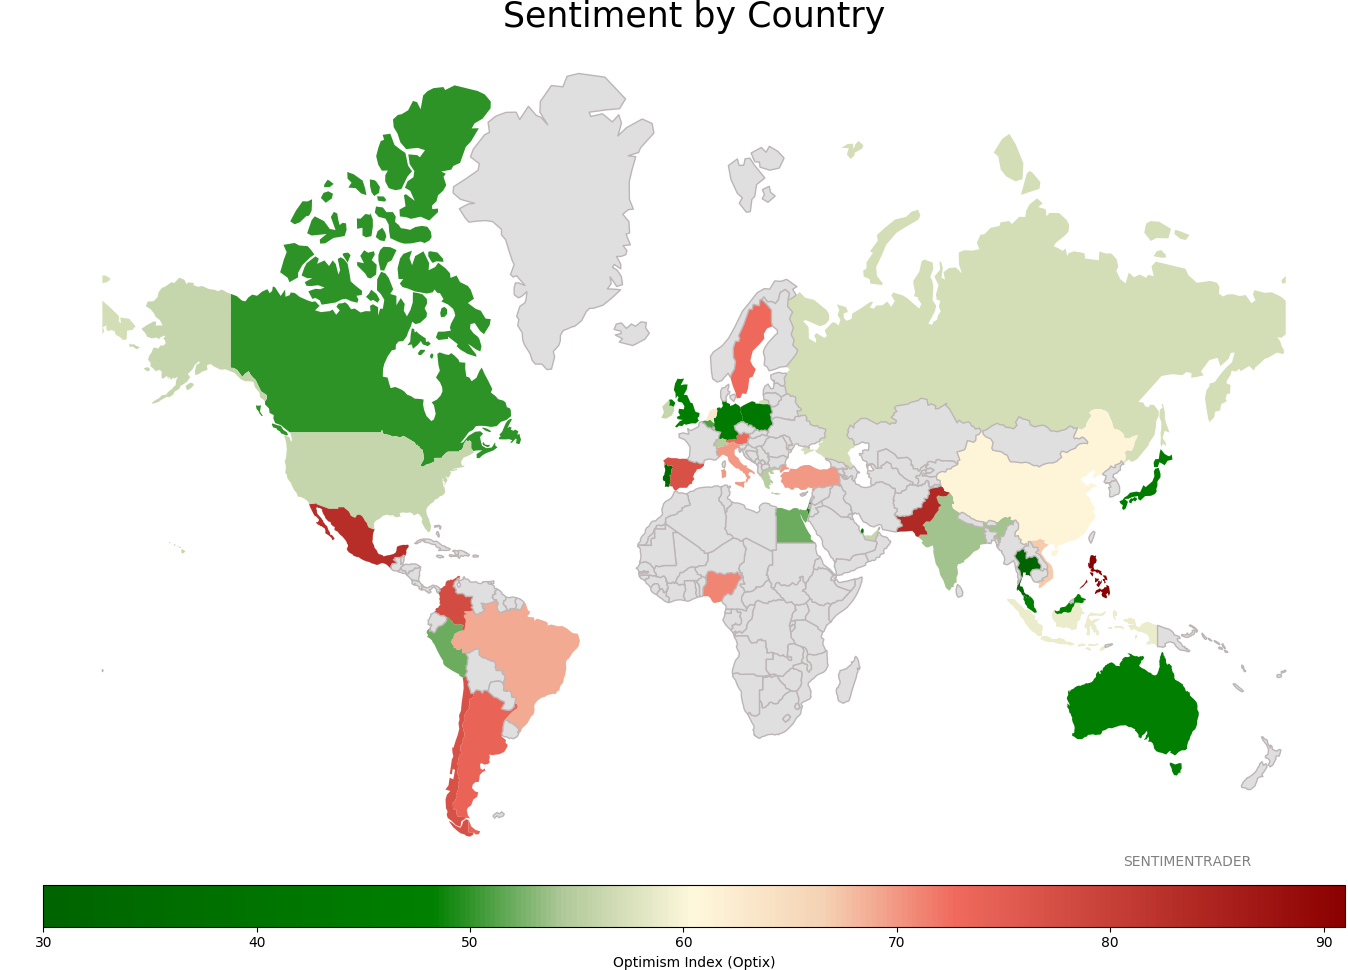
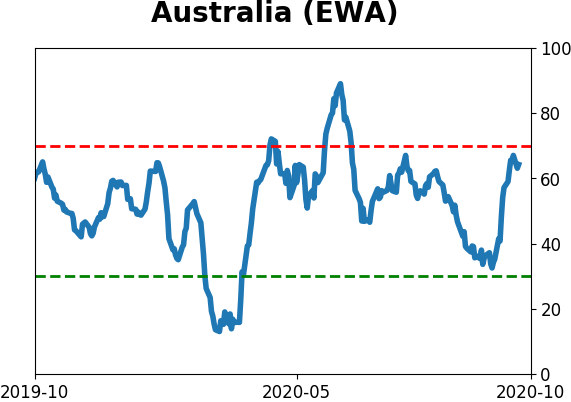
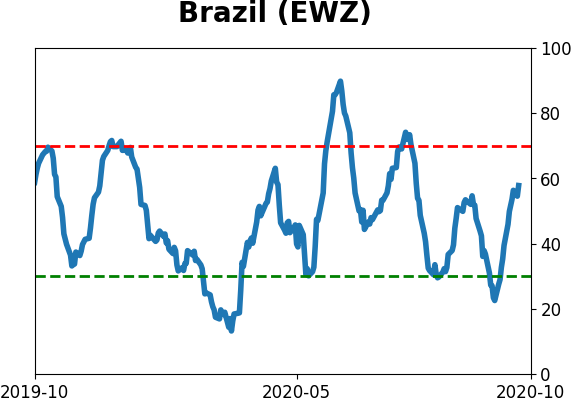
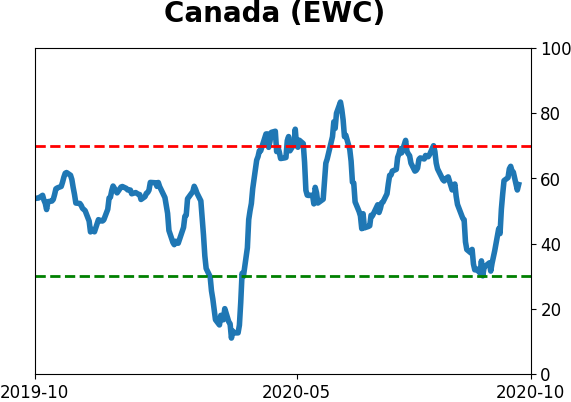
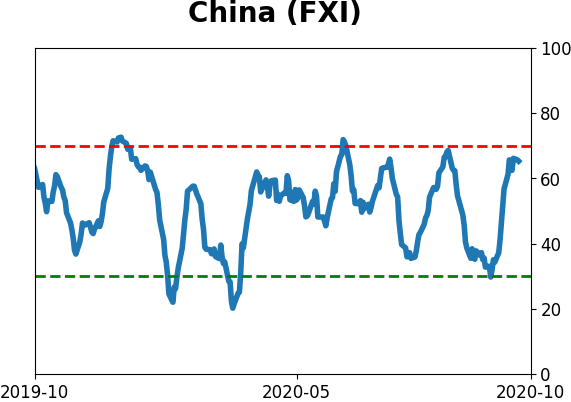
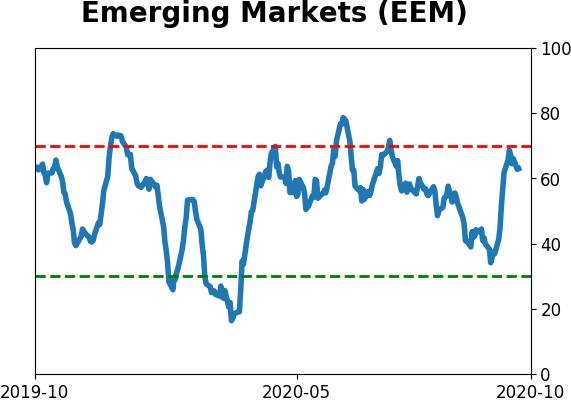
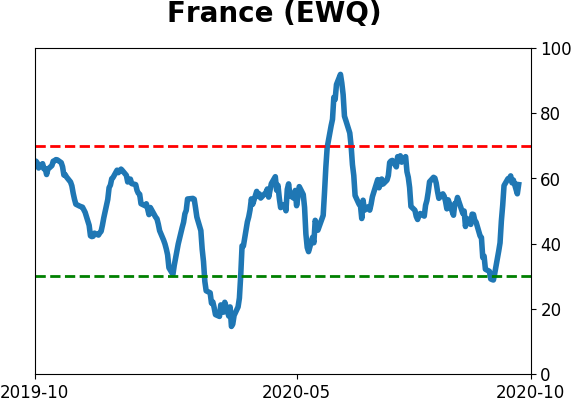
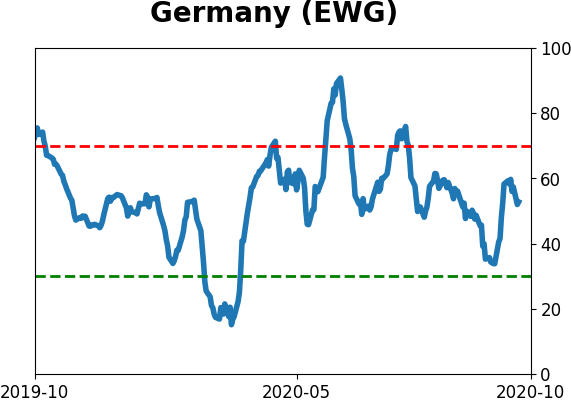
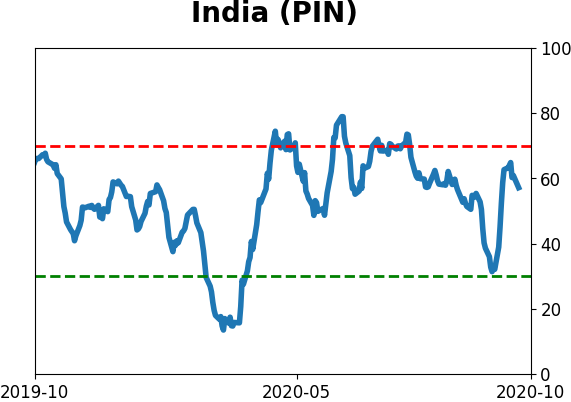
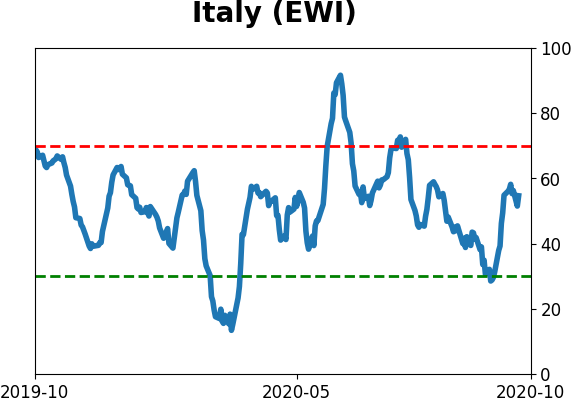
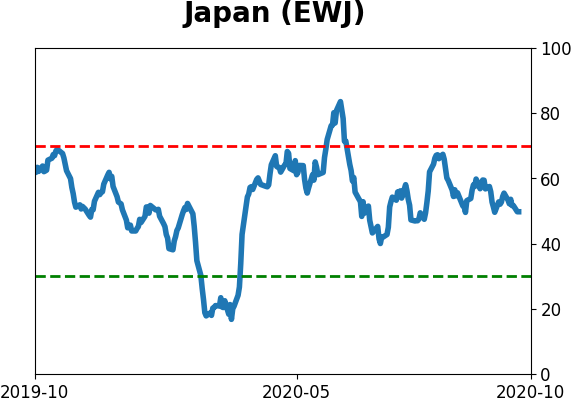
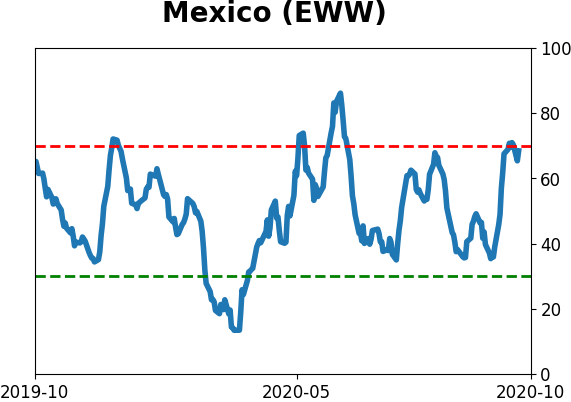
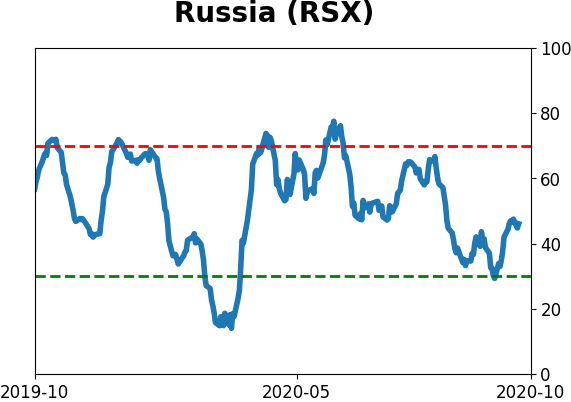
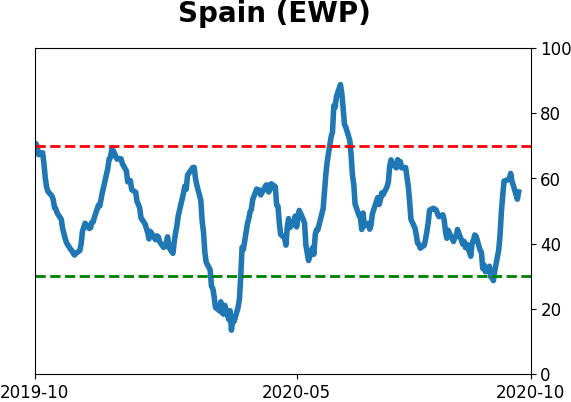
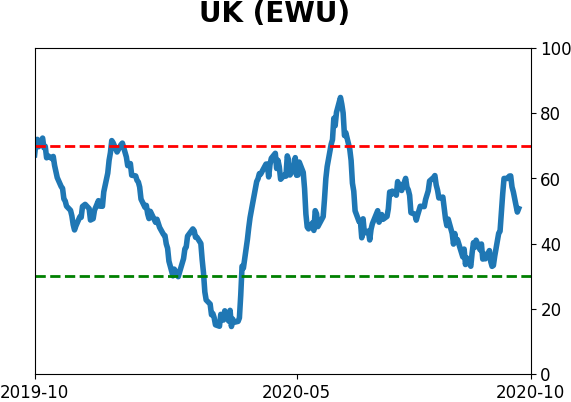
Sentiment Around The World
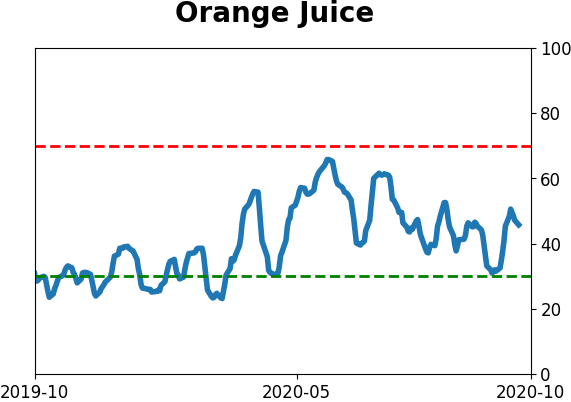
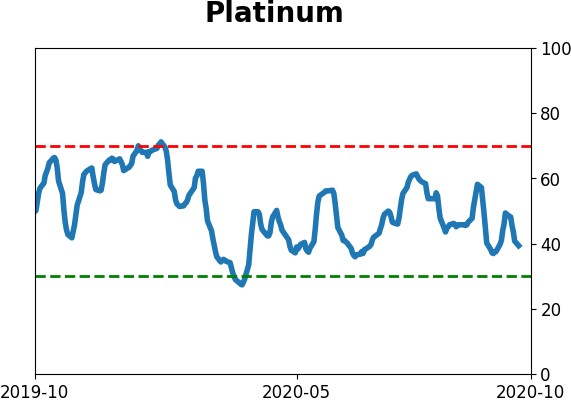
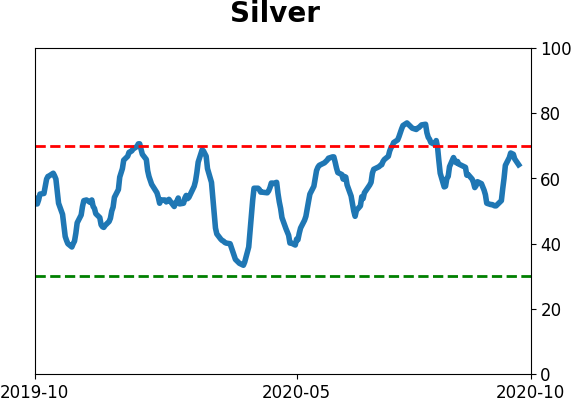
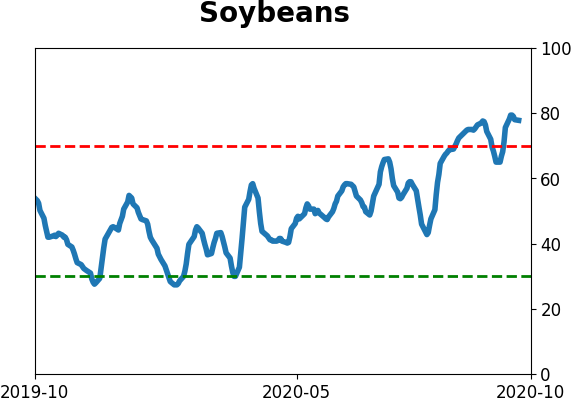
Optimism Index Thumbnails
|
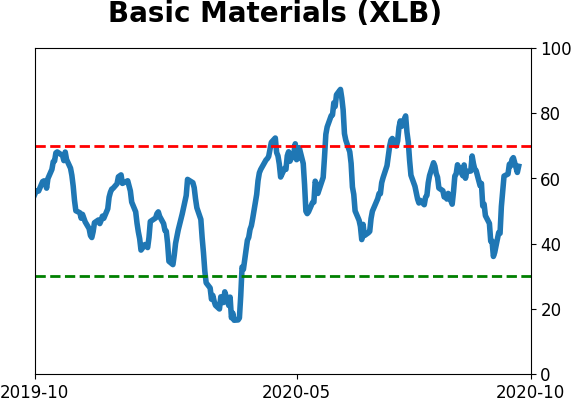
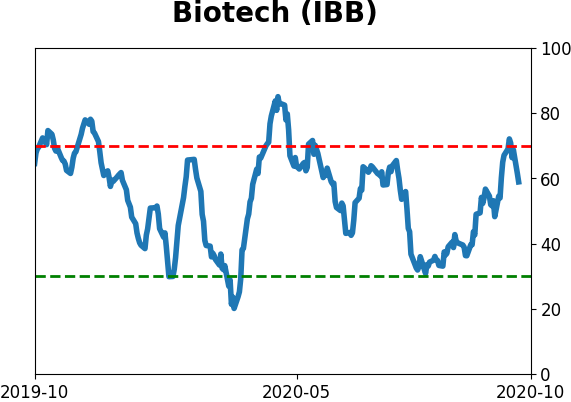
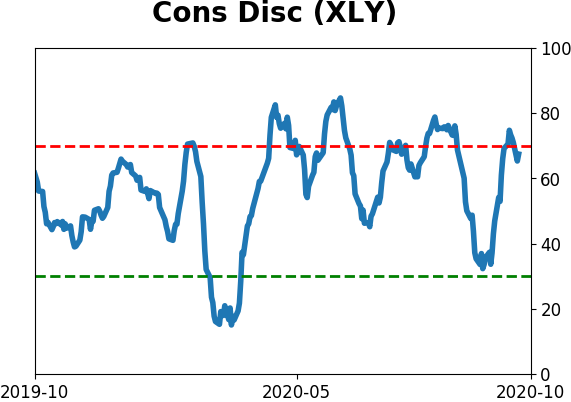
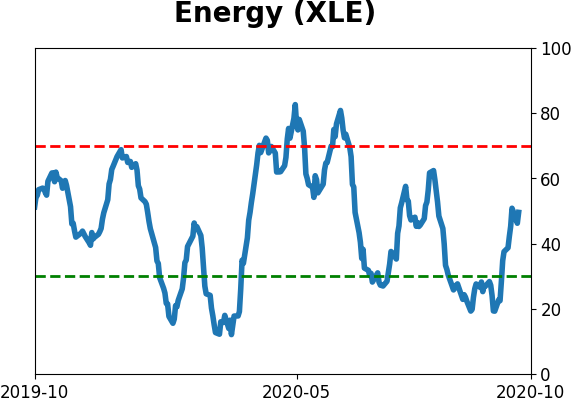
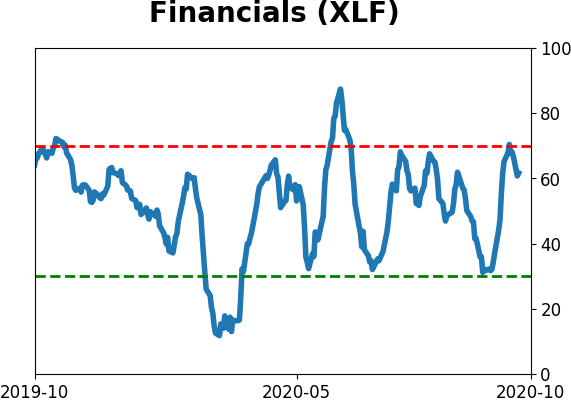
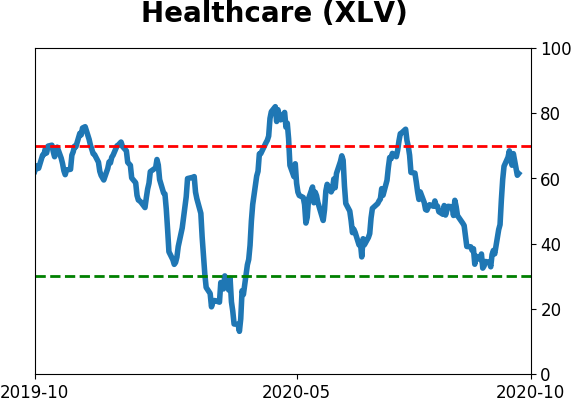
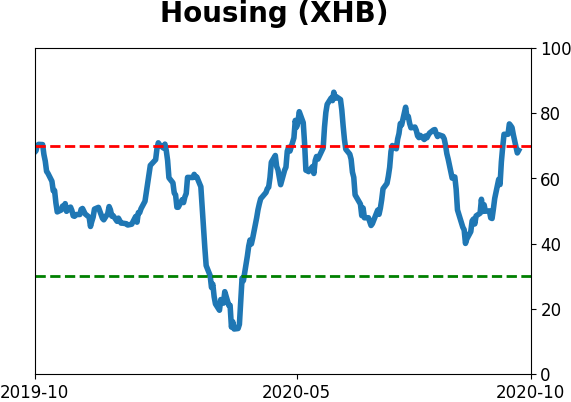
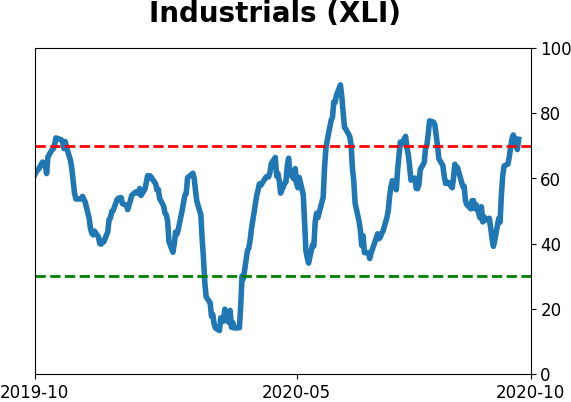
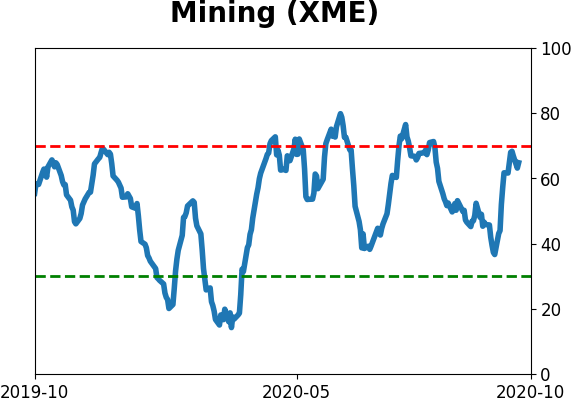
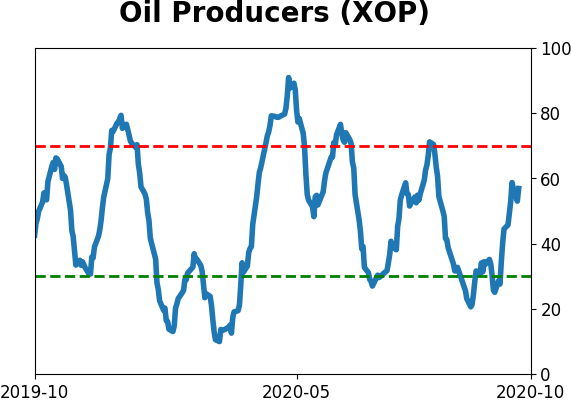
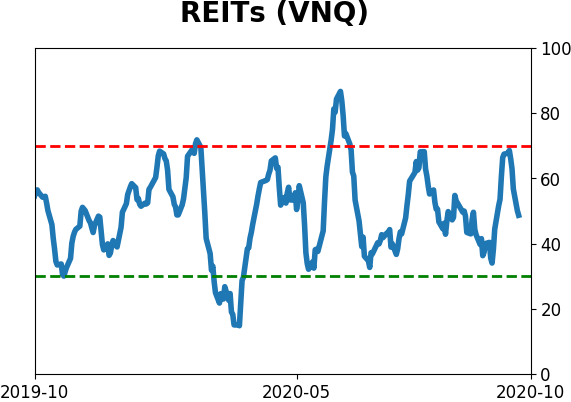
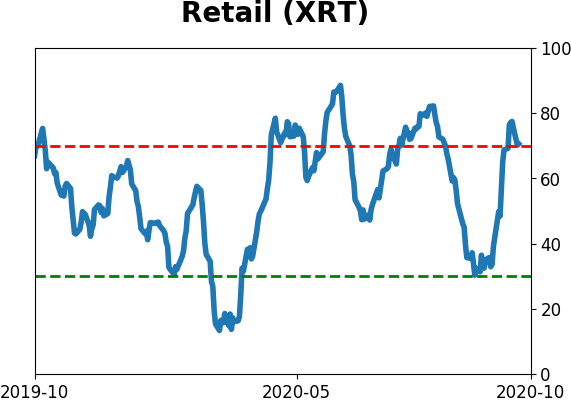
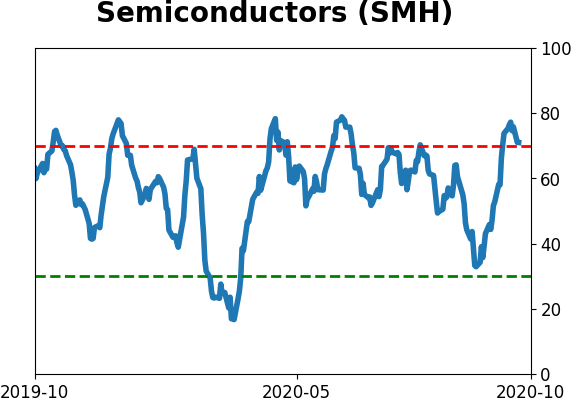
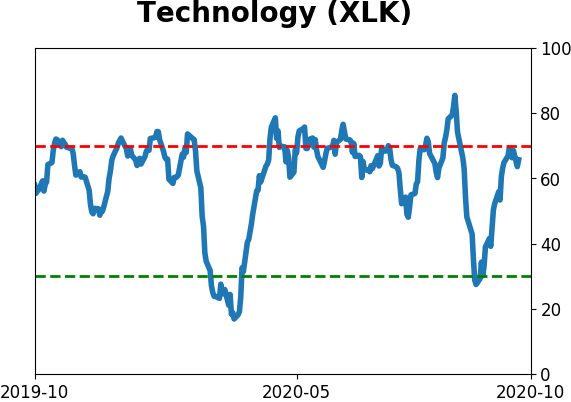
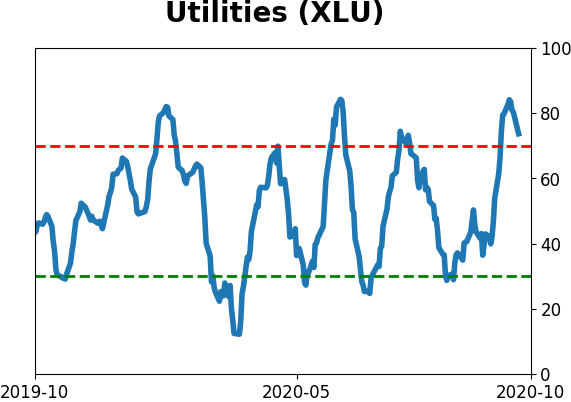
Sector ETF's - 10-Day Moving Average
|
|
|
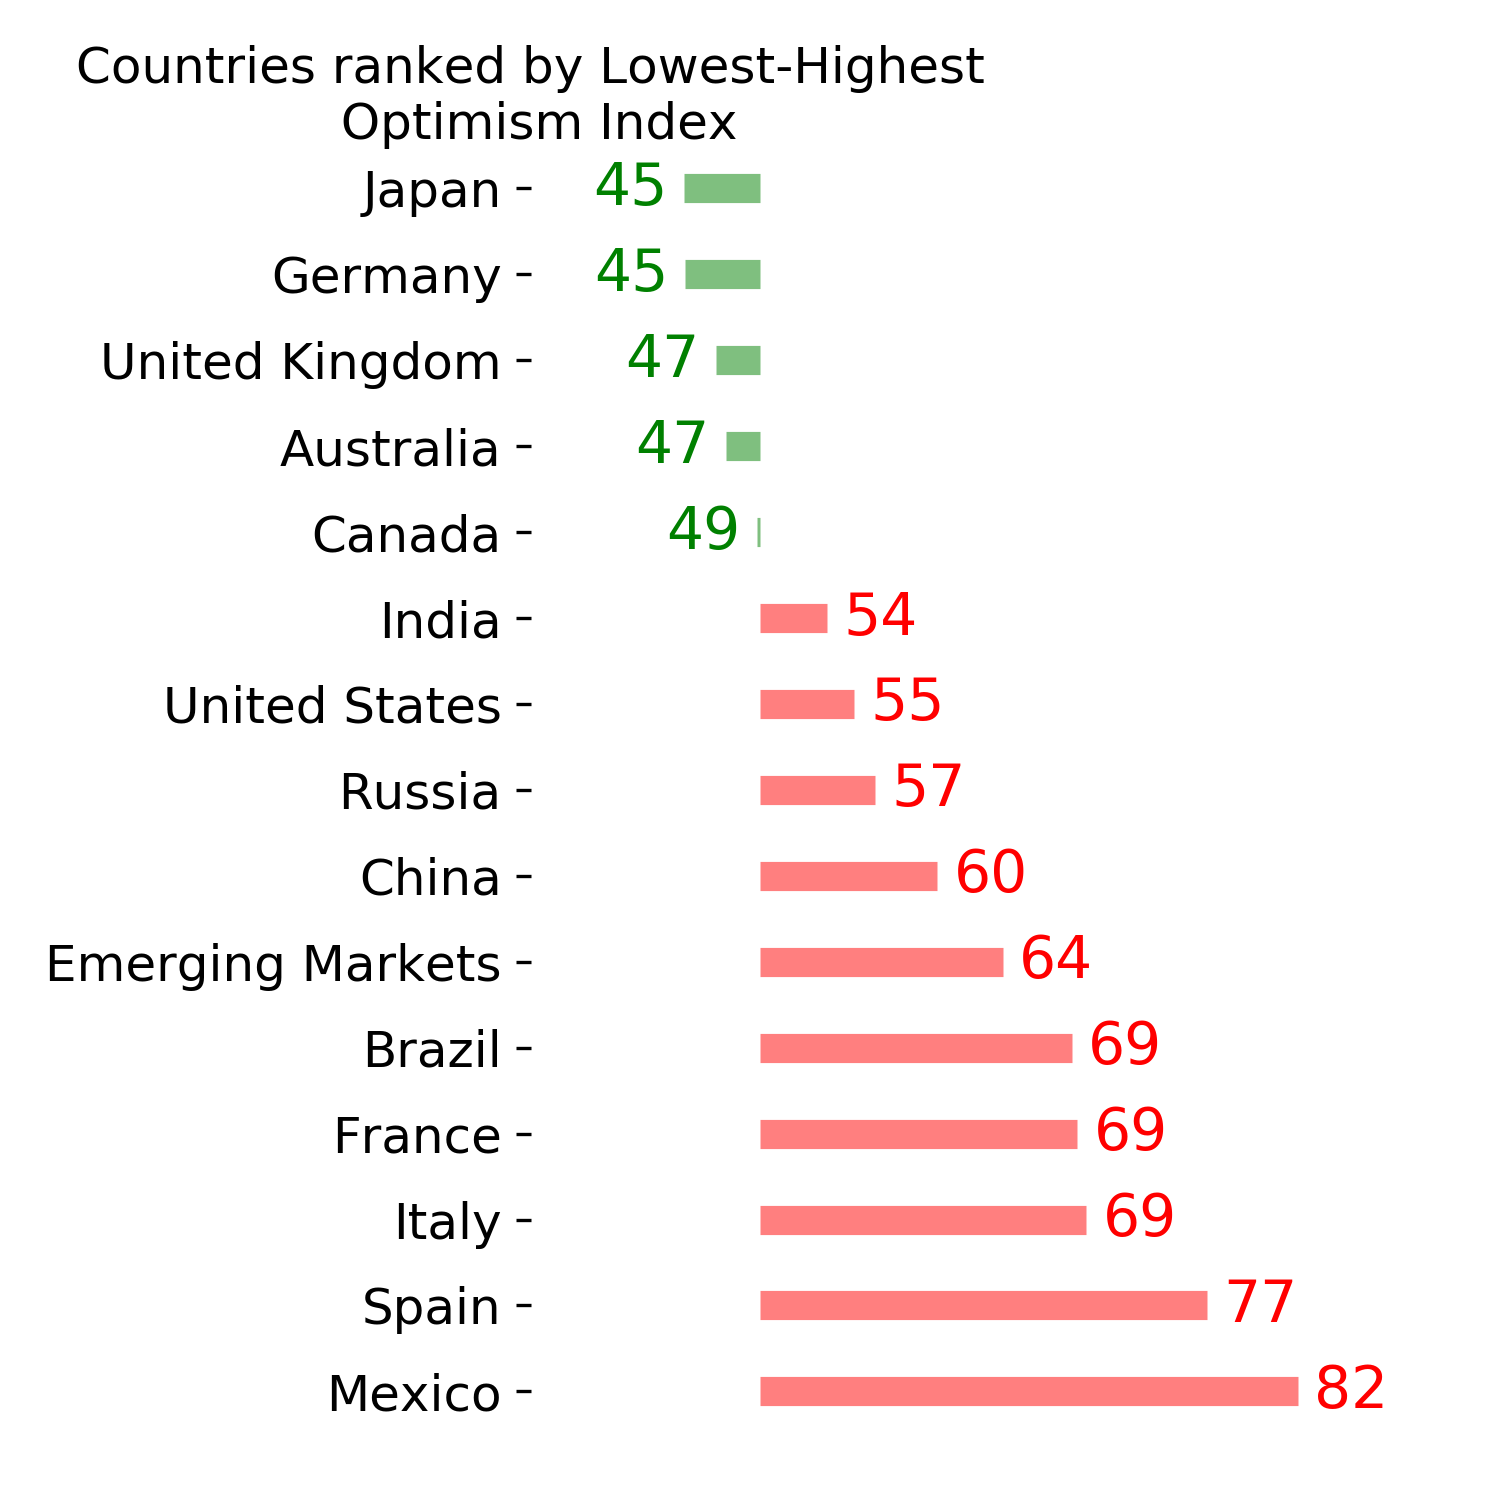
Country ETF's - 10-Day Moving Average
|
|
|
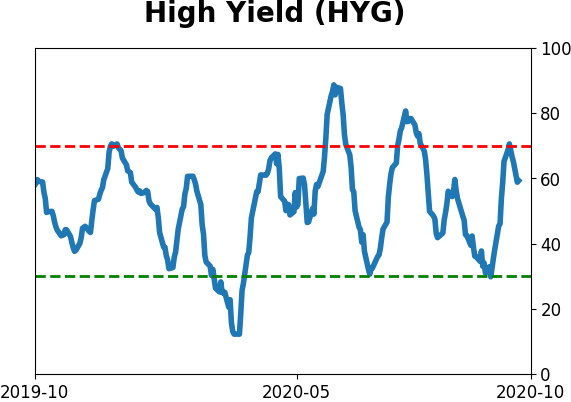
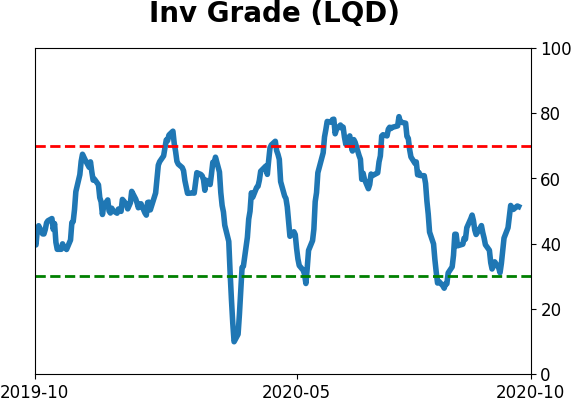
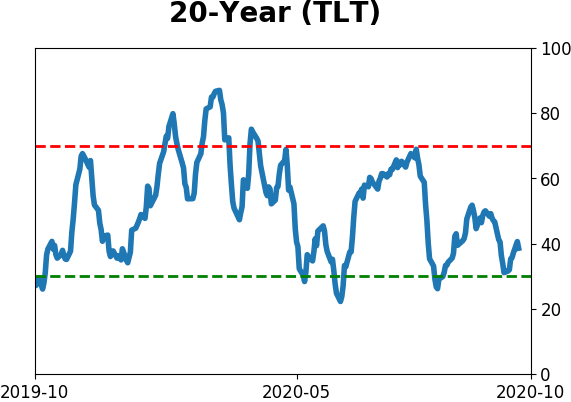
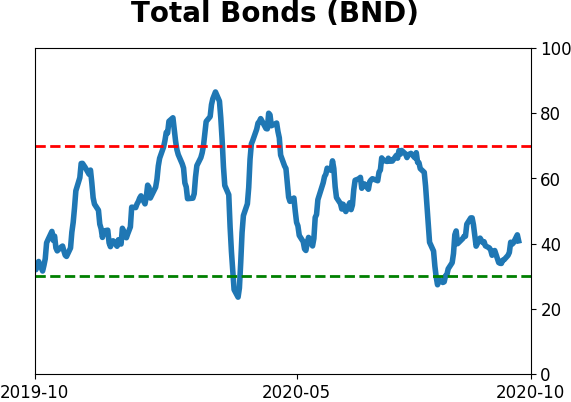
Bond ETF's - 10-Day Moving Average
|
|
|
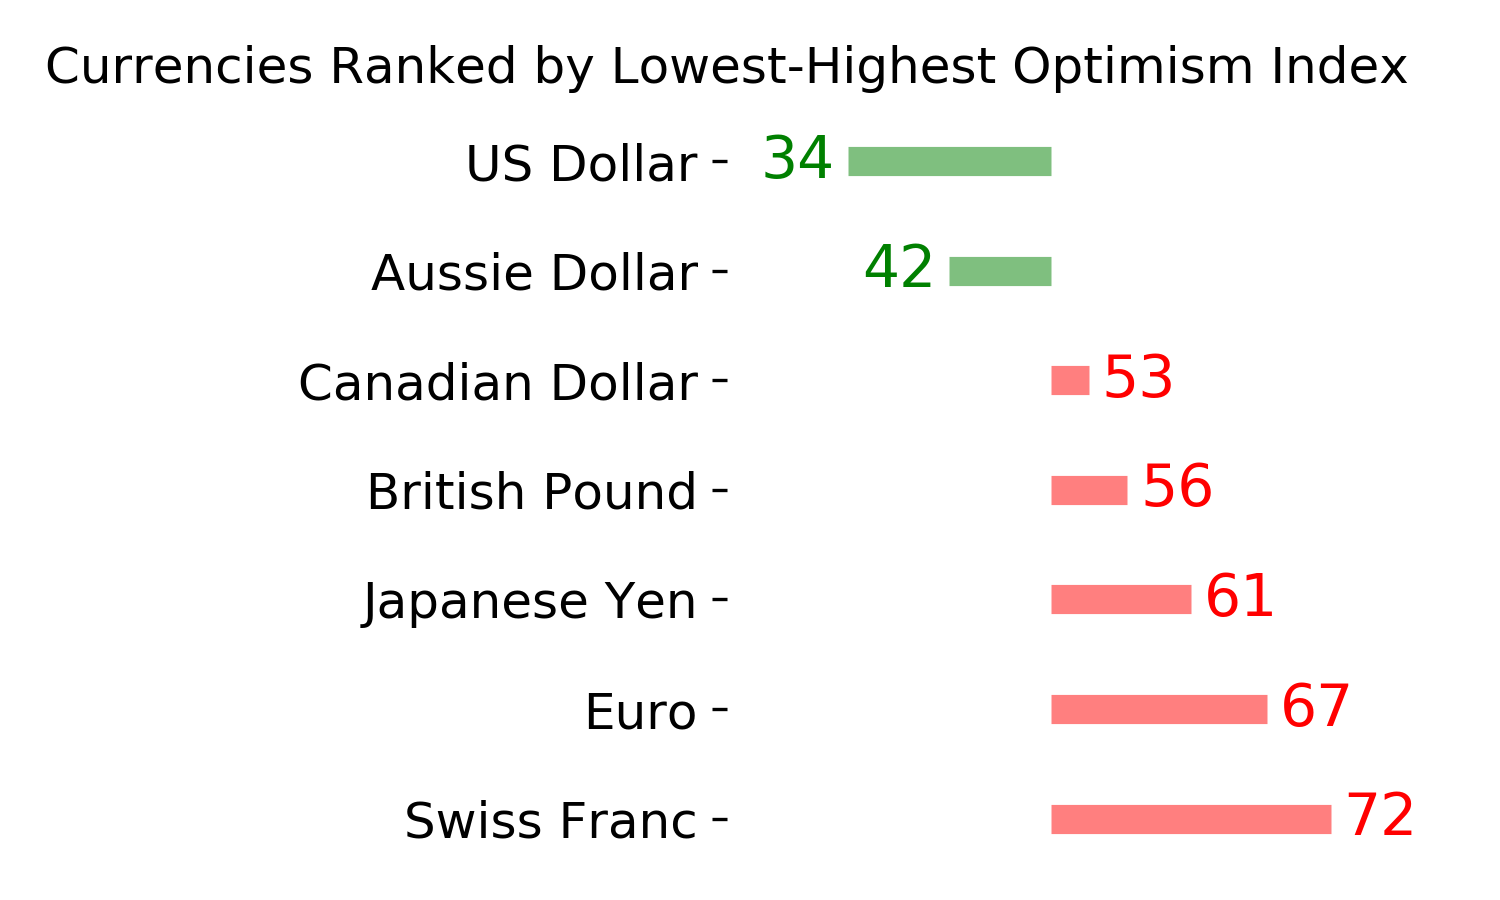
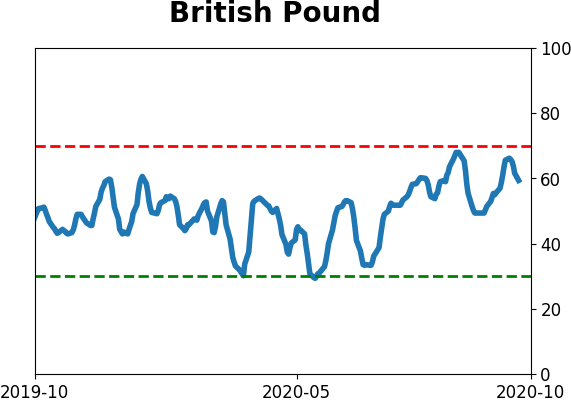
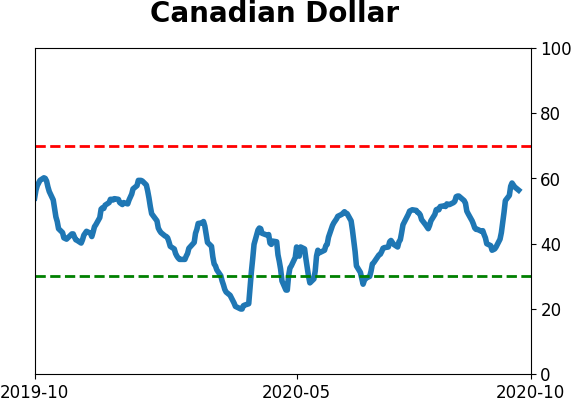
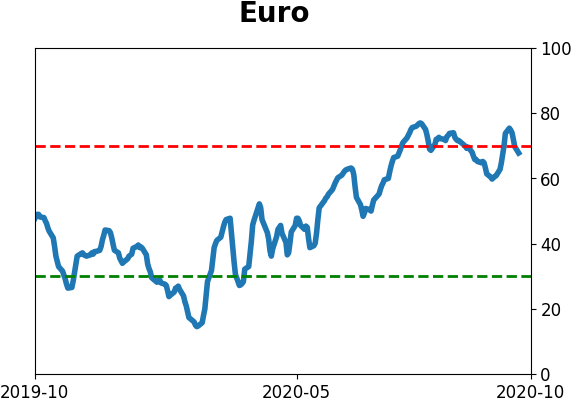
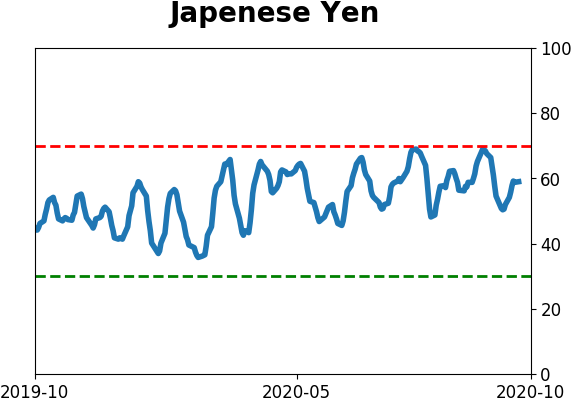
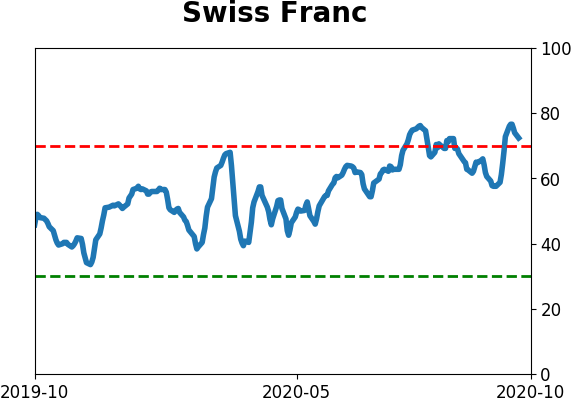
Currency ETF's - 5-Day Moving Average
|
|
|
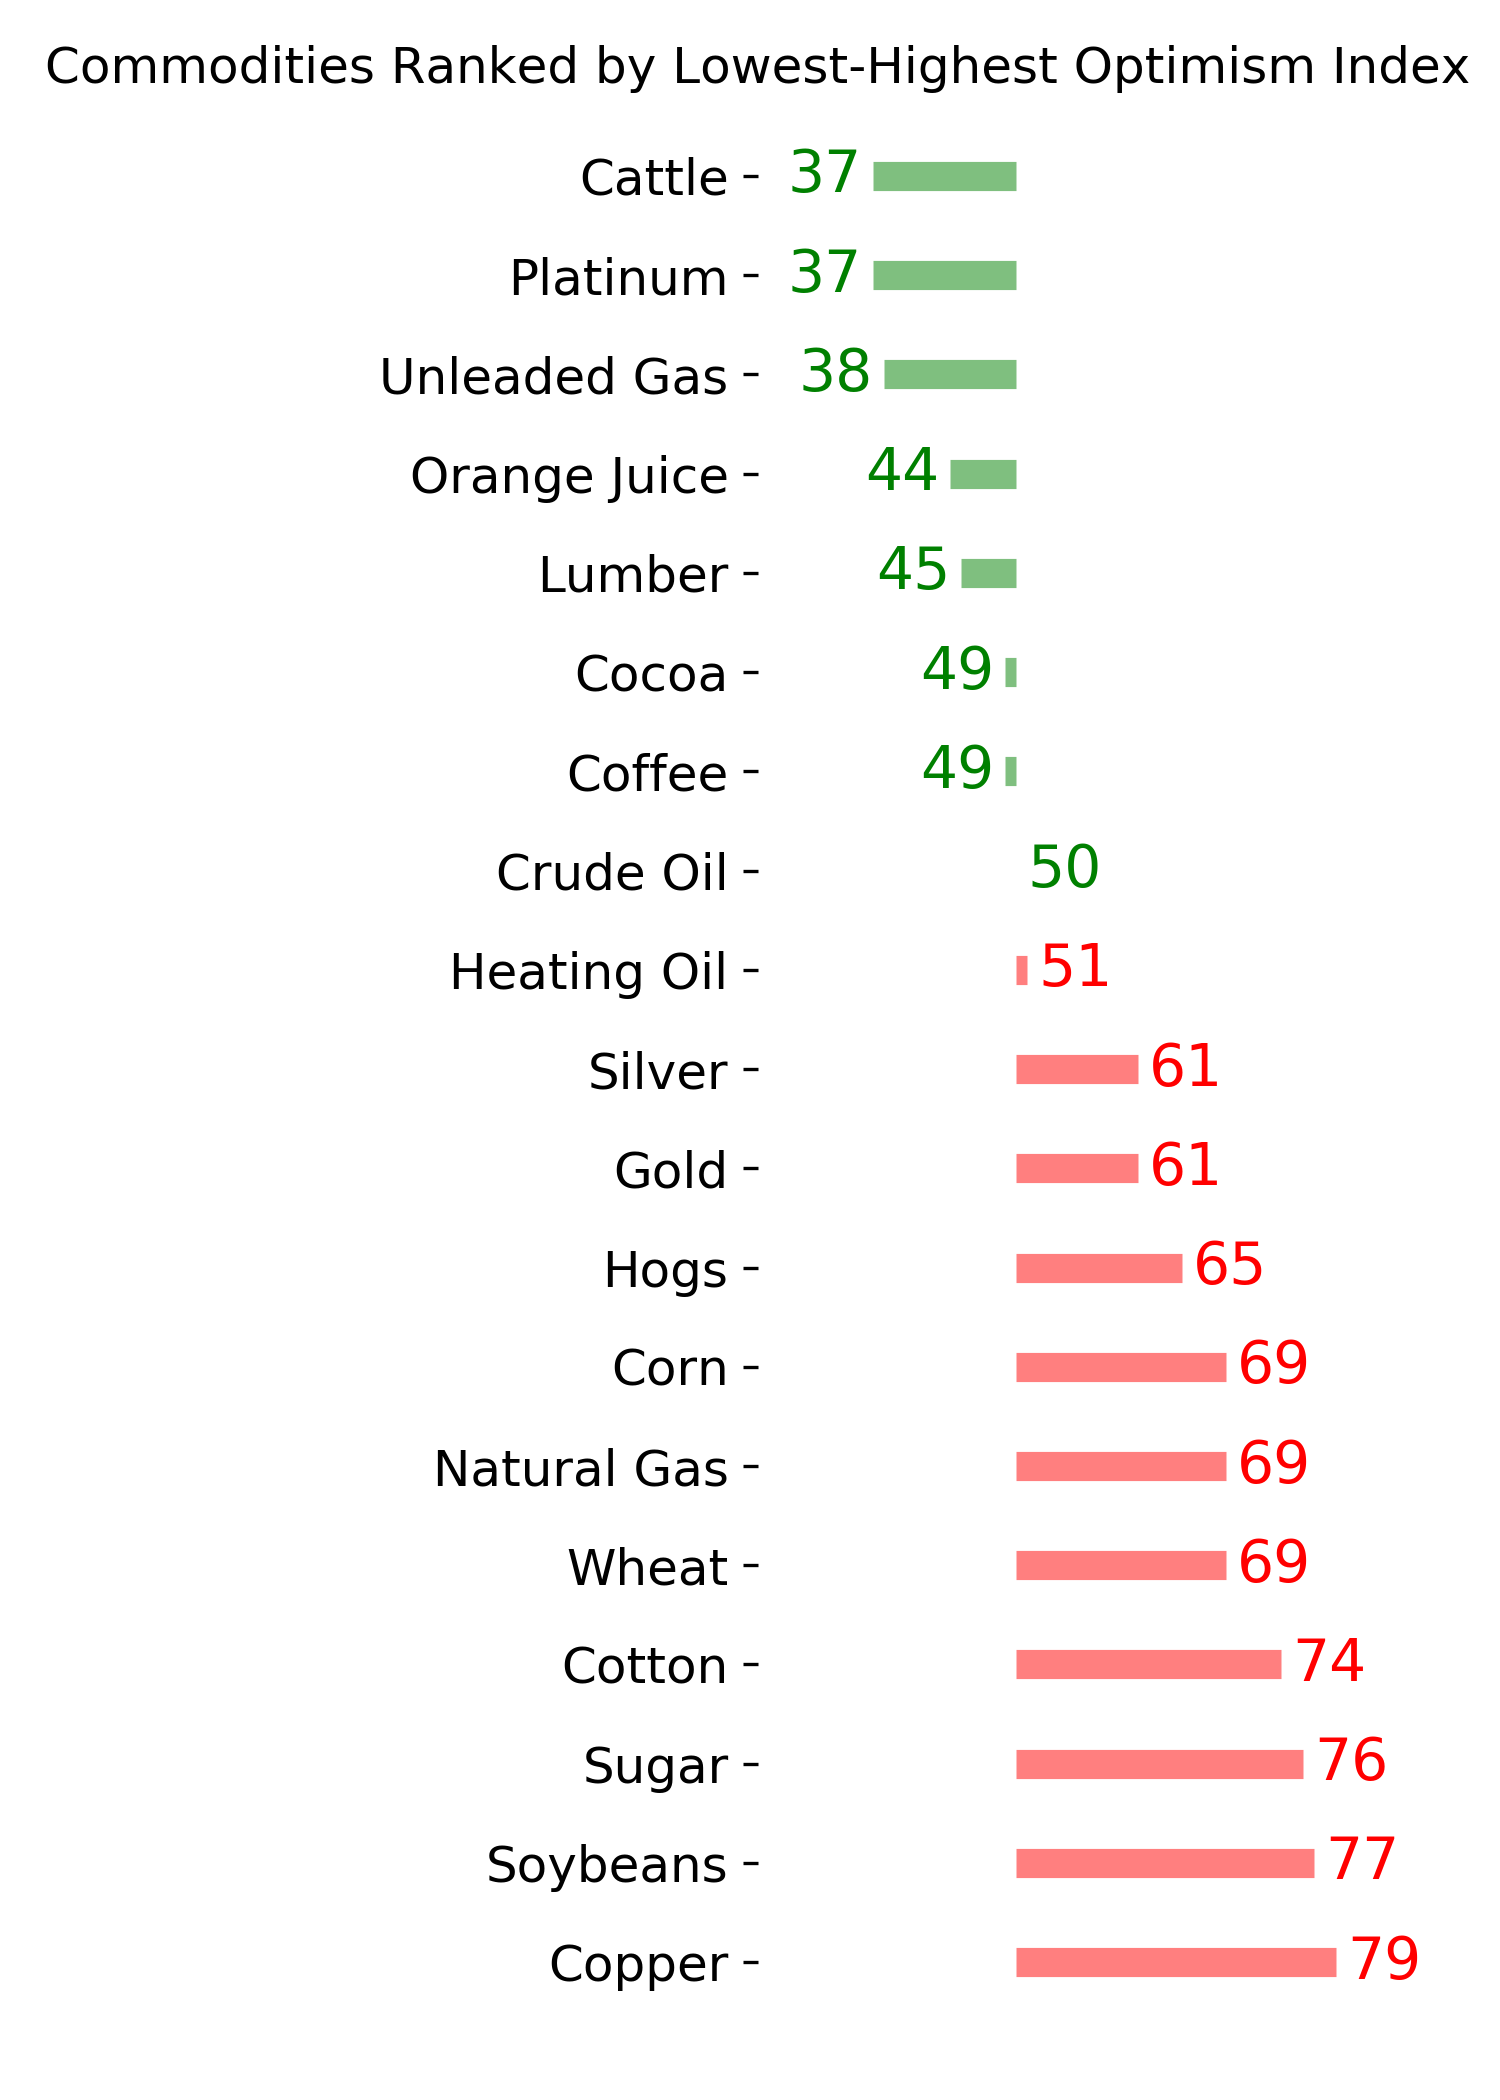
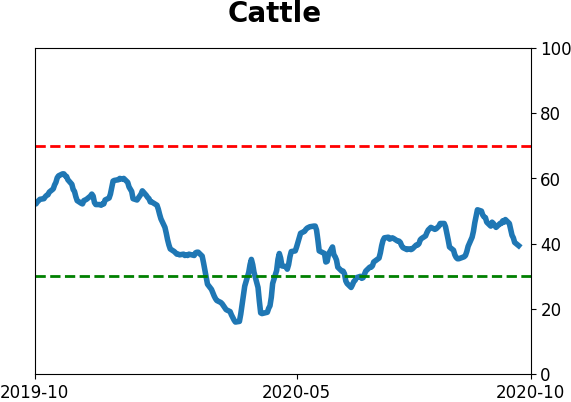
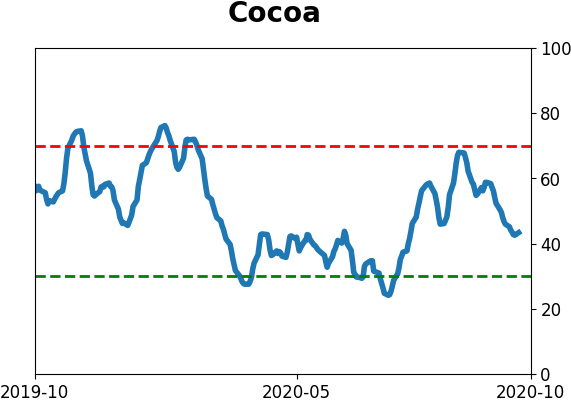
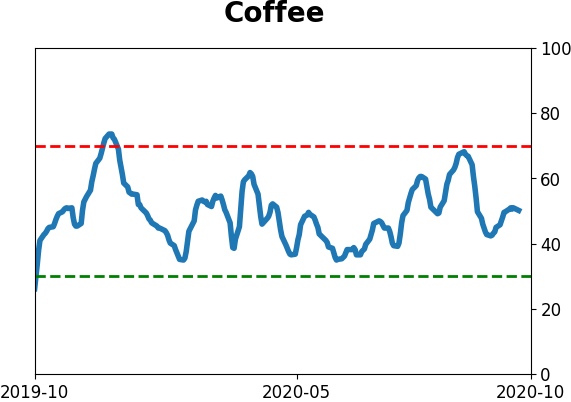
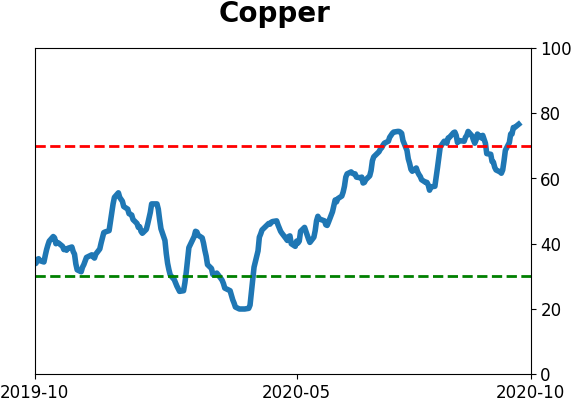
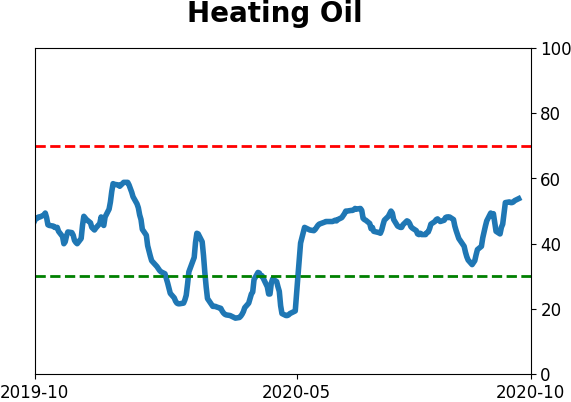
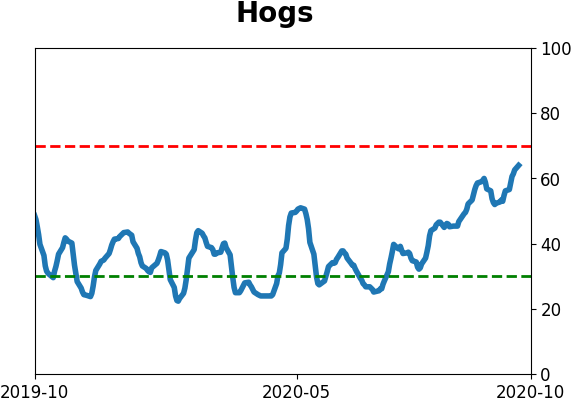
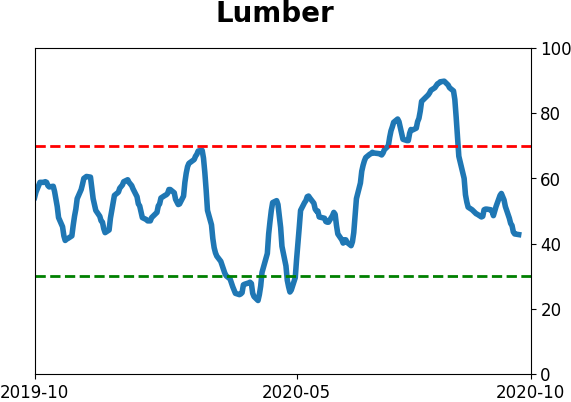
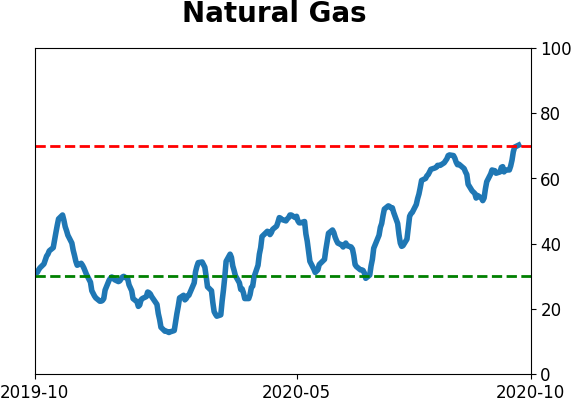
Commodity ETF's - 5-Day Moving Average
|
|