Headlines
|
|
Speculative behavior makes a comeback:
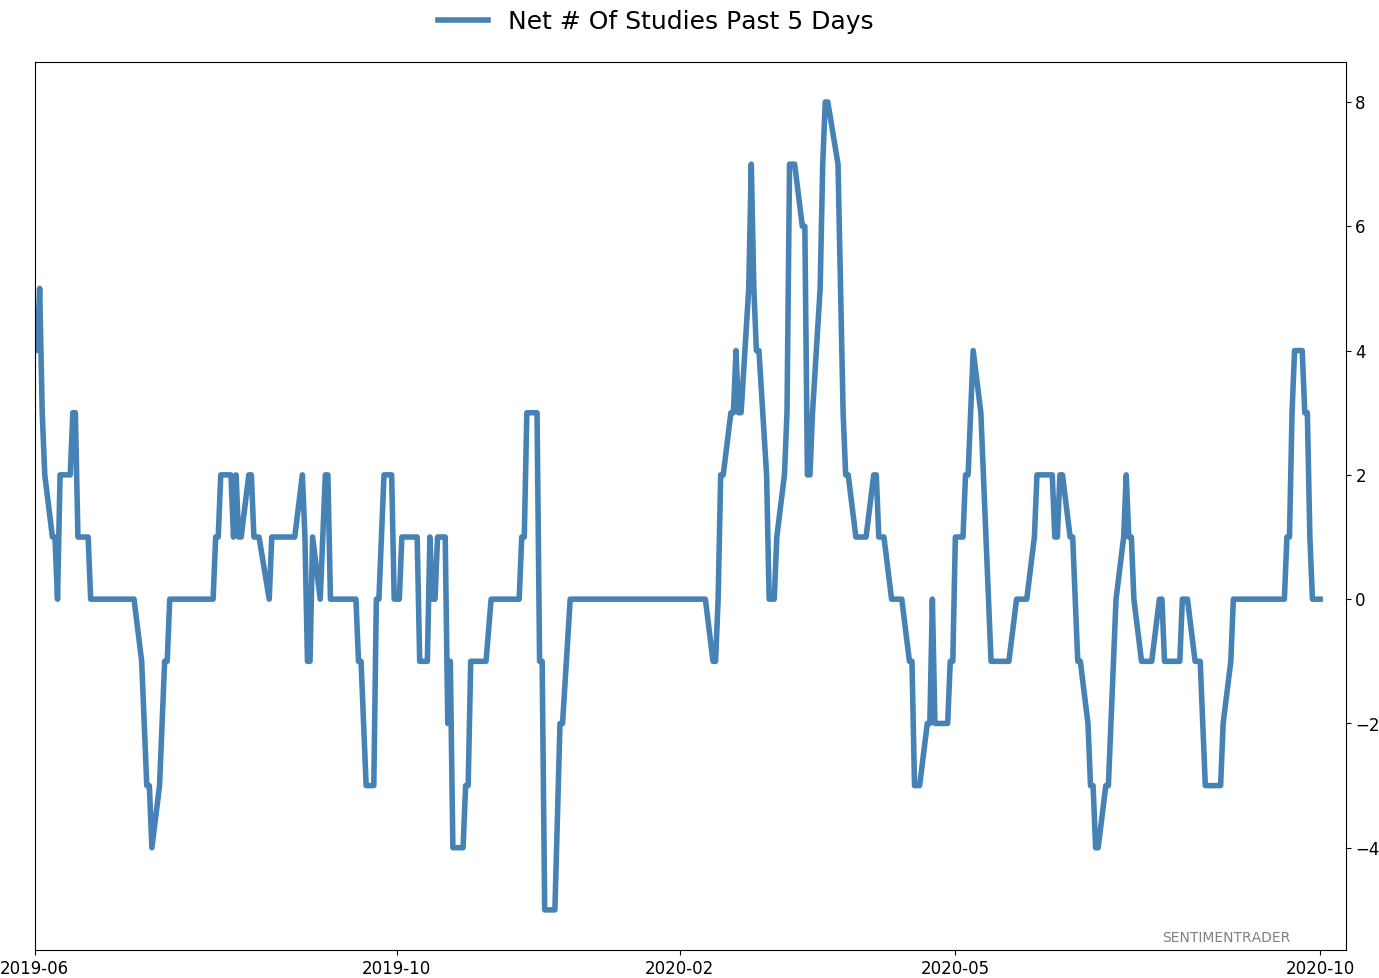
Over the past week, "smart money" hedgers have become net short, small options traders picked up their speculative activity, and one of our main models reached a new extreme. If indexes start to wobble, it will be a sign that month(s) of weakness likely like ahead.
Bottom Line:
- A positive environment favors becoming aggressive on signs of excessive pessimism.
|
Smart / Dumb Money Confidence
|
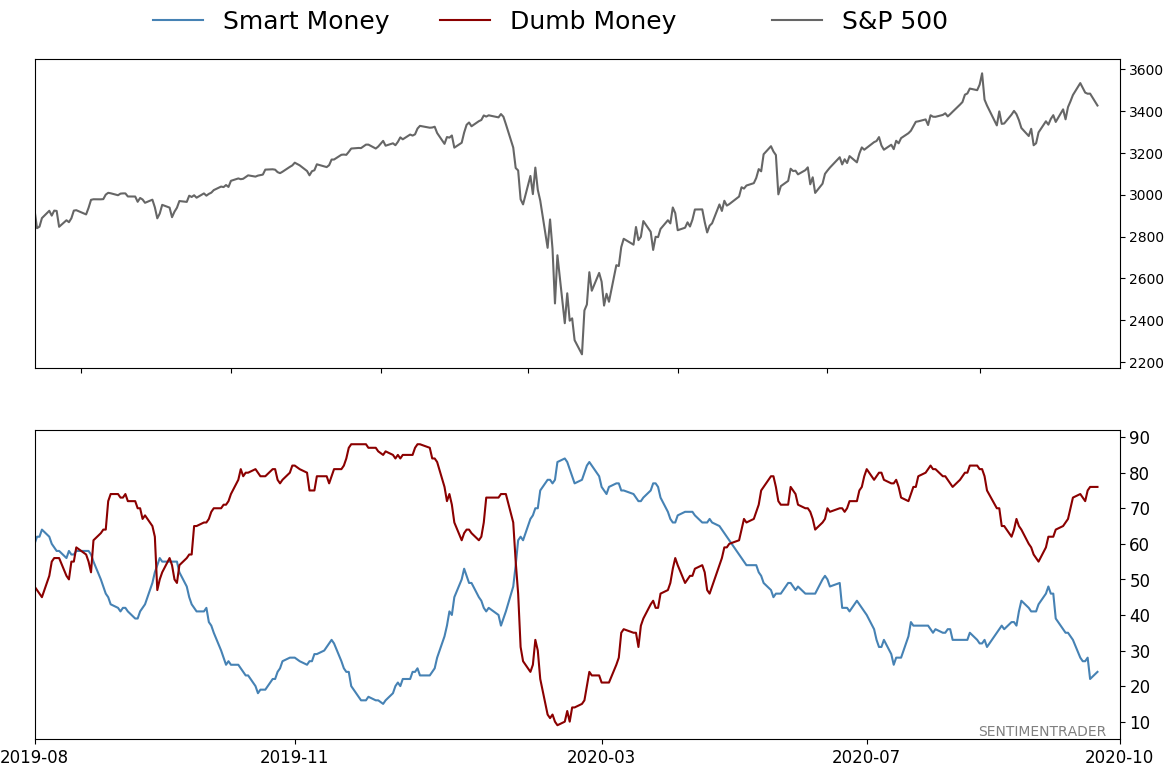
Smart Money Confidence: 24%
Dumb Money Confidence: 76%
|
|
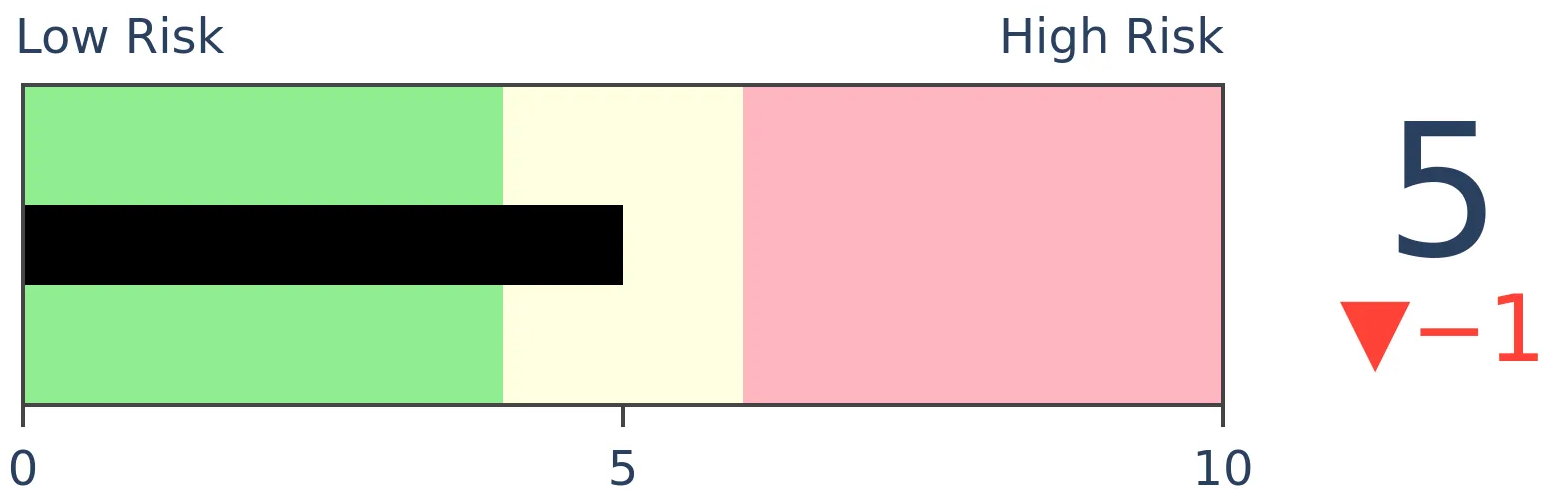
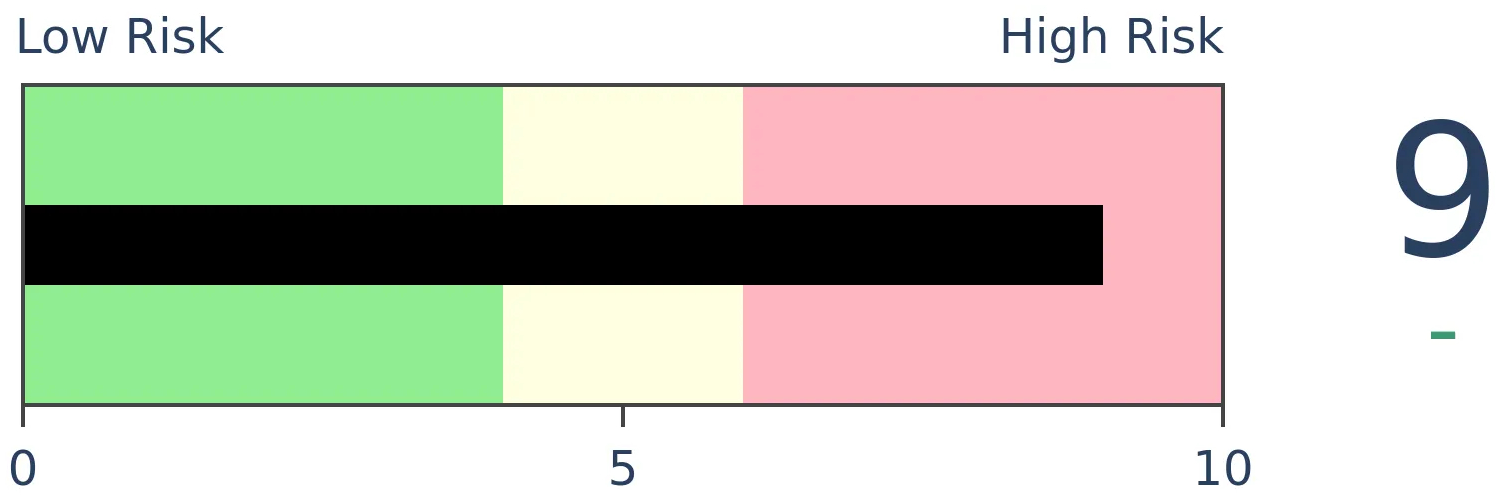
Risk Levels
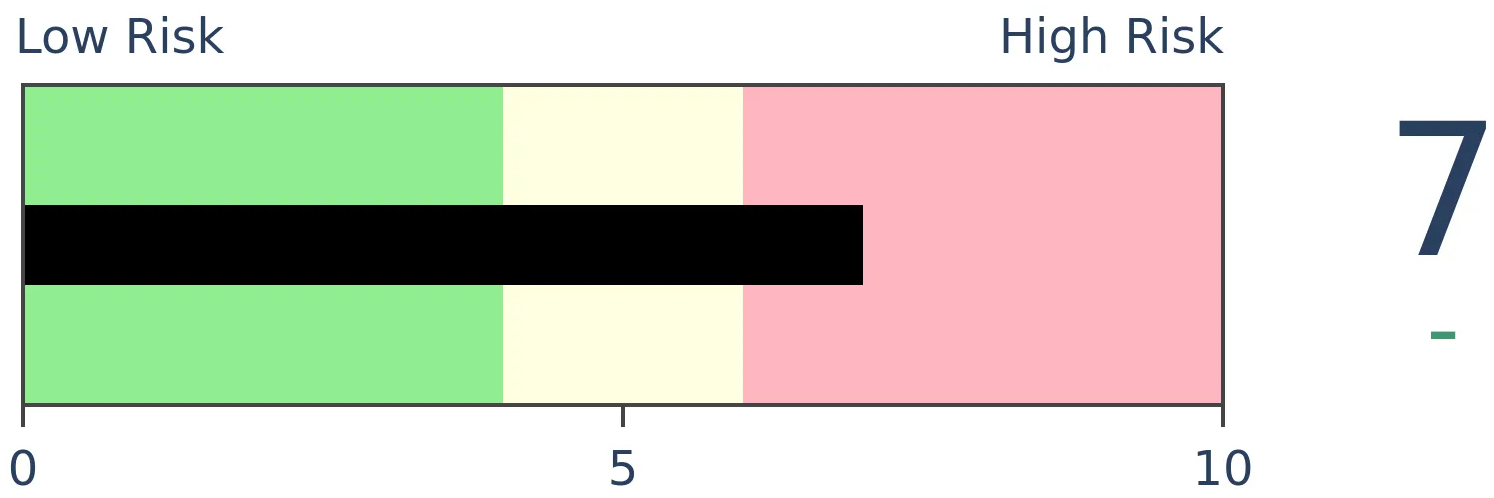
Stocks Short-Term
|
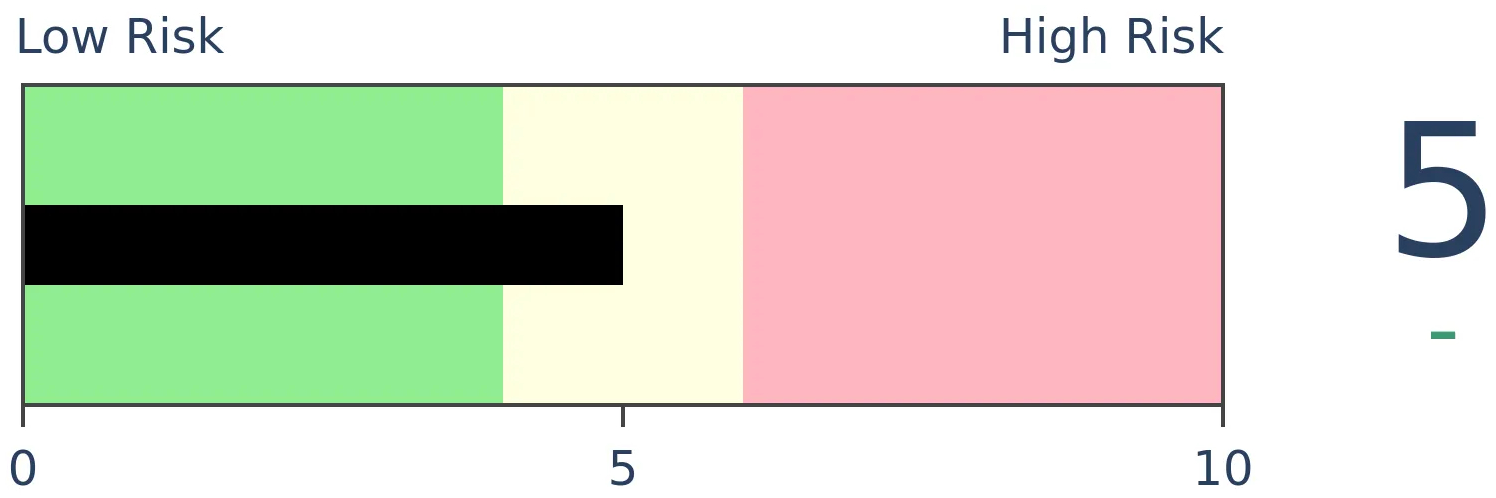
Stocks Medium-Term
|
|
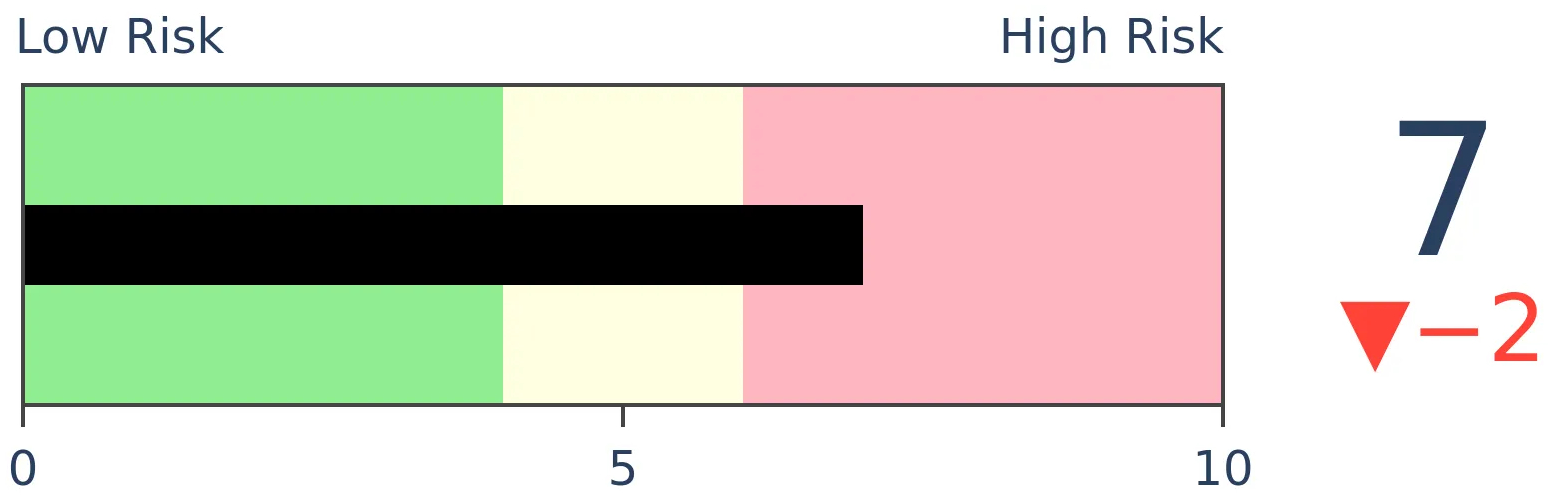
Bonds
|
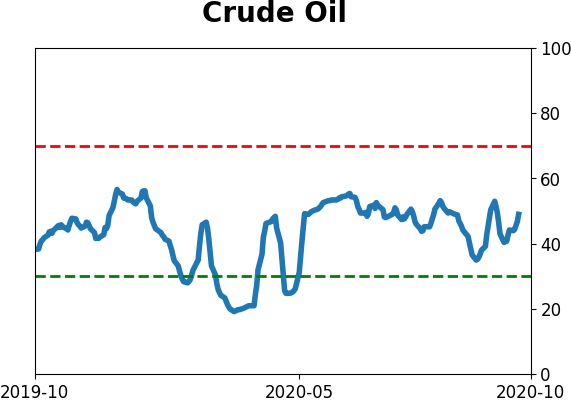
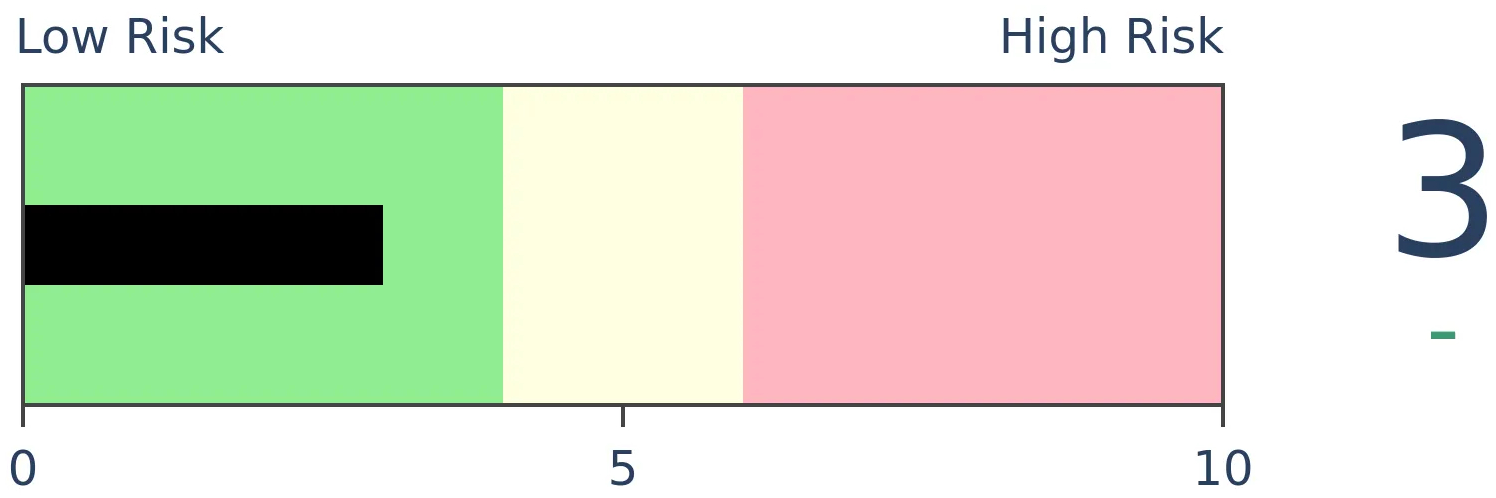
Crude Oil
|
|
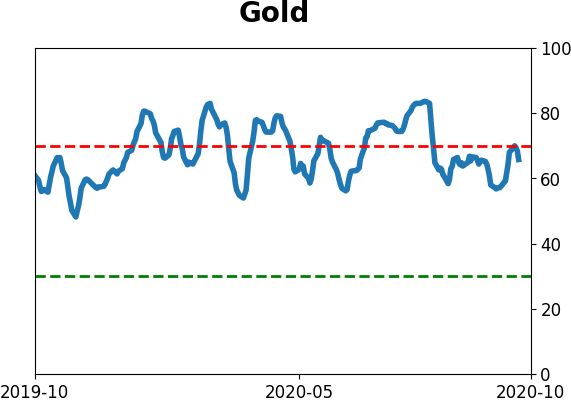
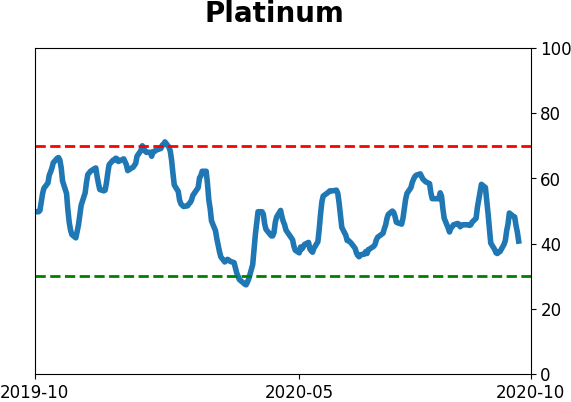
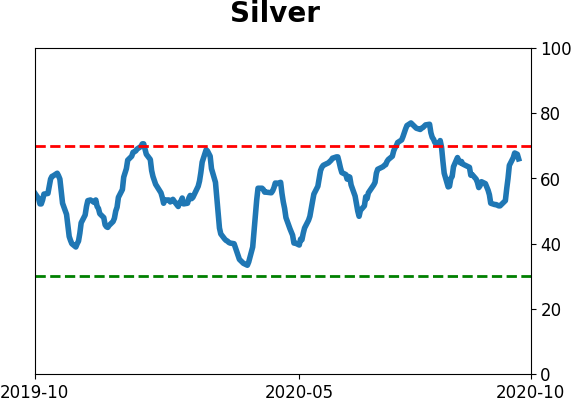
Gold
|
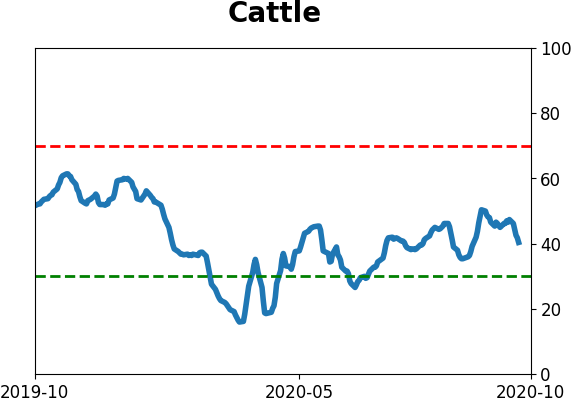
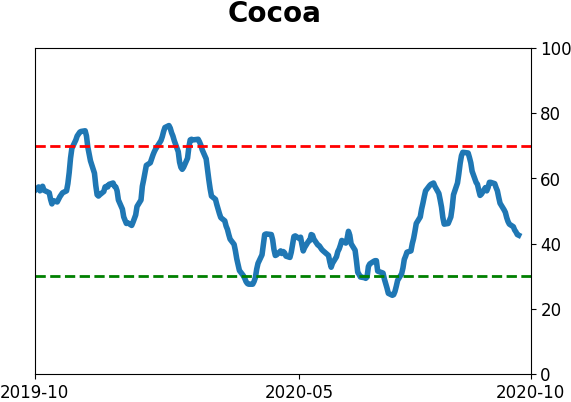
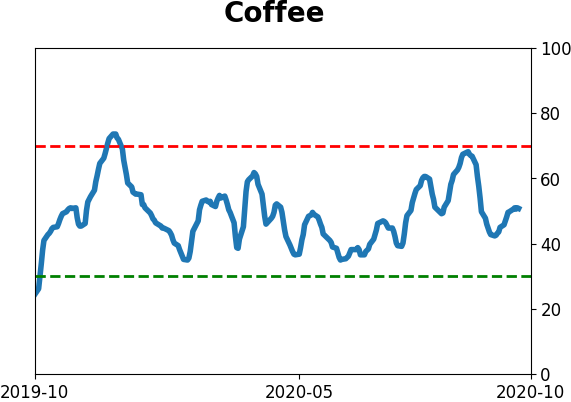
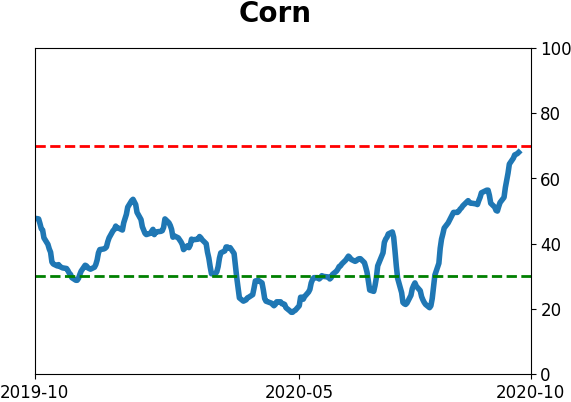
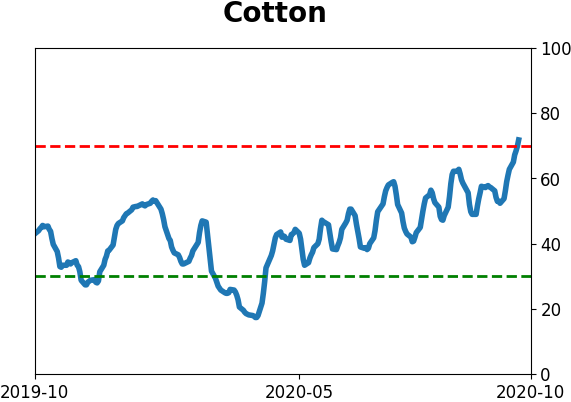
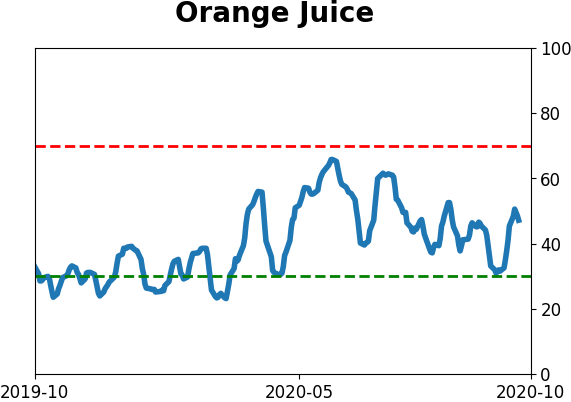
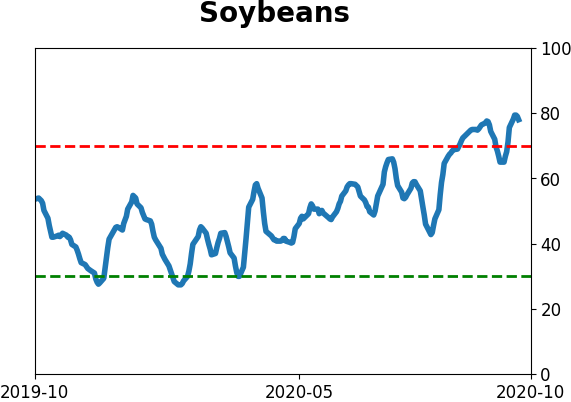
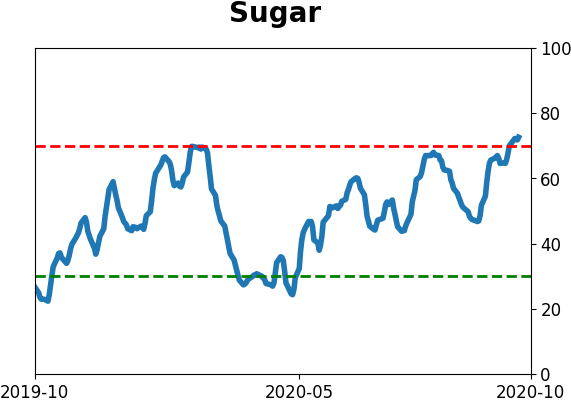
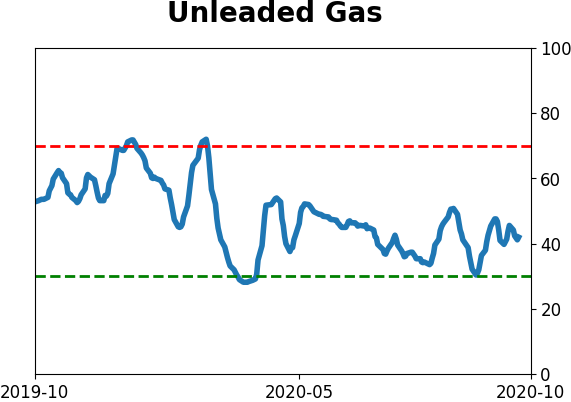
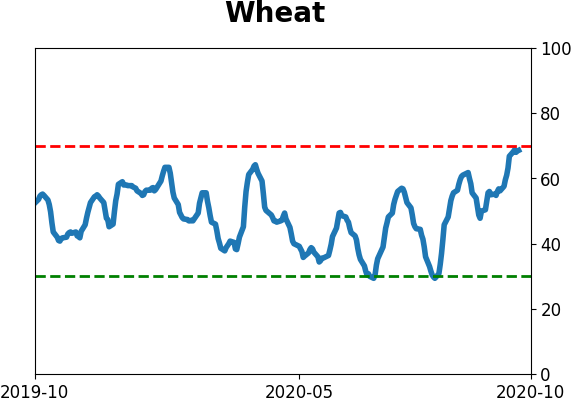
Agriculture
|
|
Research
BOTTOM LINE
Over the past week, "smart money" hedgers have become net short, small options traders picked up their speculative activity, and one of our main models reached a new extreme. If indexes start to wobble, it will be a sign that month(s) of weakness likely like ahead.
FORECAST / TIMEFRAME
None
|
One of the inputs causing our sentiment models to become extremely positive in March, and then stay elevated into May, was the behavior of speculators in the major equity index futures contracts. They shorted heavily and remained short through much of this rally.
Commercial hedgers take the opposite sides of large and small speculators, so hedgers were curiously net long since March. Over the past decade, in particular, a large net long position by this "smart money" group has invariably been an excellent buy signal.
As noted on Friday, that changed in a drastic way in the past week. Thanks to a dramatic change in positioning in the Nasdaq 100, hedgers' positions cycled from a large net long position to a large net short one. Over the past couple of years, when their net short neared $40 billion, stocks struggled.
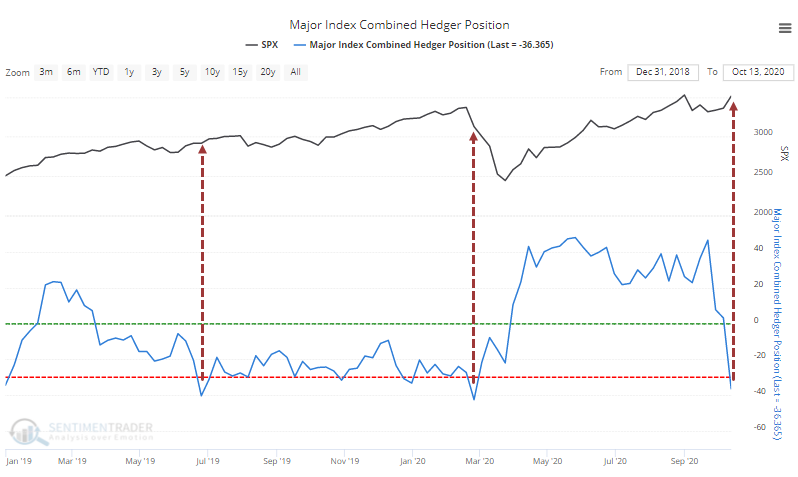
Historically, hedgers have established much larger shorts against stocks than they have now, so the absolute level of their exposure isn't too troubling. It's more of a concern that one of the reasons for being positive has now evaporated.
When hedgers have been net long for at least 6 weeks and then flipped to a net short position, stocks have struggled over the short- to medium-term.
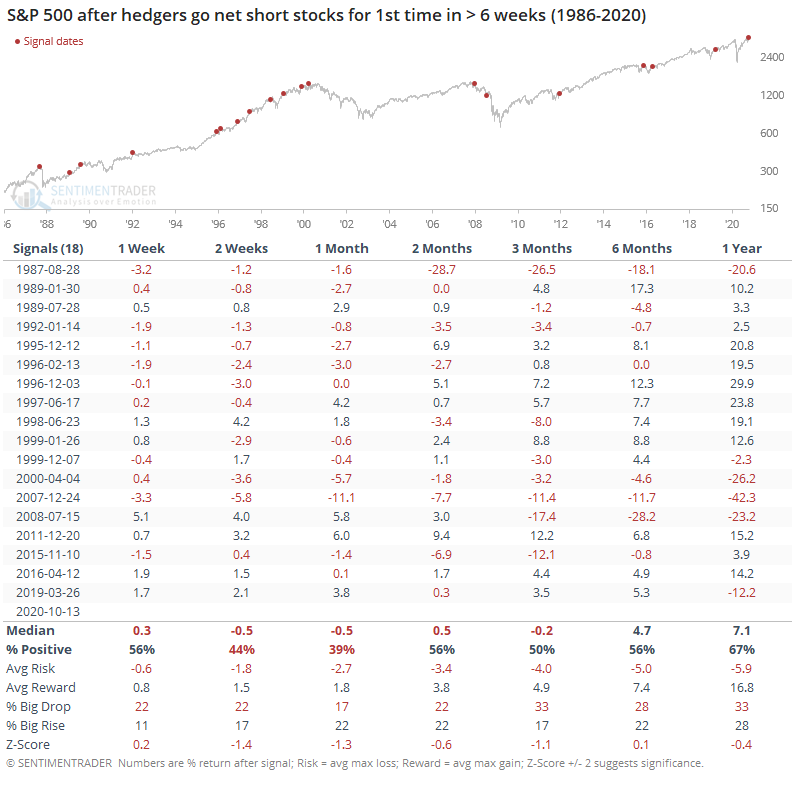
Up to about 3 months later, the S&P 500's average return was below average, it had a tendency to decline, the risk/reward was about even, and there was a slightly larger probability of a big drop than a big rise. None of them are extreme, but given the general trend of rising prices over the study period, these figures are well below random.
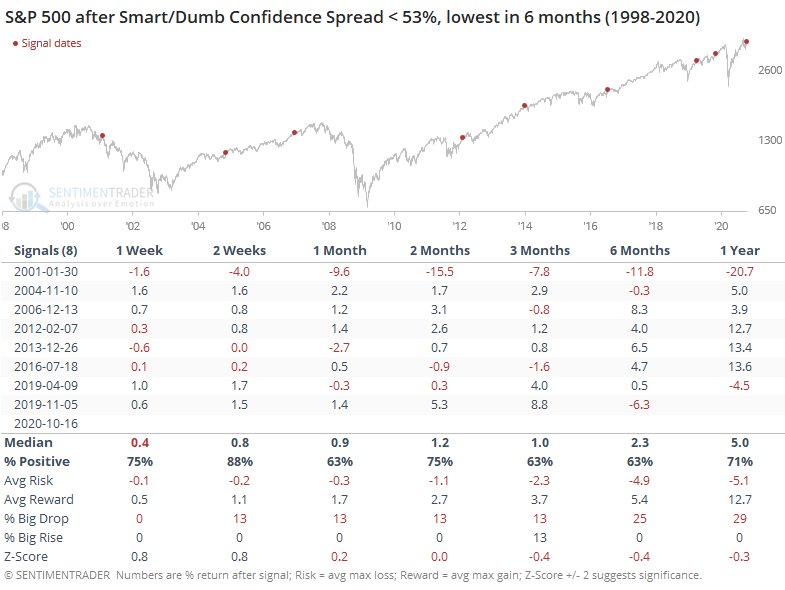
Due in part to this change in hedgers' positions, Smart Money Confidence has plunged. Combined with still-high Dumb Money Confidence, the spread between them has declined to the lowest since January. It has dropped to -50% or below a few times over the past 2 years, each eventually leading to a give-back of most or all of the gains made while the model was extreme.
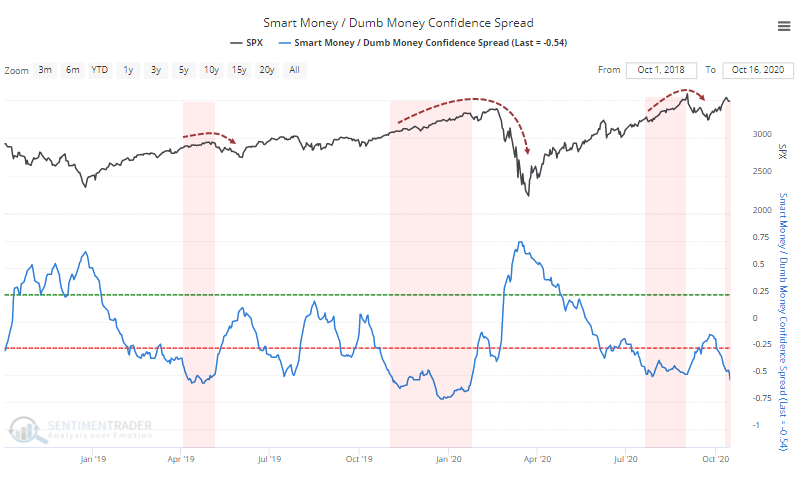
Each time the spread got this low, stocks managed to creep higher for weeks or even months. There was less of a tendency to see this in the past, so maybe something's changed in the makeup of market participants, or maybe it's "just one of those things." It's impossible to know yet. The S&P didn't start to really wobble until it violated its 20-day moving average, so if we're going to see a repeat of this type of behavior following an extreme, then that's a simple way to watch for increased danger in the weeks ahead.
When the spread got this low for the first time in months, it led to below-average returns, but the time frame in which weakness eventually set in was highly variable.
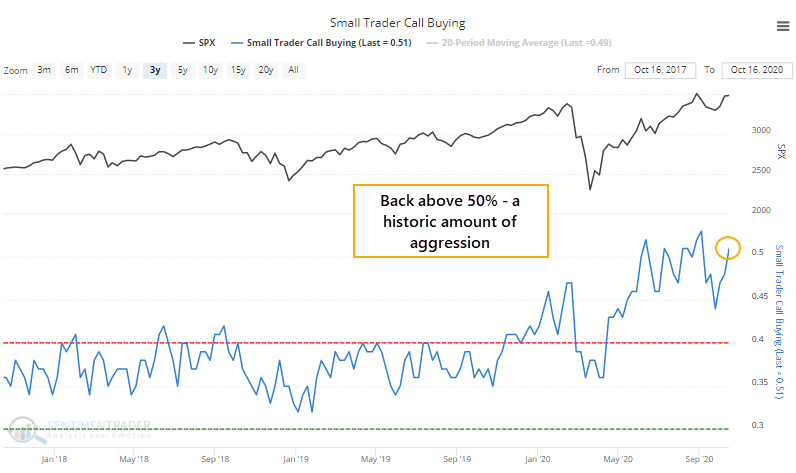
As hedgers were retreating, small options traders kept storming back. Last week, they once again spent more than 50% of their total volume on buying speculative call options.
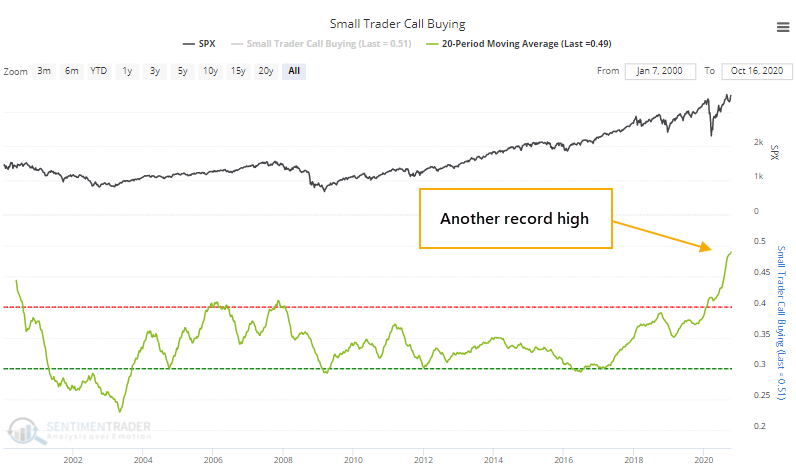
Clearly, these traders have had a large focus on buying call options for months. The 20-week average of this figure is now well above the peak from 2000.
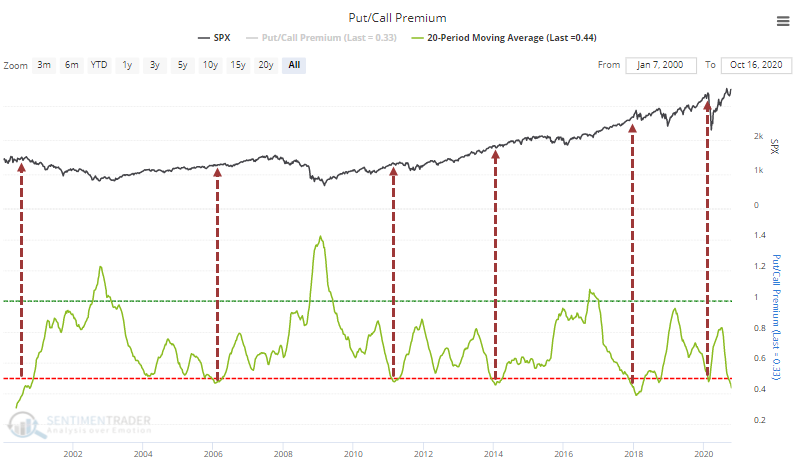
Last week, they spent about 3x more on call option premiums than put option premiums, among the lowest in years.
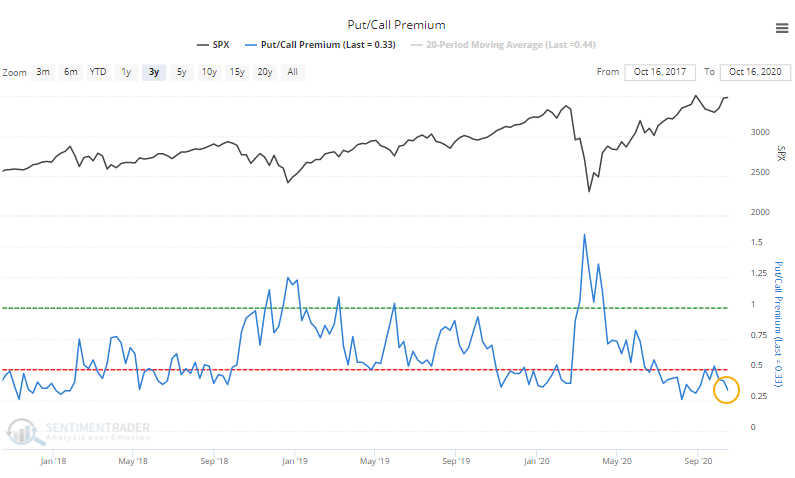
That's pushed the 20-week average of the Put/Call Premium ratio to among the lowest in 20 years.
The biggest thing stocks have going for them now is the impressive thrust in breadth, derived by small-caps and tech stocks. That's not the kind of activity we saw in August when risk appeared high. It's hard to see how renewed aggression by options traders will be rewarded, as markets just don't accommodate that kind of behavior for long. Given how markets have responded in recent years, we have to accept that we may see another creeper type of uptrend in the weeks ahead, but when prices start to violate their shorter-term moving averages, it'll be a warning that this excessive optimism will need some time to be worked off.
Active Studies
| Time Frame | Bullish | Bearish | | Short-Term | 0 | 0 | | Medium-Term | 4 | 8 | | Long-Term | 48 | 2 |
|
Indicators at Extremes
Portfolio
| Position | Description | Weight % | Added / Reduced | Date | | Stocks | 15.6% RSP, 10.1% VWO, 7.5% XLE, 5.1% PSCE | 38.2 | Added 5% | 2020-10-15 | | Bonds | 10% BND, 10% SCHP, 10% ANGL | 29.7 | Reduced 0.1% | 2020-10-02 | | Commodities | GCC | 2.4 | Reduced 2.1%
| 2020-09-04 | | Precious Metals | GDX | 4.7 | Added 5% | 2020-09-09 | | Special Situations | | 0.0 | Reduced 5% | 2020-10-02 | | Cash | | 25.0 | | |
|
Updates (Changes made today are underlined)
After the September swoon wrung some of the worst of the speculation out of stocks, there are some signs that it's returning, especially in the options market. It's helped to push Dumb Money Confidence above 70%. A big difference between now and August is that in August, there was a multitude of days with exceptionally odd breadth readings. Some of the biggest stocks were masking underlying weakness. Combined with heavy speculative activity, it was a dangerous setup. Now, we've seen very strong internal strength, in the broad market, as well as tech and small-cap stocks. Prior signals almost invariably led to higher prices. That's hard to square with the idea that forward returns tend to be subdued when Confidence is high, but that's less reliable during healthy market conditions, which we're seeing now (for the most part). I added some risk with small-cap energy stocks, due to an increasing number of positive signs in both small-caps and energy. This is intended as a long-term position.
RETURN YTD: -0.9% 2019: 12.6%, 2018: 0.6%, 2017: 3.8%, 2016: 17.1%, 2015: 9.2%, 2014: 14.5%, 2013: 2.2%, 2012: 10.8%, 2011: 16.5%, 2010: 15.3%, 2009: 23.9%, 2008: 16.2%, 2007: 7.8%
|
|
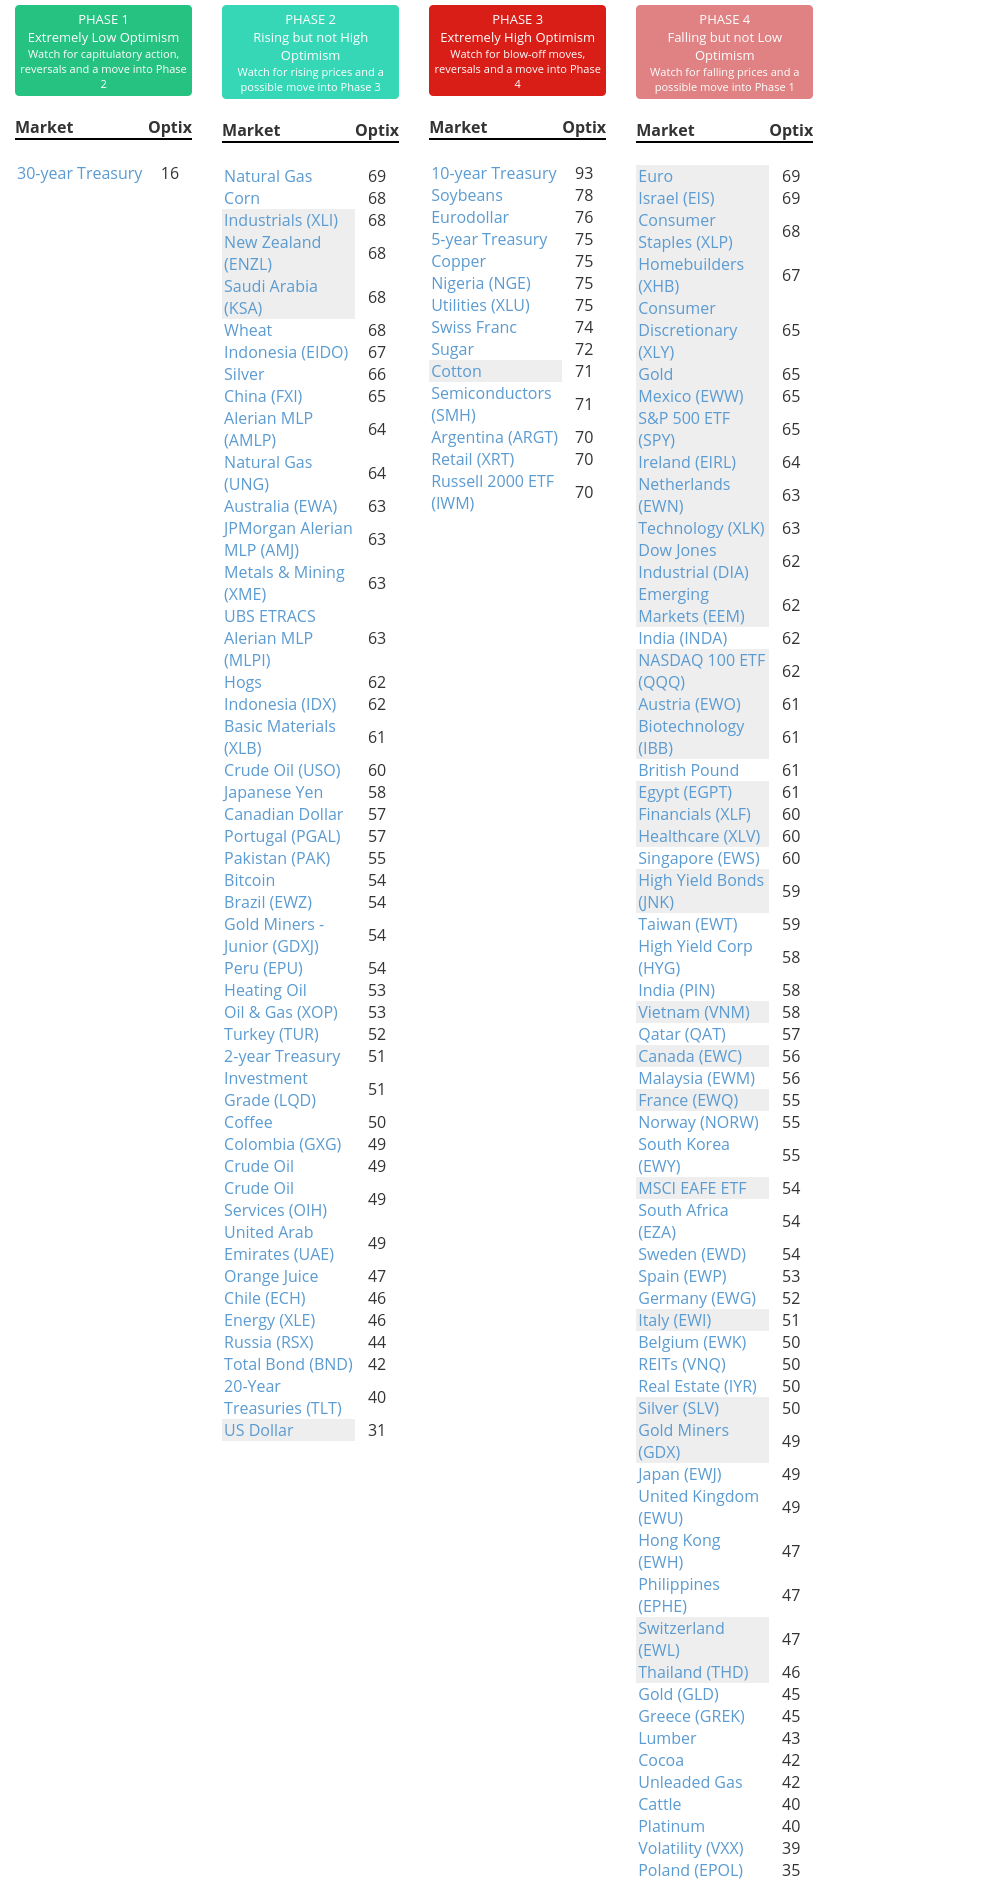
Phase Table
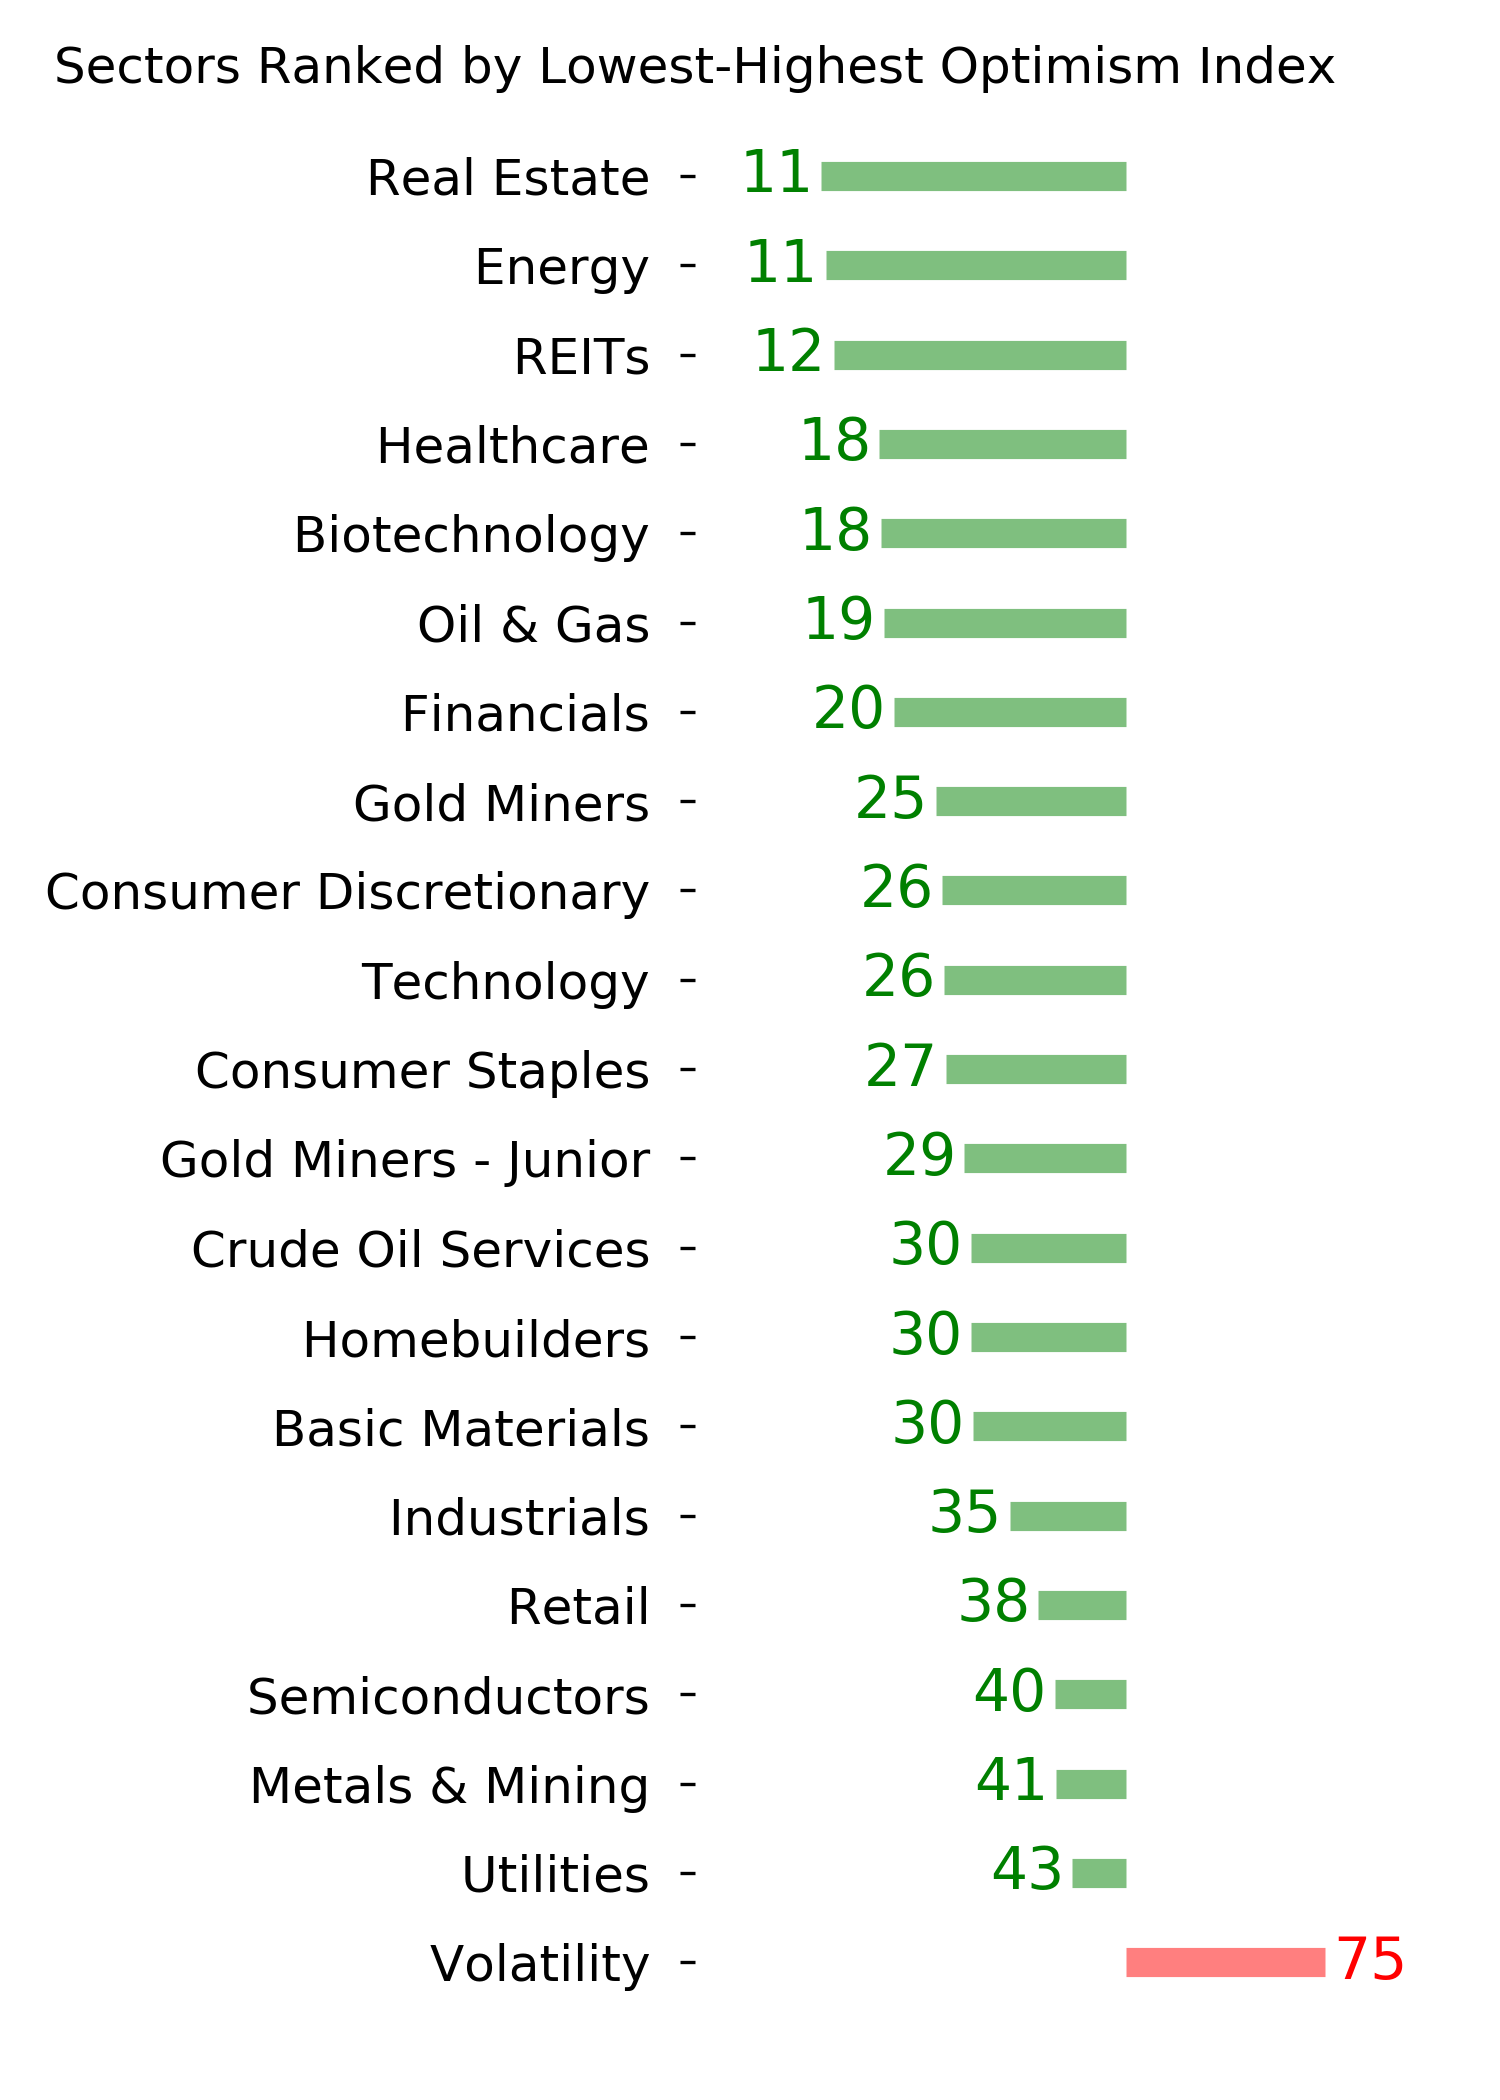
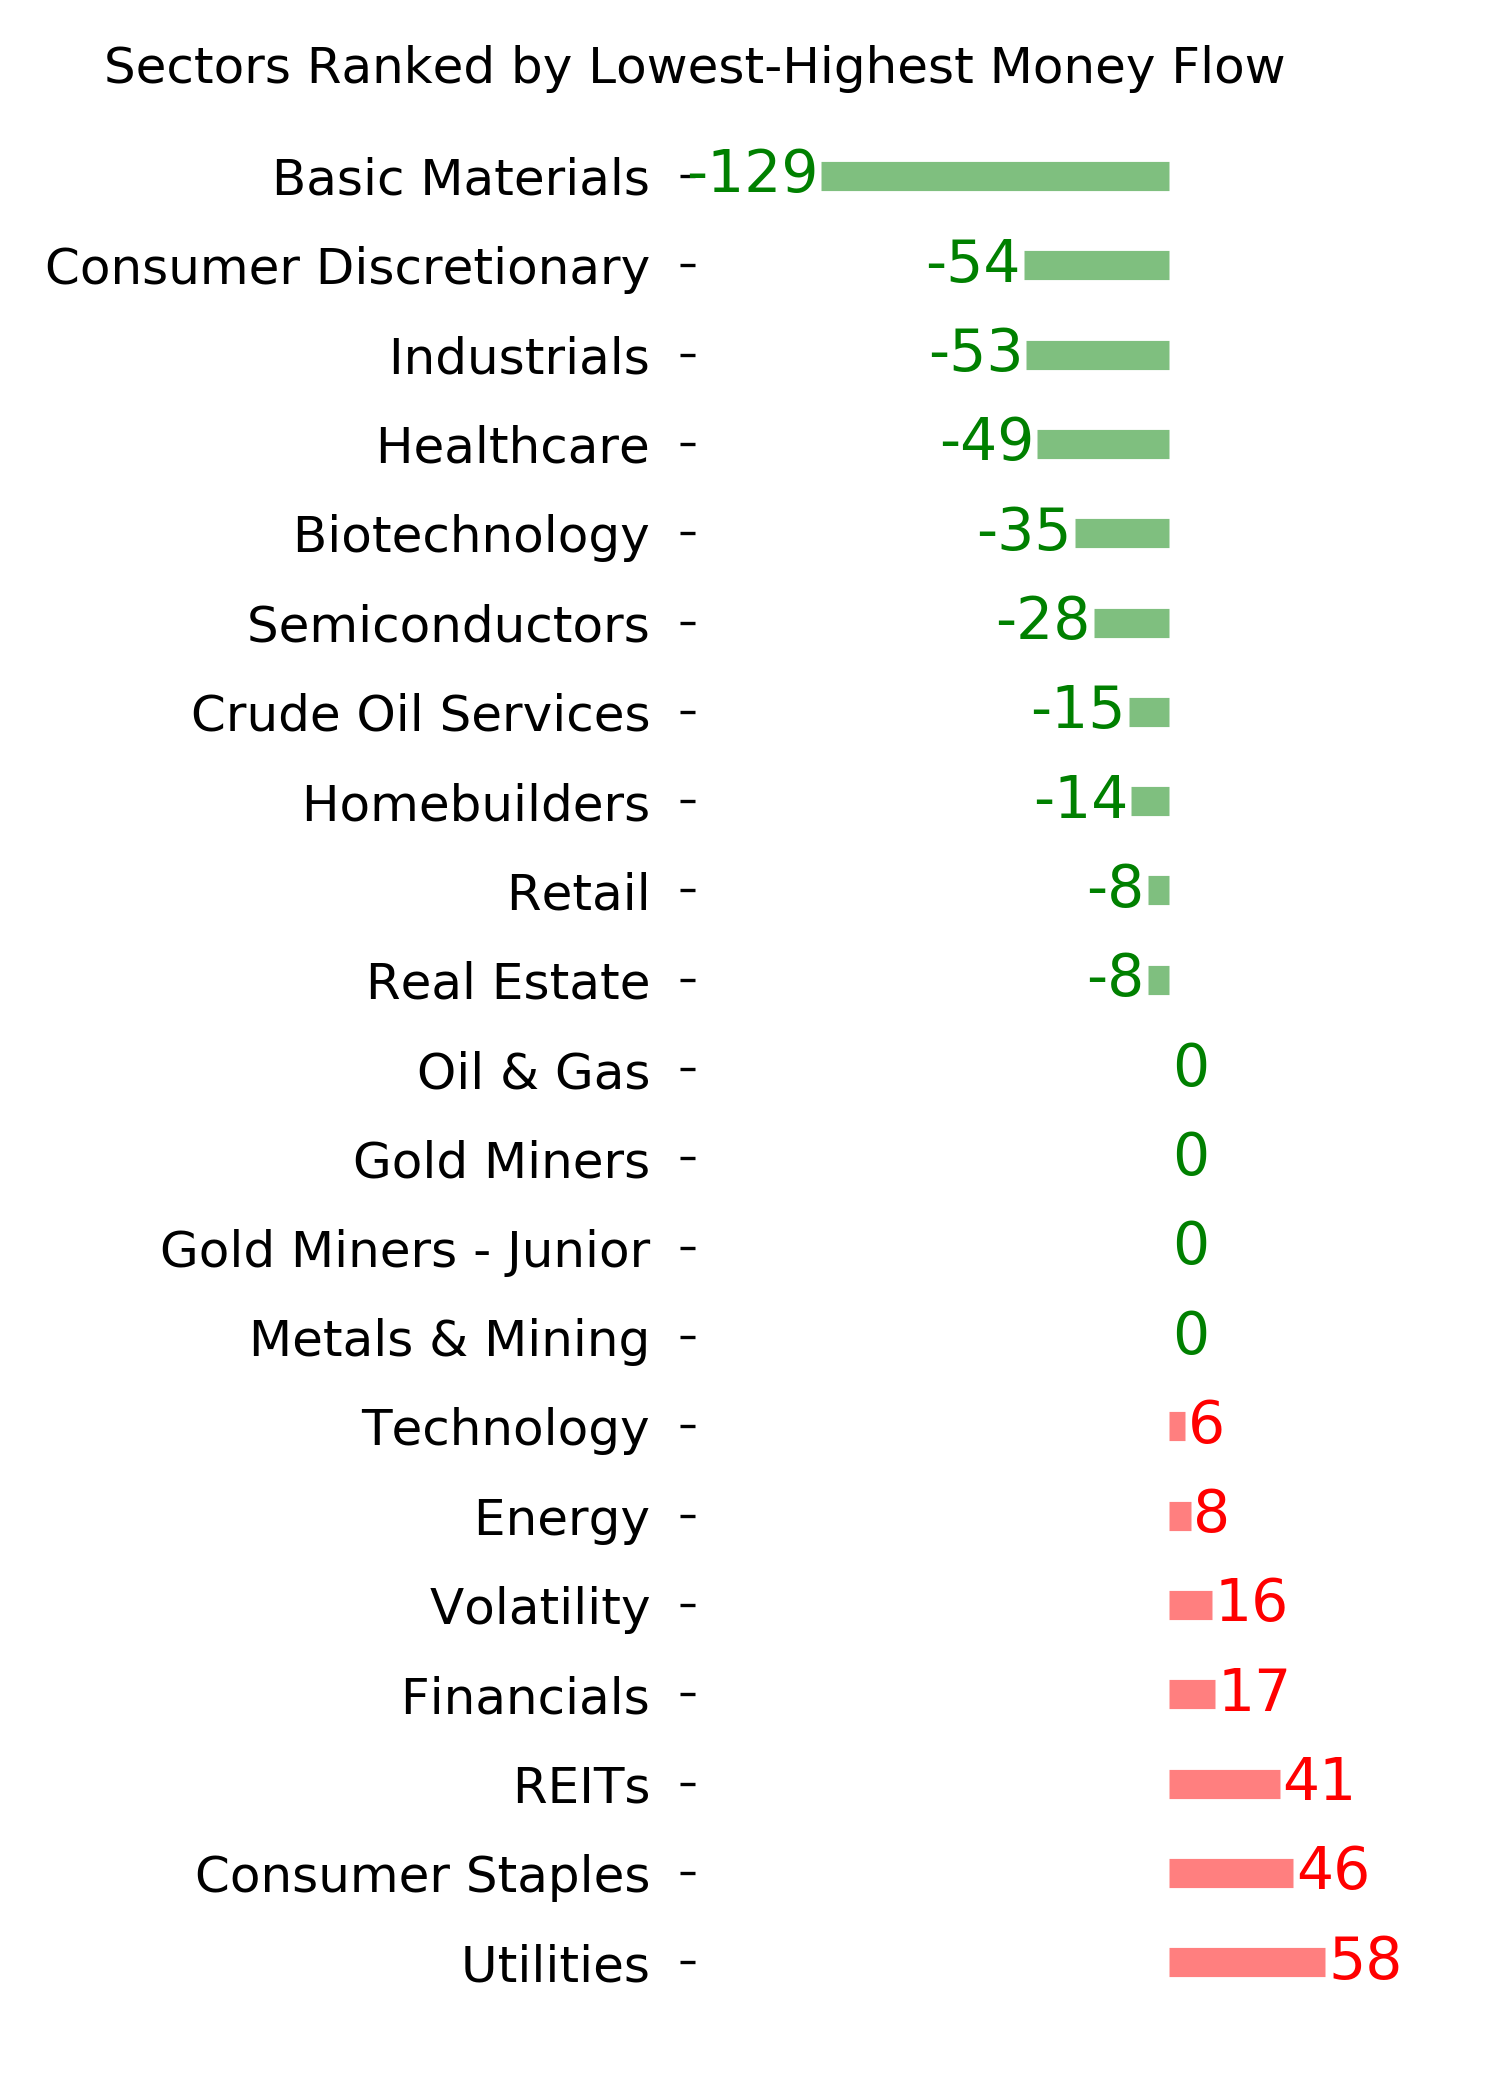
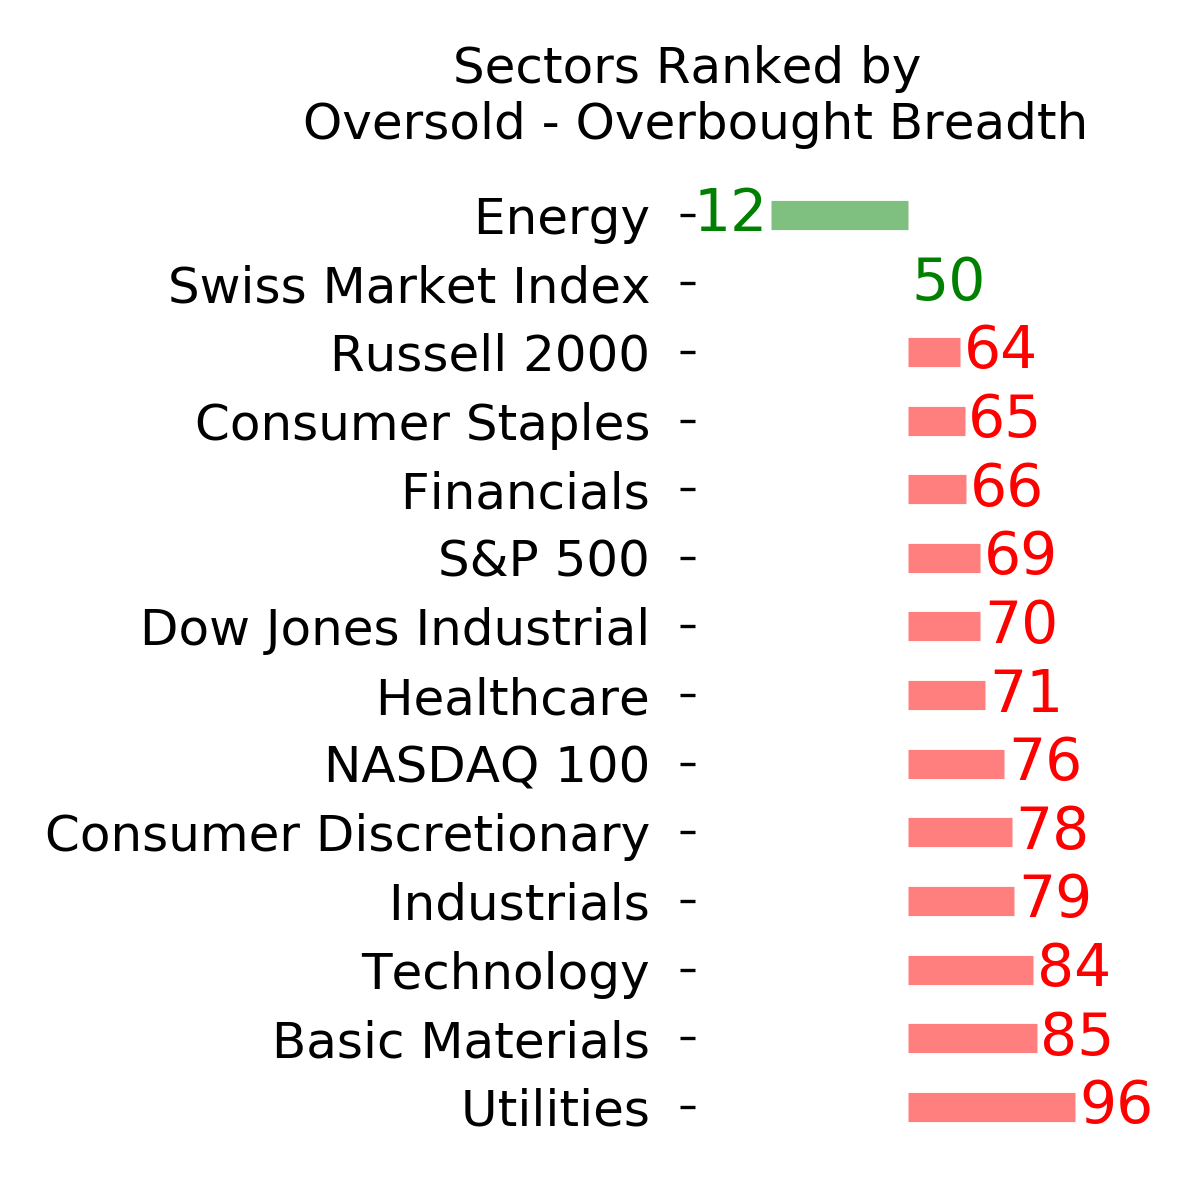
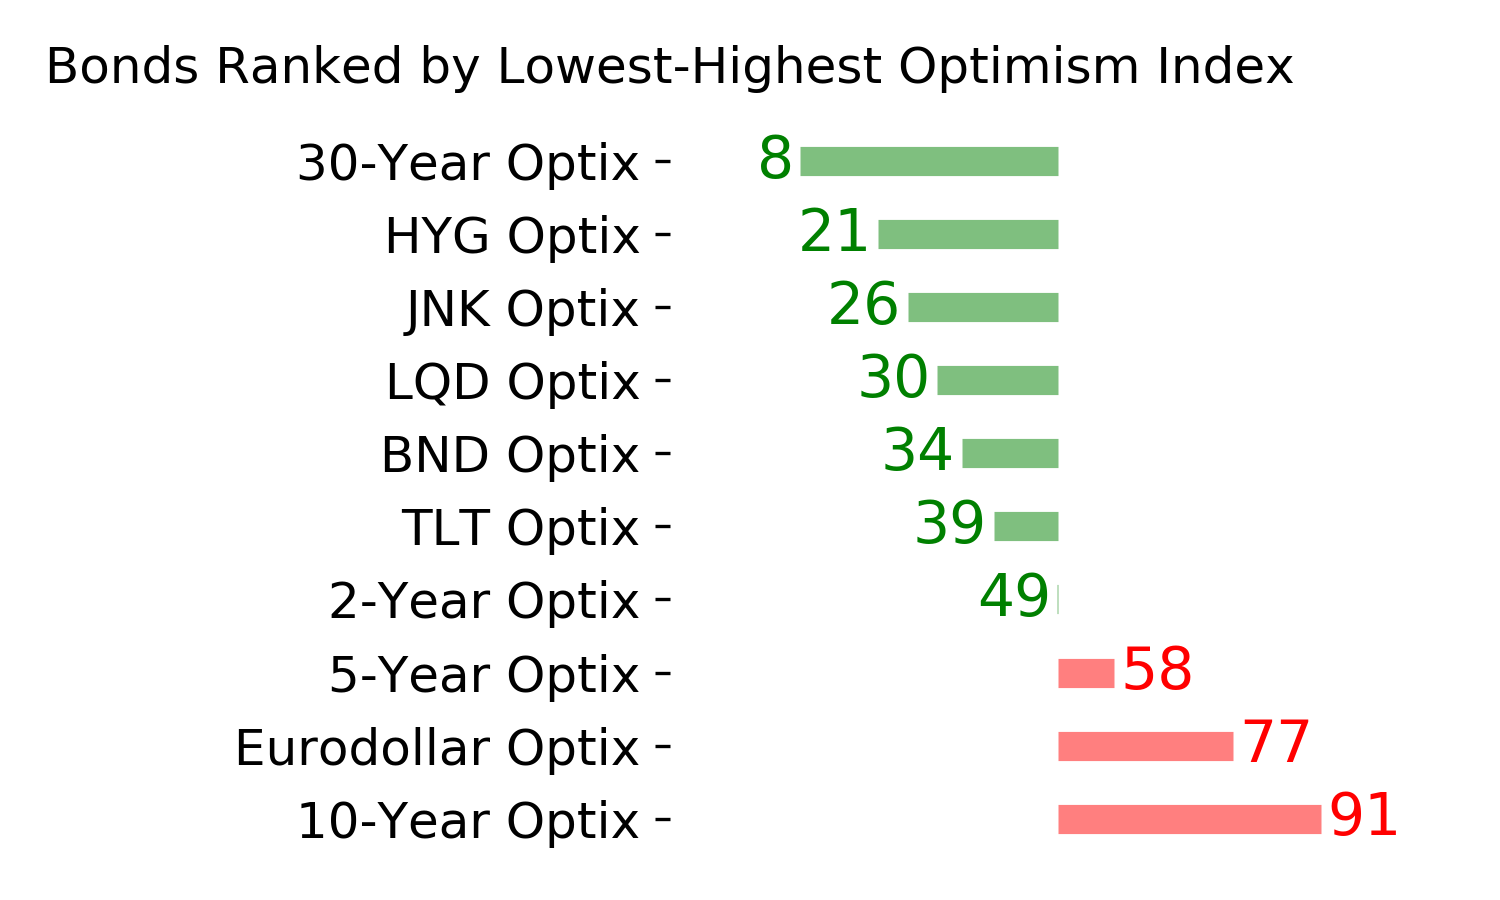
Ranks
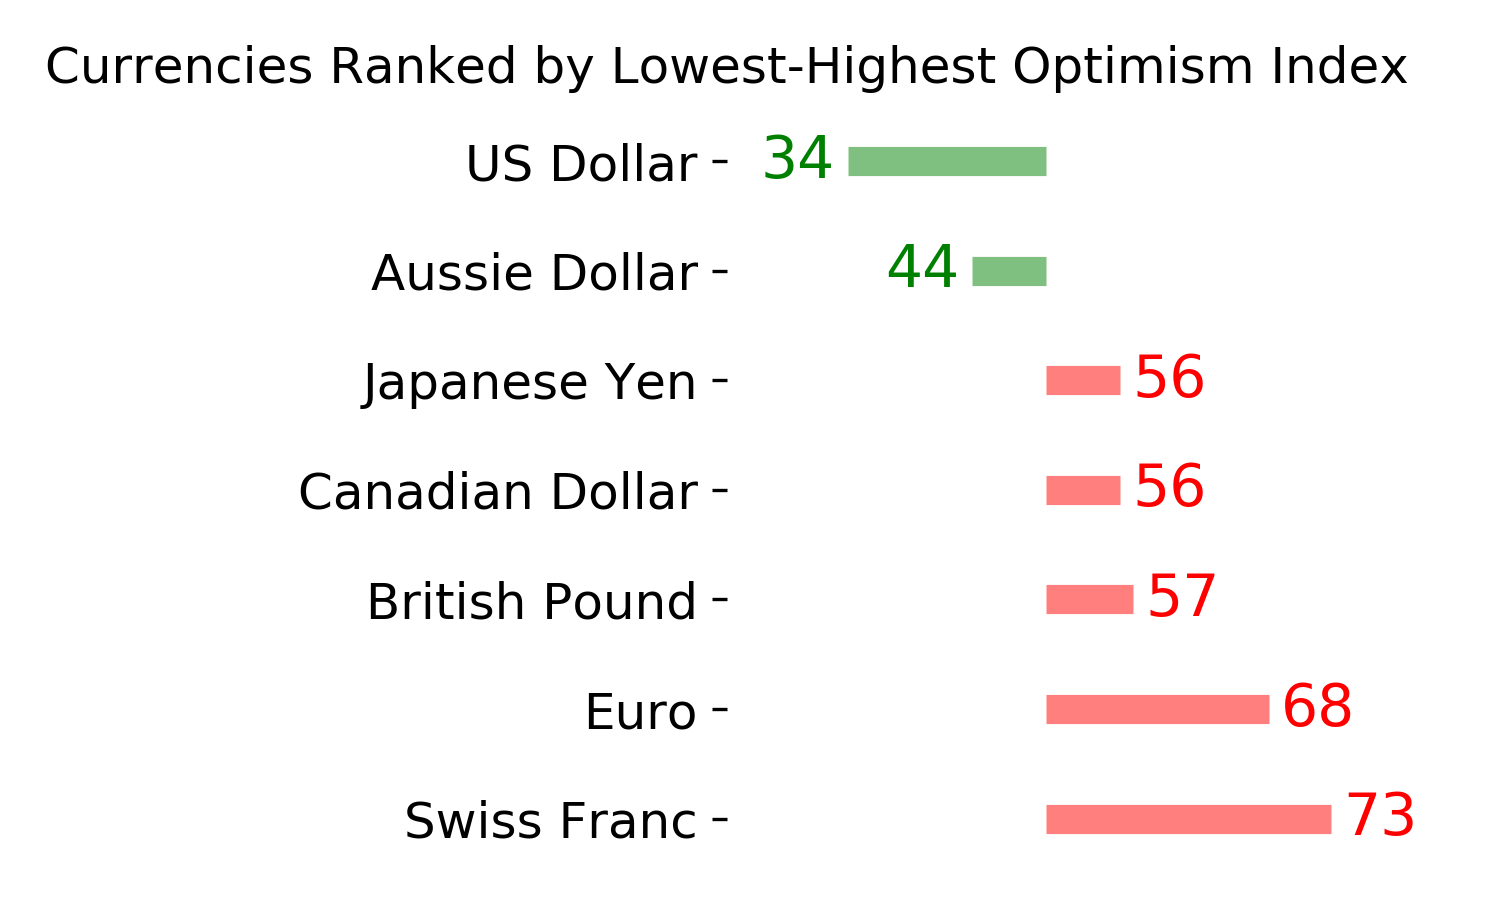
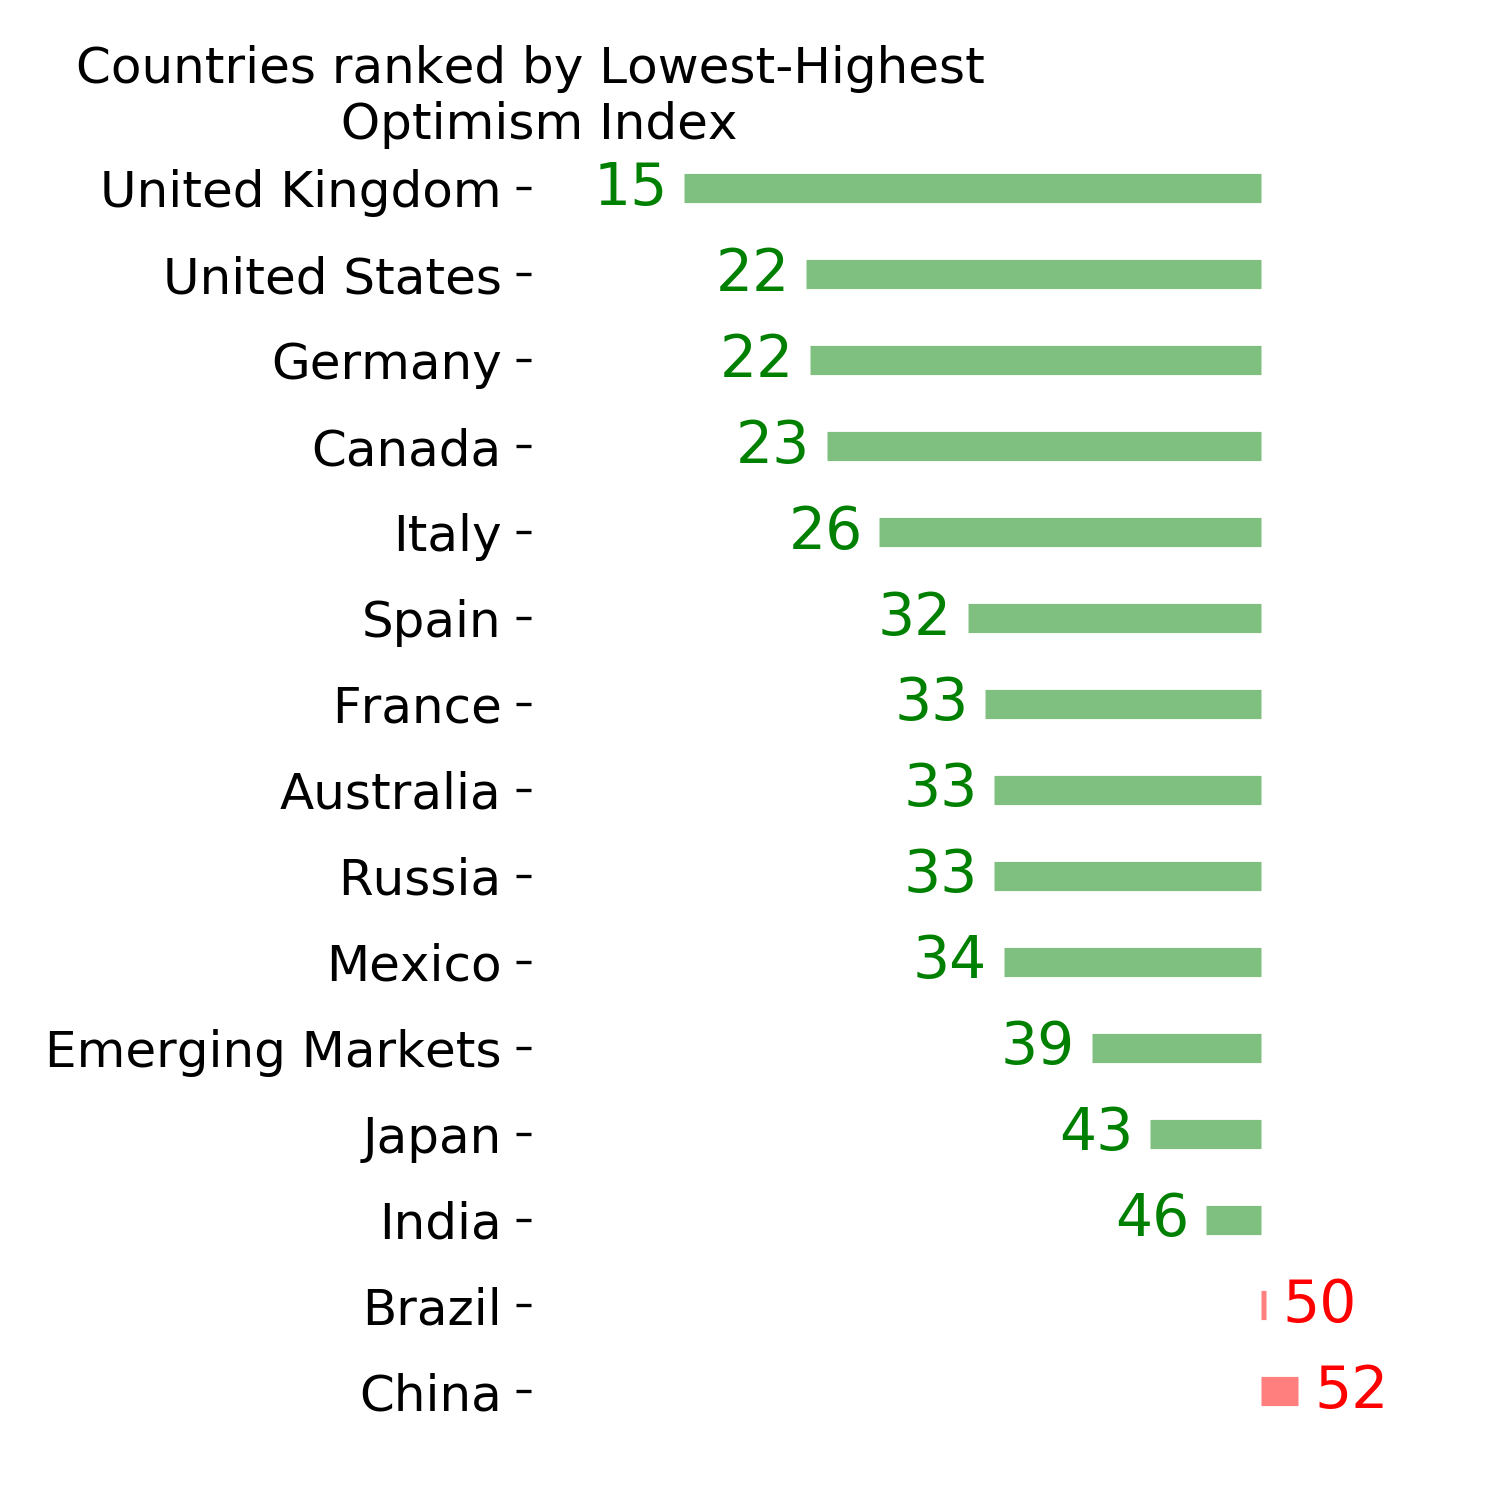
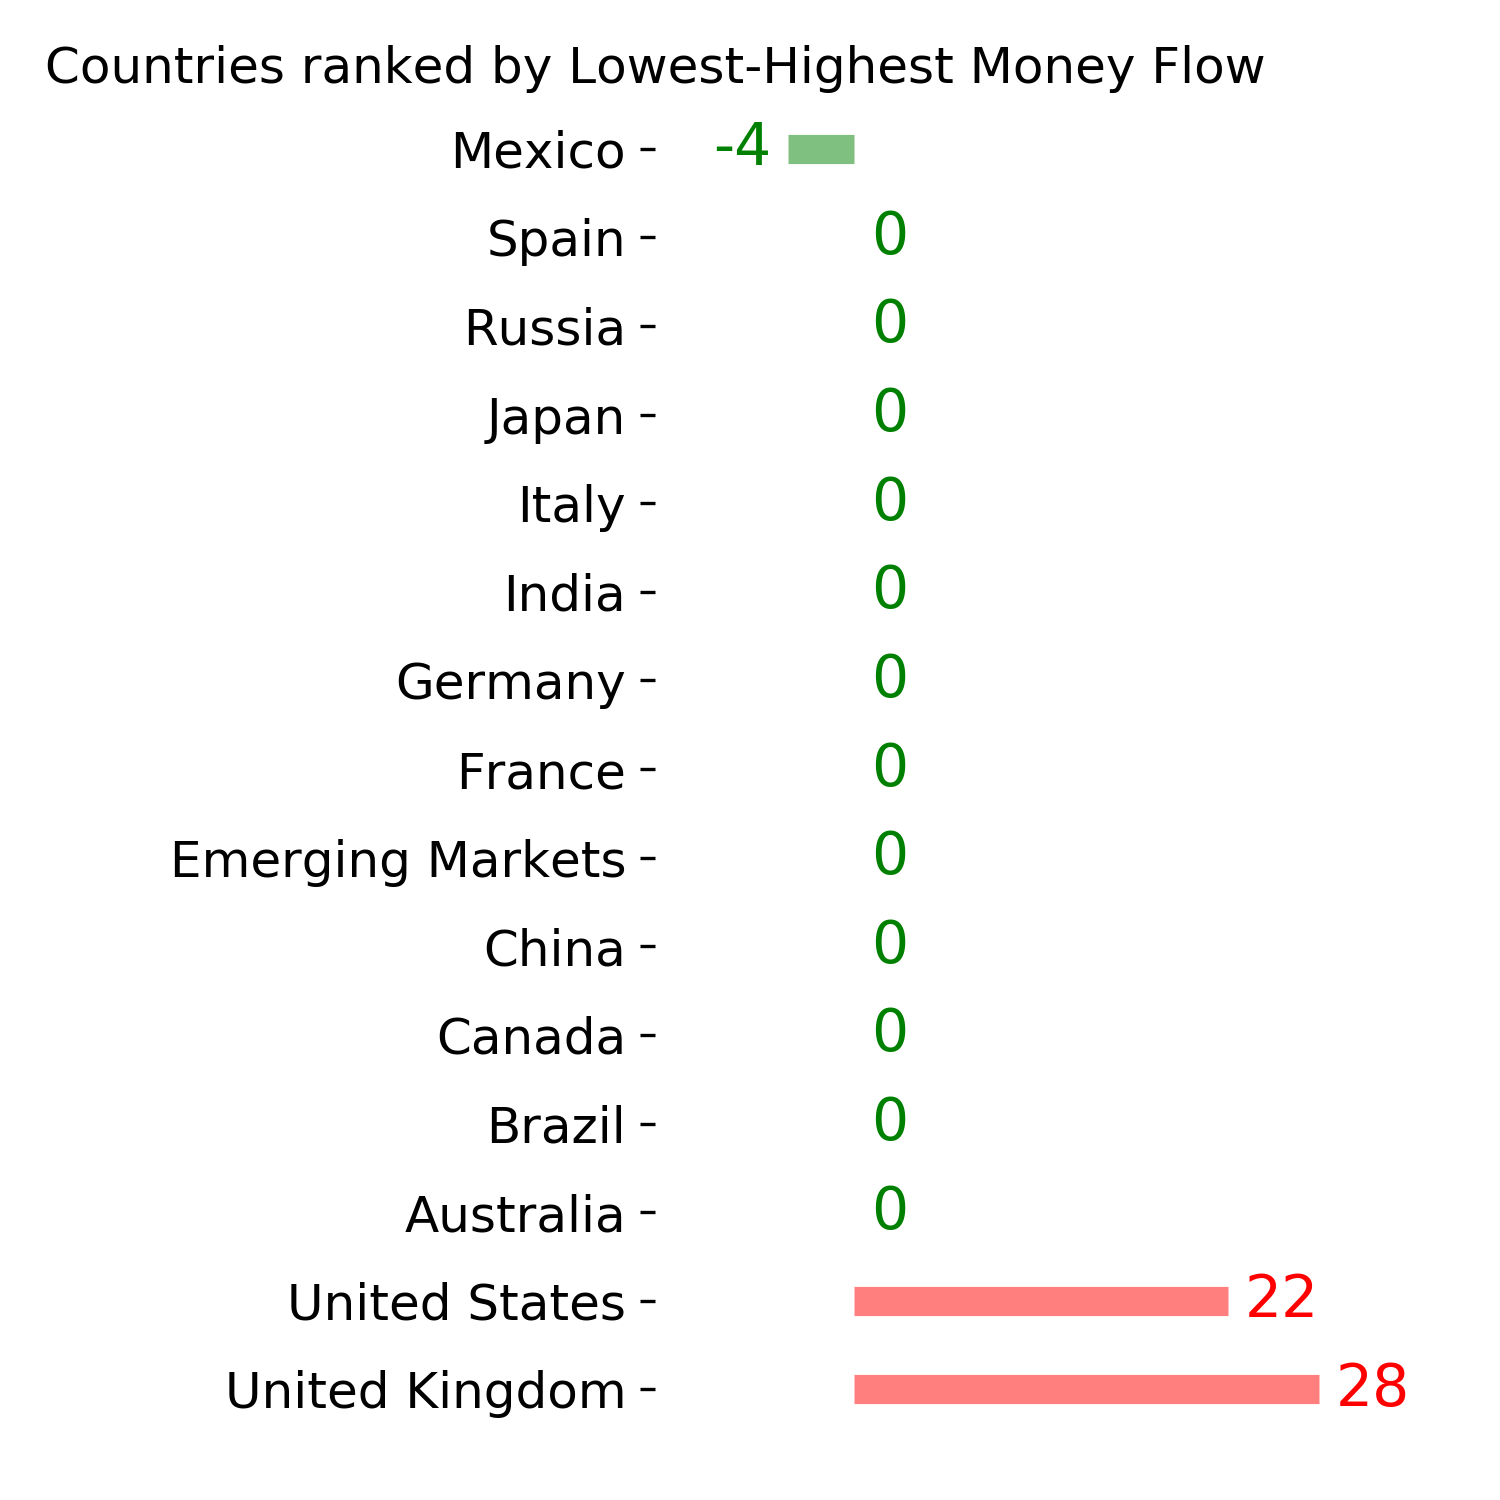
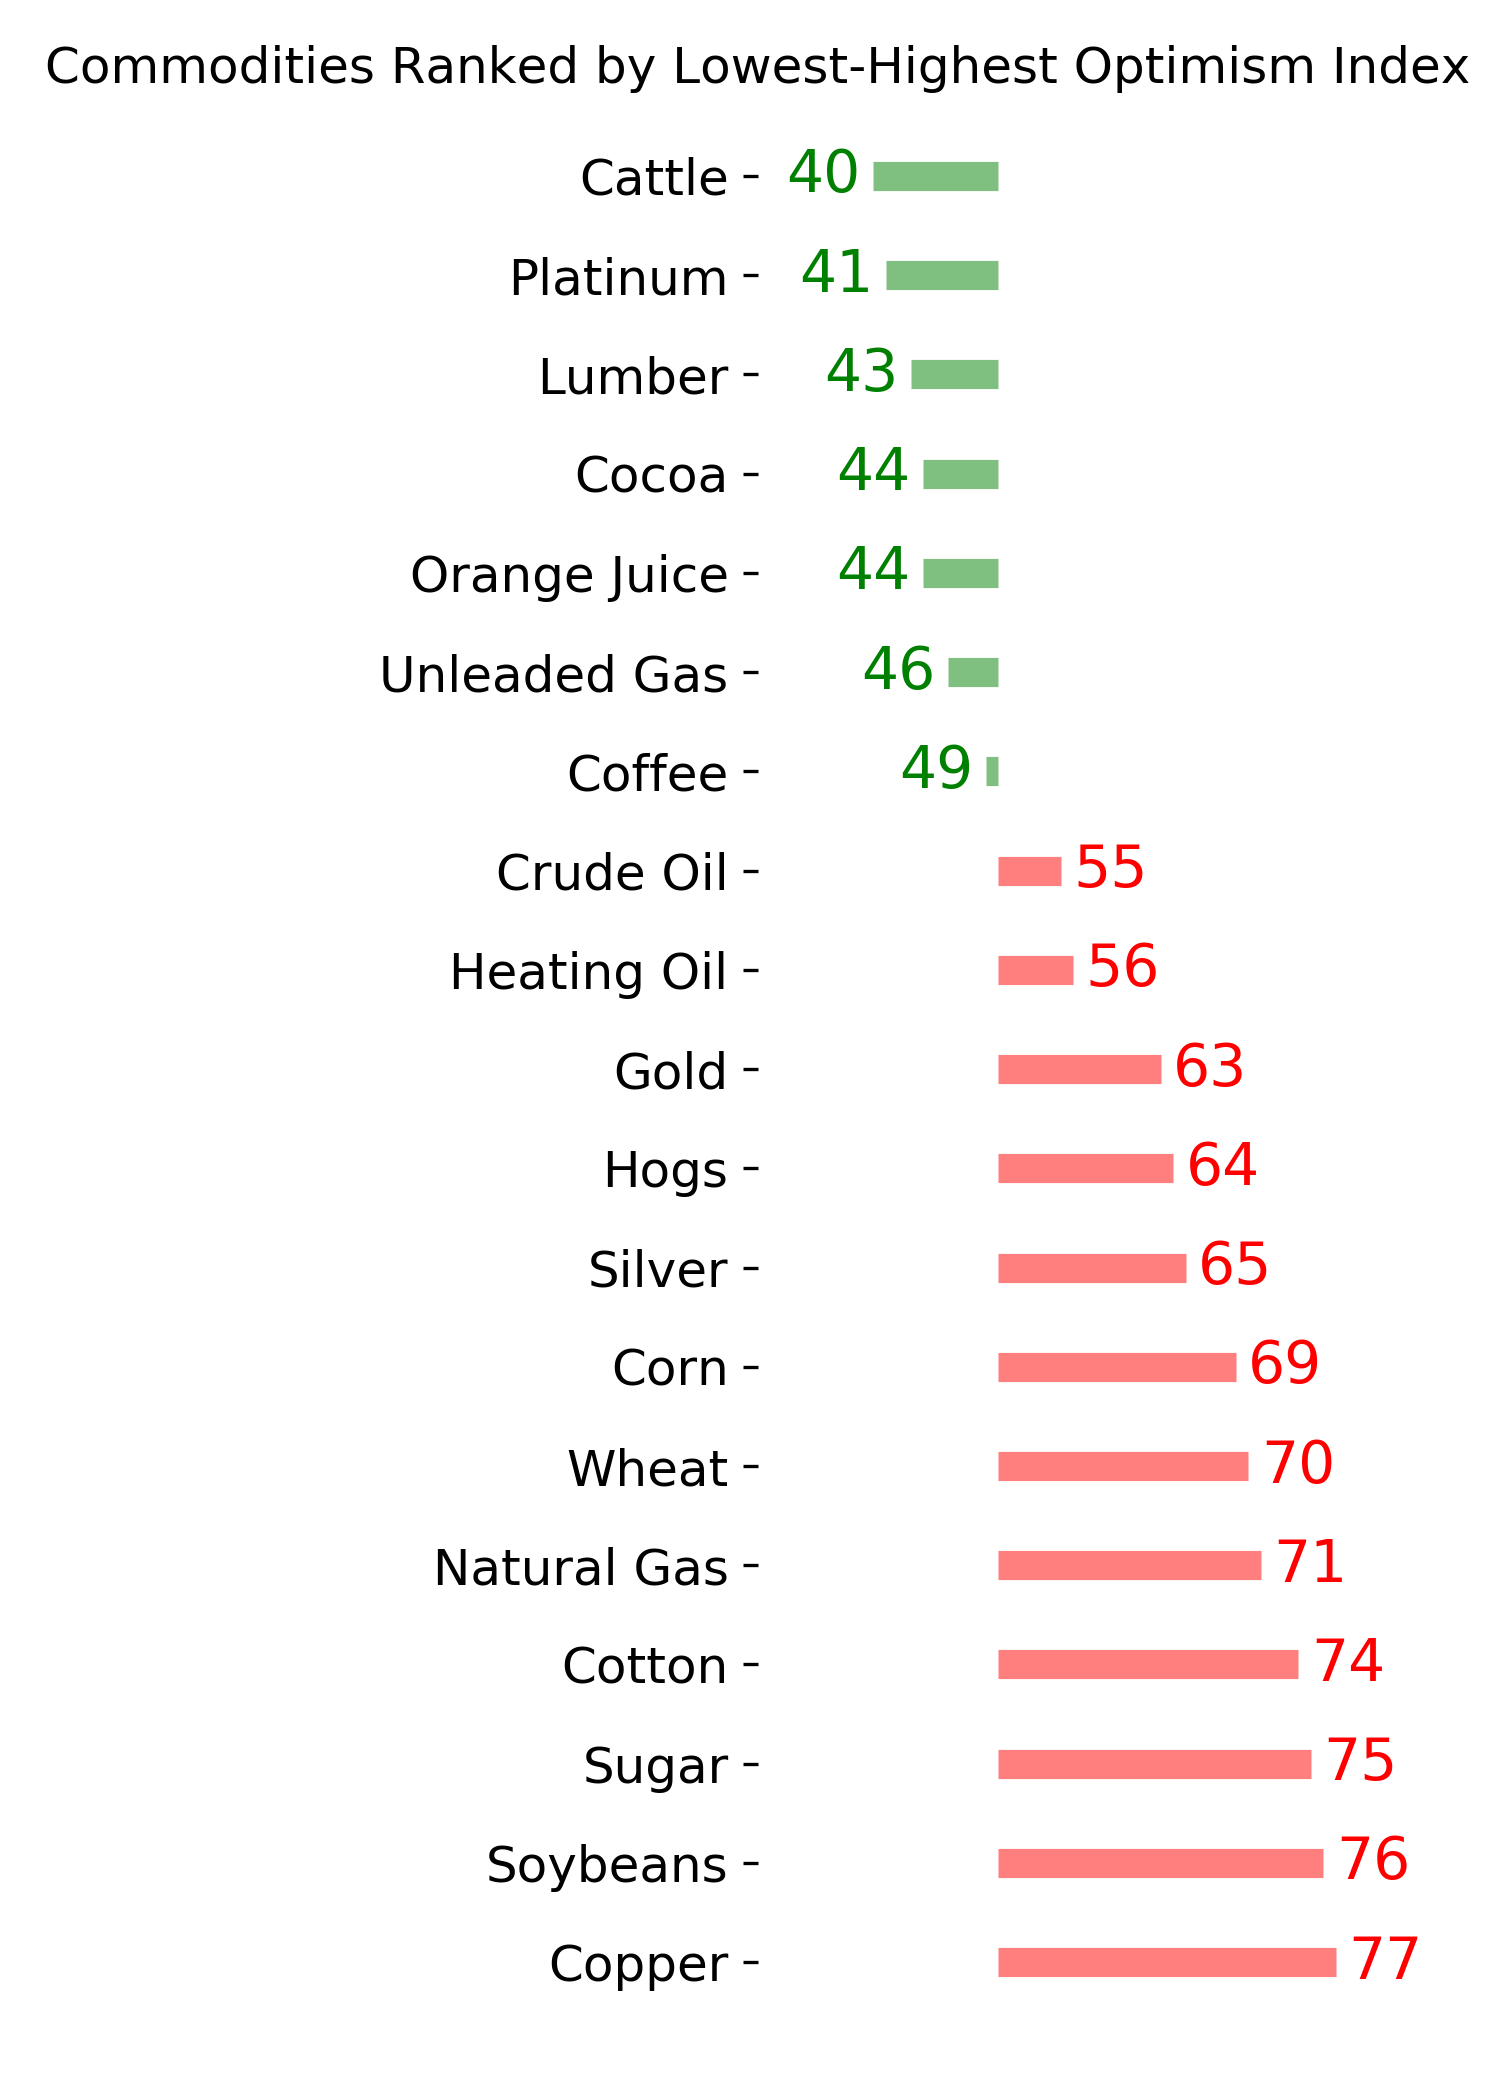
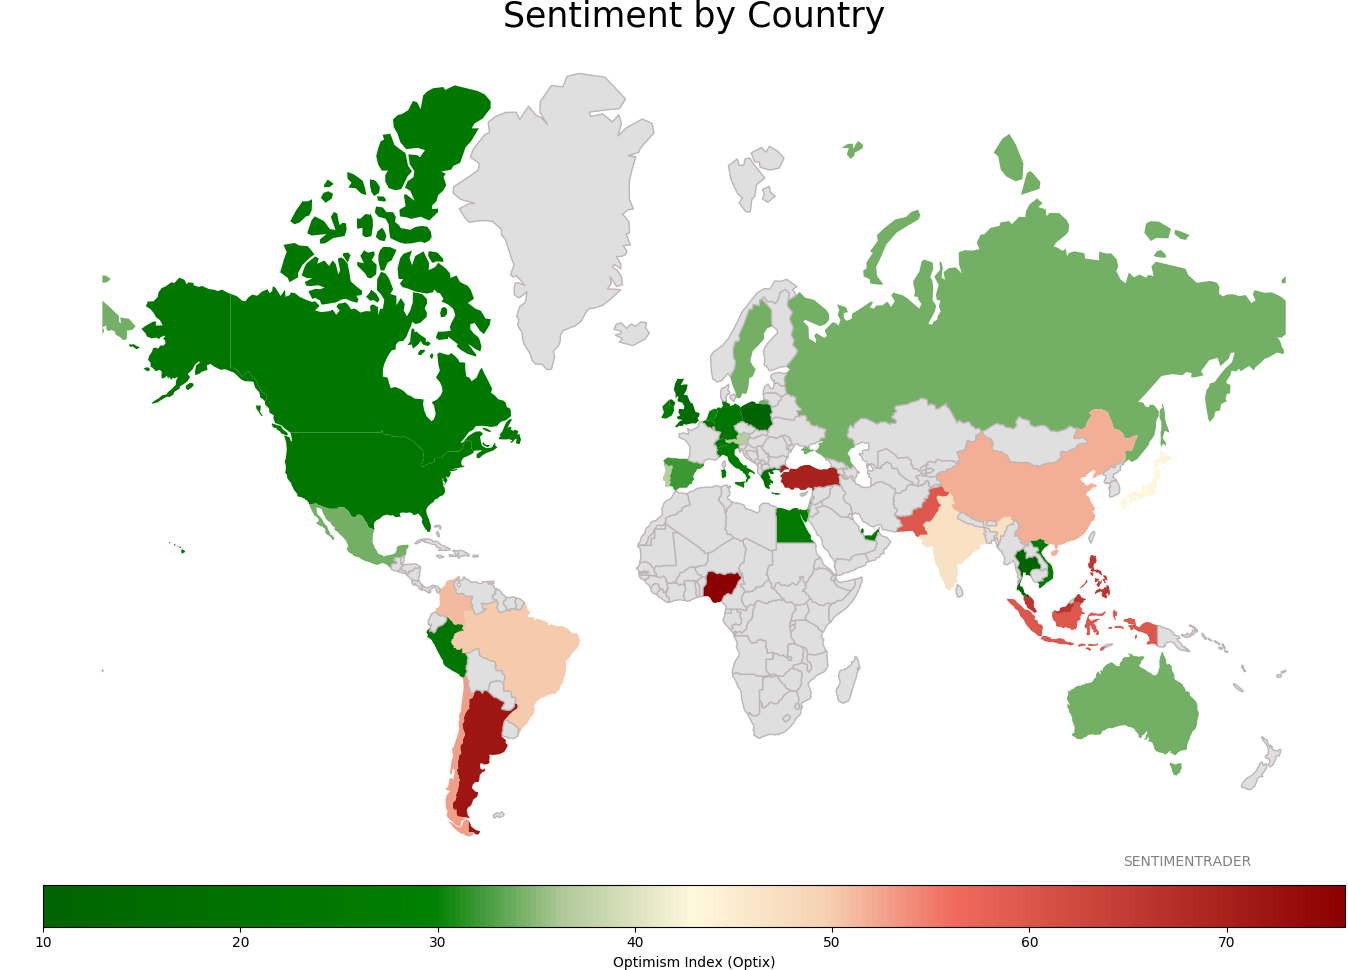
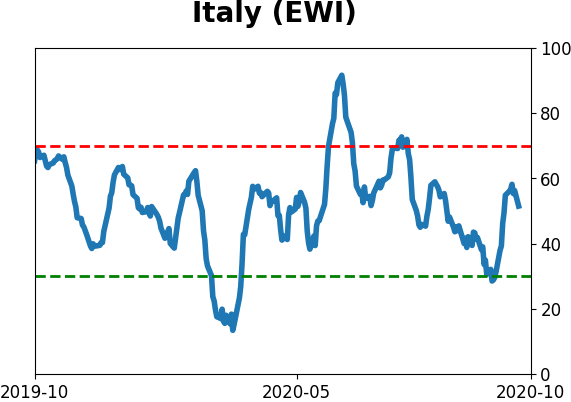
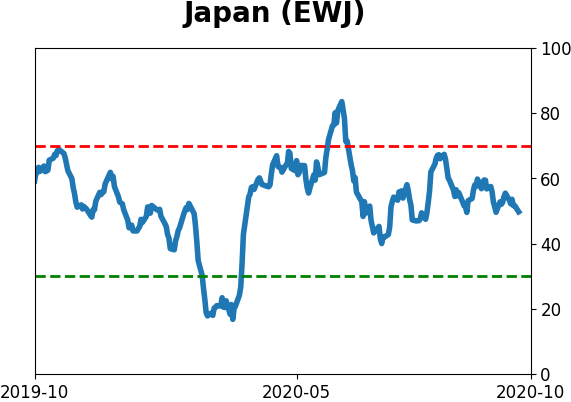
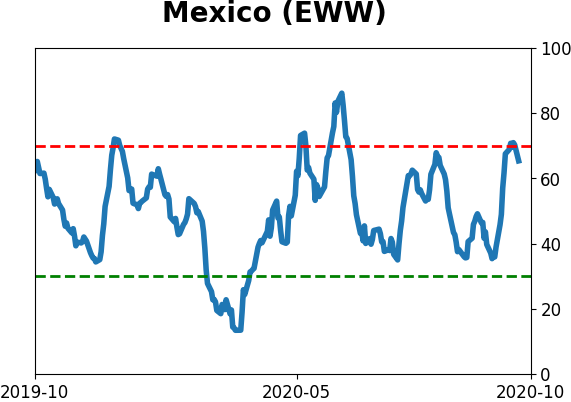
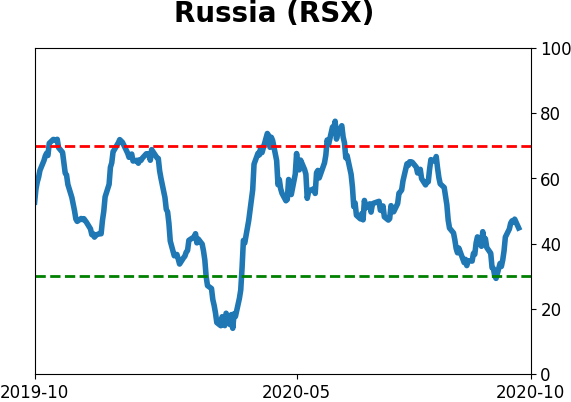
Sentiment Around The World
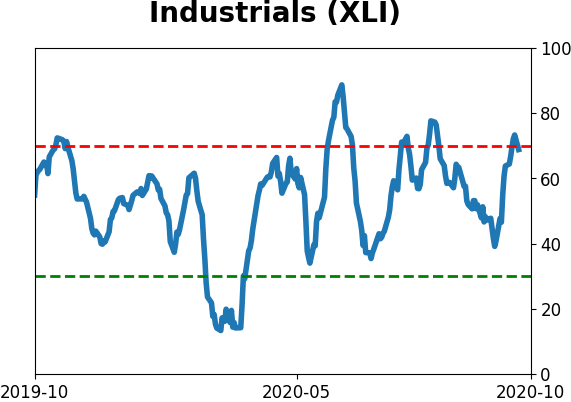
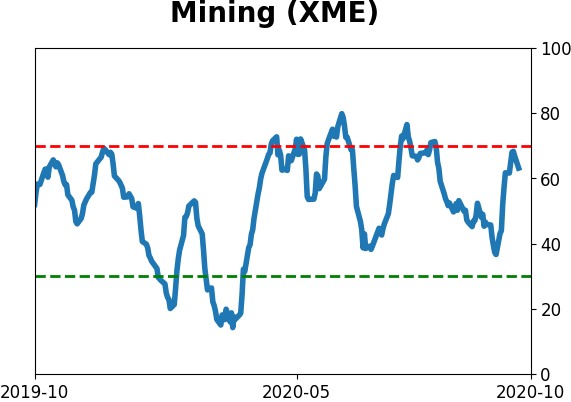
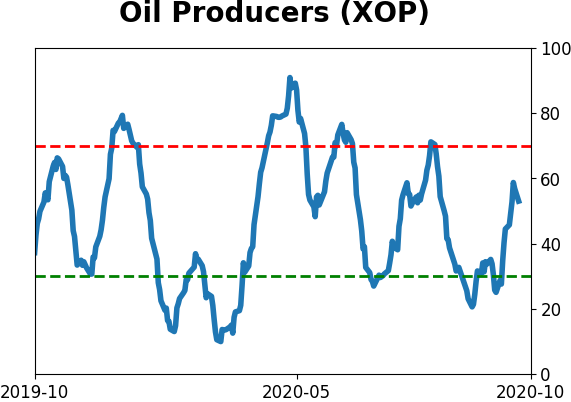
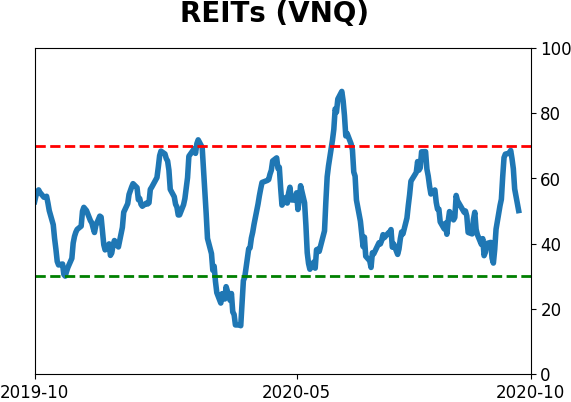
Optimism Index Thumbnails
|
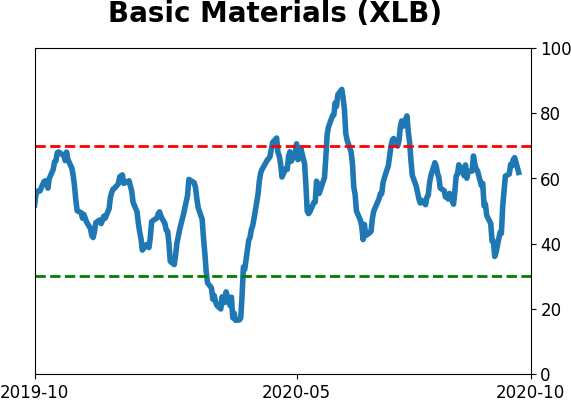
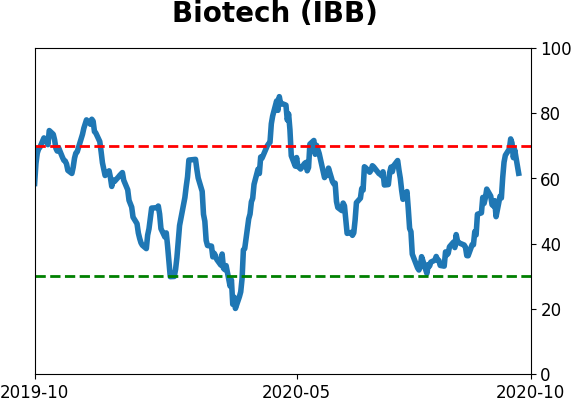
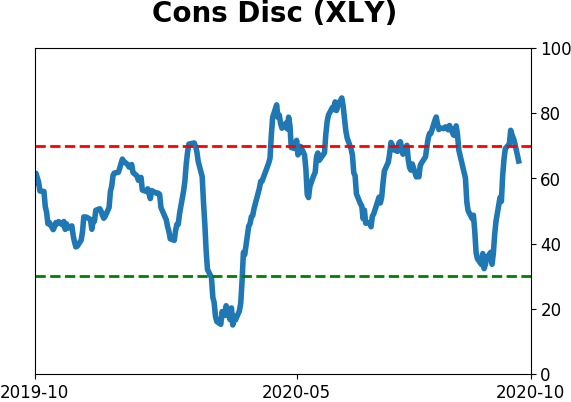
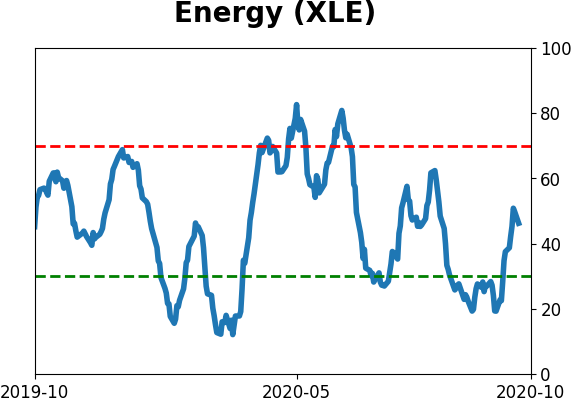
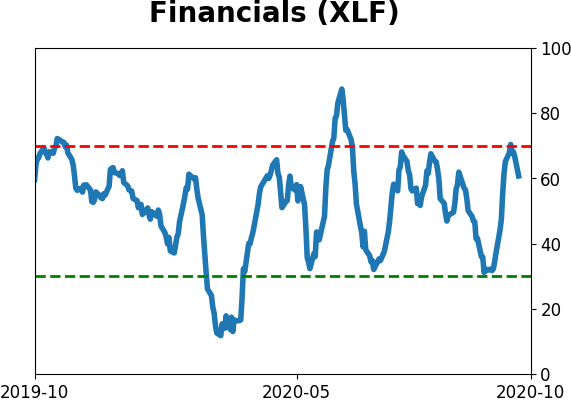
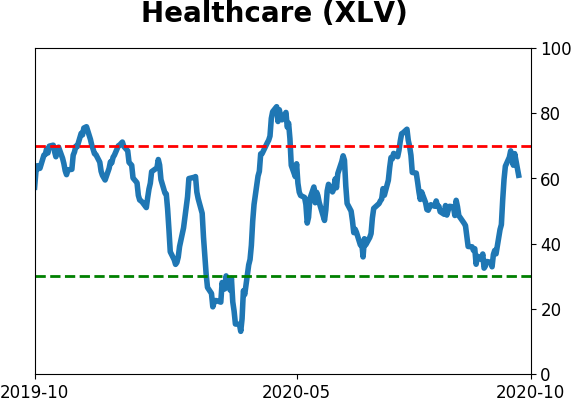
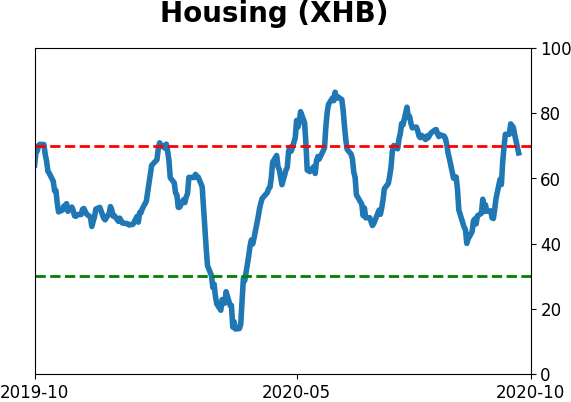
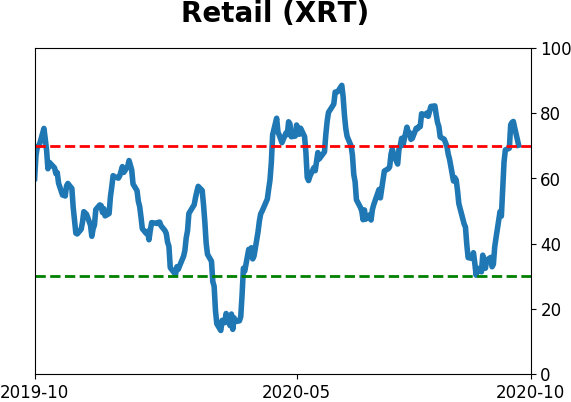
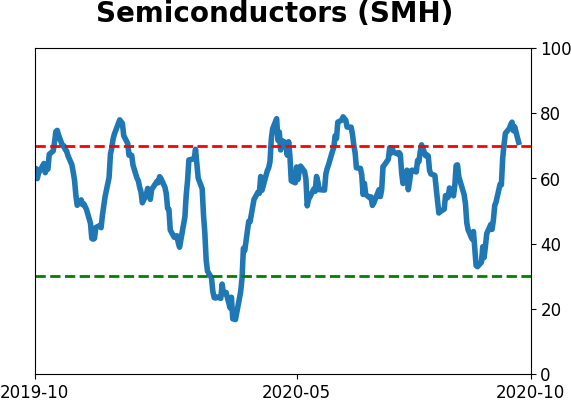
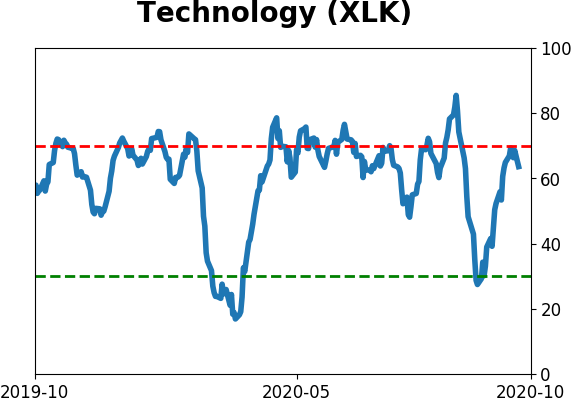
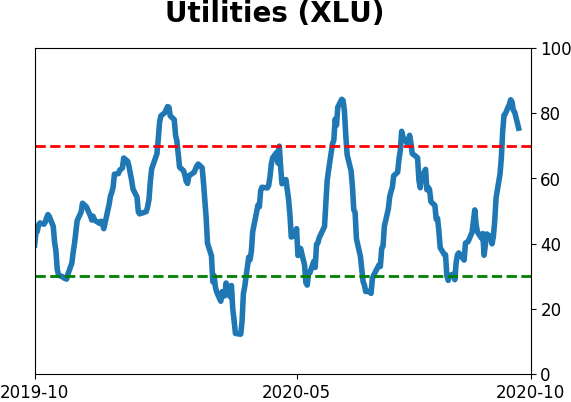
Sector ETF's - 10-Day Moving Average
|
|
|
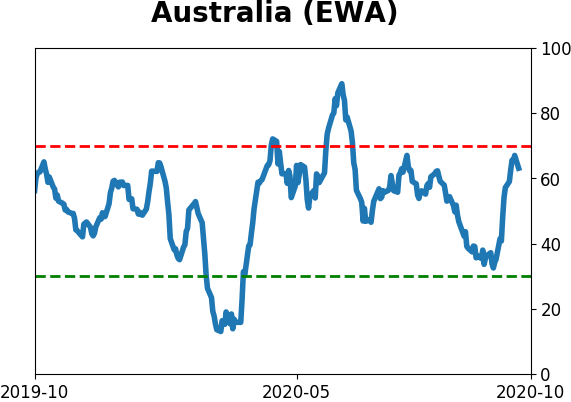
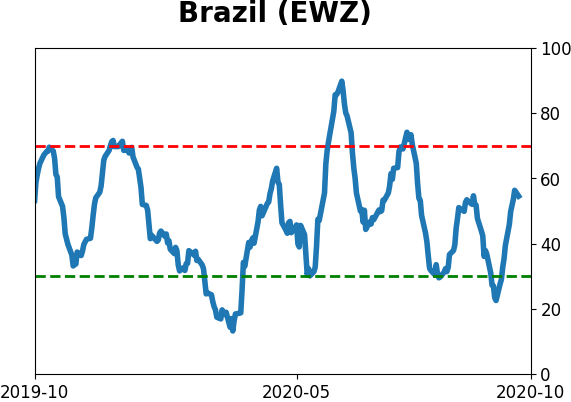
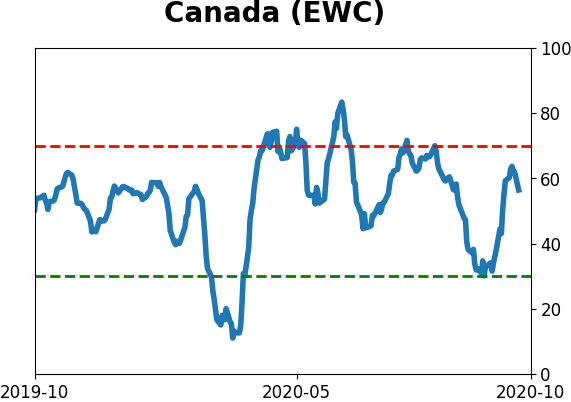
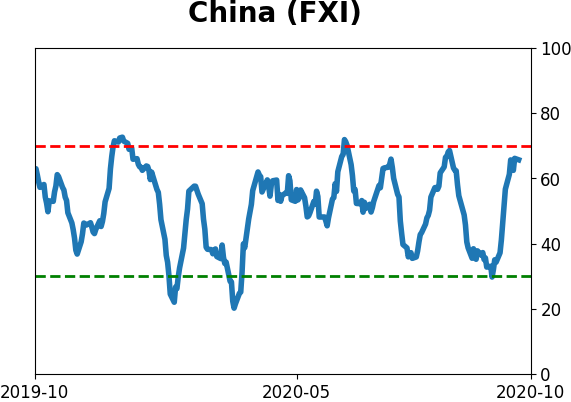
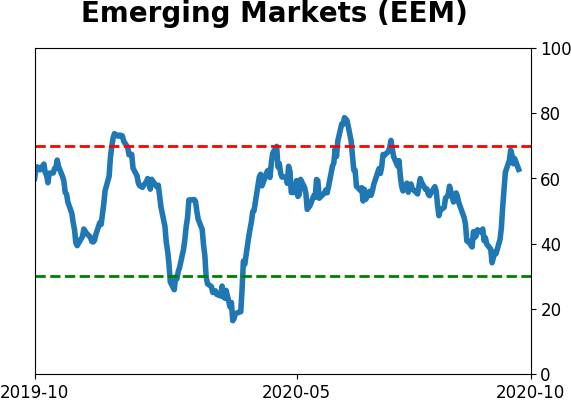
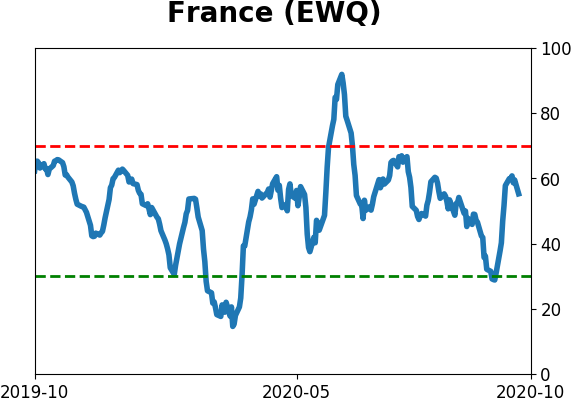
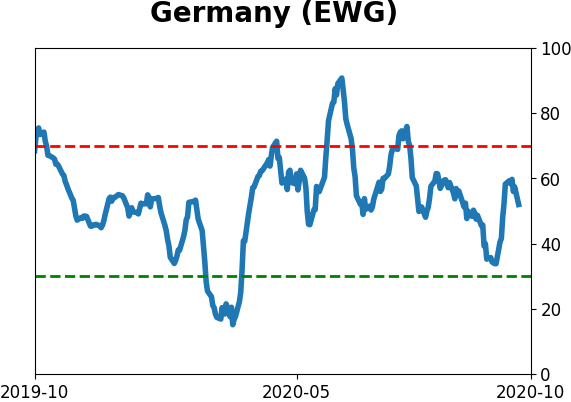
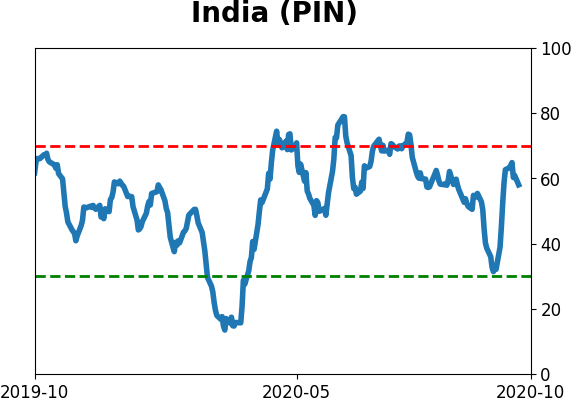
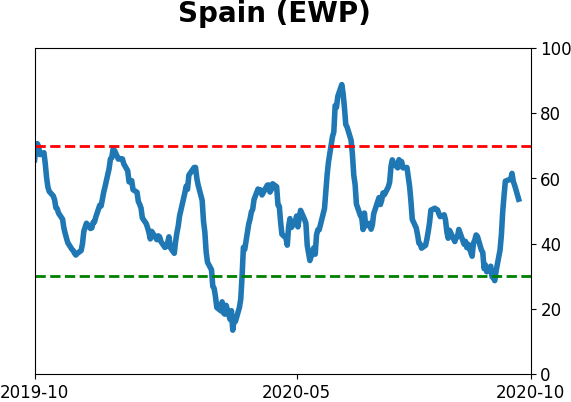
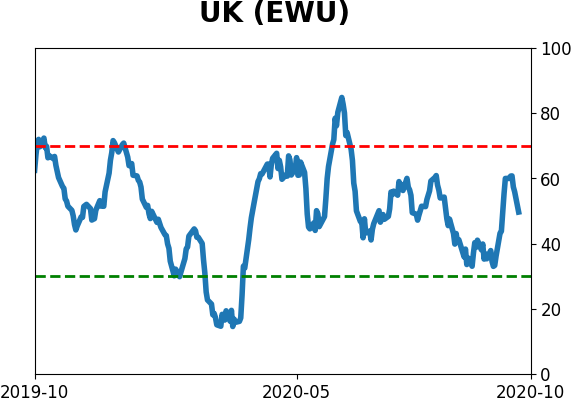
Country ETF's - 10-Day Moving Average
|
|
|
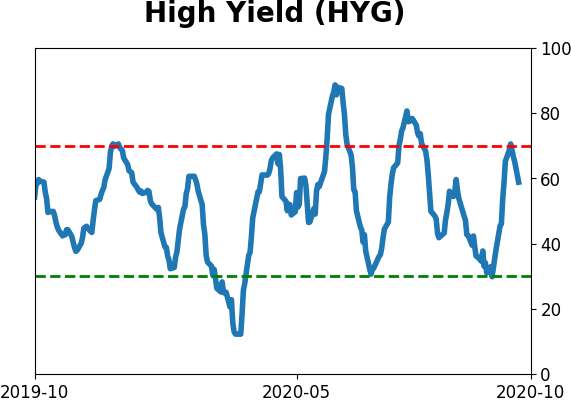
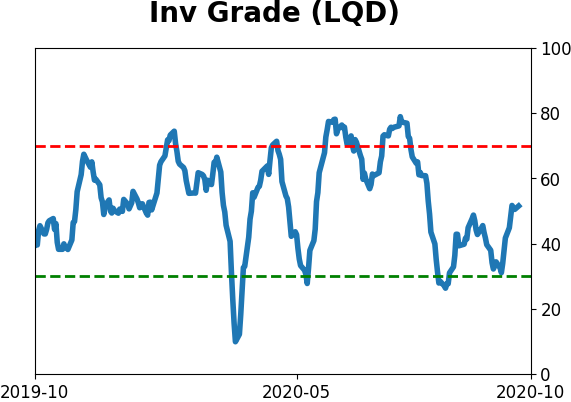
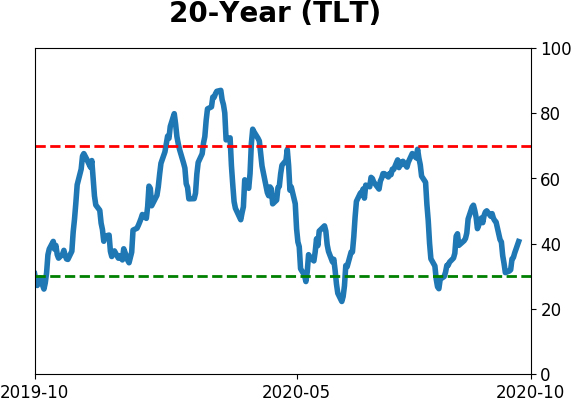
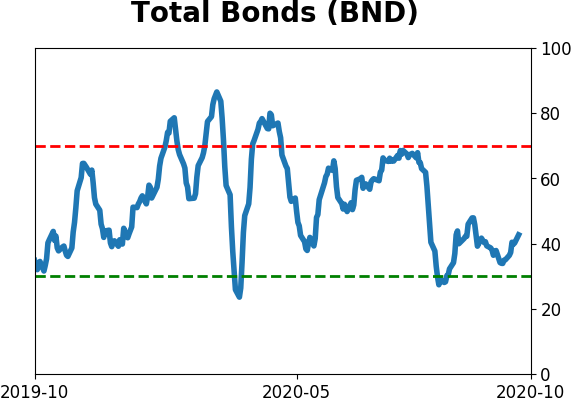
Bond ETF's - 10-Day Moving Average
|
|
|
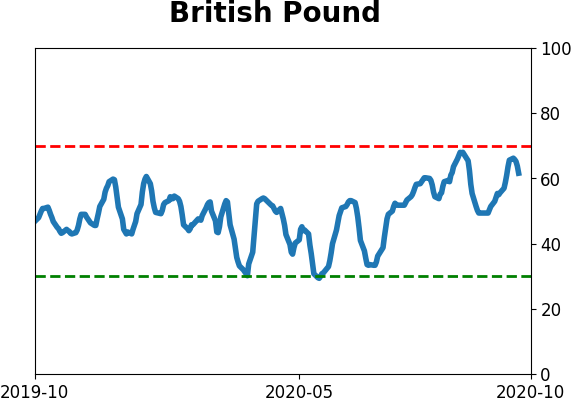
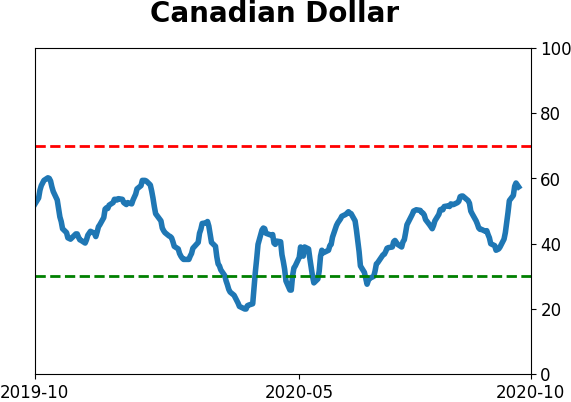
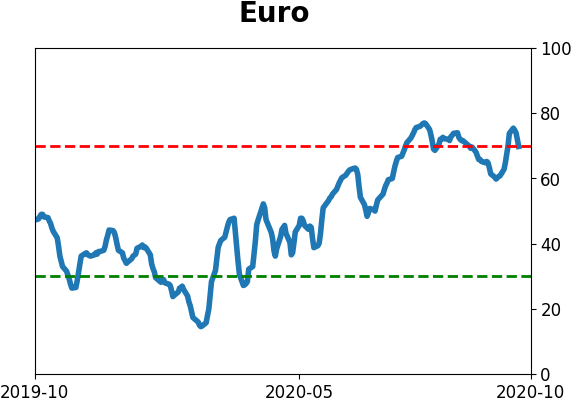
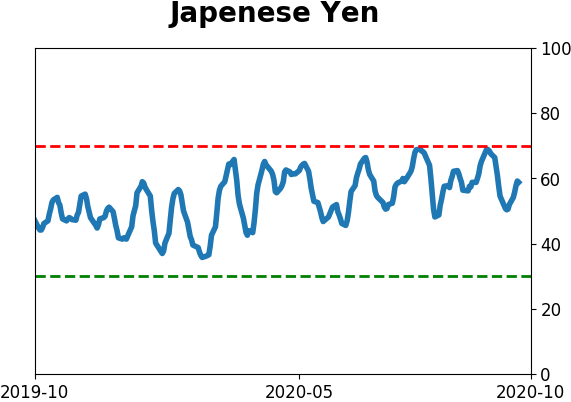
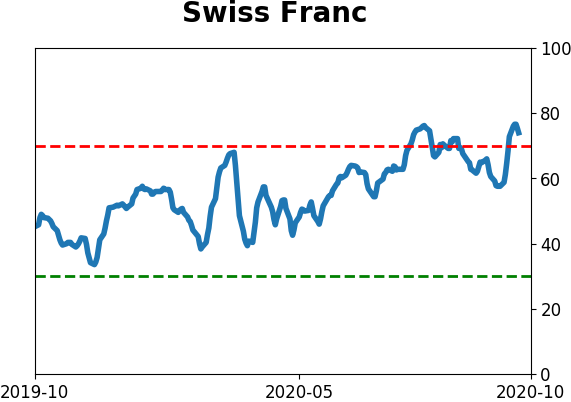
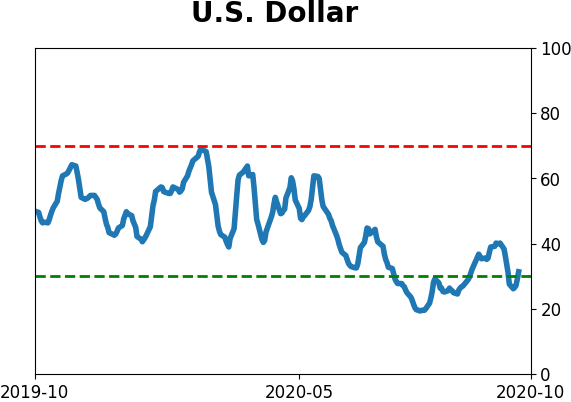
Currency ETF's - 5-Day Moving Average
|
|
|
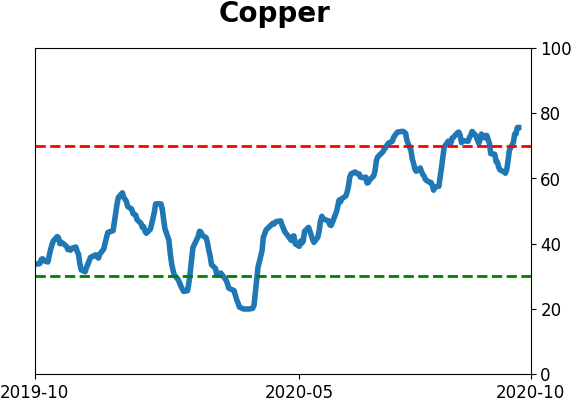
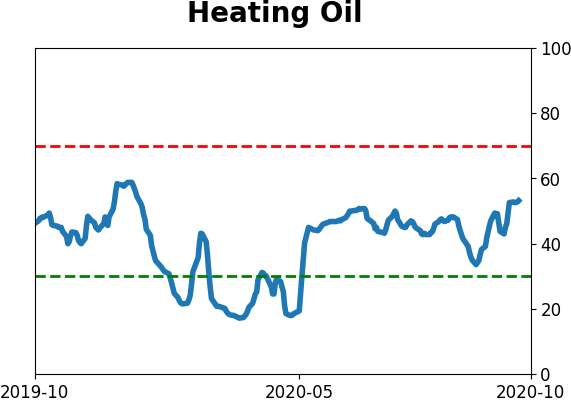
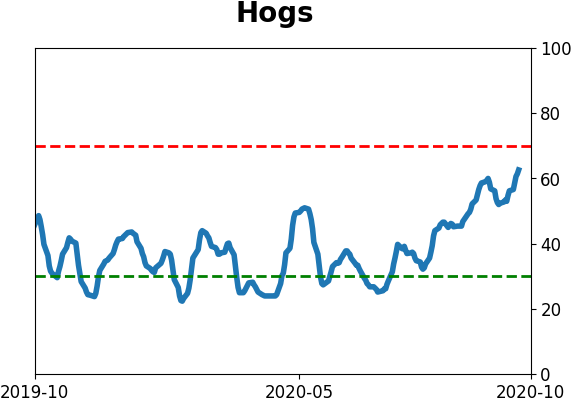
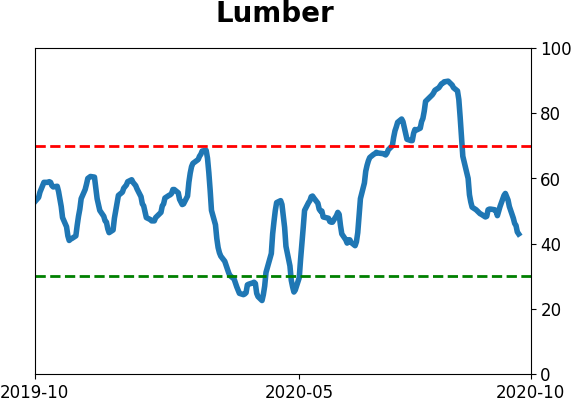
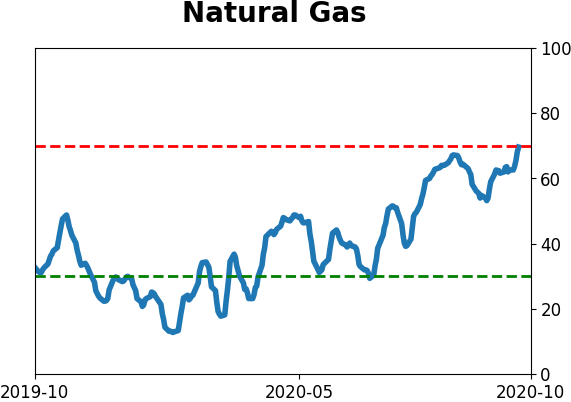
Commodity ETF's - 5-Day Moving Average
|
|