Headlines
|
|
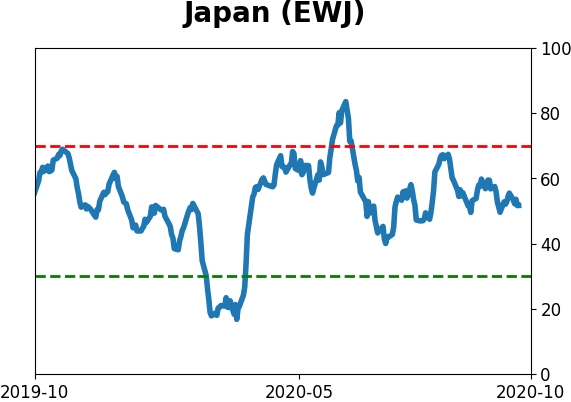
Leveraged Japanese traders finally see smaller losses:
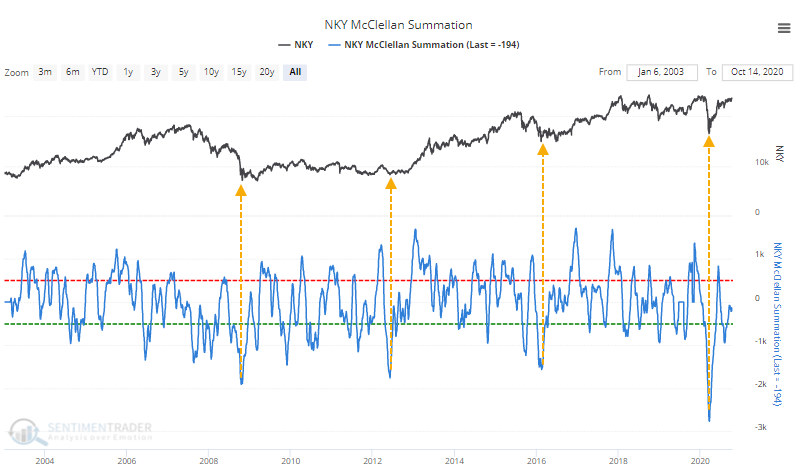
Traders who use margin on Japanese stock exchanges have suffered large losses, for a long time. That has finally started to change. The only two other times it started to get better after a prolonged period of losses, Japanese shares embarked on multi-year rallies. This comes on the heels of a record low in the Summation Index on the Nikkei 225.
The latest Commitments of Traders report was released, covering positions through Tuesday: The 3-Year Min/Max Screen shows that "smart money" commercial hedgers continue to sell commodities in general and agriculture in particular. Most other contracts showed modest reversals of previous extremes, such as long exposure to the dollar, and shorts against gold. They also became less short 10-year T-notes and less long 30-year T-bonds, an odd mix that has only happened twice before. The most notable change was in stocks, where they went from being net long $46 billion worth of major equity index futures 3 weeks ago to $36 billion net short this week. Hedgers take the opposite side of large and small speculators, so this suggests that speculators rushed into stocks. That $82 billion swing is twice as large as any other 3-week stretch in history and it lessens what had been a bullish support for stocks since March.
Bottom Line:
- A positive environment favors becoming aggressive on signs of excessive pessimism.
|
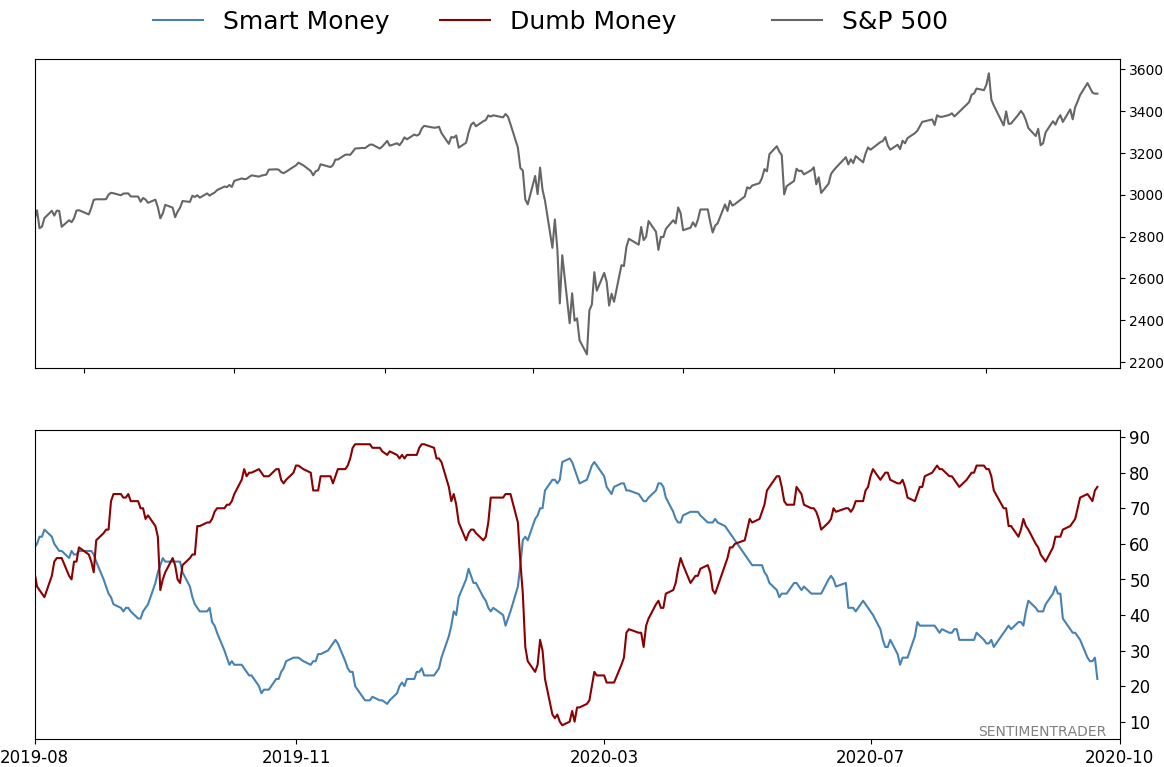
Smart / Dumb Money Confidence
|
Smart Money Confidence: 22%
Dumb Money Confidence: 76%
|
|
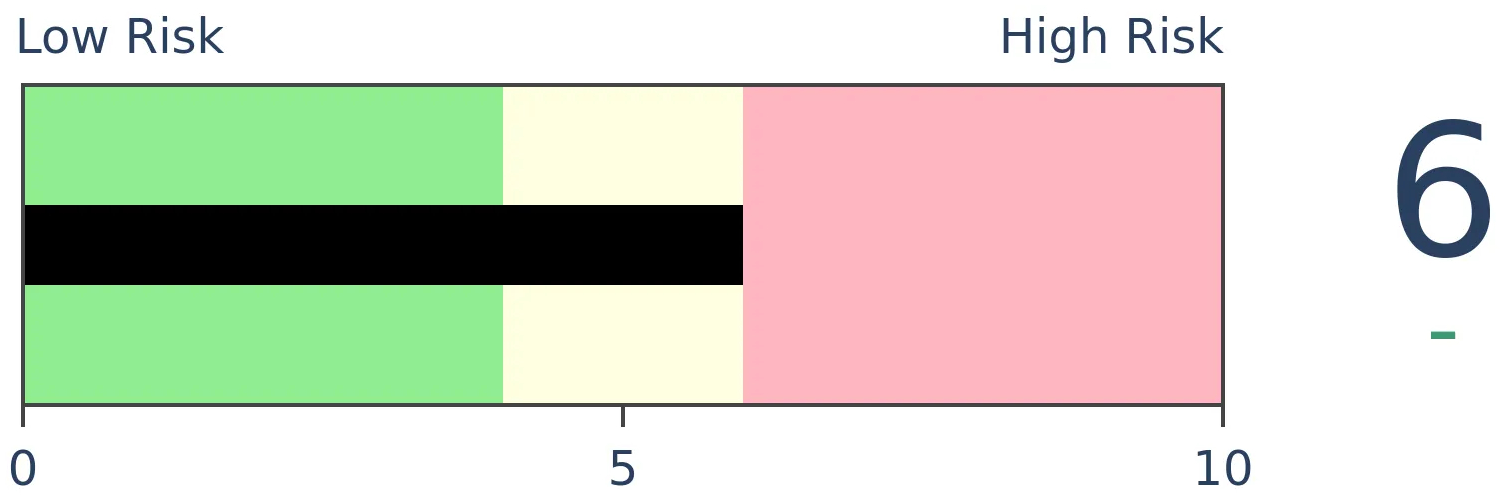
Risk Levels
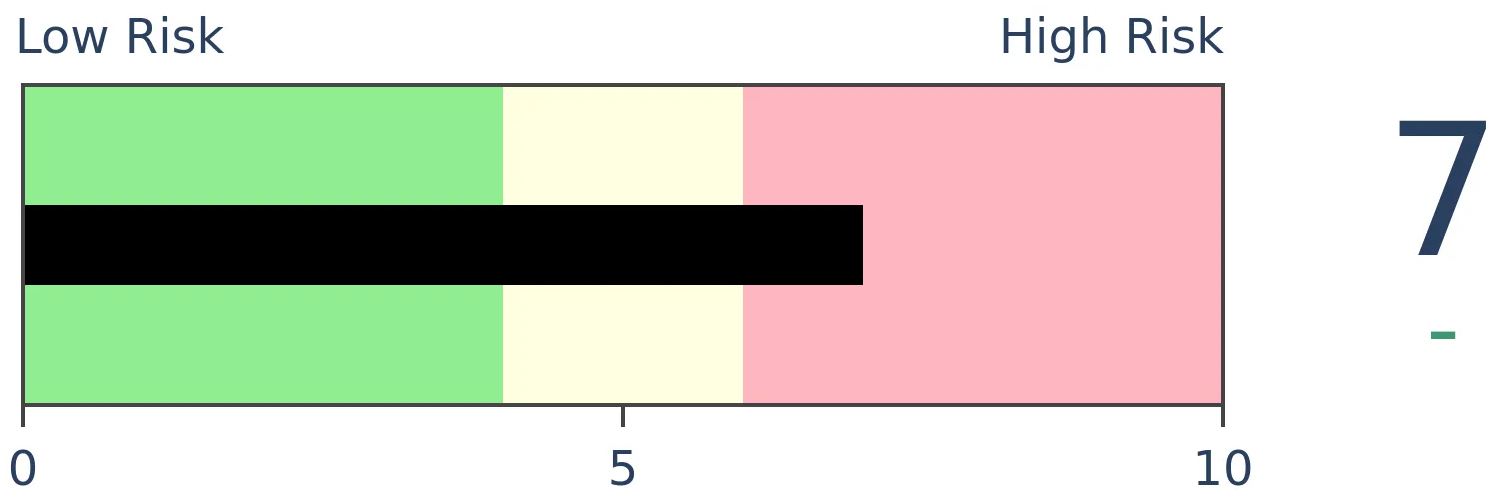
Stocks Short-Term
|
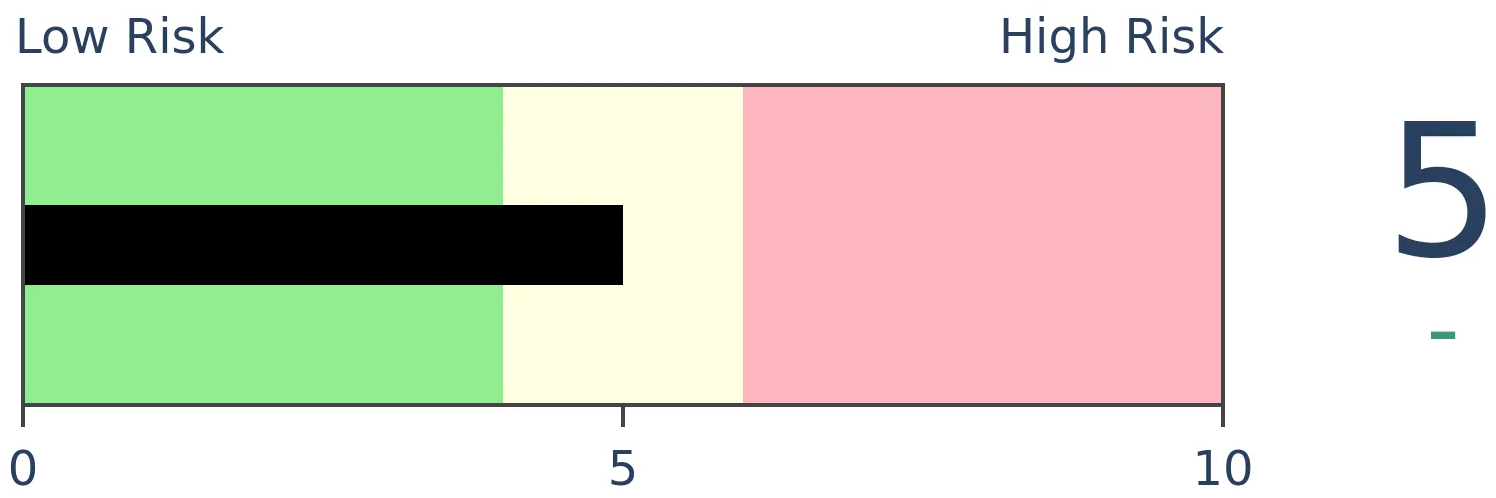
Stocks Medium-Term
|
|
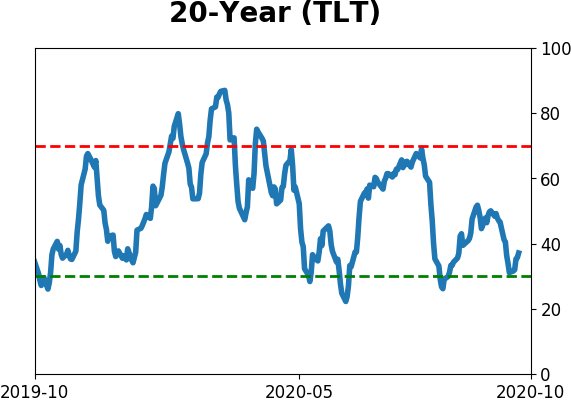
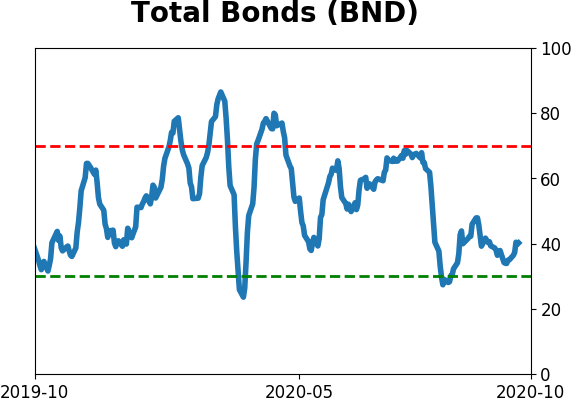
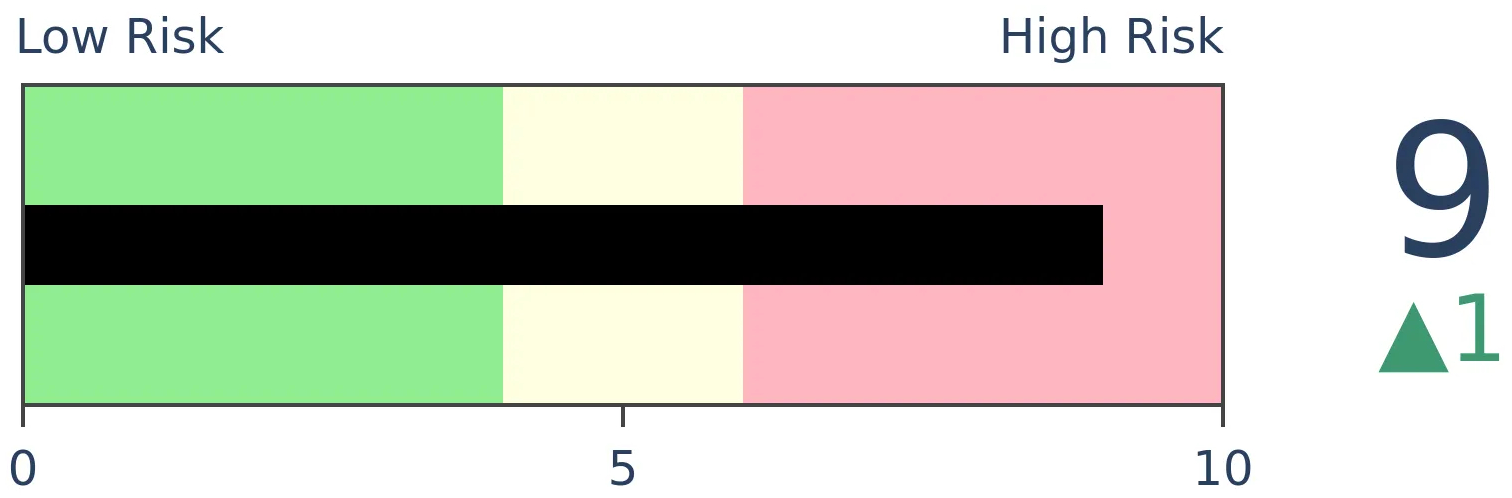
Bonds
|
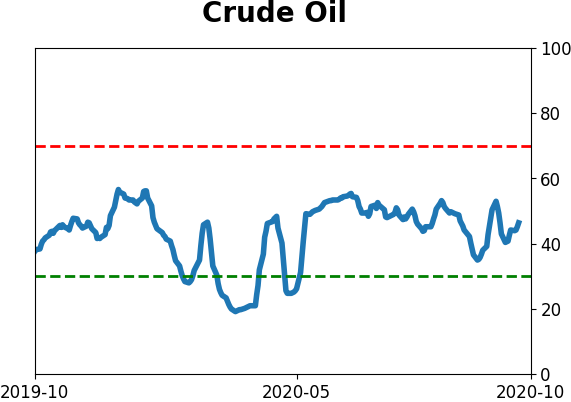
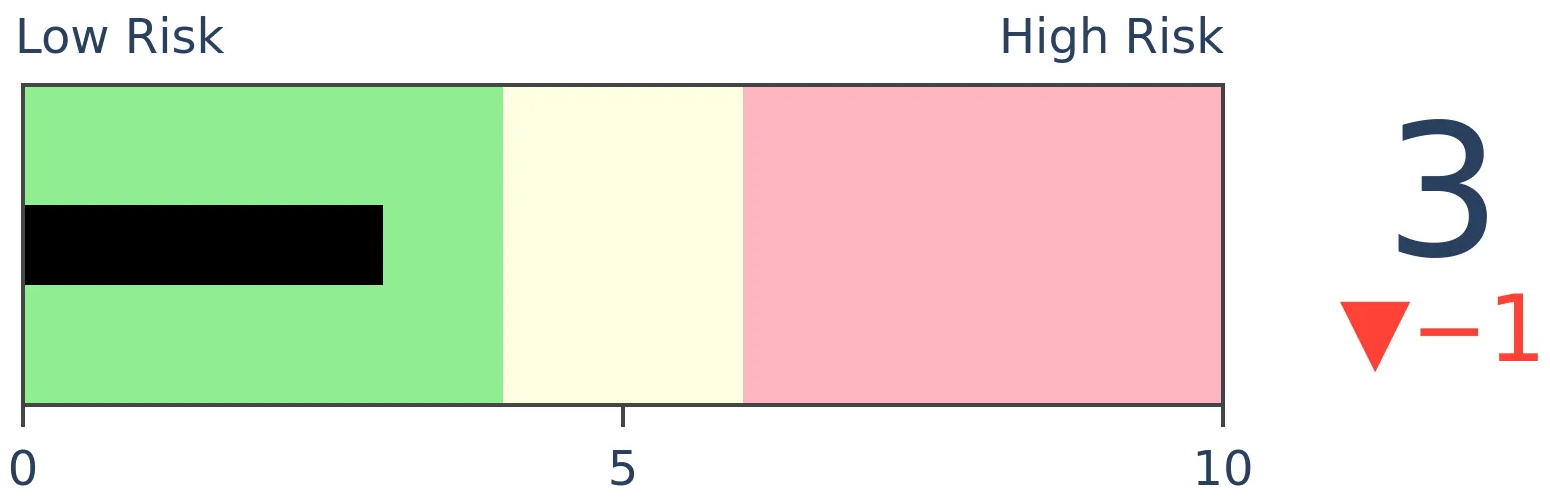
Crude Oil
|
|
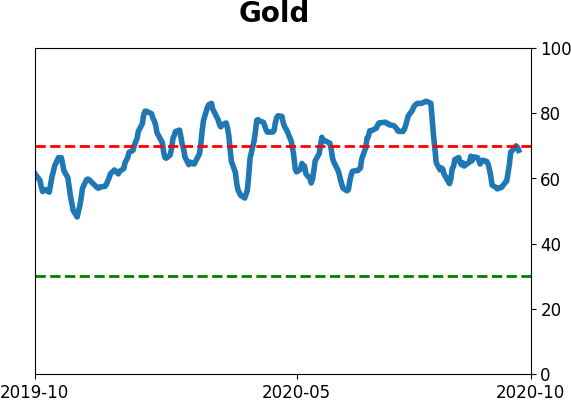
Gold
|
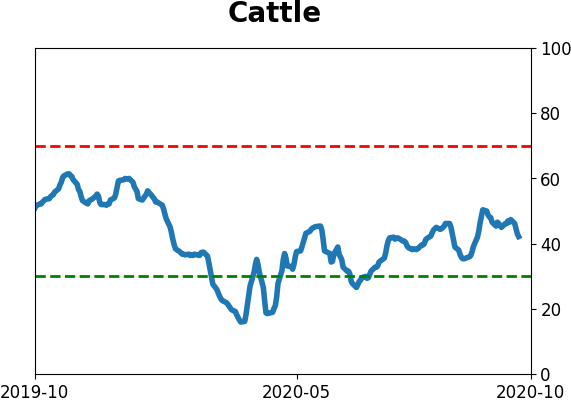
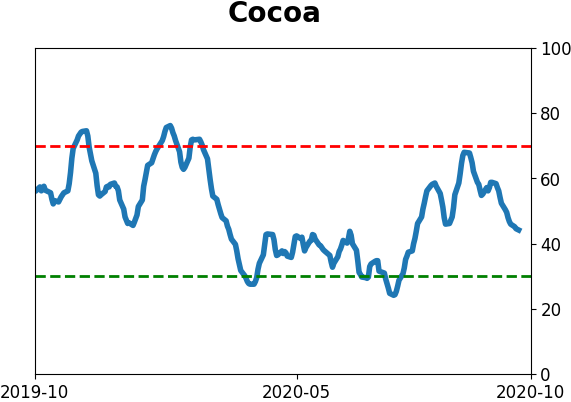
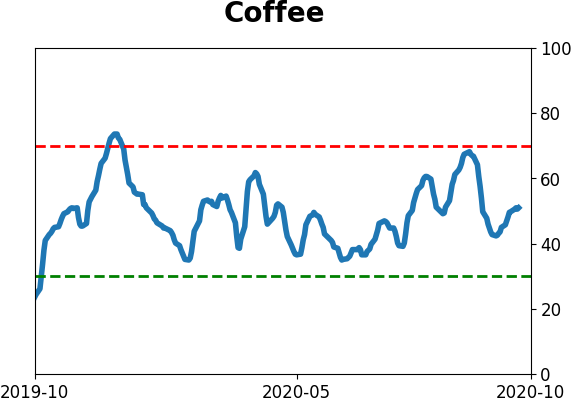
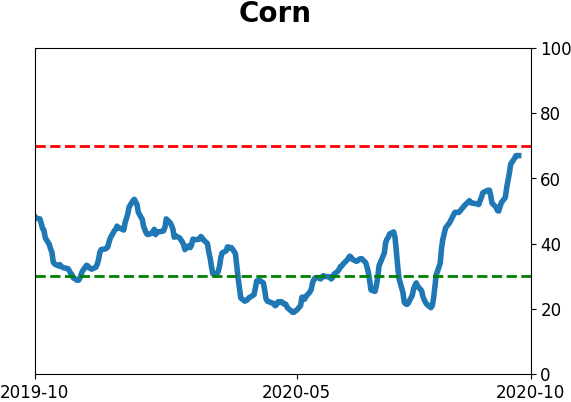
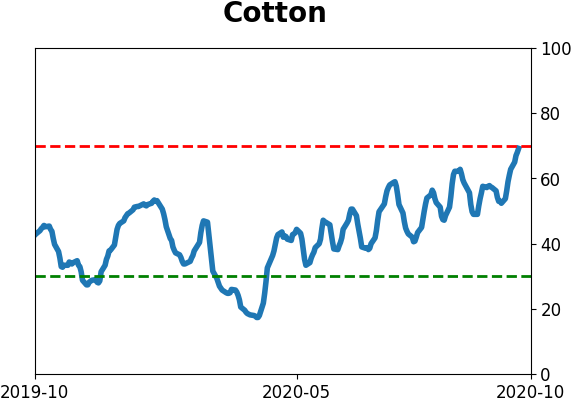
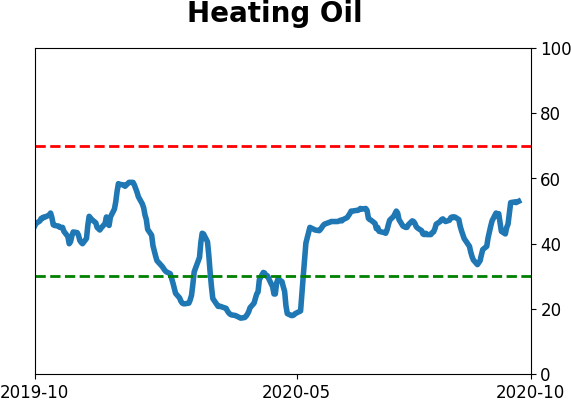
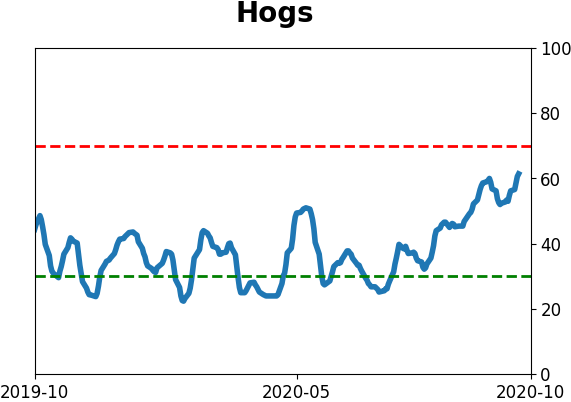
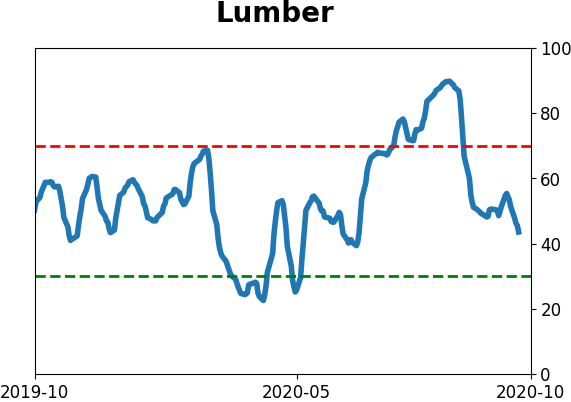
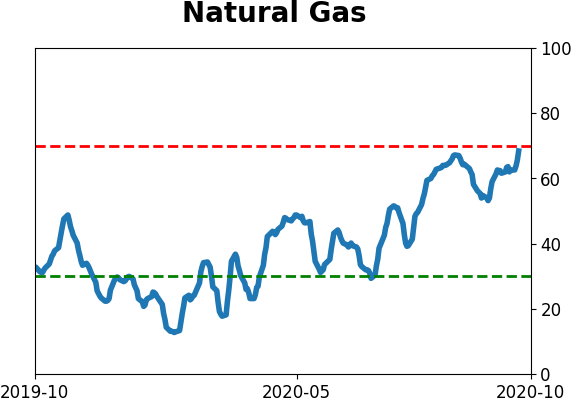
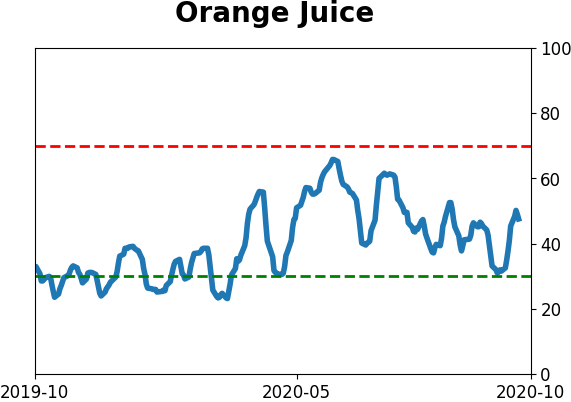
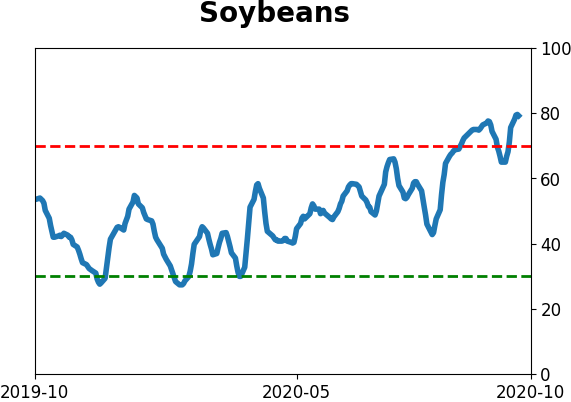
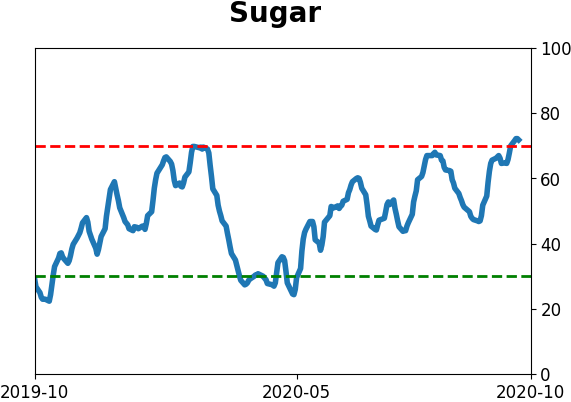
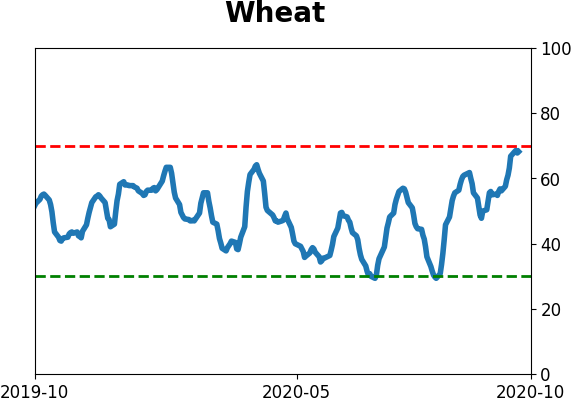
Agriculture
|
|
Research
BOTTOM LINE
Traders who use margin on Japanese stock exchanges have suffered large losses, for a long time. That has finally started to change. The only two other times it started to get better after a prolonged period of losses, Japanese shares embarked on multi-year rallies. This comes on the heels of a record low in the Summation Index on the Nikkei 225.
FORECAST / TIMEFRAME
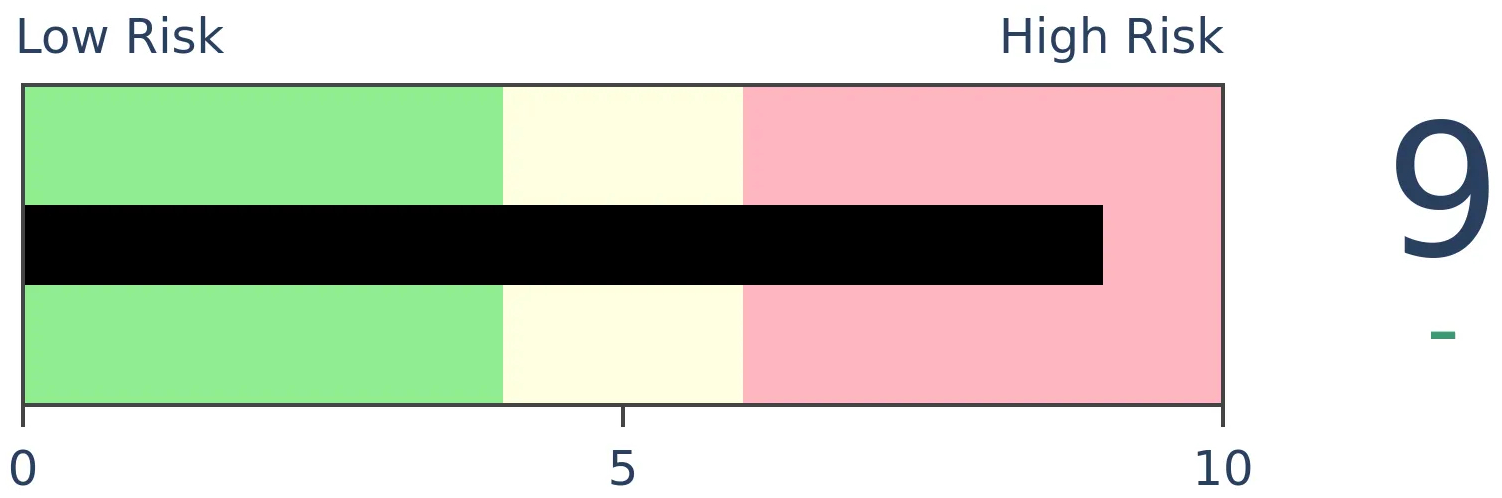
EWJE -- Up, Long-Term
|
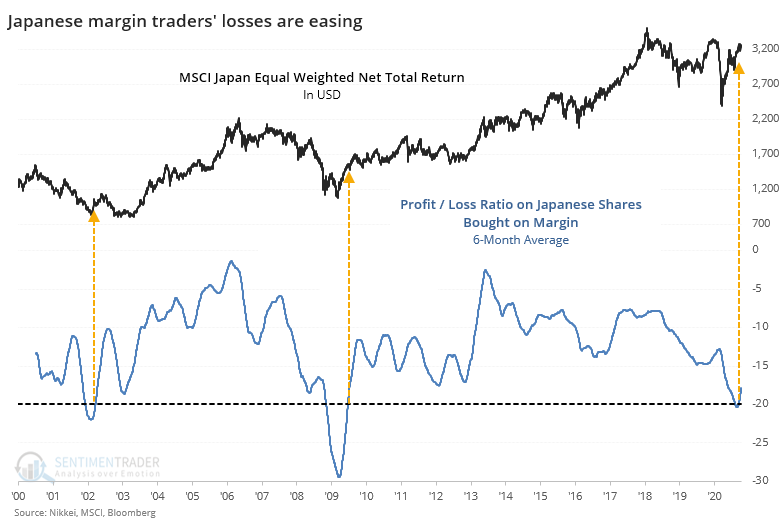
Margin traders in Japan are finally starting to profit. Or at least, lose less.
According to calculations from Bloomberg, the profit / loss ratio on shares bought on margin on the Tokyo and Nagoya exchanges has started to become less negative for the first time in a very, very long time.
Per Bloomberg:
"Margin Transaction Outstanding includes not only stock certificates but also preferred securities, beneficiary certificates of stock investment trust or investment securities issued by investing corporations. This ticker is Profit or Loss ratio on the average bid price by shares bought on margin."
The ratio as calculated by Bloomberg has been below -10 for about 1.5 years, by far the longest stretch in the past 20 years.
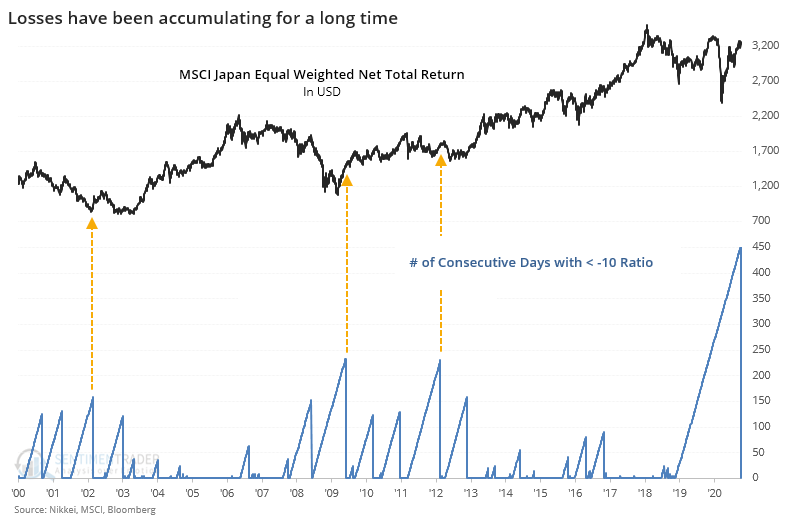
It's not only been low for a long time, but it has also been very low, so the 6-month average dropped below -20 and only recently started to curl higher.
According to a paper published by the Pacific-Basin Finance Journal in 2009, this could be an important inflection point because retail traders have an outsized influence in this market.
"A growing body of literature suggests that investor sentiment affects stock prices both at the firm level and at the market level. This study
examines the relationship between investor behavior and stock returns focusing on Japanese margin transactions using weekly data
from 1994 to 2003. Margin trading is dominated by individual investors in Japan. In analysis at the firm level, we find a significant
cross-sectional relationship between margin buying and stock returns. Both market-level and firm-level analyses show that margin
buying traders follow herding behavior. They seem to follow positive feedback trading behavior for small-firm stocks and negative feedback
trading behavior for large firm stocks. Our results show that information about margin buying helps predict future stock returns, especially for small-firm stocks at short horizons. The predictive power does not diminish even after controlling for firm size and liquidity."
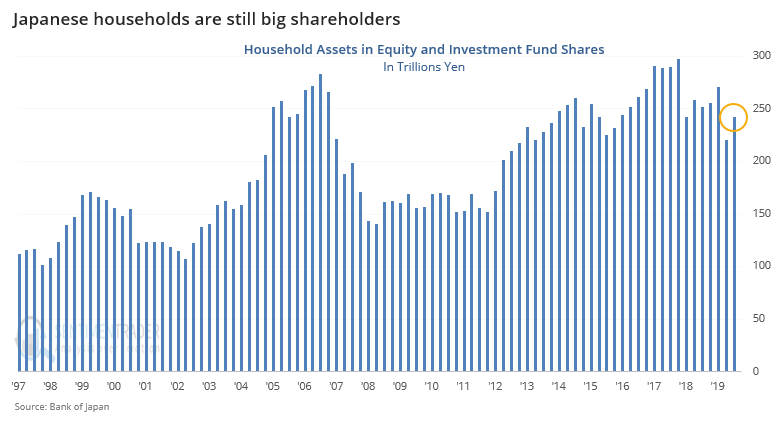
Perhaps that's now outdated because the Bank of Japan owns a large portion of the market, which became even more exaggerated after the pandemic hit. Their buying of ETFs and individual shares has been extremely aggressive, and the central bank is the top shareholder of many leading companies.
However, households still have substantial holdings of equities.
As these investors regain confidence, with apparently easing losses on margin purchases, we should see the shares rise. The only other times these investors had been burned this badly, for this long, Japanese shares embarked on multi-year rallies. Perhaps it won't be as effective as the BoJ crowds out mom-and-pop, but the latter still exerts an influence.
If we switch to the Nikkei 225, the list of stocks hitting fresh 52-week highs has been moribund for 6 months. It's been 166 days since more than 5% of stocks in that index managed to hit a new high.
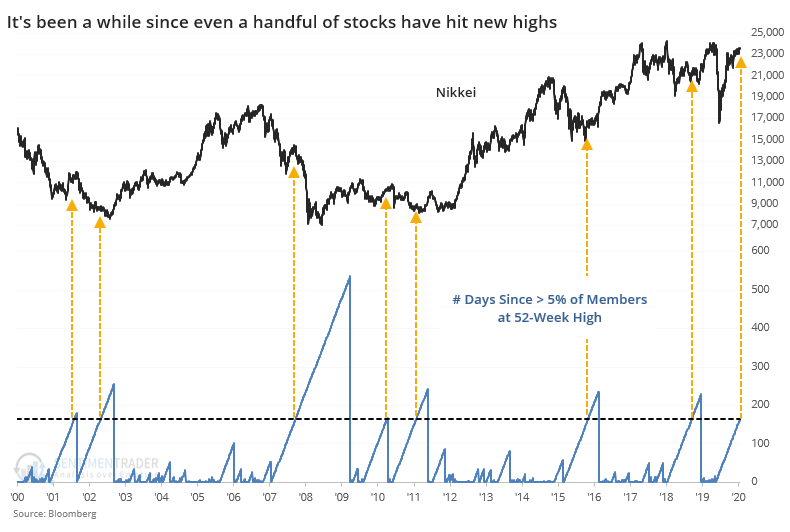
It's going to take some doing to push many of them above their prior highs because the drop in March was so devastating. Breadth was bad enough to plunge the McClellan Summation Index for that index to a record low. Other times it dropped to an extreme, the Nikkei didn't exceed its lows for years.
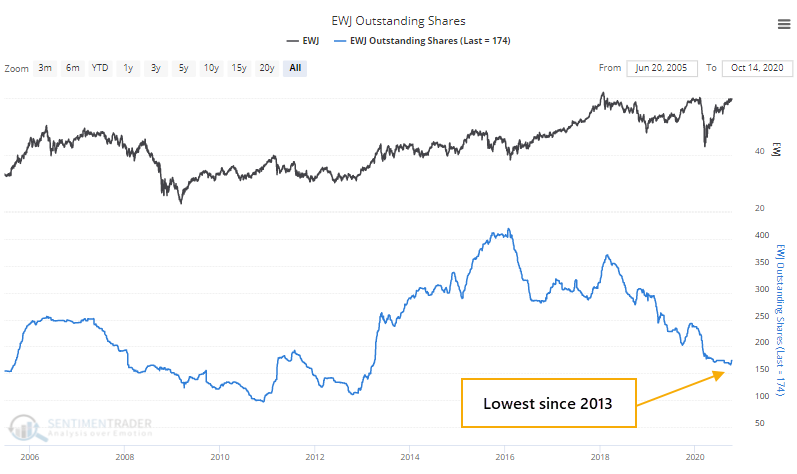
As a rough gauge of interest among traders, the shares outstanding in EWJ shows that there isn't any (interest). It's dropped to the lowest in 7 years, fairly remarkable given that EWJ is the largest Japan-focused fund with more than double the assets of its closest competitor.
None of this shows any edge in the short-term or even the medium-term. It's all a reflection of a market that's been beaten up and ignored, only recently showing signs of renewed interest. By the time it's gotten this bad before, the long-term risk/reward was positive.
Active Studies
| Time Frame | Bullish | Bearish | | Short-Term | 0 | 0 | | Medium-Term | 4 | 8 | | Long-Term | 48 | 2 |
|
Indicators at Extremes
Portfolio
| Position | Description | Weight % | Added / Reduced | Date | | Stocks | 15.6% RSP, 10.1% VWO, 7.5% XLE, 5.1% PSCE | 38.2 | Added 5% | 2020-10-15 | | Bonds | 10% BND, 10% SCHP, 10% ANGL | 29.7 | Reduced 0.1% | 2020-10-02 | | Commodities | GCC | 2.4 | Reduced 2.1%
| 2020-09-04 | | Precious Metals | GDX | 4.7 | Added 5% | 2020-09-09 | | Special Situations | | 0.0 | Reduced 5% | 2020-10-02 | | Cash | | 25.0 | | |
|
Updates (Changes made today are underlined)
After the September swoon wrung some of the worst of the speculation out of stocks, there are some signs that it's returning, especially in the options market. It's helped to push Dumb Money Confidence above 70%. A big difference between now and August is that in August, there was a multitude of days with exceptionally odd breadth readings. Some of the biggest stocks were masking underlying weakness. Combined with heavy speculative activity, it was a dangerous setup. Now, we've seen very strong internal strength, in the broad market, as well as tech and small-cap stocks. Prior signals almost invariably led to higher prices. That's hard to square with the idea that forward returns tend to be subdued when Confidence is high, but that's less reliable during healthy market conditions, which we're seeing now (for the most part). I added some risk with small-cap energy stocks, due to an increasing number of positive signs in both small-caps and energy. This is intended as a long-term position.
RETURN YTD: -0.5% 2019: 12.6%, 2018: 0.6%, 2017: 3.8%, 2016: 17.1%, 2015: 9.2%, 2014: 14.5%, 2013: 2.2%, 2012: 10.8%, 2011: 16.5%, 2010: 15.3%, 2009: 23.9%, 2008: 16.2%, 2007: 7.8%
|
|
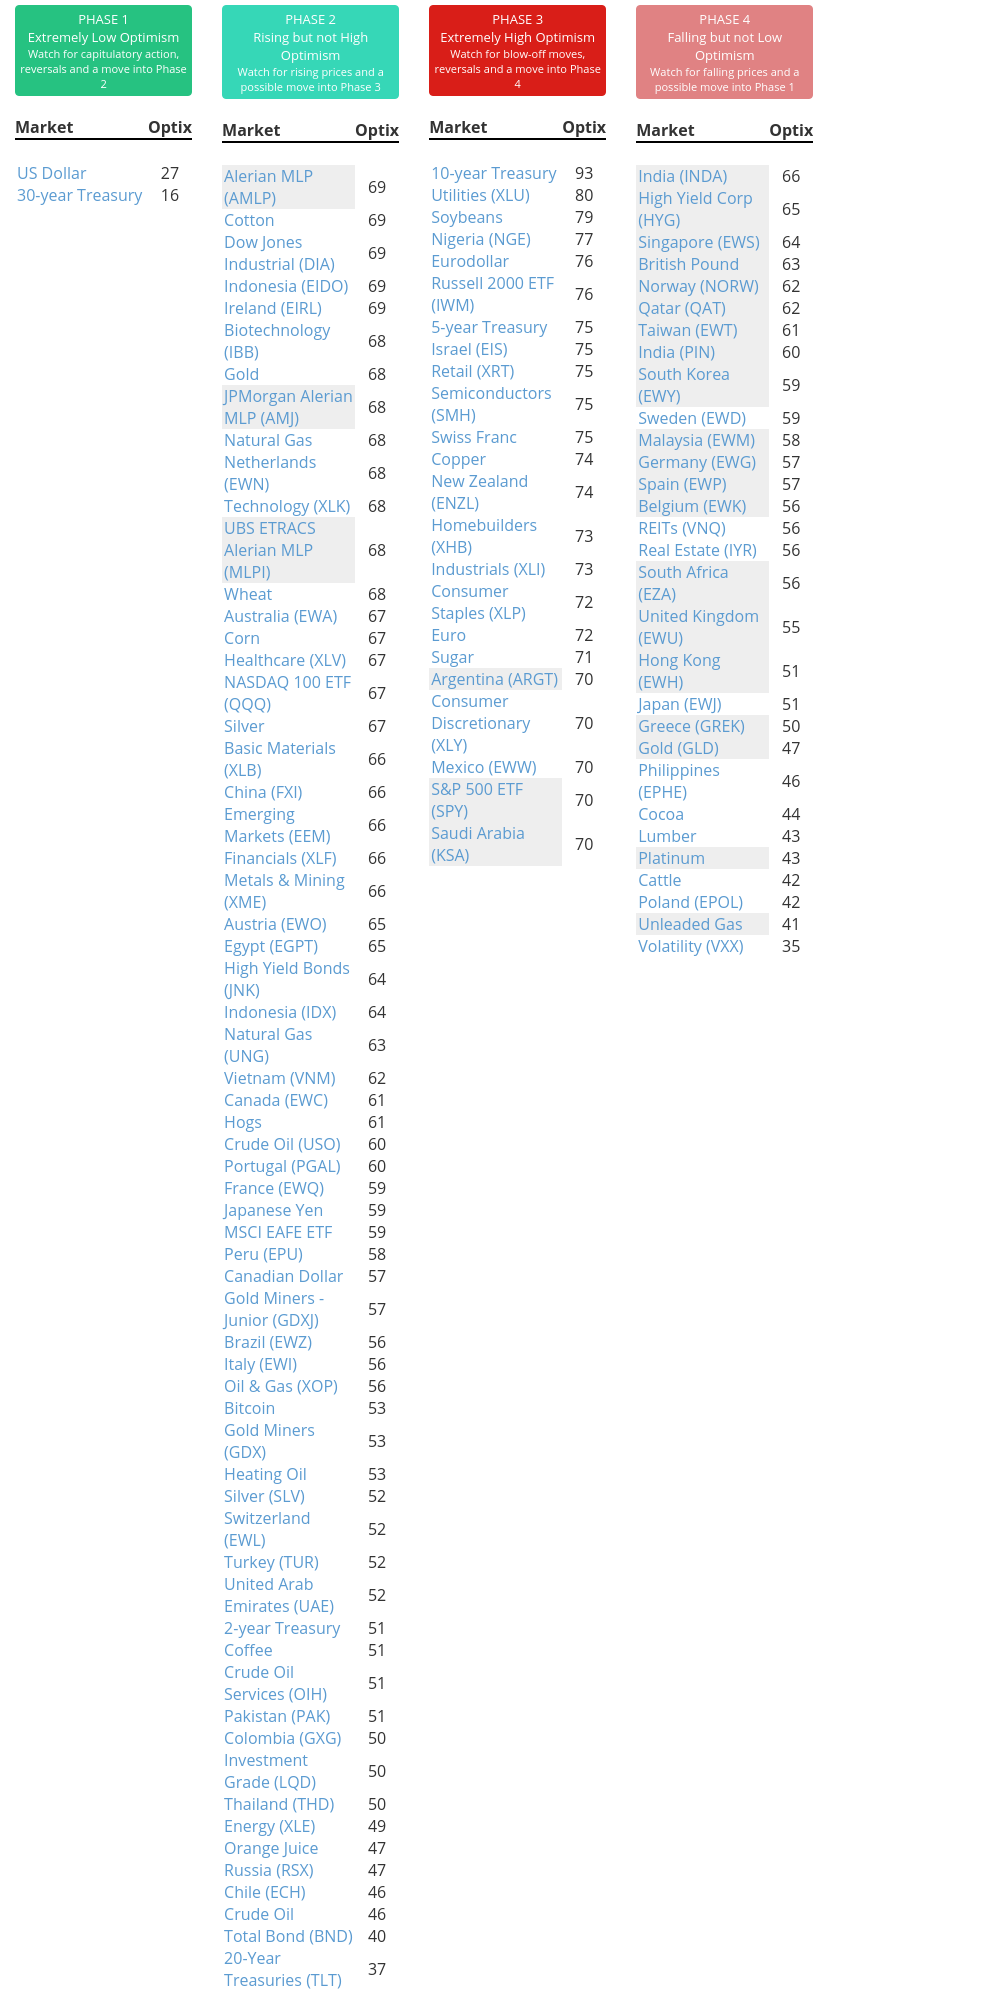
Phase Table
Ranks
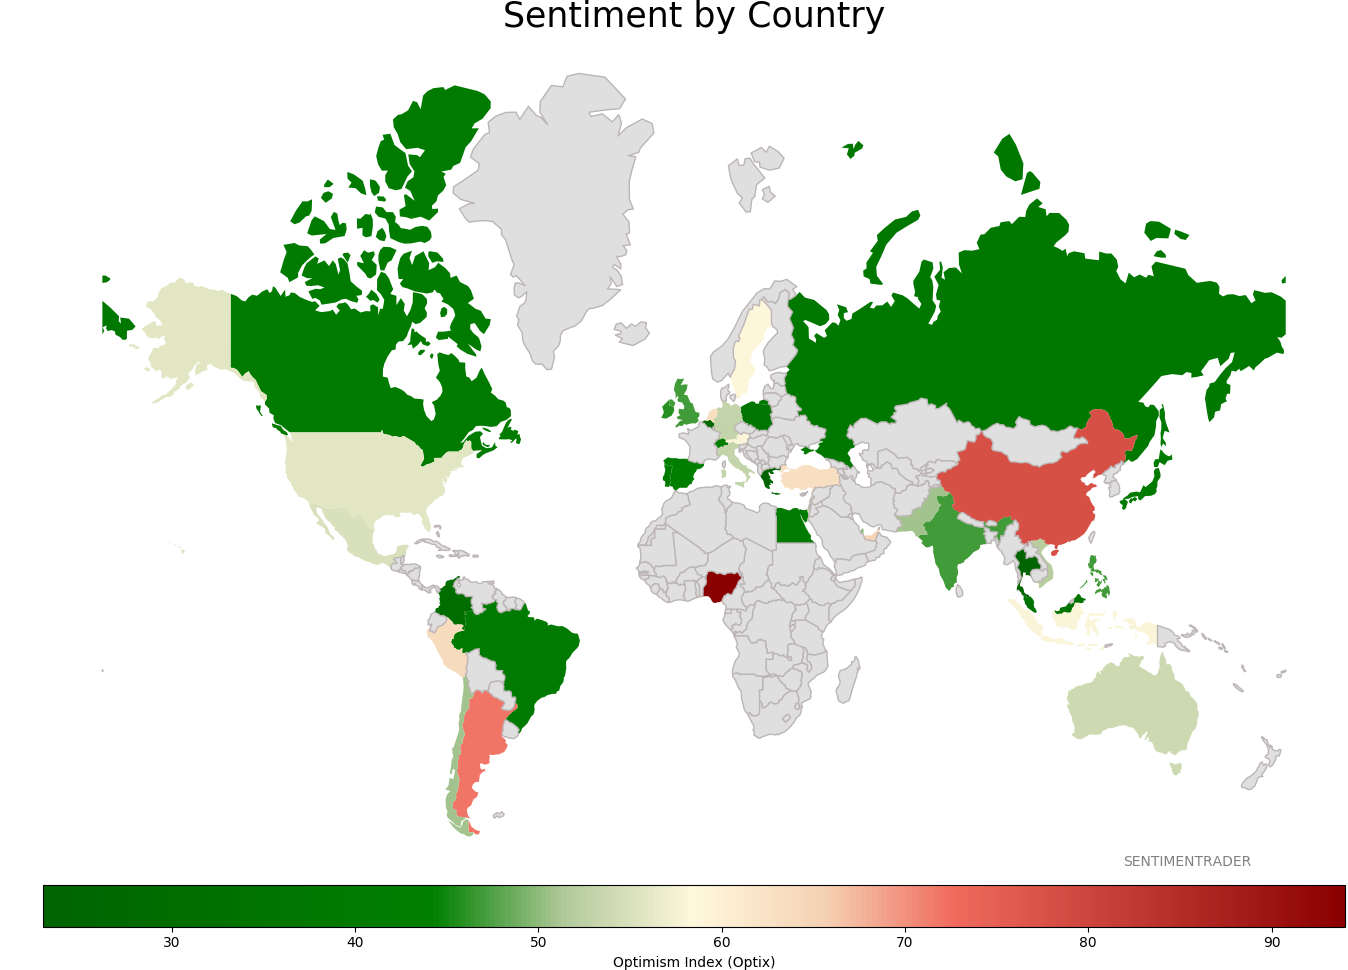
Sentiment Around The World
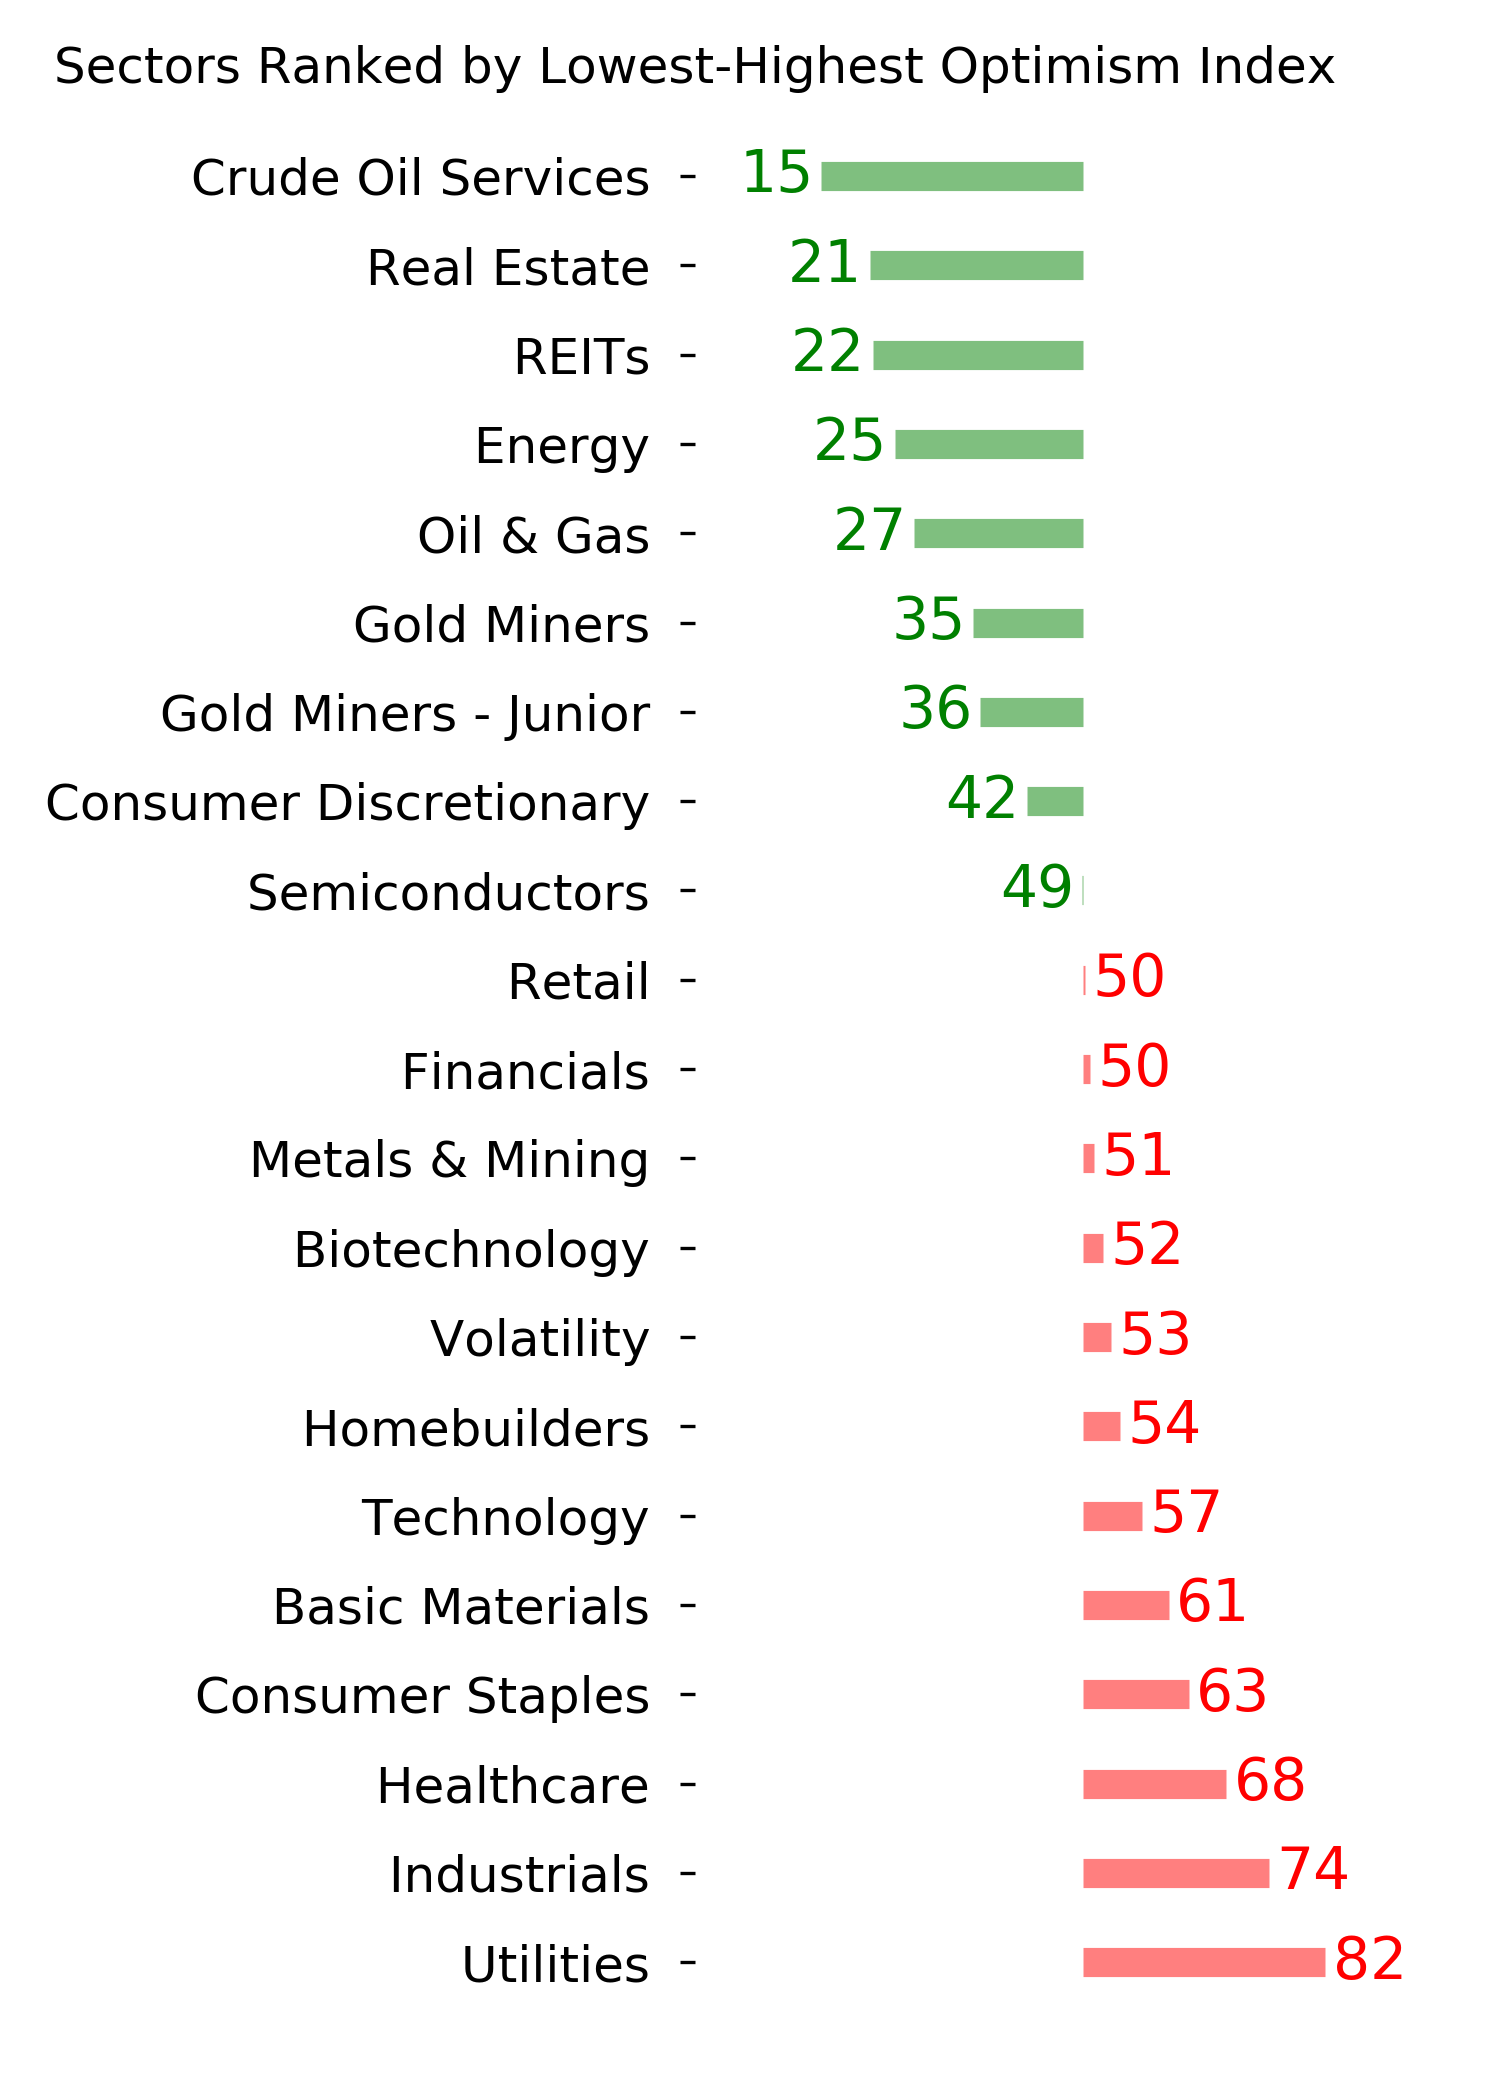
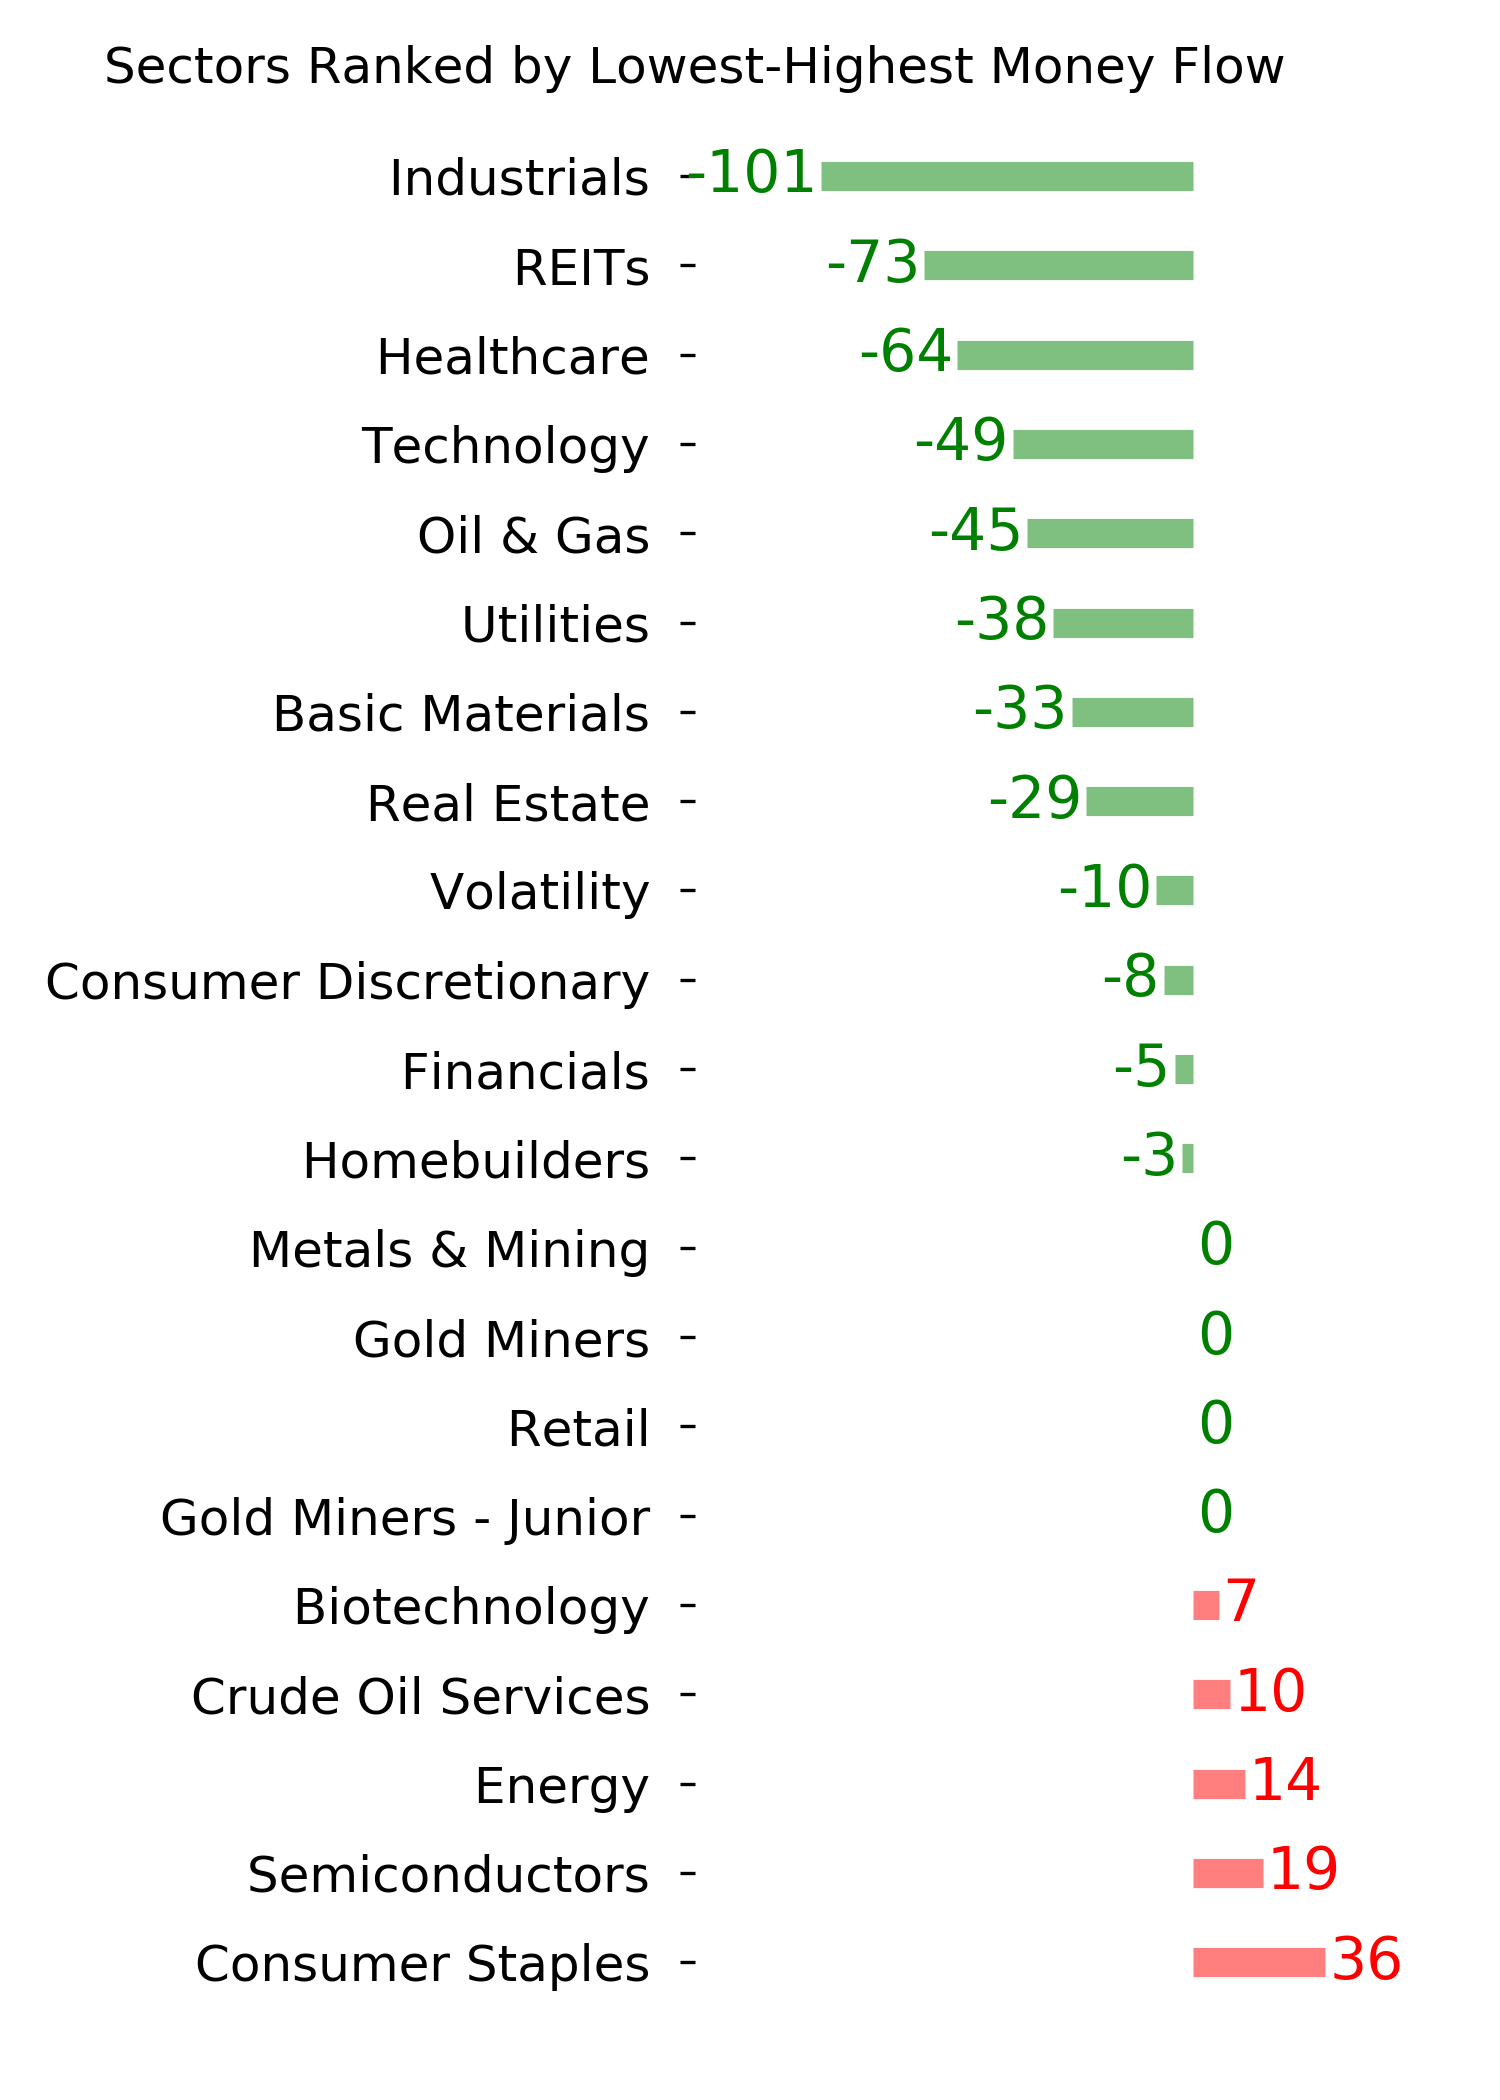
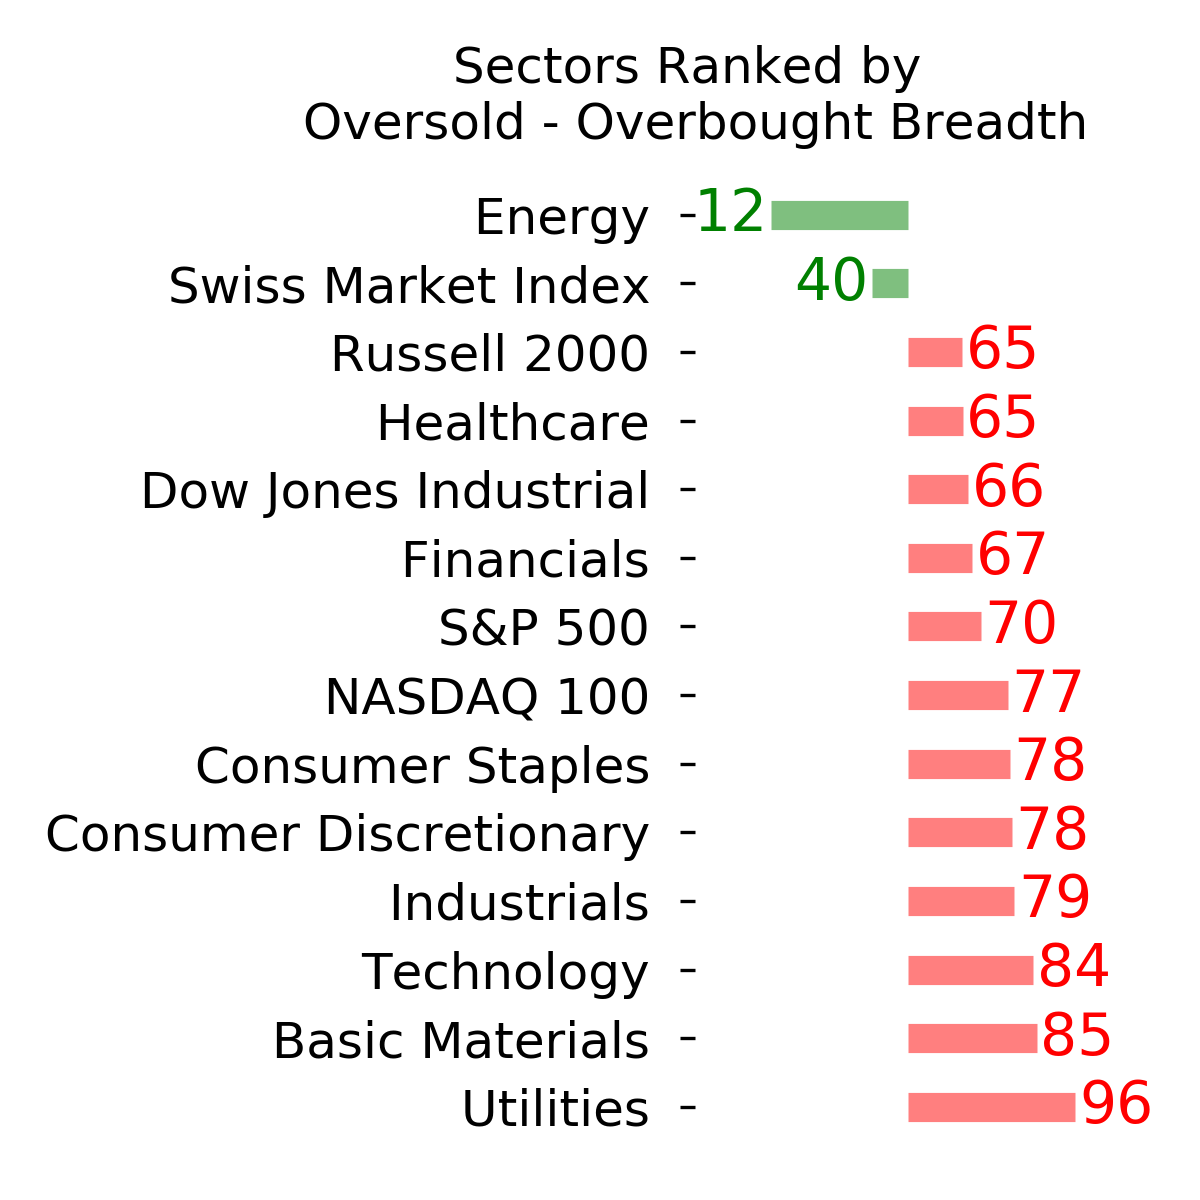
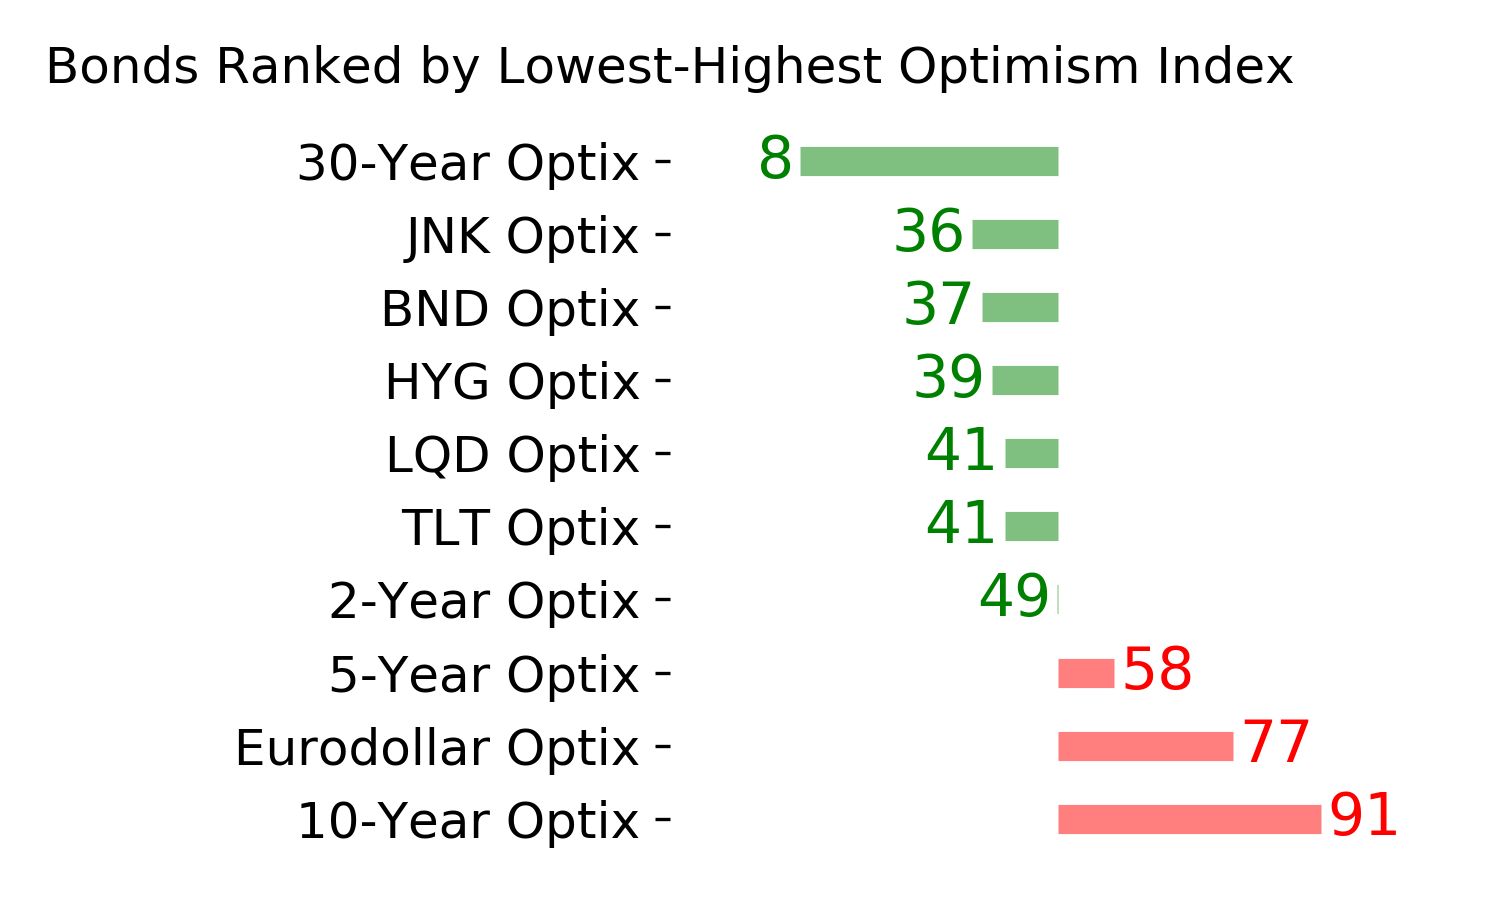
Optimism Index Thumbnails
|
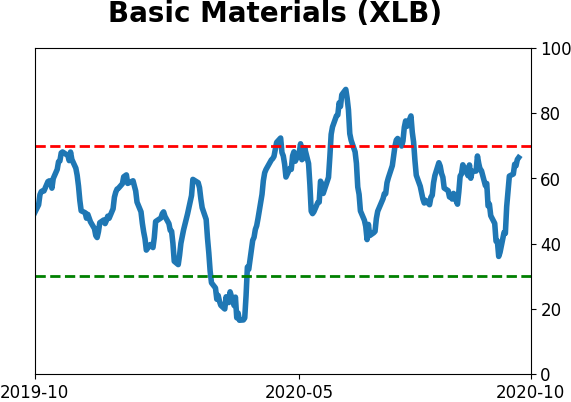
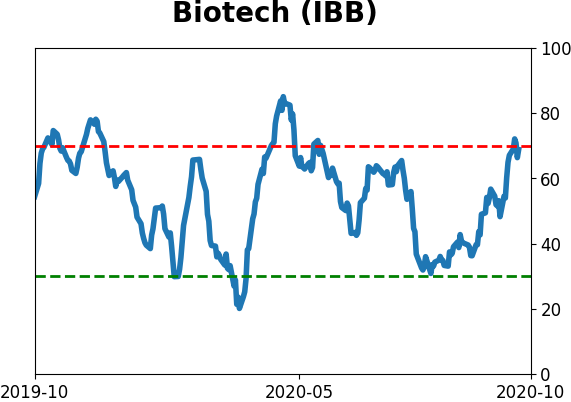
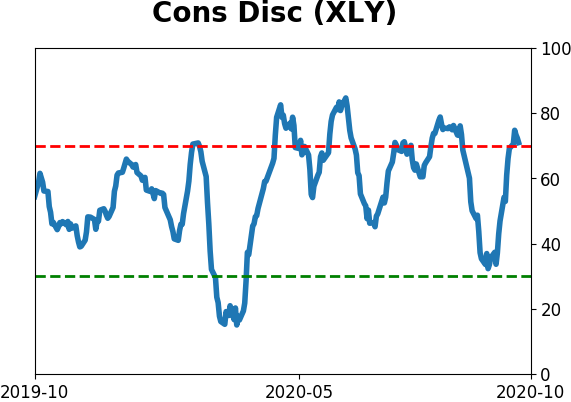
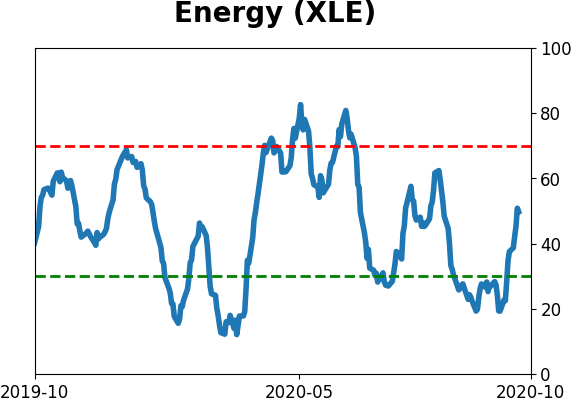
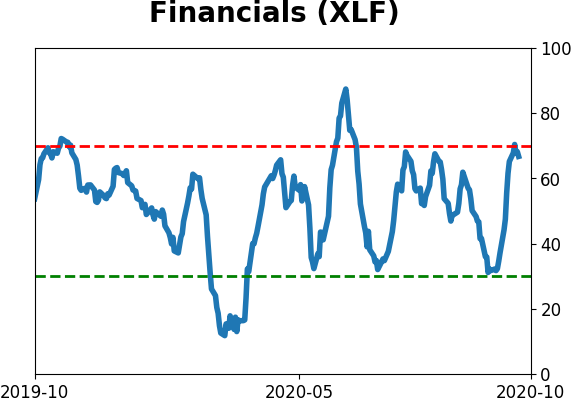
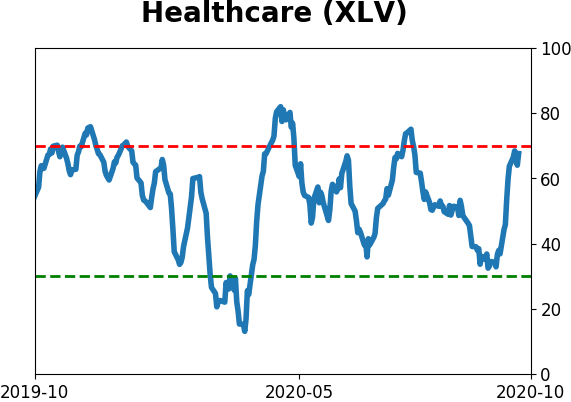
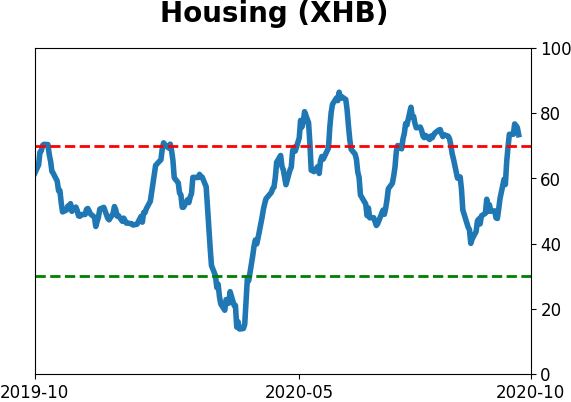
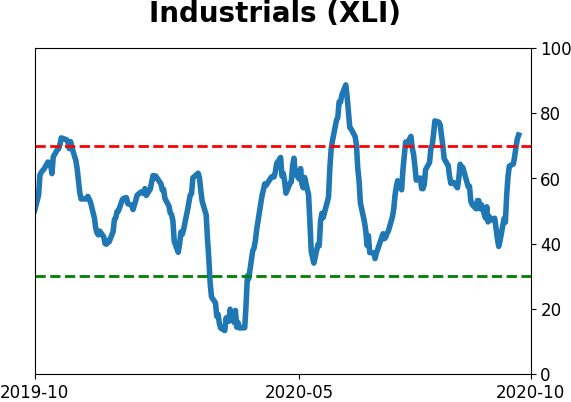
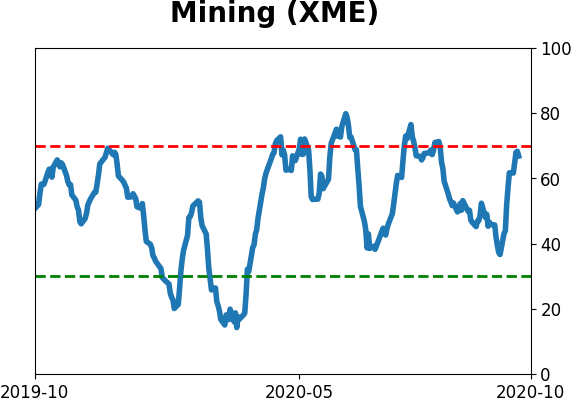
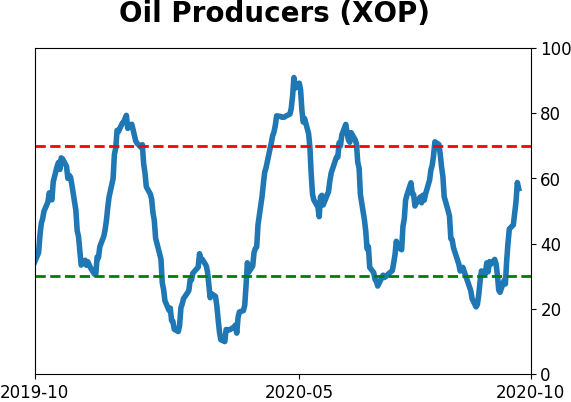
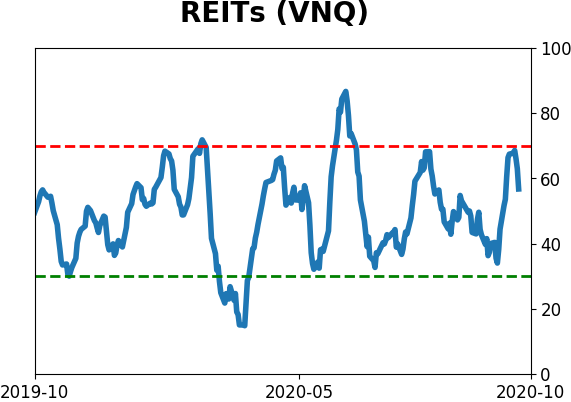
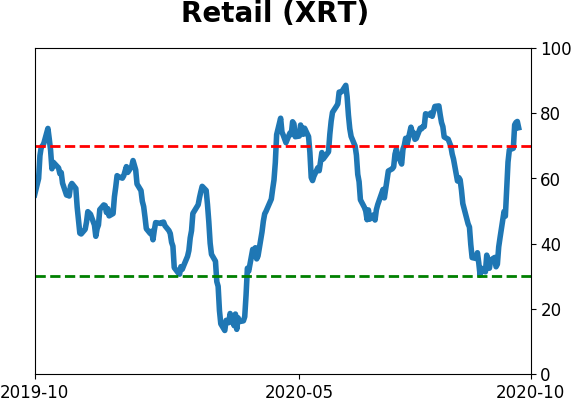
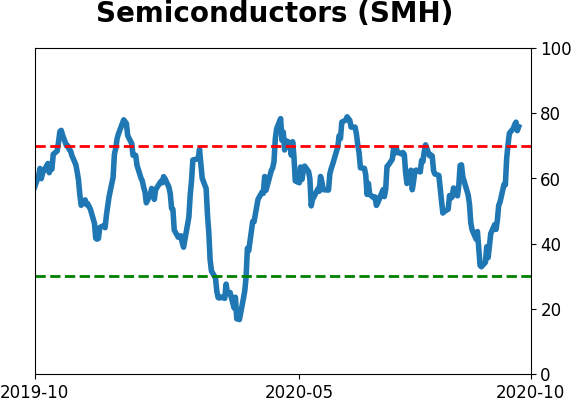
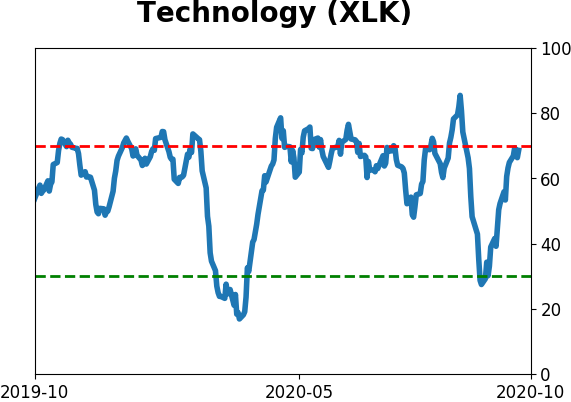
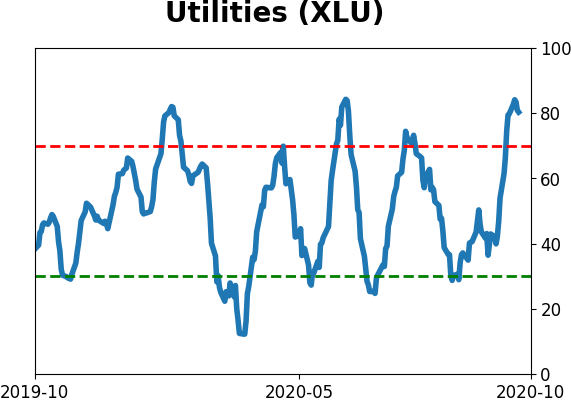
Sector ETF's - 10-Day Moving Average
|
|
|
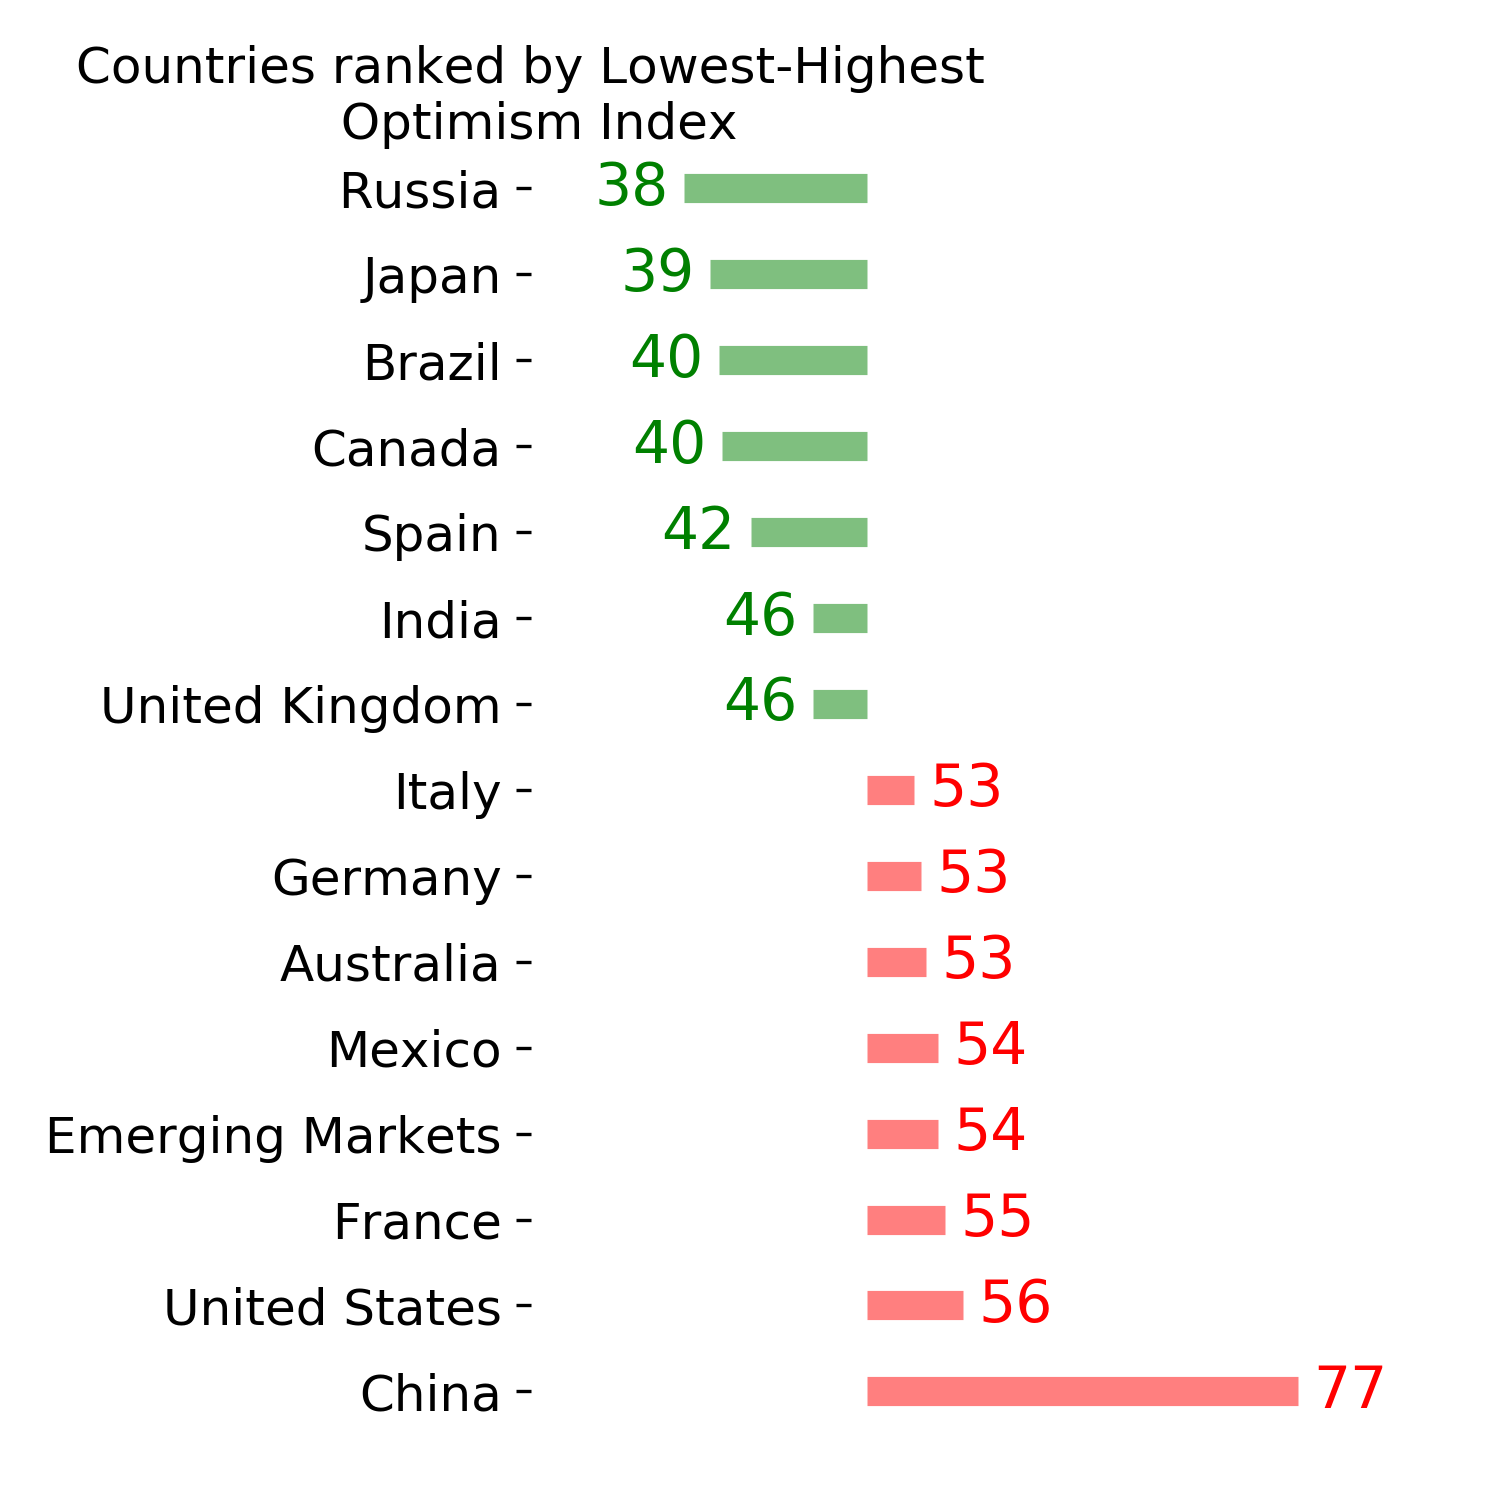
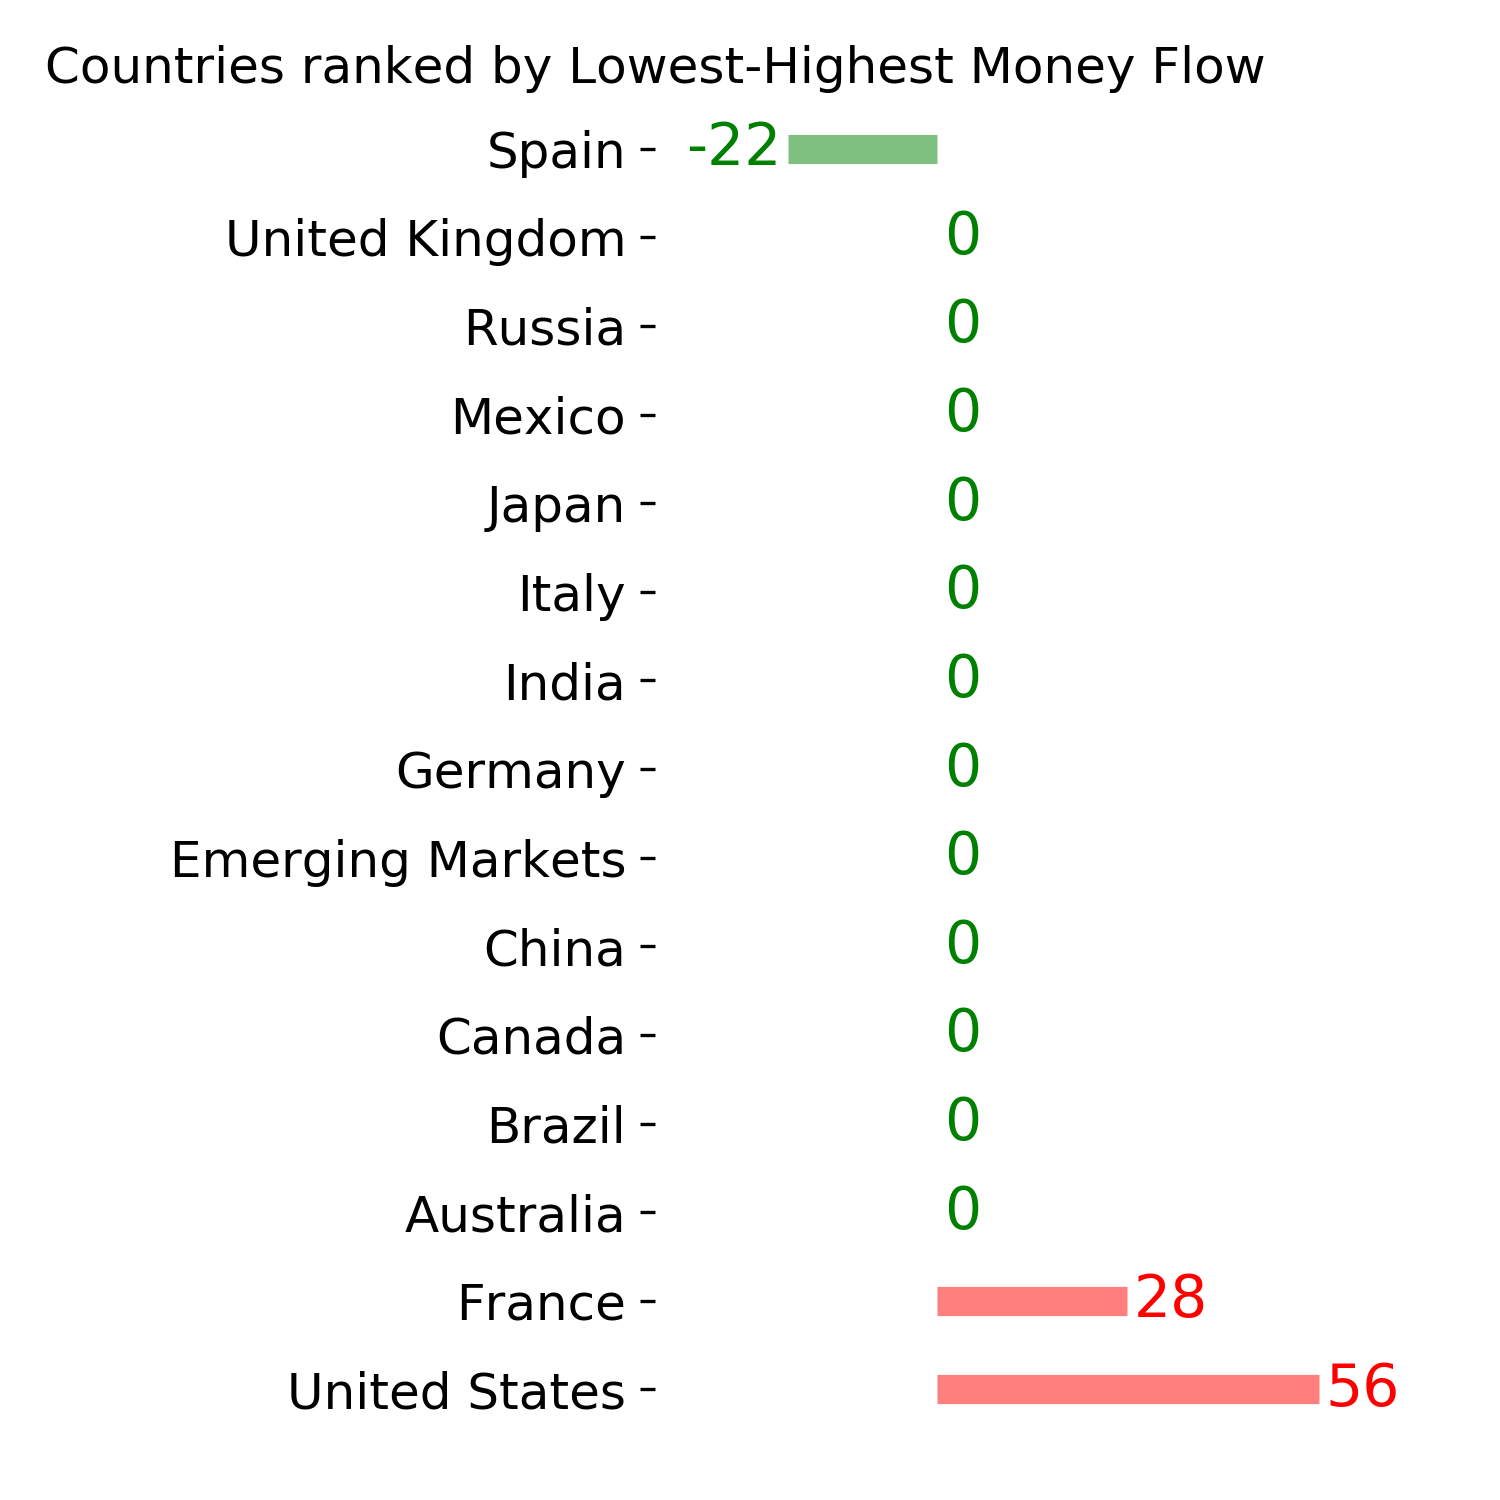
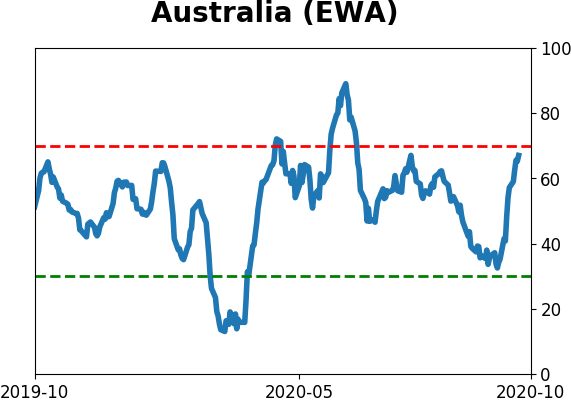
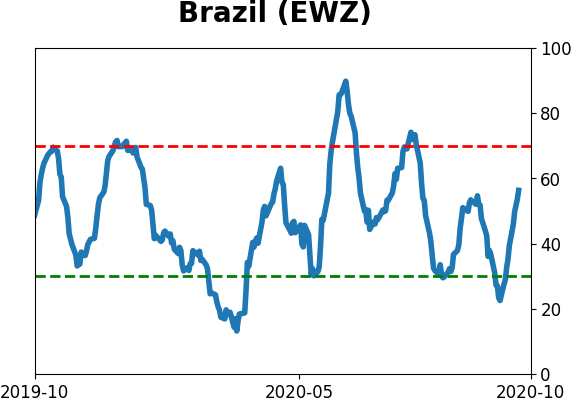
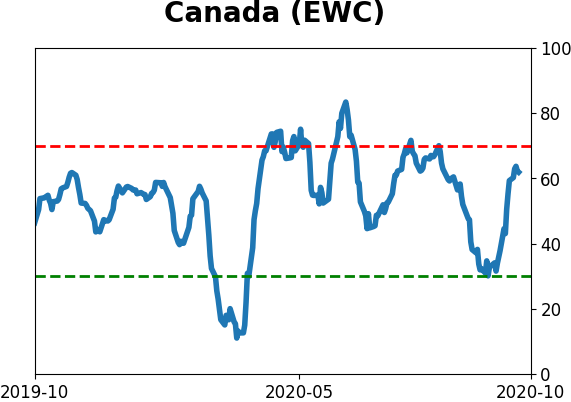
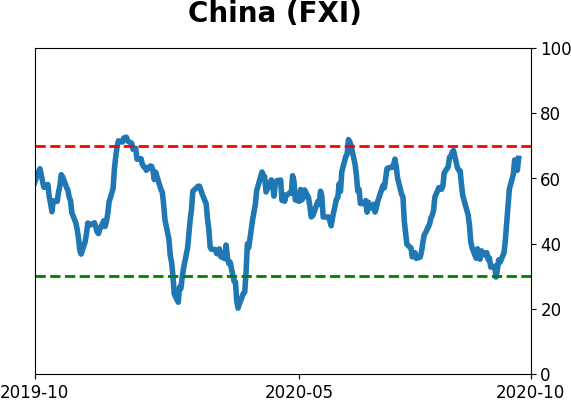
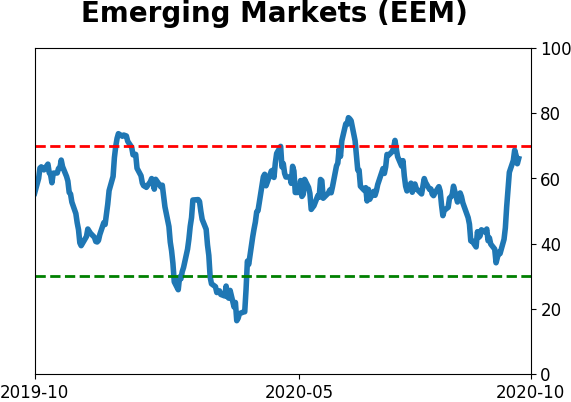
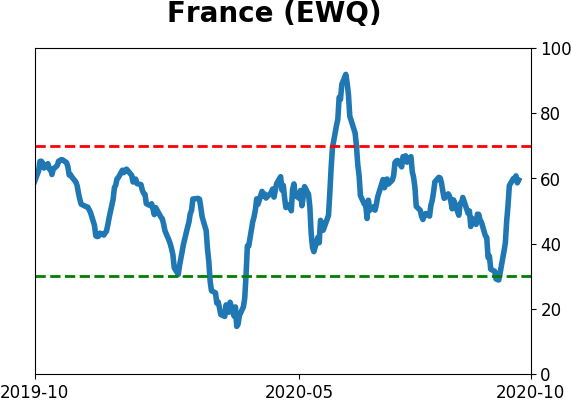
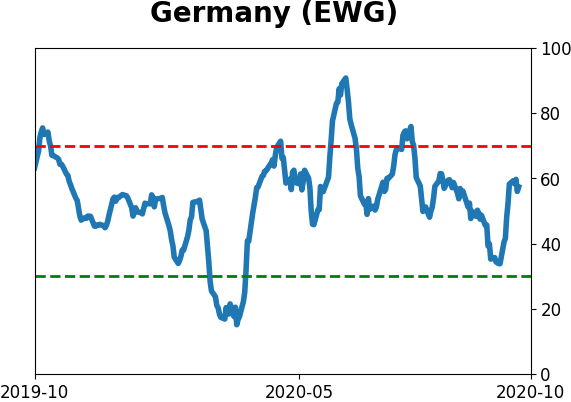
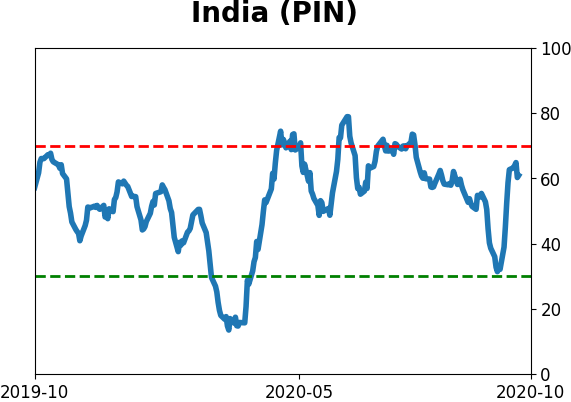
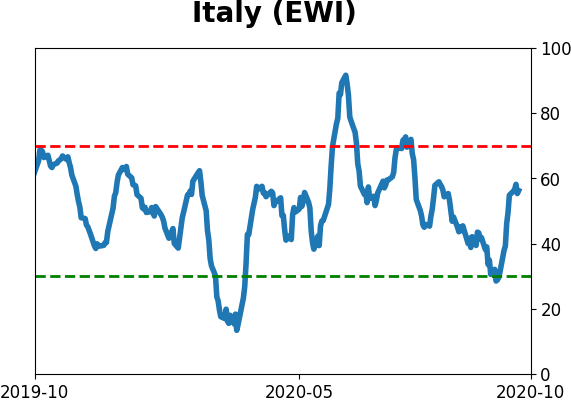
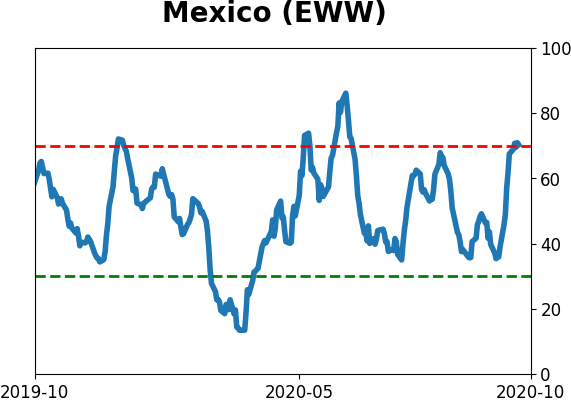
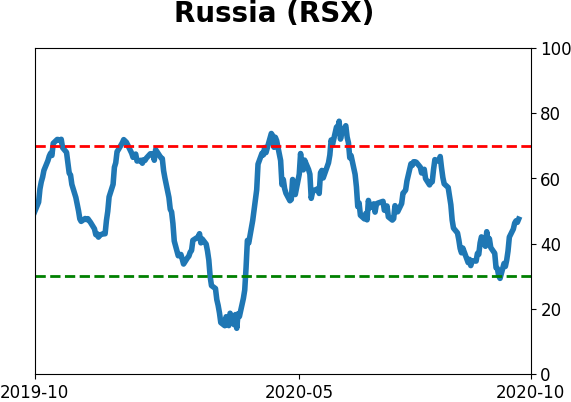
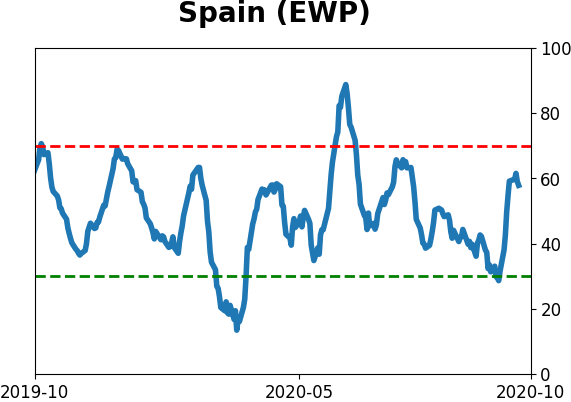
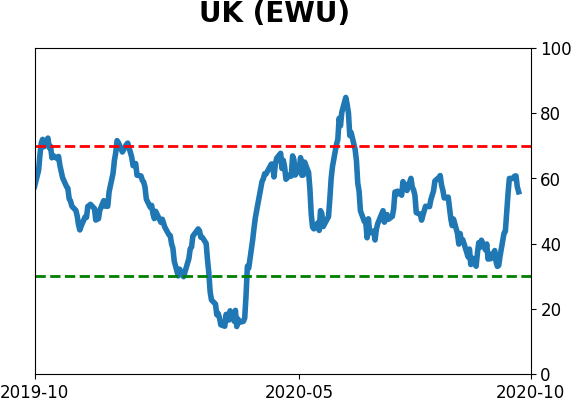
Country ETF's - 10-Day Moving Average
|
|
|
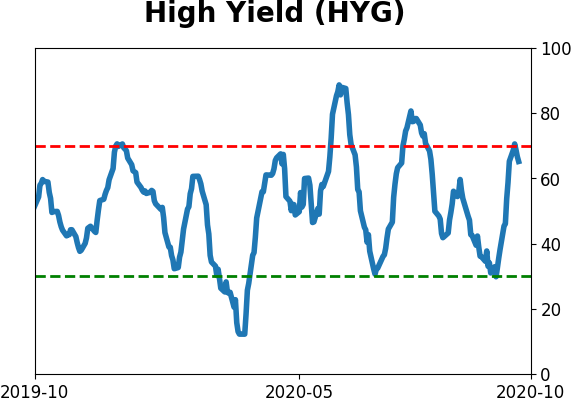
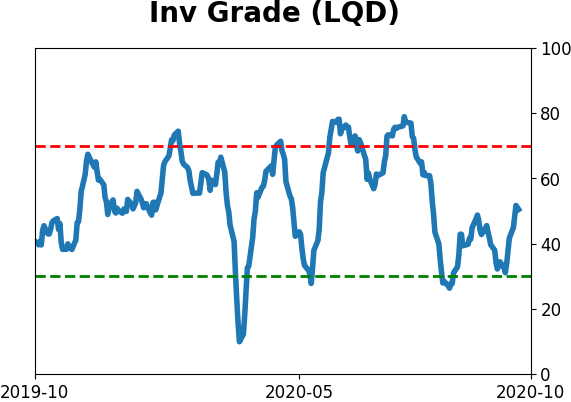
Bond ETF's - 10-Day Moving Average
|
|
|
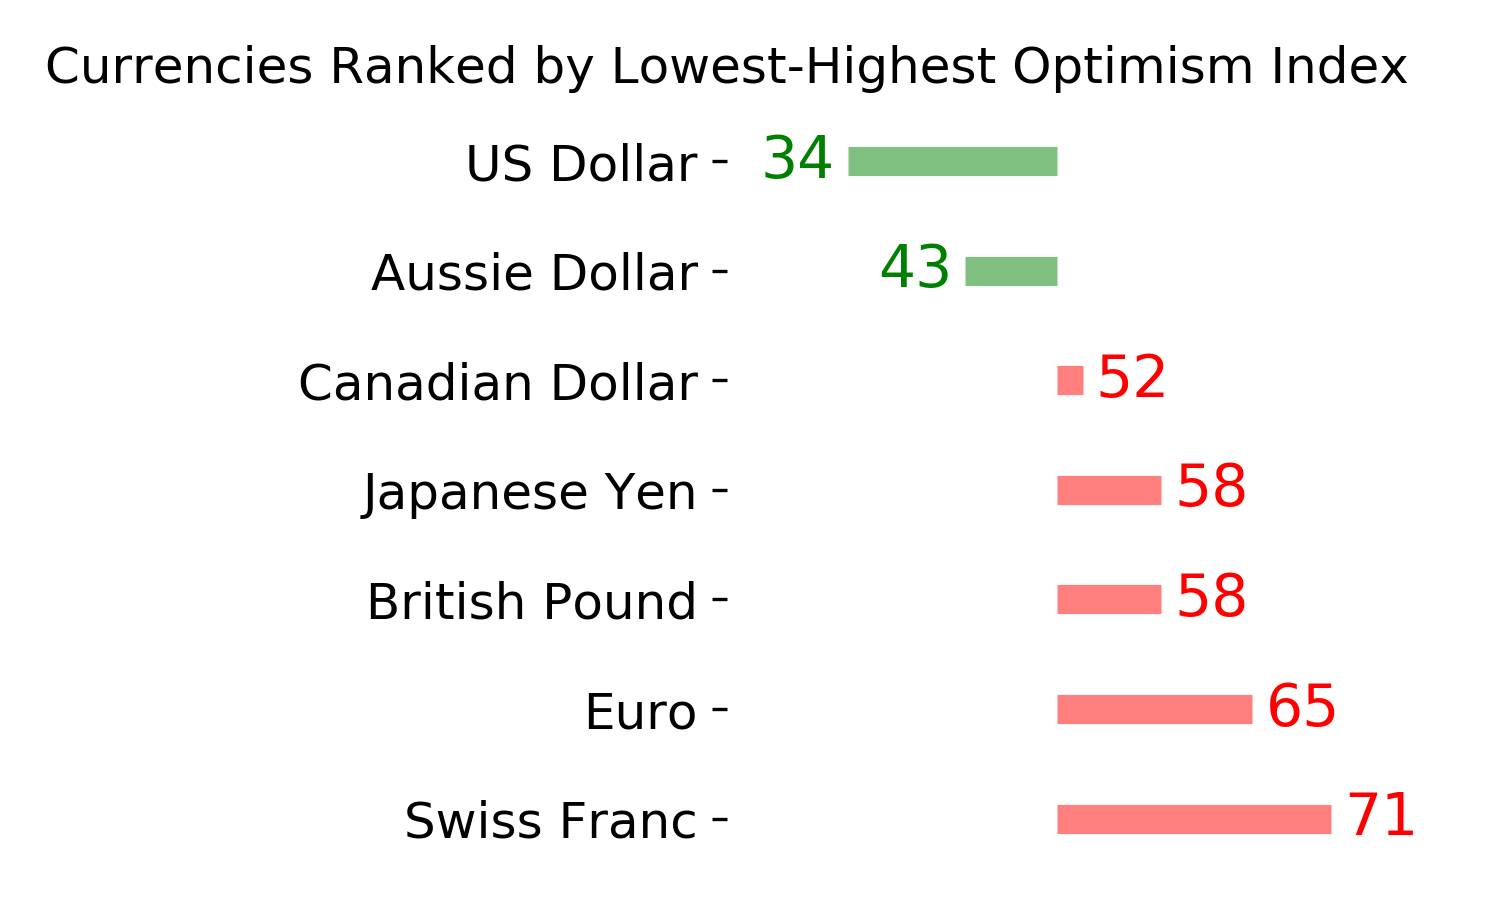
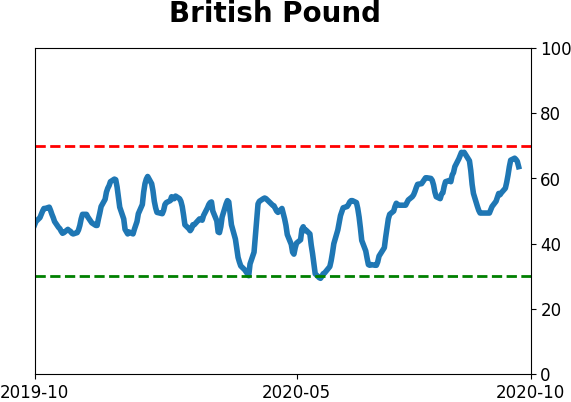
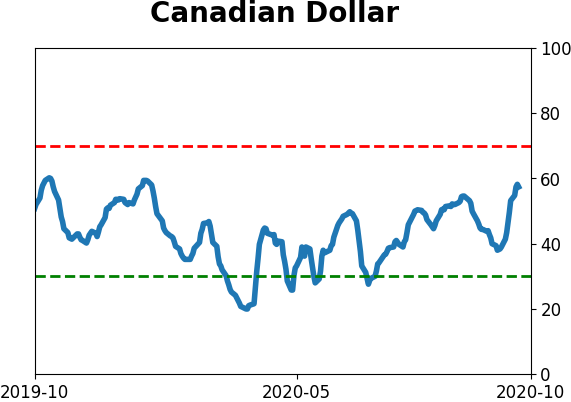
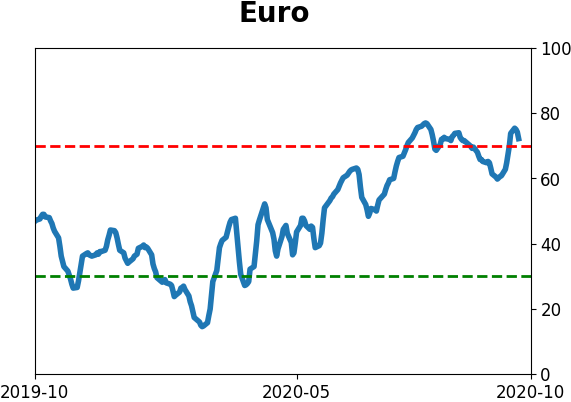
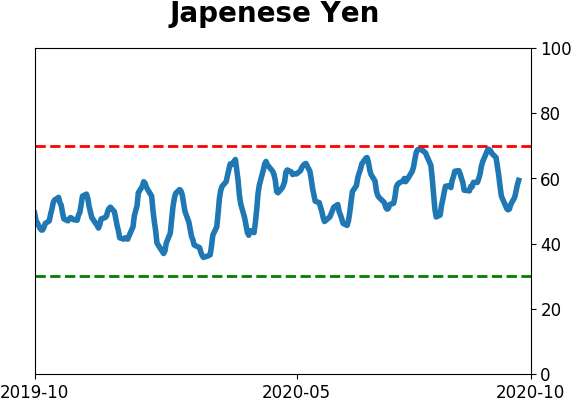
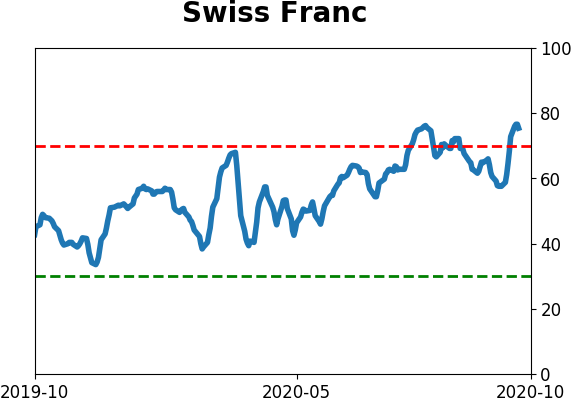
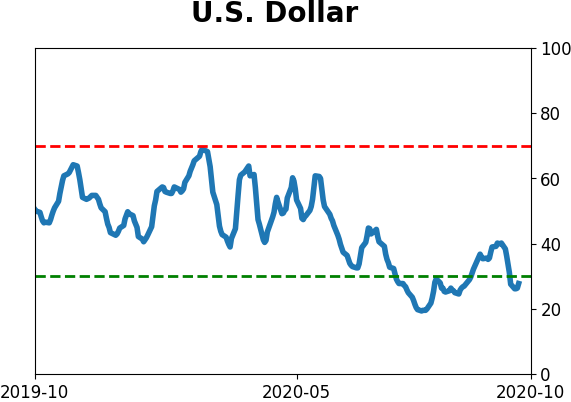
Currency ETF's - 5-Day Moving Average
|
|
|
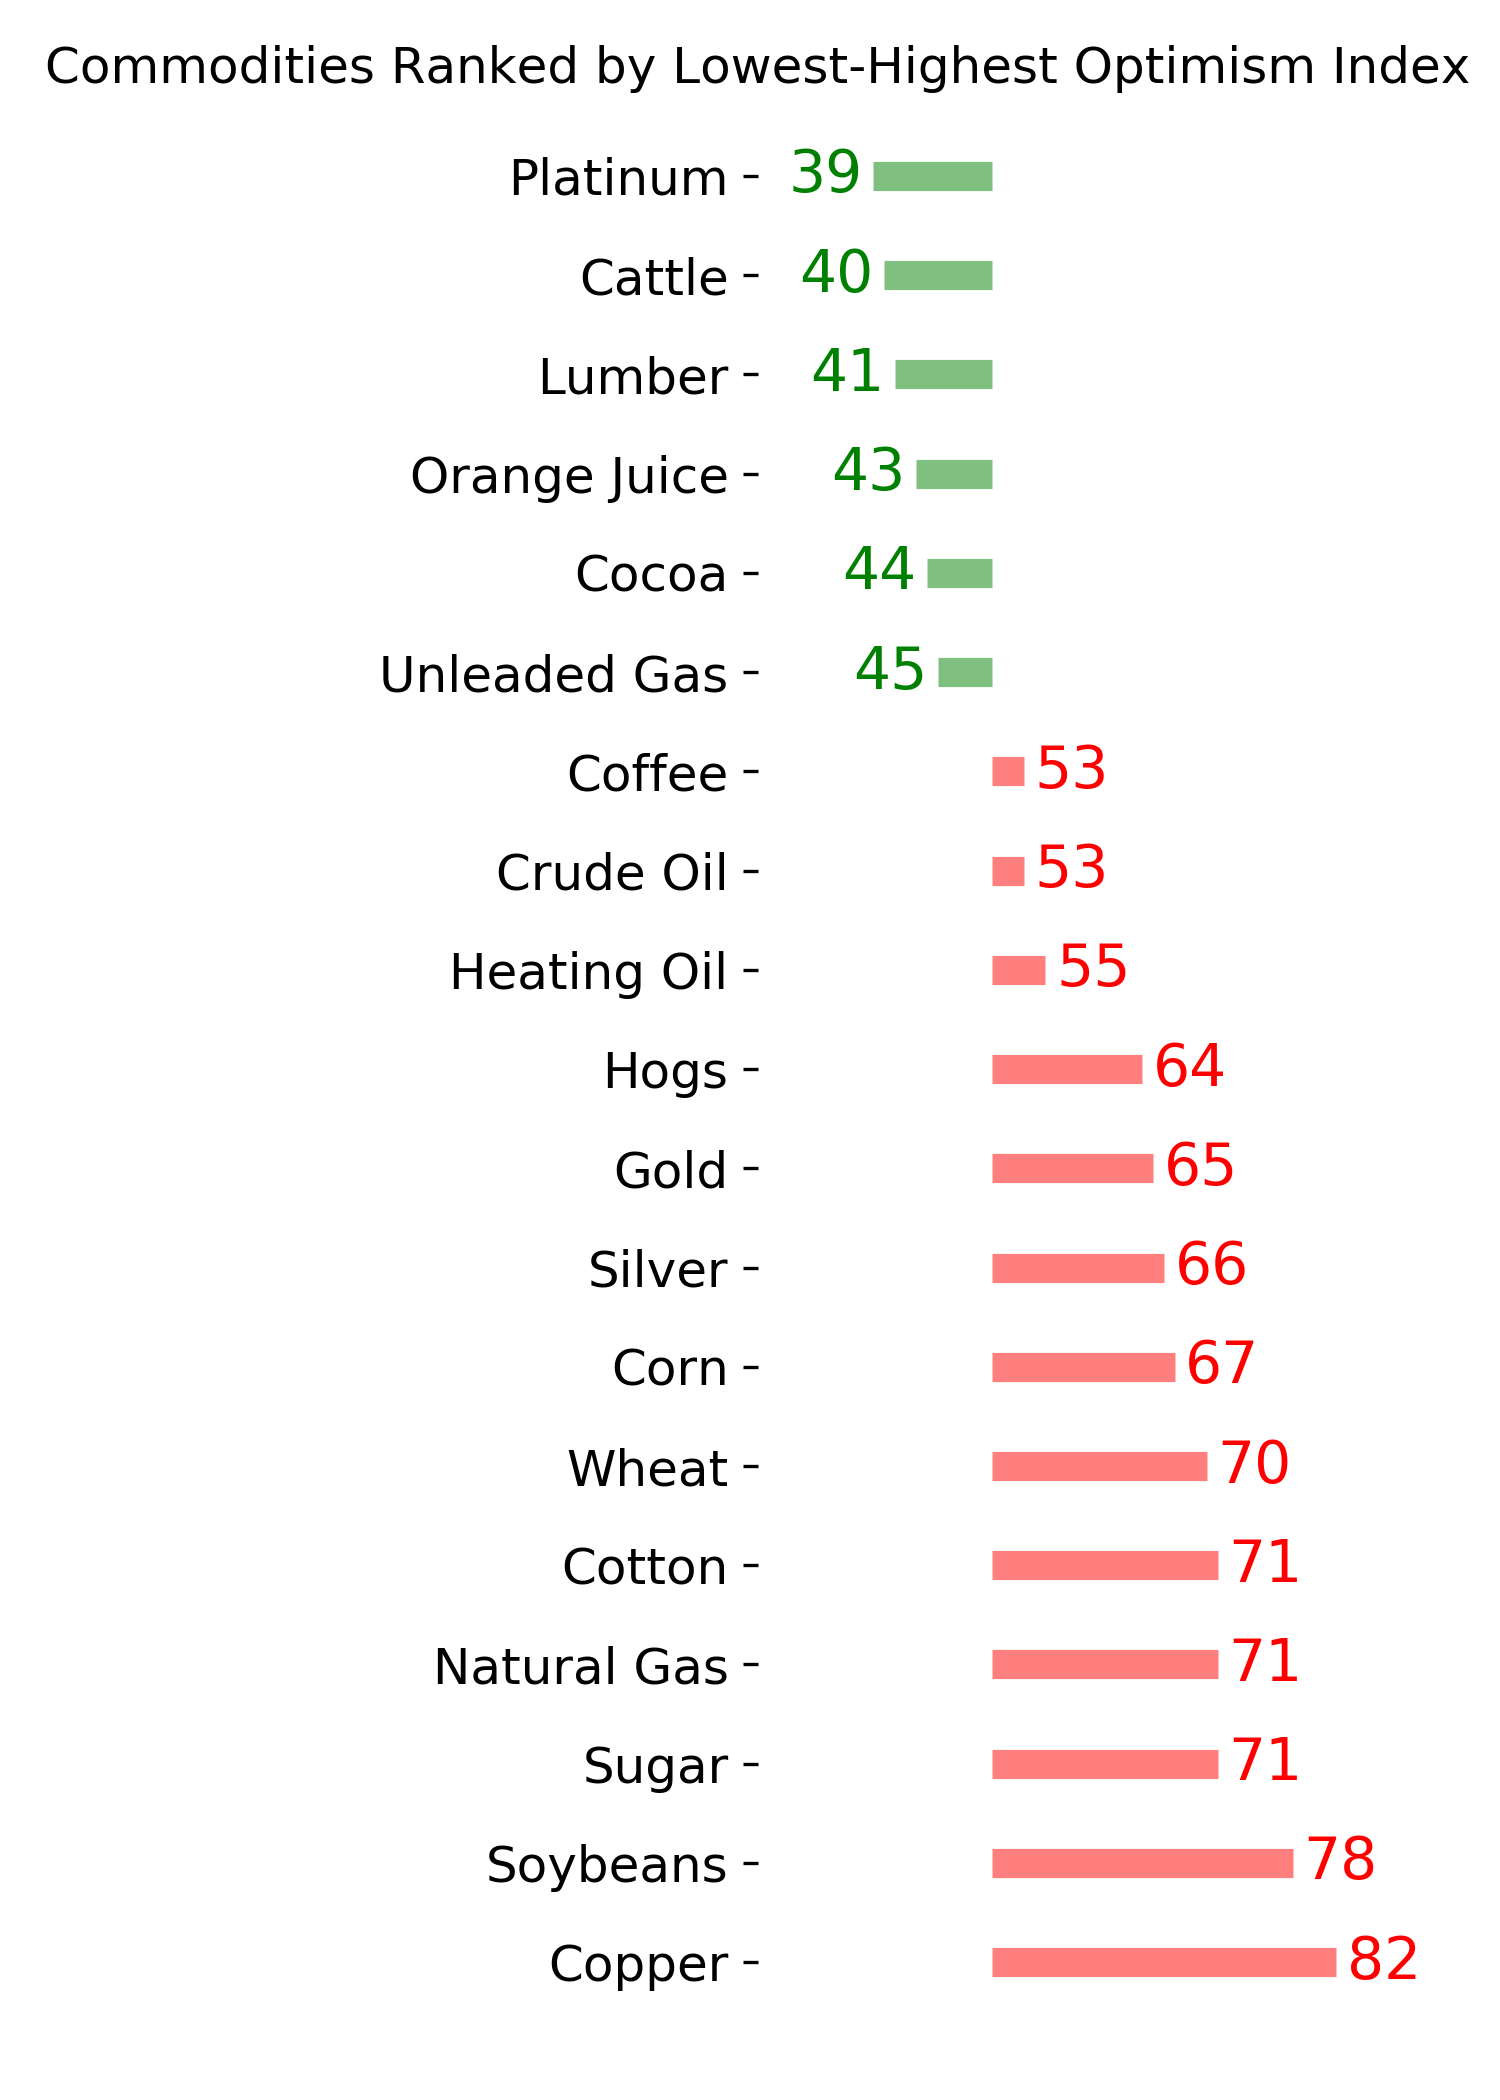
Commodity ETF's - 5-Day Moving Average
|
|