Daily Report : Weekly Wrap for Oct 15 - Souring Sentiment on Stocks and Bonds; Tech Pessimism; Commodity Rally

| View/Print a PDF version of this Report |
Headlines
|
Weekly Wrap for Oct 15 - Souring Sentiment on Stocks and Bonds; Tech Pessimism; Commodity Rally: This week, we saw the unusual situation of low optimism in both the stock and bond markets. After similar setups, a balanced 60/40 fund did well, as did risk parity. Volatility has been rising, which hasn't been a problem in the past. Internal momentum in the S&P is weak, with a negative McClellan Summation Index, and that needs to change. Commodities have been rising with the dollar, and zinc has zoomed higher. The latest Commitments of Traders report was released, covering positions through Tuesday: The 3-Year Min/Max Screen shows that "smart money" commercial hedgers were pretty aggressive in selling stocks over the past week, particularly the S&P 500 where they now have a record short position. In major equity index contracts, they cycled from more than $46 billion net long a little over a year ago to nearly $60 billion net short this week. According to the Backtest Engine, there have been 18 other weeks with short exposure this large, preceding a positive return over the next couple of weeks after only 6 of them. This data started acting oddly last spring so we don't place as much weight on it as we used to, but still, it's mildly concerning. Elsewhere, they established a new multi-year net long position in the Mexican peso, holding more than 20% of the open interest net long. This was a bullish sign for the peso over the past 15 years, except for 2015-16 when the currency slid relentlessly. Bottom Line: STOCKS: Weak buy BONDS: Hold GOLD: Hold |
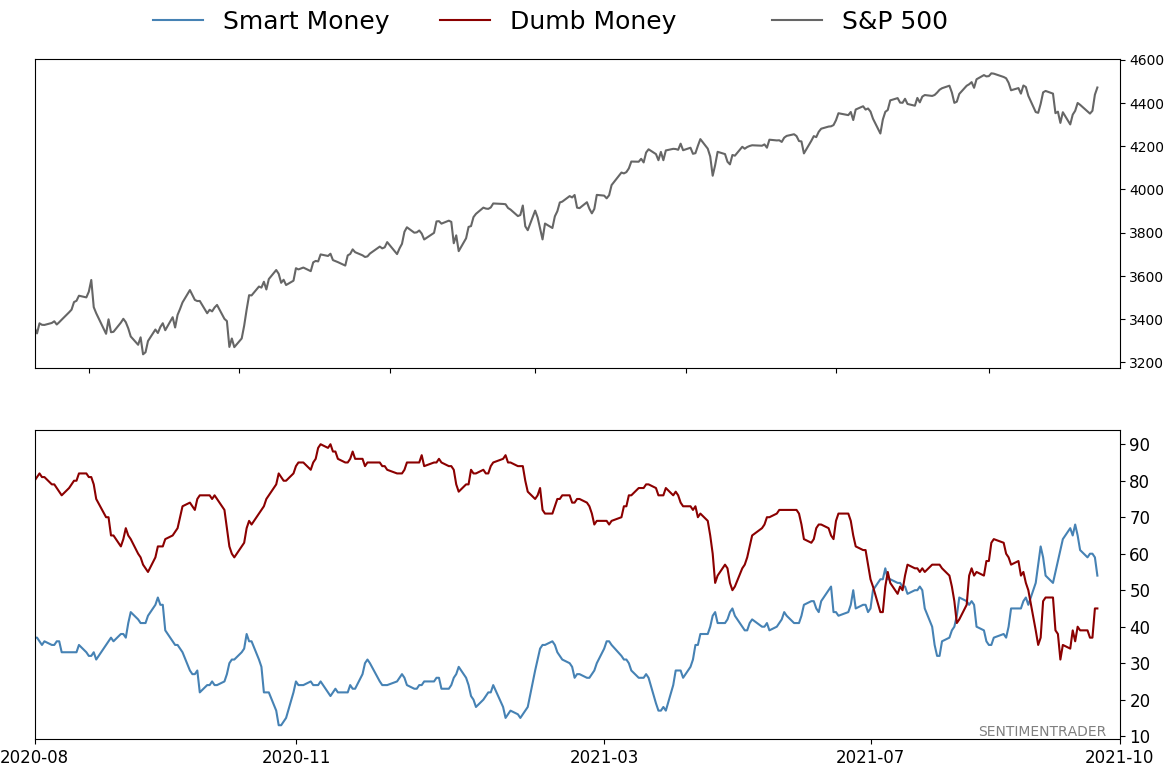
Smart / Dumb Money Confidence
|
|
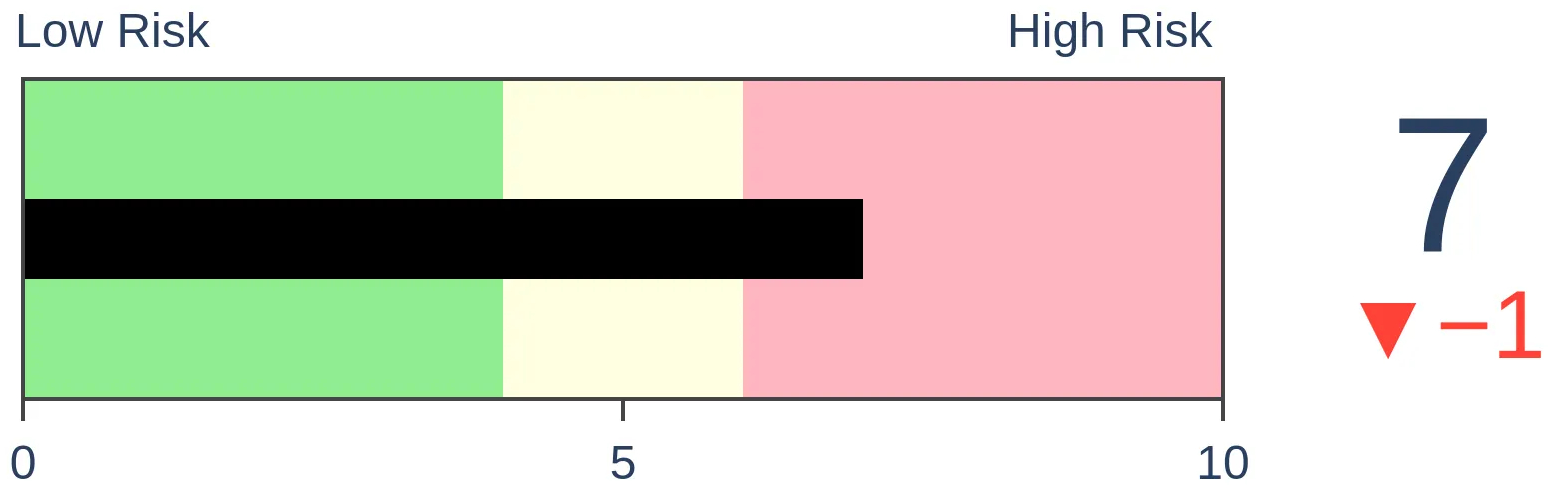
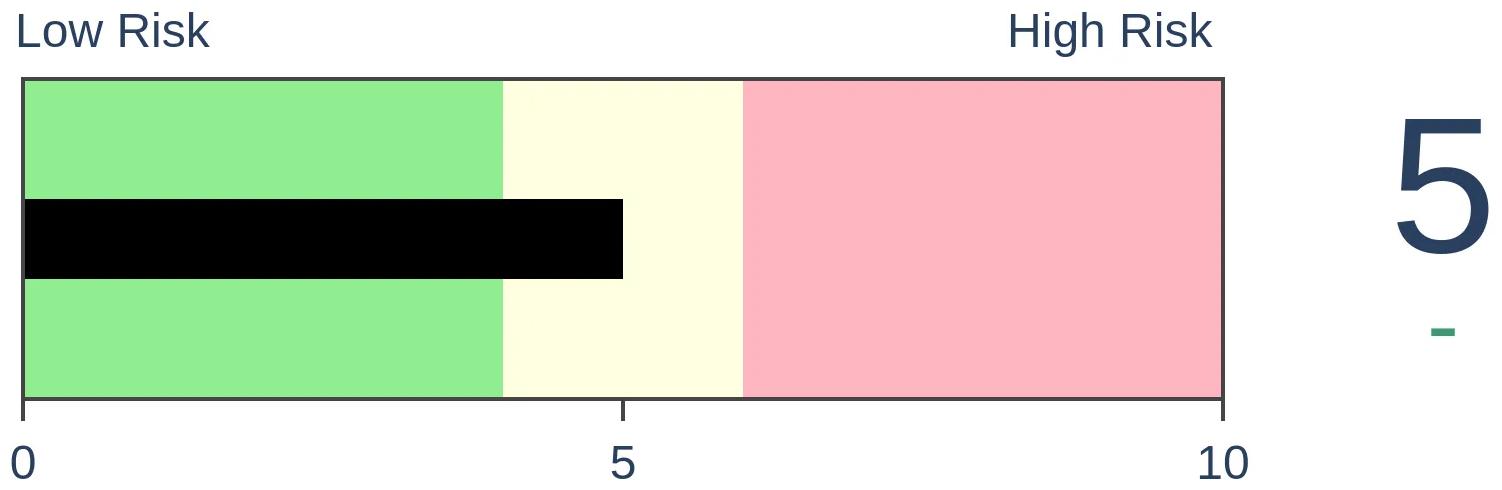
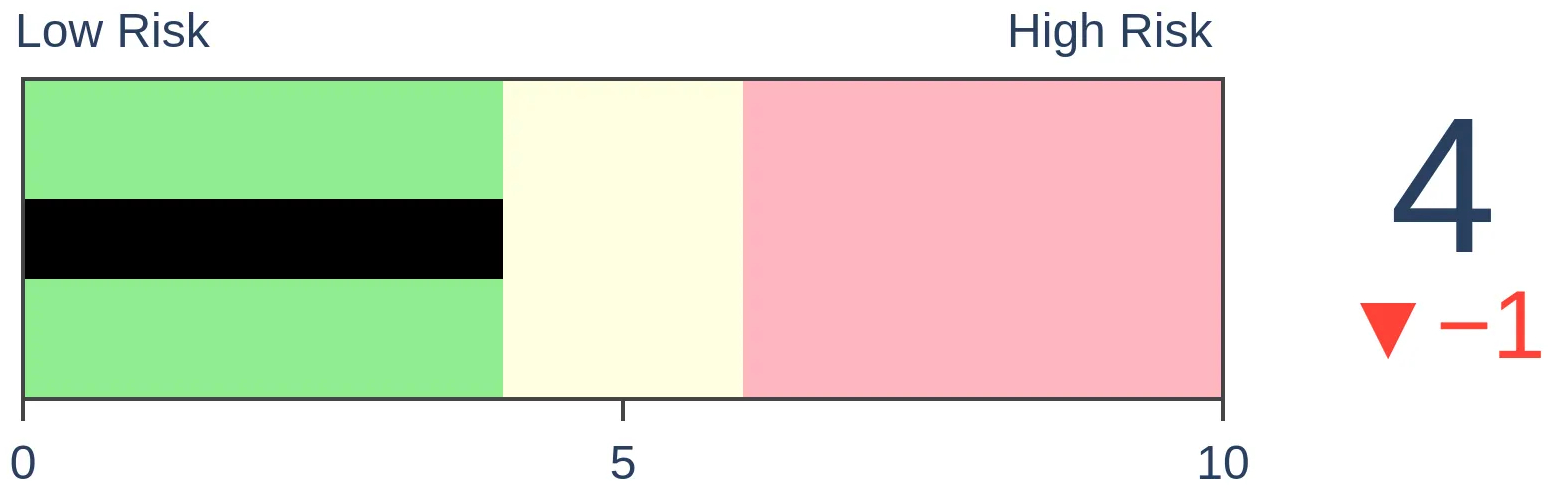
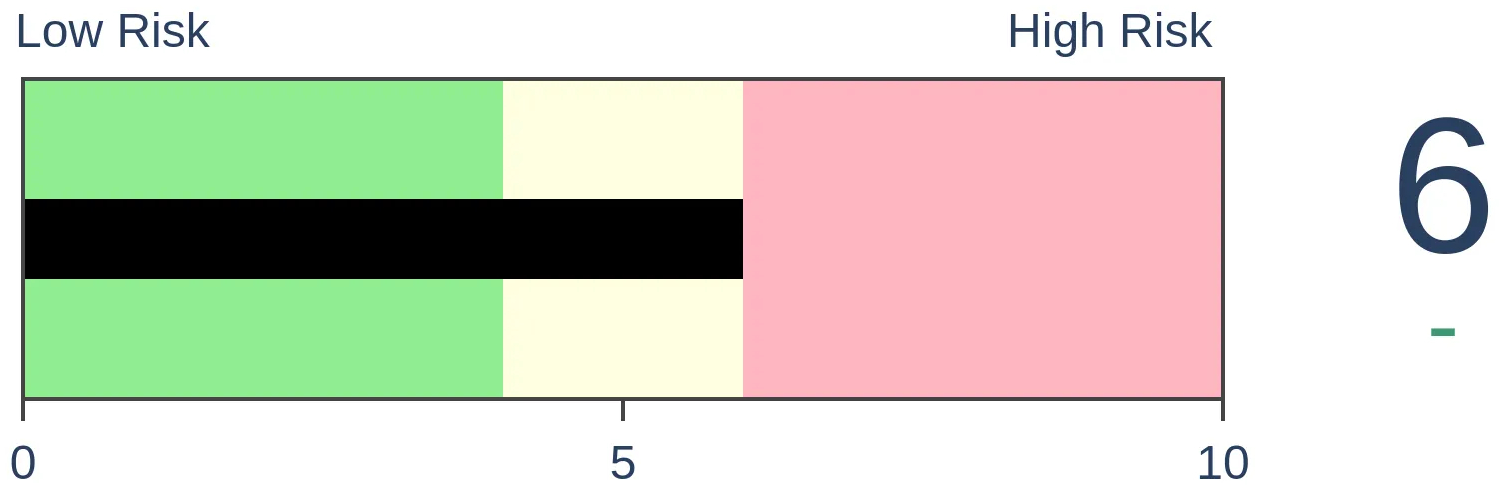
Risk Levels
|
|
|

Research
Weekly Wrap for Oct 15 - Souring Sentiment on Stocks and Bonds; Tech Pessimism; Commodity RallyBy Jason GoepfertBOTTOM LINEThis week, we saw the unusual situation of low optimism in both the stock and bond markets. After similar setups, a balanced 60/40 fund did well, as did risk parity. Volatility has been rising, which hasn't been a problem in the past. Internal momentum in the S&P is weak, with a negative McClellan Summation Index, and that needs to change. Commodities have been rising with the dollar, and zinc has zoomed higher. FORECAST / TIMEFRAME |
The goal of the Weekly Wrap is to summarize our recent research. Some of it includes premium content (underlined links), but we're highlighting the key focus of the research for all. Sometimes there is a lot to digest, with this summary meant to highlight the highest conviction ideas we discussed. Tags will show any symbols and time frames related to the research.
| STOCKS | ||
 |  | |
At various points this year, the majority of stocks have trailed the major indexes. Sometimes, there was a wide divergence between what the average stock was doing versus, say, the S&P 500. Historically, that has preceded declines in the indexes, but 2021 has thrown a whole host of historical markers out the window.
Even so, the internal weakness was enough so that when the S&P actually did start to struggle over a month ago, some of its breadth metrics really struggled. The rally at the tail end of last week started to change that; the McClellan Oscillator for the S&P 500 has turned positive for the first time in a month.
The extended run below zero in the Oscillator caused the longer-term Summation Index to plunge, and it recently dived below its zero line for the first time in well over a year. The worst possible scenario for an index or sector is when its Summation Index is negative and declining - that's when the ugliest selloffs tend to occur.
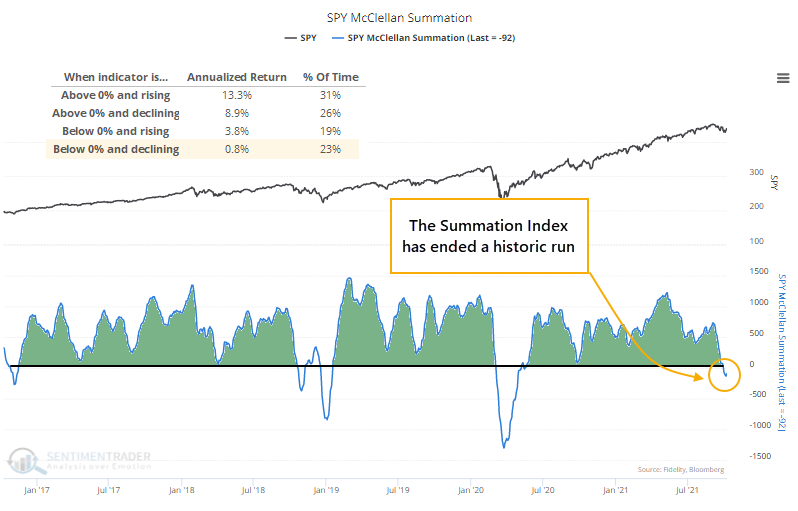
The drop below zero ended the 4th-longest streak in positive territory for the Summation Index since 1926, and it missed making it into 2nd place by only a few sessions.
The longest streak ended in 2018, almost exactly three years ago, and ushered in some quick and painful losses. That was more the exception than the rule, though. After other long positive streaks ended, the S&P tended to show positive returns going forward, better than average returns, with generally small losses. Over the next three months, there were only two losers larger than -5%.
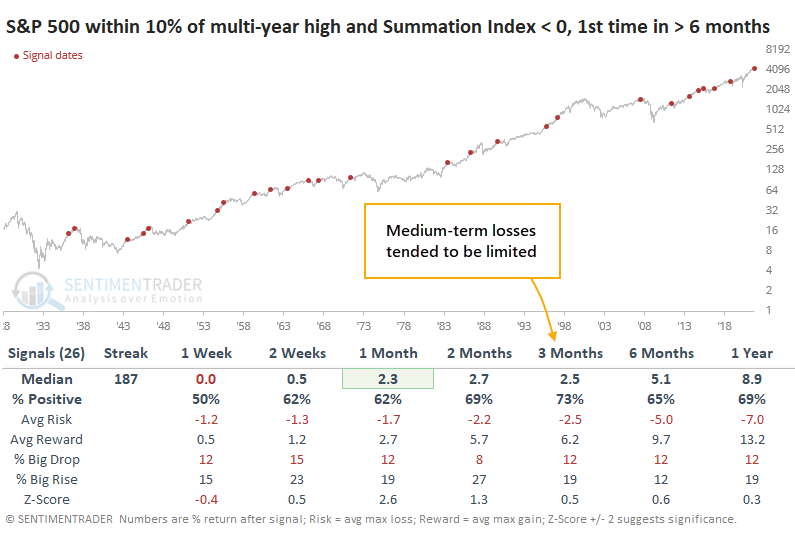
Over the past week, we've looked multiple times at the ends of long streaks of positive momentum. To a one, they showed a positive expectation going forward. After a long time with positive trends and internals, buyers have had a powerful tendency to see the first real pullback as an opportunity.
VOLATILITY SPIKE IS NOT A CONSISTENT REASON TO FEAR
For those who were indoctrinated on technical analysis textbooks, we were taught that when stocks turn volatile during a bull market, then trouble is brewing.
It's an issue now because the S&P 500 is mired in its longest pullback in a year. Despite a relatively shallow pullback, though, the index has been gyrating wildly, with over a week of days with 1% daily moves. That has pushed the index's 10-day realized volatility to a 90-day high.
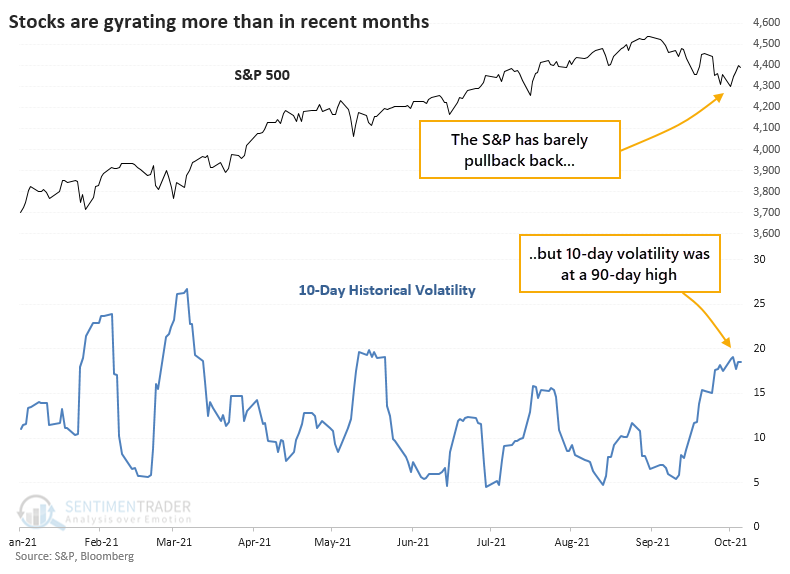
Instead of reading tea leaves, let's look at the evidence. The table below shows every time when the S&P was within 30 days of a multi-year high, no more than 5% from its peak, and yet its 10-day volatility rose to a 90-day high.
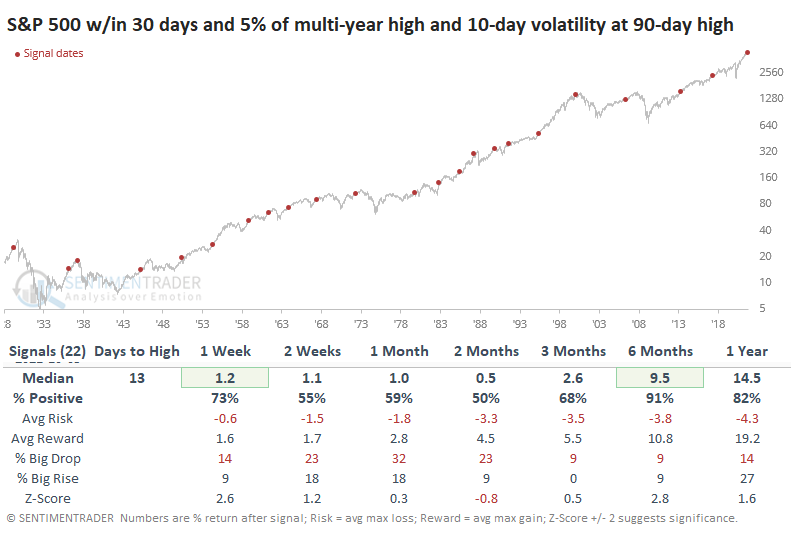
Over the next six months, the index rose after 20 out of 22 signals. More specifically, only one of the signals preceded an imminent bear market, which is what this heightened volatility was supposed to tip us off to. Granted, several of the other signals ultimately led to a protracted decline, but they were months if not years away.
OPTIMISM IS LOW IN STOCKS AND BONDS
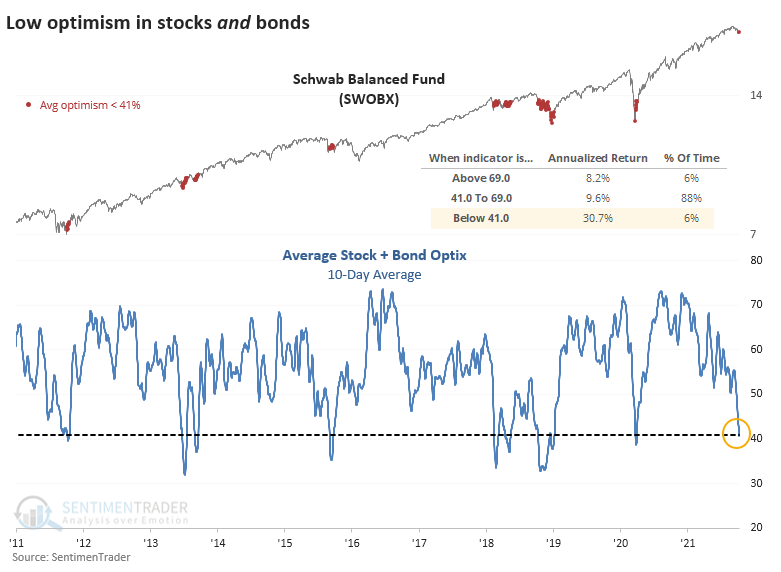
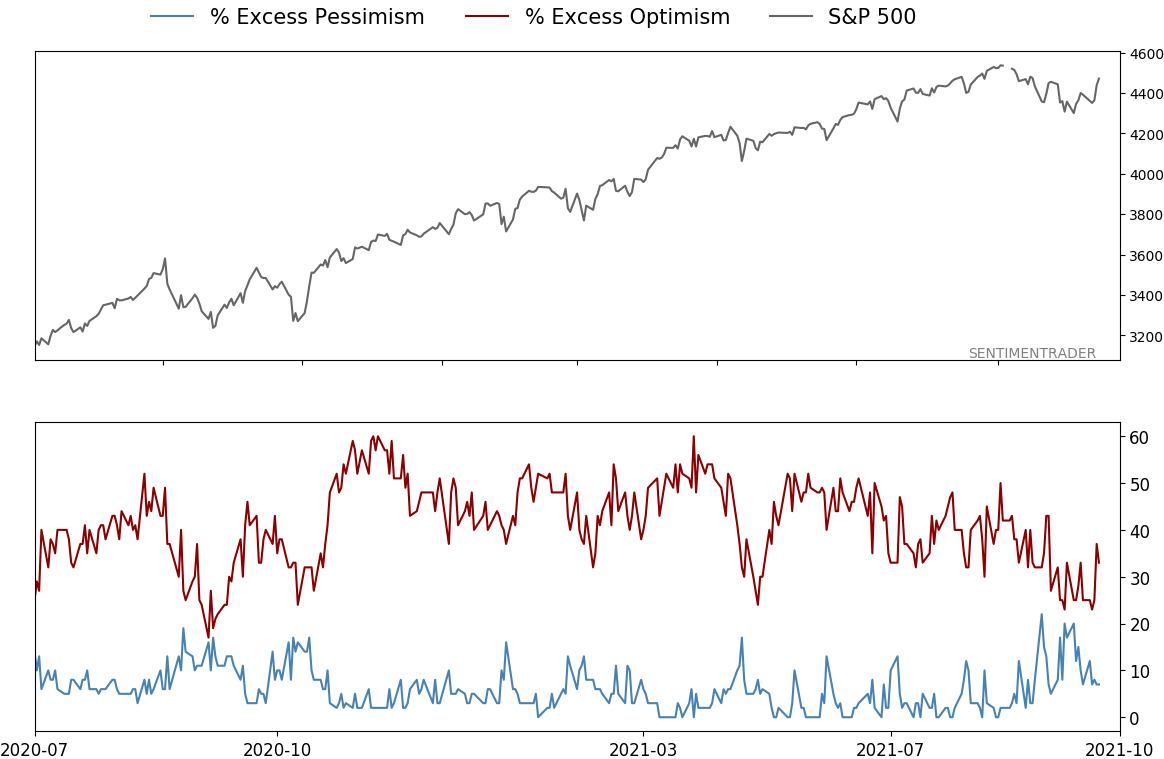
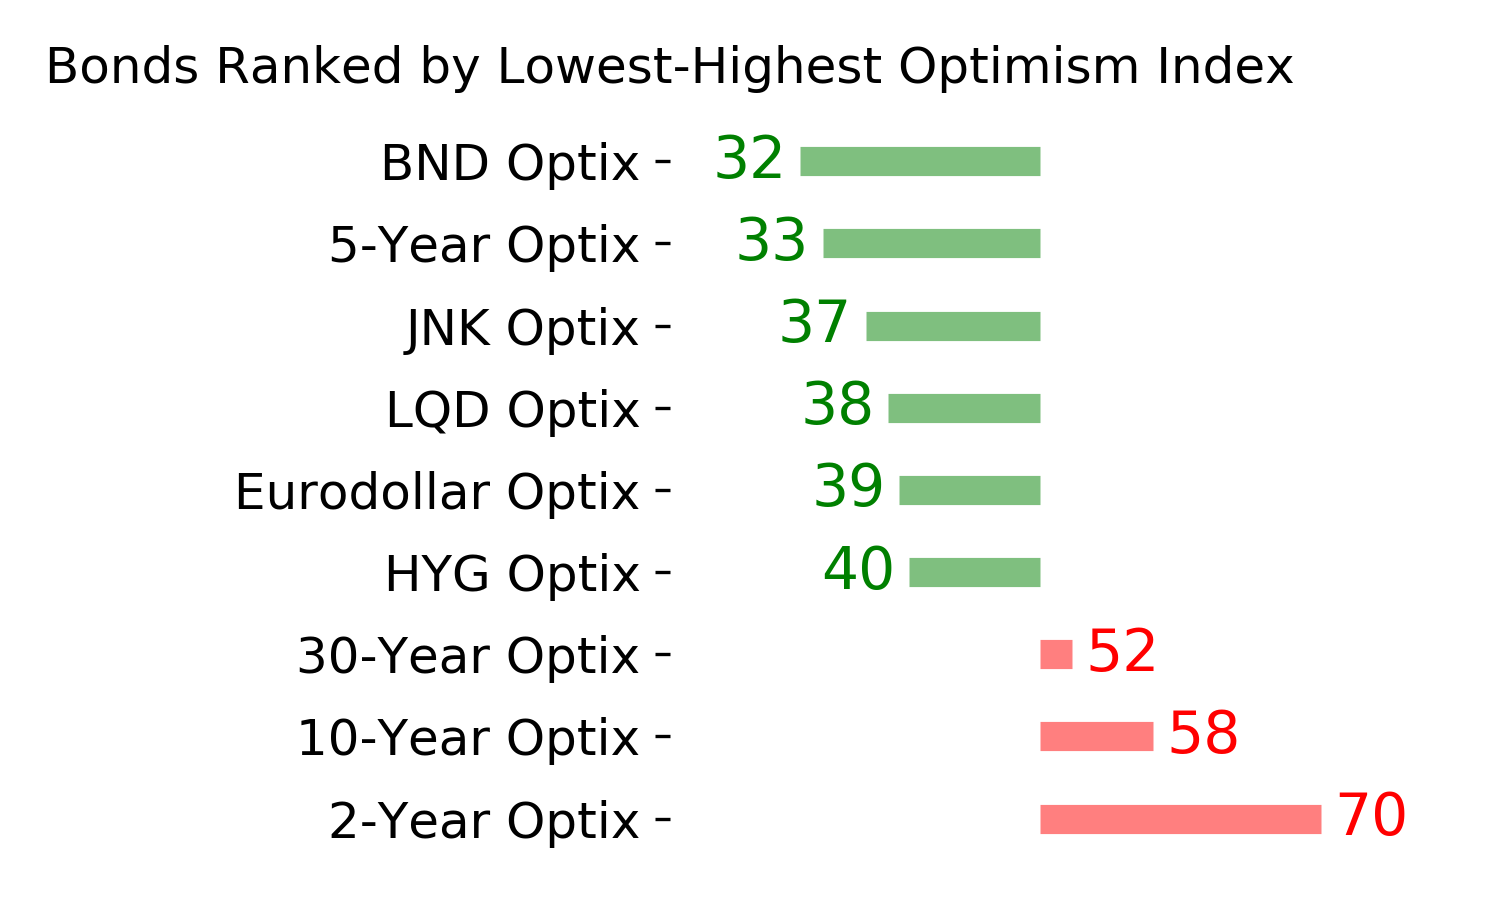
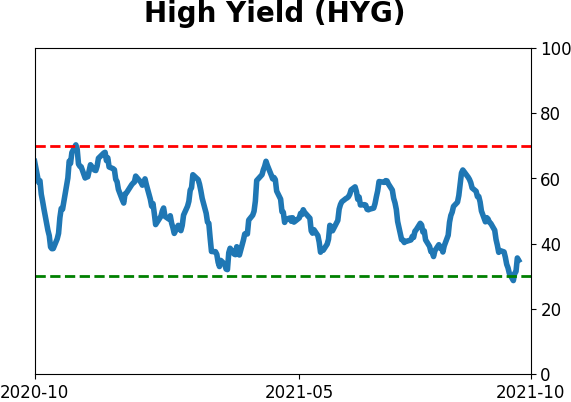
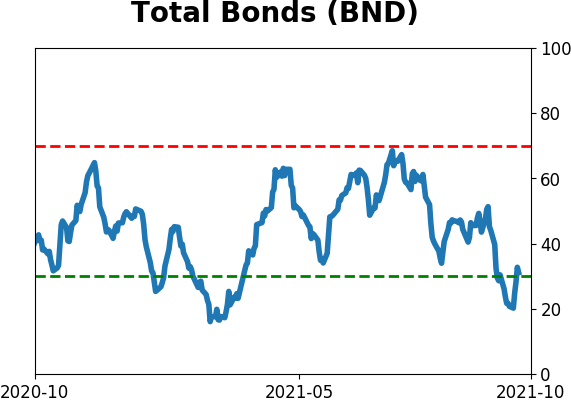
In recent days, sentiment has soured for stocks, and the 10-day average of the Medium-term Optimism Index is nearing a pessimistic extreme. Curiously, investors have not sought the safety of the bond market. The 10-day average Bond Optimism Index has likewise dropped.
The average combined stock and bond optimism is now approaching 40% for one of the few times in the past 20 years. Typically, the markets balance each other, with investors moving to bonds when they're fearful of stocks and vice-versa.
Over the past decade, the annualized return in a balanced equity and bond fund when combined optimism was this low was a hefty +30.7%.
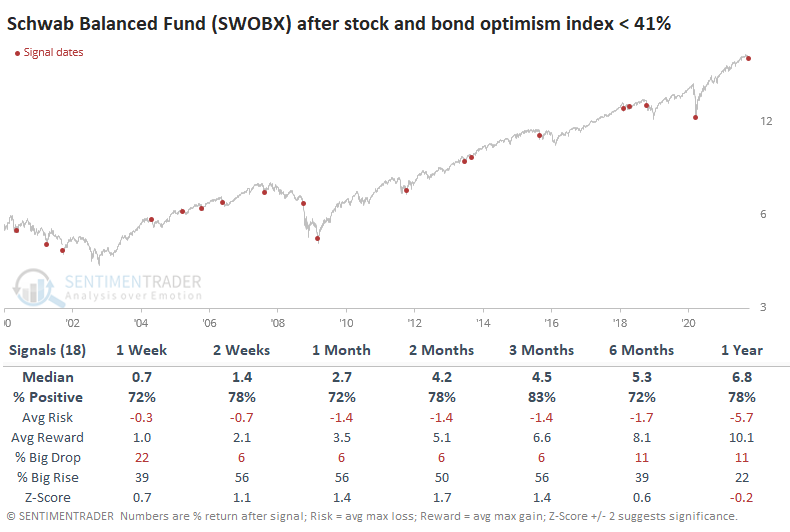
There is a lot of talk about whether the bond market will serve as a buffer against stock volatility in the years ahead. Both markets are objectively overvalued, and if they decline together, then it's going to hurt a whole generation of investors raised on the gospel of a 60/40 balanced portfolio.
Schwab's good, low-fee fund that generally adheres to the 60/40 stock/bond allocation shows that such fears were mostly unfounded. Out of the 18 prior signals, only one preceded a large and sustained decline (global financial crisis). Only 3 signals saw a loss of more than -5% at any point over the next three months, while 10 of them saw a maximum gain of more than +5%.
There is also a concern that action like this will trigger systemic issues due to risk parity funds. These obscure funds, which typically use heavy leverage to place bets on stock and bond markets based on their historical volatility, pop up once in a while as a boogeyman. But in the months after these signals, a risk parity index showed consistent gains, with extremely low risk relative to reward.
There aren't very many opportunities for longer-term investors who try to balance their portfolios broadly by stock and bond allocations when investors in aggregate sour on both markets. While pessimism in either market isn't yet extreme, it's pretty stretched. That's curious given the relatively small losses, but maybe some pessimism makes sense when investors haven't suffered nary a blip for a year.
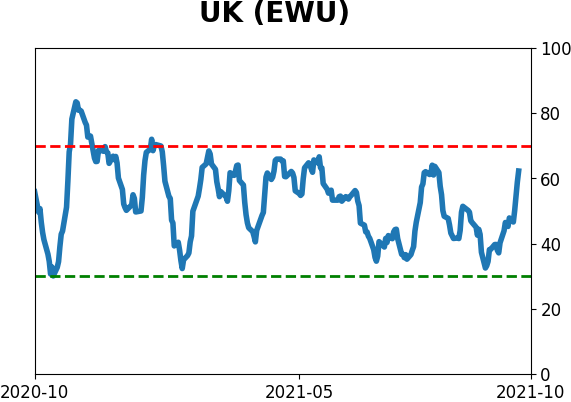
STOCKS AND SECTORS - OVERSEAS STOCKS
Dean updated his absolute and relative trend following indicators for domestic and international ETFs.
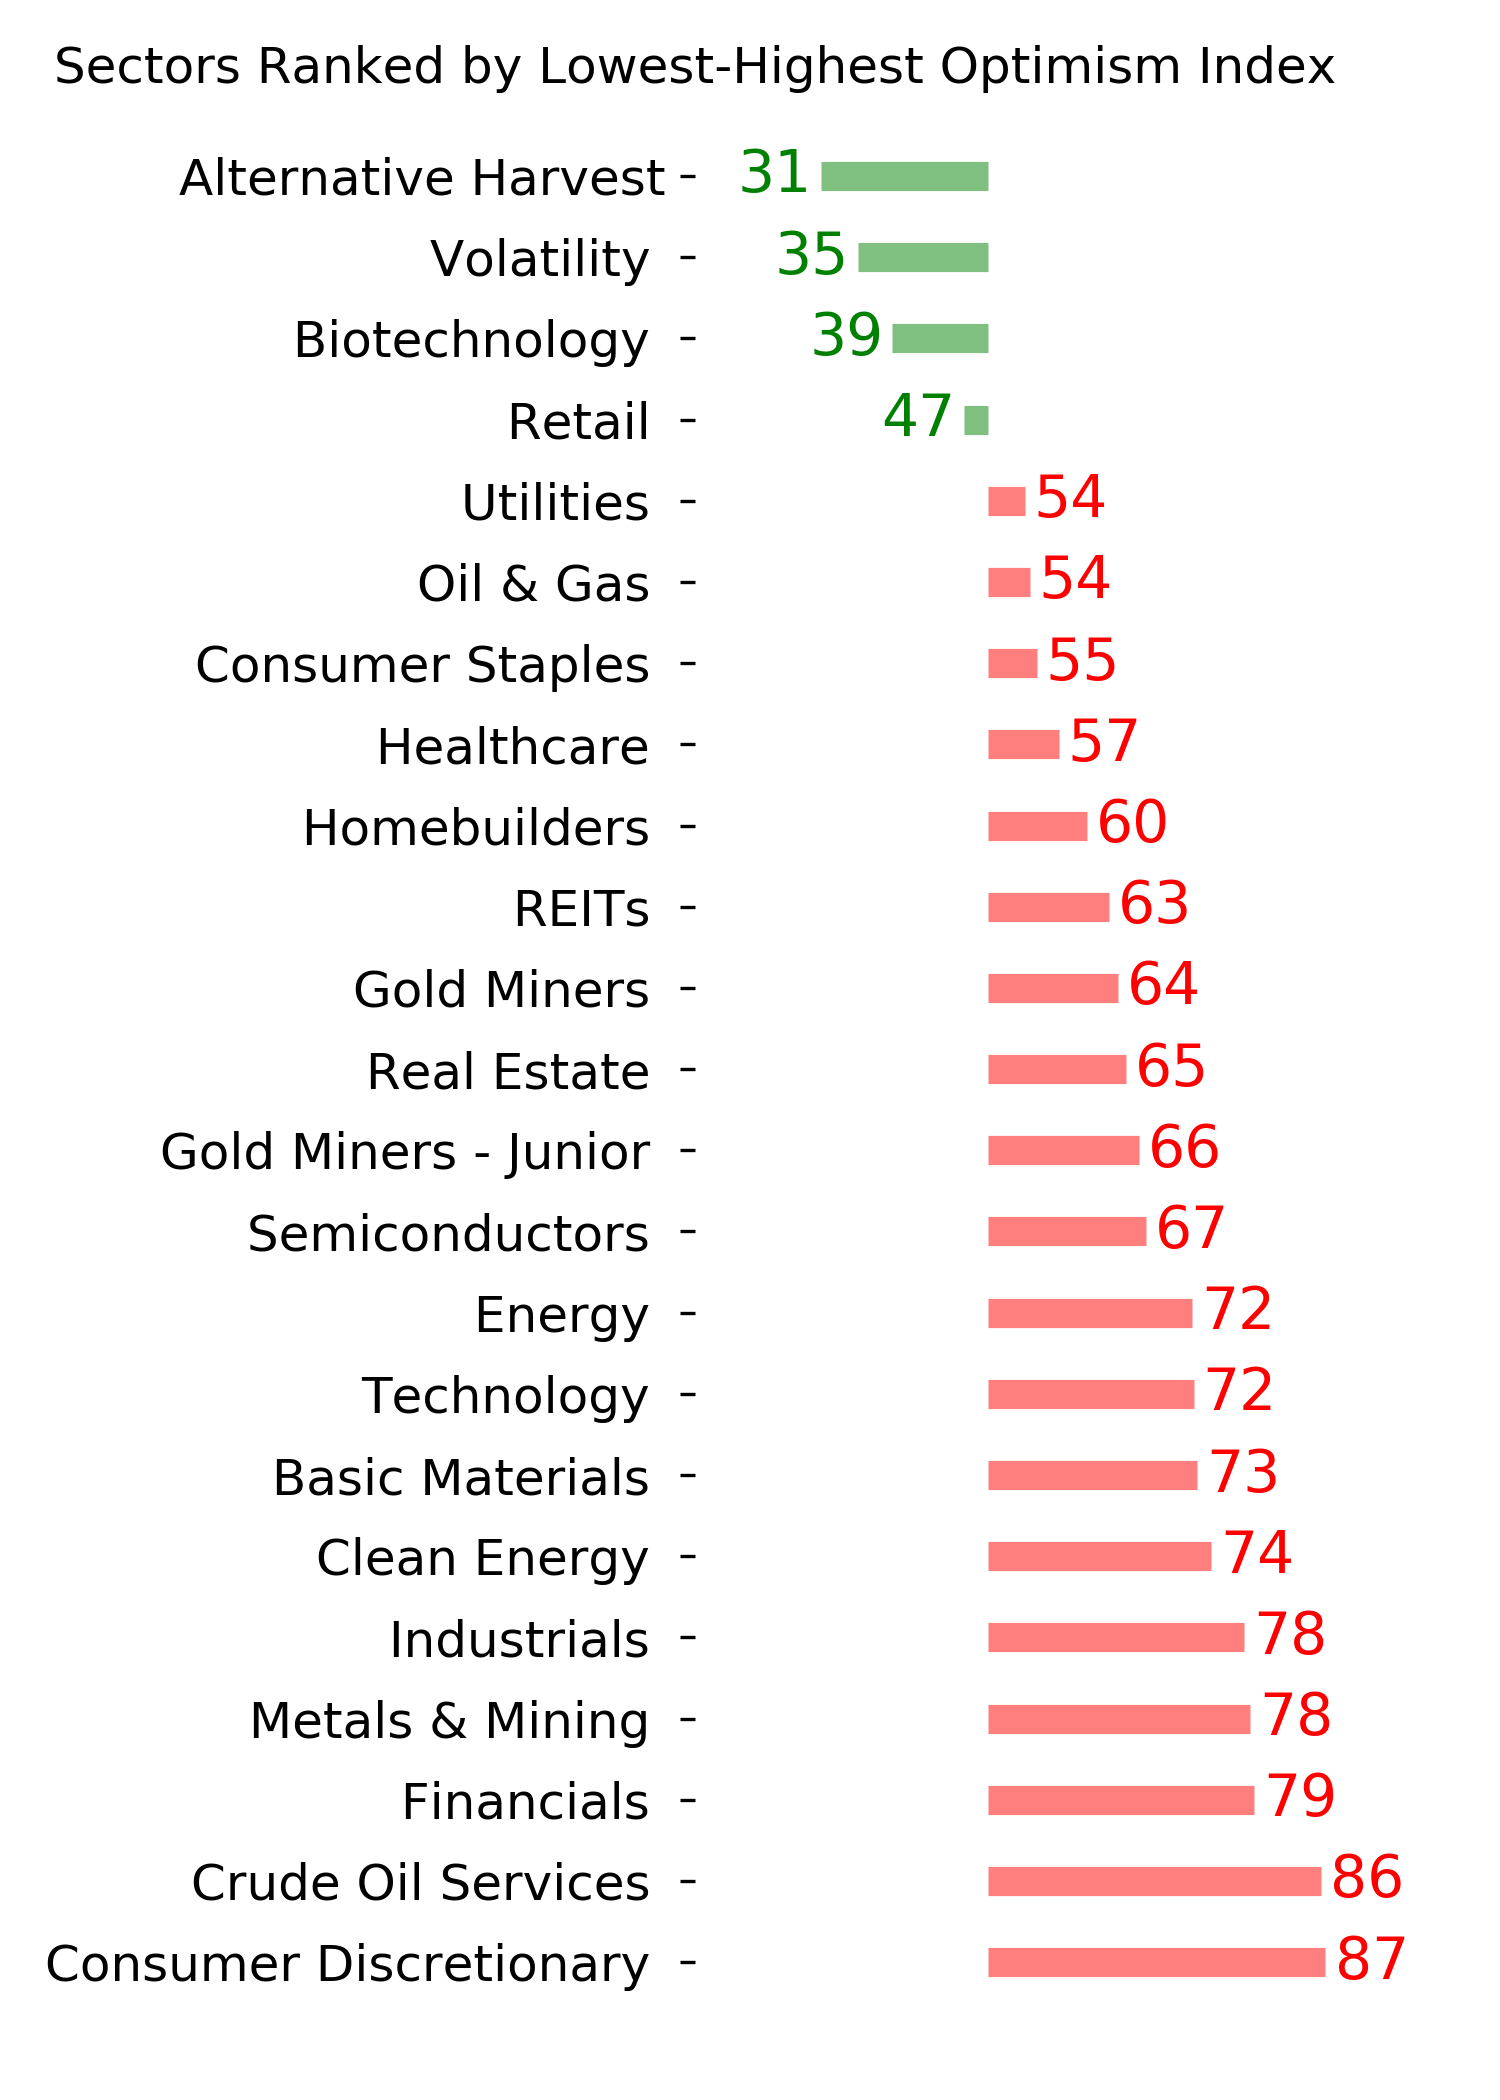
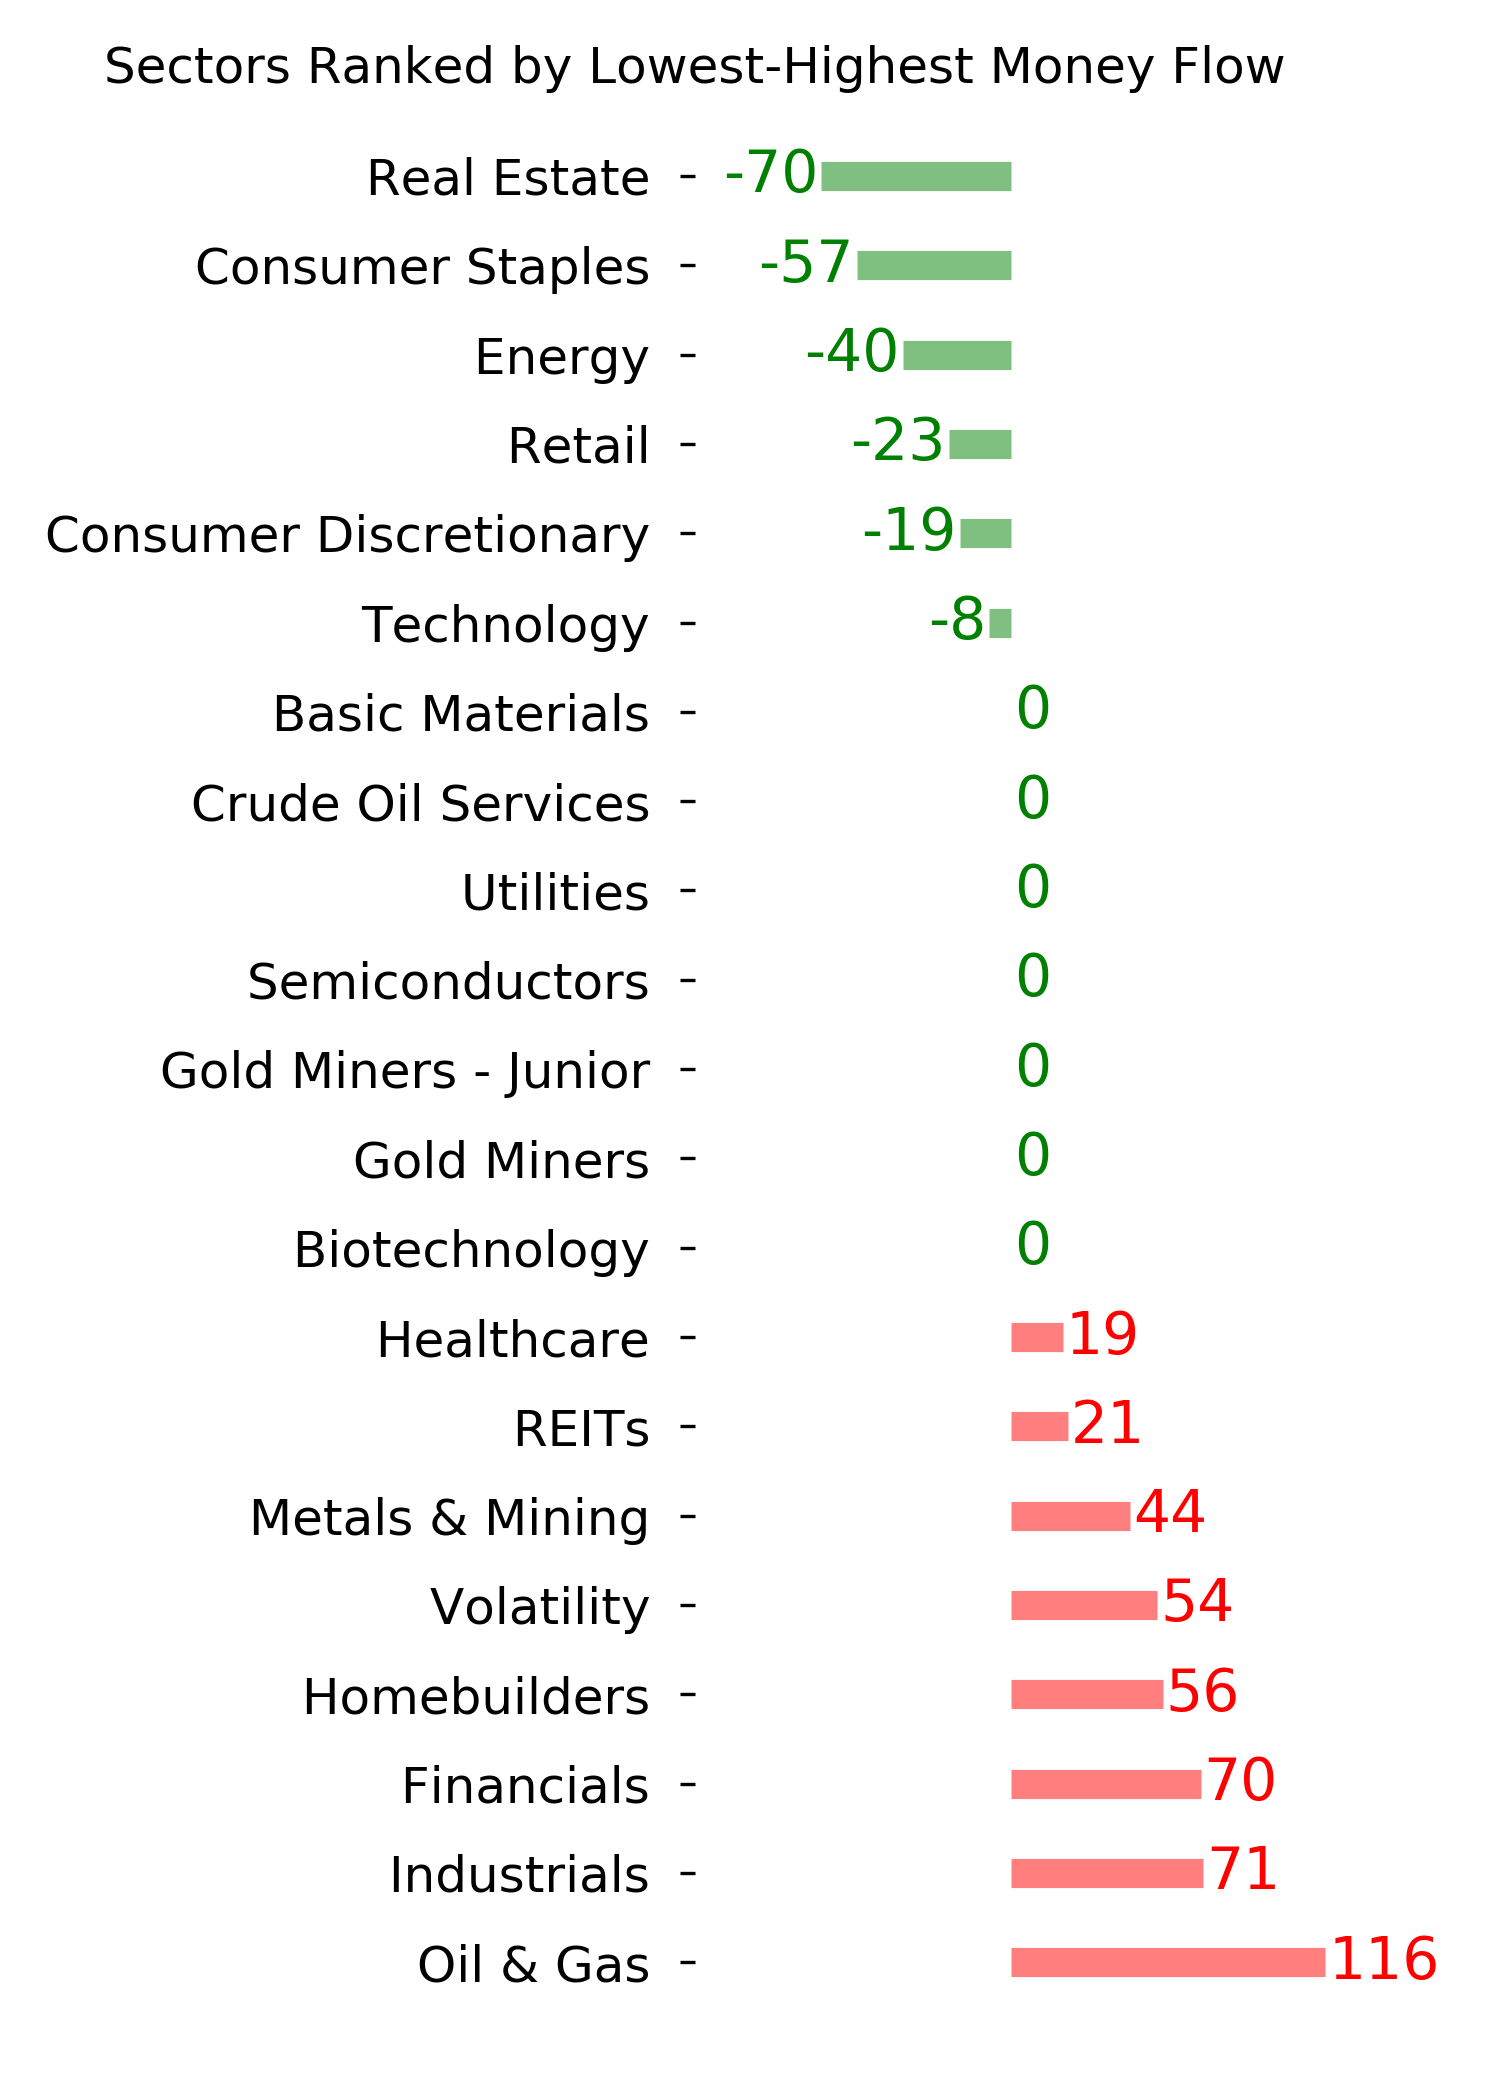
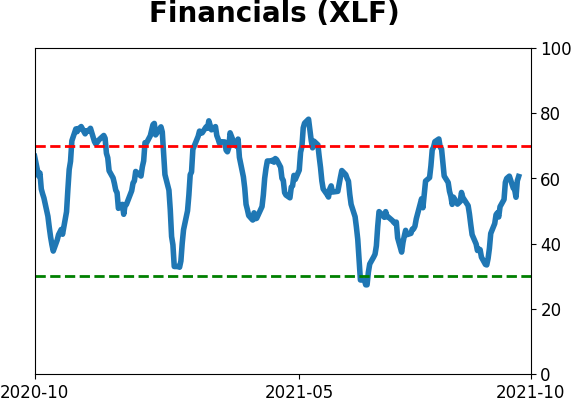
The financials maintain the best absolute and relative trend score combination of any group. And, I would note that the sector registered new relative highs on 3/5 days last week.
While the relative trend score for energy declined slightly, the absolute score remains strong at a ten. The group registered multiple relative highs on the week.
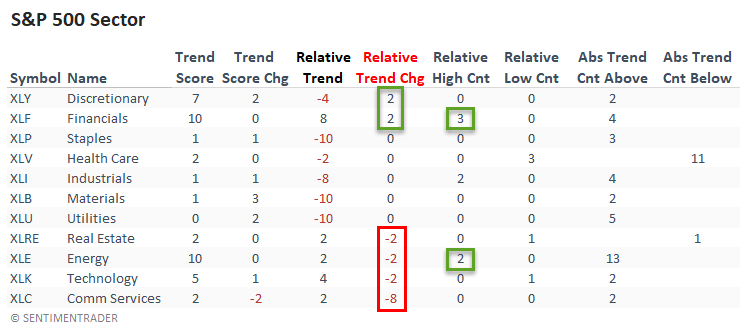
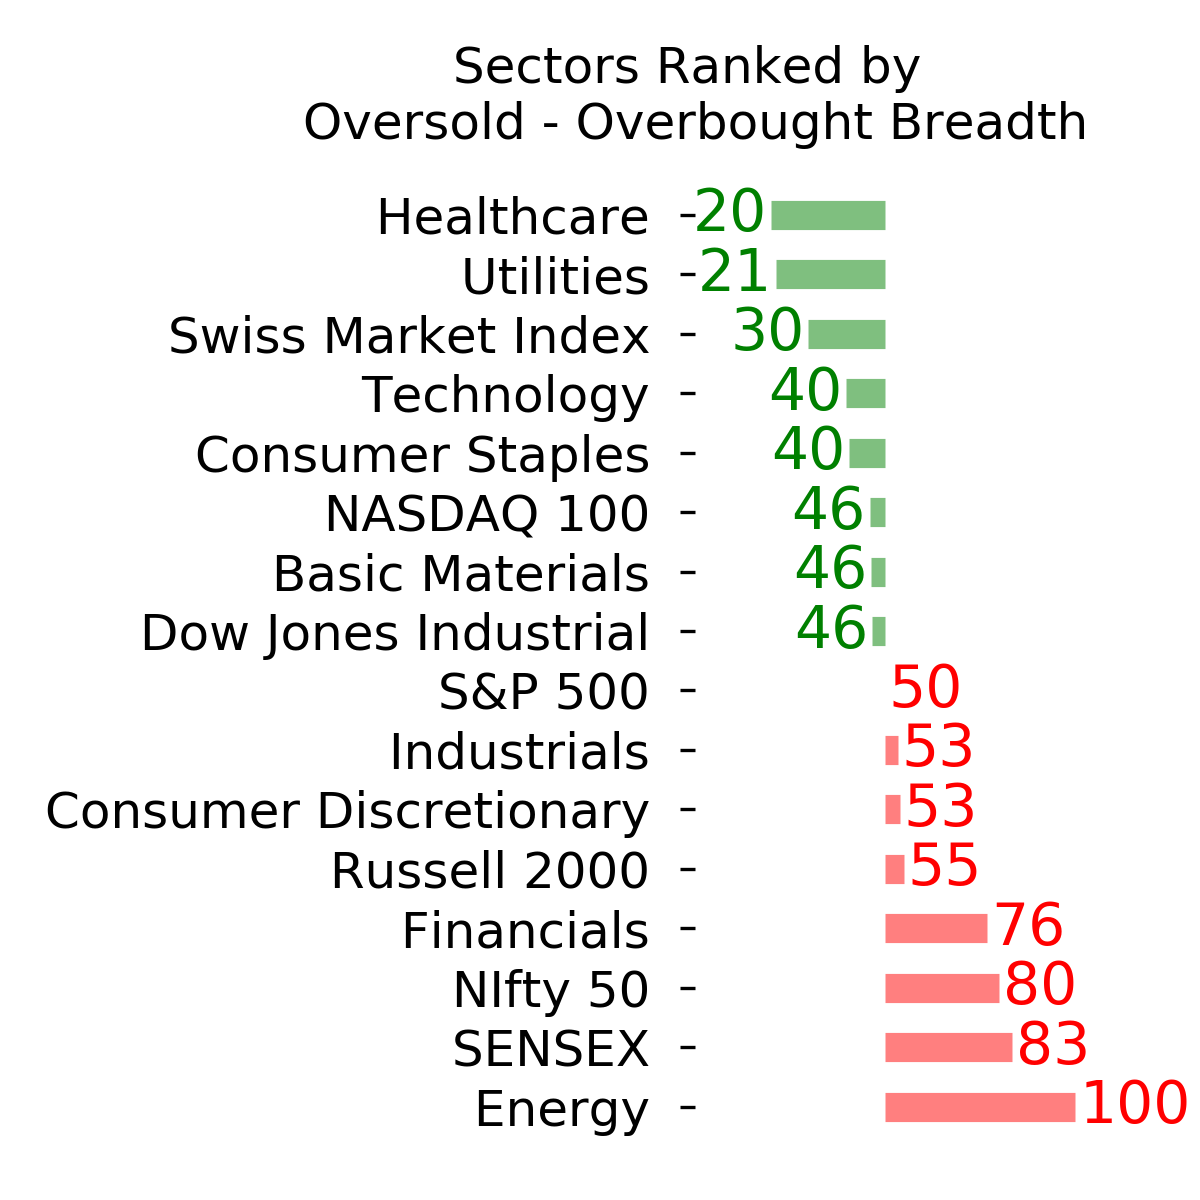
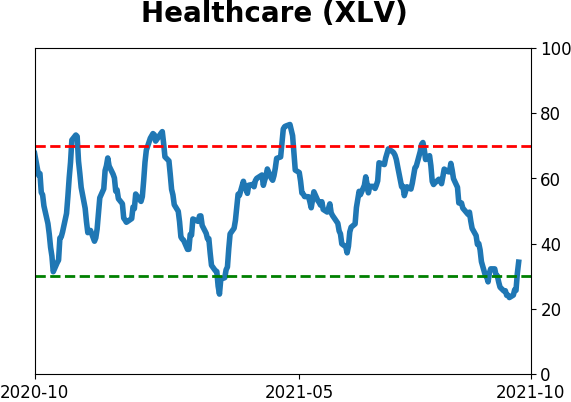
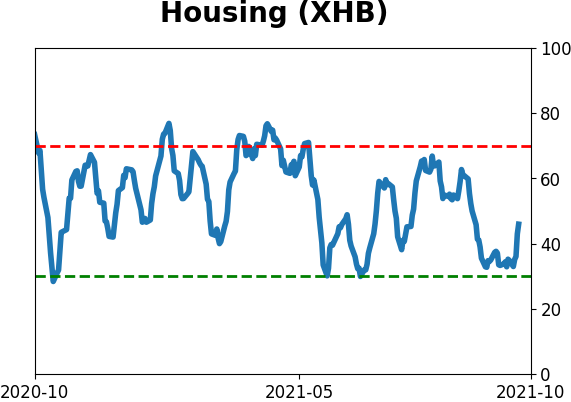
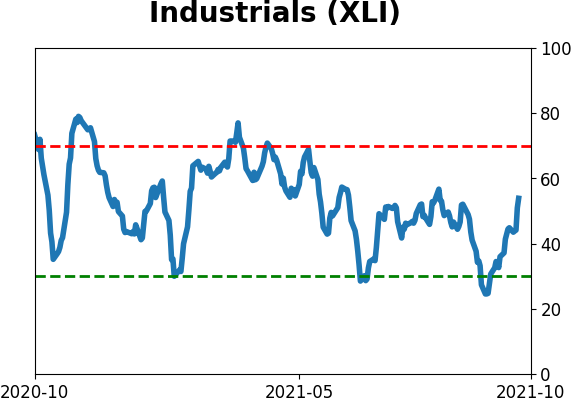
The equal-weighted sector data shows a clear distinction between cyclical/value groups and growth-oriented ones. Financials, Industrials, and energy improved, while technology and health care deteriorated.
The percentage of countries with a positive relative trend score versus the S&P 500 held steady on a w/w basis. Europe and South America deteriorated while the Asia Pacific region improved. The current level continues to suggest an unfavorable environment for the MSCI ACWI World Index ex USA.
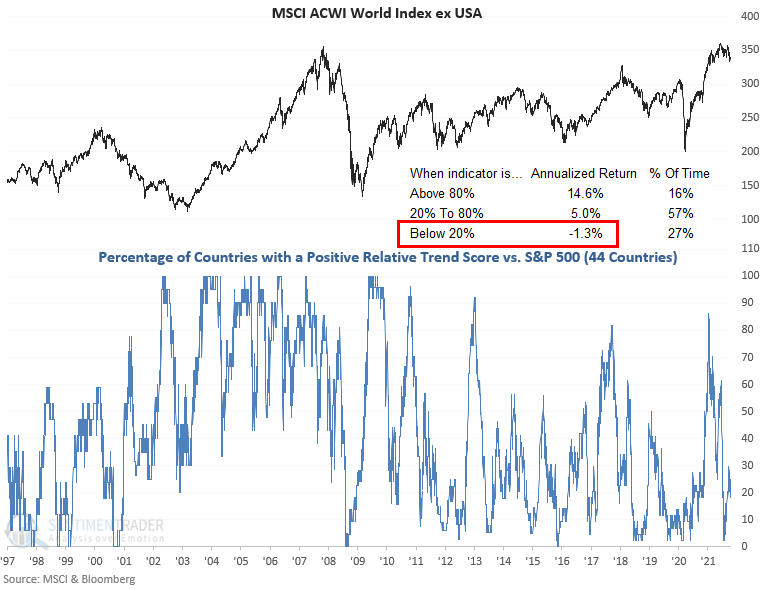
The percentage of countries with a relative trend score of -10 versus the S&P 500 was unchanged on a w/w basis. The Asia Pacific region improved while Europe deteriorated.
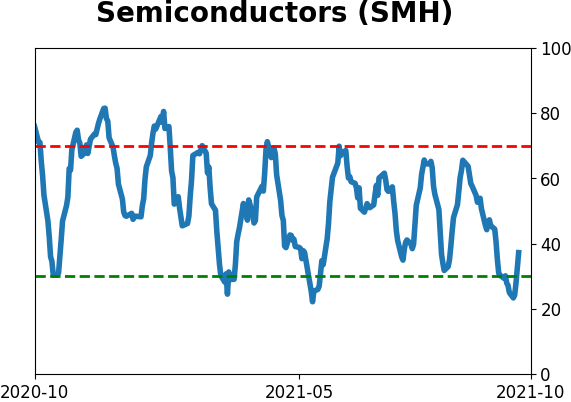
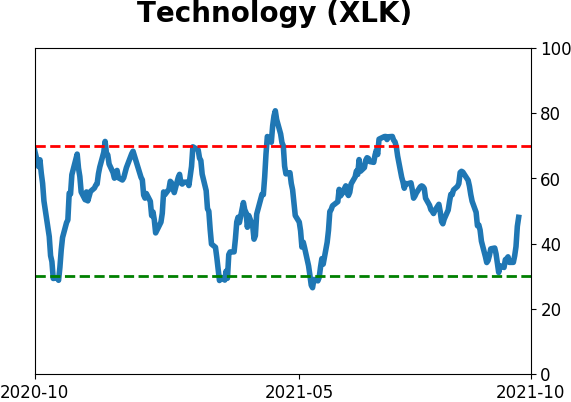
STOCKS AND SECTORS - TECH
Many prognosticators seem to want to be the first to declare that "Tech is Dead," based primarily on the size of their spectacular run in recent years and the excessive valuations for many of the leading stocks in the group.
Nevertheless, at the moment, a few generally reliable indicators are suggesting that the tech sector may have another run left in it. Jay took a closer look.
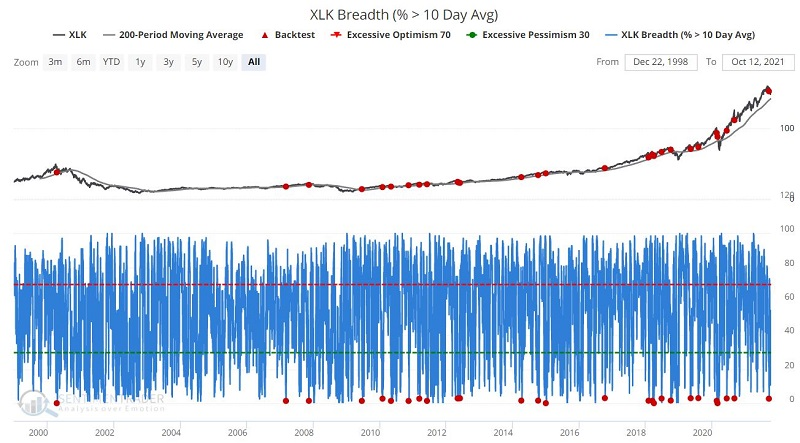
This test identifies those times when the percentage of tech stocks above their 10-day moving averages crosses below 3, with no overlapping signals in the past week, while XLK is trading above its 200-day moving average.
In the simplest terms possible, this test is looking for an internal pullback in an established uptrend.
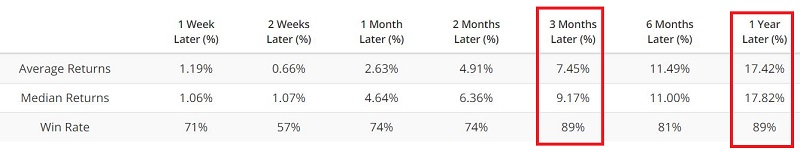
The summary of results appears in the table below. Returns have been solid and consistently favorable three months and 12 months out. The last signal triggered in late September and would remain effective through at least Q4.
In addition, the chart below displays the Annual Seasonal Trend for ticker XLK. As you can see, it is about to enter a seasonally favorable period that extends from Trading Day of Year (TDY) #196 through TDM #214.
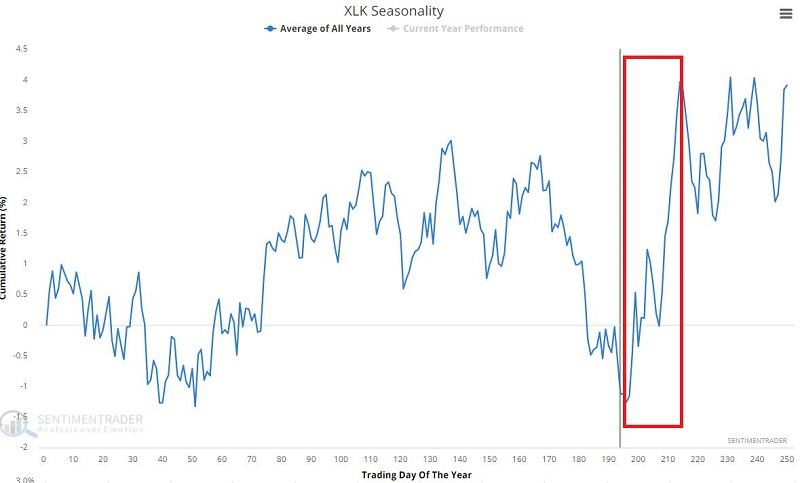
Over the past 22 years, this window showed a positive return 18 times.
STOCKS AND SECTORS - HANG SENG
Chinese stocks have been in the news as several local currency indexes and U.S. dollar-based ETFs have registered significant corrections or outright bear market drawdowns.
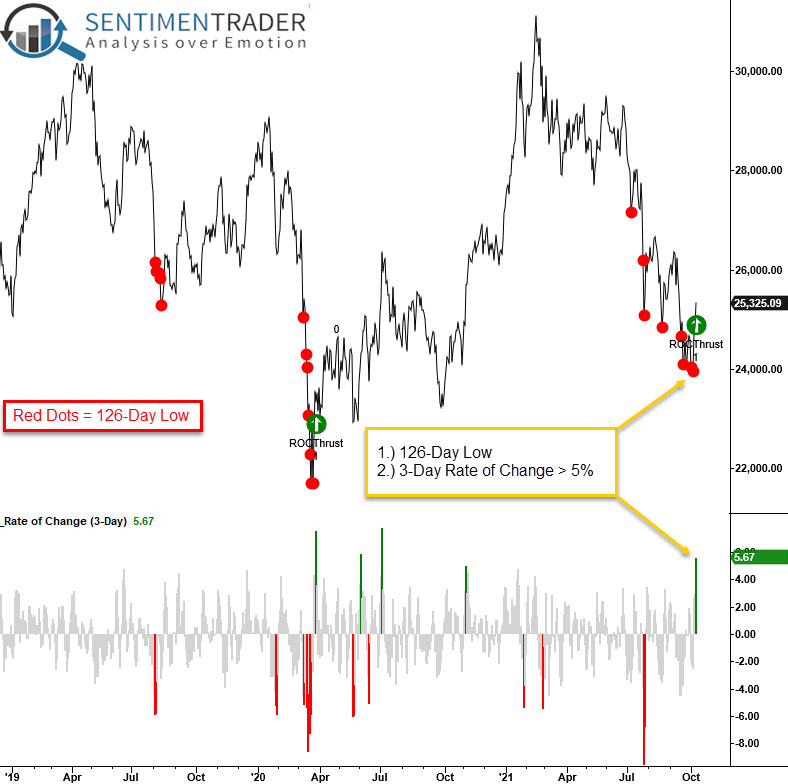
Dean pointed out that over the previous three trading days, the Hang Seng Index has reversed from a 6-month low, with its 3-day rate of change registering a reading of 5.67%.
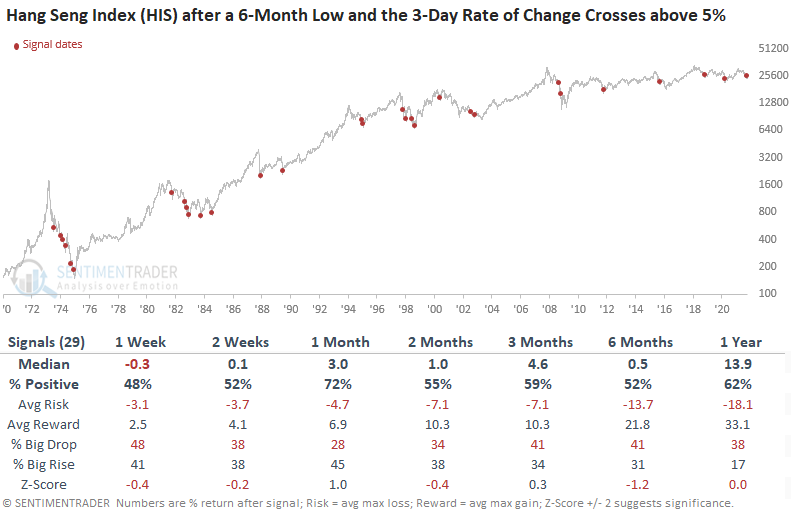
Let's conduct a study to assess the outlook for the Hang Seng (HSI) when the index closes at a 126-day low and subsequently registers a 3-day rate of change surge of greater than 5%.
Results look uninspiring in the first couple of weeks. However, the 1-month window shows some opportunity for a mean reversion trade. The unfavorable signals in the 1-month window mainly occurred during significant global bear market periods, which is not the case now.
STOCKS AND SECTORS - ROKU
Trading opportunities - like beauty - are in the eye of the beholder. Jay looked at ROKU (Roku, Inc.) as an example.
One trader will look at the daily chart below (courtesy of ProfitSource) and see a stock that has just "successfully tested support and is ready for the next leg up."
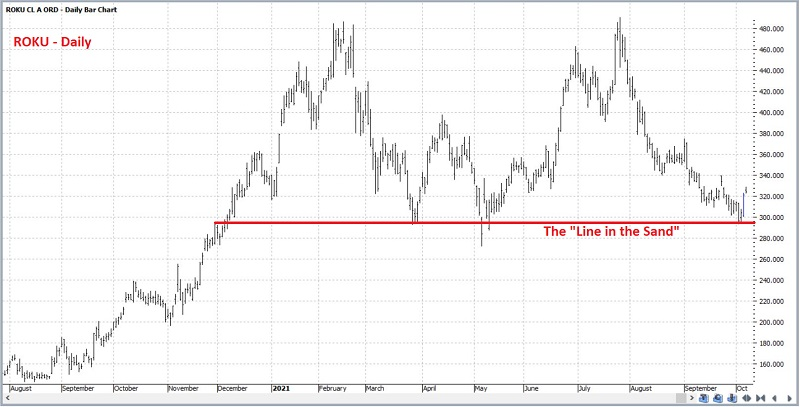
Another trader will look at the weekly chart of Roku and see a stock that "is in the early stages of a long, hard fall."
The problem for many traders is that ROKU is trading at around $325 a share. So, to buy 100 shares of stock requires a commitment of roughly $32,500. Likewise, selling short 100 shares of ROKU would involve a hefty sum of margin (not to mention the assumption of unlimited risk). So, let's consider alternatives for both scenarios.
Our example bullish trade involves:
- Buying 2 ROKU Dec17 300 calls @ $41.10
- Selling 2 ROKU Dec17 405 calls @ $6.05
The risk curves appear in the screenshots below (courtesy of Optionsanalysis).
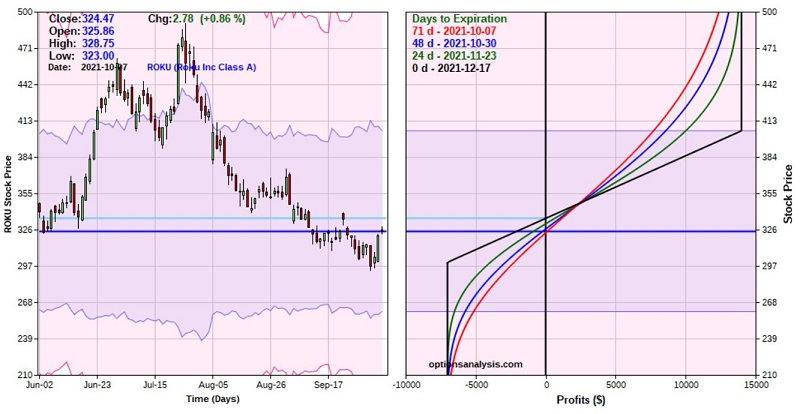
- This trade has 71 days left until expiration at the time of entry, so a trader MUST expect ROKU to move higher in the next 2+ months.
- Buying a 2 lot gives this trade a delta of 100. This means that (for now) this position will behave like a position holding 100 shares of ROKU, however...
- The cost to enter this trade is $7,010 versus $32,447 to buy 100 shares of ROKU stock.
Our example bearish trade involves:
- Buying 3 ROKU Mar18 300 puts @ $28.95
- Selling 3 ROKU Mar18 200 puts @ $3.47
The risk curves appear in the screenshots below (courtesy of Optionsanalysis).
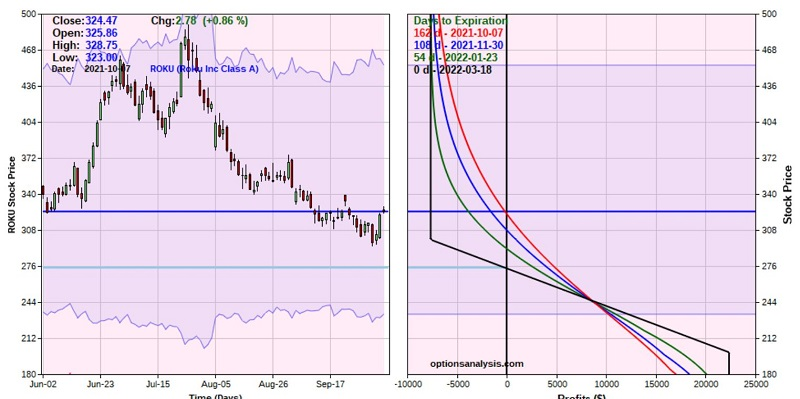
- This trade has 162 days left until expiration at the time of entry - so the trader has almost 5 months for ROKU to make a move
- Buying a 3 lot gives this trade a delta of -82.93. This means that (for now) this position will behave like a position holding short 83 shares of ROKU. The cost to enter this trade with a 3-lot is $7,644.
- The maximum profit potential is $22,356 (if ROKU is below $200 a share at March 2022 option expiration).
Will either of these trades make money? I can't say. They are not presented as "hot trades" of the "you can't lose trading options" variety (as if there was such a thing). But each trade represents a potential opportunity for a trader:
- With a specific outlook for ROKU (bullish or bearish)
- Who does not want to or cannot afford to commit the capital to trade 100 shares of stock
- Desires limited, predefined risk
| BONDS | ||
 | ||
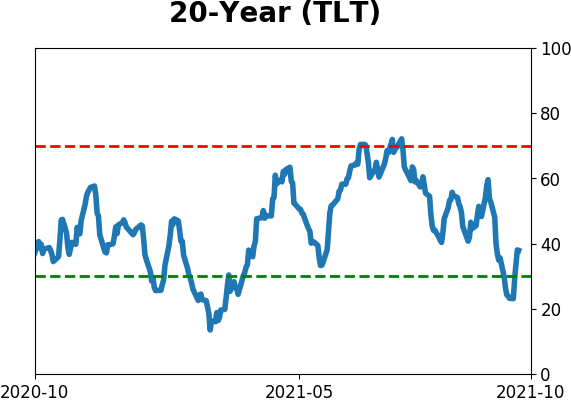
A lot of doubt and fear has crept into the bond market of late (see above). This is not surprising given that interest rates are still near all-time lows, and inflation is relatively high and a cause of major concern for fixed-income investors.
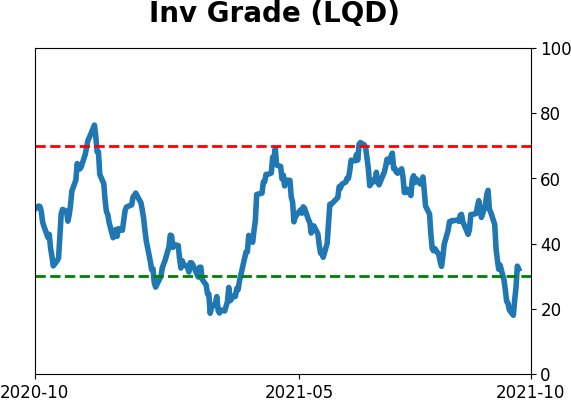
Still, at least two factors are flashing signs of hope for investment-grade corporate bonds in the months ahead.
The test below looks at investor sentiment for ticker LQD (iShares iBoxx $ Investment Grade Corporate Bond ETF) and identifies those times when the 10-period moving average of LQD Optix crosses below 20, which just triggered.
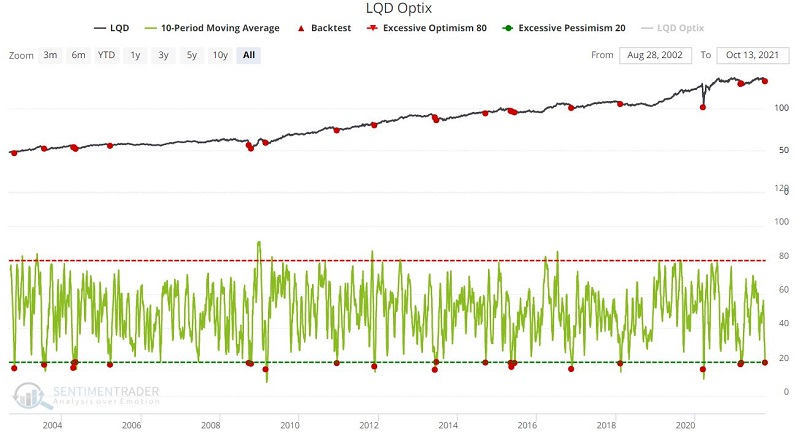
The table below displays a summary of the results.
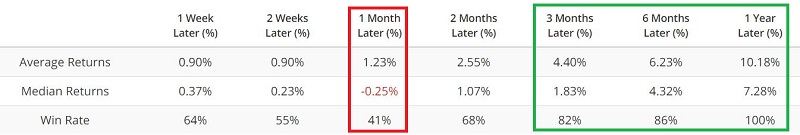
As you can see, investment-grade bond performance is so-so in the first month after a new Optix signal. After that, however, results improve significantly.
In addition, the historical seasonal tendency of investment-grade corporate bonds is positive from now through early next year. The (approximately) next 90 trading days in total return data for ticker FBNDX (Fidelity Investment Grade Bond Fund) have shown a postiive return 33 out of 41 years.
| COMMODITIES | ||
 | ||
Zinc, an industrial metal used to galvanize other metals to prevent rusting, closed at a new 252-day this week. And, the 5-day rate of change crossed above 8%.
Dean conducted a study to assess the outlook for the metal, stocks, and bonds when zinc surges to a new high. Our study will identify historical instances when zinc closed at a 252-day, and the 5-day rate of change is 8% or greater.
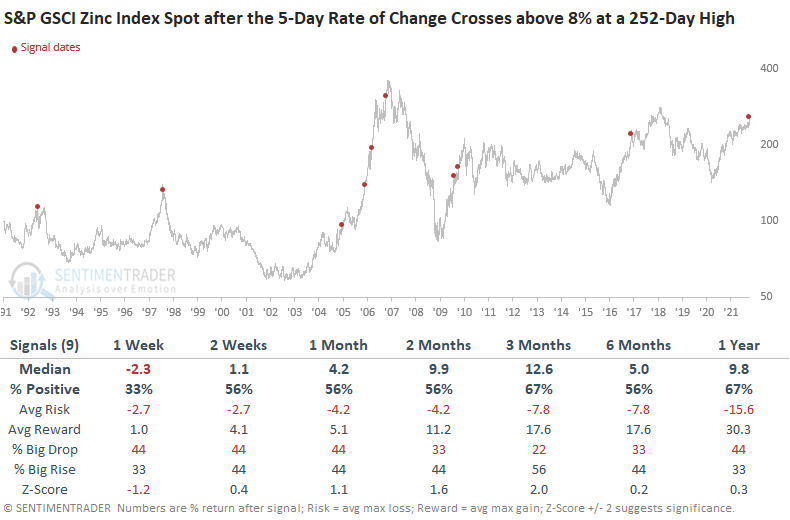
Results look weak in the short-term, which should not be a surprise after a sharp move higher. The 2-12 month time frames look better, especially since 2005. This should be in the plus column if you're in the camp that industrial metals have embarked upon a new bull market; an infrastructure deal from the folks in Washington wouldn't hurt.
After these surges in zinc, the S&P 500 mostly showed positive short- to medium-term returns while 10-year Treasury note futures showed mostly weaker returns.
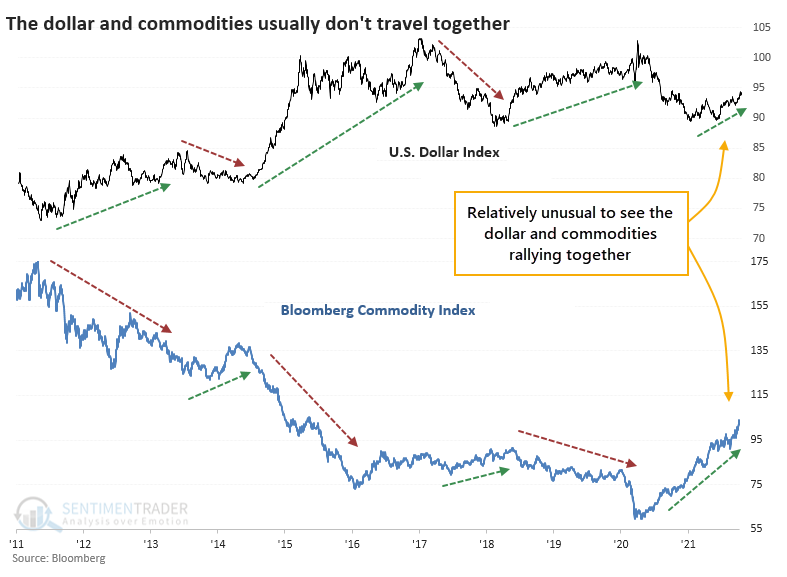
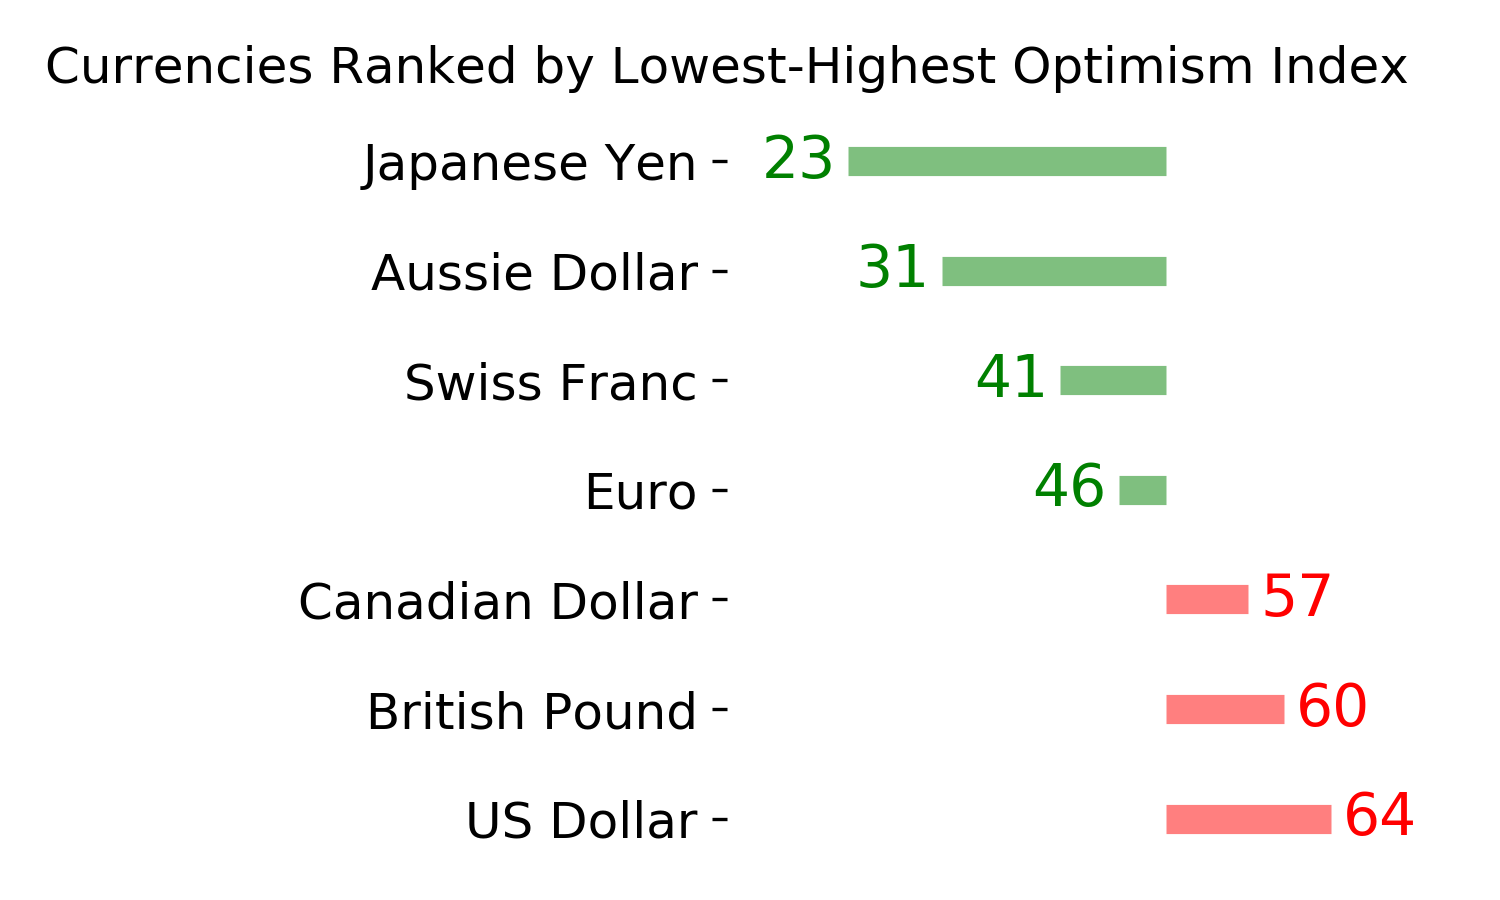
COMMODITIES ARE RALLYING WITH THE DOLLAR
Among all the breakdowns in historical relationships during 2021, one of the most unusual is that commodities continue to scream higher despite a rising U.S. dollar.
That's not the usual relationship between the two assets. Over the past decade, the two have roughly traveled in opposite directions during big trend swings. A rising dollar has typically meant falling commodities, and vice-versa. At least, that was the case until 2021.
Going back to 1975, there have been a dozen instances when the dollar rallied at least 4.5% over a 90-day window and the Bloomberg Commodity Index more than doubled that return, rallying at least 9%.
Despite a trend that mostly points down over the decades, the dollar tended to rise after these periods, with well-above-average returns.
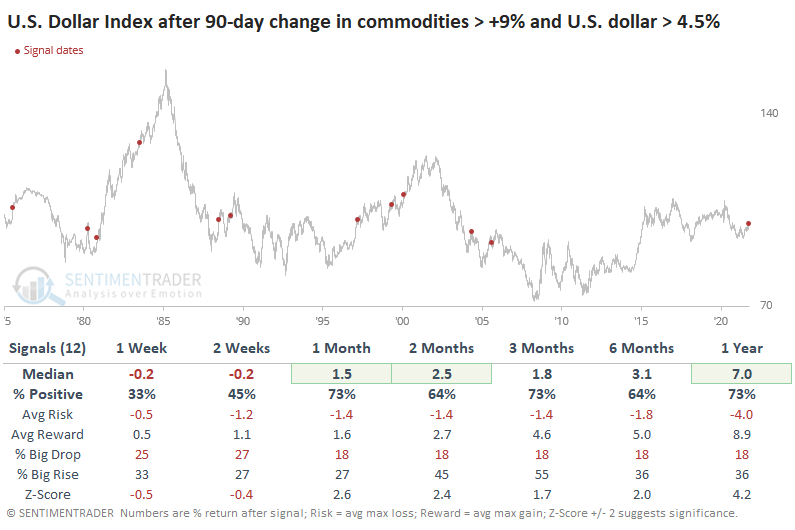
It was a different sign for commodities. They had a much more difficult time continuing to buck the headwind of a rising dollar with only a 36% win rate over the next 2-3 months.
The next couple of weeks should tell us a lot about the trends in the dollar and commodities. Usually, when both have rallied as much as they have lately, how investors behave in the weeks ahead says quite a bit about their appetite for the long-term trends in each. If they keep pushing into the dollar, it will likely mean a much tougher row to hoe for commodities in the months ahead.
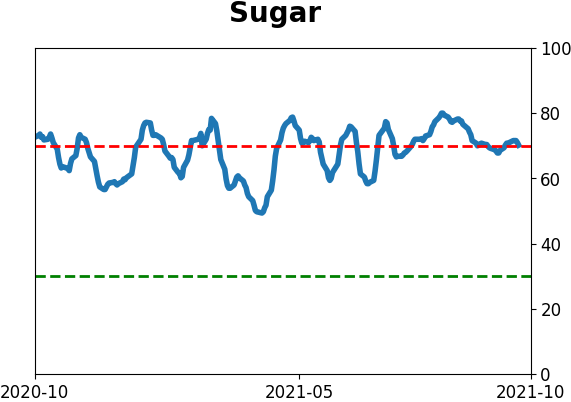
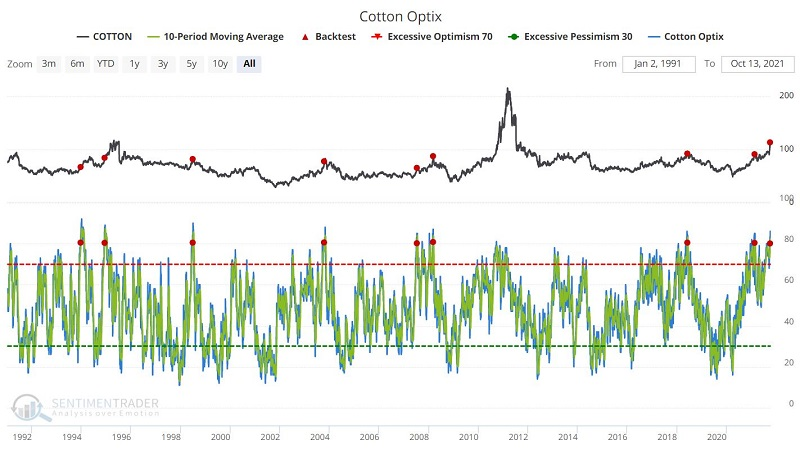
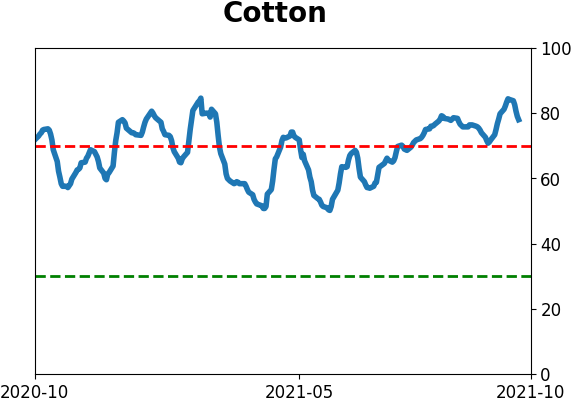
COTTON TRADERS HAVE BECOME TOO OPTIMISTIC
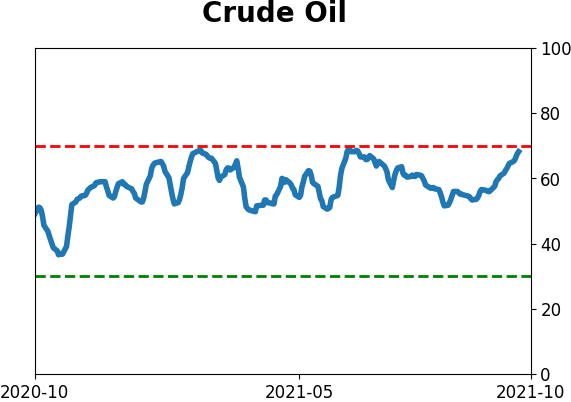
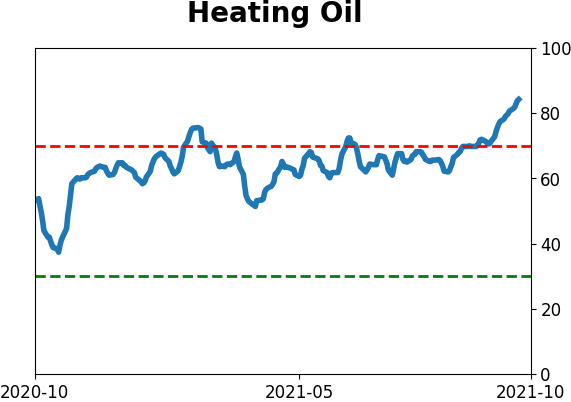
Jay pointed out that although many people use cotton, only a handful of people ever "trade" cotton. Still, the topic of soaring commodity prices has become a thing in the past 12 months (to wit, lumber, crude oil, coffee, natural gas, lithium, uranium, corn, and soybeans, etc.).
As a result, optimism toward the contract has soared.
In the following test of Cotton Optix, we look for those times when the 10-day moving average for Cotton Optix crossed above 80, as it did this week. In a nutshell, we are looking for a sustained period of extreme optimism regarding cotton.
The summary of results appears in the table below.
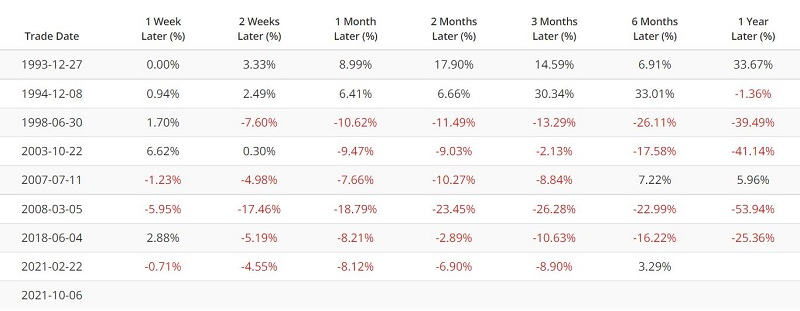
As you can see in the table, results in the ensuing 12 months have been relatively poor but each event is its own roll of the dice.
It is OK to believe that cotton may weaken in the months ahead; it is NOT OK to blindly sell short cotton without implementing proper risk control.
Active Studies
|
|
|
|
|
|
Indicators at Extremes
|
|
|
Portfolio
|
|
|
|
Phase Table
|
|
|
Ranks
|
|
|
|
|
|
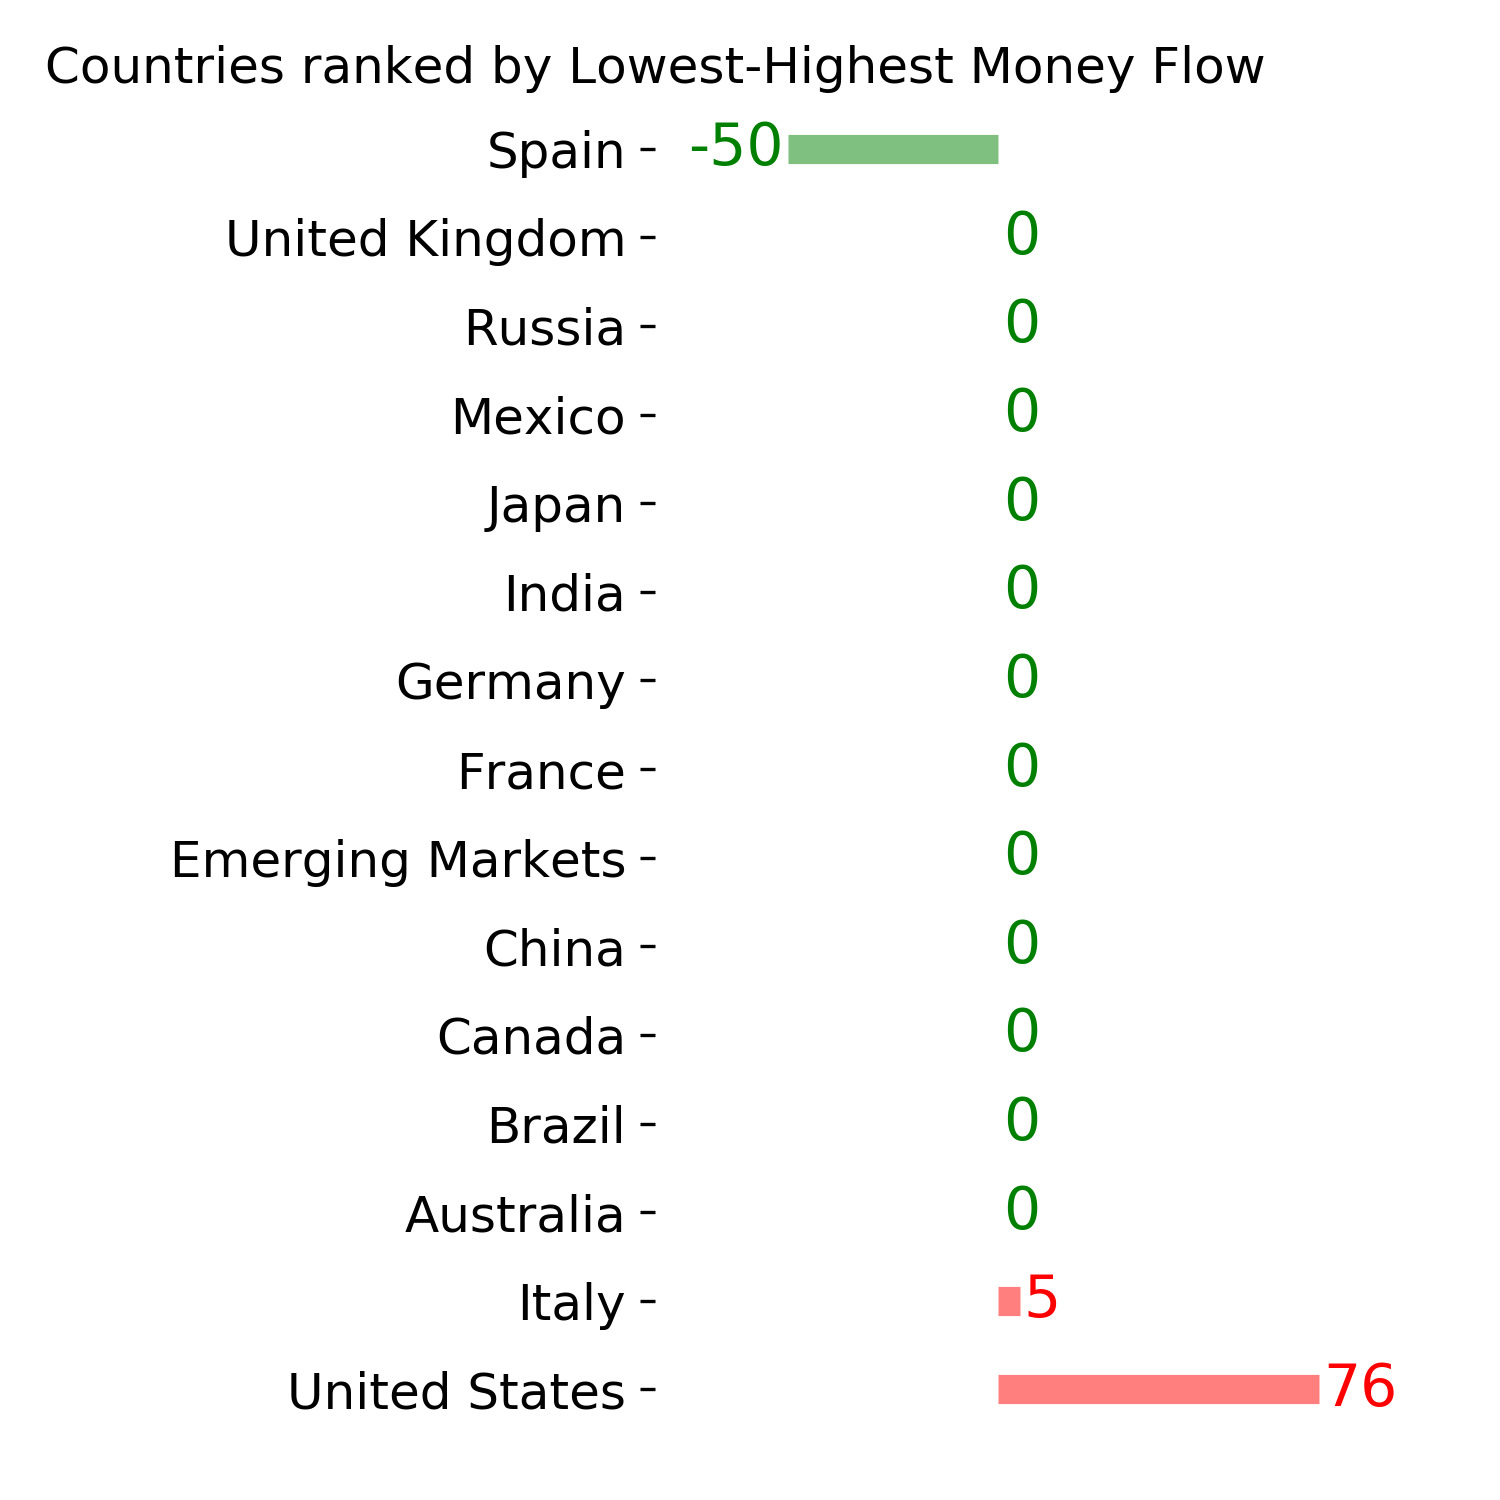
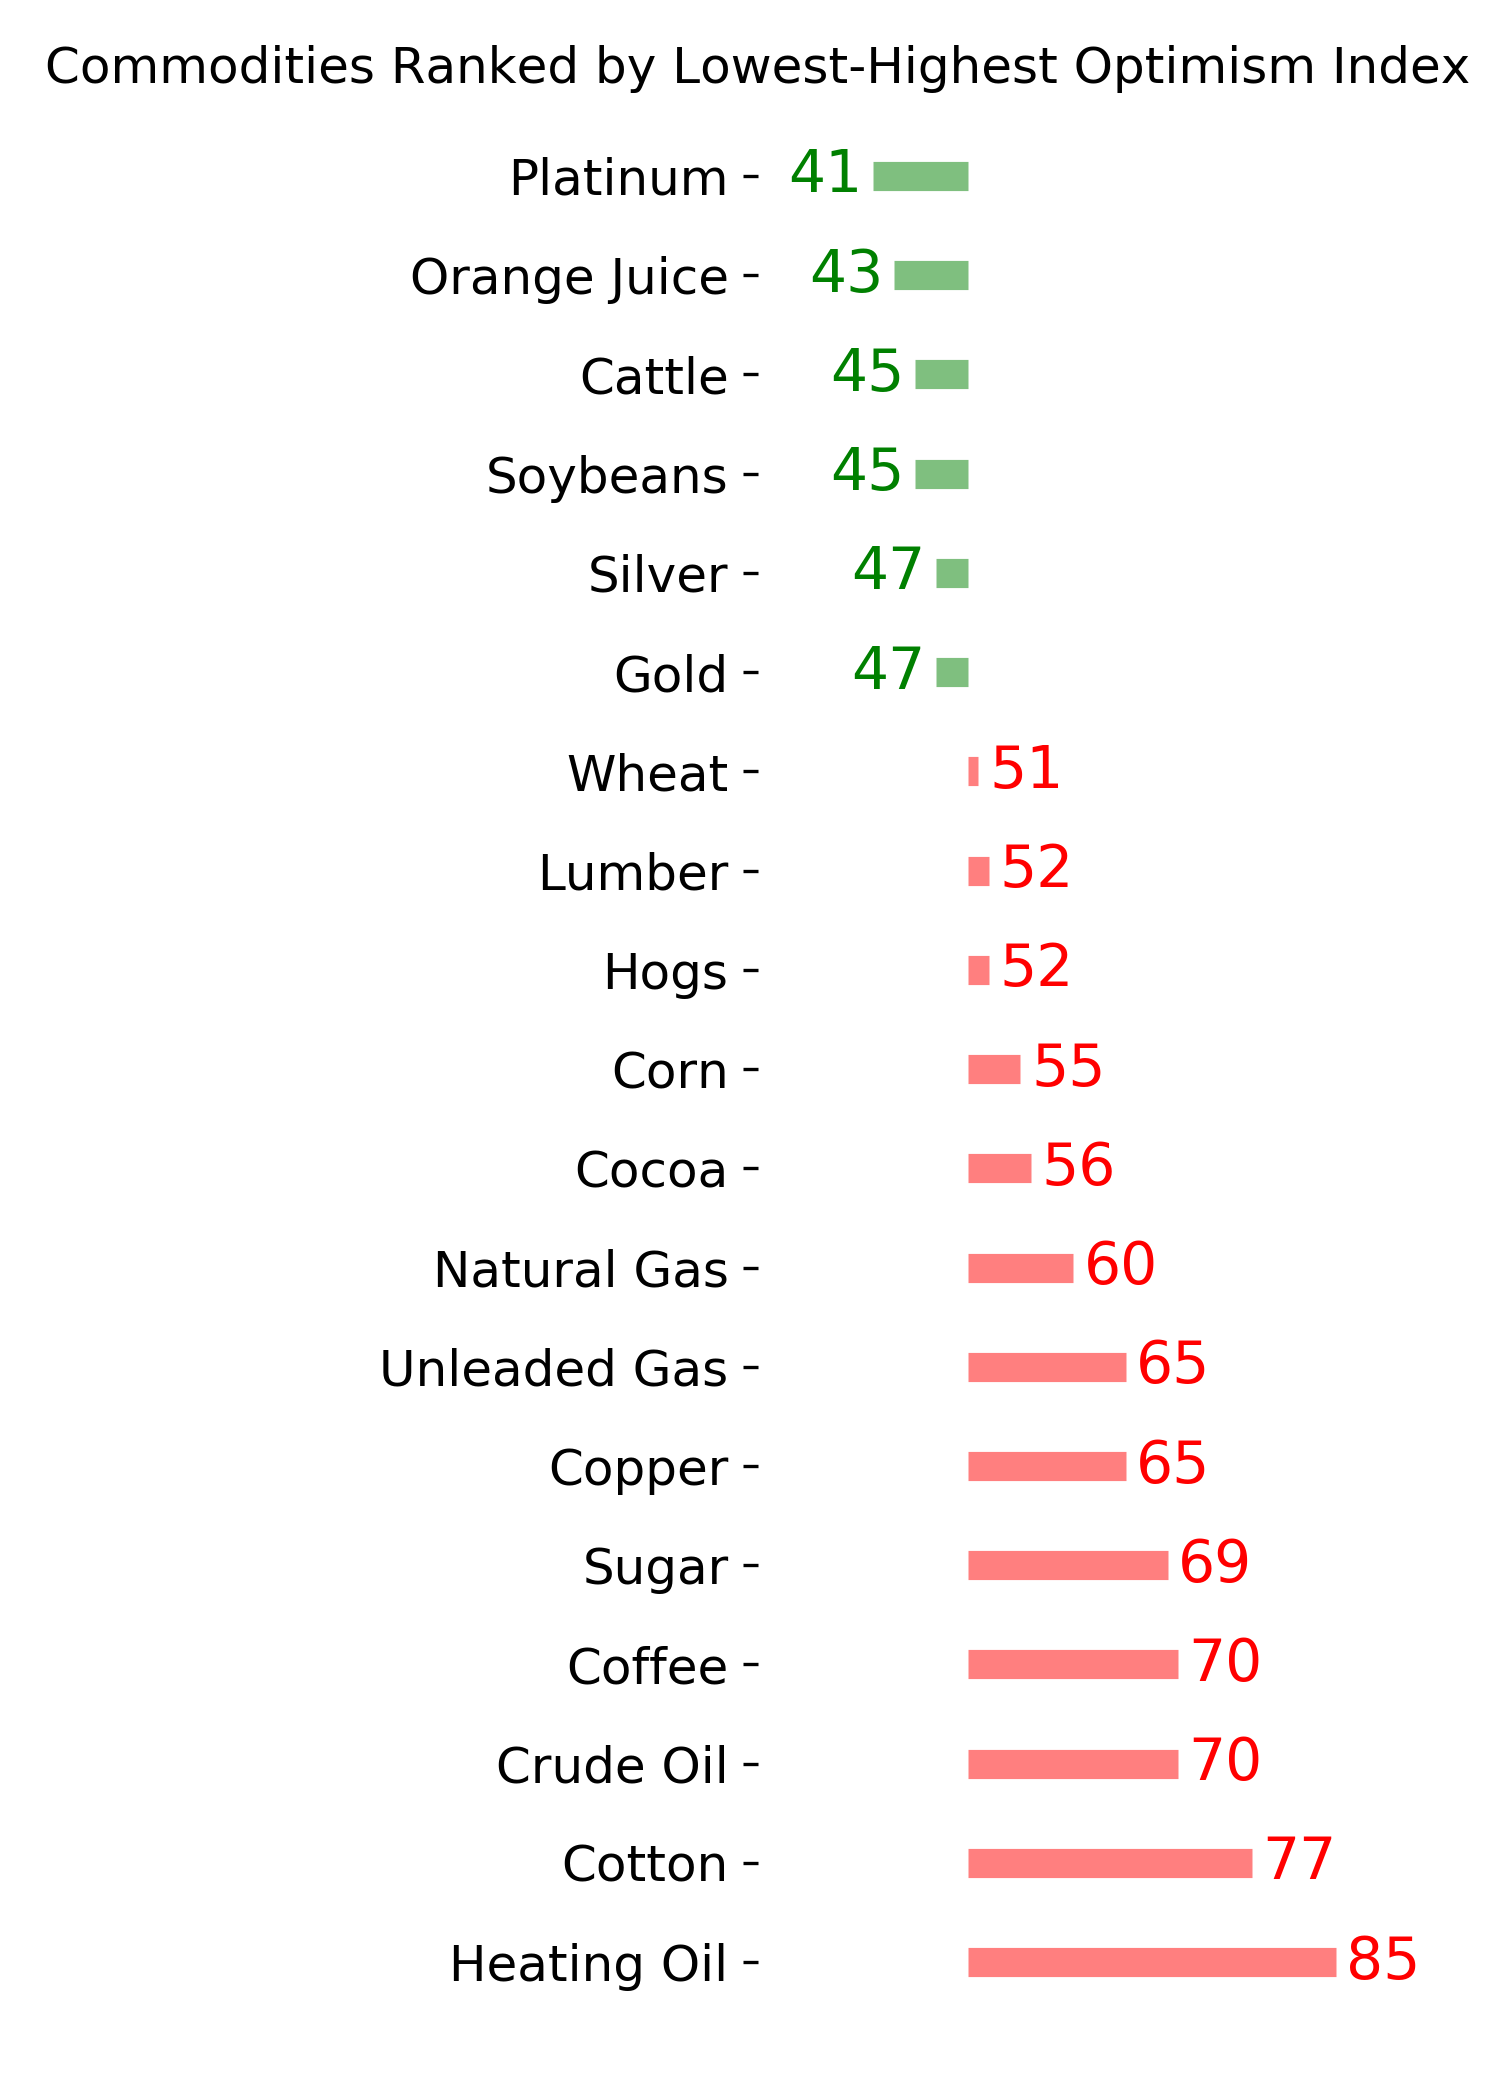
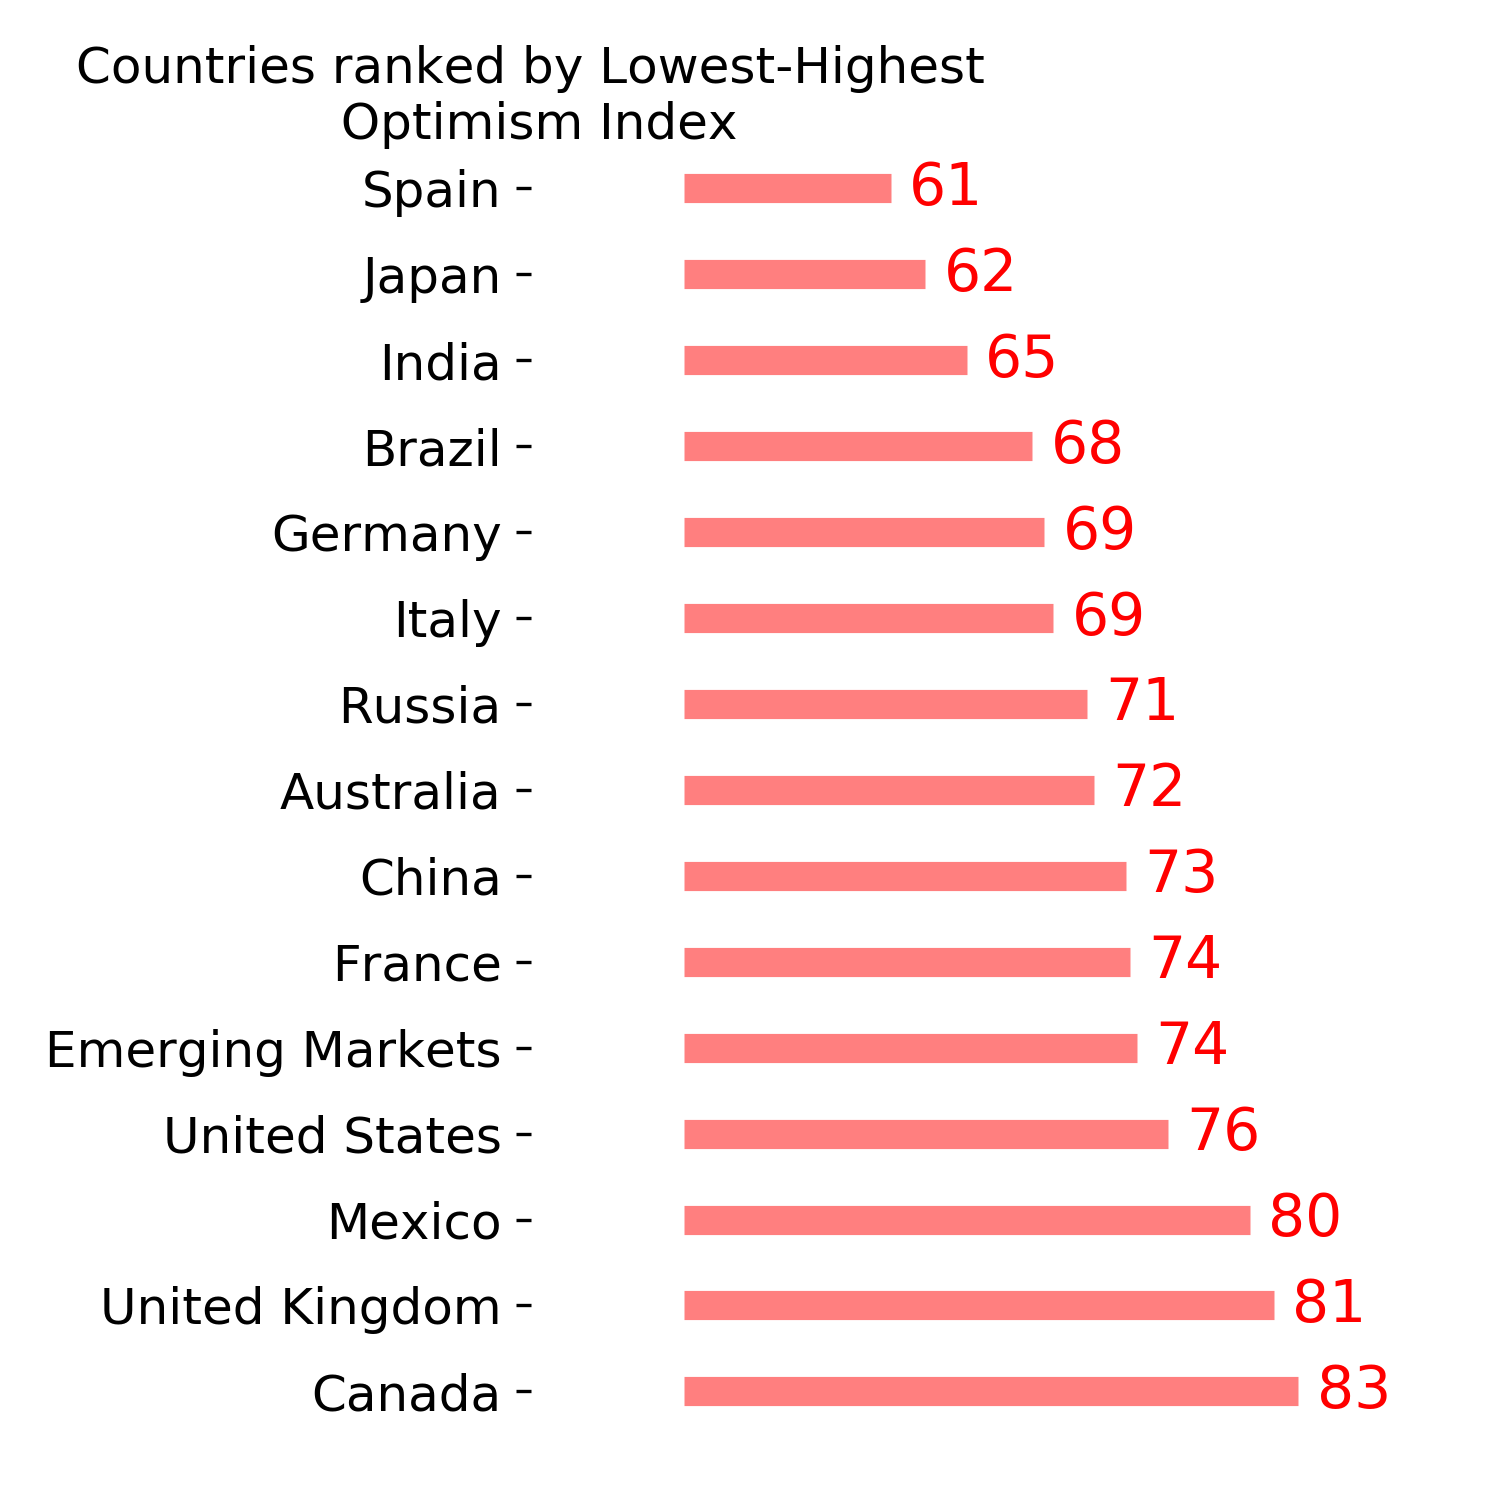
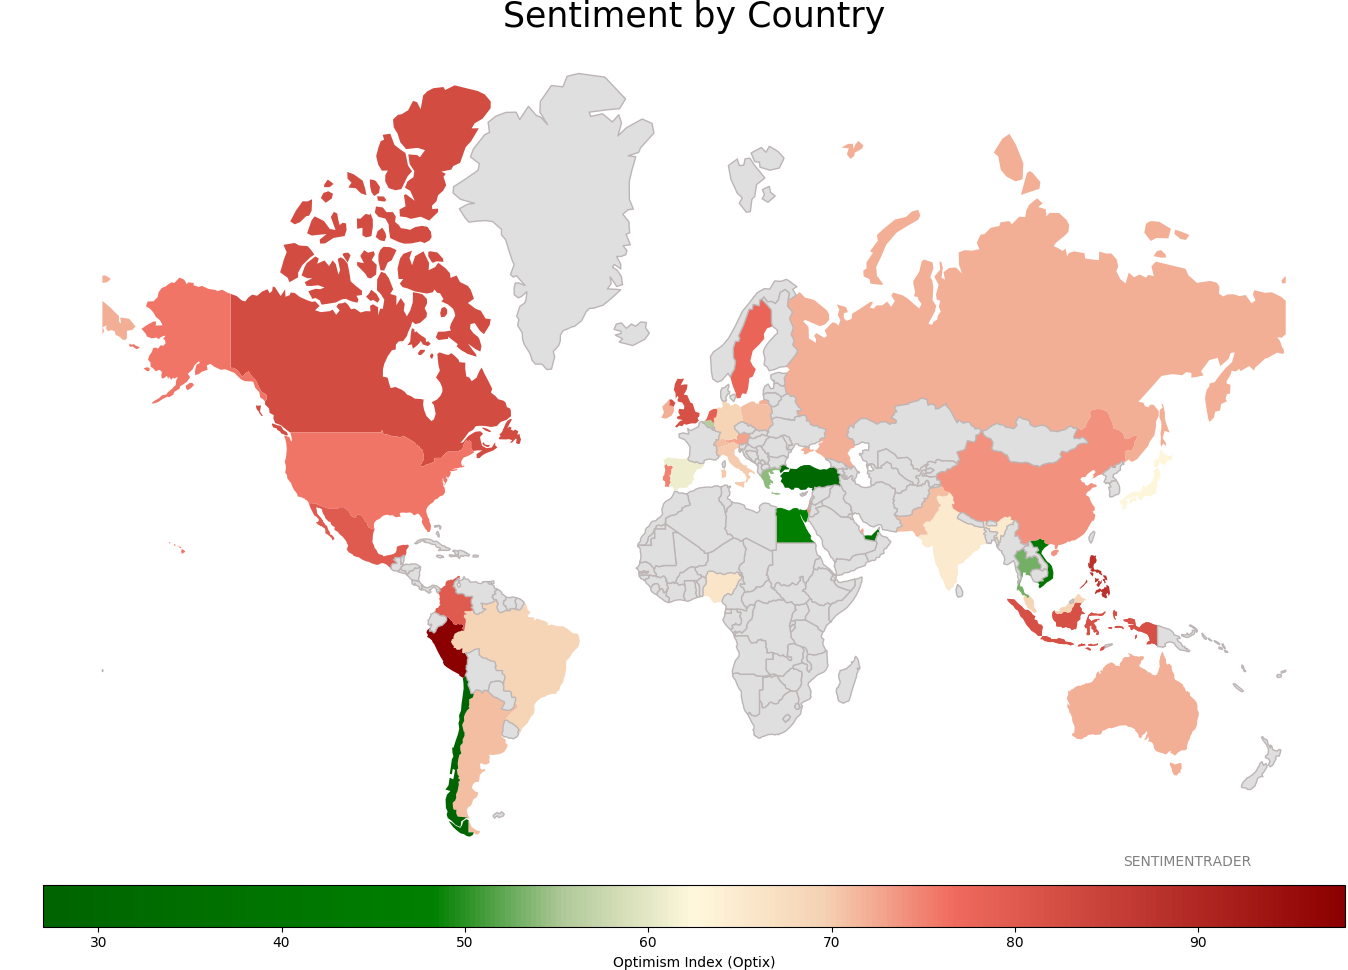
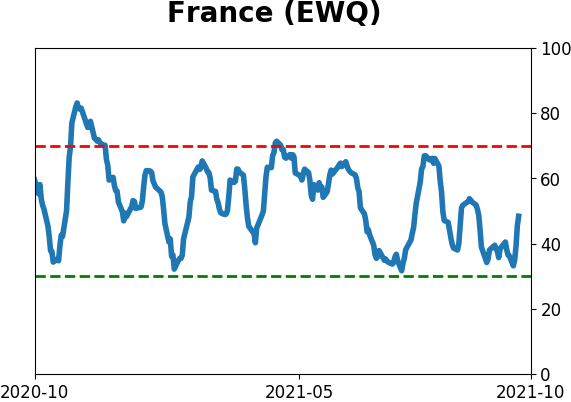
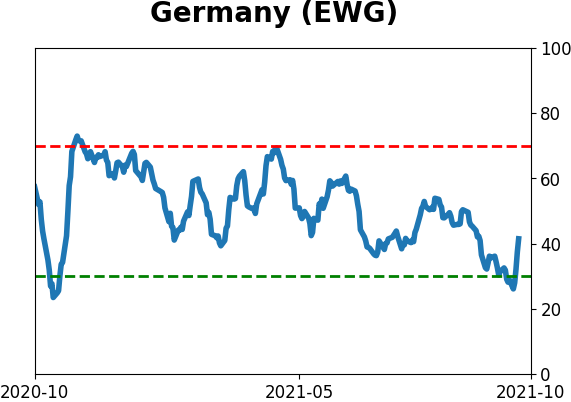
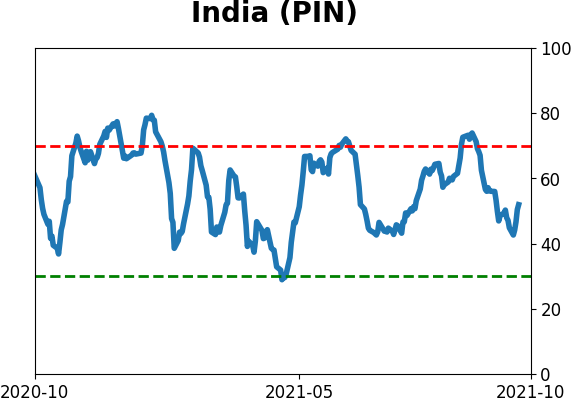
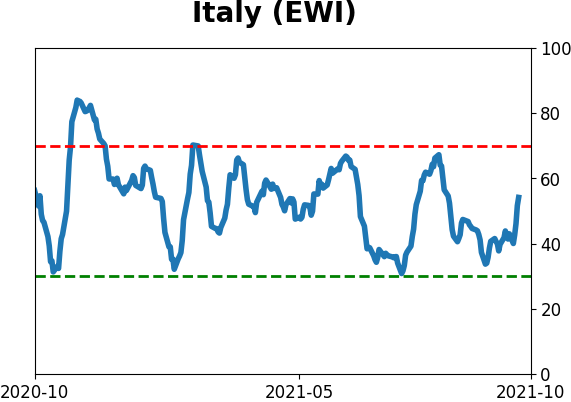
Sentiment Around The World
|
|
|
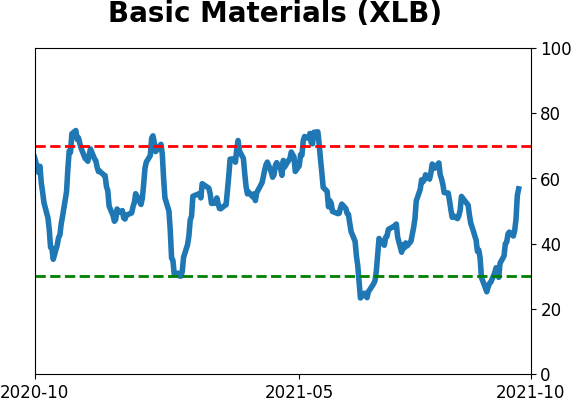
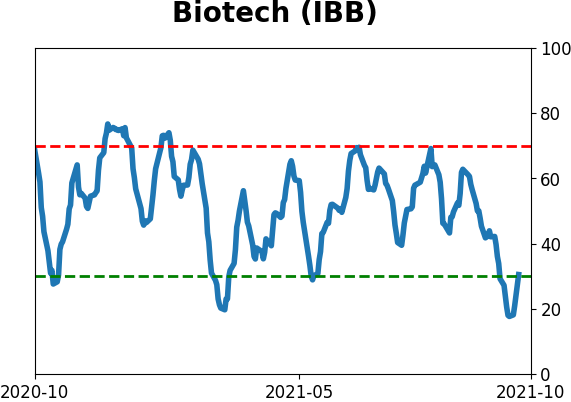
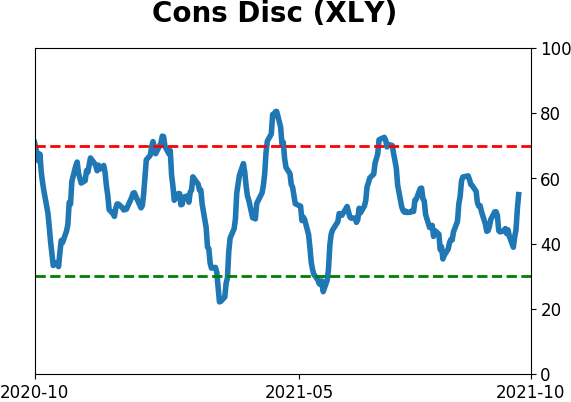
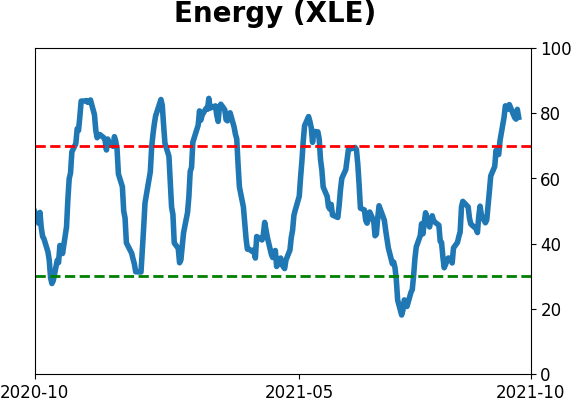
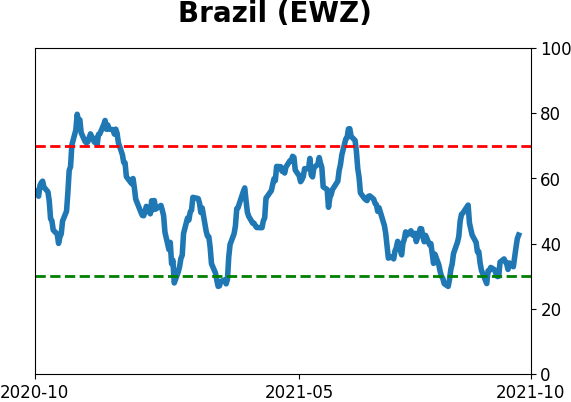
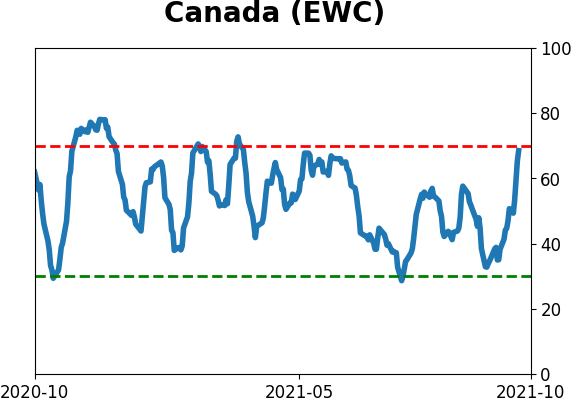
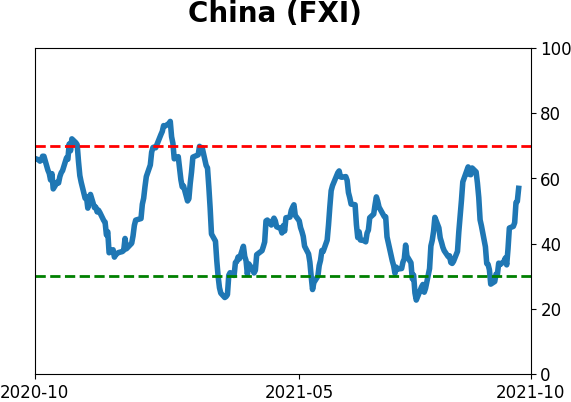
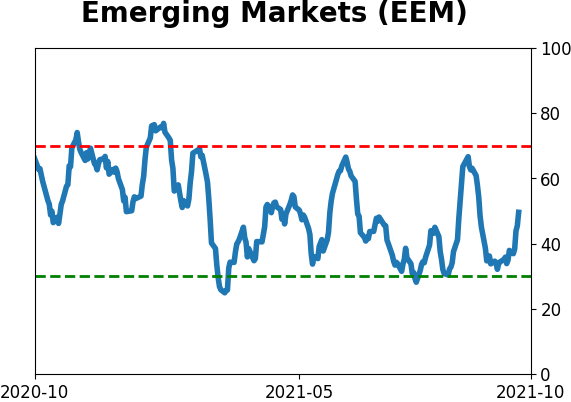
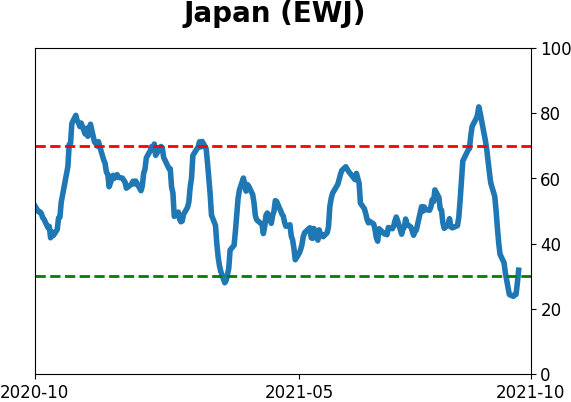
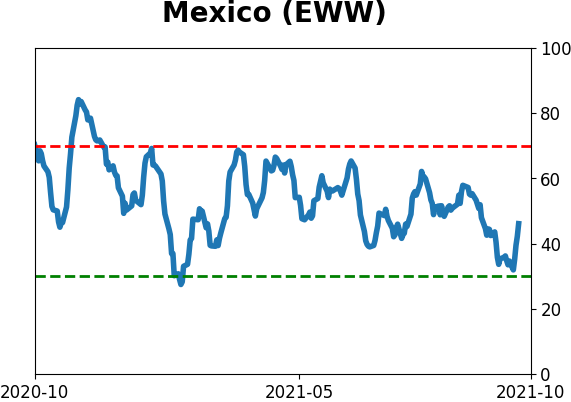
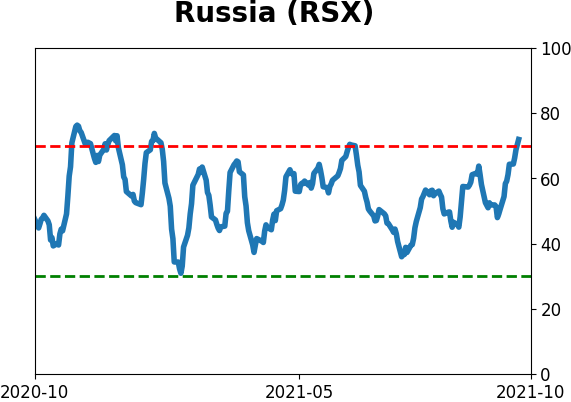
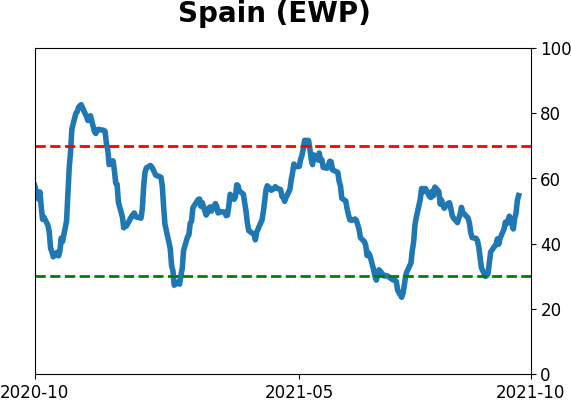
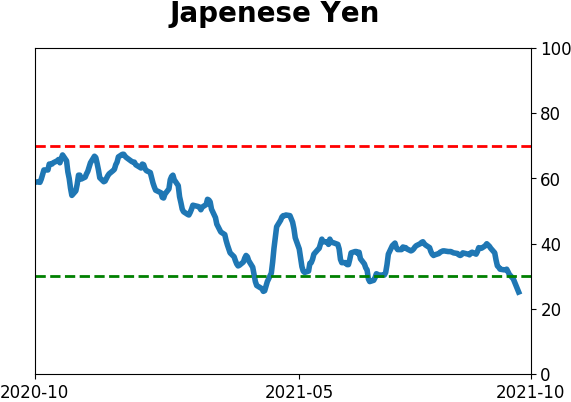
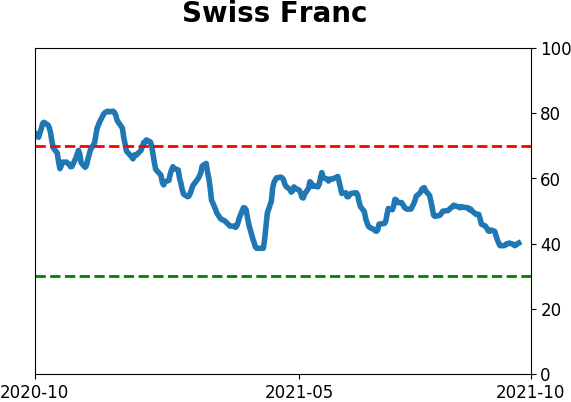
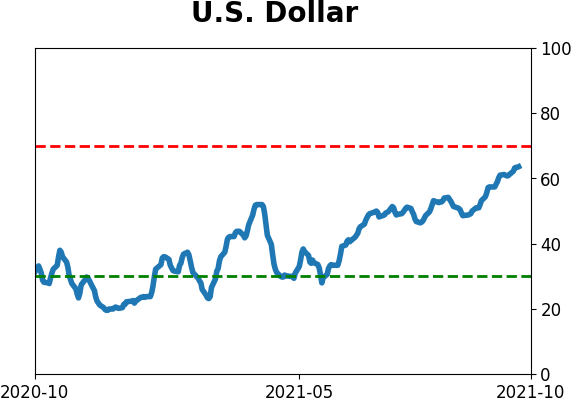
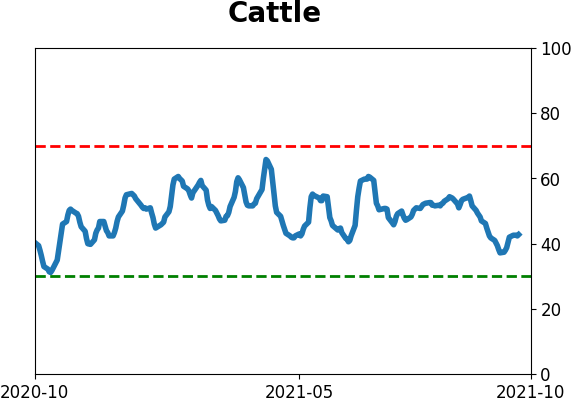
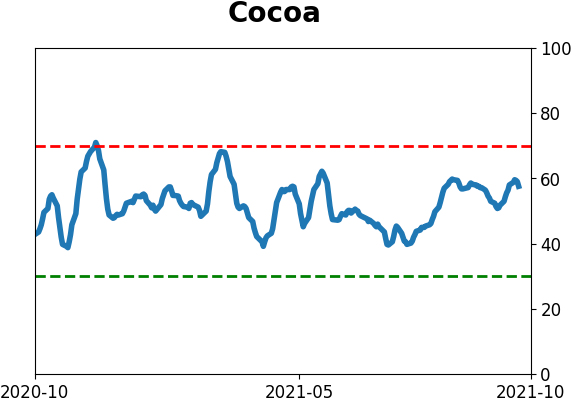
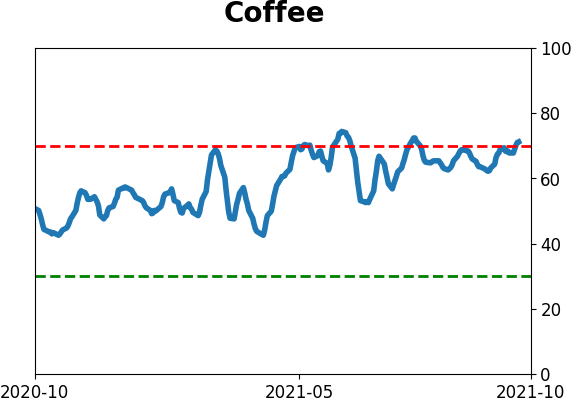
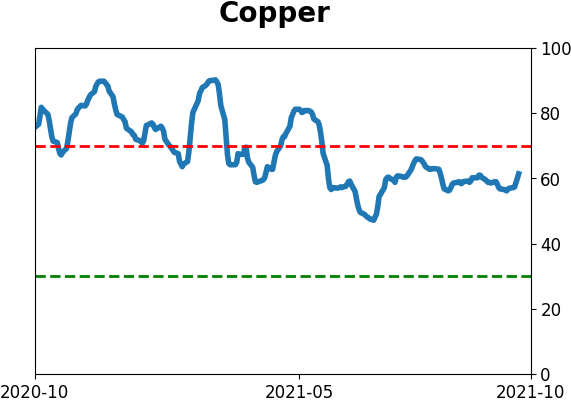
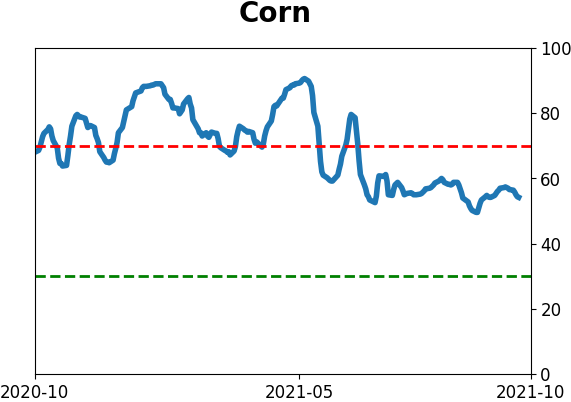
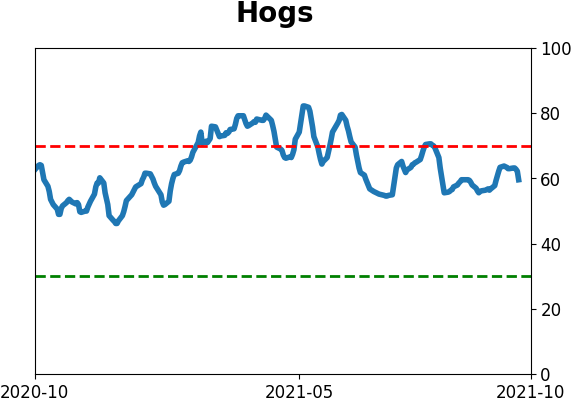
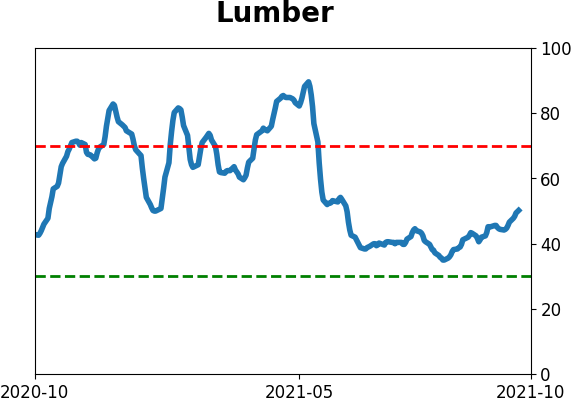
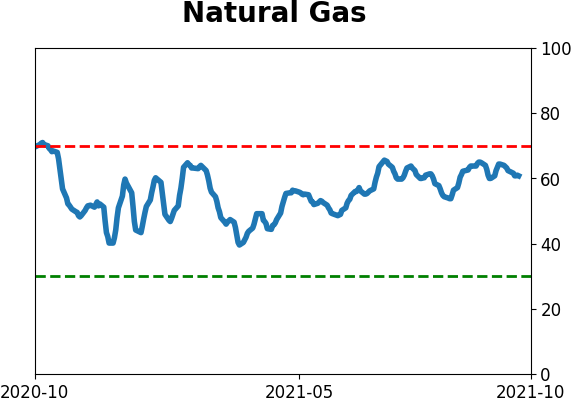
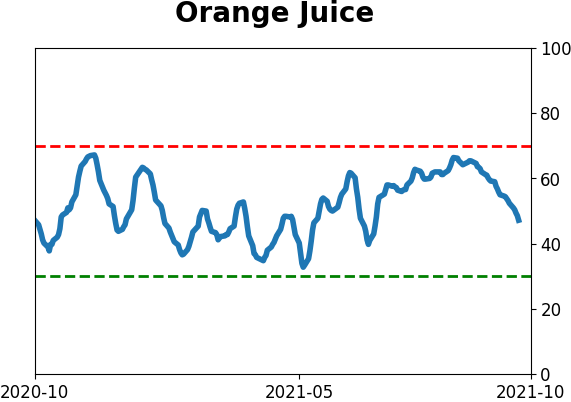
Optimism Index Thumbnails
|
|
|
|
|
|
|
|
|
|
|
|
|
|
|
|
|
|
|
|
|