Headlines
|
|
Tech rally brings new assets, and more ETFs:
Technology stocks' dominance in 2020 has brought a lot of attention, and massive inflows to funds with large exposure. To meet this demand, fund companies have created new ETFs, which are dominating other types of funds. This is usually a long-term warning sign.
Active managers get aggressive again: Active investment managers polled by the NAAIM organization are leveraged long for the first time since August. The thing with this survey, however, is that it's not very useful as a contrary indicator, at least when managers get aggressively long. The Backtest Engine shows that when the average manager was more than 100% net long, the S&P 500 was higher 3 months later 88% of the time, averaging more than 4.2%. The GIF below shows it takes about 18 seconds to find out the danger of automatically assuming this high exposure is negative for stocks.
Bottom Line:
- A positive environment favors becoming aggressive on signs of excessive pessimism.
|
Smart / Dumb Money Confidence
|
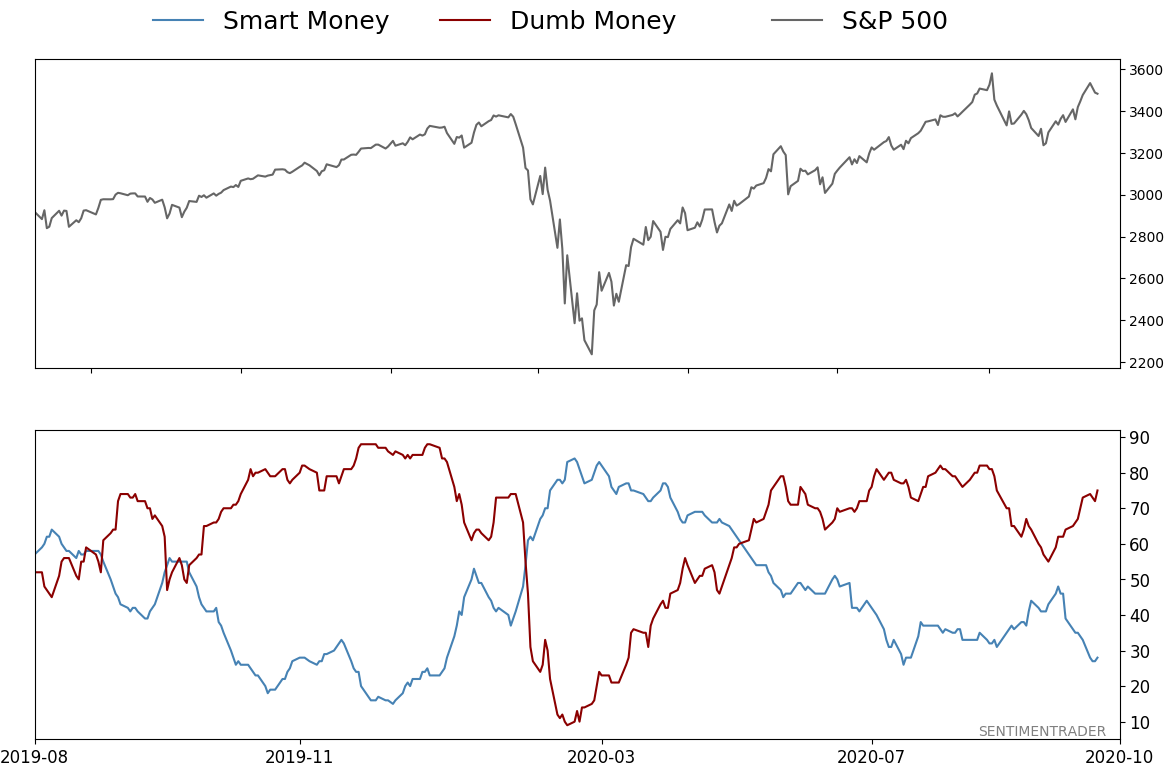
Smart Money Confidence: 28%
Dumb Money Confidence: 75%
|
|
Risk Levels
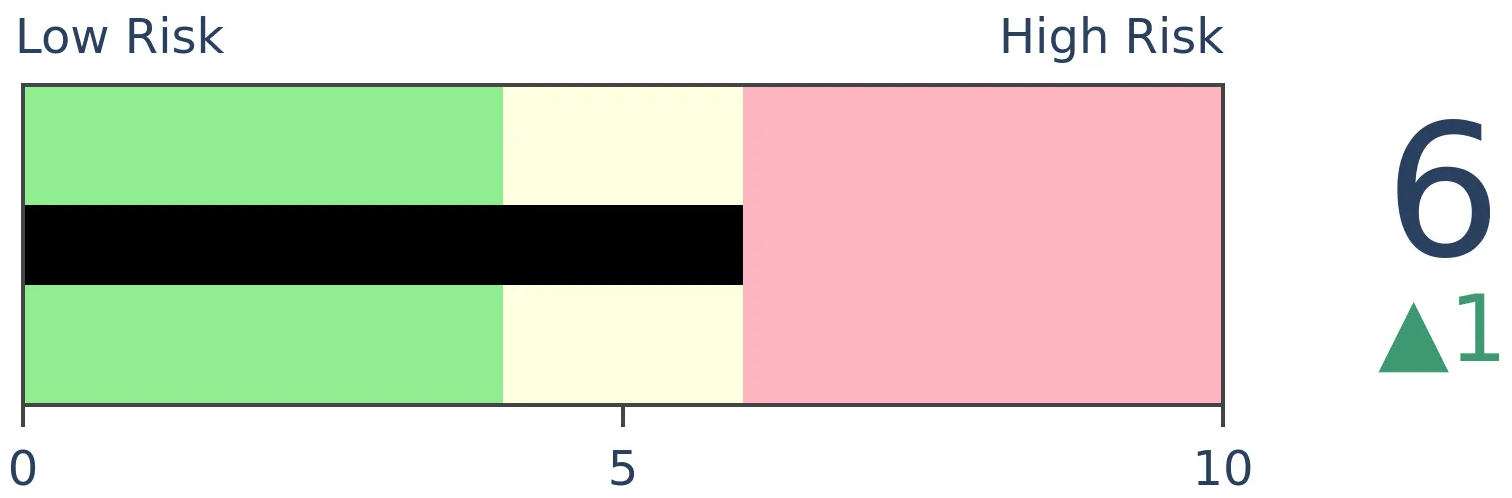
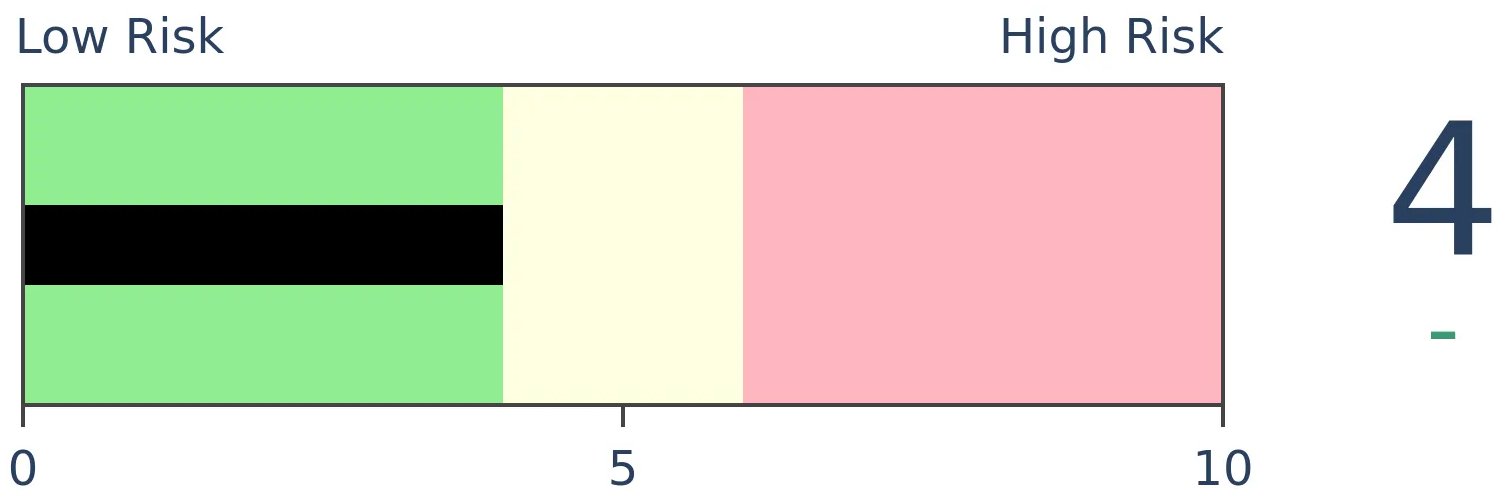
Stocks Short-Term
|
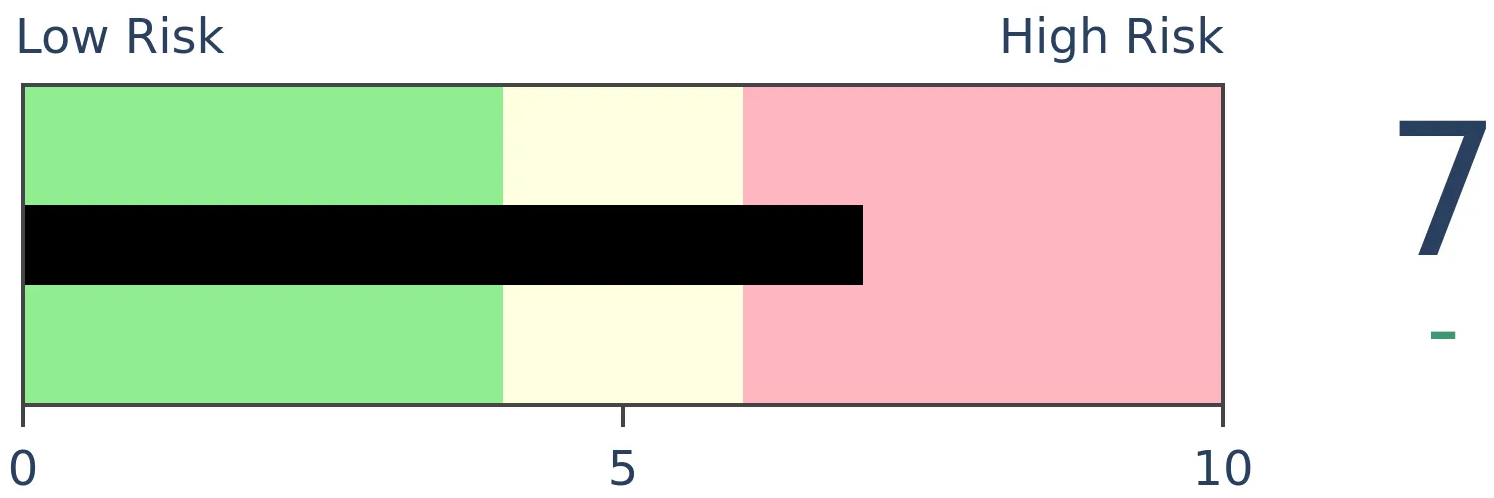
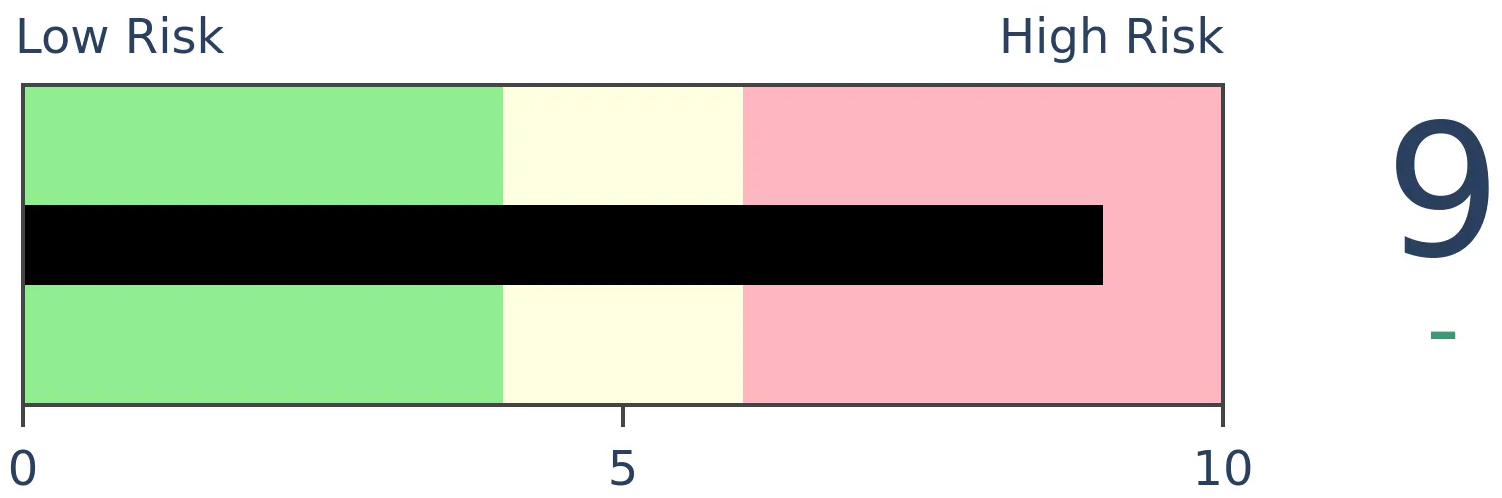
Stocks Medium-Term
|
|
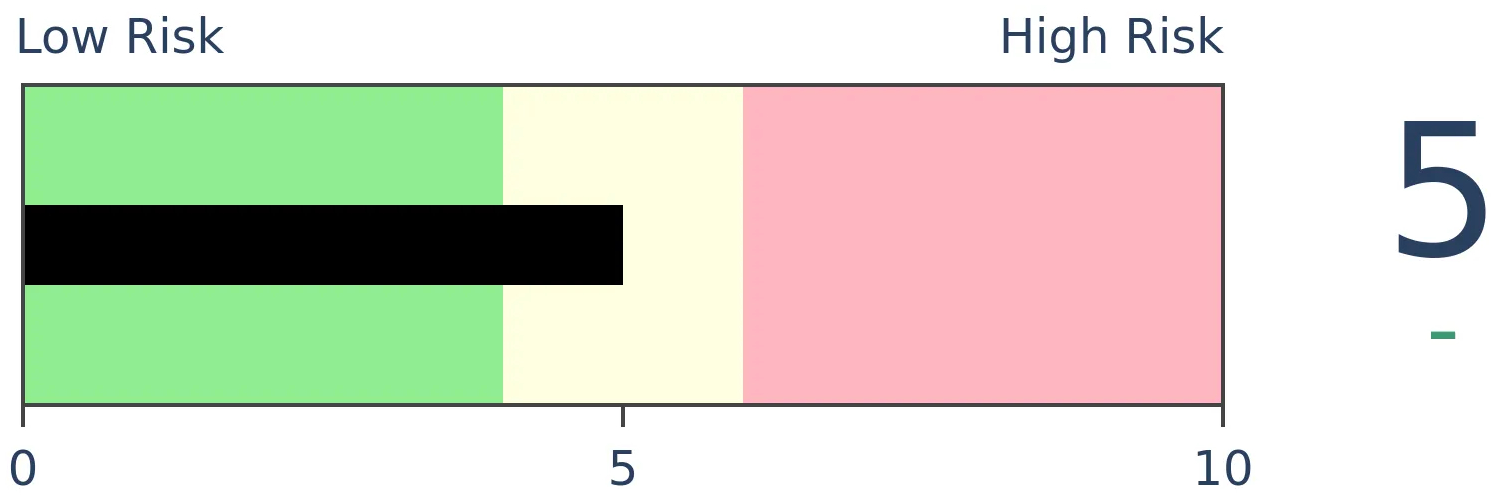
Bonds
|
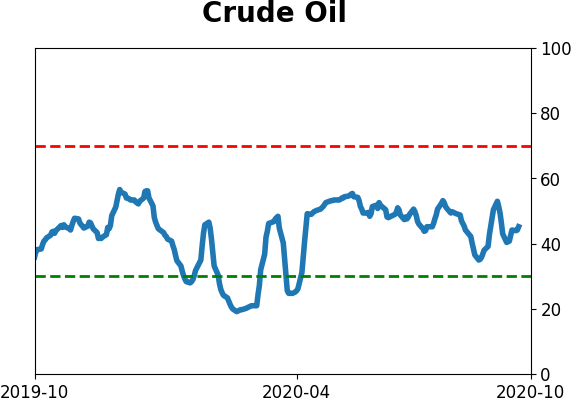
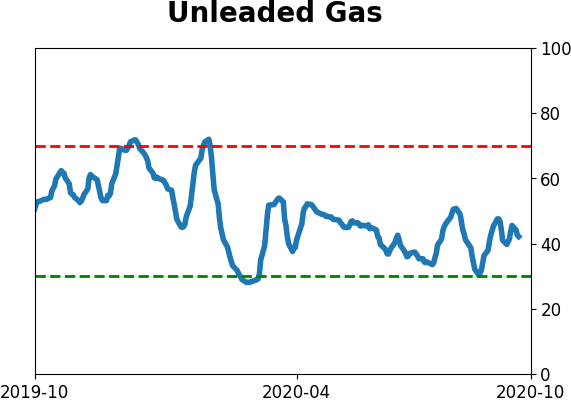
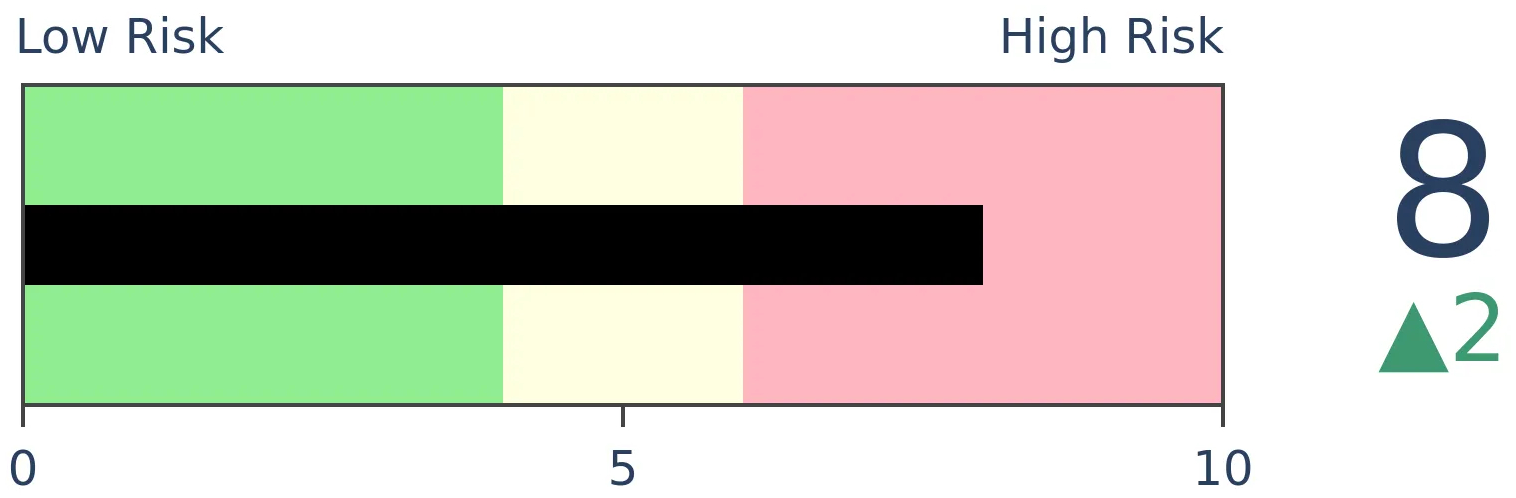
Crude Oil
|
|
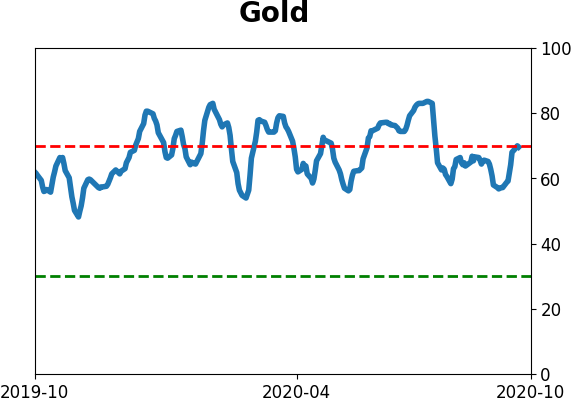
Gold
|
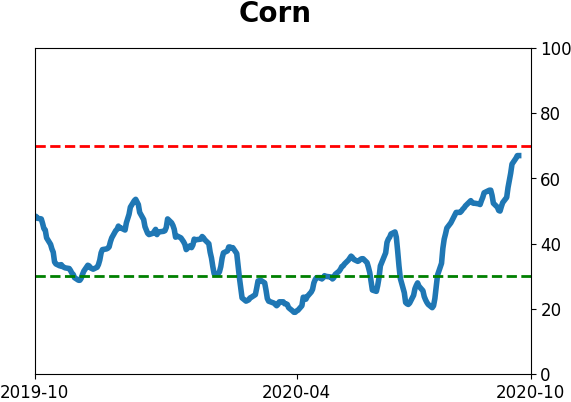
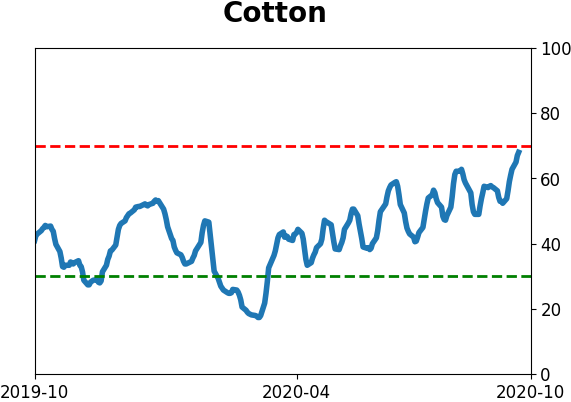
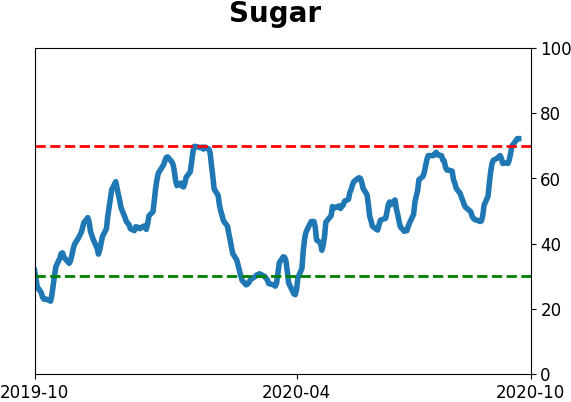
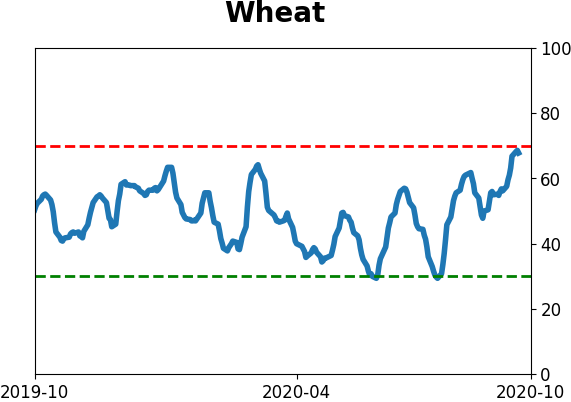
Agriculture
|
|
Research
BOTTOM LINE
Technology stocks' dominance in 2020 has brought a lot of attention, and massive inflows to funds with large exposure. To meet this demand, fund companies have created new ETFs, which are dominating other types of funds. This is usually a long-term warning sign.
FORECAST / TIMEFRAME
None
|
There's nothing like an established market trend to spur demand for MOAR. And when fund companies see that demand from investors, they will do whatever they can to supply it.
The breathtaking run in technology stocks has spurred Invesco, creator of the wildly popular QQQ exchange-traded fund, to create offshoots. As the Wall Street Journal notes (emphasis added):
"Invesco Ltd. is adding more Qs to its fund lineup, a wager by the world’s fourth-biggest issuer of exchange-traded products that investors’ love affair with technology stocks will continue."
We see this all the time. When a sector, or the market as a whole, does well, fund companies will create more ETFs, as we saw in the summer of 2015. Or the opposite - when a sector does poorly, then fund companies will quietly liquidate the funds or split the shares, like what happened with volatility ETFs in 2016.
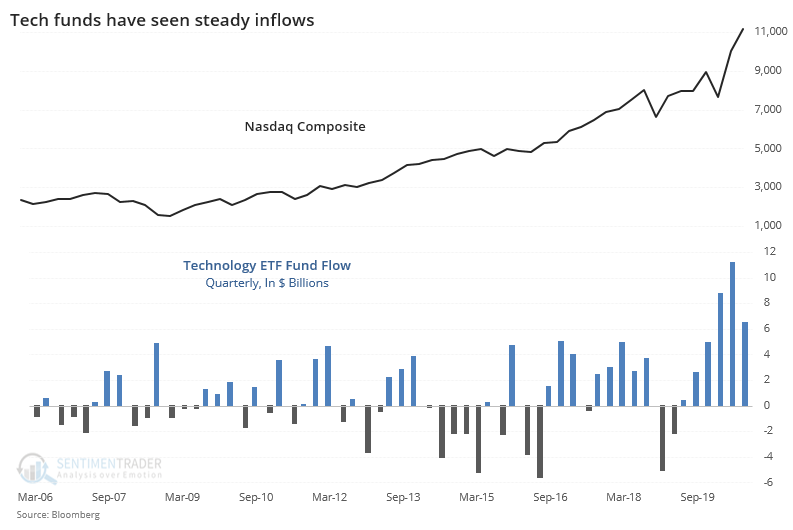
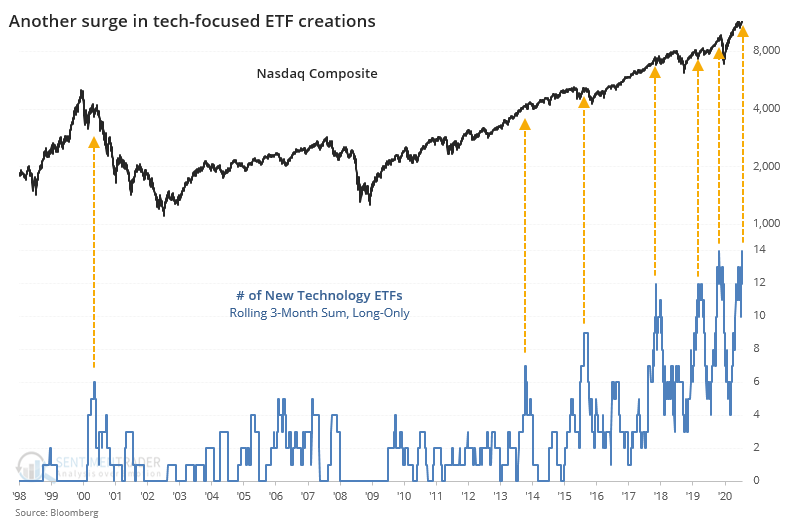
There has certainly been demand for anything tech-related. Flows into and out of QQQ have swung violently in 2020, but that isn't the only tech fund. As a sector, quarterly fund flows have soared this year.
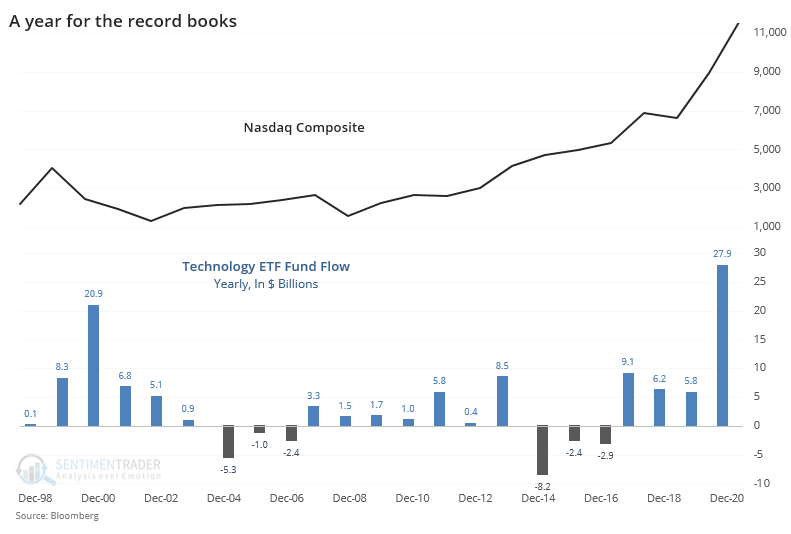
On a yearly basis, we've already surpassed 2000.
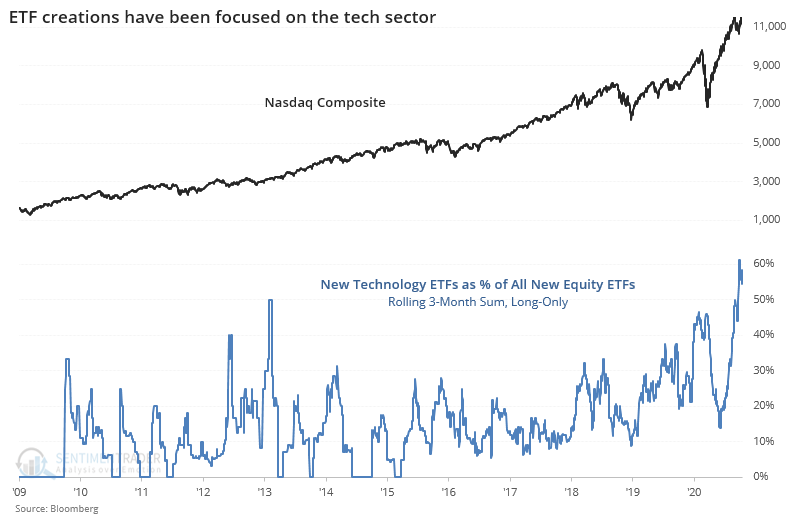
Because there is demand for tech stocks at the moment, fund companies are creating more ways to satiate that demand. Below, we can see a rolling 3-month sum of all new ETFs that explicitly have at least 25% exposure to the tech sector at inception.
As a percentage of all new equity ETFs, these funds have never been more popular.
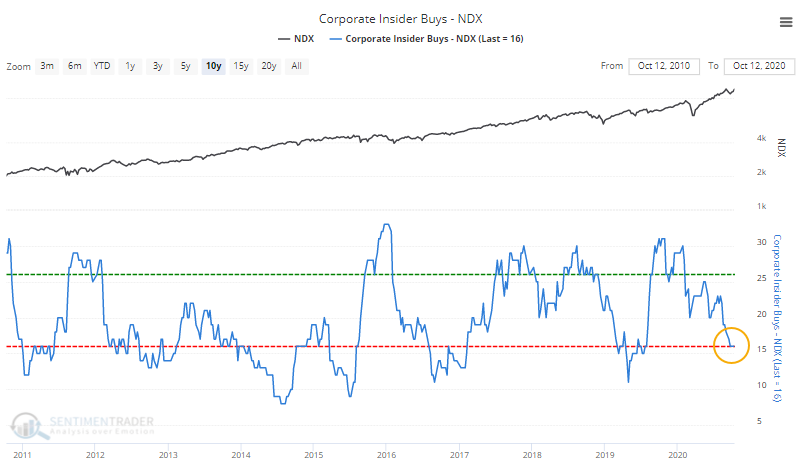
While demand from retail investors has been great enough to spur fund companies to undergo the expense and risk of creating new funds, corporate insiders in many of these companies continue to sell, with few buyers.
In Nasdaq 100 companies, open market purchases have tapered off significantly.
A drop in transactions isn't all that surprising as earnings season approaches, but at the same time, the number of open market sales remains high.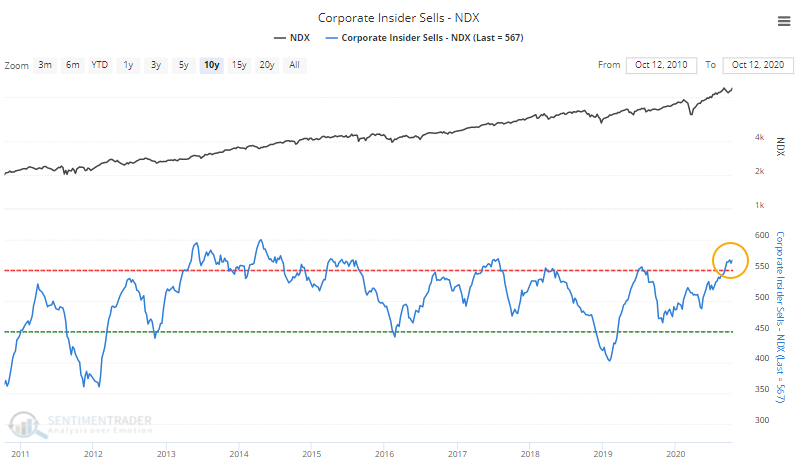
The recent surge in tech stocks has become about more than just a few massive stocks sitting at the top. This kind of broadening participation has been a consistently good sign over the medium-term. On a long-term basis, there has to be at least modest concern about the attention these stocks are getting. When any single sector becomes such a focus, there is usually something, at some point, that comes along to knock it down a peg.
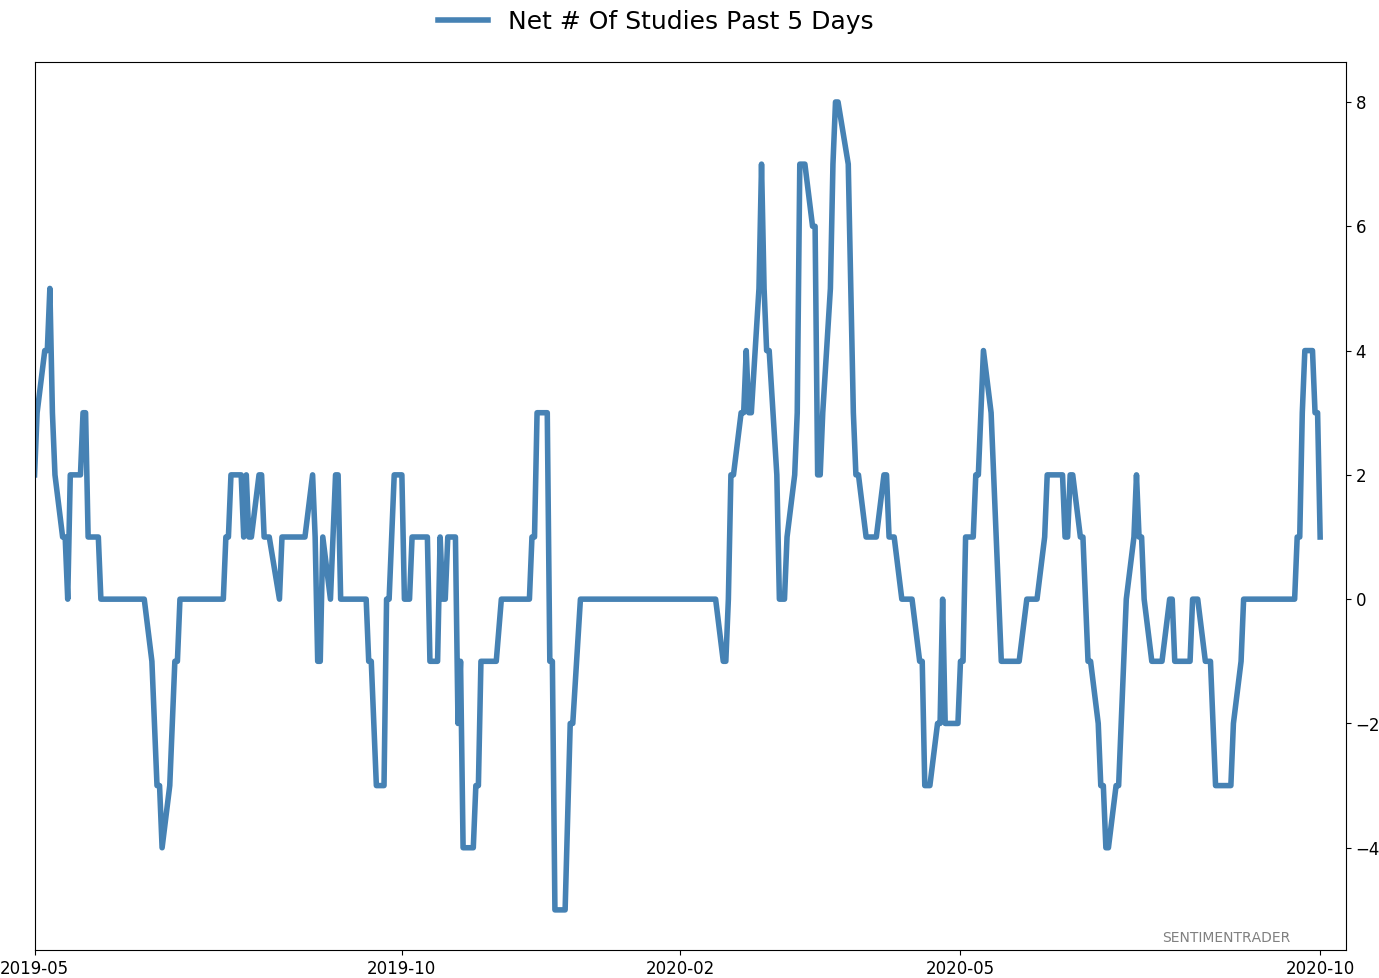
Active Studies
| Time Frame | Bullish | Bearish | | Short-Term | 0 | 0 | | Medium-Term | 4 | 8 | | Long-Term | 48 | 2 |
|
Indicators at Extremes
Portfolio
| Position | Description | Weight % | Added / Reduced | Date | | Stocks | 15.6% RSP, 10.1% VWO, 7.5% XLE, 5.1% PSCE | 38.2 | Added 5% | 2020-10-15 | | Bonds | 10% BND, 10% SCHP, 10% ANGL | 29.7 | Reduced 0.1% | 2020-10-02 | | Commodities | GCC | 2.4 | Reduced 2.1%
| 2020-09-04 | | Precious Metals | GDX | 4.7 | Added 5% | 2020-09-09 | | Special Situations | | 0.0 | Reduced 5% | 2020-10-02 | | Cash | | 25.0 | | |
|
Updates (Changes made today are underlined)
After the September swoon wrung some of the worst of the speculation out of stocks, there are some signs that it's returning, especially in the options market. It's helped to push Dumb Money Confidence above 70%. A big difference between now and August is that in August, there was a multitude of days with exceptionally odd breadth readings. Some of the biggest stocks were masking underlying weakness. Combined with heavy speculative activity, it was a dangerous setup. Now, we've seen very strong internal strength, in the broad market, as well as tech and small-cap stocks. Prior signals almost invariably led to higher prices. That's hard to square with the idea that forward returns tend to be subdued when Confidence is high, but that's less reliable during healthy market conditions, which we're seeing now (for the most part). I added some risk with small-cap energy stocks, due to an increasing number of positive signs in both small-caps and energy. This is intended as a long-term position.
RETURN YTD: -0.1% 2019: 12.6%, 2018: 0.6%, 2017: 3.8%, 2016: 17.1%, 2015: 9.2%, 2014: 14.5%, 2013: 2.2%, 2012: 10.8%, 2011: 16.5%, 2010: 15.3%, 2009: 23.9%, 2008: 16.2%, 2007: 7.8%
|
|
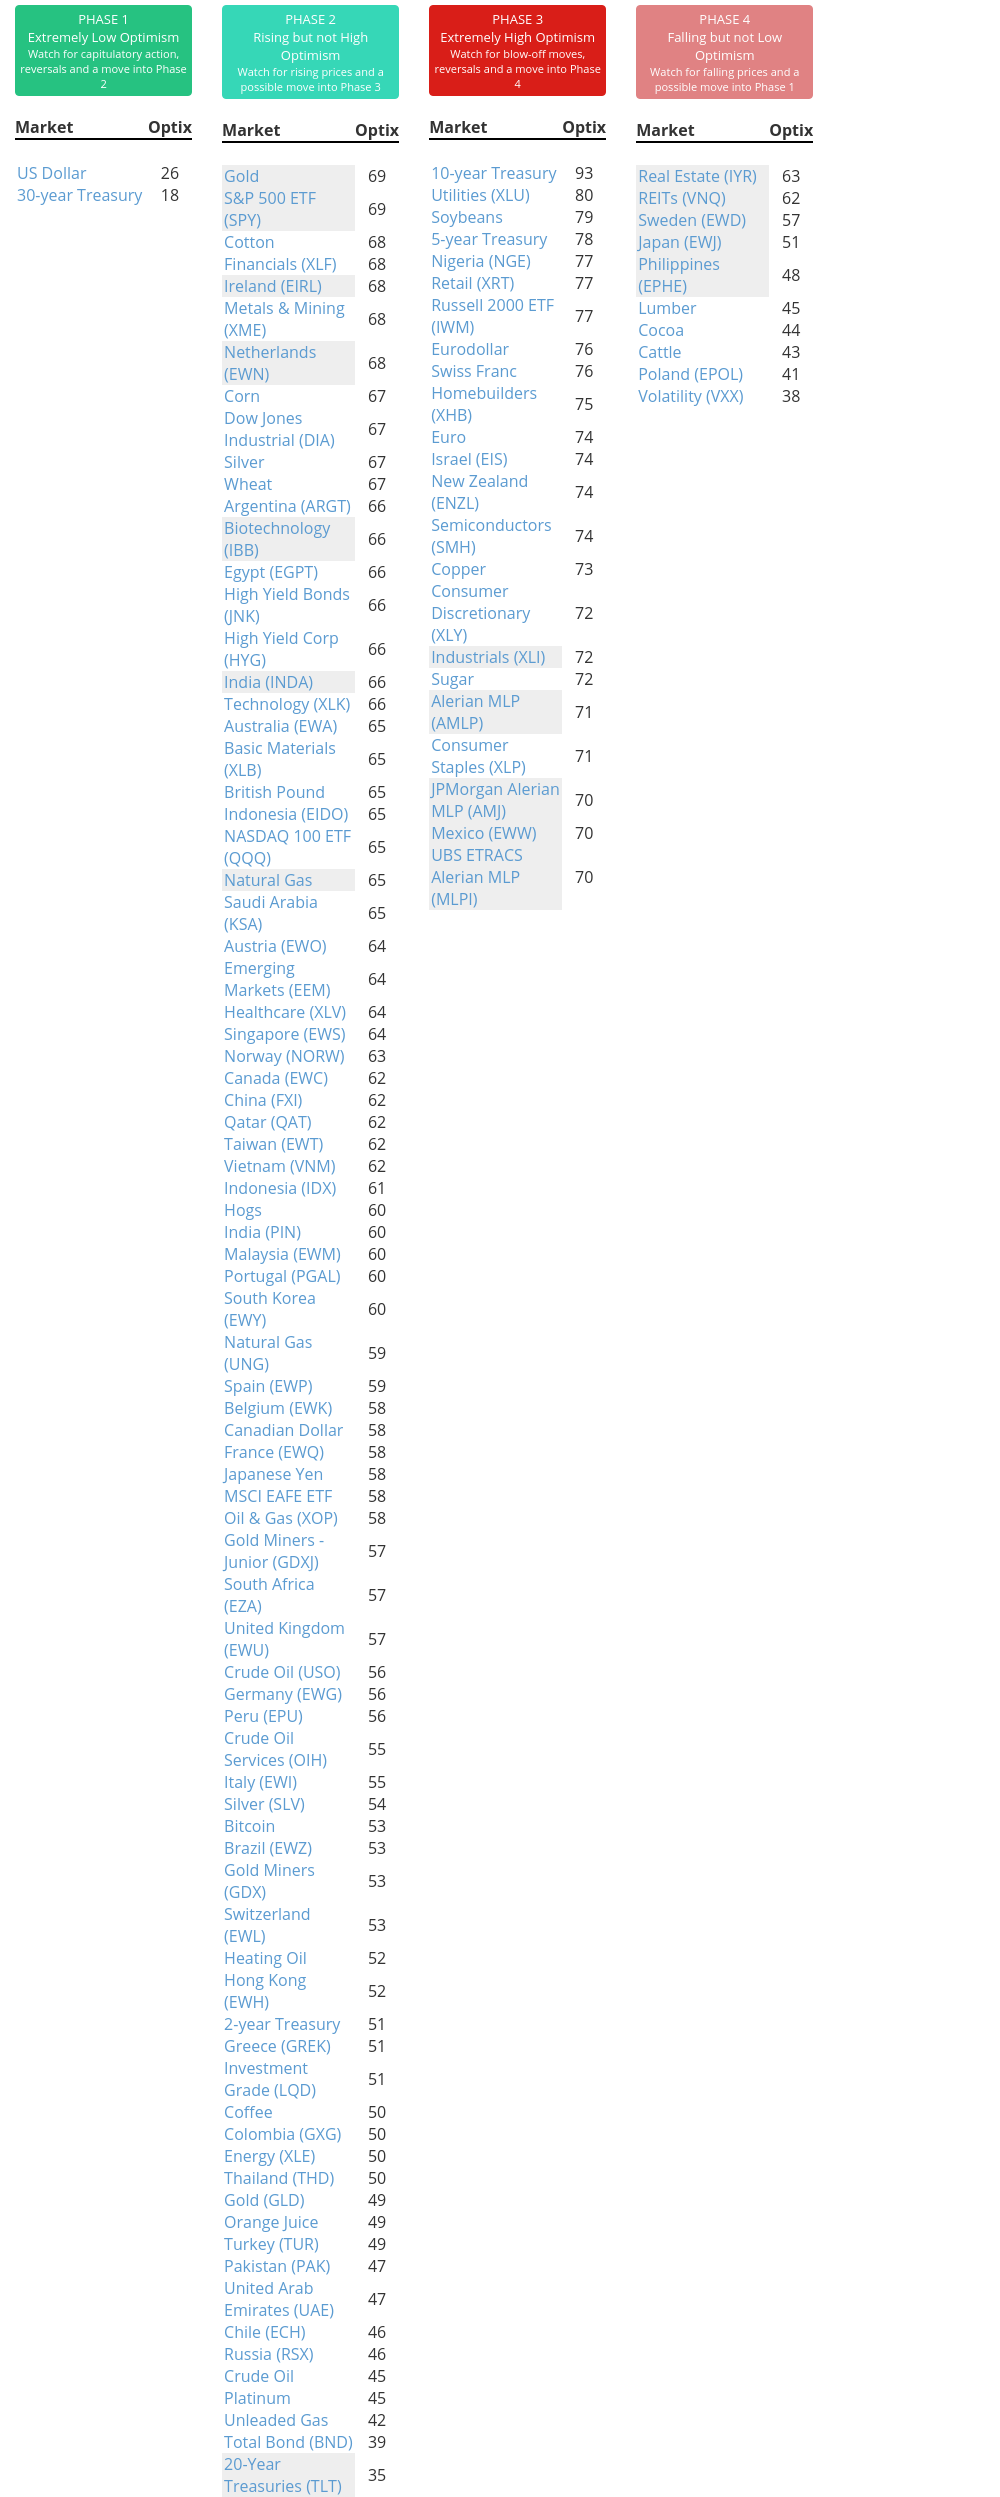
Phase Table
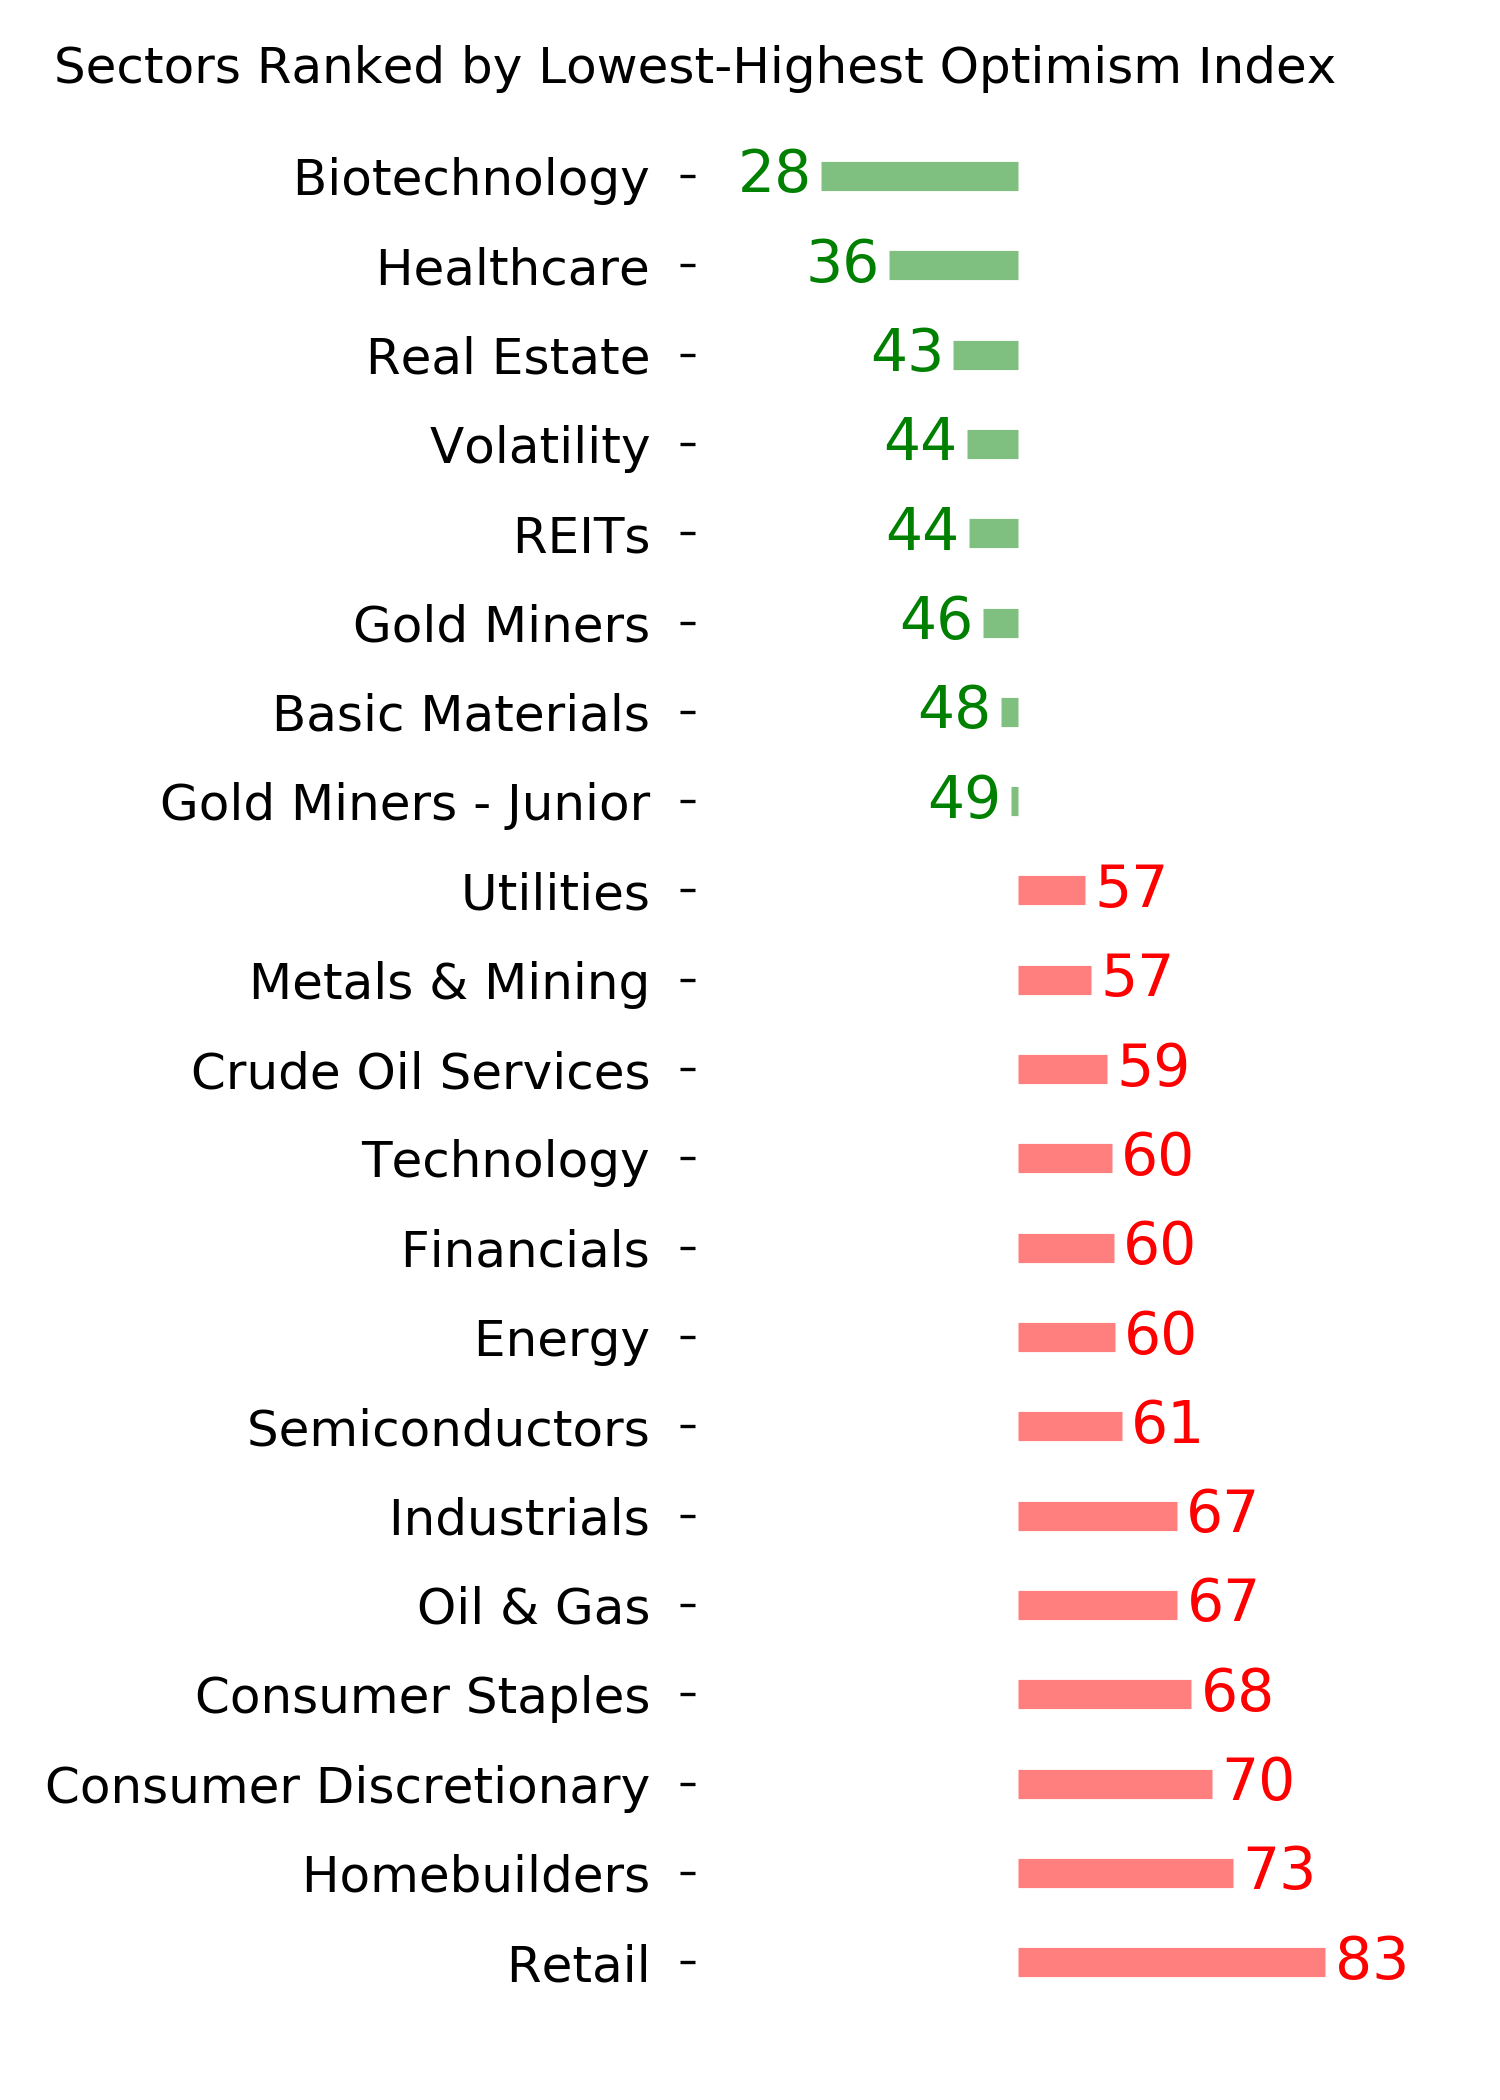
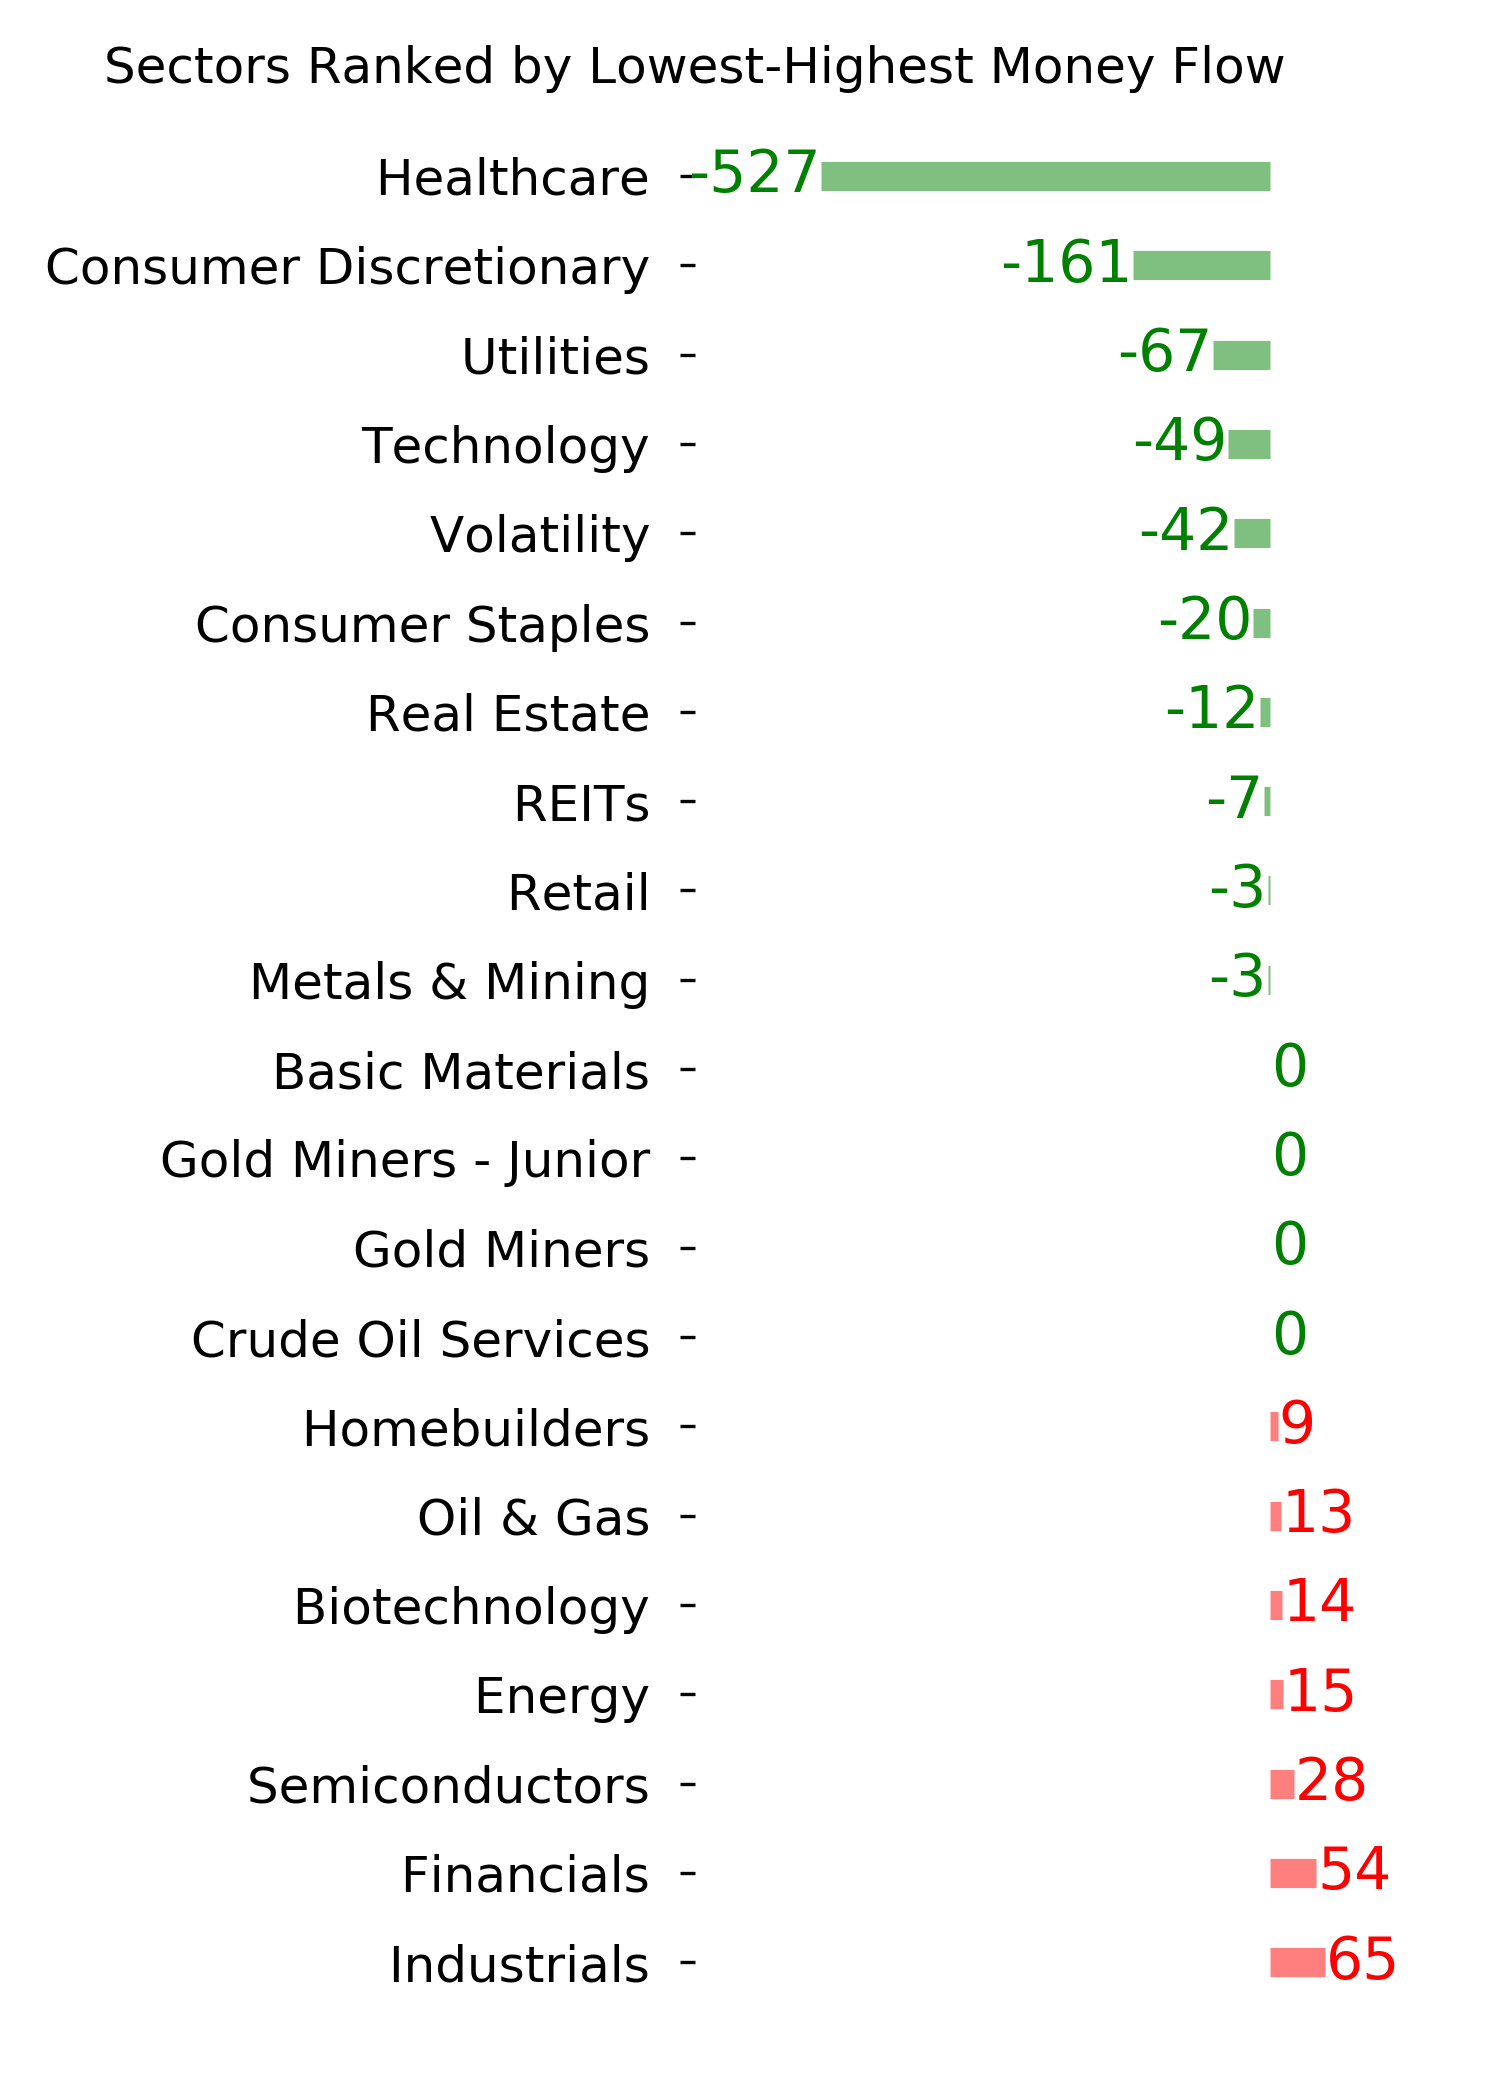
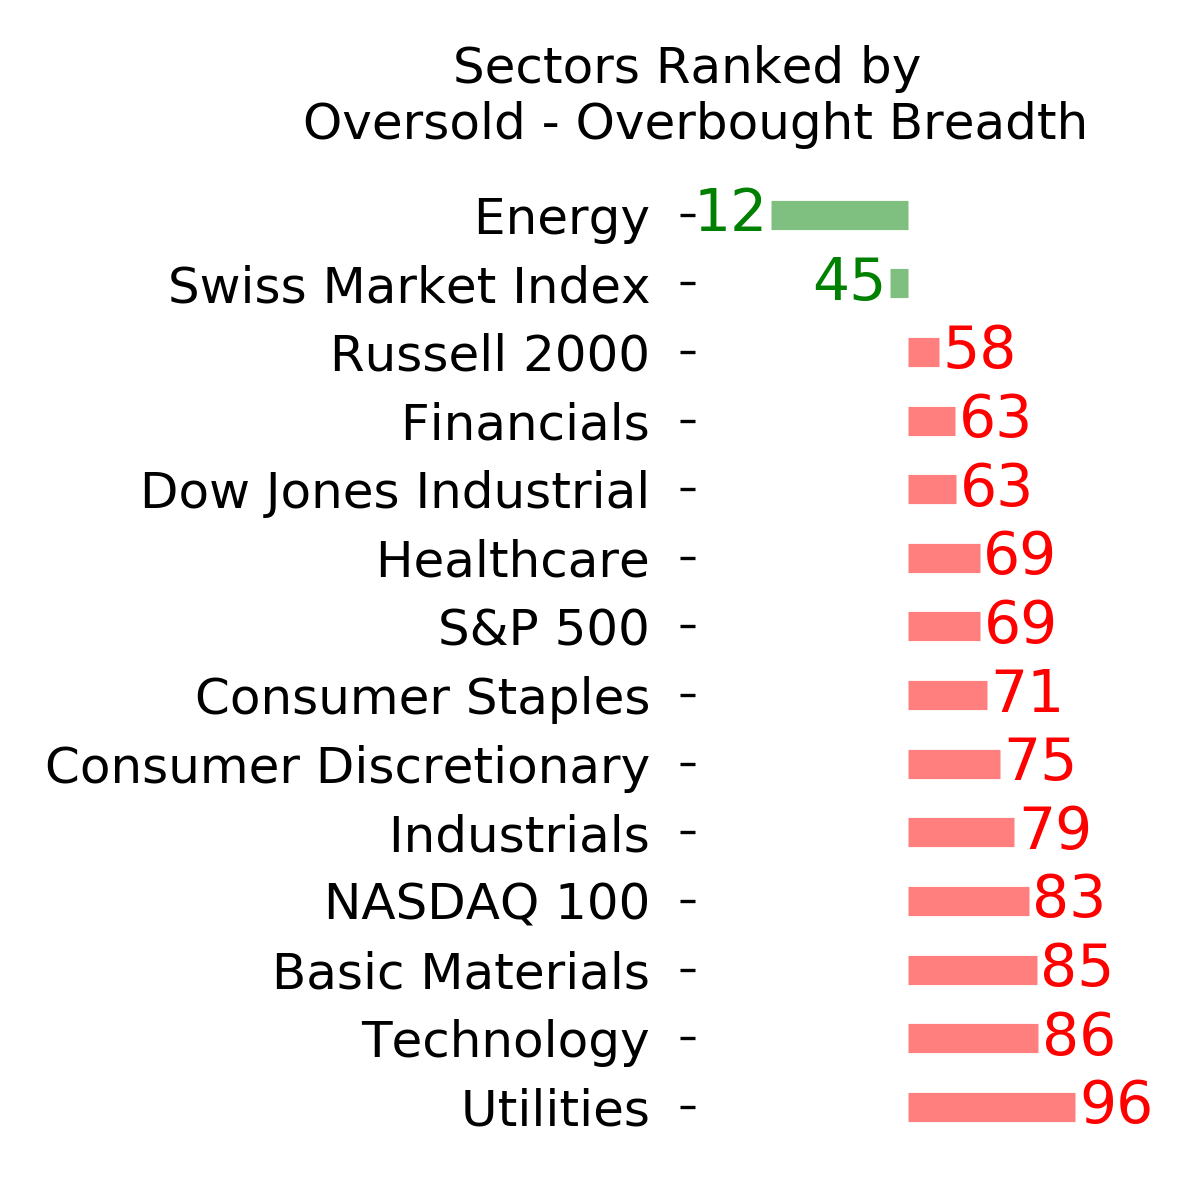
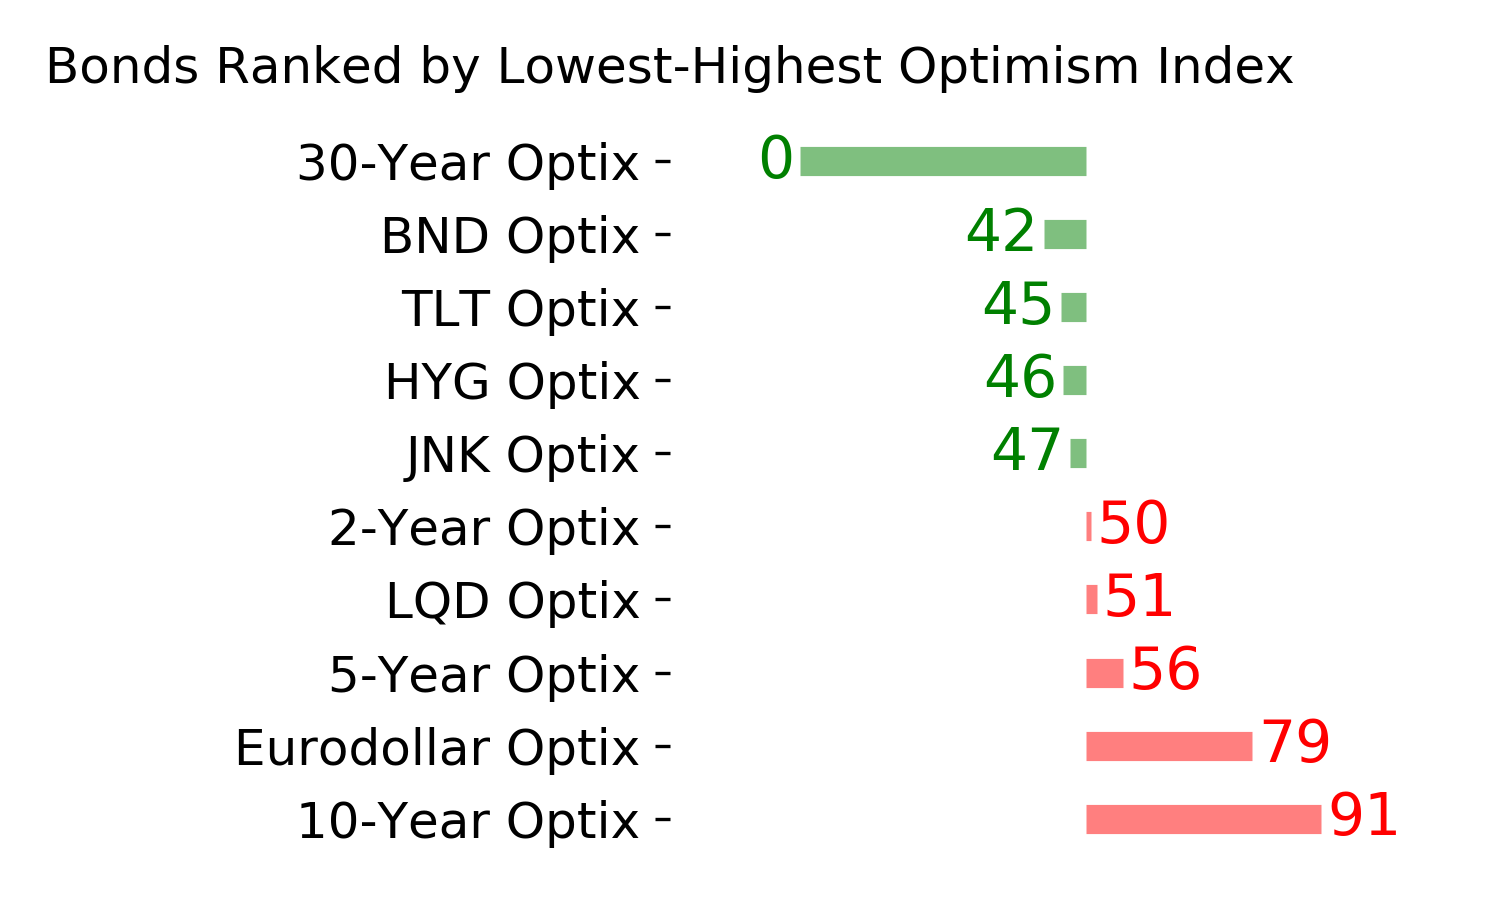
Ranks
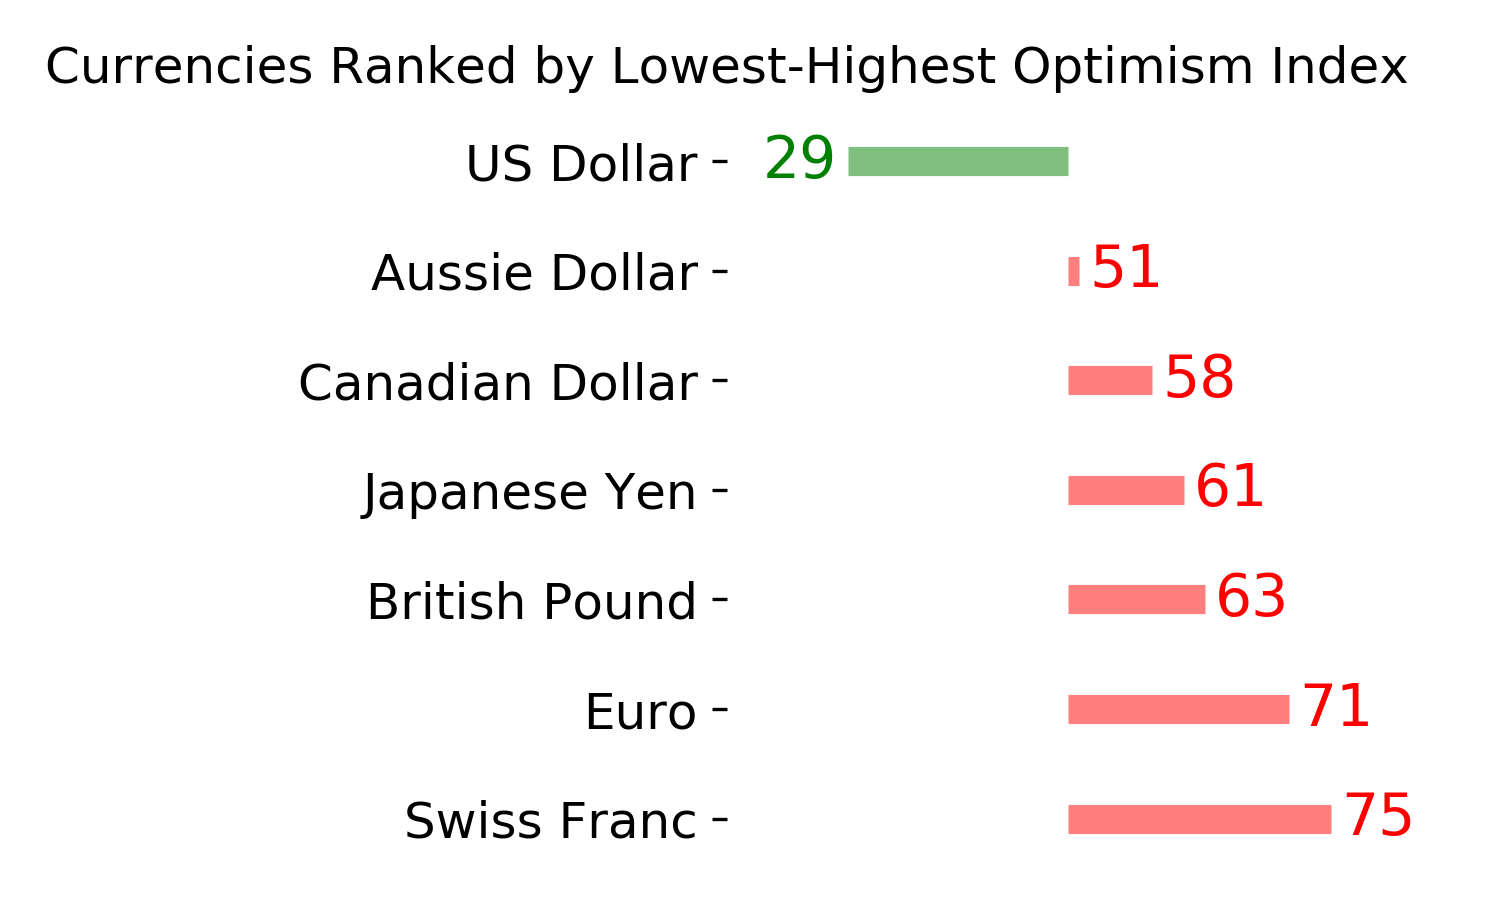
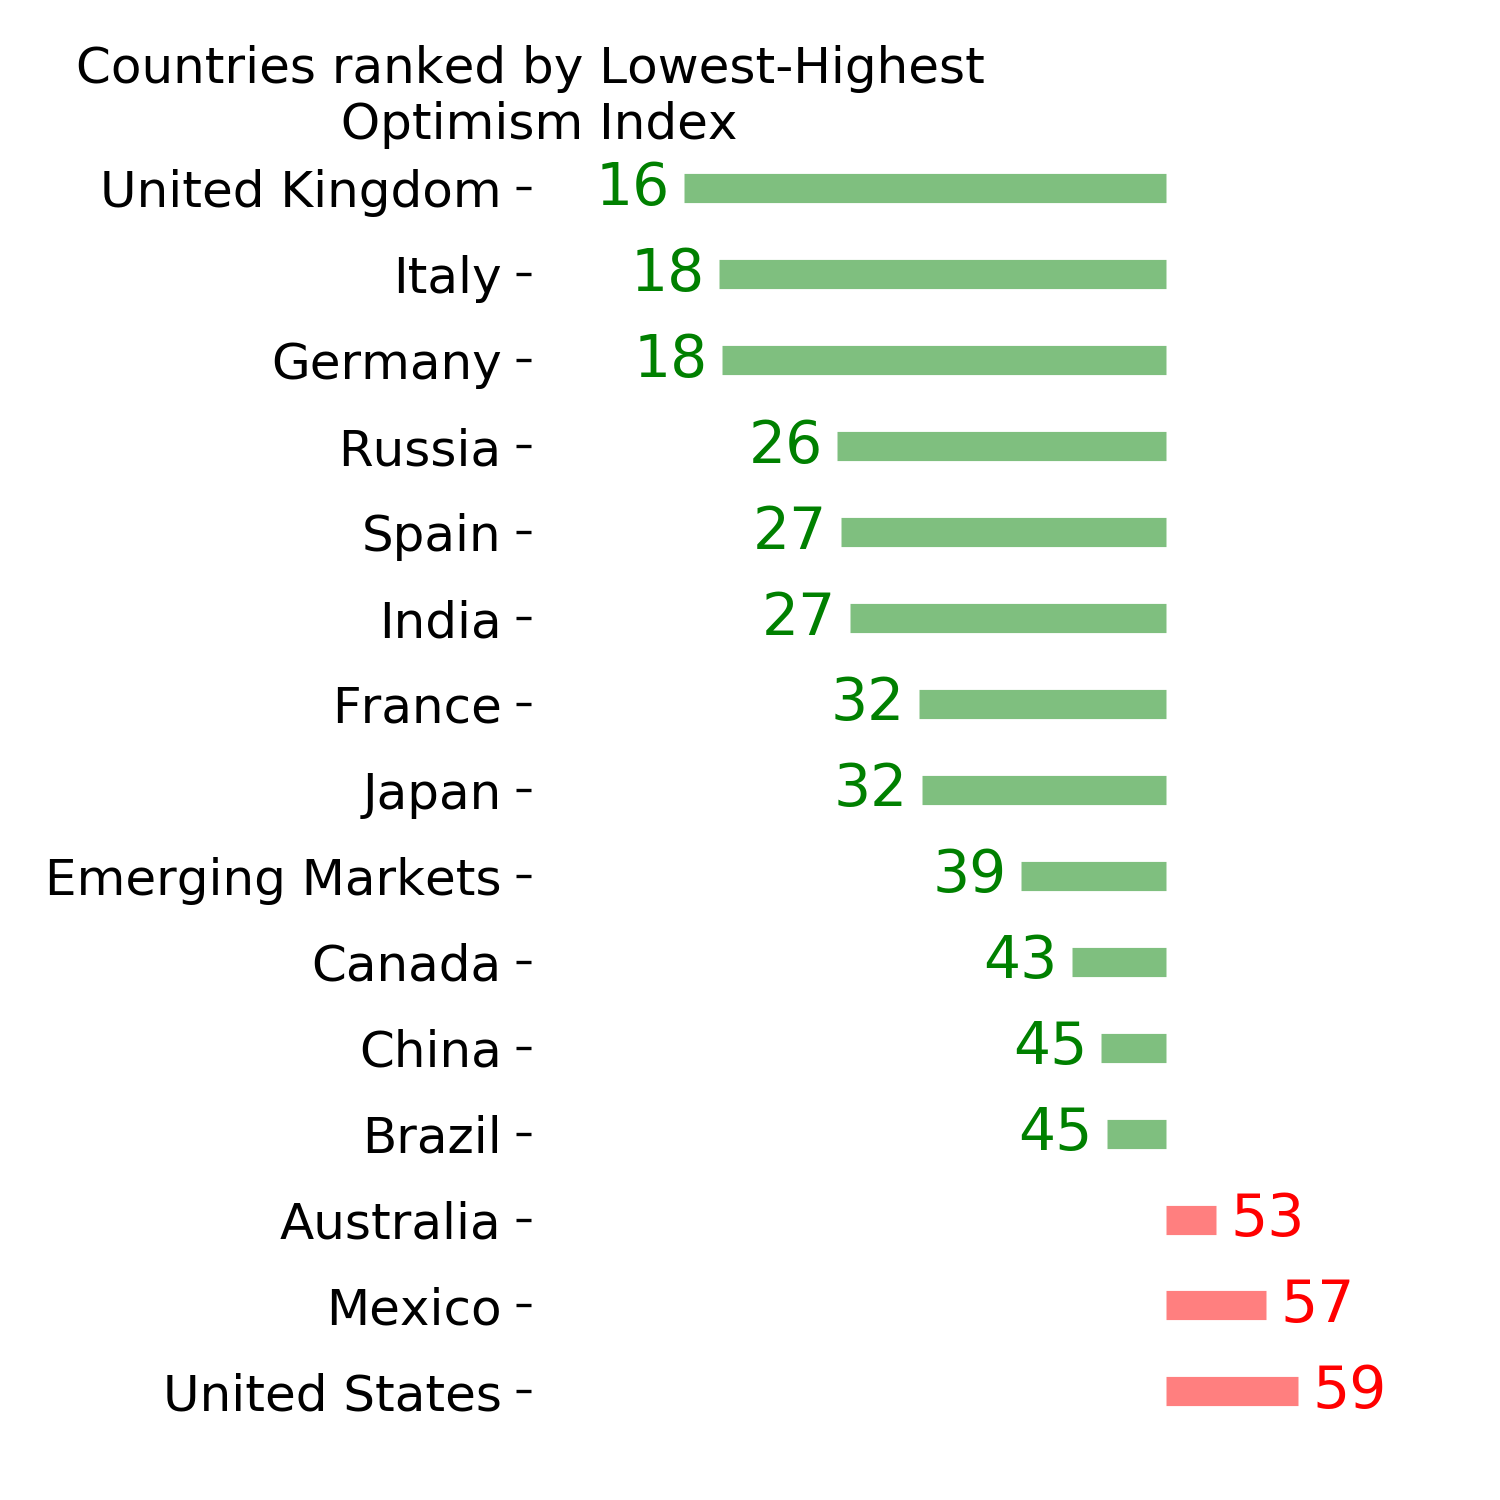
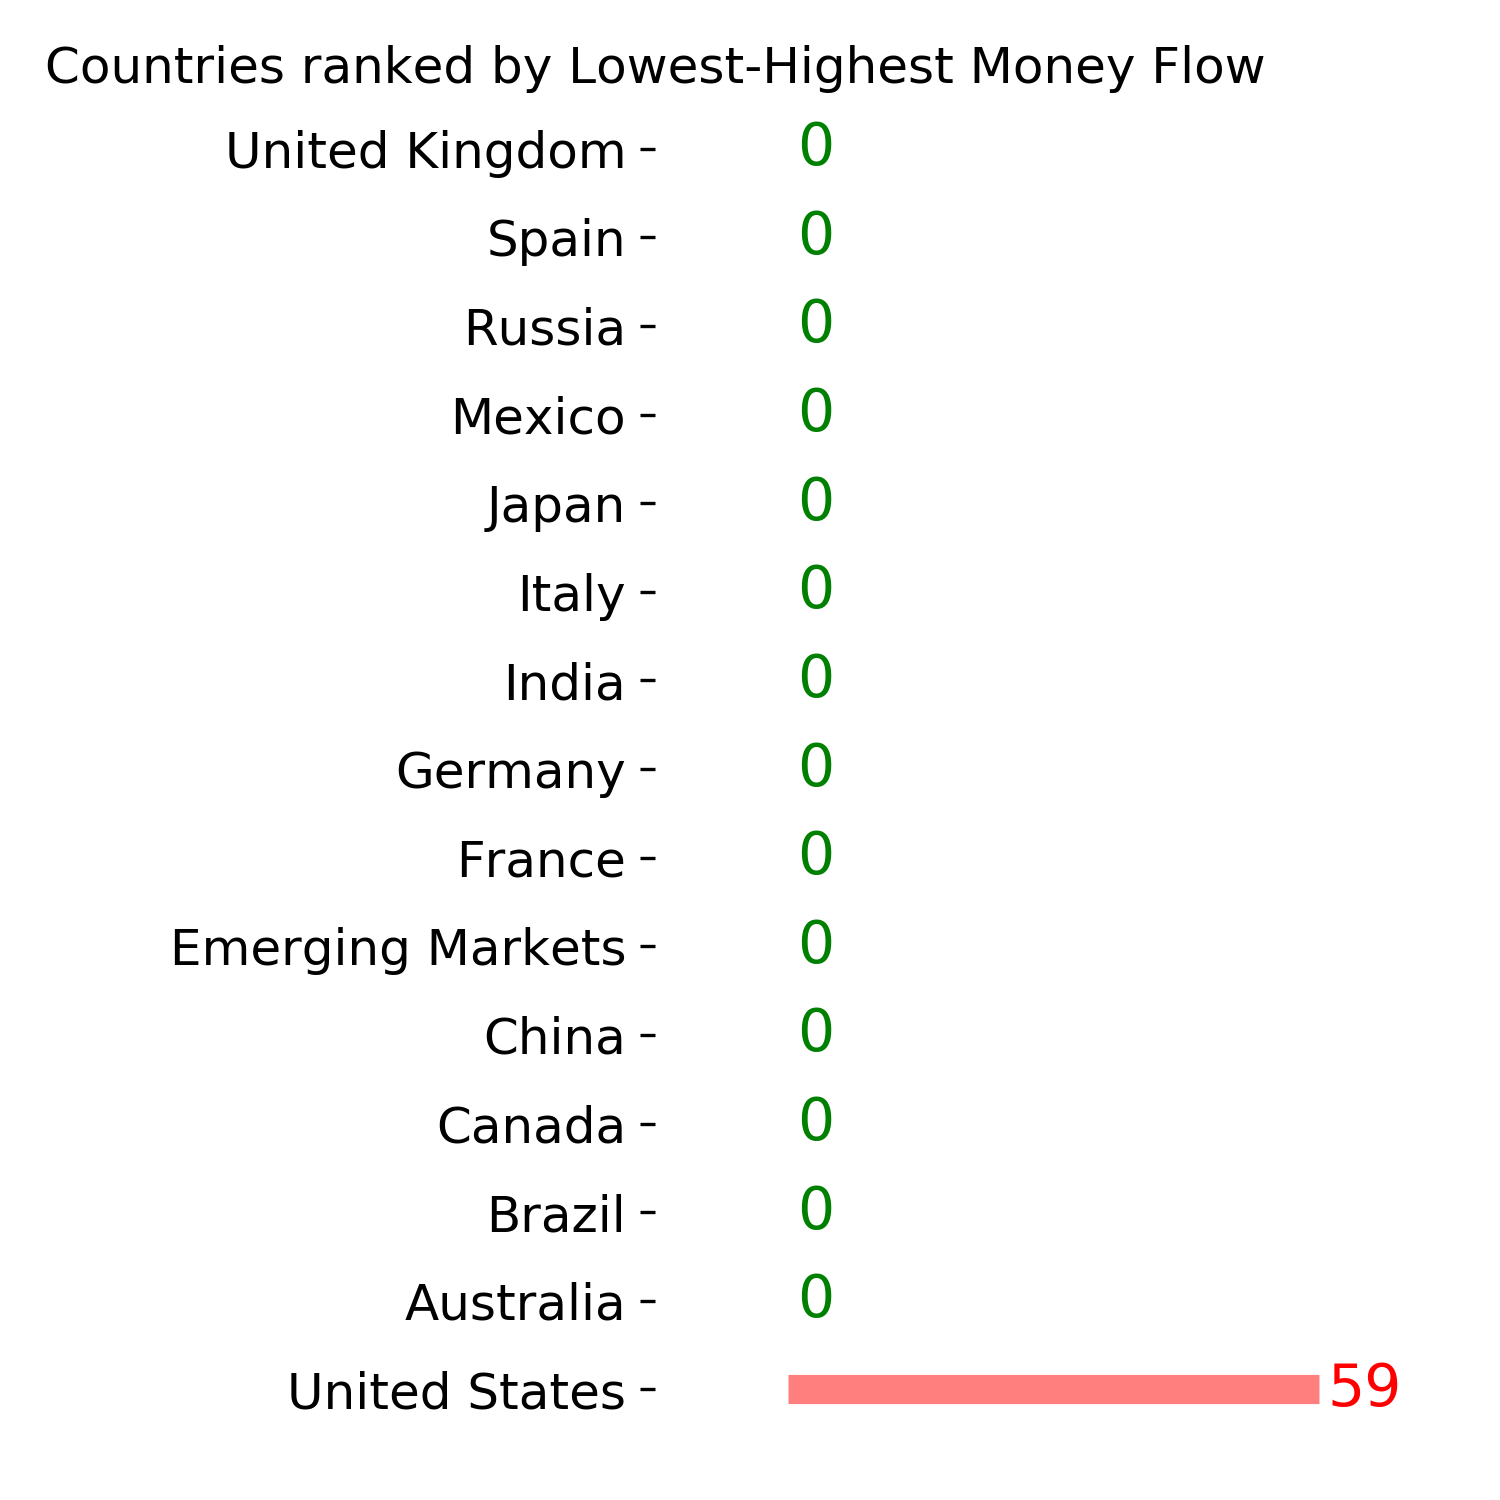
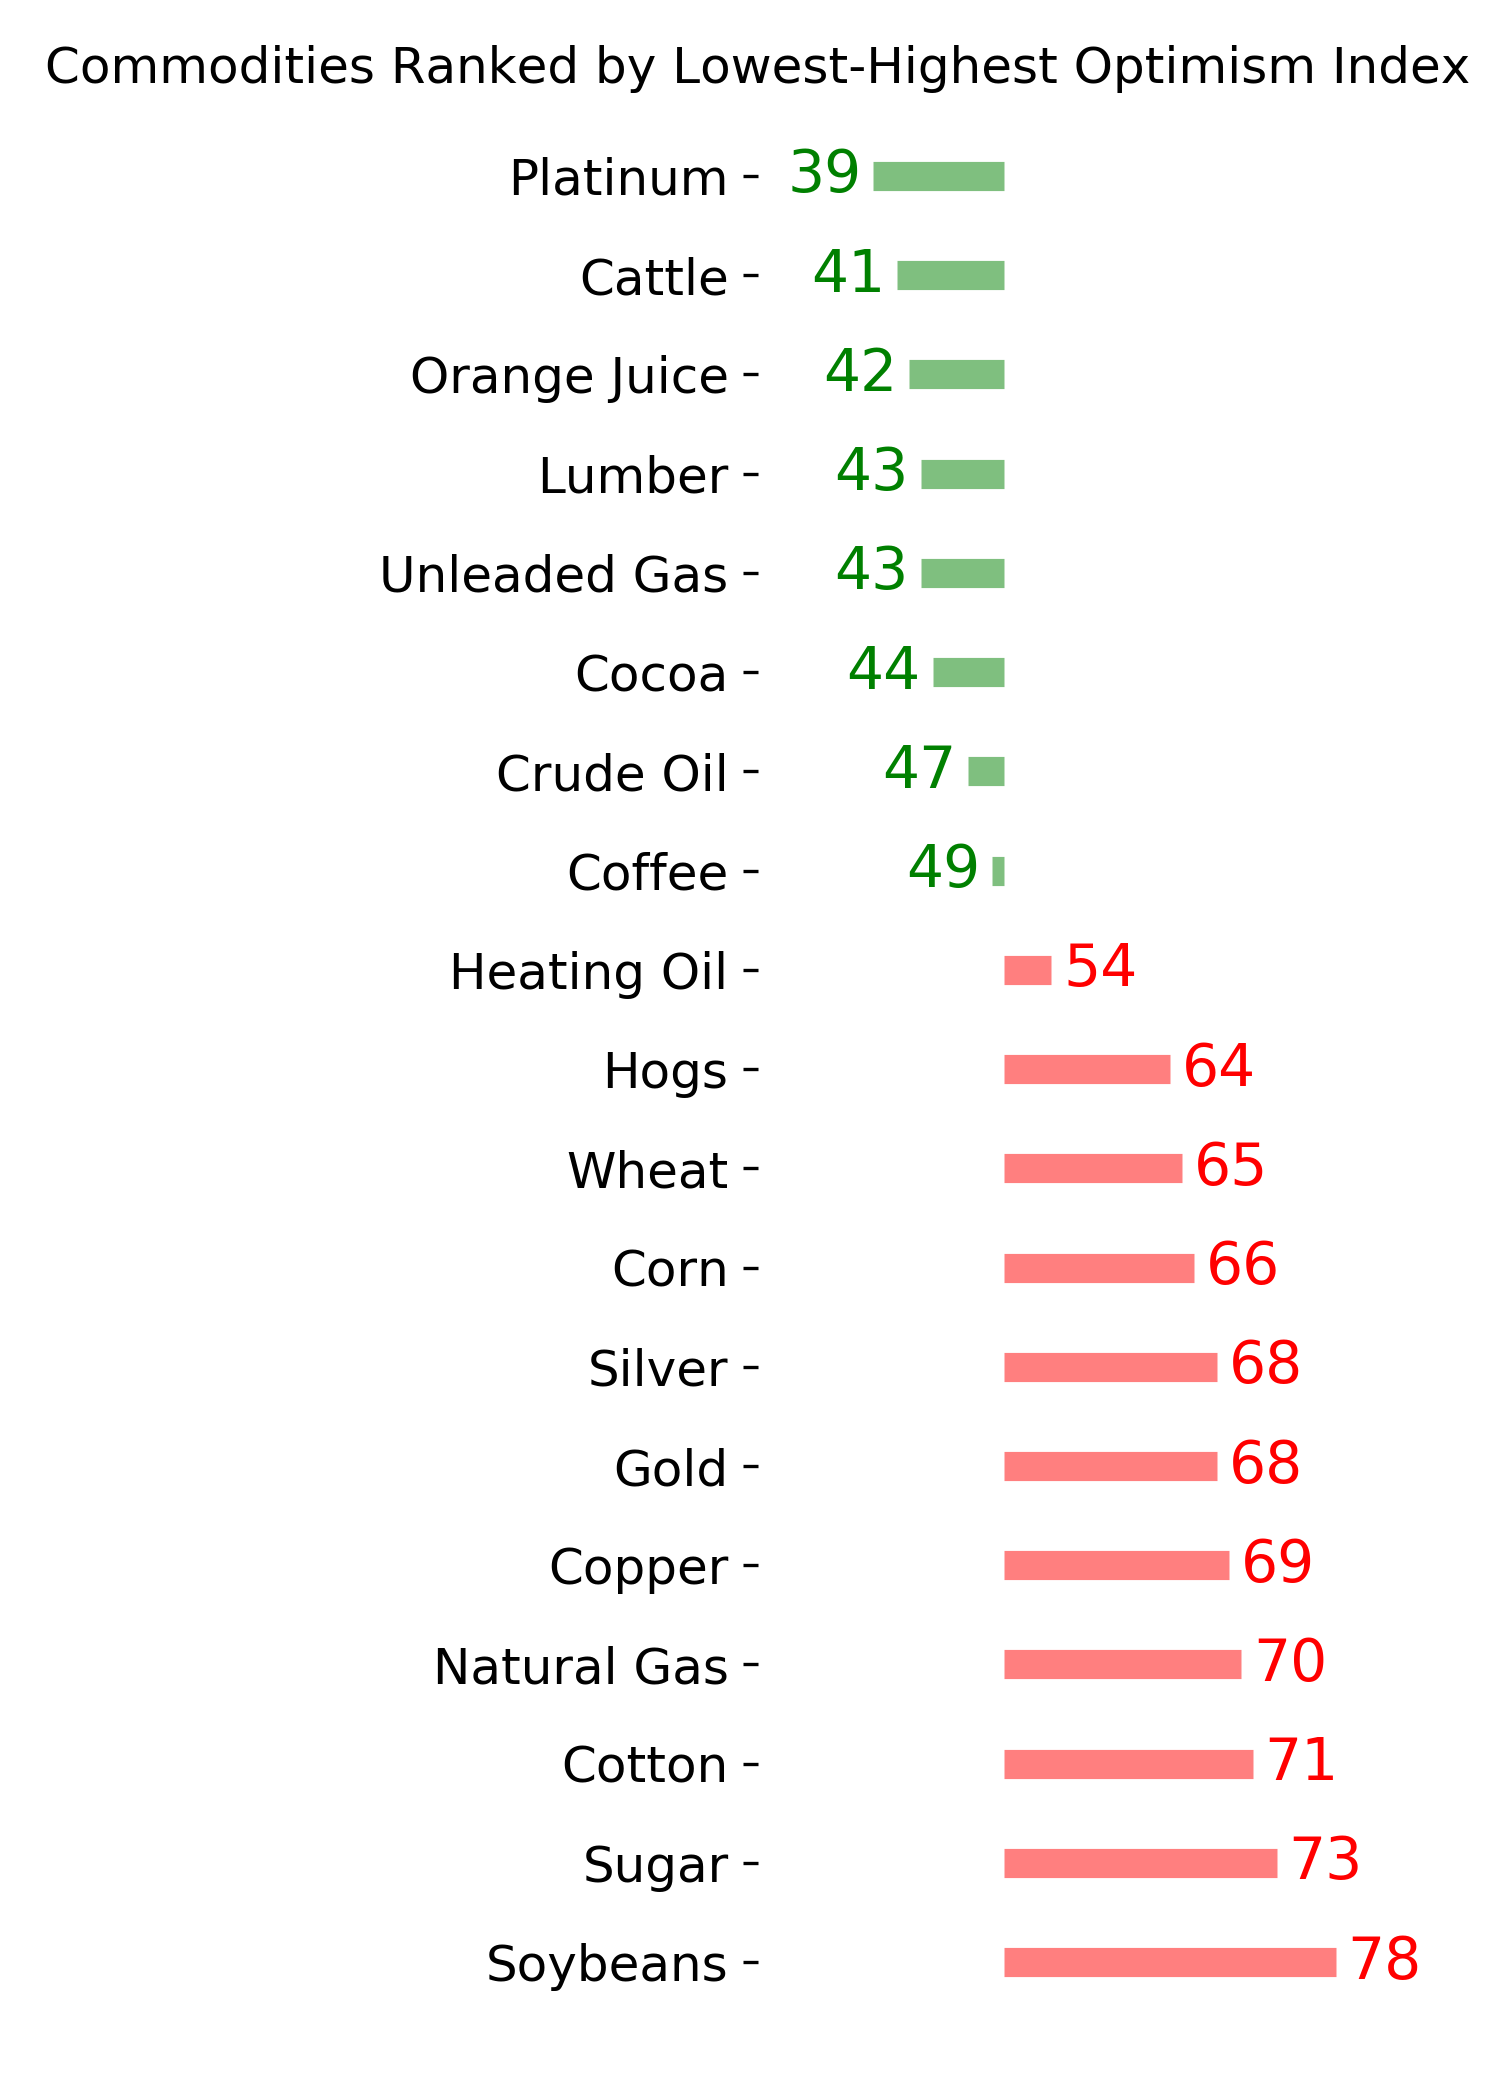
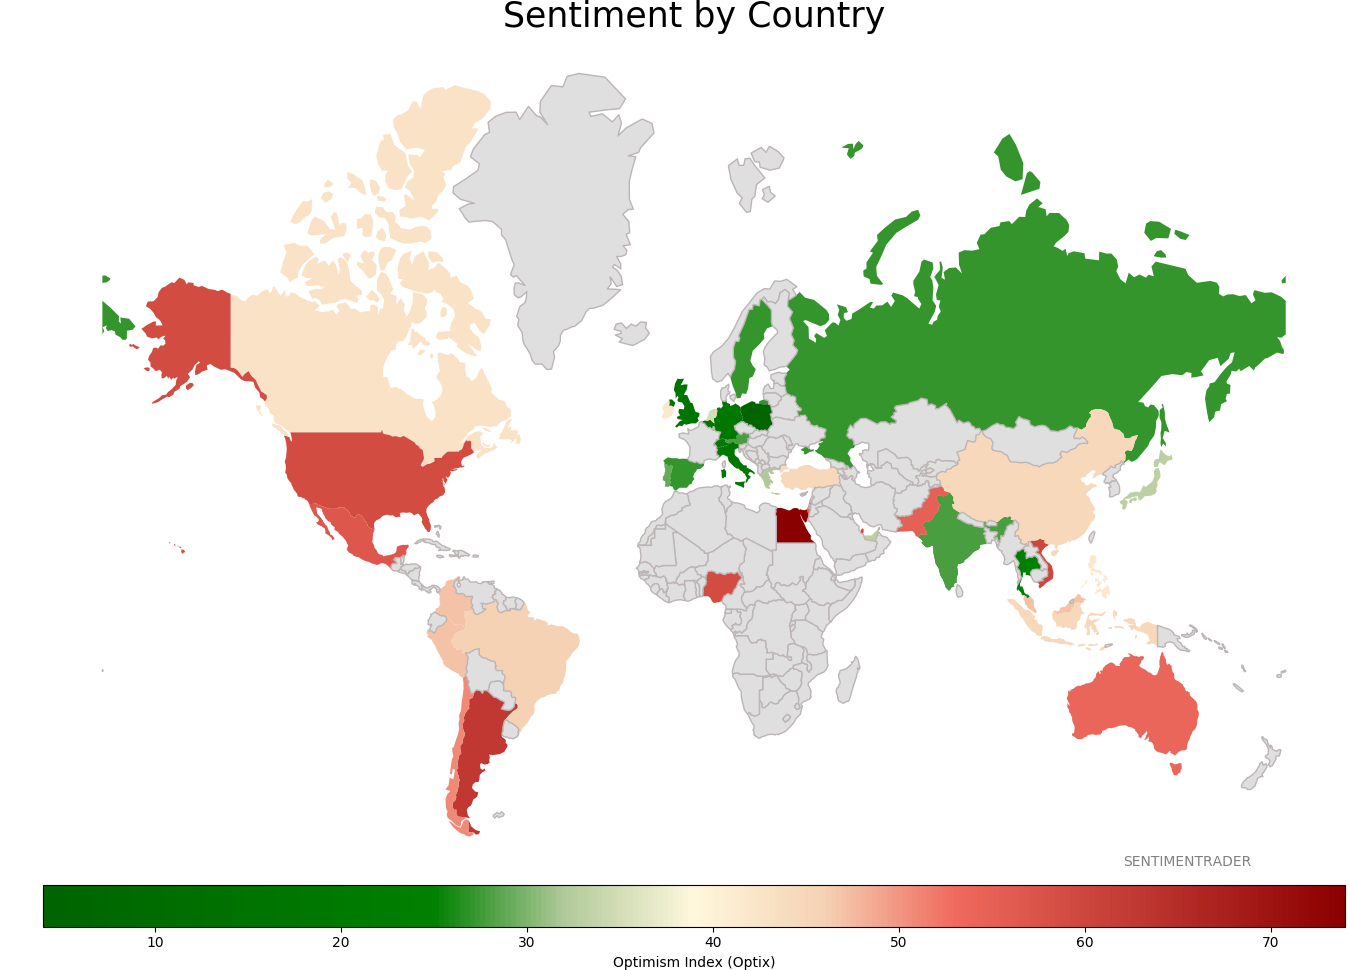
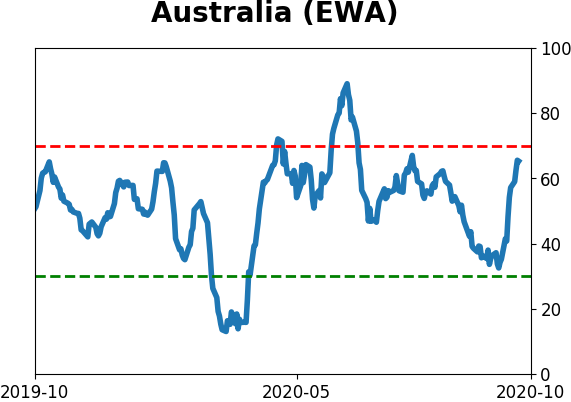
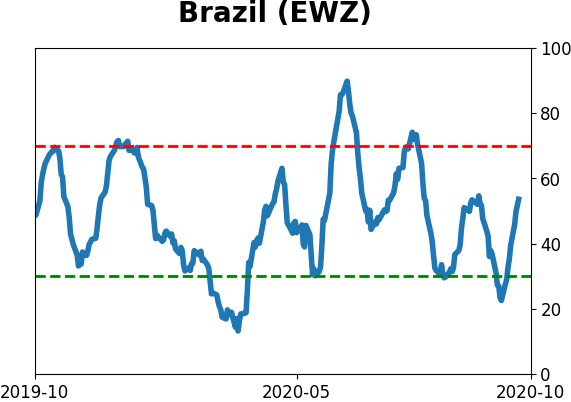
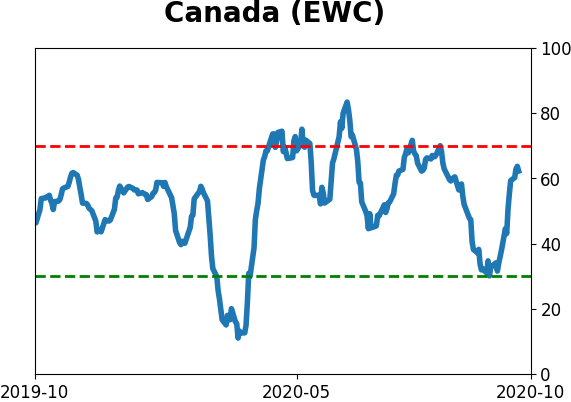
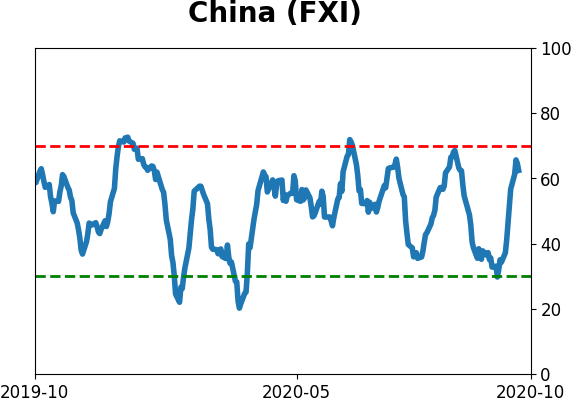
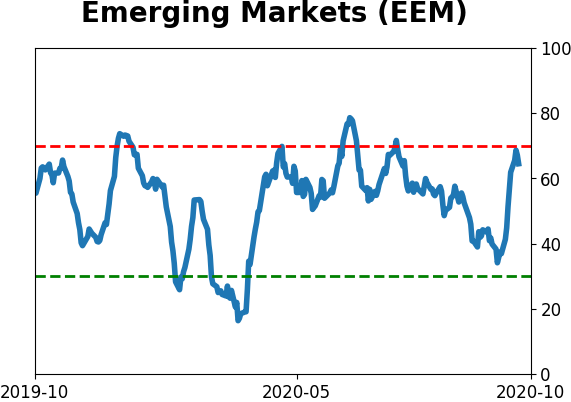
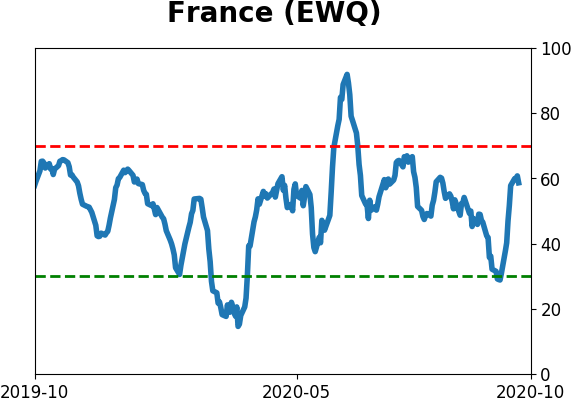
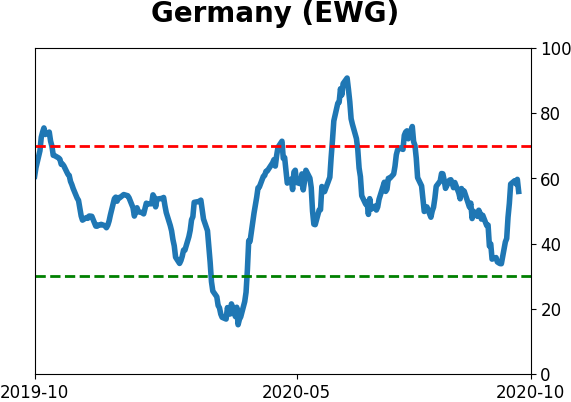
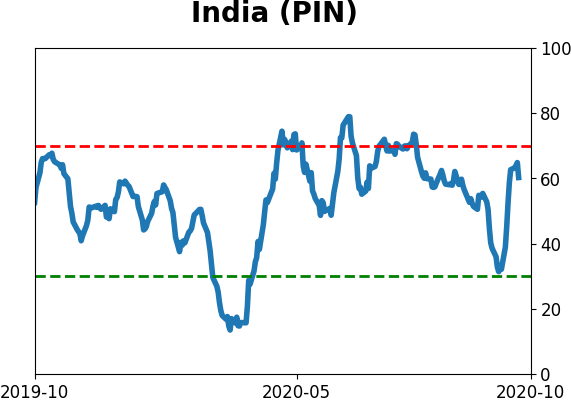
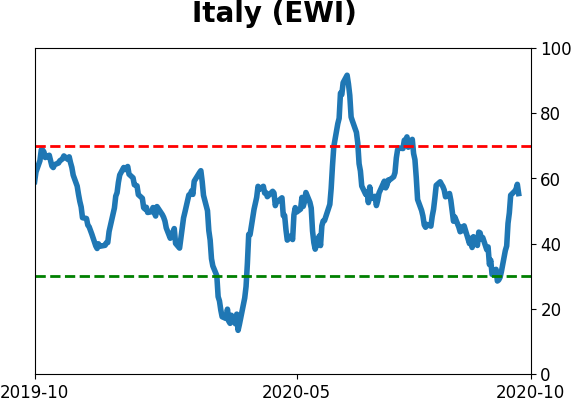
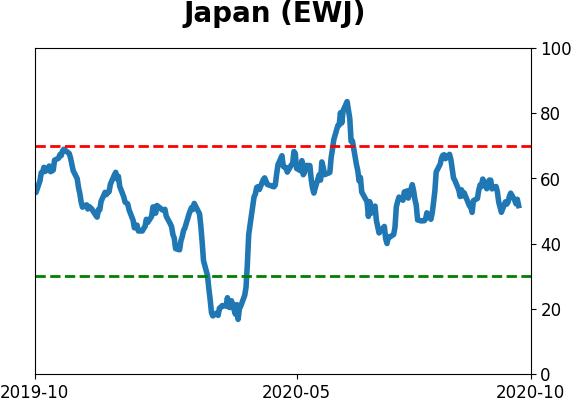
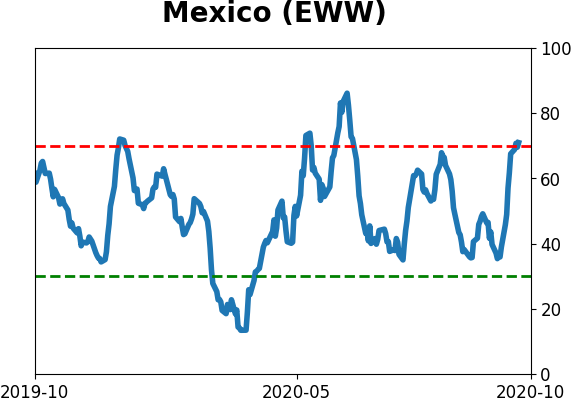
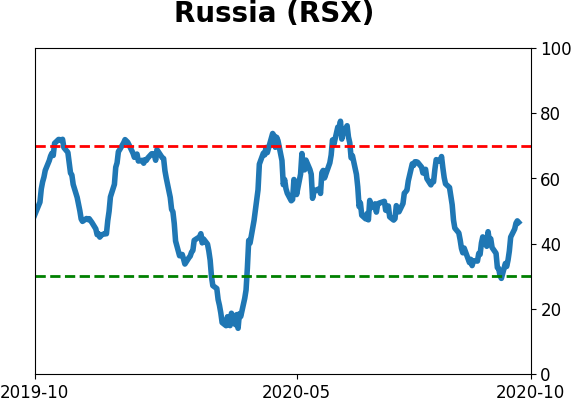
Sentiment Around The World
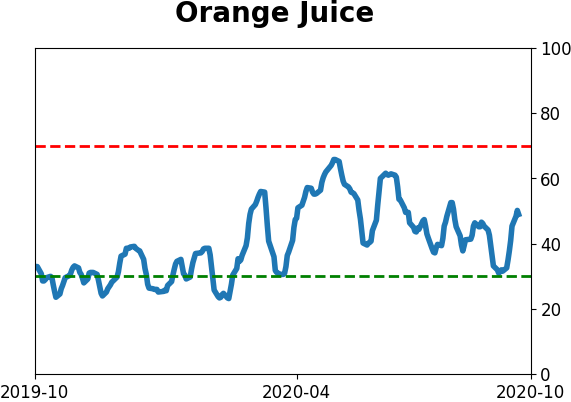
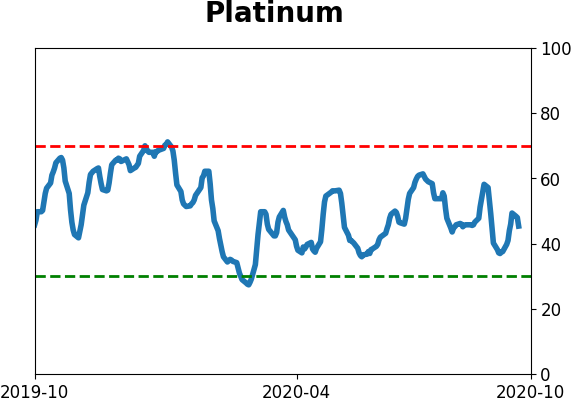
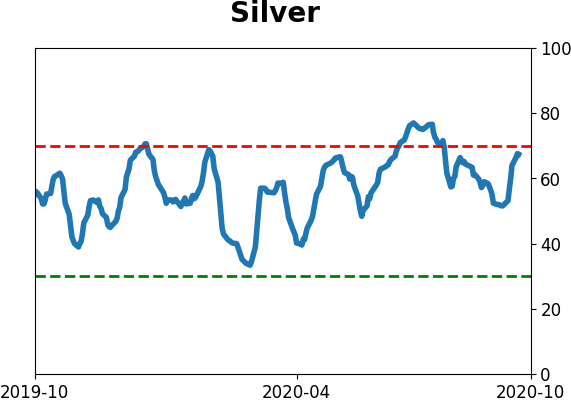
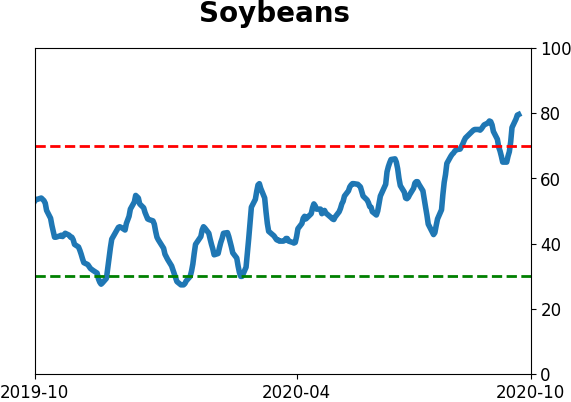
Optimism Index Thumbnails
|
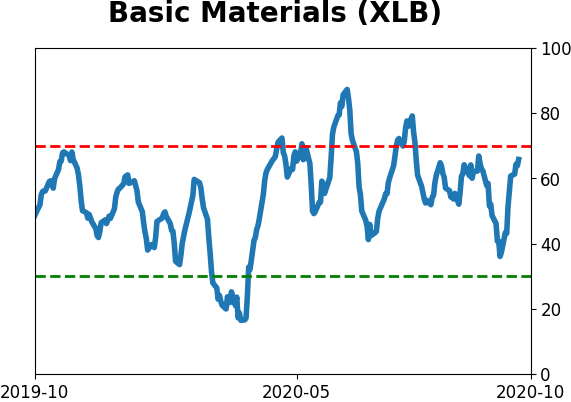
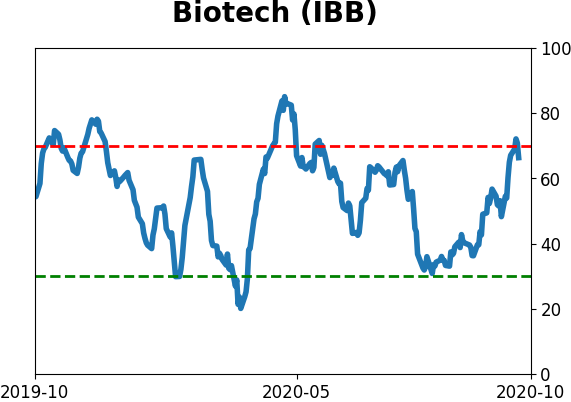
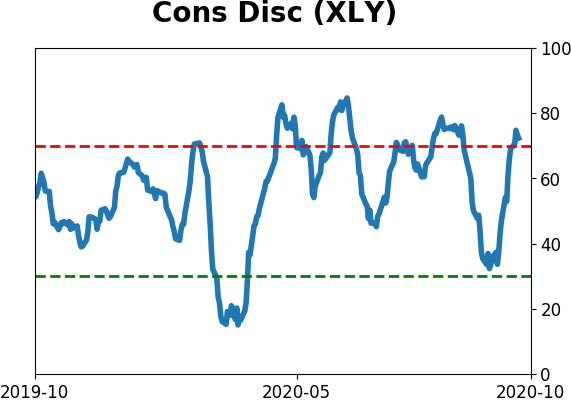
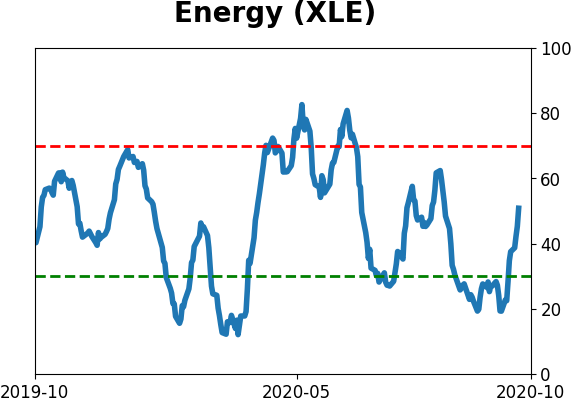
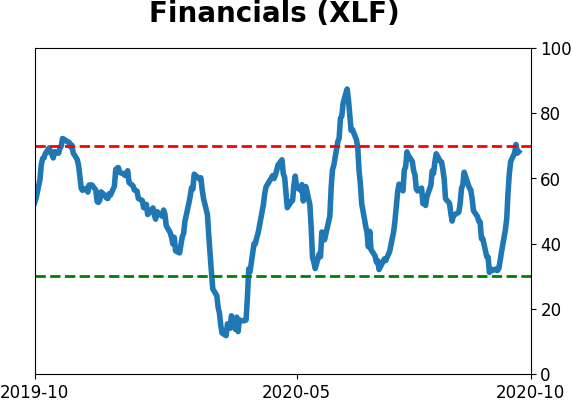
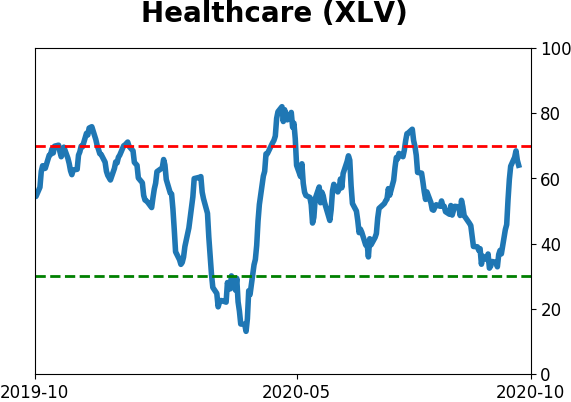
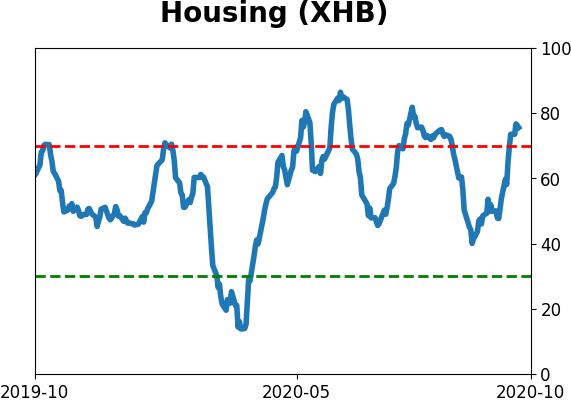
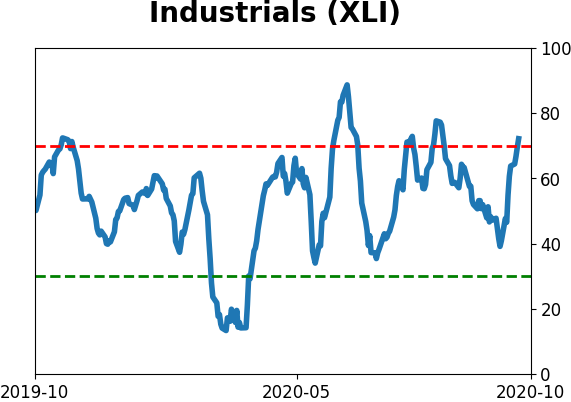
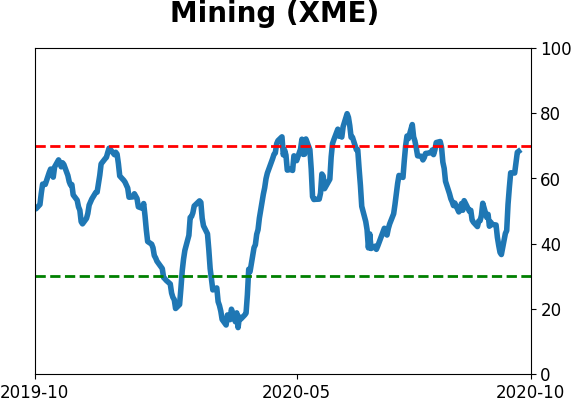
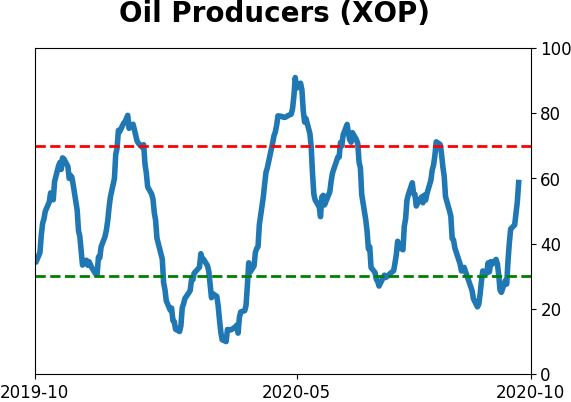
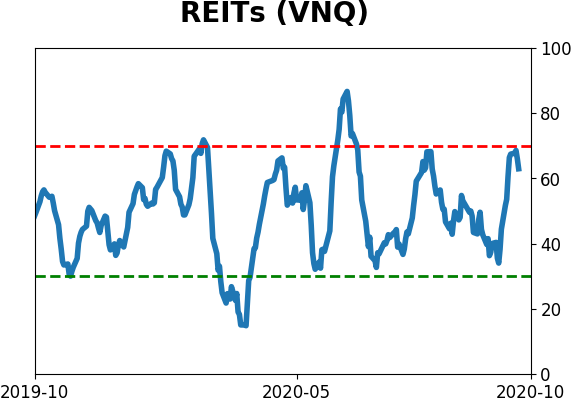
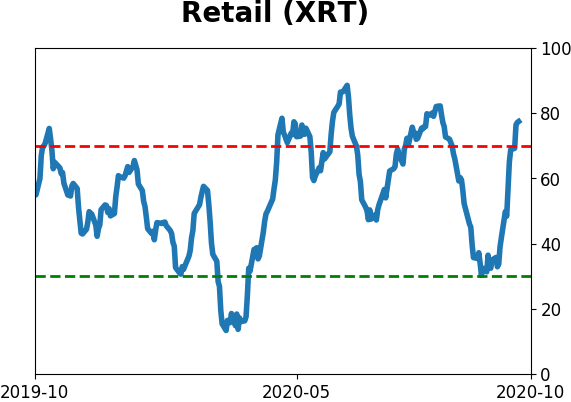
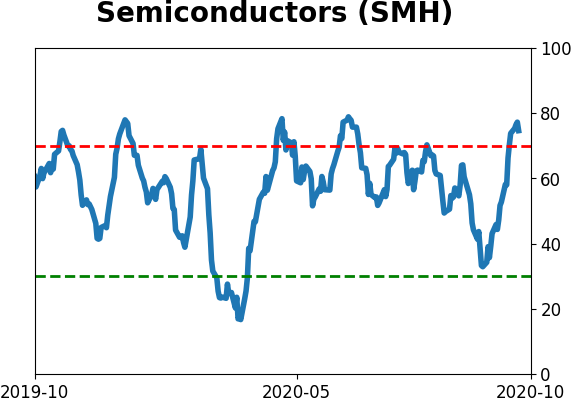
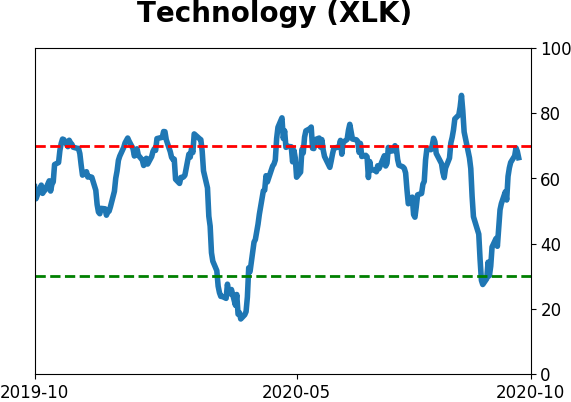
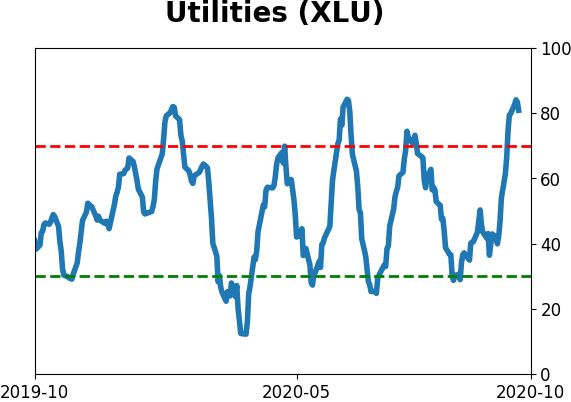
Sector ETF's - 10-Day Moving Average
|
|
|
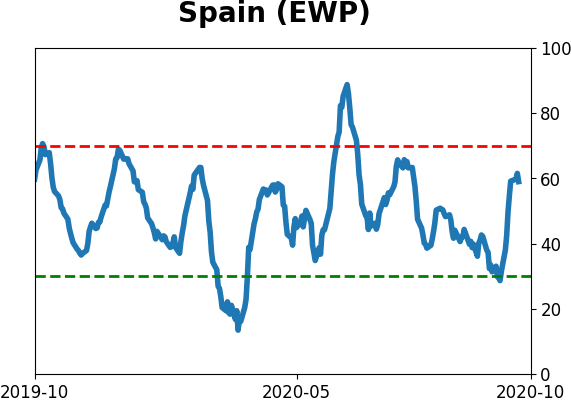
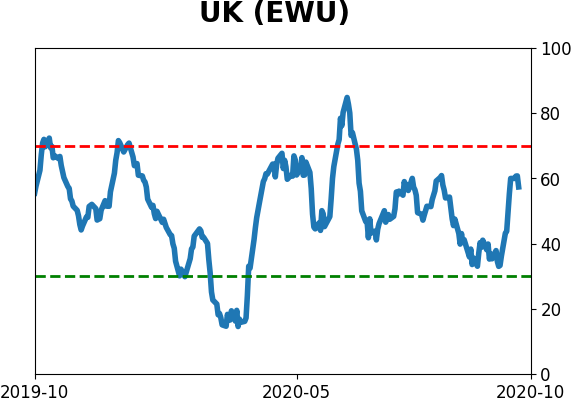
Country ETF's - 10-Day Moving Average
|
|
|
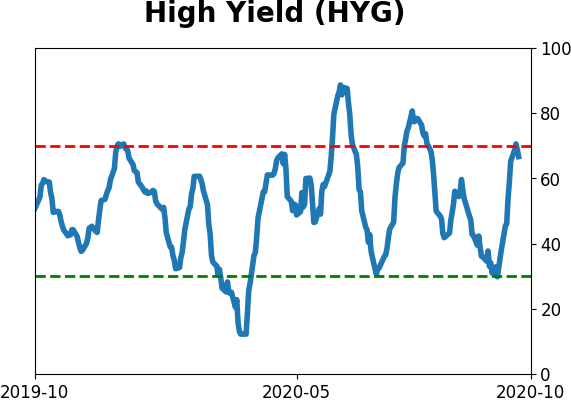
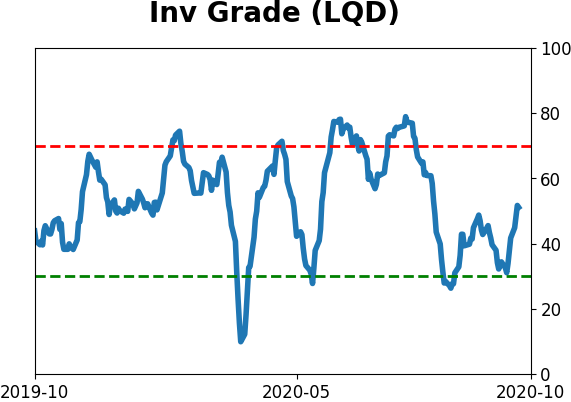
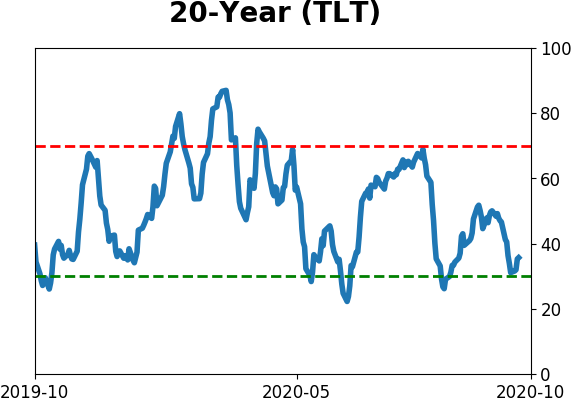
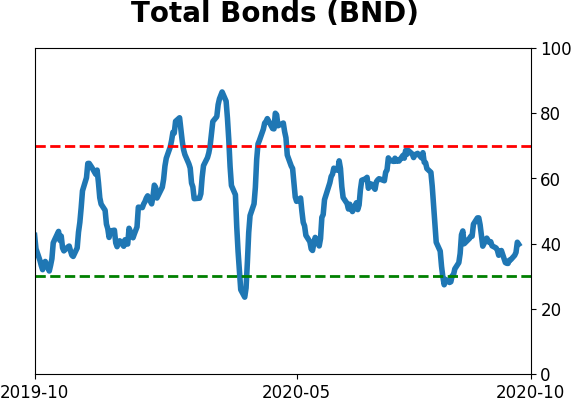
Bond ETF's - 10-Day Moving Average
|
|
|
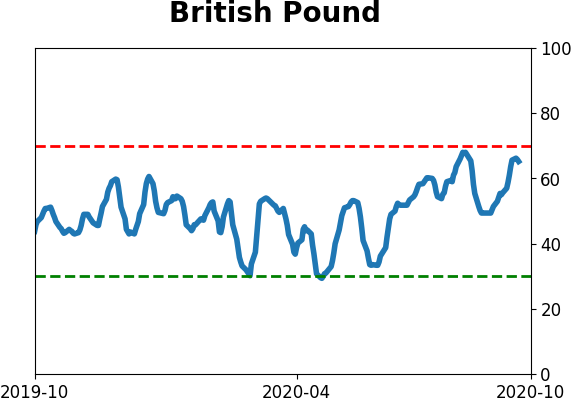
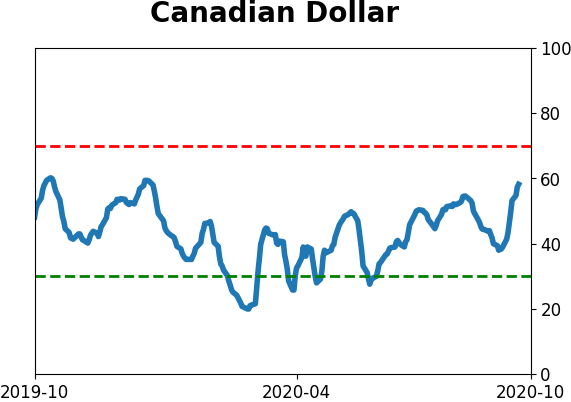
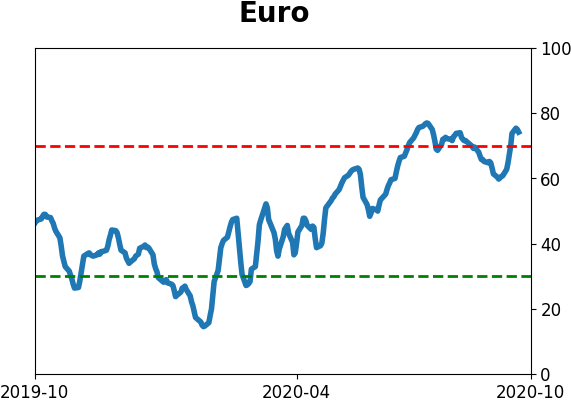
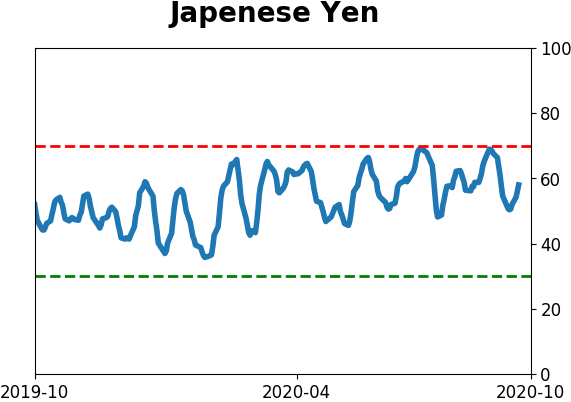
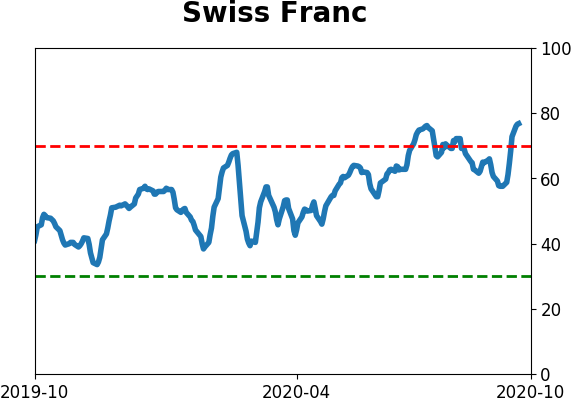
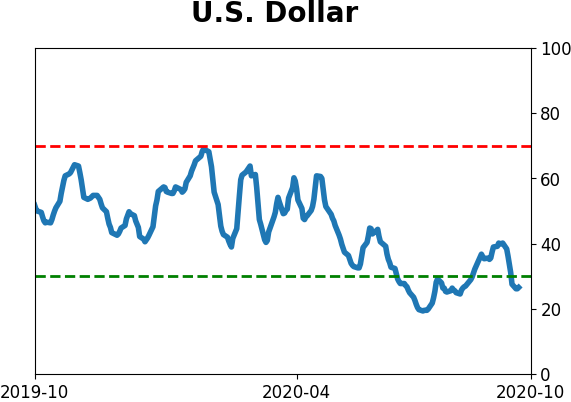
Currency ETF's - 5-Day Moving Average
|
|
|
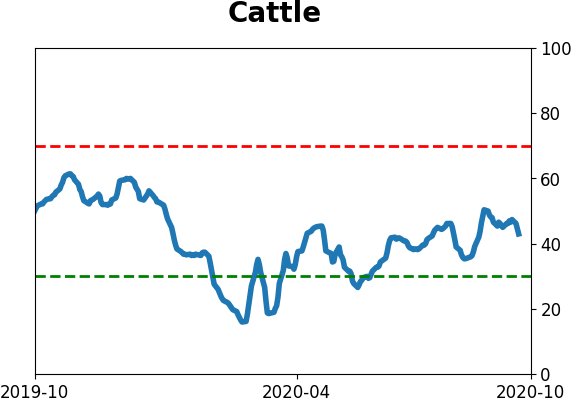
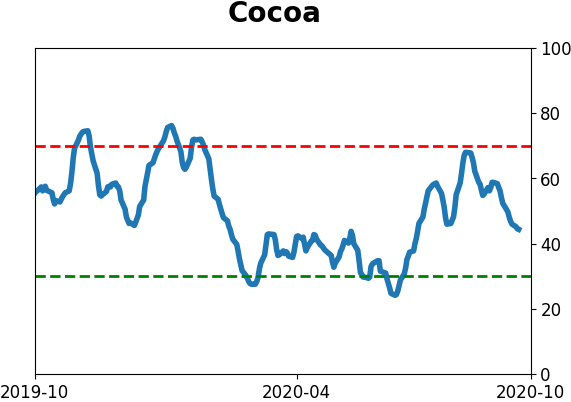
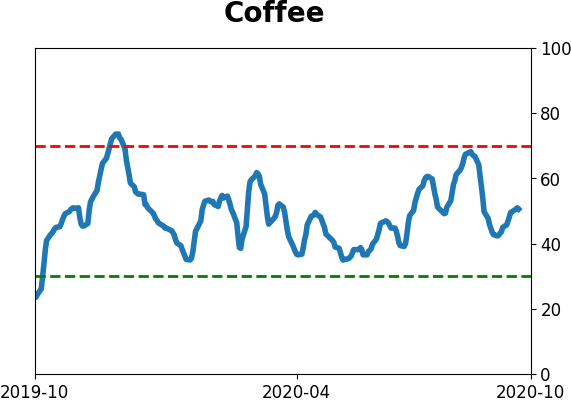
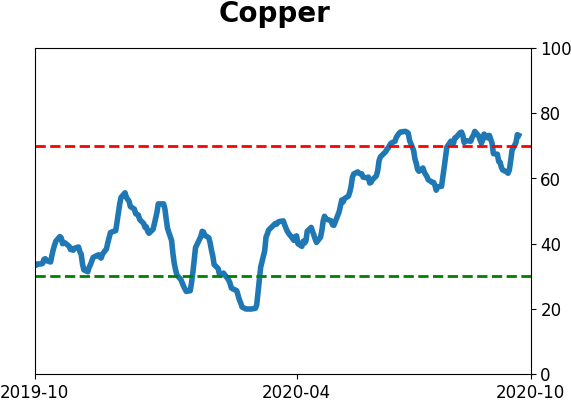
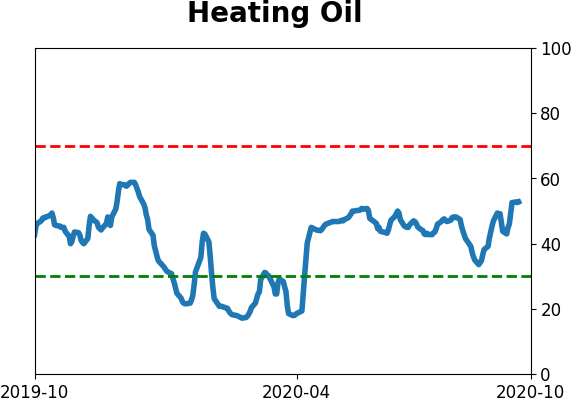
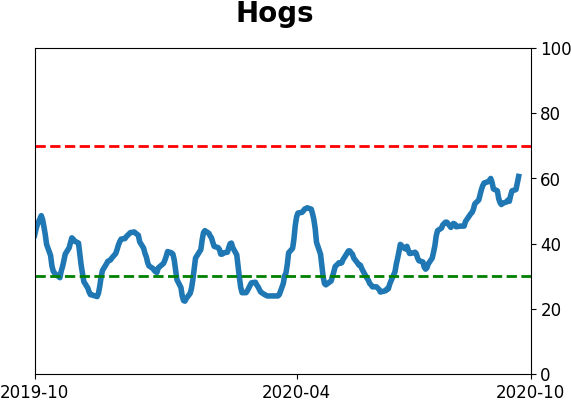
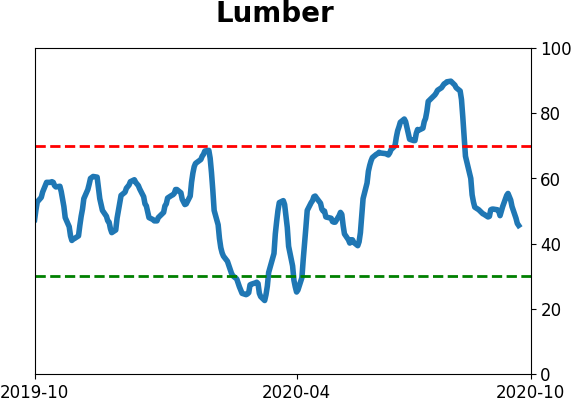
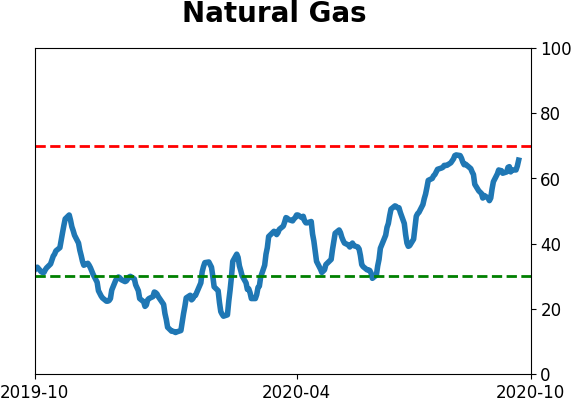
Commodity ETF's - 5-Day Moving Average
|
|