Headlines
|
|
For the 1st time in months, oil rigs come back online:
To save money, energy companies idled hundreds of rigs over the summer. That has just begun to change as a few come back online. When rig counts plunge then start to recover, it has been a positive long-term sign for energy stocks, but not so much for oil prices.
Traders seem positive on stocks, negative on indexes:
Over the past few sessions, options traders have been trading calls more heavily than puts on stocks. But on indexes, it's flipped, with more puts than calls. There has never been this extreme of a difference. Other times it seems like traders were hedging their bets with index puts, stocks mostly rose.
Two weeks of (kind of) big moves: After a period of relative stability, the S&P 500 has moved at least 0.5% each day for the past 11 sessions, as noted by strategist Callie Cox. When stocks have rallied and then start to swing, the old market cliche is that it's a sign of a trend change. Below, we can see every time something similar occurred. It did not precede anything bad over the next 2-3 months, but those longer-term returns weren't great.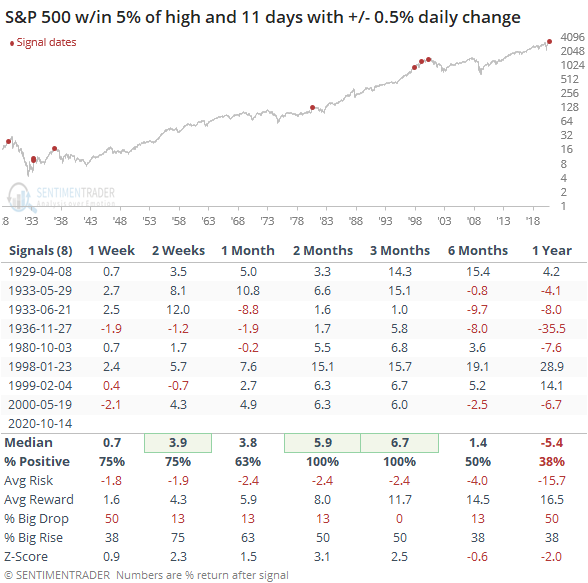
Investors leave stocks, love bonds: In the 3 weeks ending October 7, investors pulled an average of more than $15 billion per week from equity funds (mutual and exchange-traded). The Backtest Engine shows this has been a constant theme since May, but prior to that it only triggered near the market bottoms in August 2011 and December 2018 during the past decade (it also triggered early during the financial crisis). They shoveled money into bond funds, which attracted more than $25.7 billion during the first week of October alone. That's the 3rd-highest weekly inflow out of all 835 weeks since 1997.
Bottom Line:
- A positive environment favors becoming aggressive on signs of excessive pessimism.
|
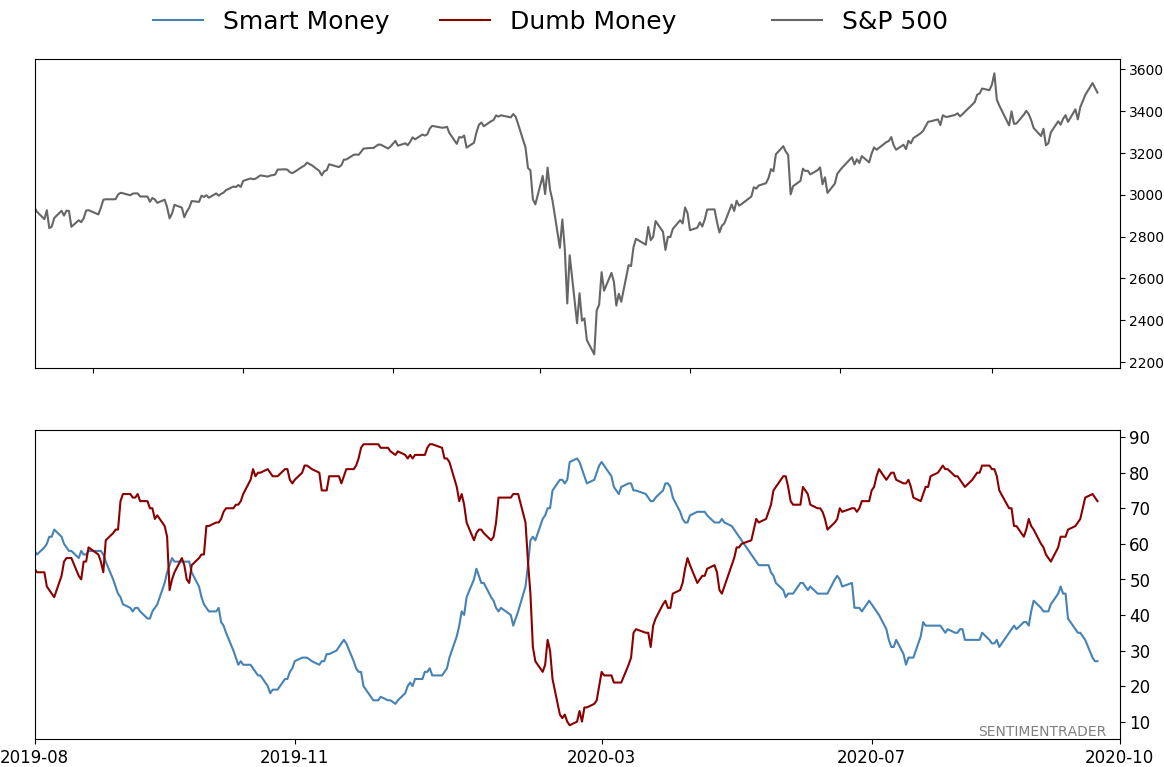
Smart / Dumb Money Confidence
|
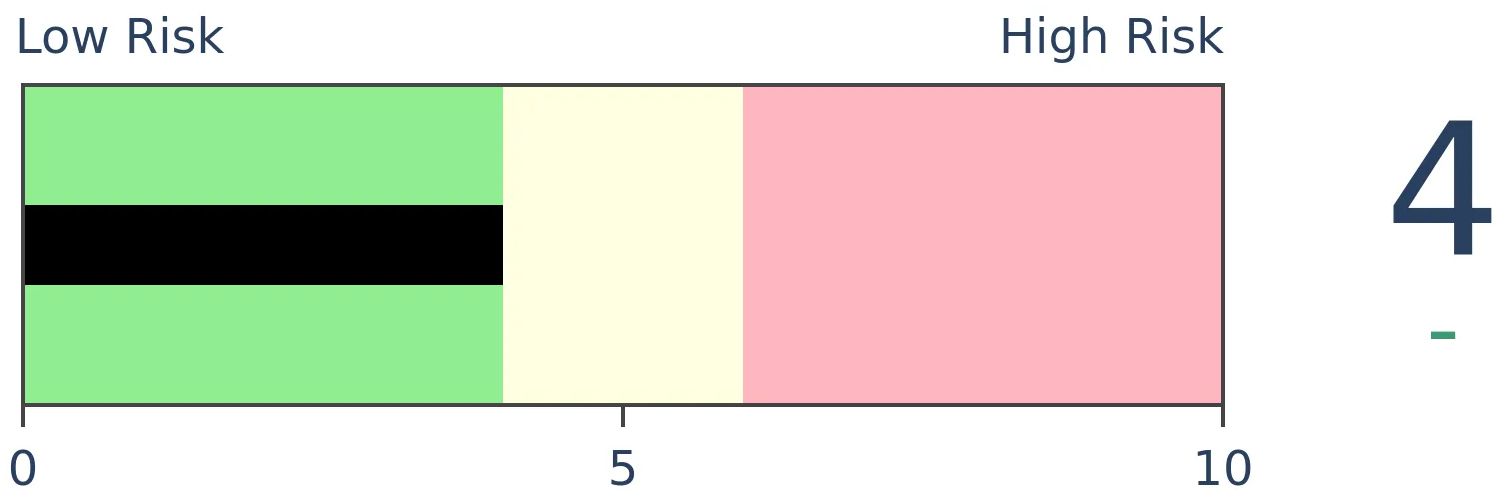
Smart Money Confidence: 27%
Dumb Money Confidence: 72%
|
|
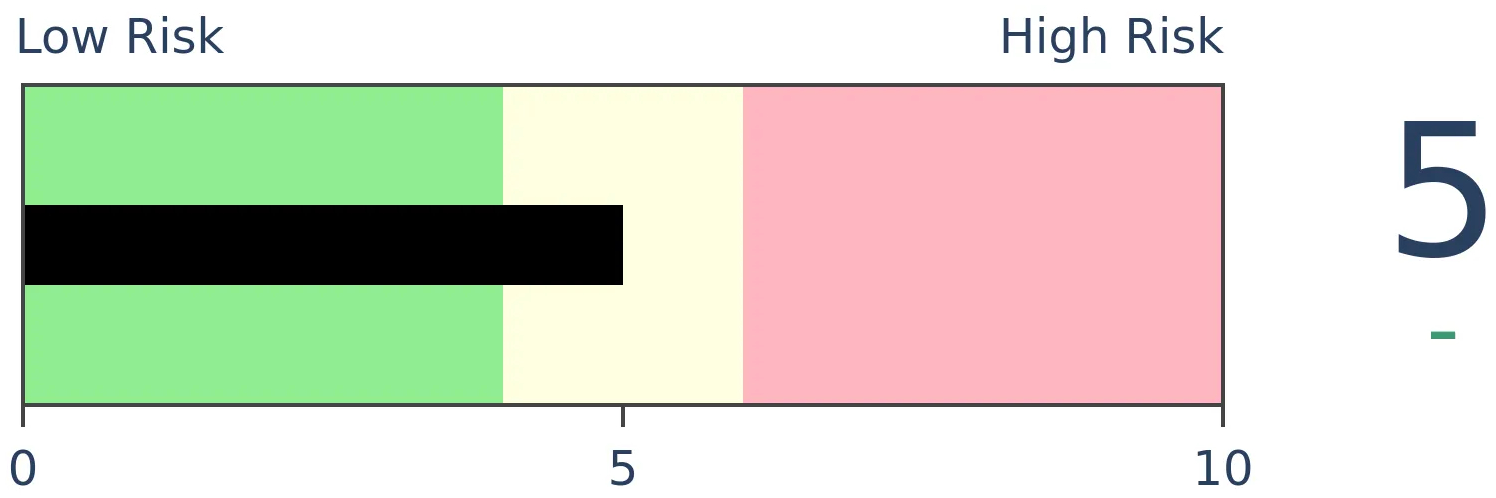
Risk Levels
Stocks Short-Term
|
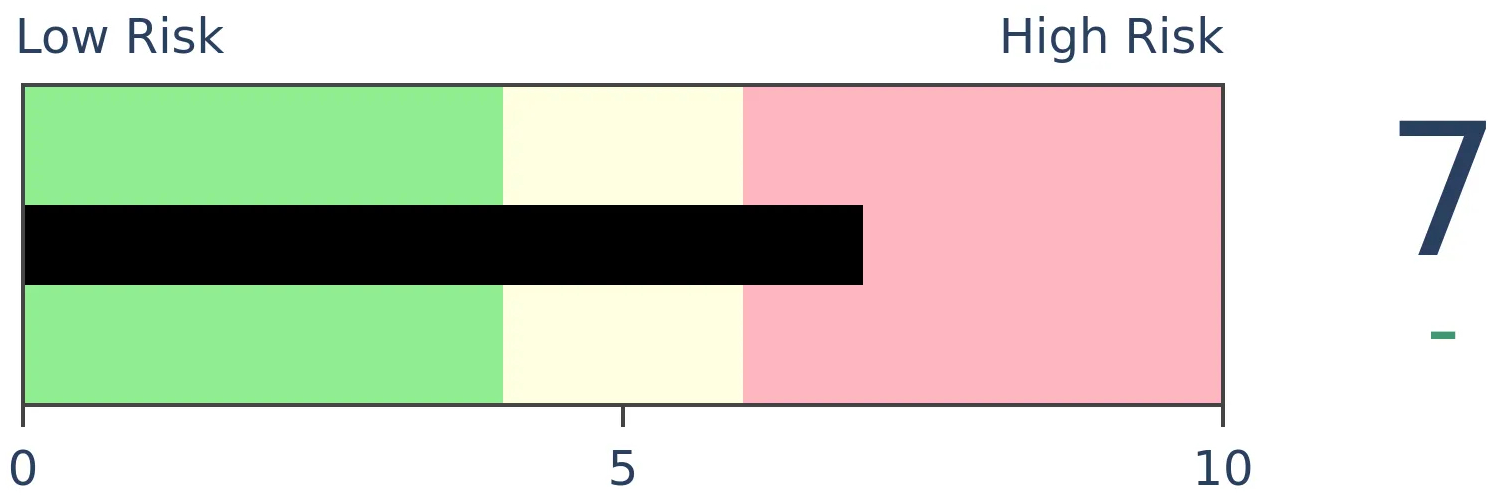
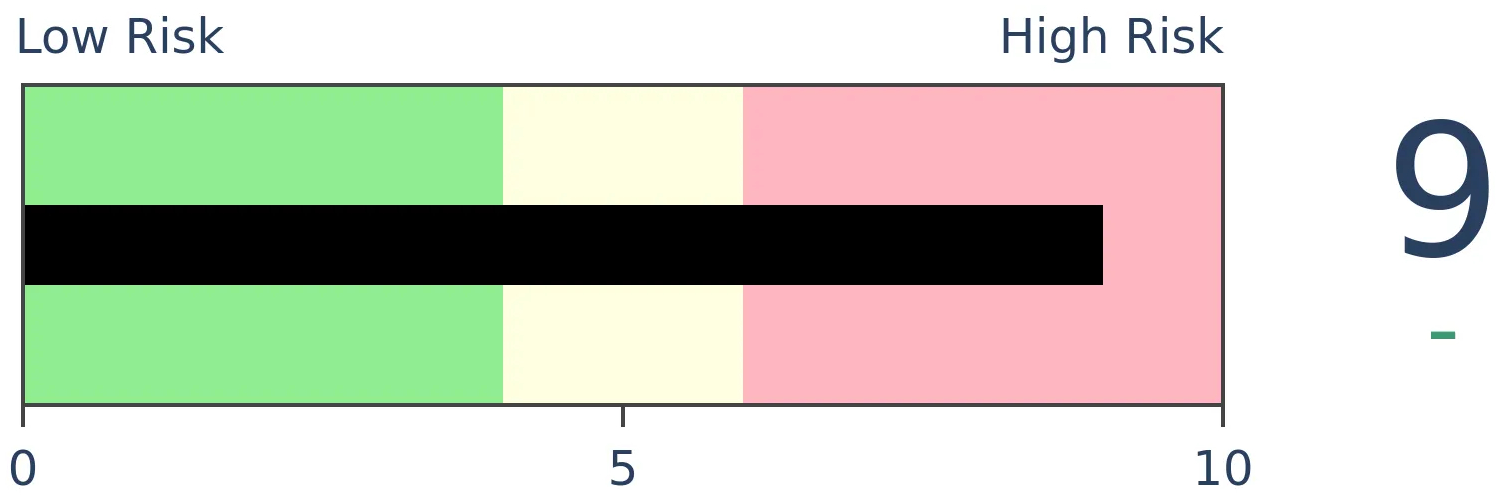
Stocks Medium-Term
|
|
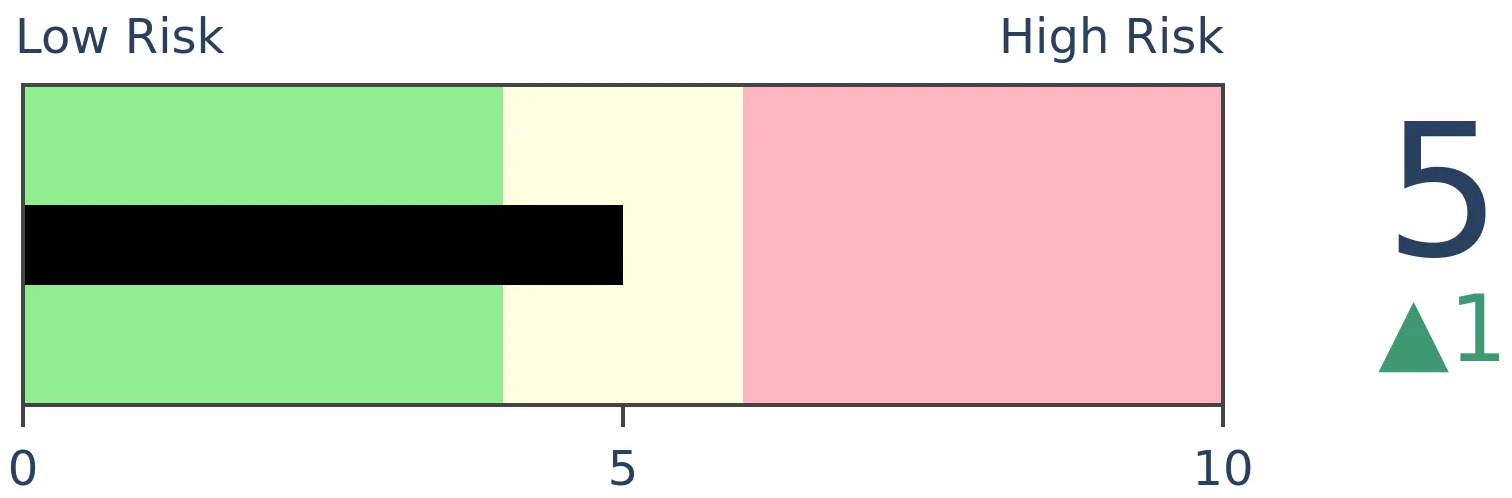
Bonds
|
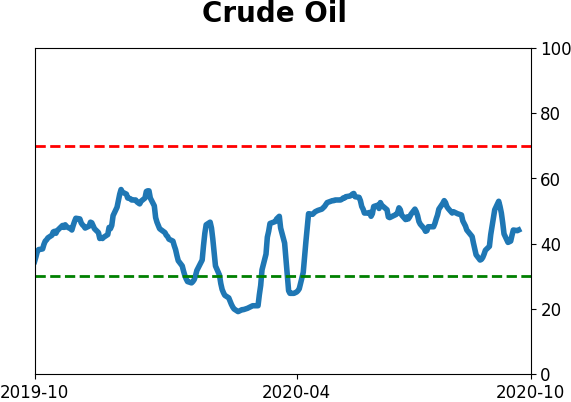
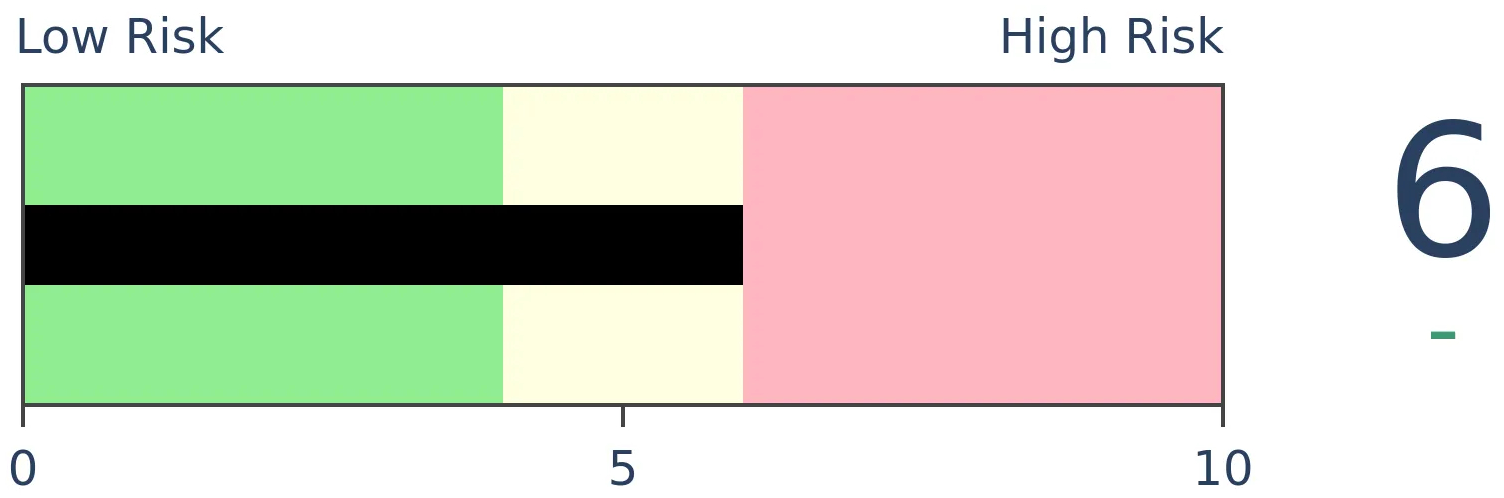
Crude Oil
|
|
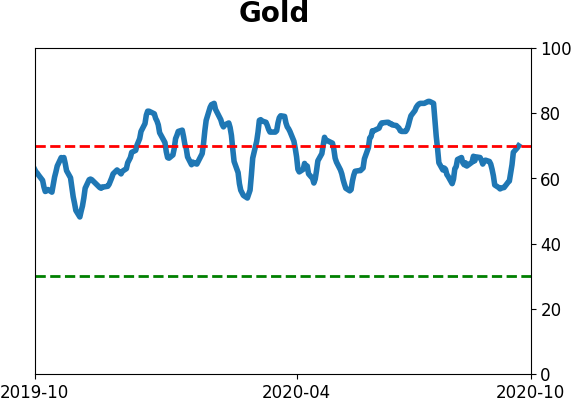
Gold
|
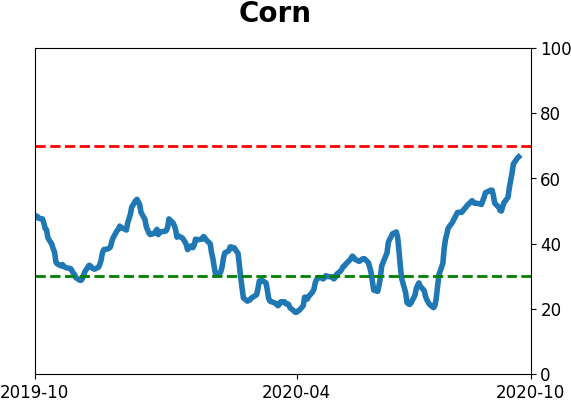
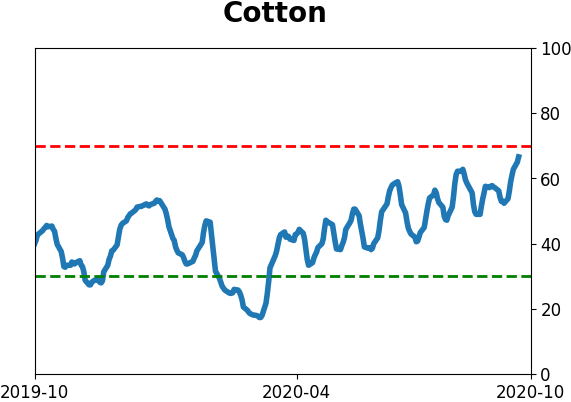
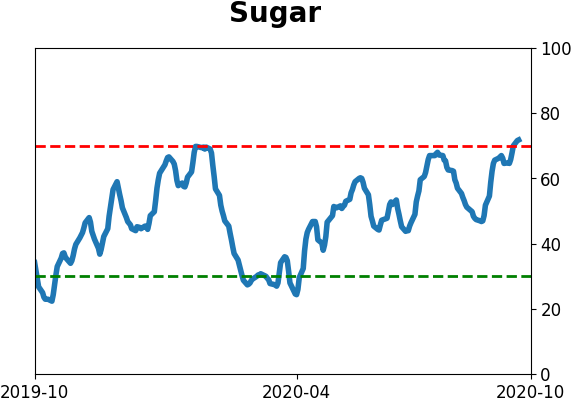
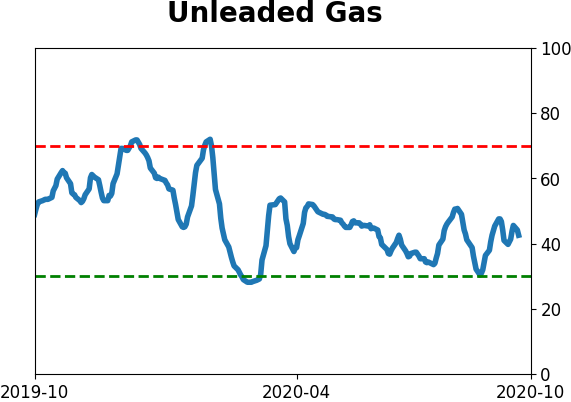
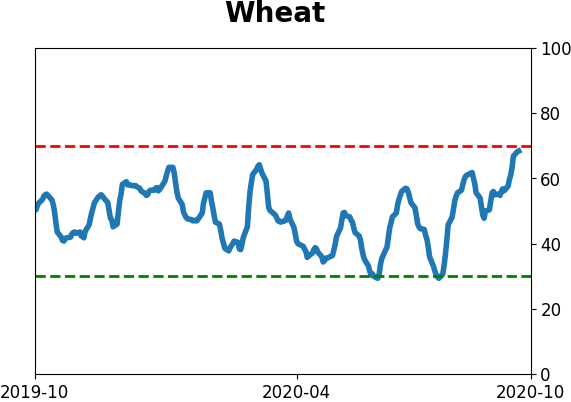
Agriculture
|
|
Research
BOTTOM LINE
To save money, energy companies idled hundreds of rigs over the summer. That has just begun to change as a few come back online. When rig counts plunge then start to recover, it has been a positive long-term sign for energy stocks, but not so much for oil prices.
FORECAST / TIMEFRAME
XLE -- Up, Long-Term
|
The oil and gas industry has been devastated in the past year, triggering layoffs and dividend cuts, something energy executives hold off as a last resort.
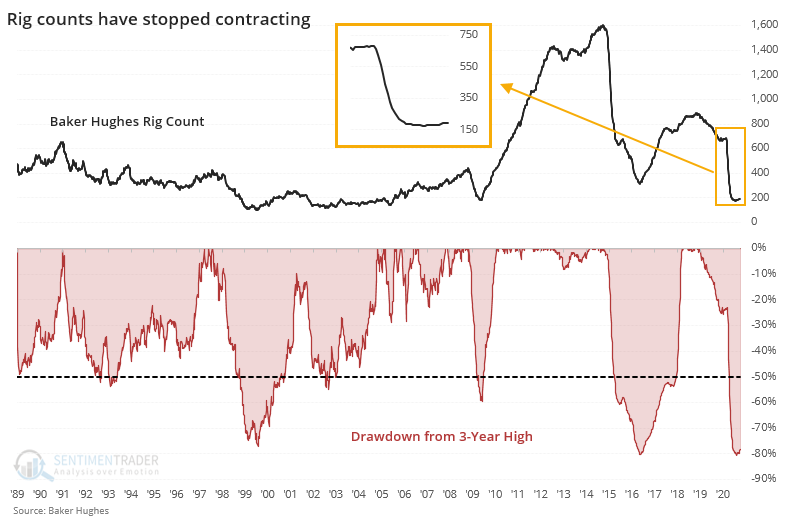
They were quicker in paring other expenses. The number of oil and gas rigs peaked almost 2 years ago and has been in freefall ever since.
The Baker Hughes Rig Count fell from a peak of 888 in November 2018 to only 172 by mid-August of this year, a plunge of more than 80%. But even though the news flow for this sector has been atrocious, a few rigs have come back online. For the first time since March, the count has started to increase.
Per Bloomberg (emphasis added):
"A rotary rig rotates the drill pipe from surface to drill a new well (or sidetracking an existing one) to explore for, develop and produce oil or natural gas. The Baker Hughes Rotary Rig count includes only those rigs that are significant consumers of oilfield services and supplies and does not include cable tool rigs, very small truck mounted rigs or rigs that can operate without a permit. Non-rotary rigs may be included in the count based on how they are employed. For example, coiled tubing and workover rigs employed in drilling new wells are included in the count. To be counted as active a rig must be on location and be drilling or 'turning to the right'. A rig is considered active from the moment the well is 'spudded' until it reaches target depth or 'TD'. Rigs that are in transit from one location to another, rigging up or being used in non-drilling
activities such as workovers, completions or production testing, are NOT counted as active. Miscellaneous rig counts represent geothermal rigs."
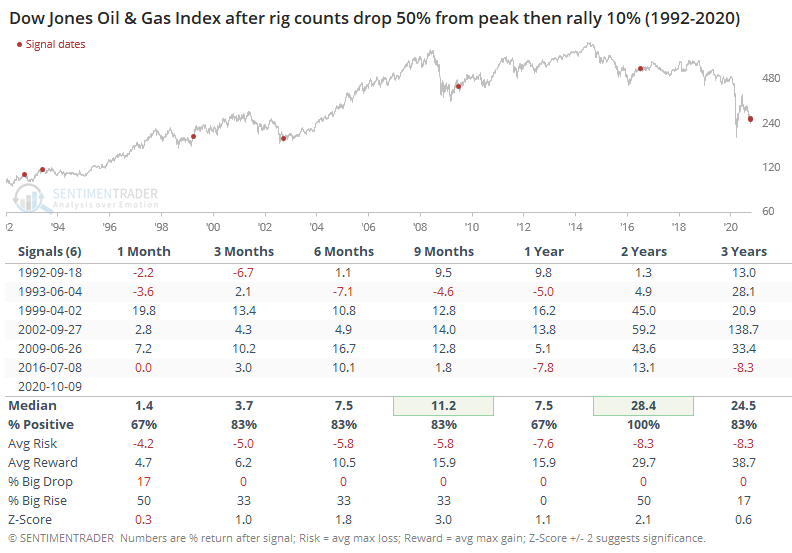
When the Rig Count rises at least 10% from its low after falling more than 50% from a multi-year peak, it has been a good long-term sign for the energy sector.
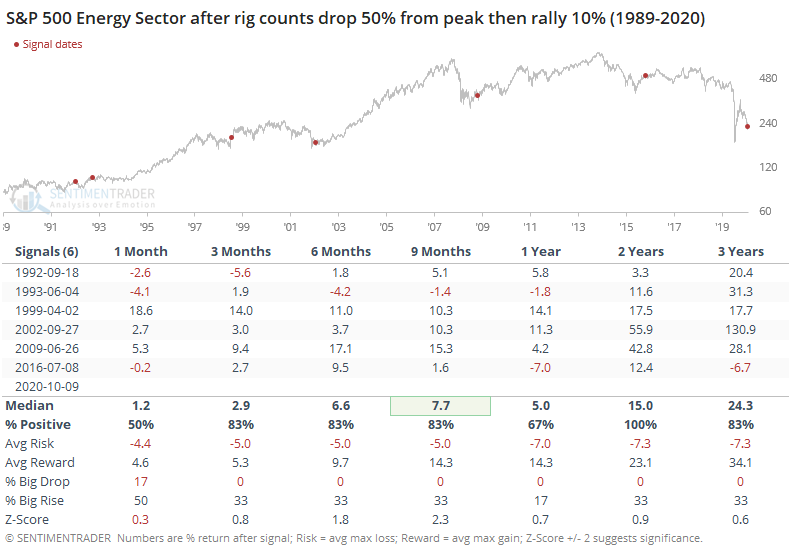
Rig counts tend to be a slow-moving series since these firms can't simply turn wells on and off with a switch. When they started adding capacity after a plunge, then companies in the S&P Energy Sector index had a strong tendency to rally over the next 9-24 months. The risk/reward and probability of a large gain/loss was most impressive over the next 2 years.
The same was true for oil and gas companies. They tend to swing more in boom/bust cycles than the broader energy sector, and so the returns were more extreme.
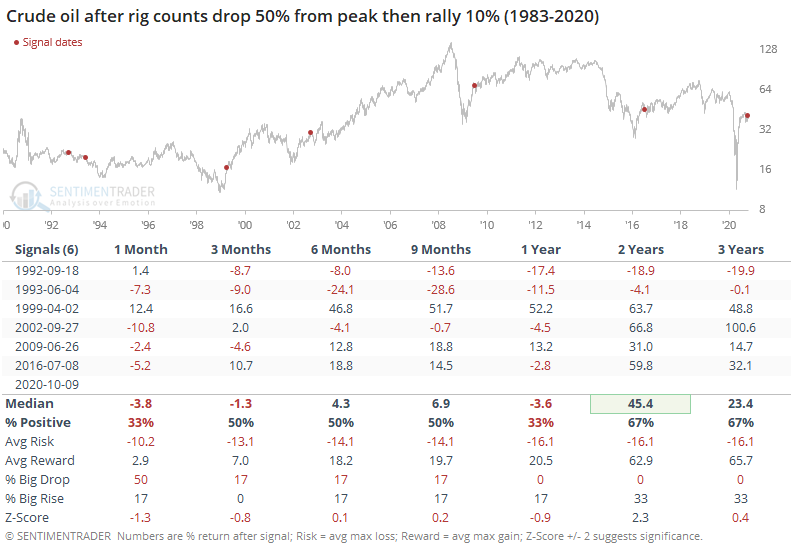
While this has been a good long-term sign for energy companies, for oil itself, it was a different story. As noted by Oilprice.com,
"Baker Hughes reported on Friday that the number of oil rigs in the United States rose by 4 to 193—a gain that may push prices down further."
Indeed, it's been tough for crude to hold gains in the short- to medium-term after rig counts start to tick up from a low. Every one of the signals showed a loss either 1 or 2 months later, and even a year later there were only 2 gains out of the 6 signals.
Positive signs in this sector are hard to come by, on a fundamental, macro, or technical basis. That's typically when the only potential positive comes from a sentiment standpoint, and signs are building that that's where we are in this cycle. When it gets to this point, usually the stocks will rally when investors realize things are getting "less bad" and rig counts may be one factor in shifting that sentiment.
BOTTOM LINE
Over the past few sessions, options traders have been trading calls more heavily than puts on stocks. But on indexes, it's flipped, with more puts than calls. There has never been this extreme of a difference. Other times it seems like traders were hedging their bets with index puts, stocks mostly rose.
FORECAST / TIMEFRAME
None
|
Earlier this week, we saw that options traders are once again increasing their speculative bets. It's not yet to a level equalling the frenzy in August, but it's getting there.
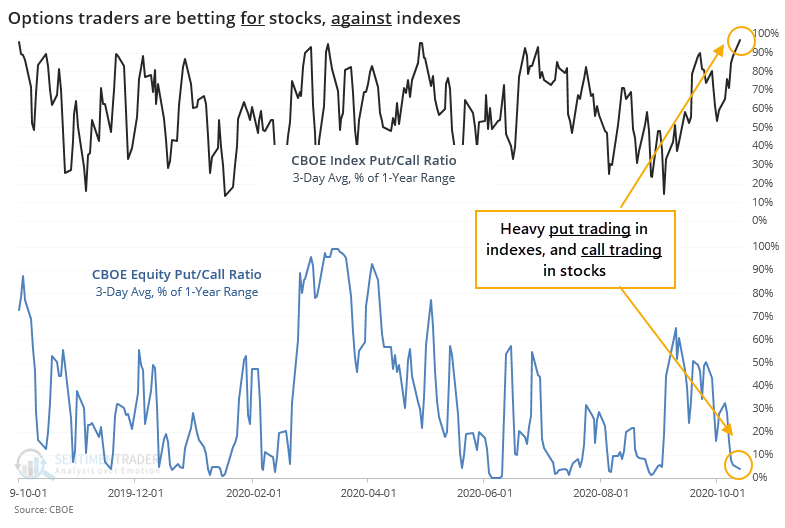
Over the past few days, there has been an interesting twist to this data. Volume in equity options has heavily skewed toward calls; volume in index options has skewed toward puts.
The 3-day average of the CBOE Index Put/Call Ratio is in the top 95% of its range over the past year. The average of the Equity Put/Call Ratio is in the bottom 5% of its range. Going back more than 20 years, this has never happened at the same time.
If we relax the parameters to get a larger sample size, then we can get a sense of whether this might be another warning sign.
It really hasn't been. While it's dangerous to assign reasons for any indicator, it looks like traders have started to establish hedges on major indexes as a check against some bets that individual stocks will keep rising. We can't quite know that from the volume figures, but there's a pretty good chance that's what's happening.
When traders behaved this way, then there was a 29% chance of a larger-than-average rise in the S&P 500 at some point over the next month, and 0% chance of a larger-than-average drop. Whenever we see 0% or 100%, it should not be taken literally - of course, there's a chance of a large decline. The point is to show that historically, there has been a better probability of a big rise than a big decline over that time frame.
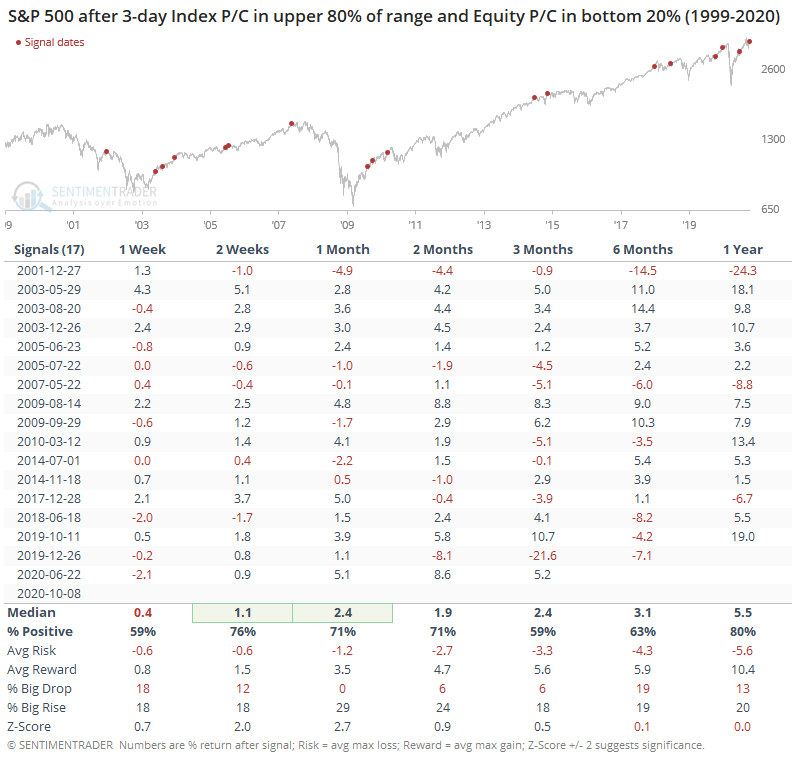
It's usually instructive to also look at the inverse to see if the pattern flips. The table below shows those times when both the Index P/C and Equity P/C Ratios were in the bottom ends of their 1-year ranges.
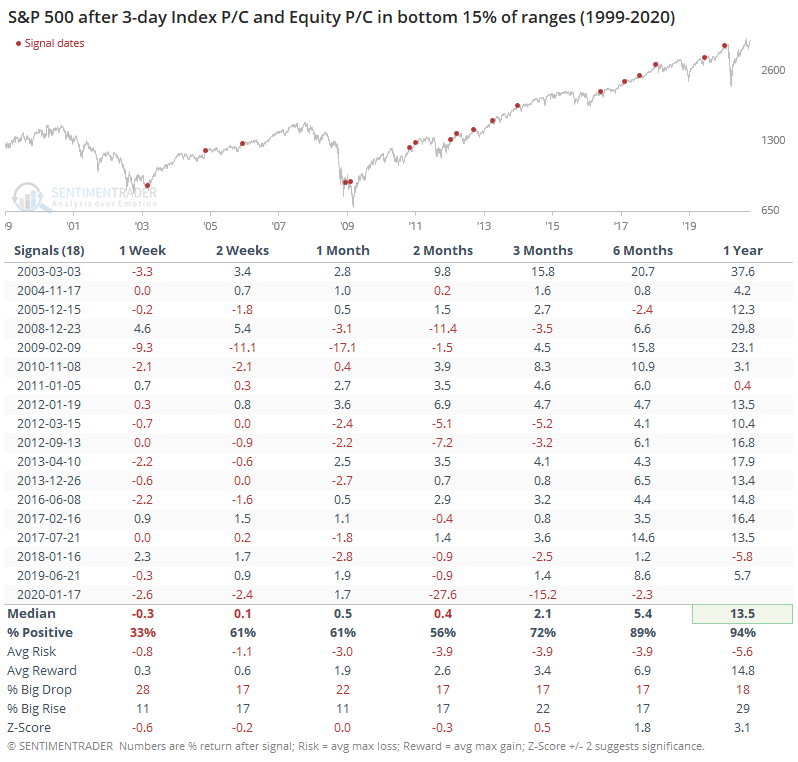
These signals preceded returns that were quite a bit weaker than the scenario we're in now, adding a bit of confidence to the idea that traders' behavior right now is relatively benign for the shorter-term.
That's hard to square with the data we looked at on Monday, but that tends to have a longer time frame. And it isn't quite at a level as the extremes in August, as well as being in a more positive environment now vs. then.
Active Studies
| Time Frame | Bullish | Bearish | | Short-Term | 0 | 0 | | Medium-Term | 4 | 8 | | Long-Term | 48 | 2 |
|
Indicators at Extremes
Portfolio
| Position | Description | Weight % | Added / Reduced | Date | | Stocks | 15.6% RSP, 10.1% VWO, 7.6% XLE | 33.3 | Added 11% | 2020-10-08 | | Bonds | 10% BND, 10% SCHP, 10% ANGL | 29.7 | Reduced 0.1% | 2020-10-02 | | Commodities | GCC | 2.4 | Reduced 2.1%
| 2020-09-04 | | Precious Metals | GDX | 4.6 | Added 5% | 2020-09-09 | | Special Situations | | 0.0 | Reduced 5% | 2020-10-02 | | Cash | | 30.0 | | |
|
Updates (Changes made today are underlined)
It's been a really mixed picture lately. In stocks, we saw huge momentum and a spike in speculation, then September managed to wring much of that out, except in the options market which is still a worry. There seem to be offsetting positives and negatives, with a mixed market environment, not the kind of setup where I feel comfortable being aggressive. I did add a bit to energy. The older I get, the less interested I am in short-term gyrations, and I don't really care about the coming days or even weeks. I'm fairly confident that the total return will be positive over a longer time frame given some of the developments we've looked in over the past week. With bonds, I decided to swap TLT for ANGL, a high-yield corporate fund with a heavy focus on energy bonds. Hedgers are heavily short 10-year Treasuries, and the high-yield market has held up well internally. I'm not generally a fan of buying into rising prices, but with the internal recovery in emerging markets from a compelling position (here and here), I started a position.
RETURN YTD: -0.3% 2019: 12.6%, 2018: 0.6%, 2017: 3.8%, 2016: 17.1%, 2015: 9.2%, 2014: 14.5%, 2013: 2.2%, 2012: 10.8%, 2011: 16.5%, 2010: 15.3%, 2009: 23.9%, 2008: 16.2%, 2007: 7.8%
|
|
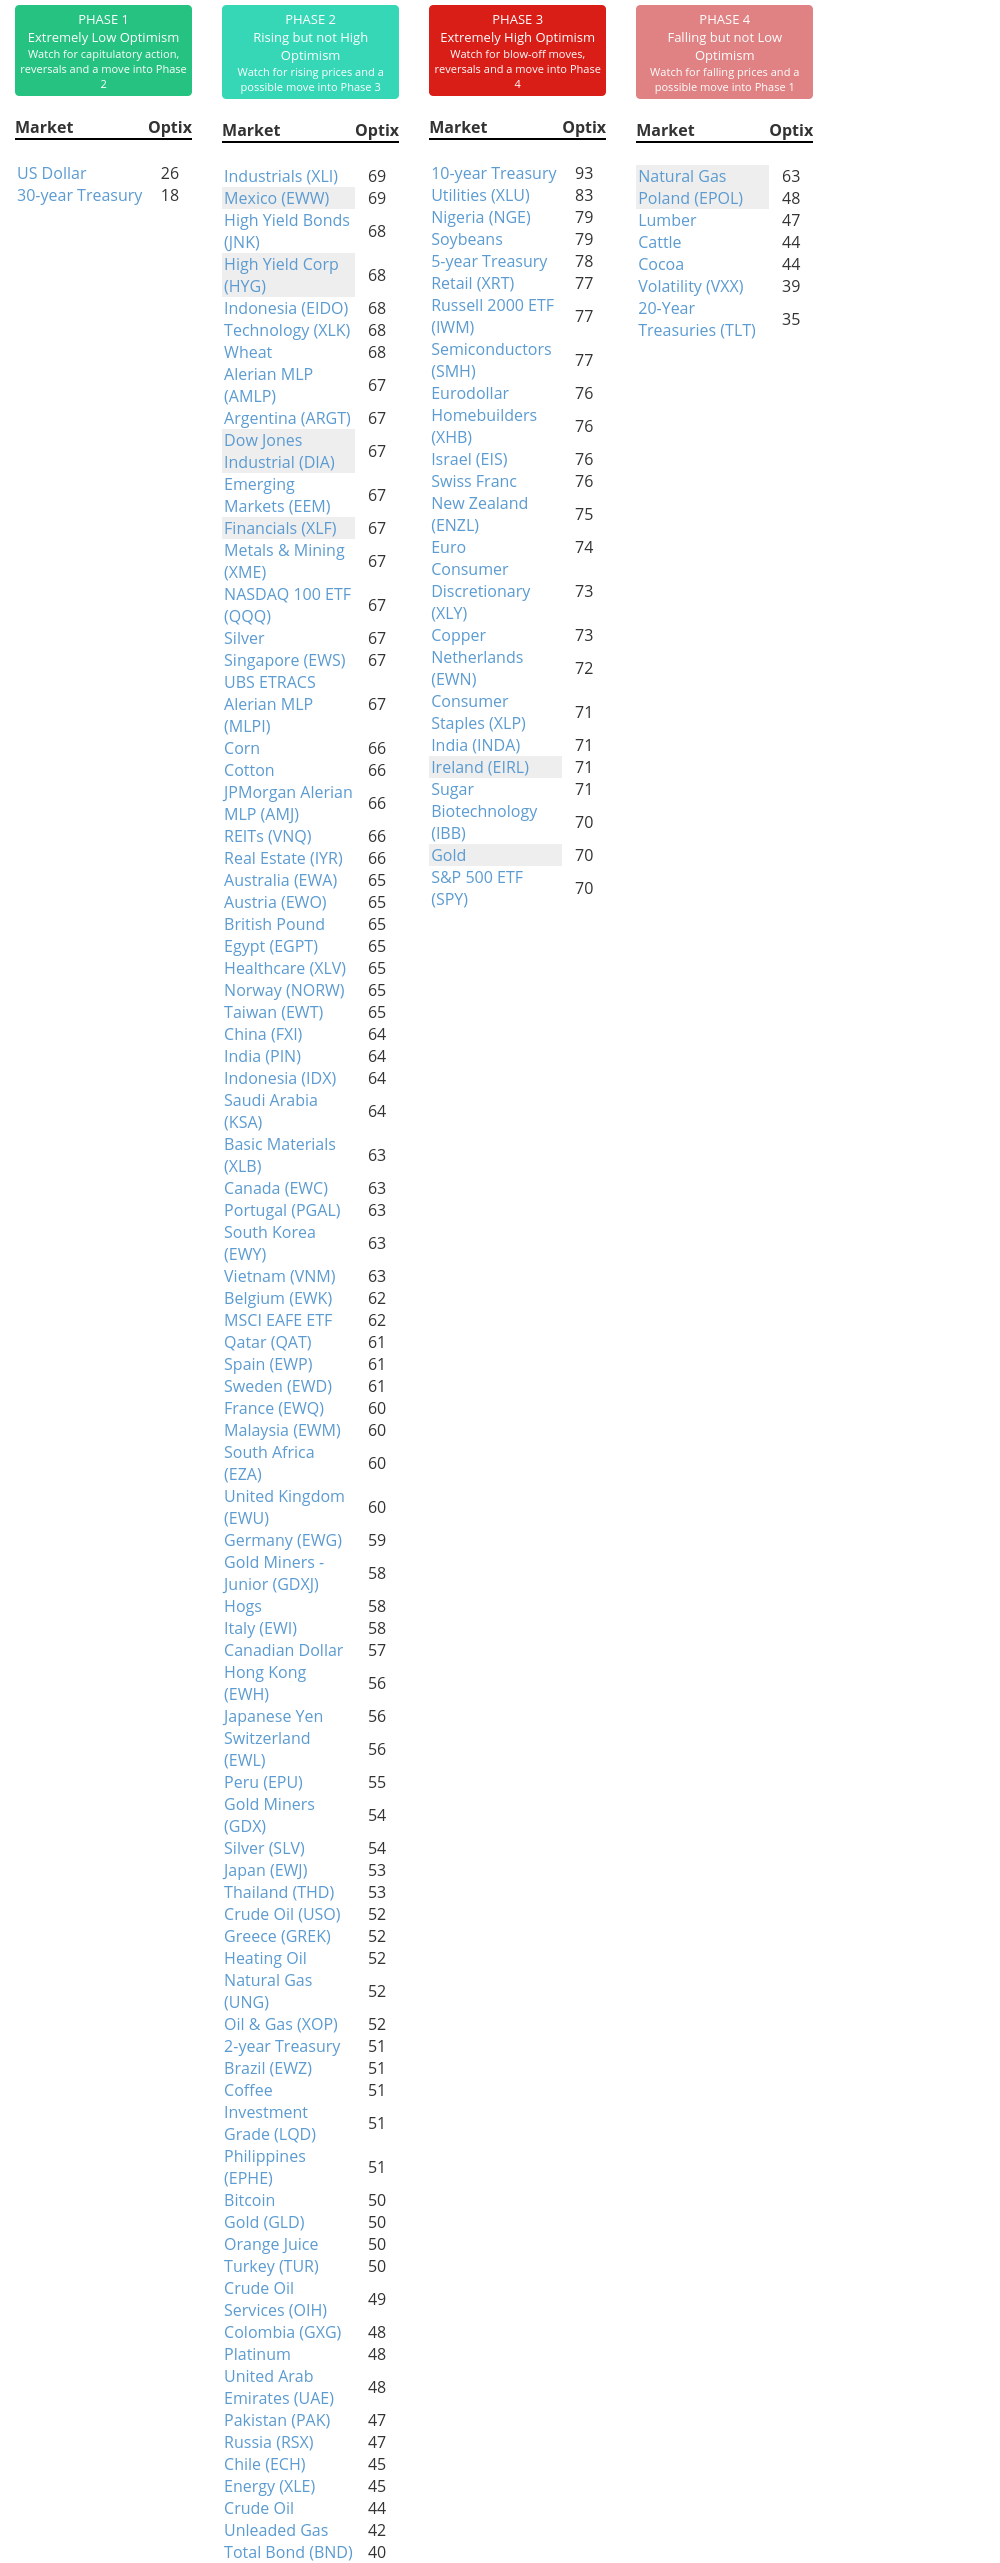
Phase Table
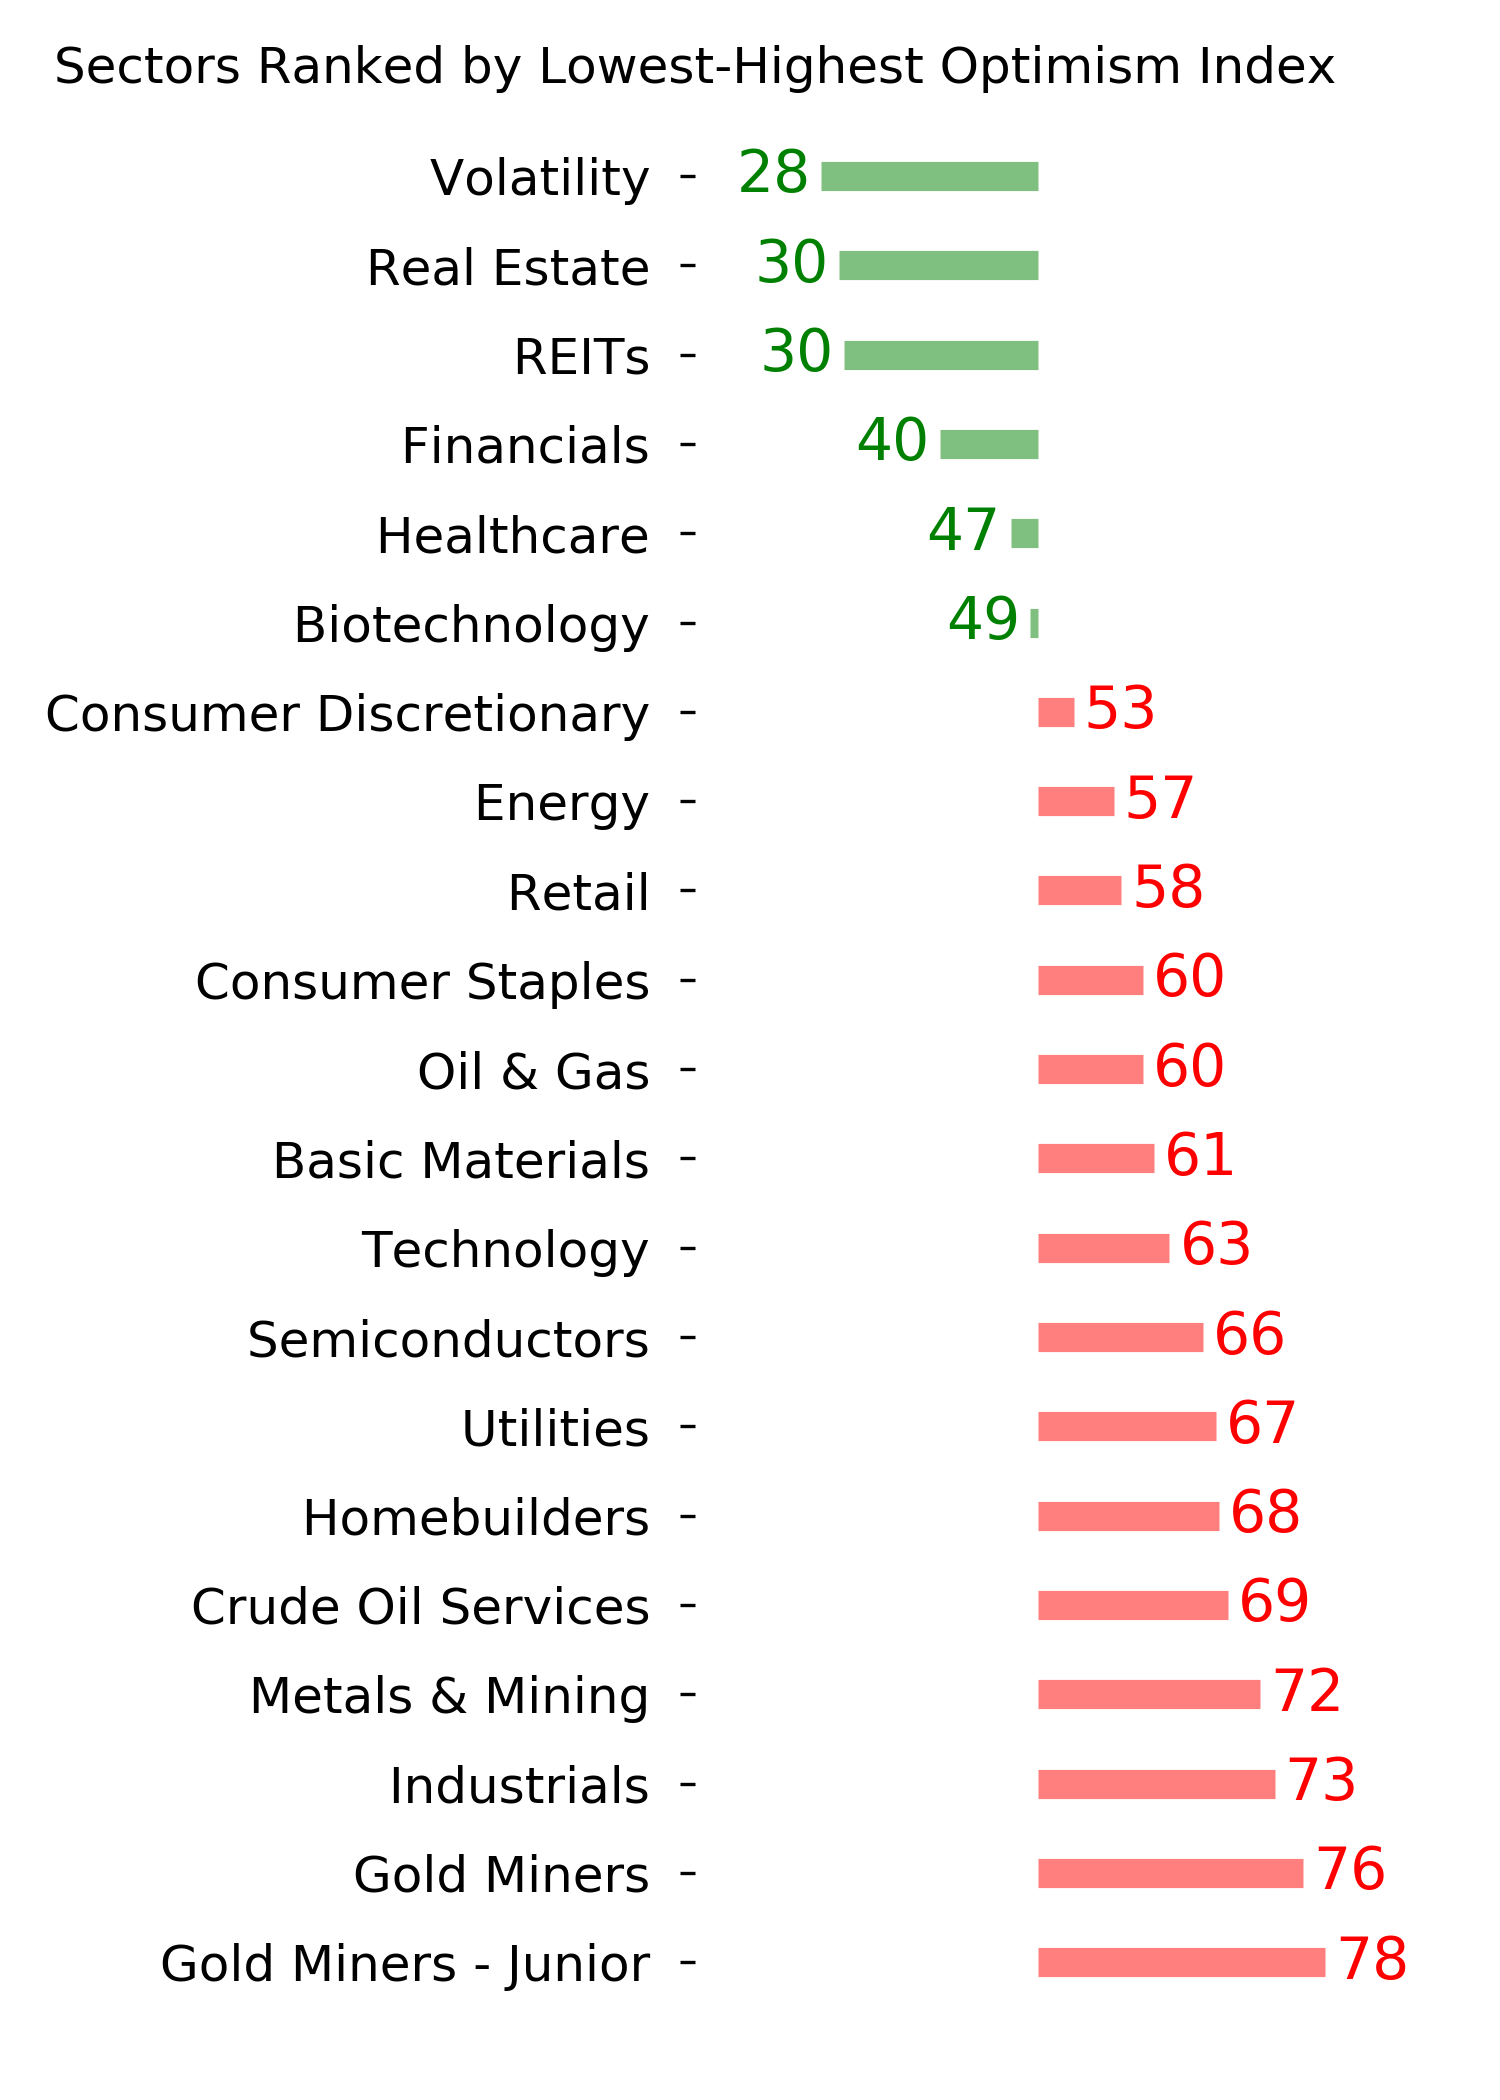
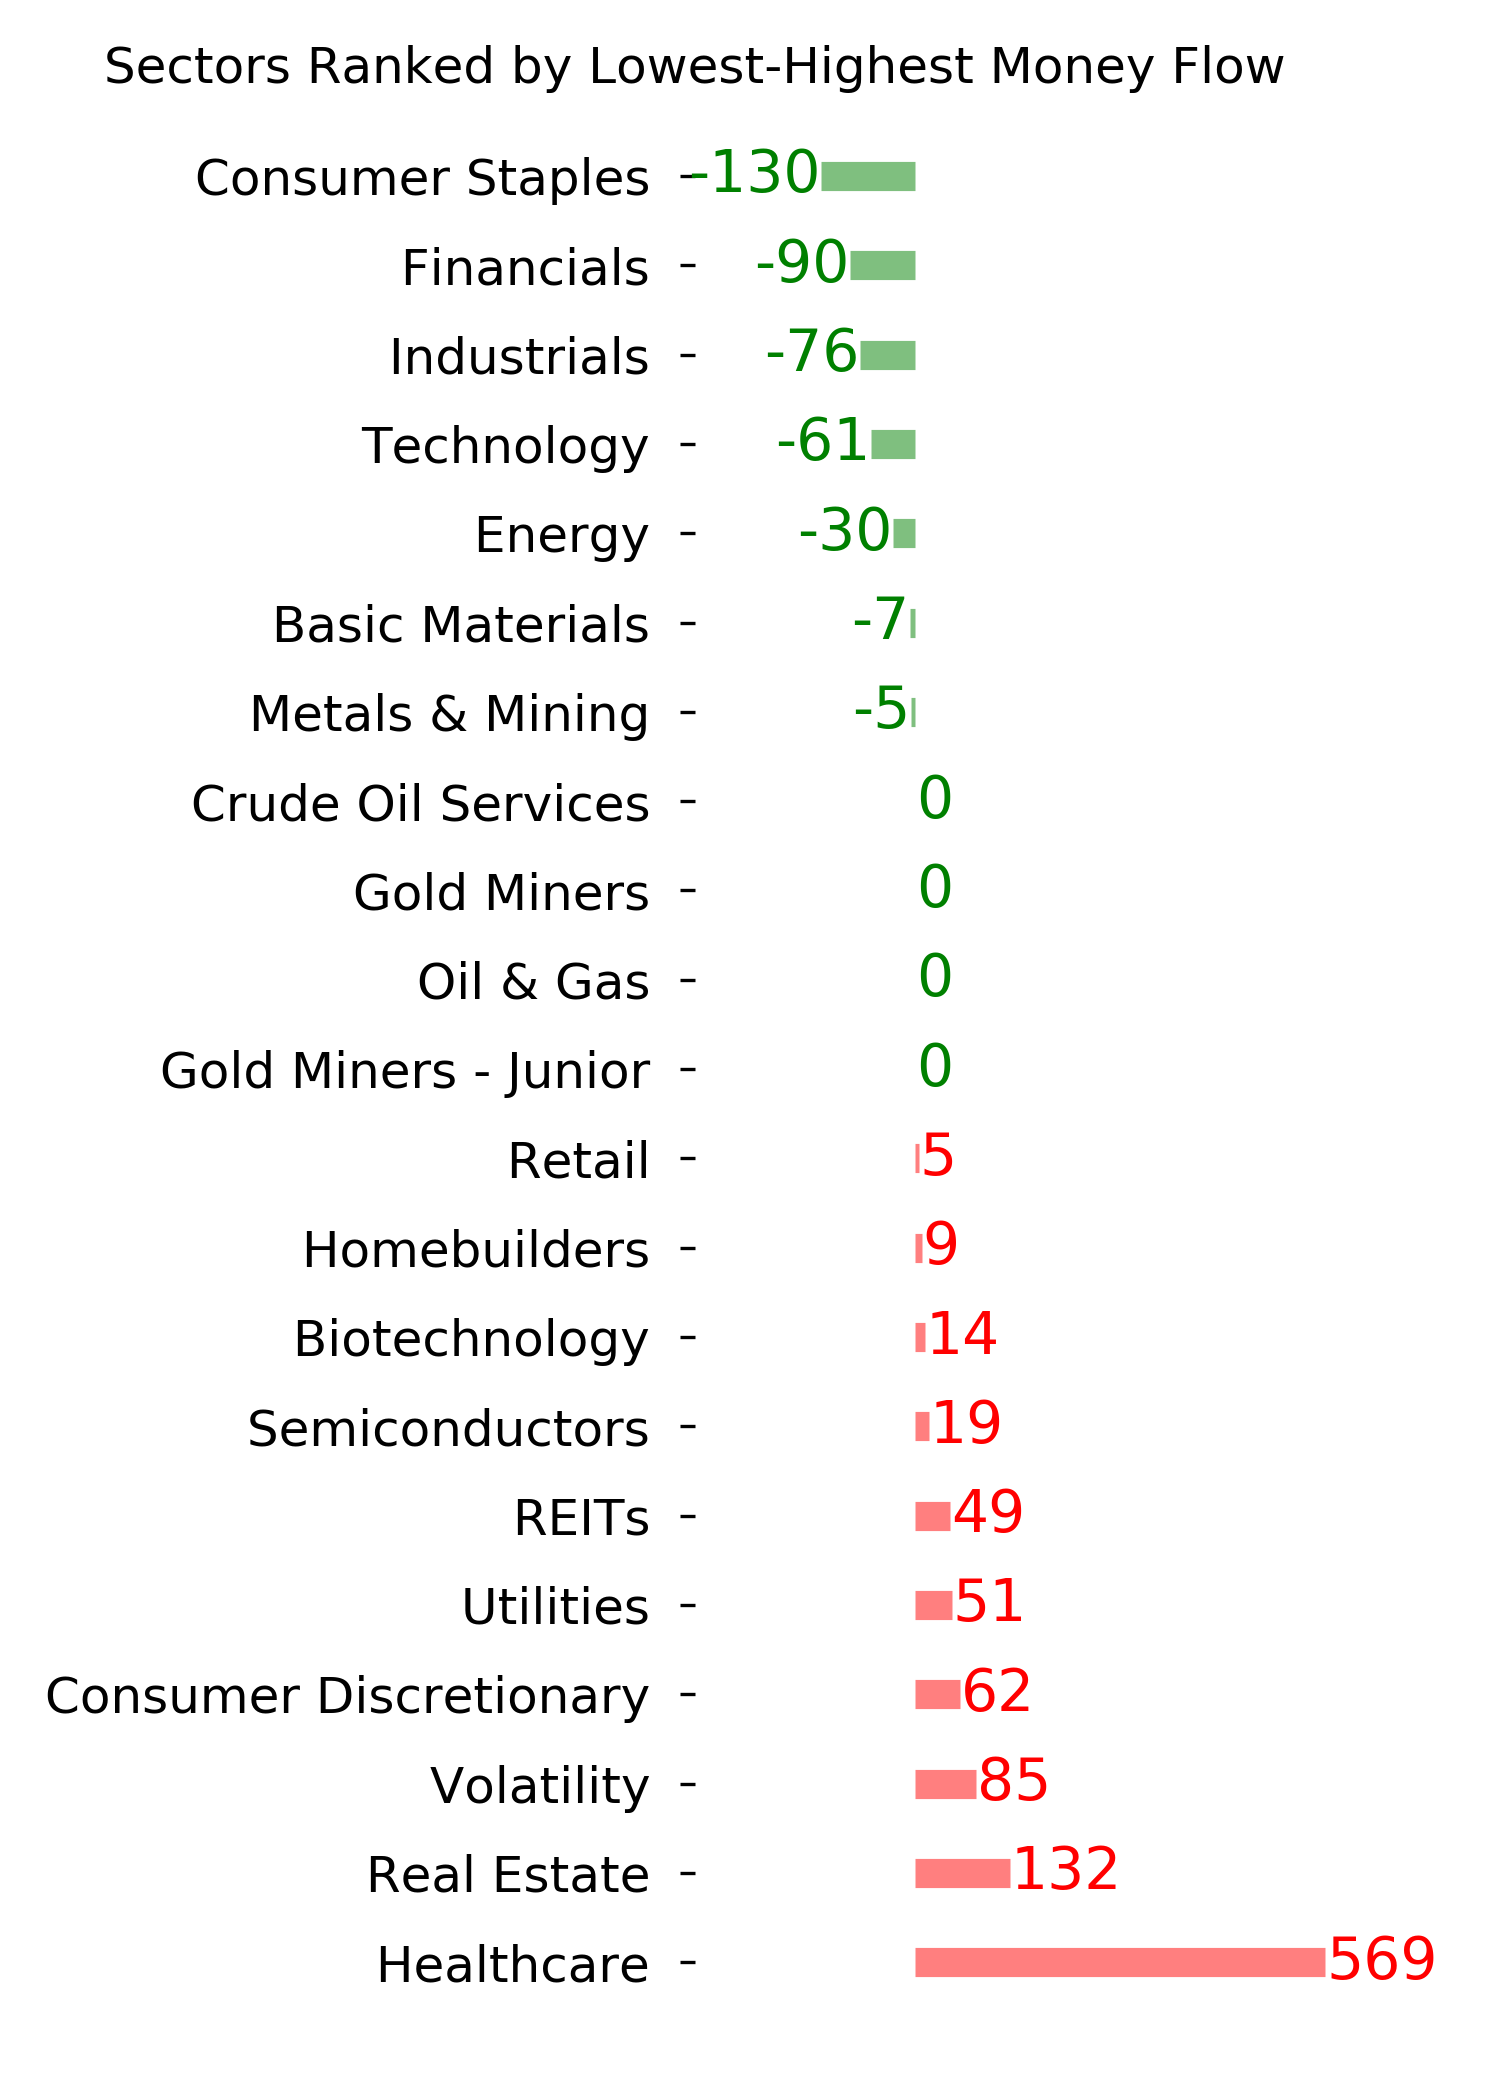
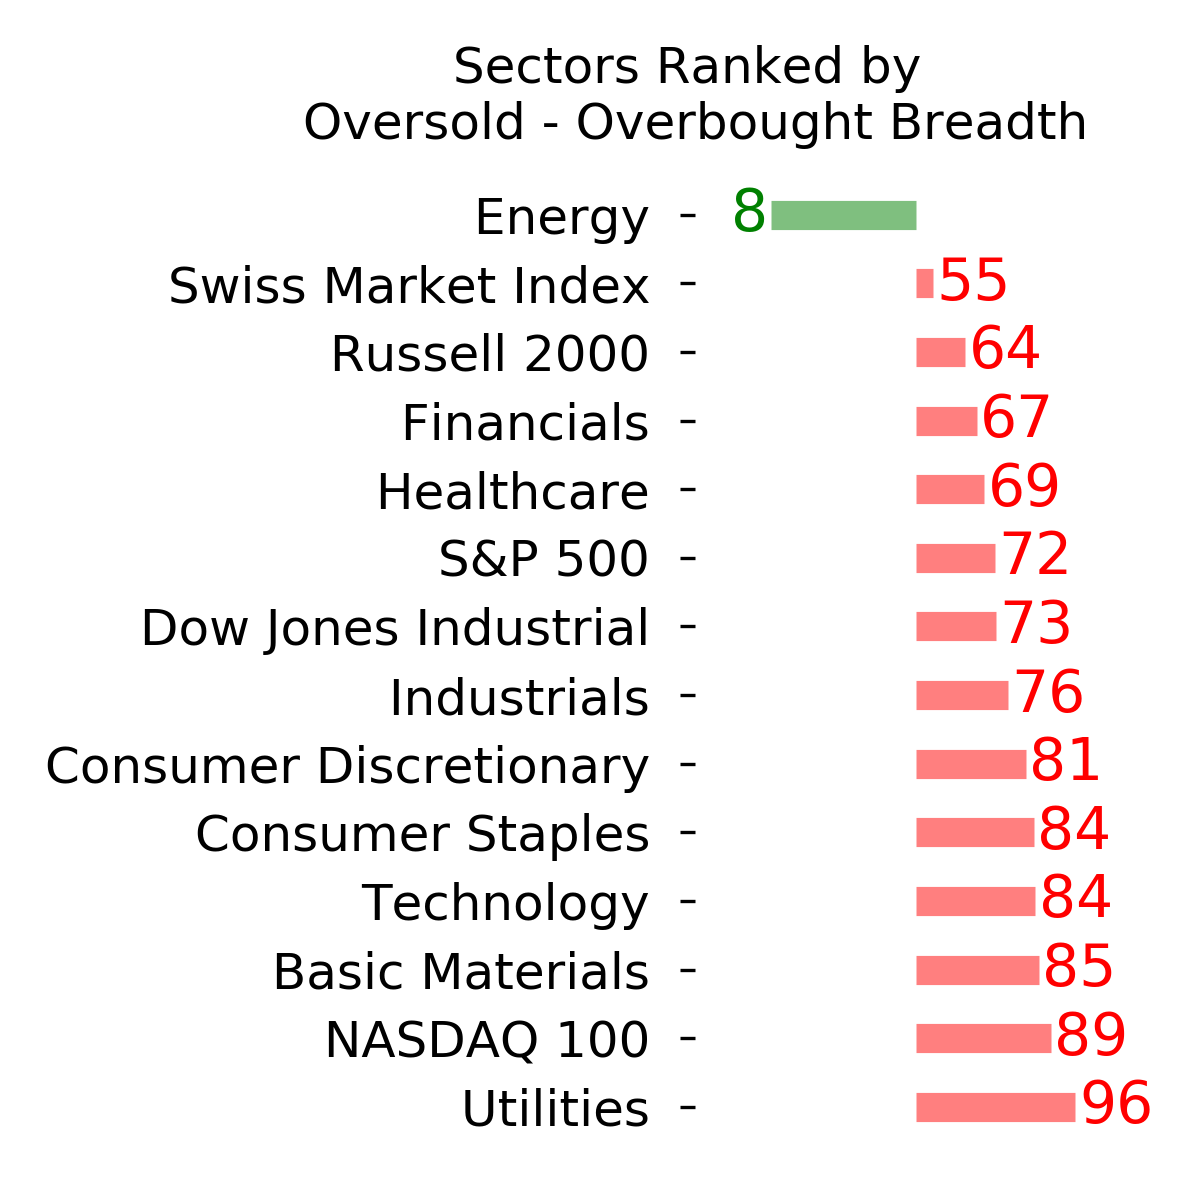
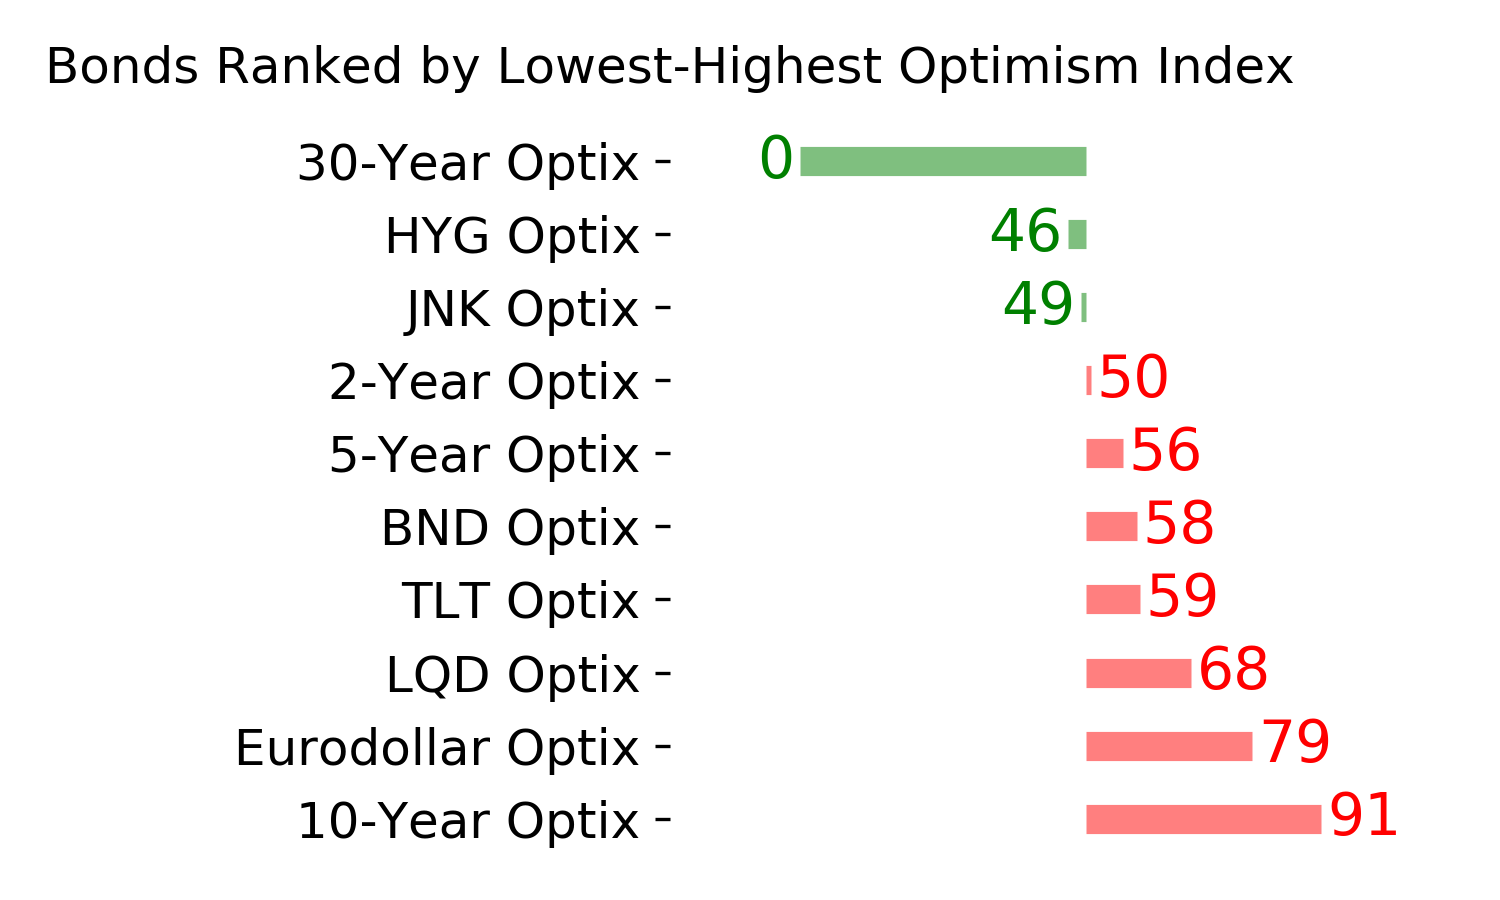
Ranks
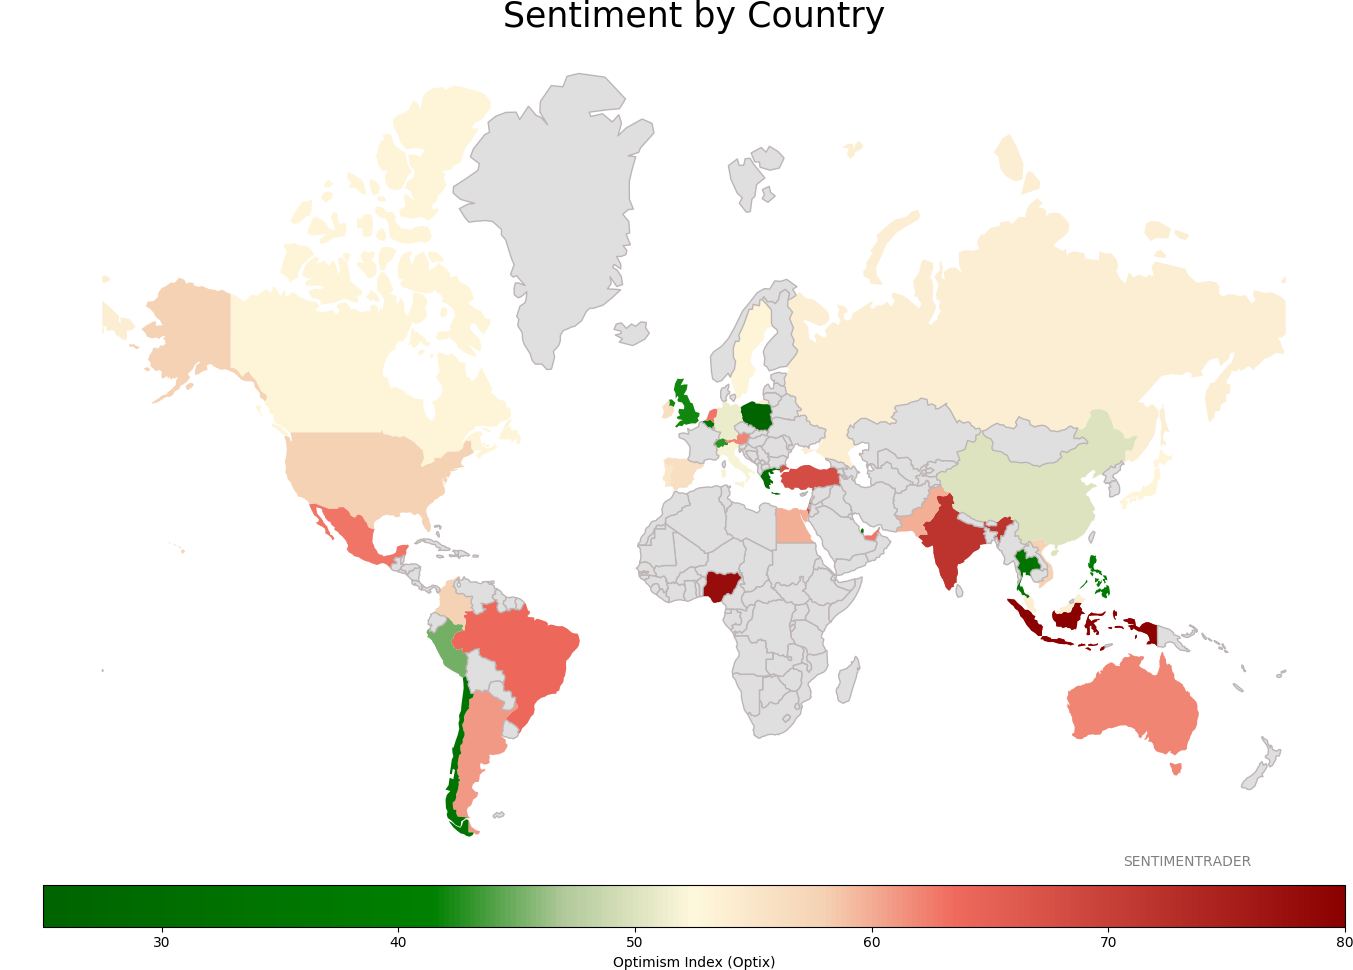
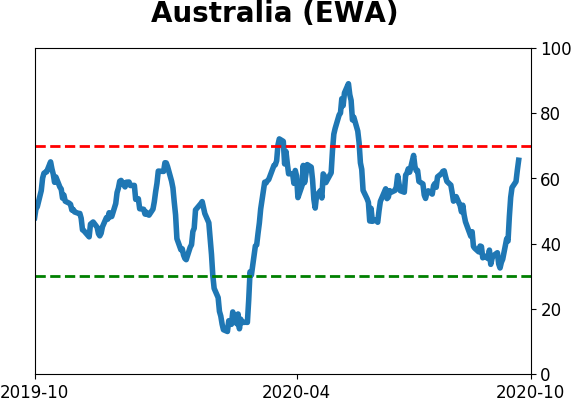
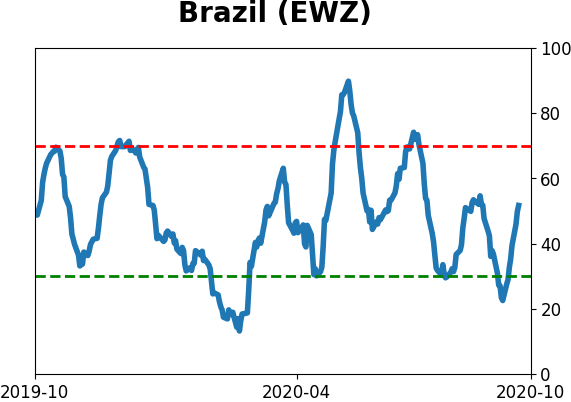
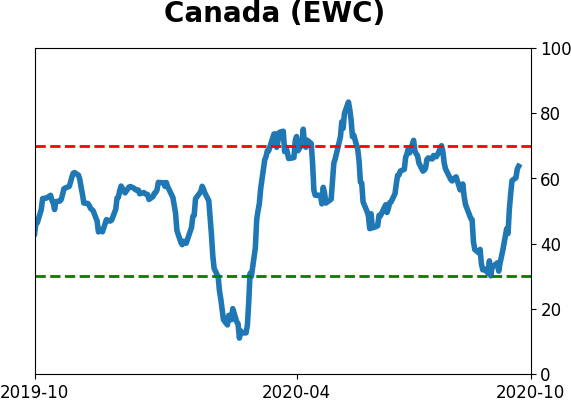
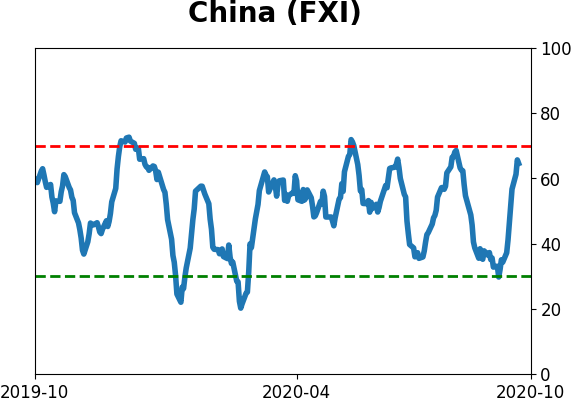
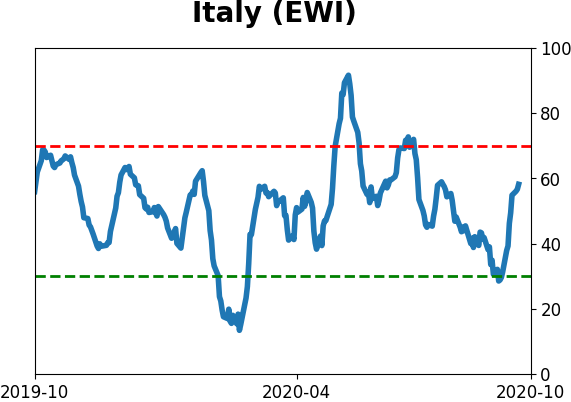
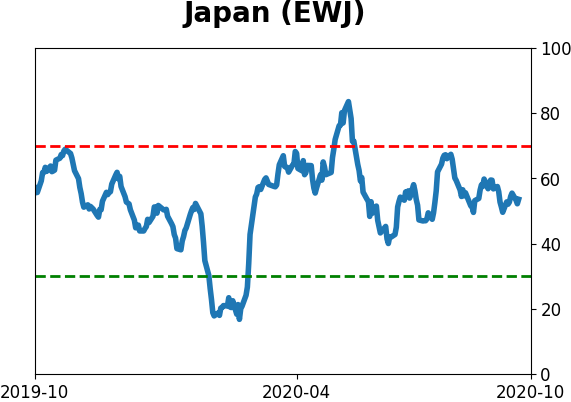
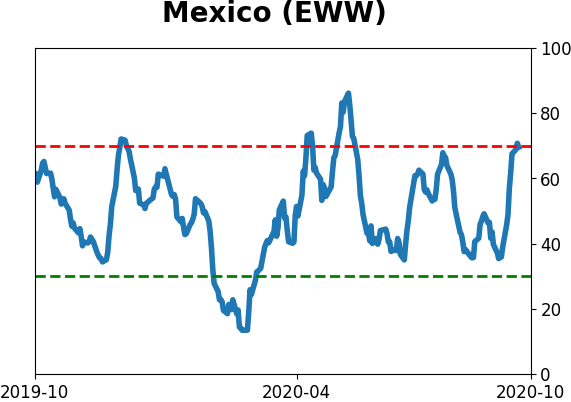
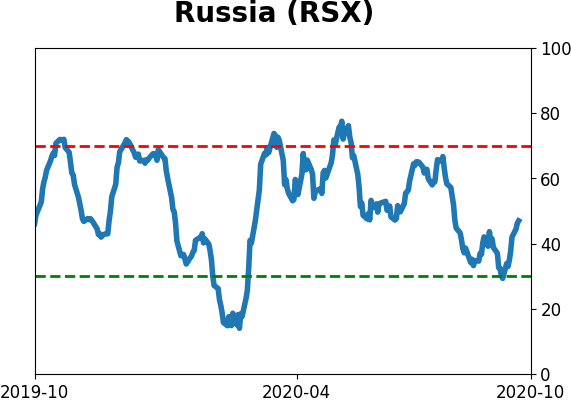
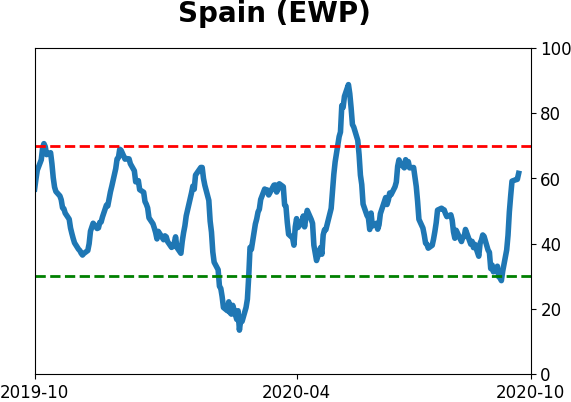
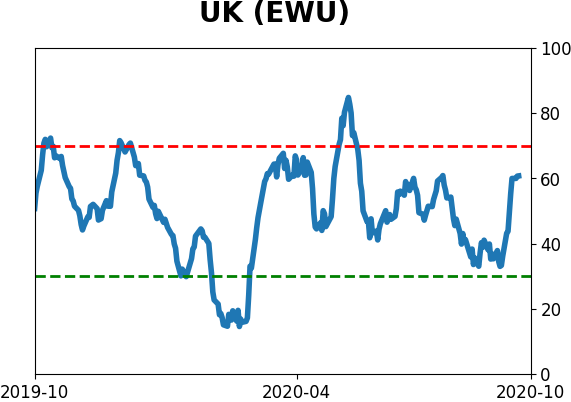
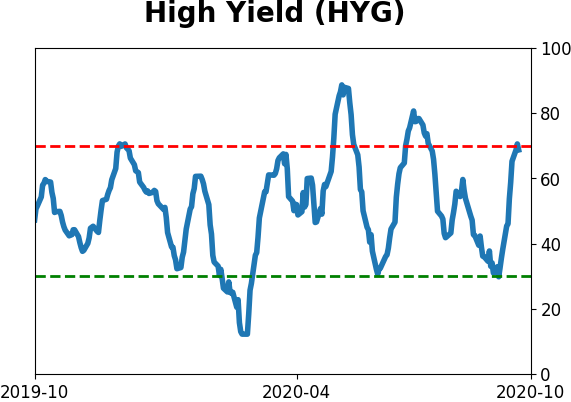
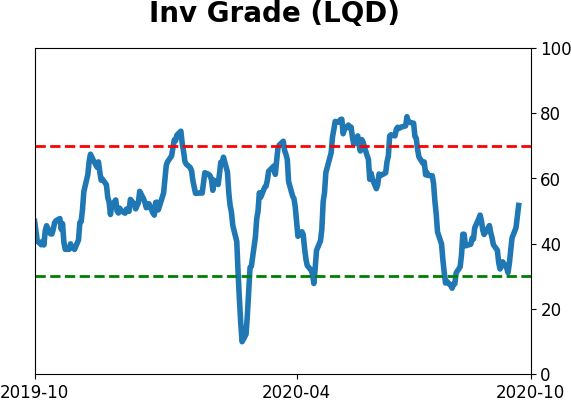
Sentiment Around The World
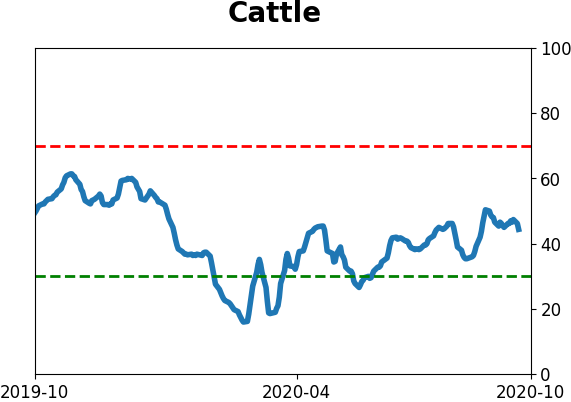
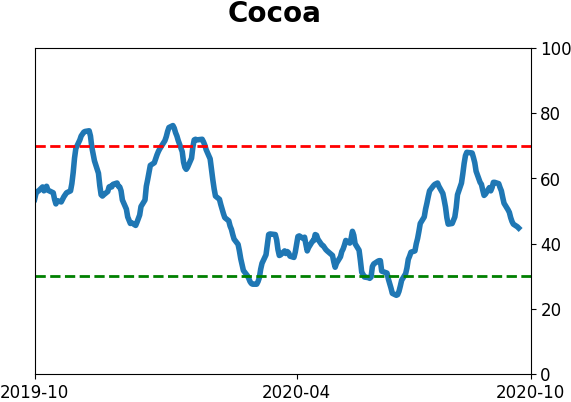
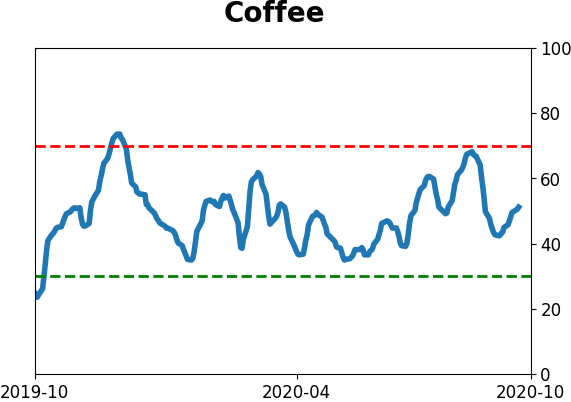
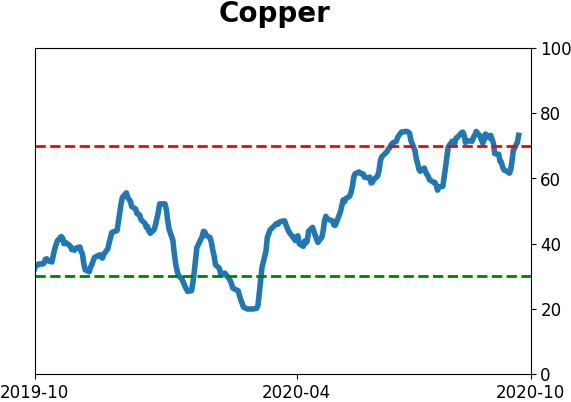
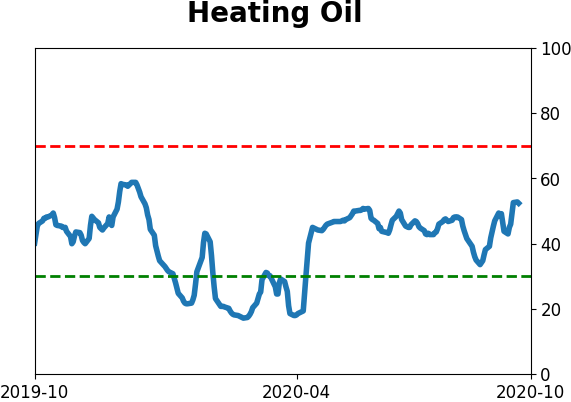
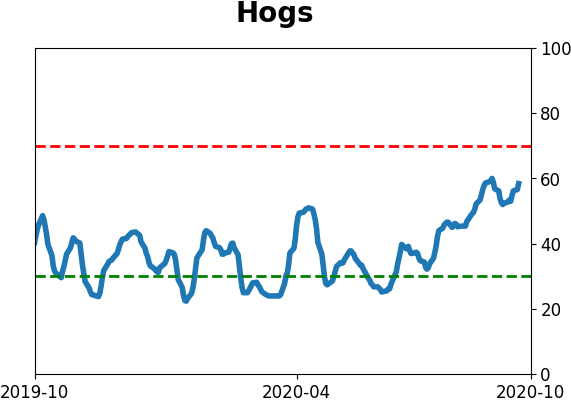
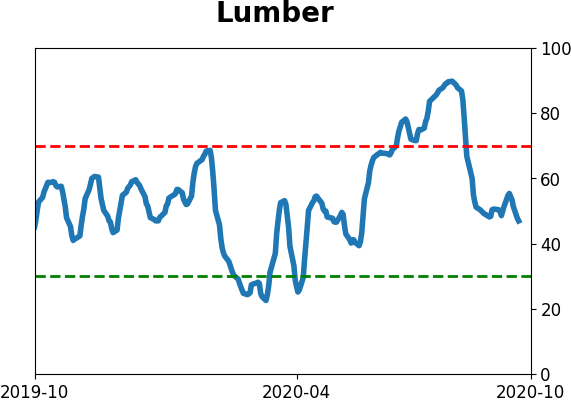
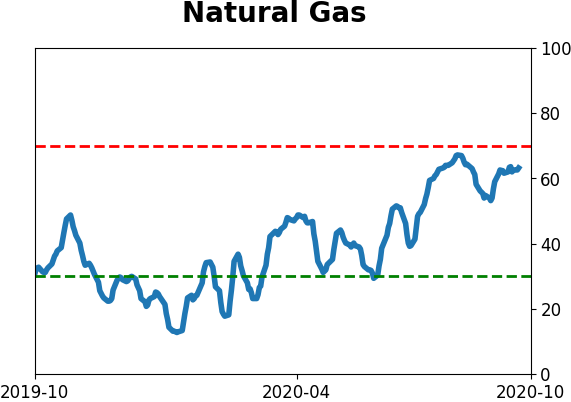
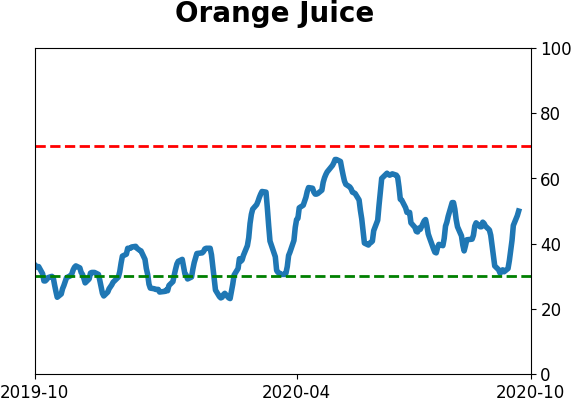
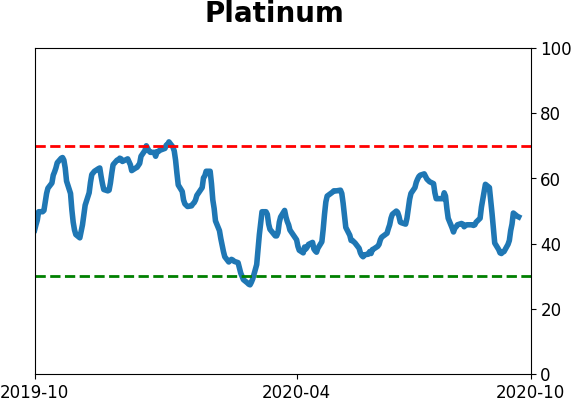
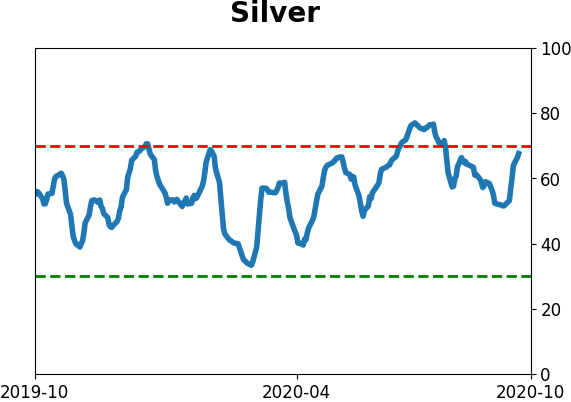
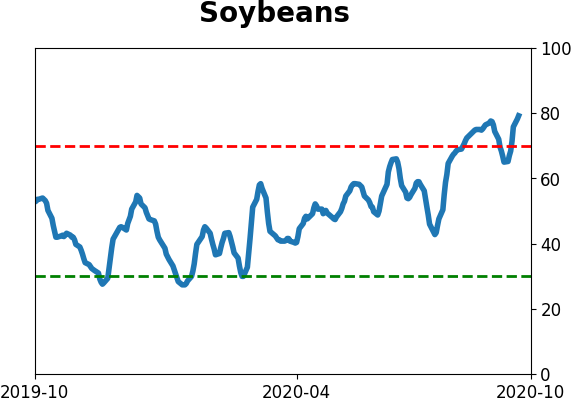
Optimism Index Thumbnails
|
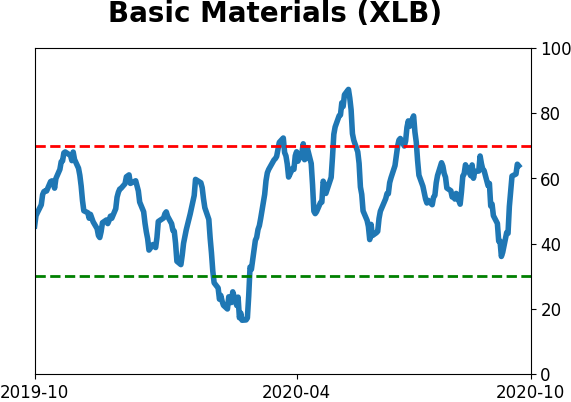
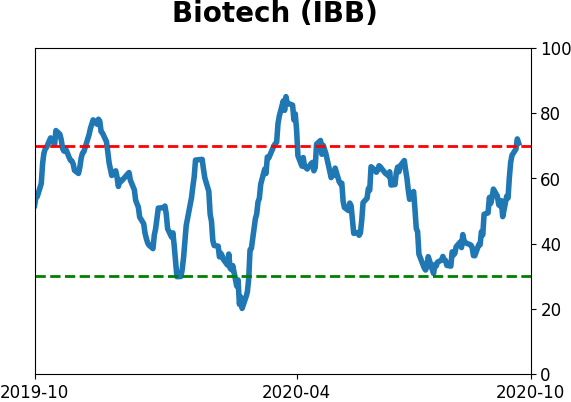
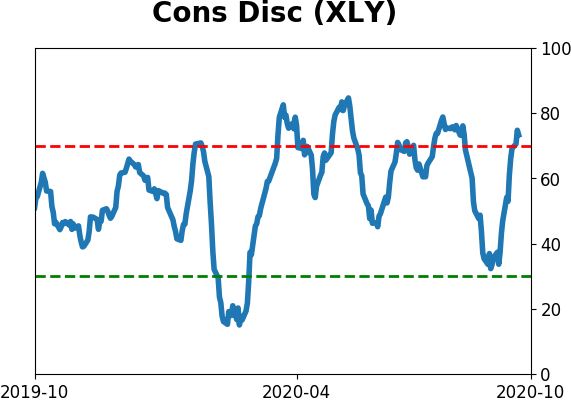
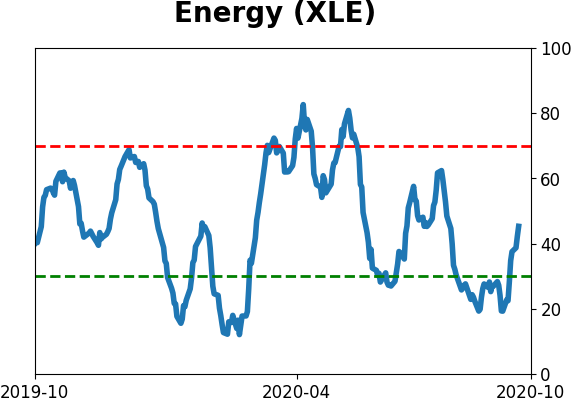
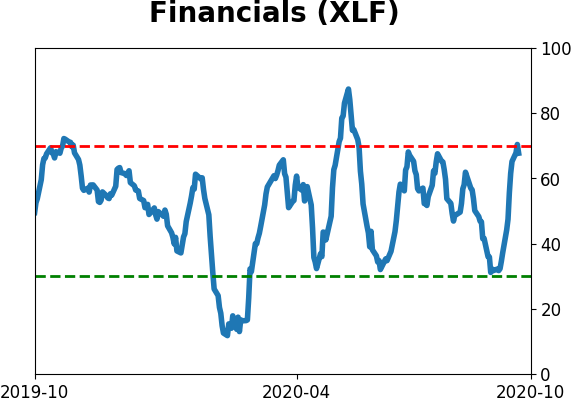
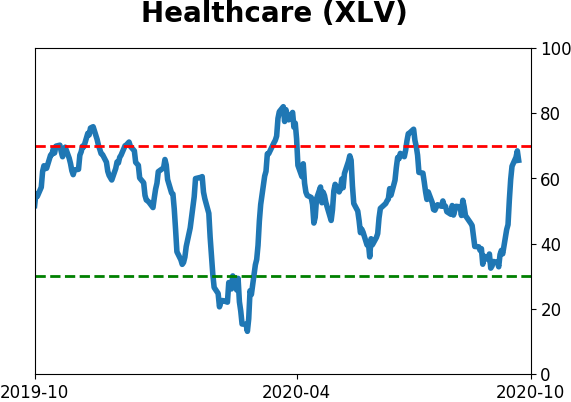
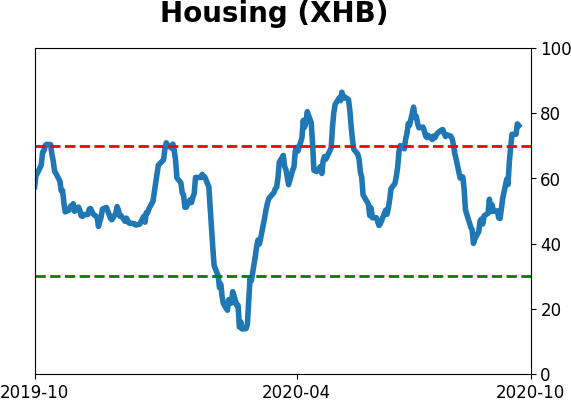
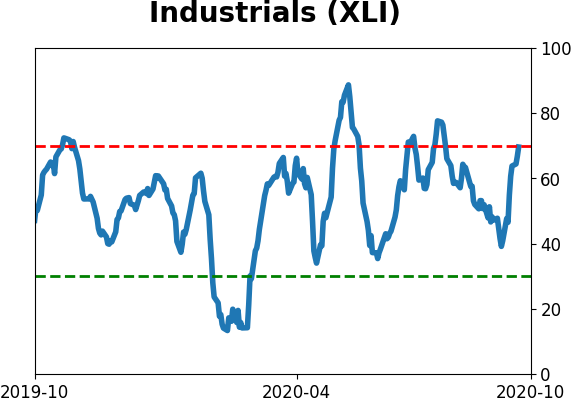
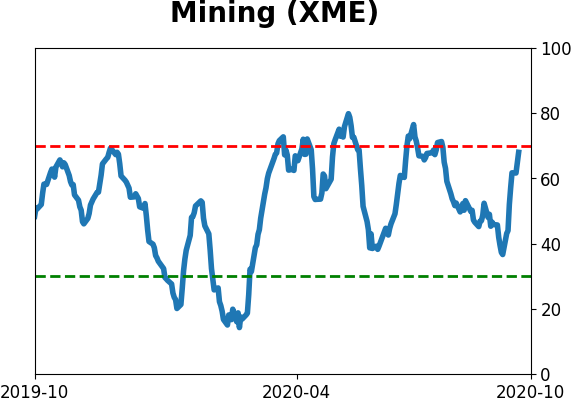
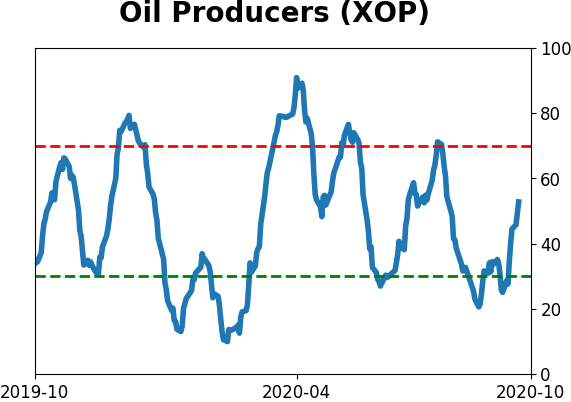
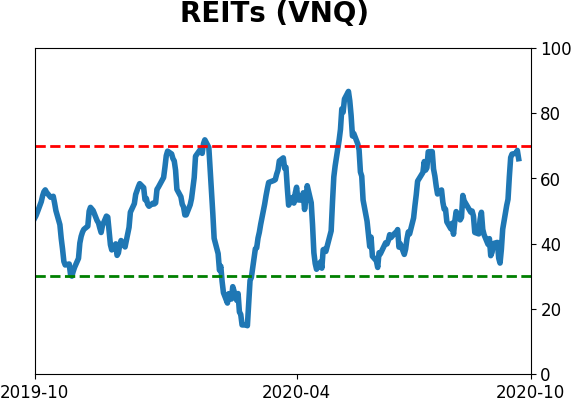
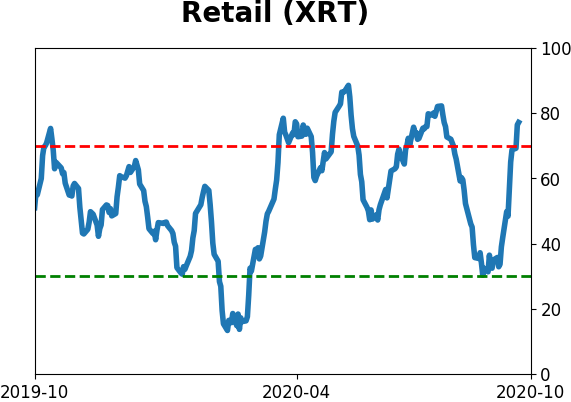
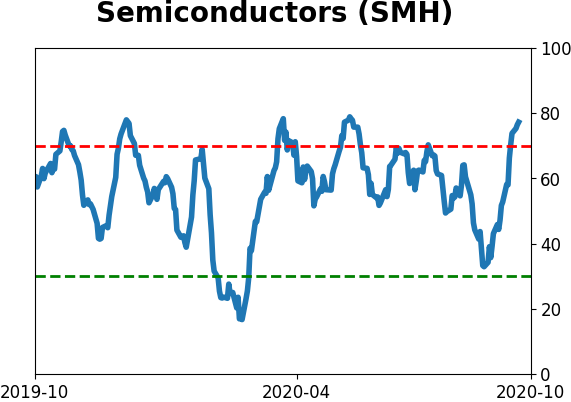
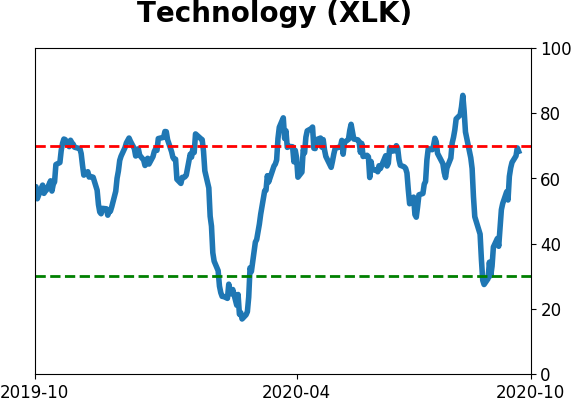
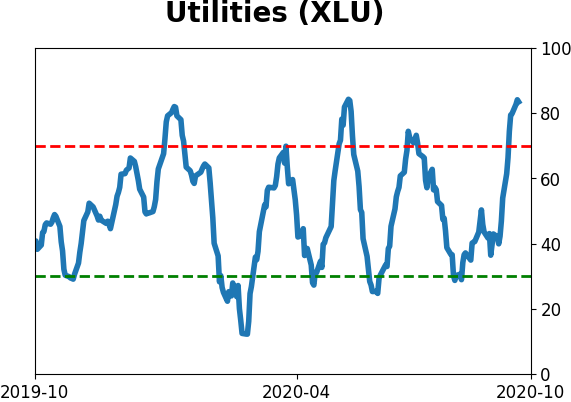
Sector ETF's - 10-Day Moving Average
|
|
|
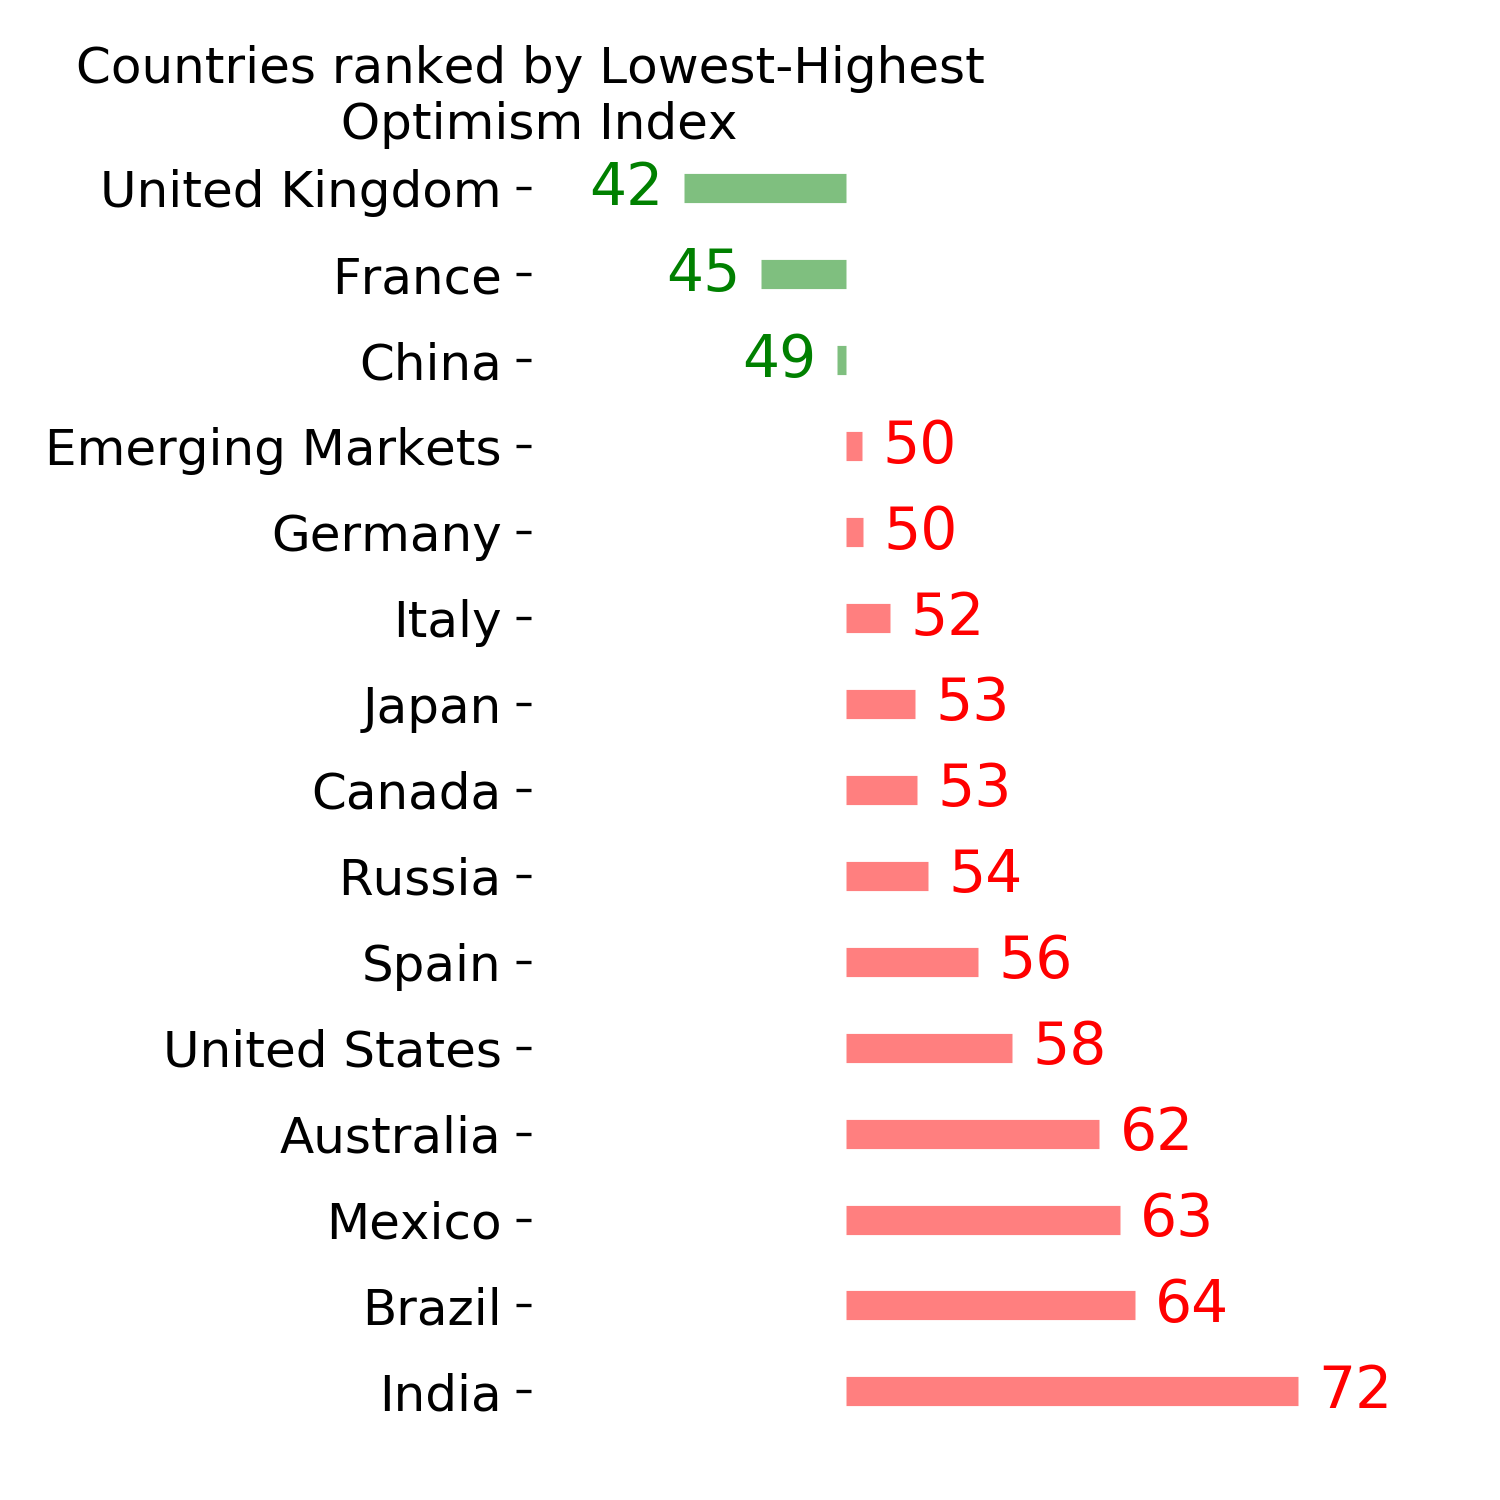
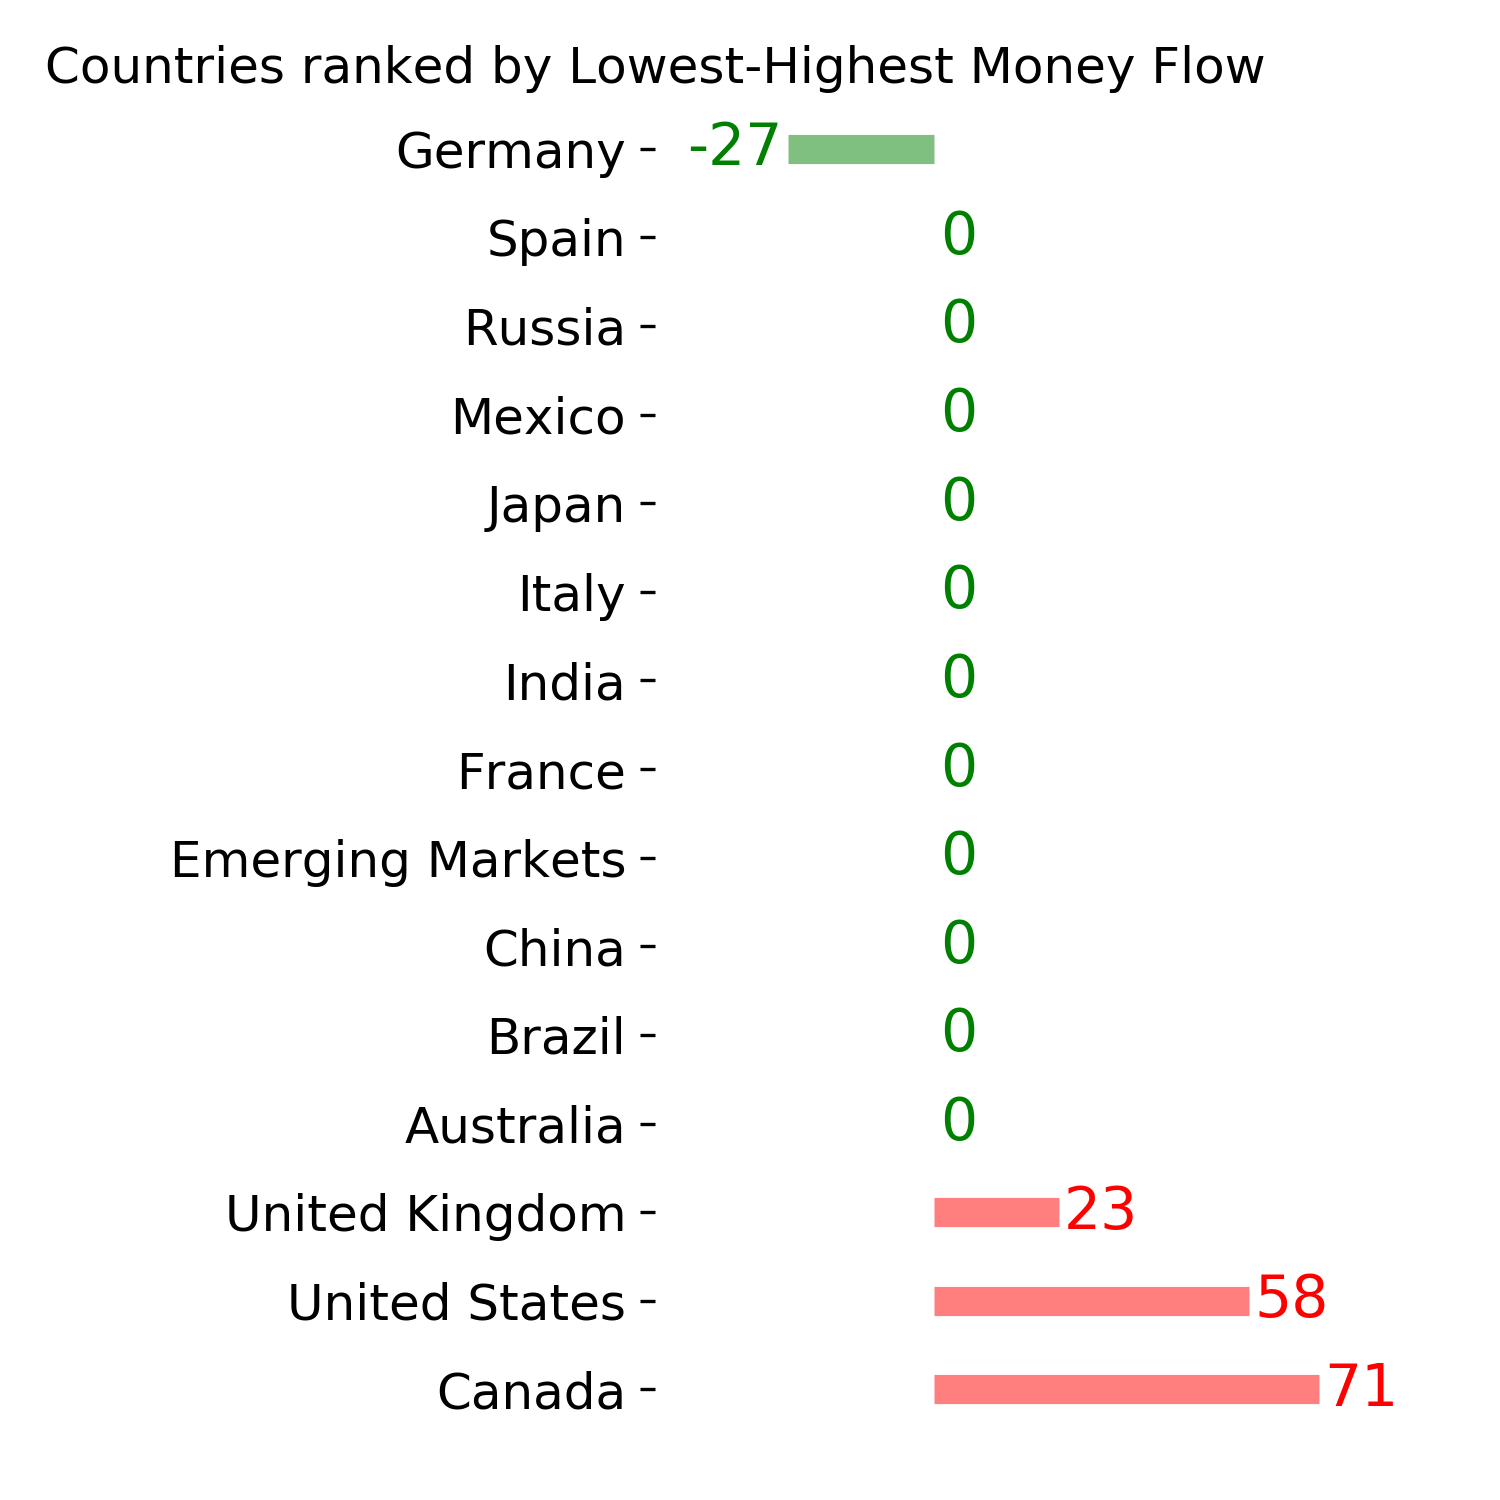
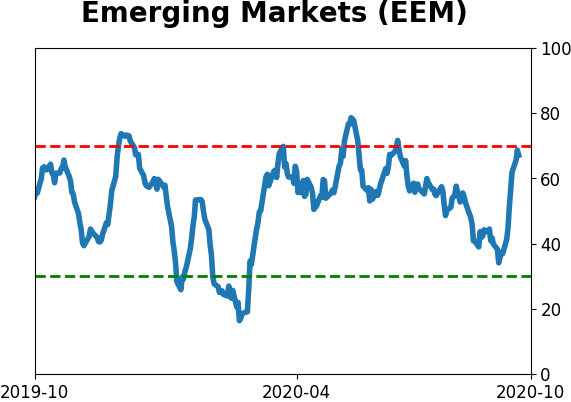
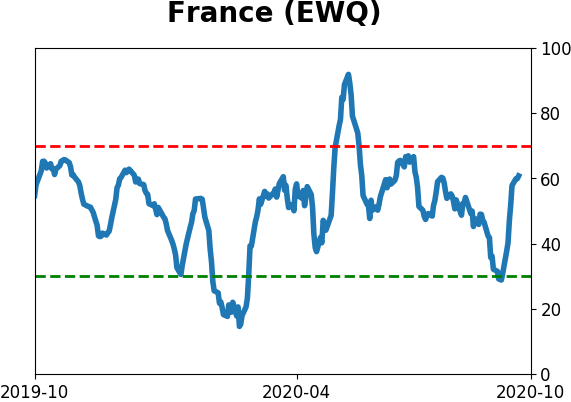
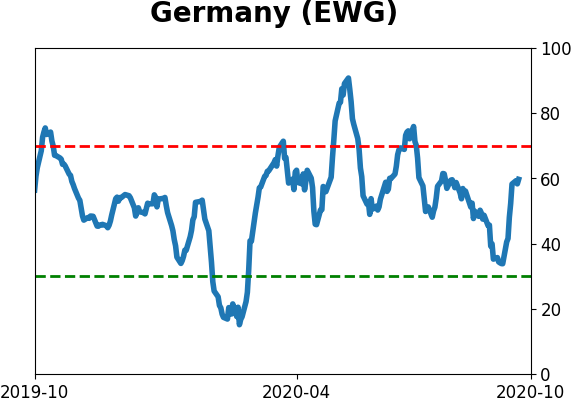
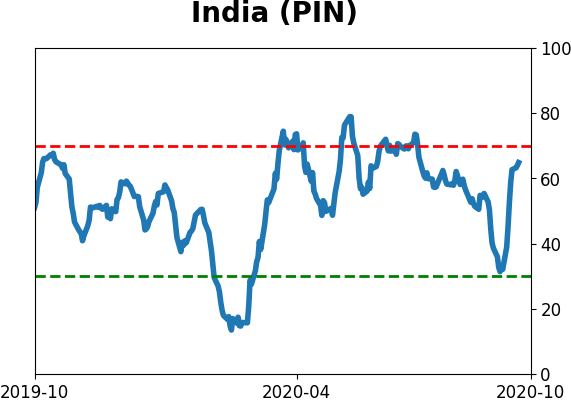
Country ETF's - 10-Day Moving Average
|
|
|
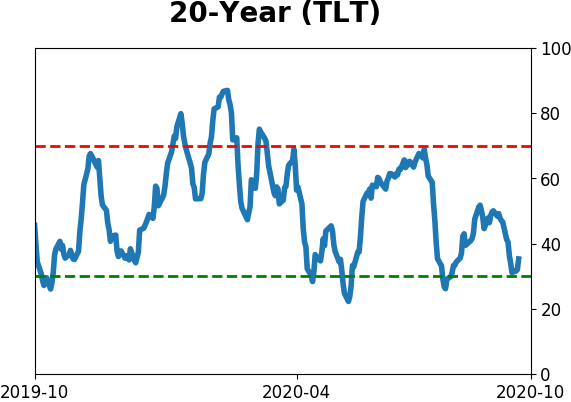
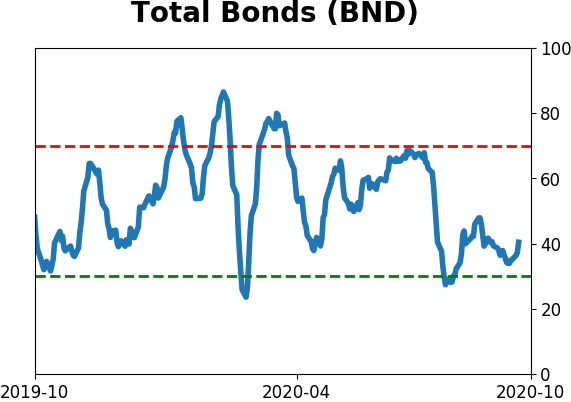
Bond ETF's - 10-Day Moving Average
|
|
|
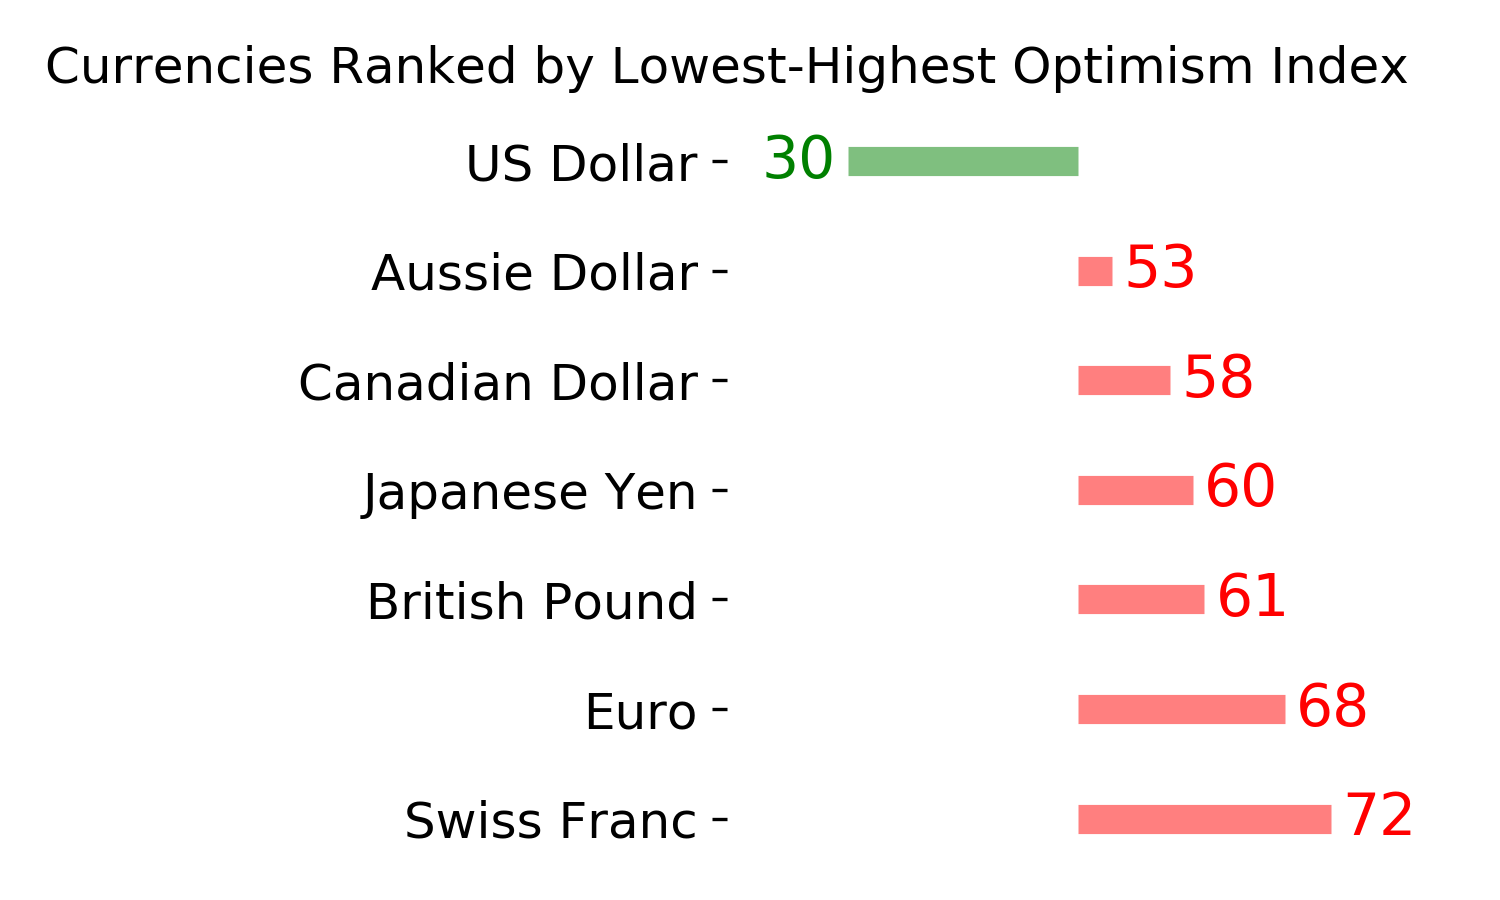
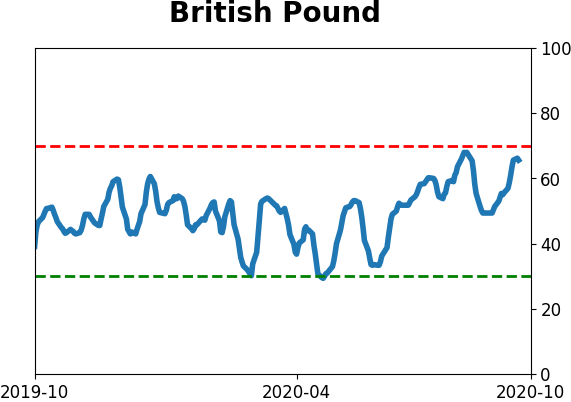
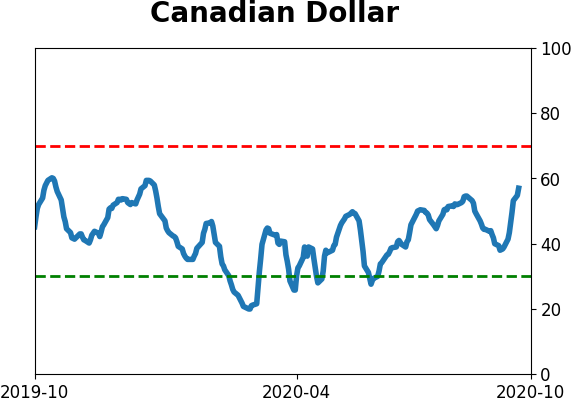
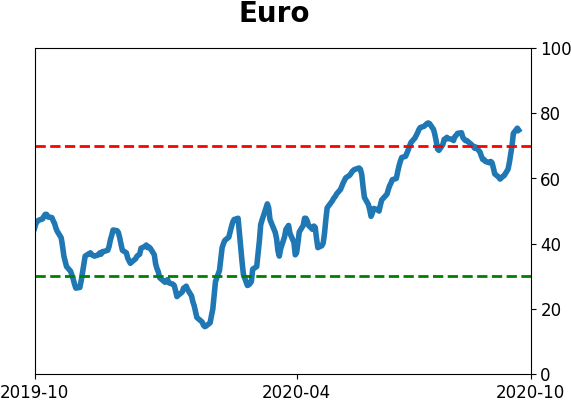
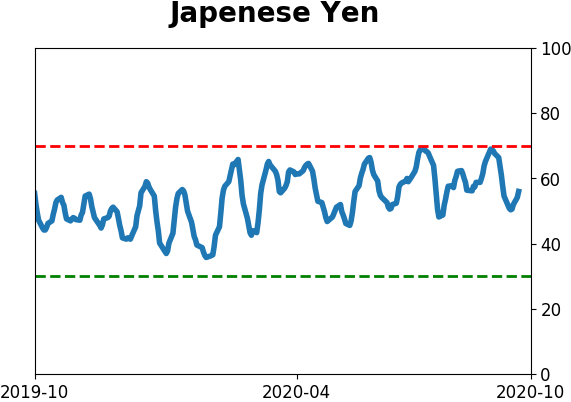
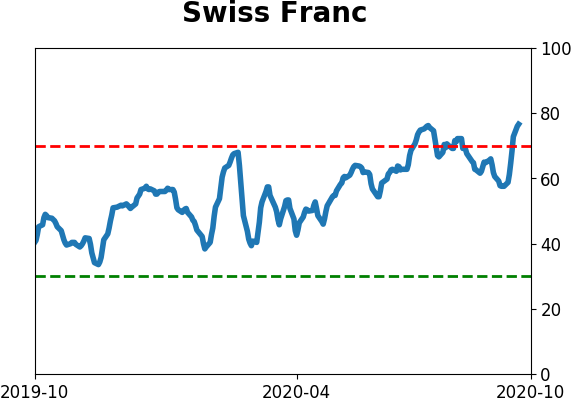
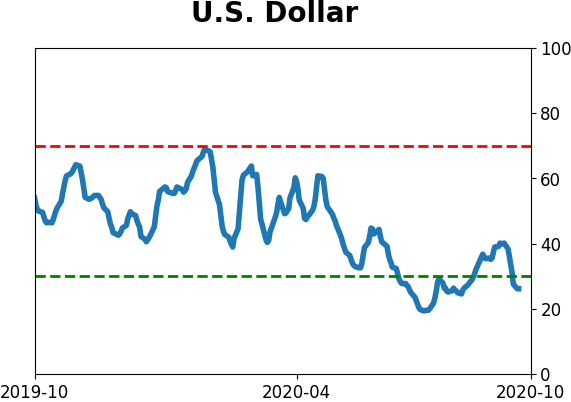
Currency ETF's - 5-Day Moving Average
|
|
|
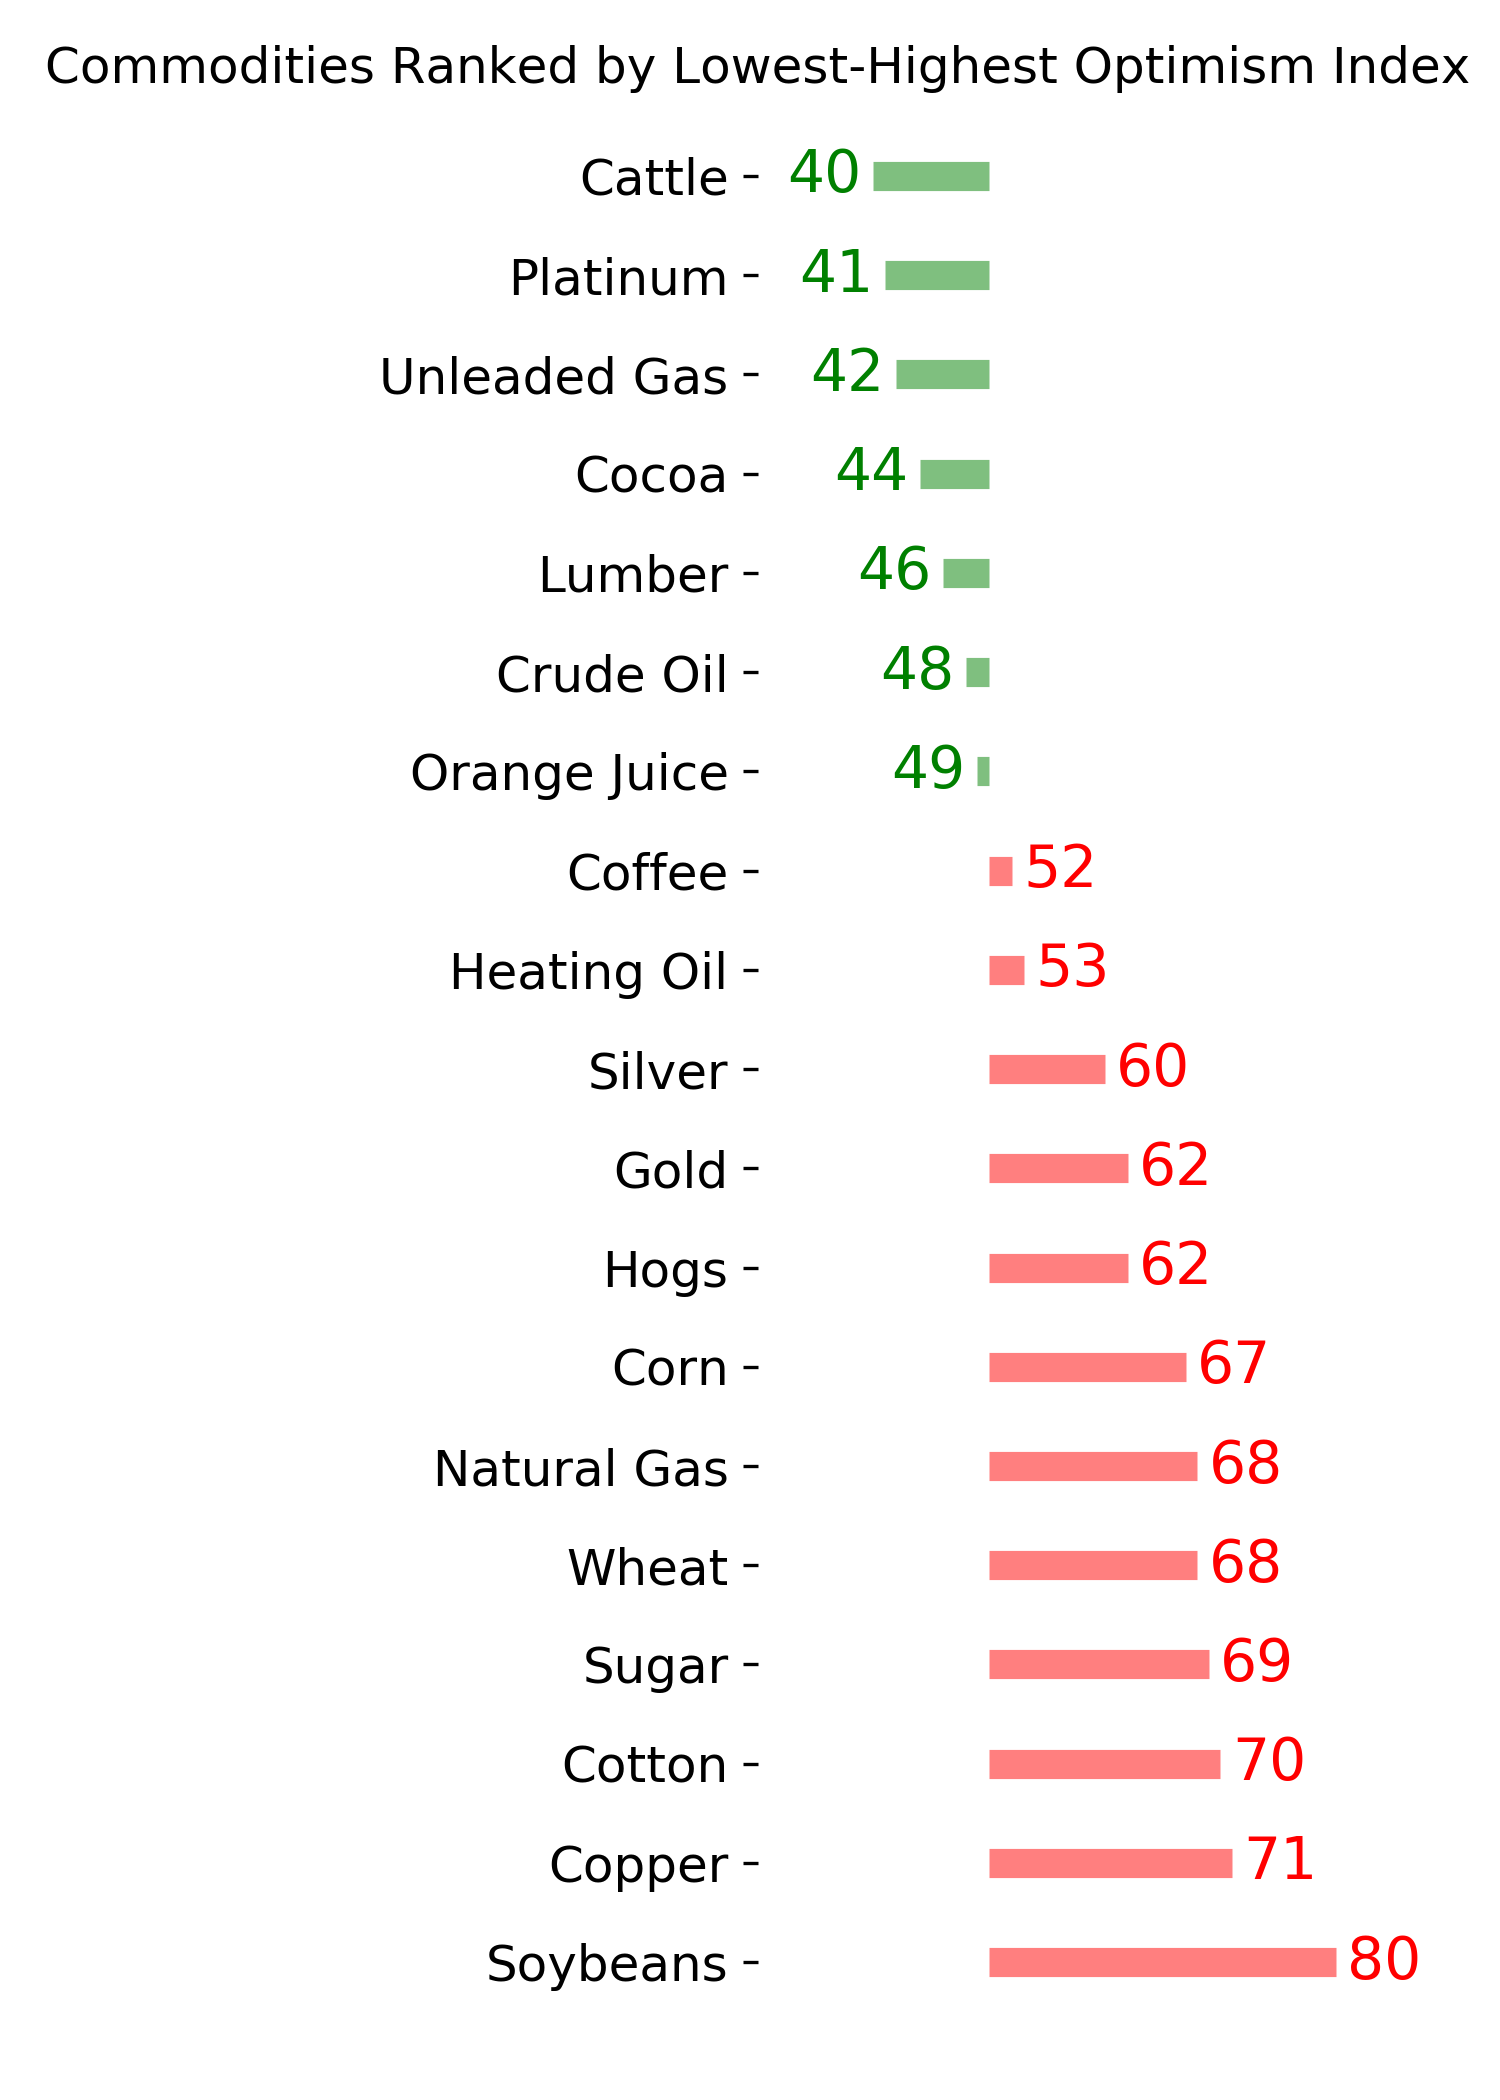
Commodity ETF's - 5-Day Moving Average
|
|