Headlines
|
|
Skeptical traders push Nasdaq short interest near record levels:
There has been a rise in the number of shares sold short against stocks trading on the Nasdaq exchange. Those bets are nearing a record high. That's supposed to be a good sign for future returns, and it is (kind of), it's just not a solid reason to buy.
SPY gaps and tail hedges:
The most important ETF in the world gapped up and added to gains for 4 straight days, the 1st time ever to this degree. At the same time, traders were buying far out-of-the-money put protection as hedges.
Bottom Line:
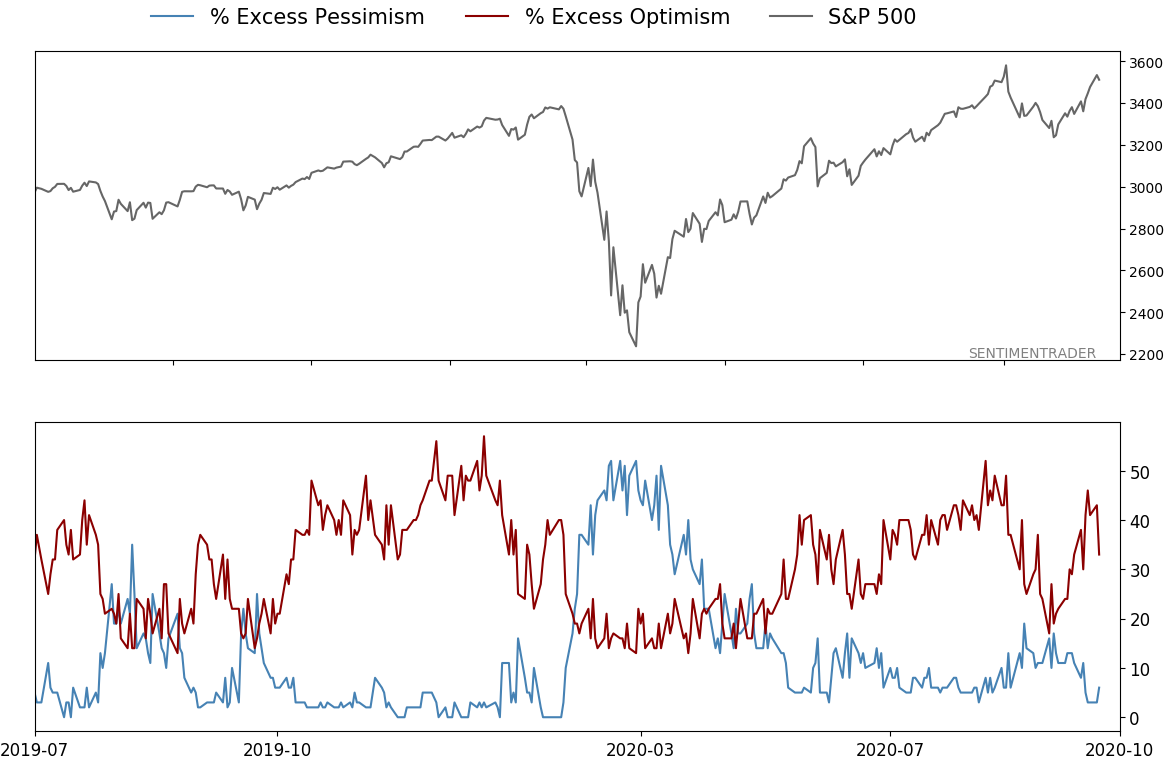
- A positive environment favors becoming aggressive on signs of excessive pessimism.
| Other Sectors and Assets |
| | Positives | Negatives | | 1. Energy (here and here) | 1. Skewed tech (here and here) |
| 2. Dollar test |
|
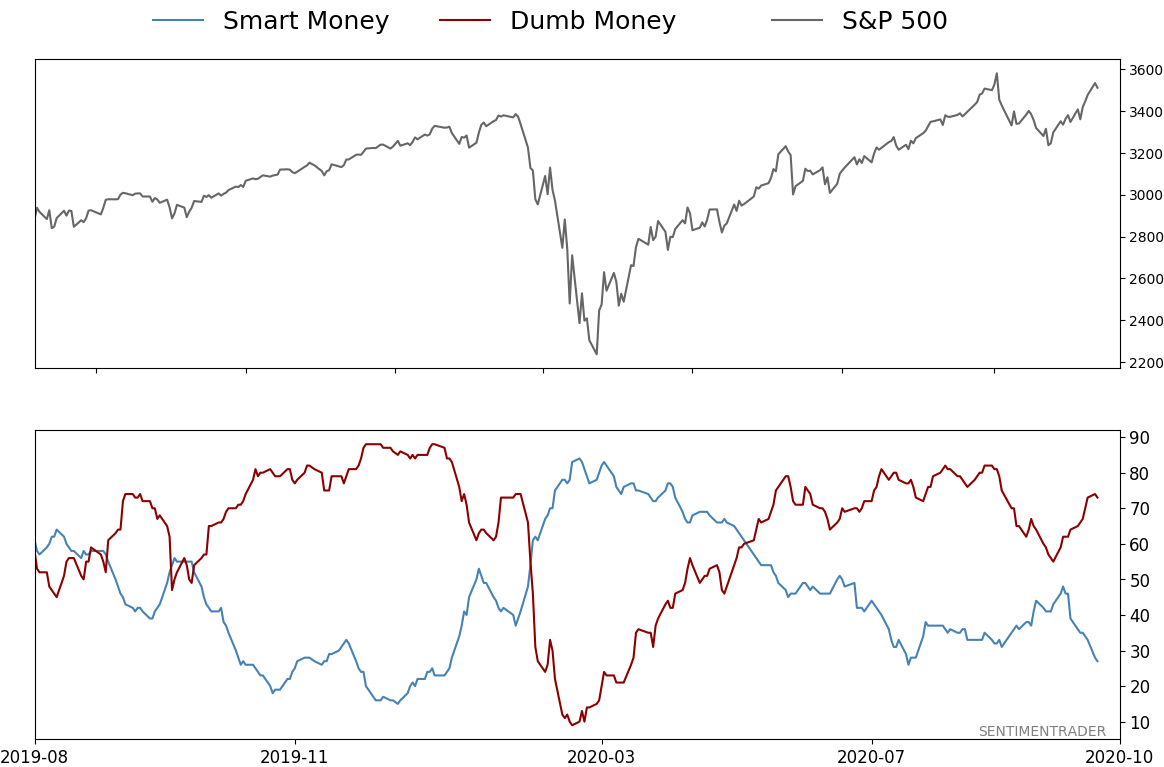
Smart / Dumb Money Confidence
|
Smart Money Confidence: 27%
Dumb Money Confidence: 73%
|
|
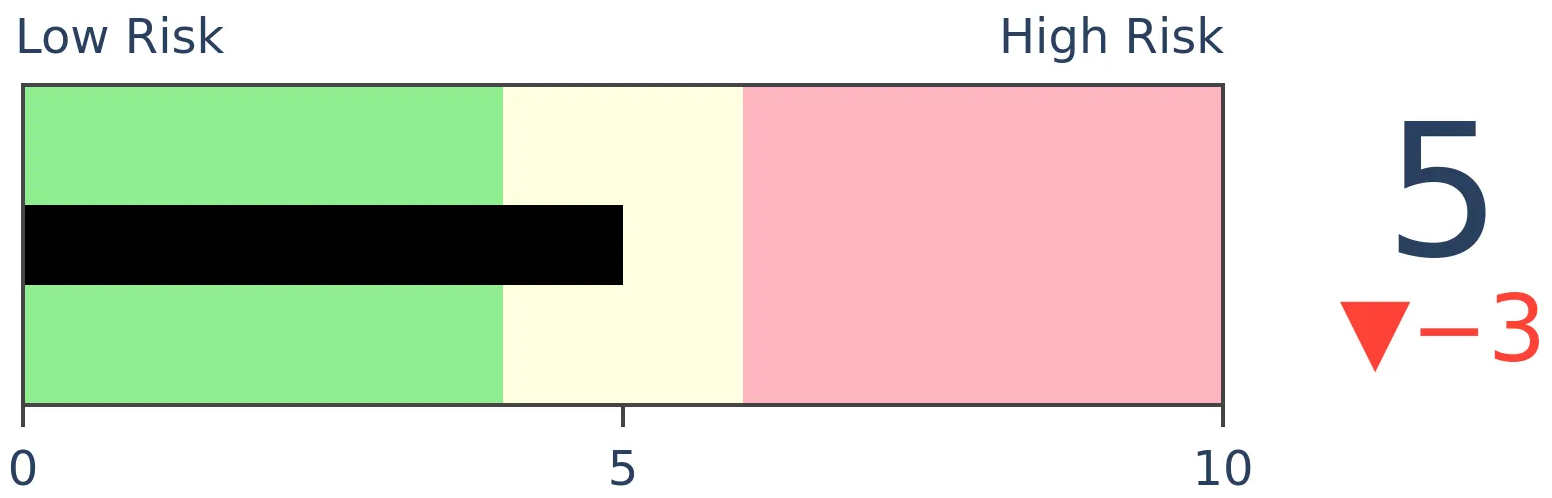
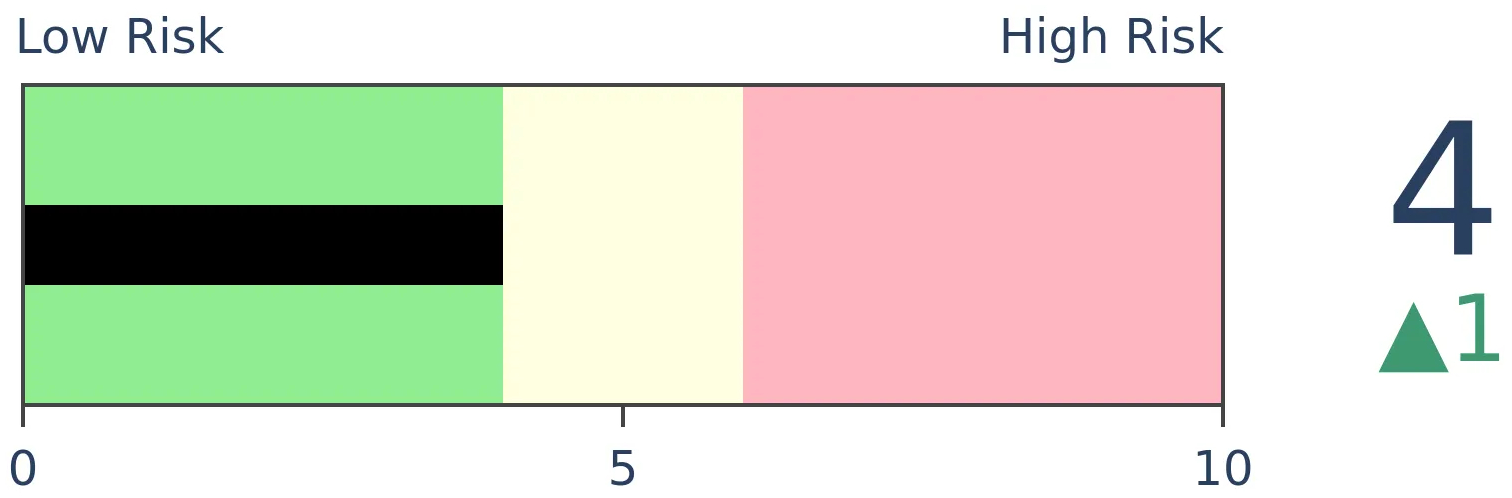
Risk Levels
Stocks Short-Term
|
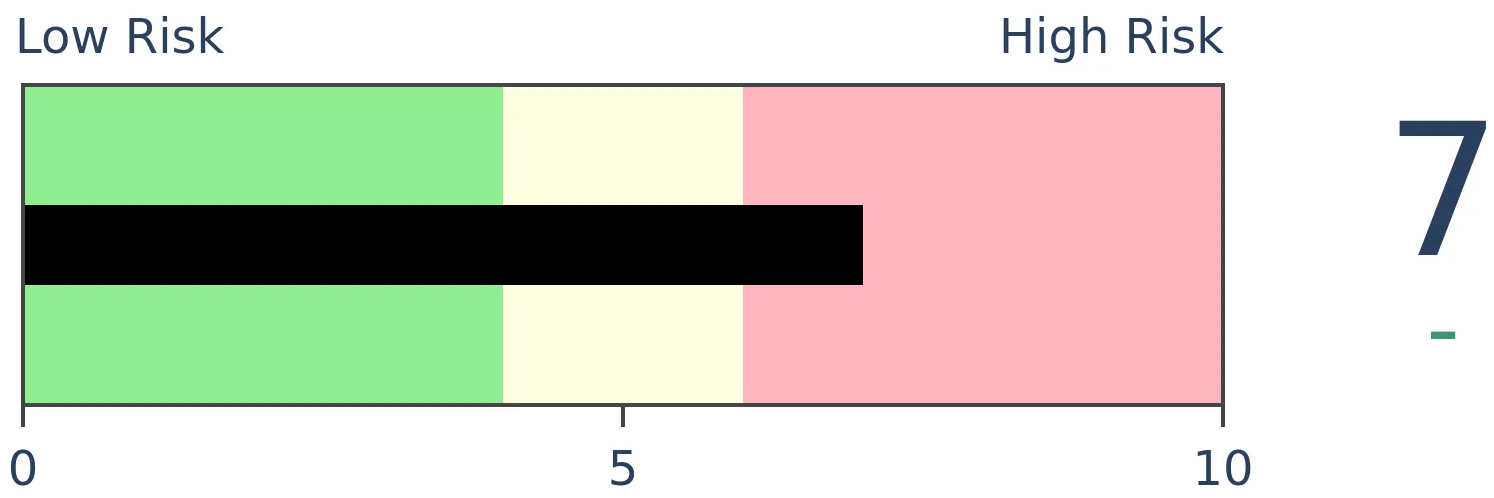
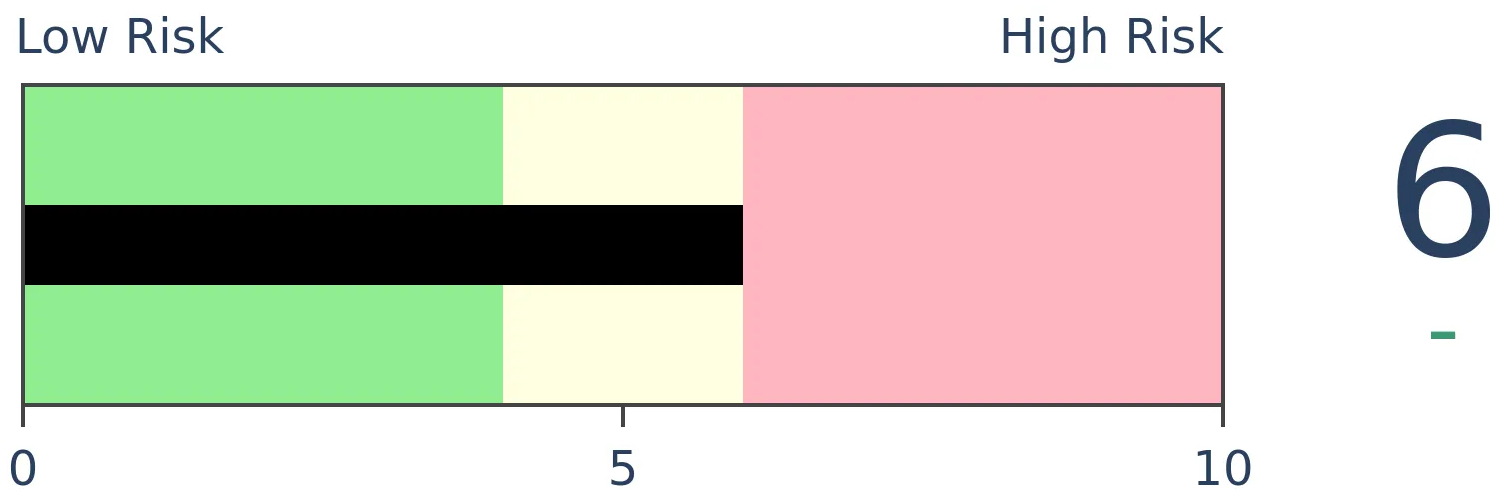
Stocks Medium-Term
|
|
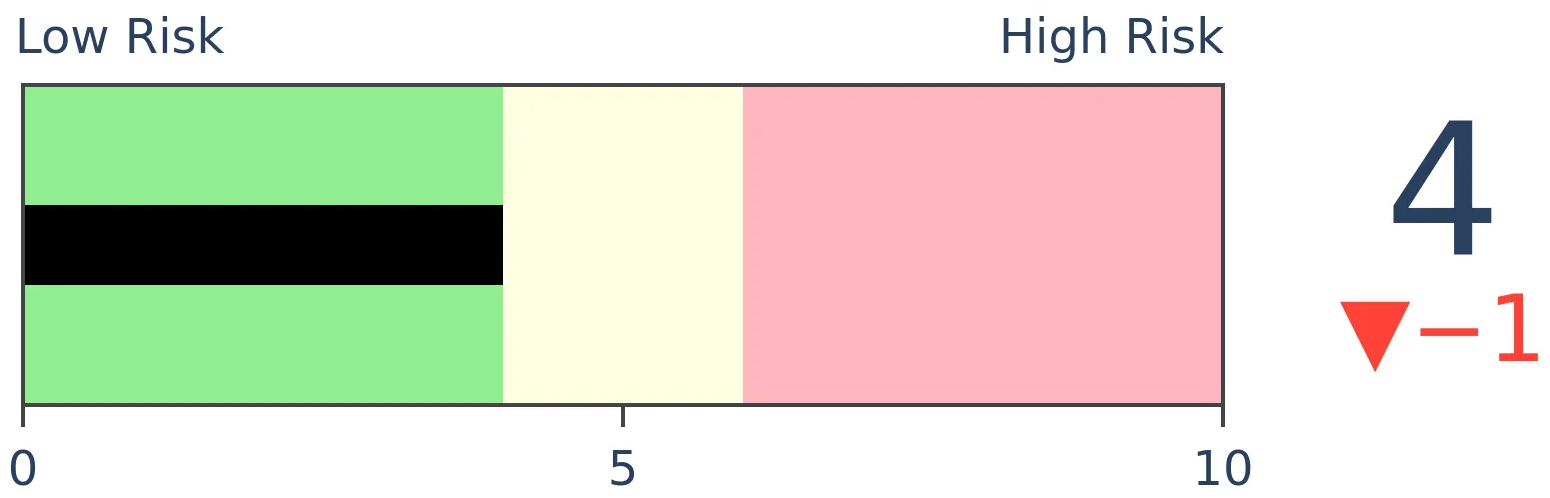
Bonds
|
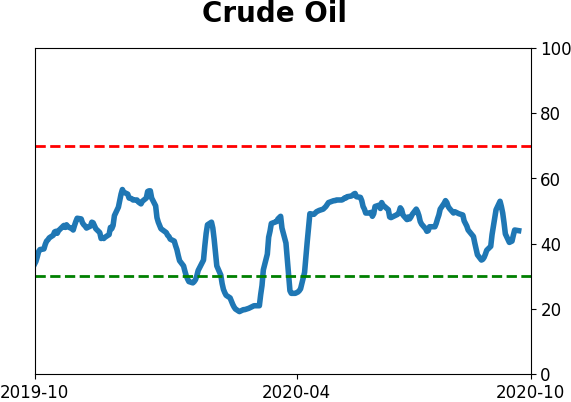
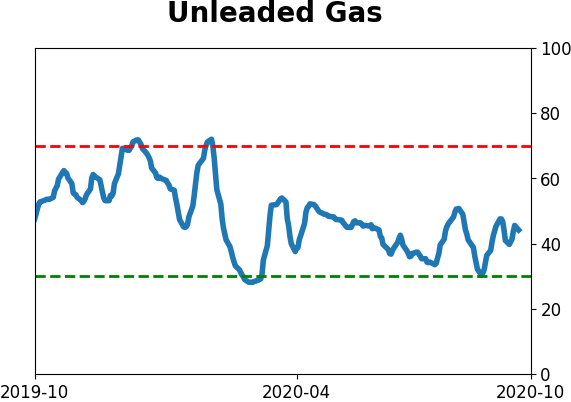
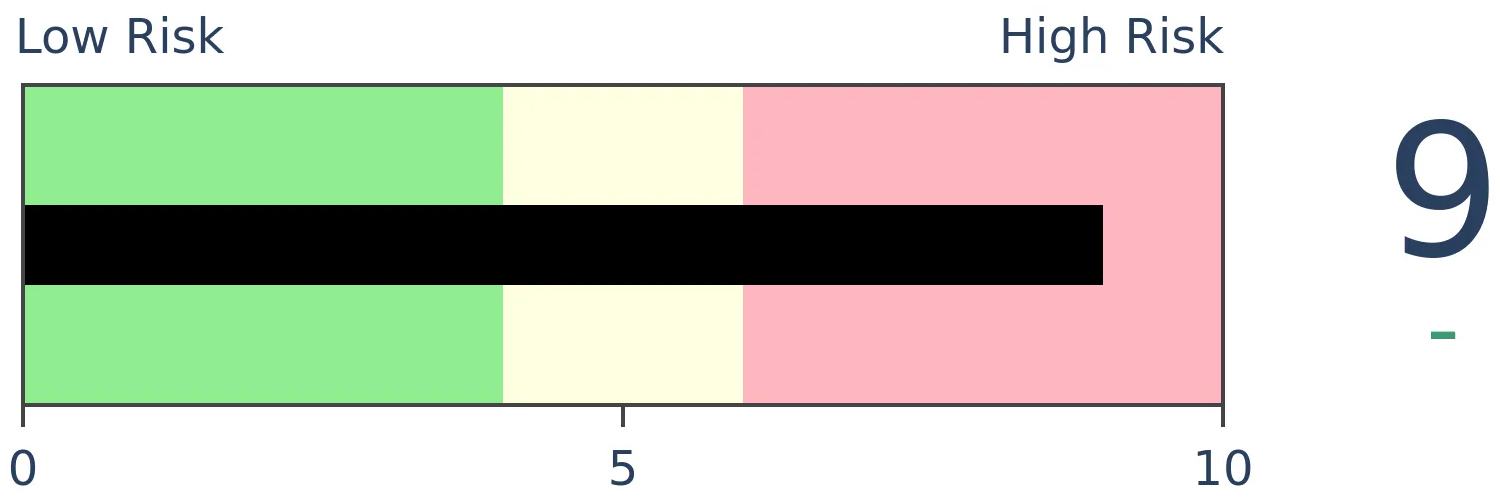
Crude Oil
|
|
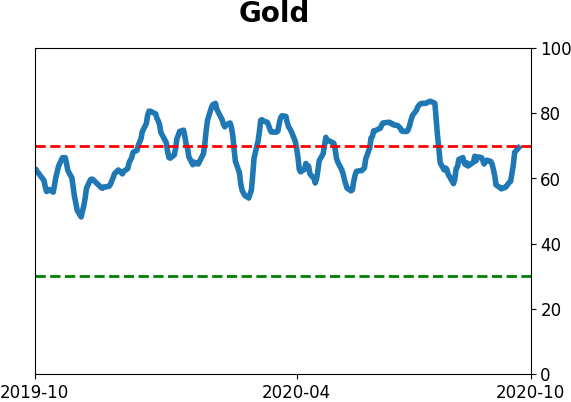
Gold
|
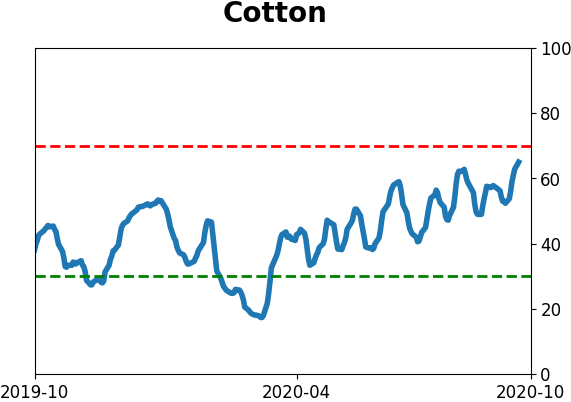
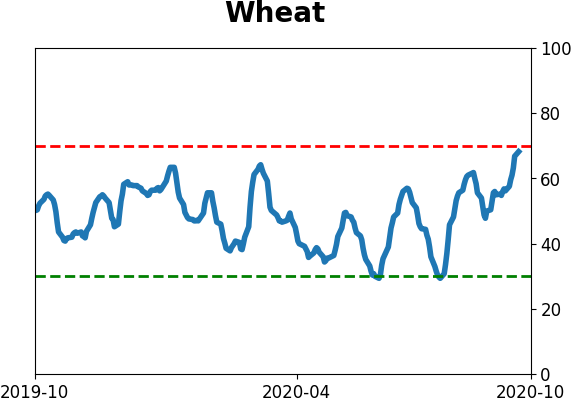
Agriculture
|
|
Research
BOTTOM LINE
There has been a rise in the number of shares sold short against stocks trading on the Nasdaq exchange. Those bets are nearing a record high. That's supposed to be a good sign for future returns, and it is (kind of), it's just not a solid reason to buy.
FORECAST / TIMEFRAME
None
|
Somebody, somewhere, still wants to bet against this market.
Short interest on stocks trading on the Nasdaq exchange rose in the last two weeks of September and is at the highest level in a decade, totaling nearly 9.7 billion shares.
According to Investopedia:
"Short selling is the opposite of buying stocks. It's the selling of a security that the seller does not own, done in the hope that the price will fall. If you feel a particular security's price, let's say the stock of a struggling company, will fall, then you can borrow the stock from your broker-dealer, sell it and get the proceeds from the sale.
Short interest is the total number of shares of a particular stock that have been sold short by investors but have not yet been covered or closed out. This can be expressed as a number or as a percentage."
We can see below that it's nearing its highest level ever.
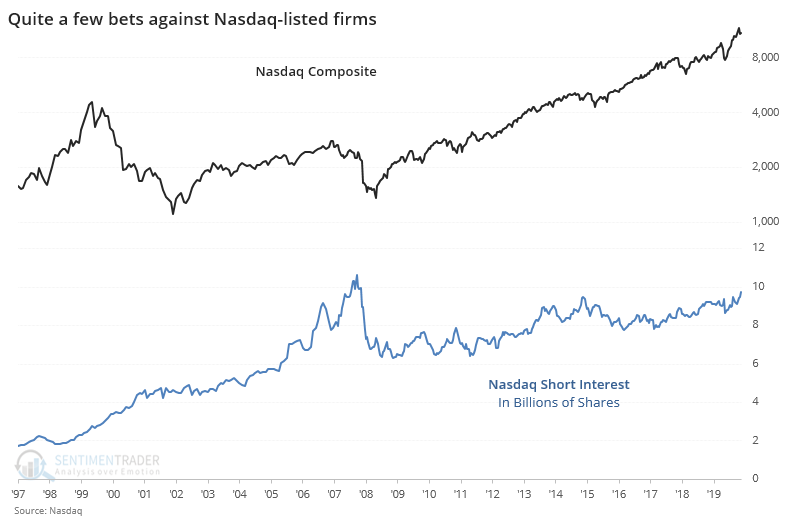
The typical interpretation of short interest is that it's a contrary indicator. The more bets there are against stocks, the more potential buying demand there is when those short-sellers cover their bets, and the more bullish it is for stocks.
This is one of those tropes that sounds good but fails in practice. It just doesn't work very well, especially when using aggregates, like across an entire exchange. On an individual stock basis, there is likely more utility to it, but as a non-contrary indicator.
In a 2009 Journal of Financial Economics paper, Boehmer and Huszar found that:
"Stocks with relatively high short interest subsequently experience negative abnormal returns, but the effect can be transient and of debatable economic significance. In contrast, relatively heavily traded stocks with low short interest experience both statistically and economically significant positive abnormal returns."
Let's see if high short interest has helped the Nasdaq's future returns. When short interest is at a multi-year high while the Composite was less than 10% from its own multi-year high, forward returns were actually quite good.
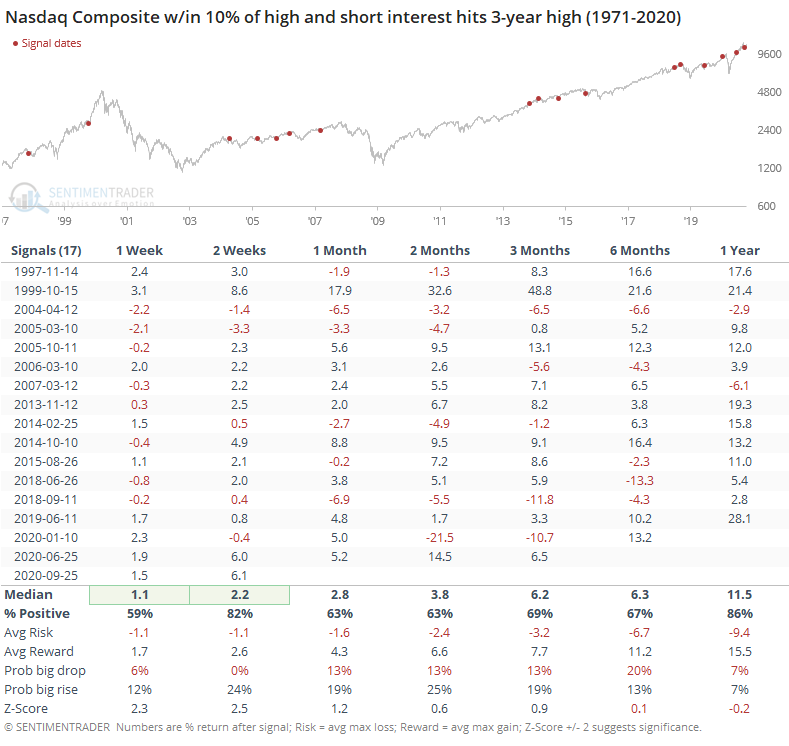
We wouldn't put much weight on the short-term numbers since this data is released with a delay and it wouldn't be usable. Over the medium- to long-term, a more appropriate time frame, returns were mostly positive. When we look at the risk/reward ratio and probability of a big gain or loss, though, it's not very impressive, about in line with random.
We sometimes get asked why bother showing any studies that don't have a solid edge. We do it because these short interest figures get tossed out frequently, and if we see this and assume it's a buy signal, because that's what we're taught to believe, then we're fooling ourselves. There are reasons to be optimistic here; this ain't one.
BOTTOM LINE
The most important ETF in the world gapped up and added to gains for 4 straight days, the 1st time ever to this degree. At the same time, traders were buying far out-of-the-money put protection as hedges.
FORECAST / TIMEFRAME
None
|
There was a whole litany of concerns tearing at investors heading into October, the "scariest month of the year." It's been scary all right, but only for the new wave of short-sellers.
Heading into Monday, the most important ETF in the world had gapped up at least 0.25% at the open for 3 straight days, as eager buyers pushed stocks higher overnight. Not only that, latecomers kept up the pressure, and the fund closed higher than the open by at least 0.25% each of those days as well. It doesn't seem like much, but it's never happened before.
Monday marked the 1st time in the nearly 30-year history of SPY that it gapped up and then added that much for 4 straight sessions. It went 3 consecutive days a handful of times.
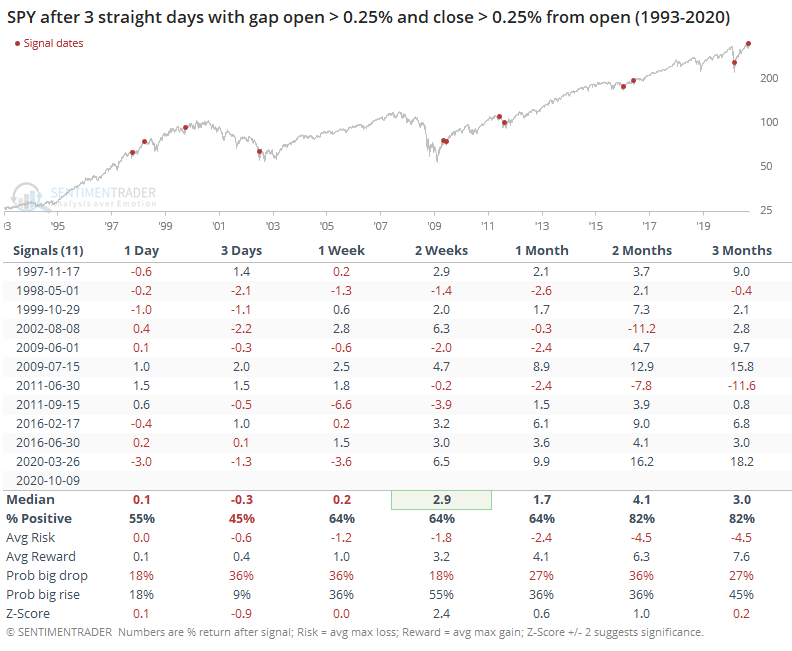
The persistent short-term buying led to more weakness than strength in the very short-term, but 2 weeks later, SPY was higher most of the time. It was more consistently higher 2-3 months later. While there were a couple of hefty losses mixed in, this kind of buying pressure tended to persist.
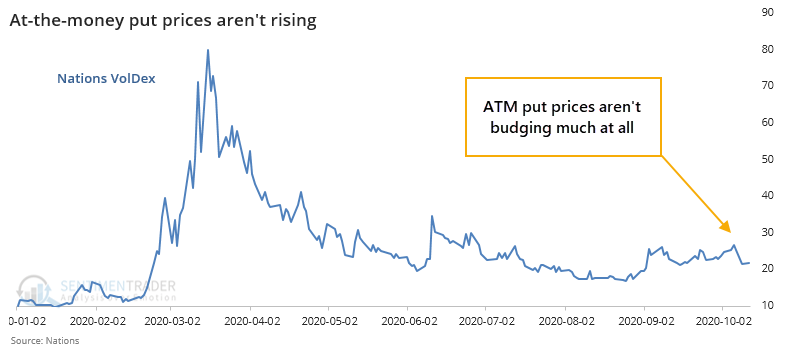
Despite the big gains on Monday, implied volatility actually increased, with a slight uptick in the VIX "fear gauge." As noted by Scott Nations, president of Nations Indexes, this was mostly due to a big jump in extremely far out-of-the-money put options.
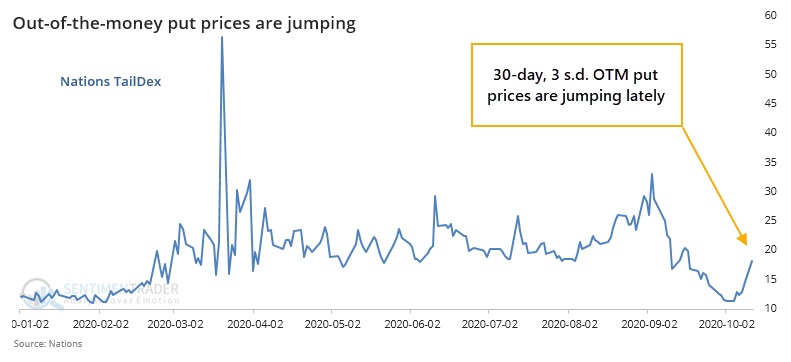
At the same time, at-the-money put options have barely budged.
This kind of scramble for lottery-ticket hedges on a big up day doesn't happen very often, all since 2019.
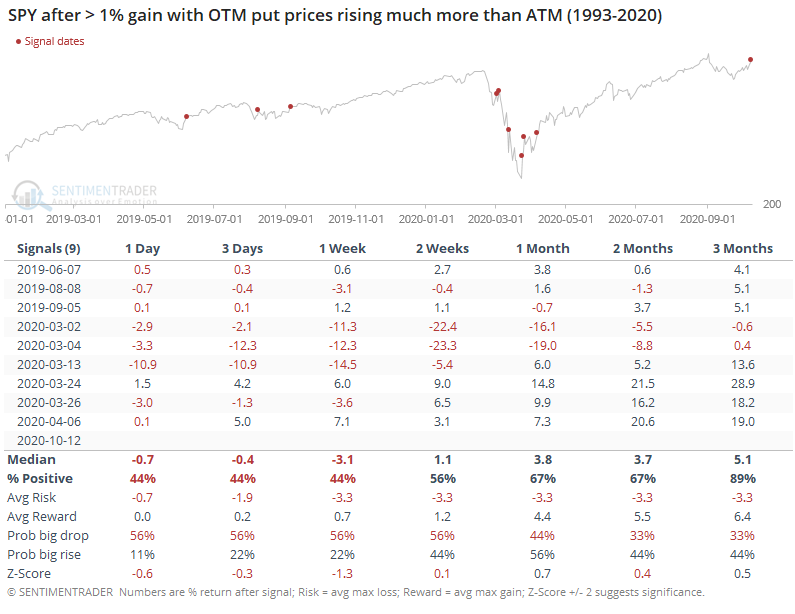
Again, this was more negative than not in the very short-term, but nothing much beyond a week.
Active Studies
| Time Frame | Bullish | Bearish | | Short-Term | 0 | 0 | | Medium-Term | 4 | 8 | | Long-Term | 48 | 2 |
|
Indicators at Extremes
Portfolio
| Position | Description | Weight % | Added / Reduced | Date | | Stocks | 15.6% RSP, 10.1% VWO, 7.6% XLE | 33.3 | Added 11% | 2020-10-08 | | Bonds | 10% BND, 10% SCHP, 10% ANGL | 29.7 | Reduced 0.1% | 2020-10-02 | | Commodities | GCC | 2.4 | Reduced 2.1%
| 2020-09-04 | | Precious Metals | GDX | 4.6 | Added 5% | 2020-09-09 | | Special Situations | | 0.0 | Reduced 5% | 2020-10-02 | | Cash | | 30.0 | | |
|
Updates (Changes made today are underlined)
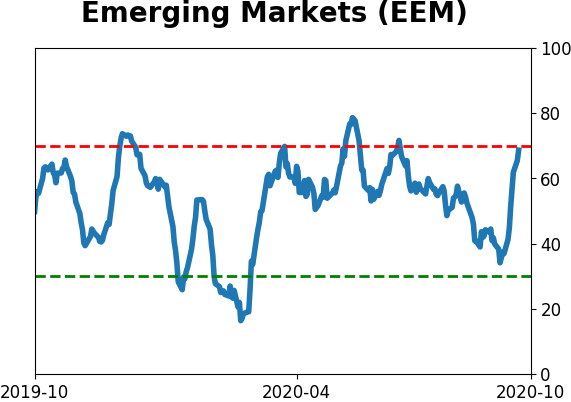
It's been a really mixed picture lately. In stocks, we saw huge momentum and a spike in speculation, then September managed to wring much of that out, except in the options market which is still a worry. There seem to be offsetting positives and negatives, with a mixed market environment, not the kind of setup where I feel comfortable being aggressive. I did add a bit to energy. The older I get, the less interested I am in short-term gyrations, and I don't really care about the coming days or even weeks. I'm fairly confident that the total return will be positive over a longer time frame given some of the developments we've looked in over the past week. With bonds, I decided to swap TLT for ANGL, a high-yield corporate fund with a heavy focus on energy bonds. Hedgers are heavily short 10-year Treasuries, and the high-yield market has held up well internally. I'm not generally a fan of buying into rising prices, but with the internal recovery in emerging markets from a compelling position (here and here), I started a position.
RETURN YTD: -0.3% 2019: 12.6%, 2018: 0.6%, 2017: 3.8%, 2016: 17.1%, 2015: 9.2%, 2014: 14.5%, 2013: 2.2%, 2012: 10.8%, 2011: 16.5%, 2010: 15.3%, 2009: 23.9%, 2008: 16.2%, 2007: 7.8%
|
|
Phase Table
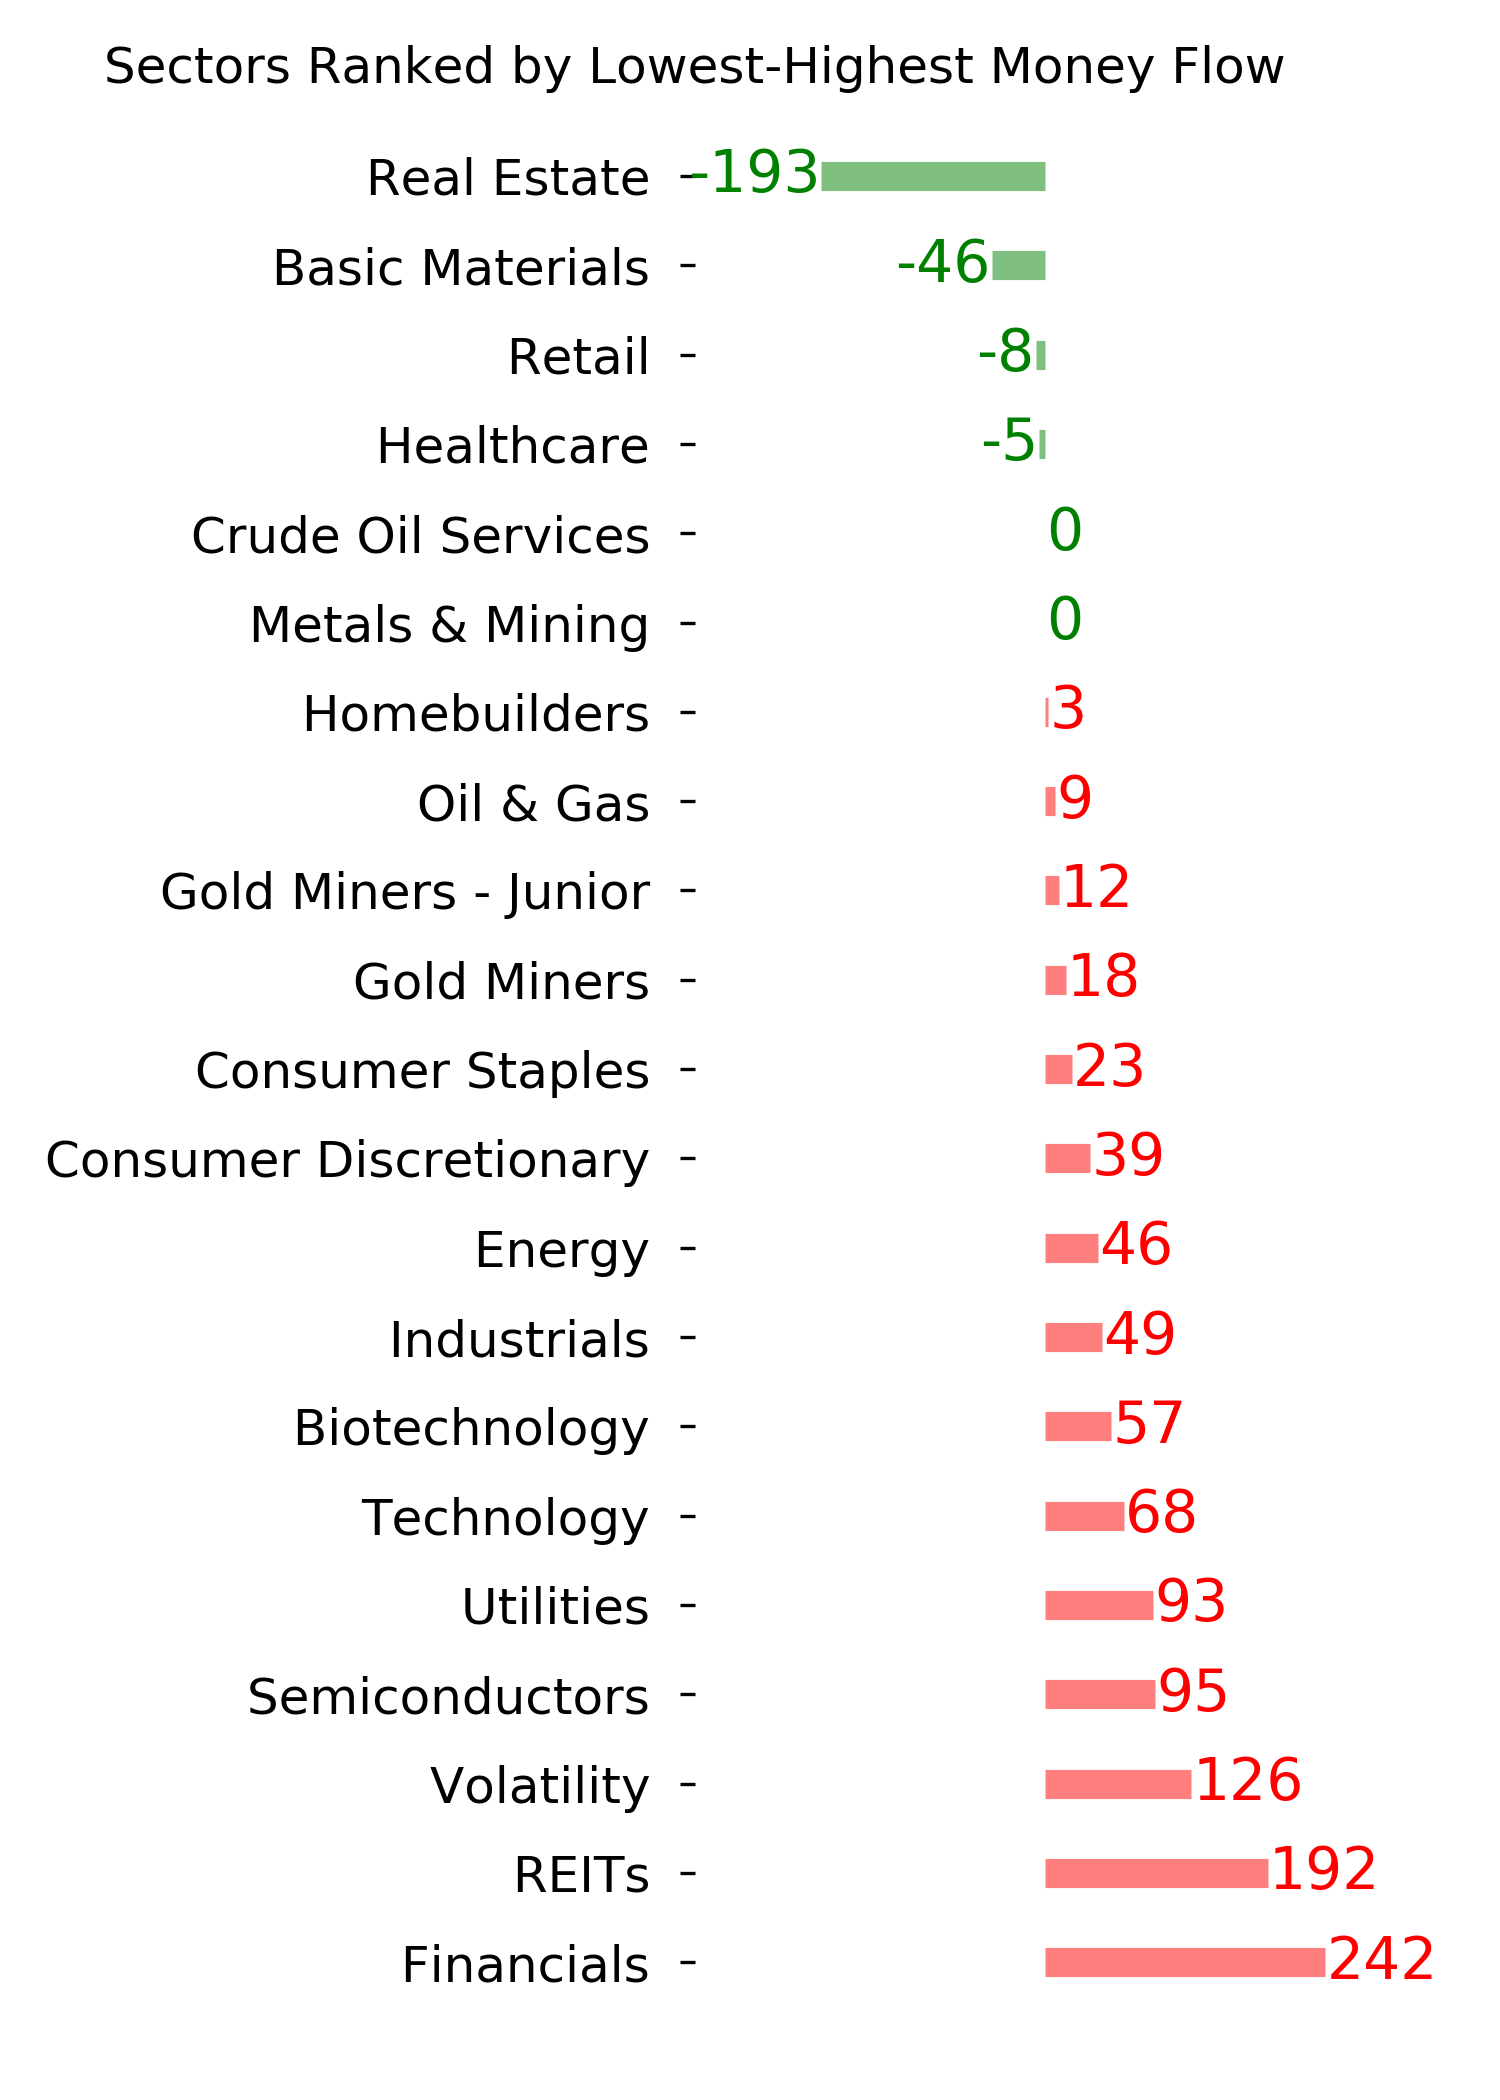
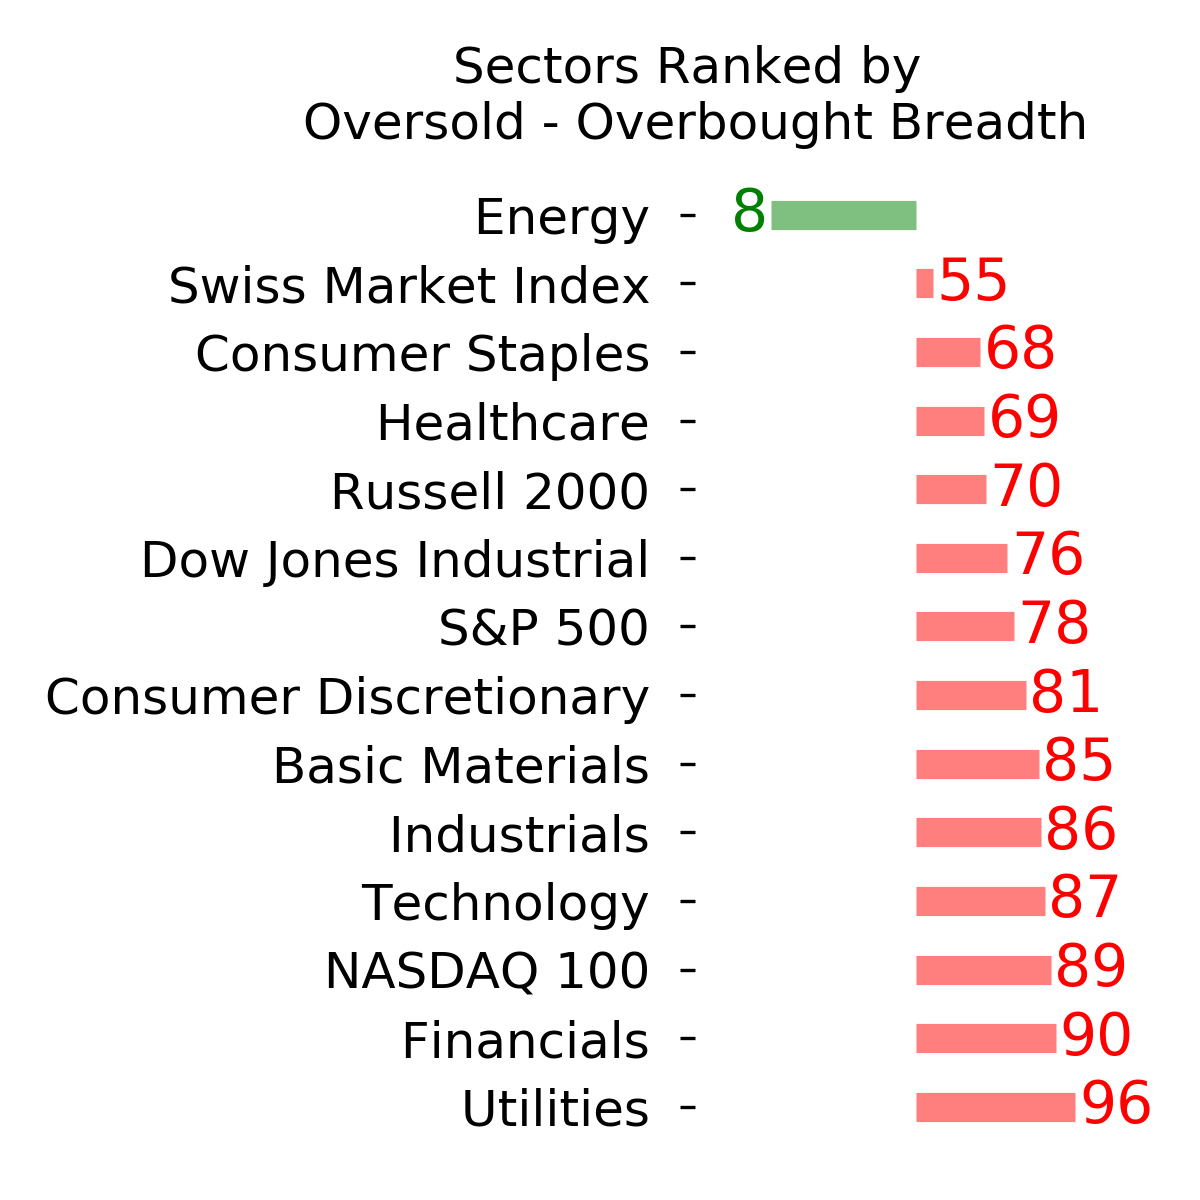
Ranks
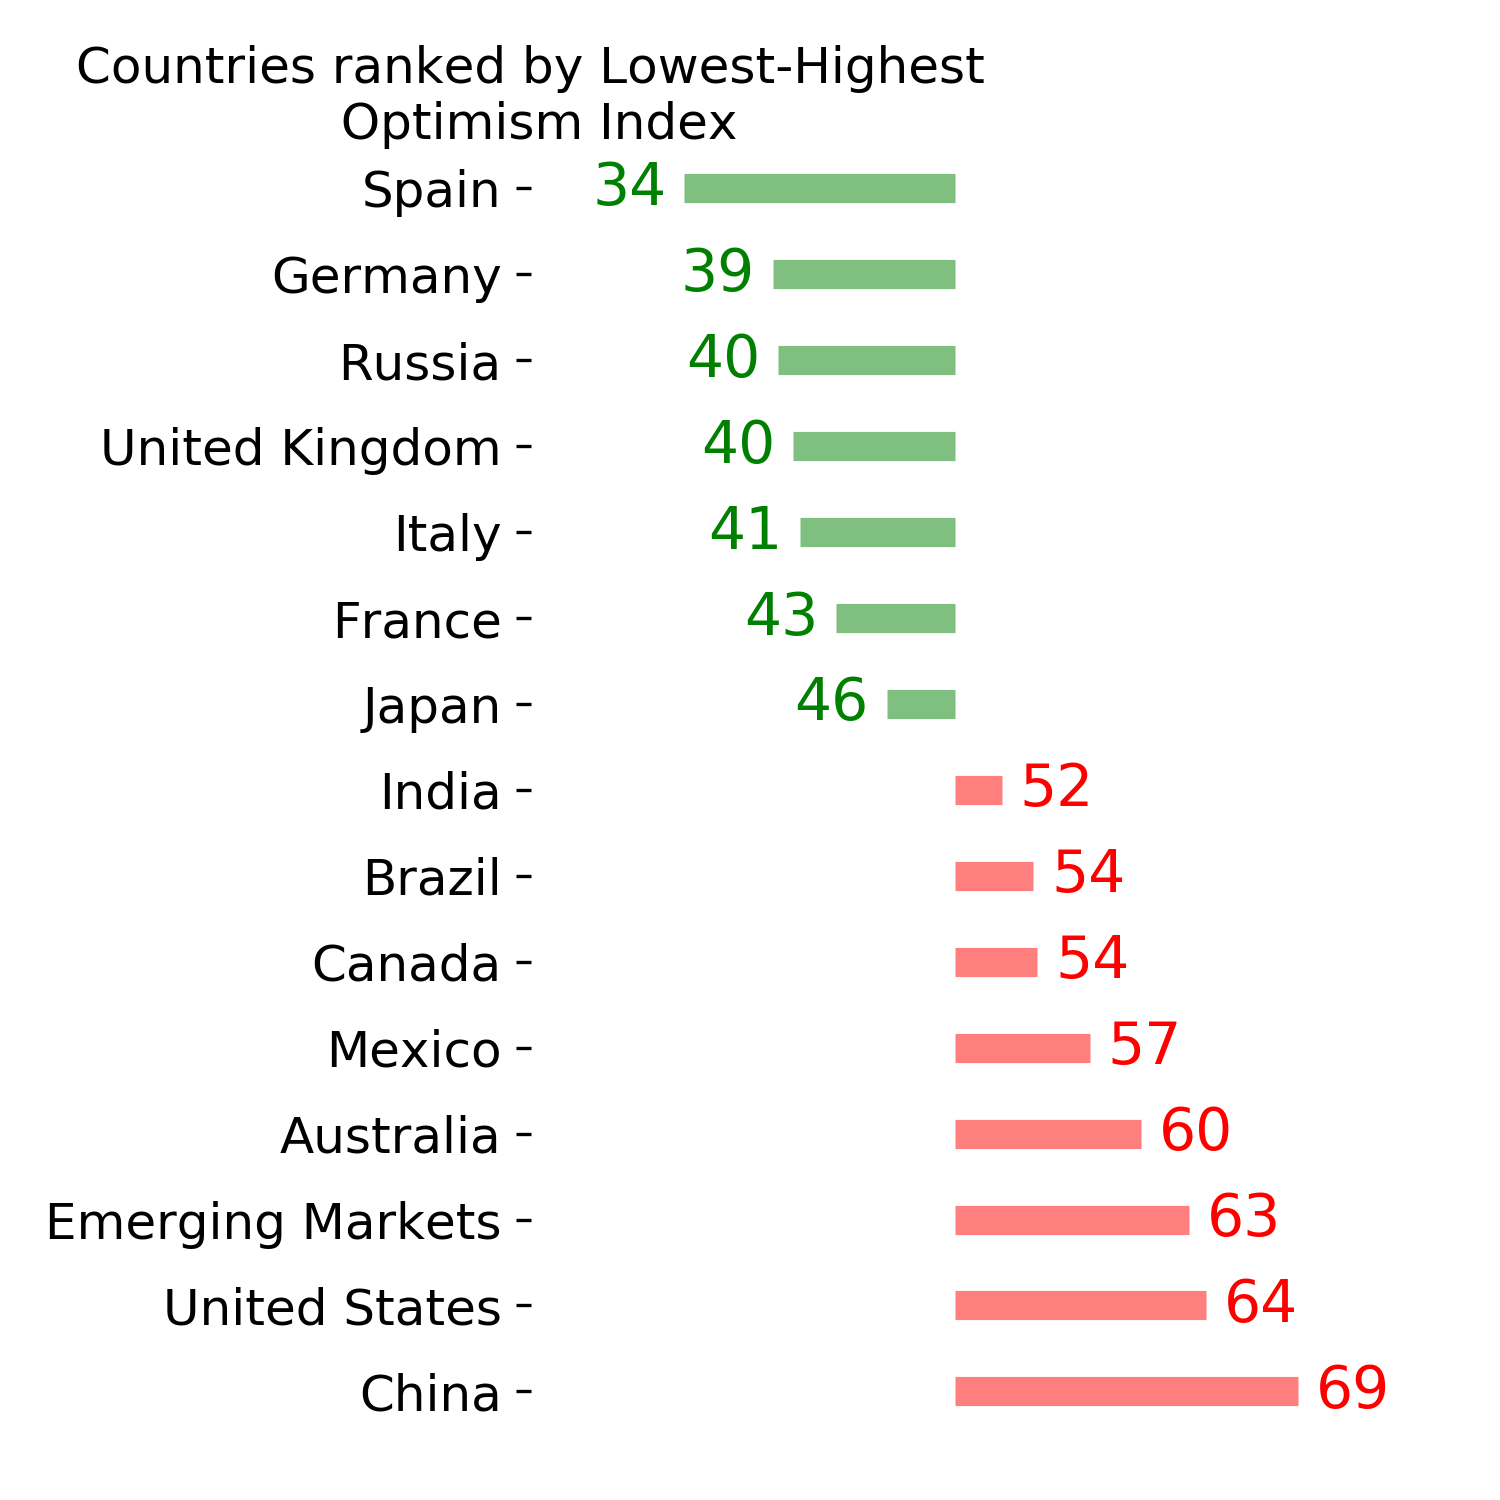
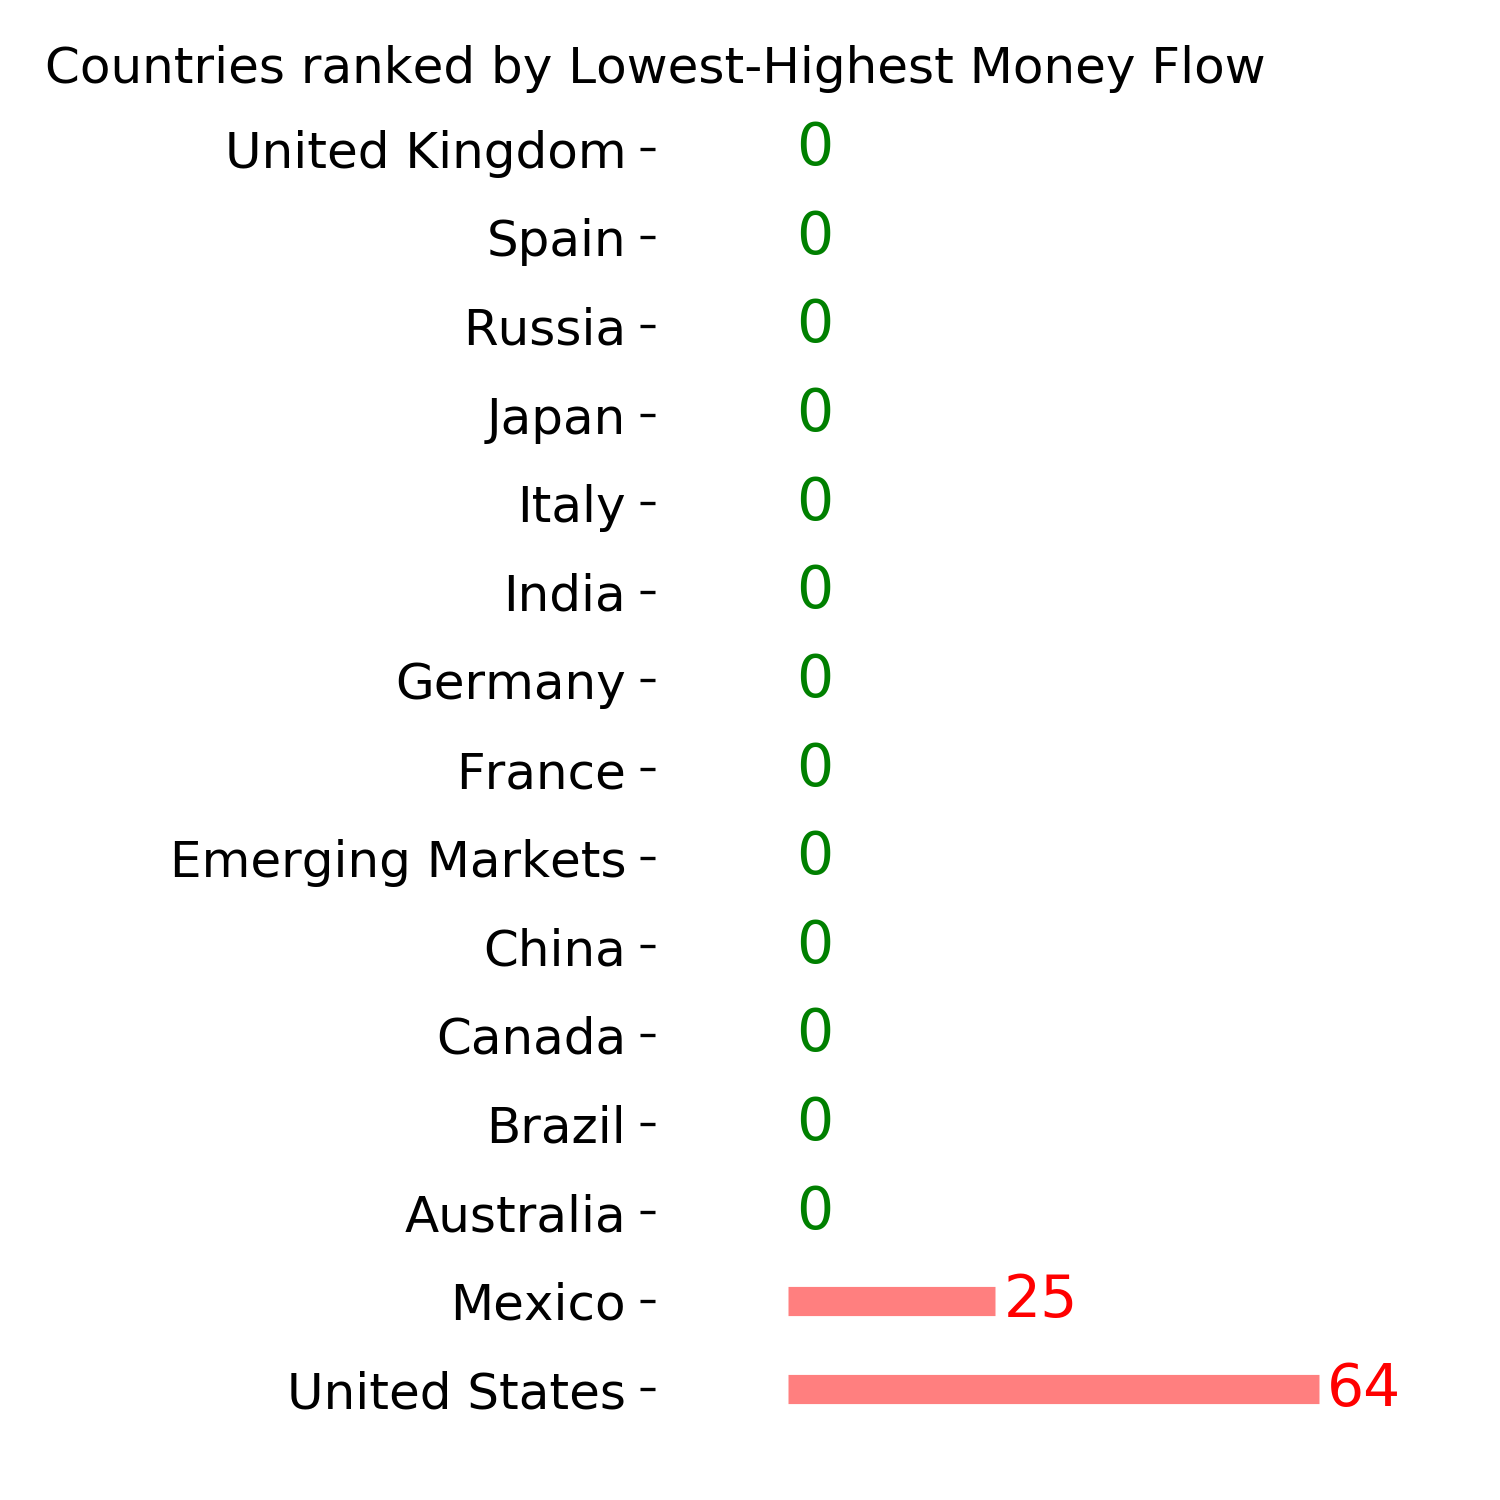
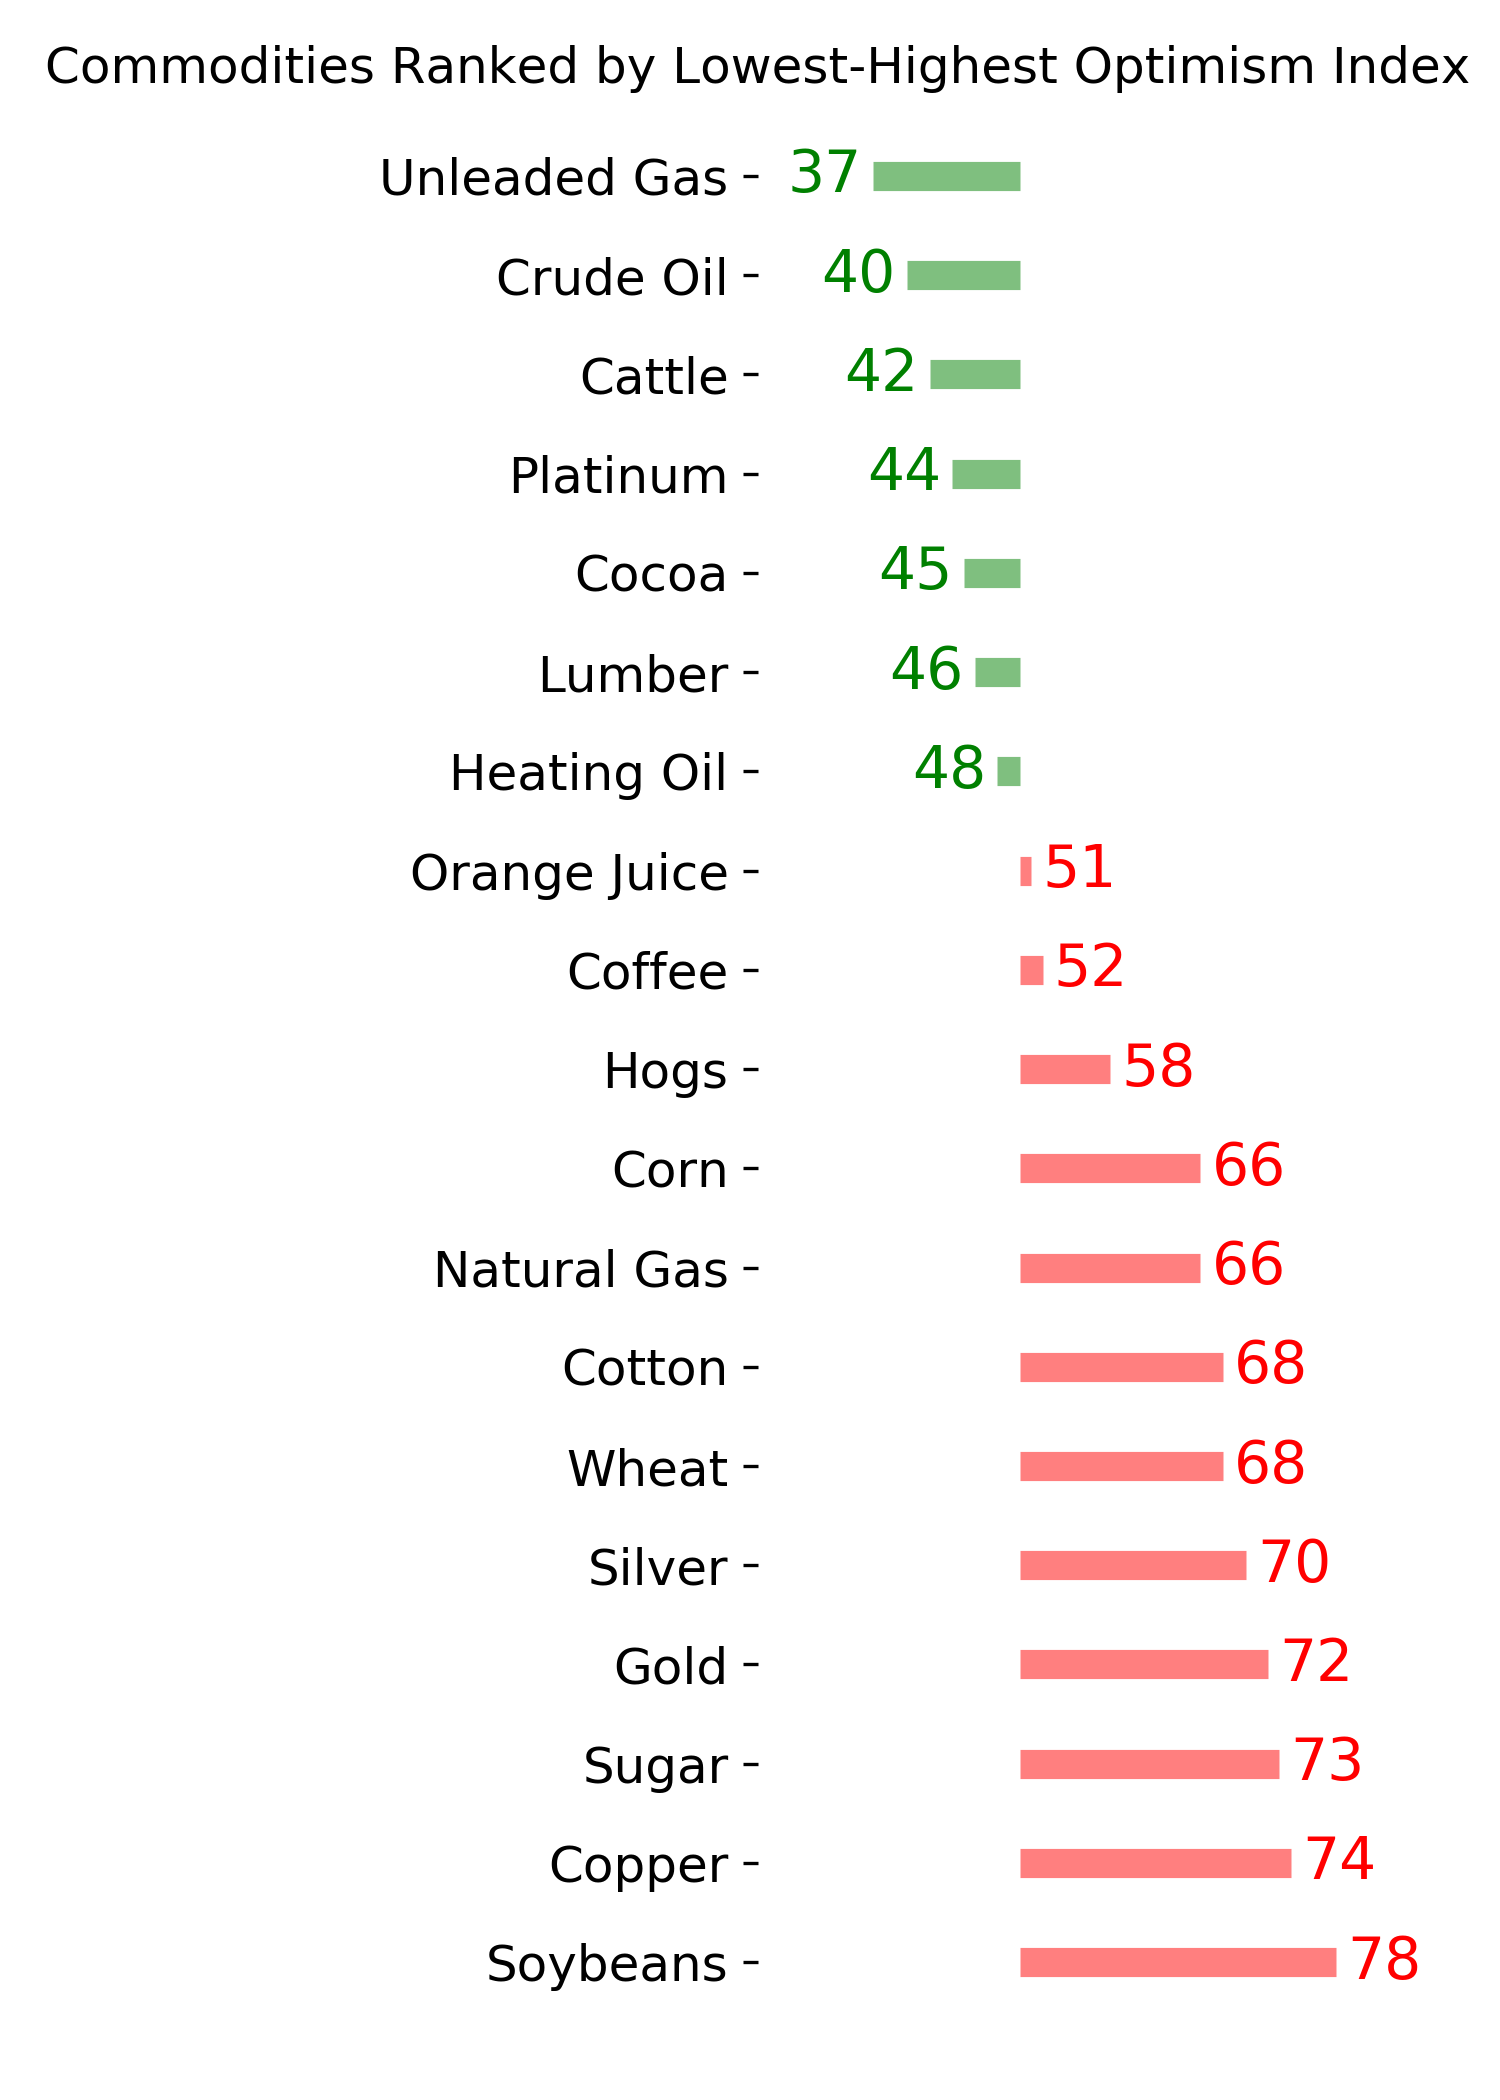
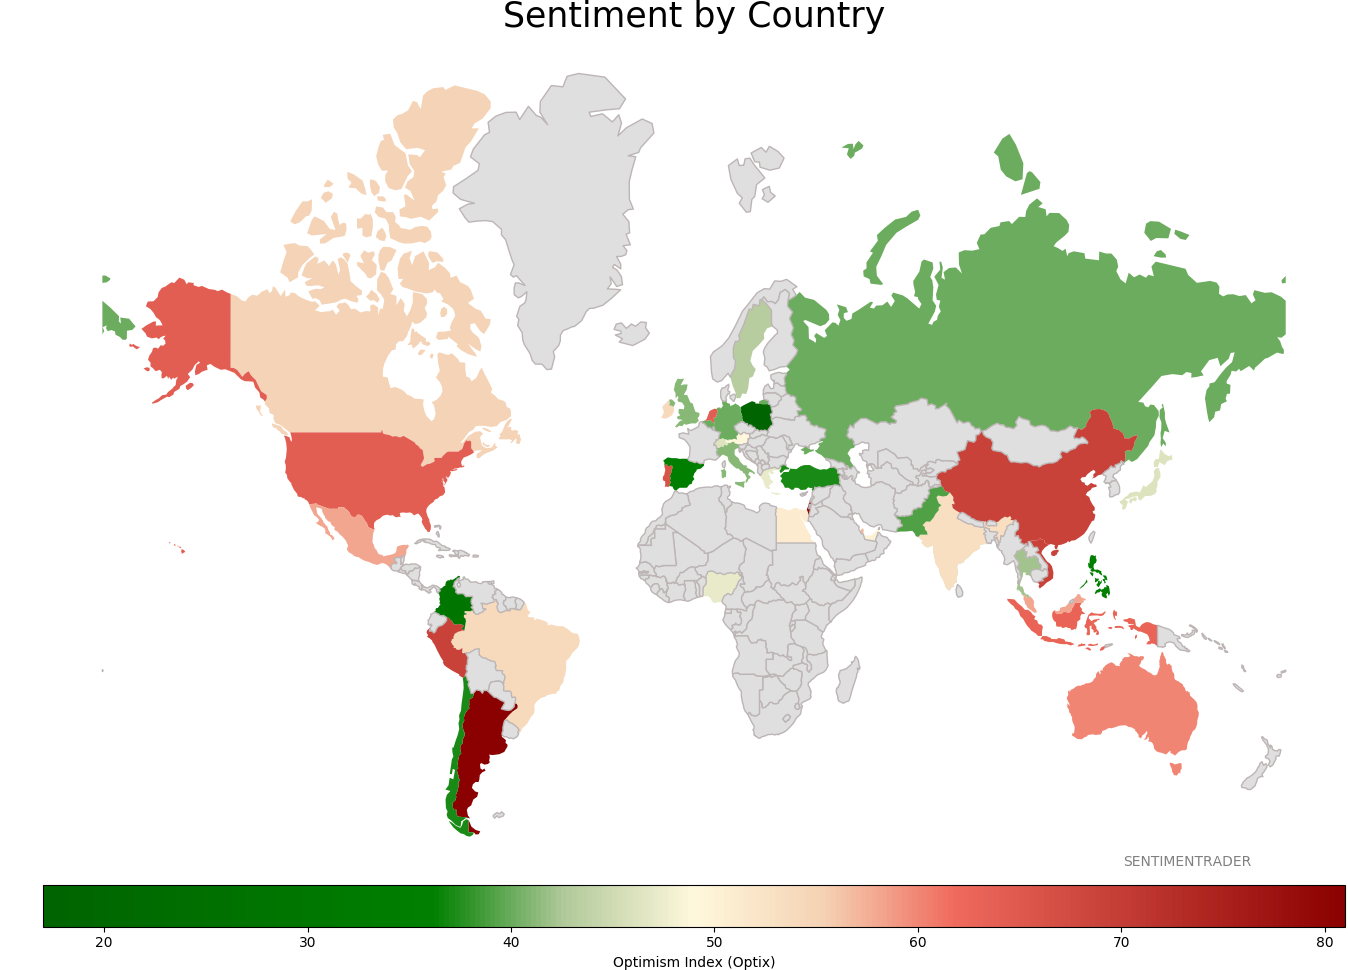
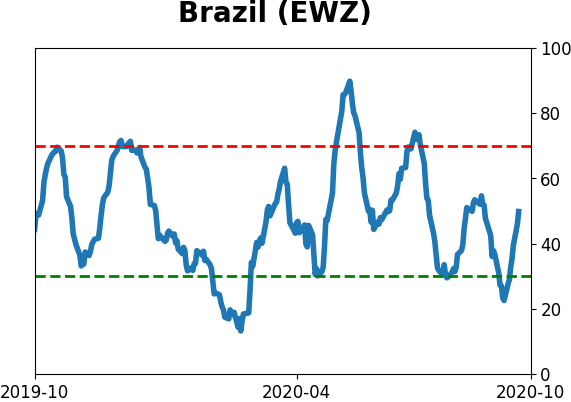
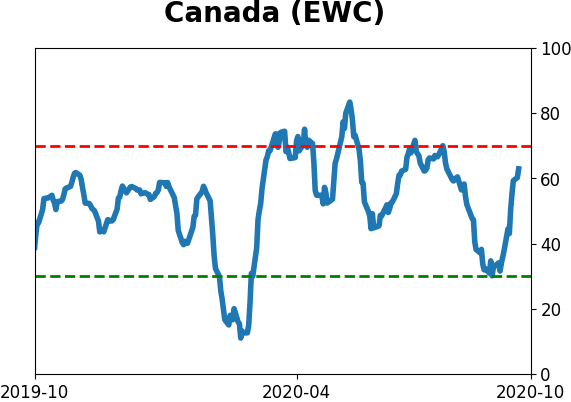
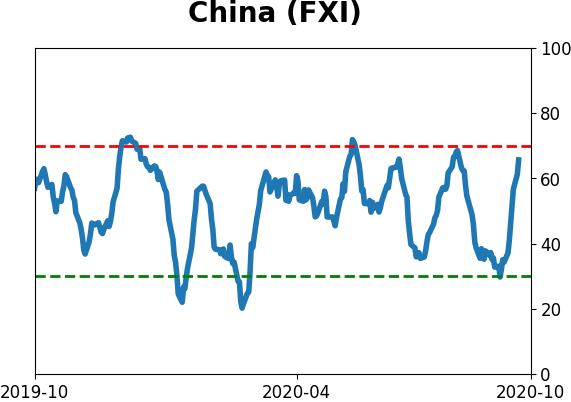
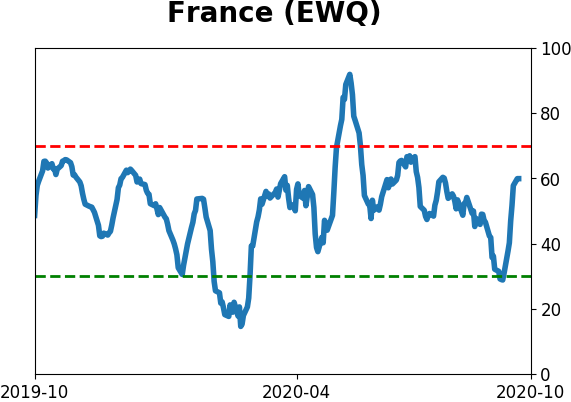
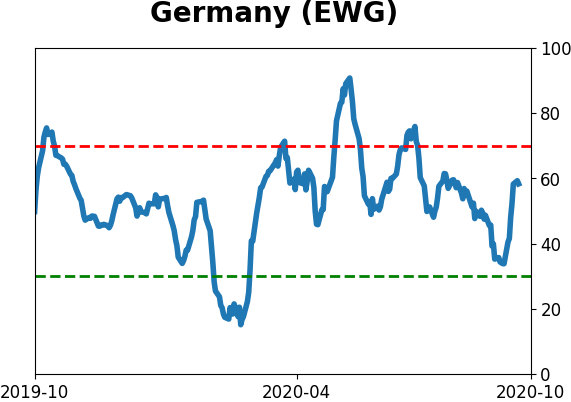
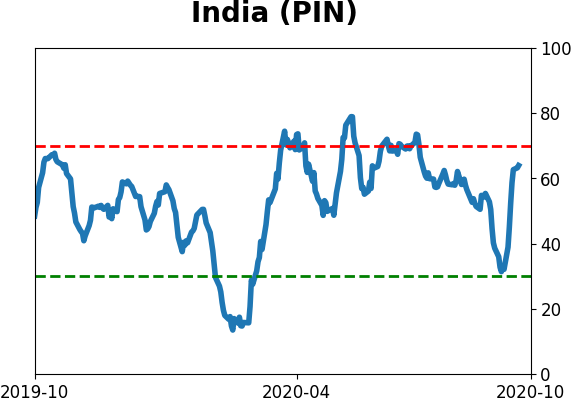
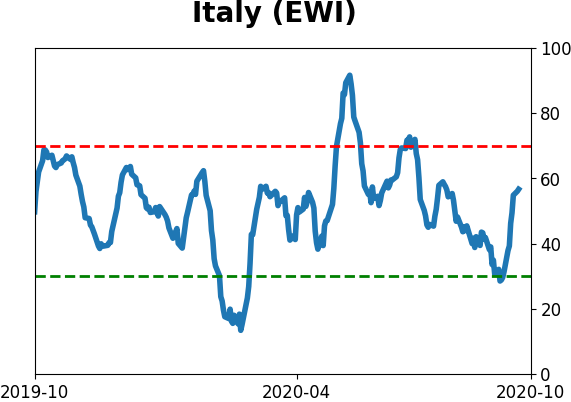
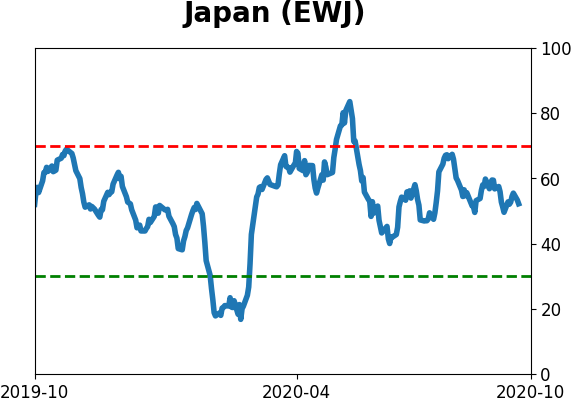
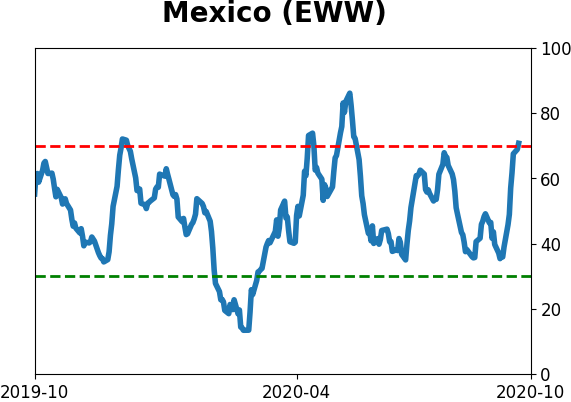
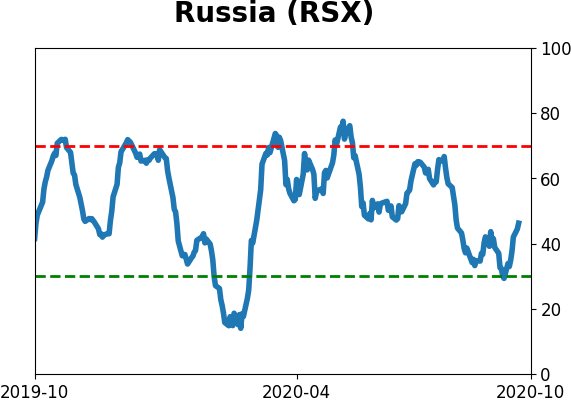
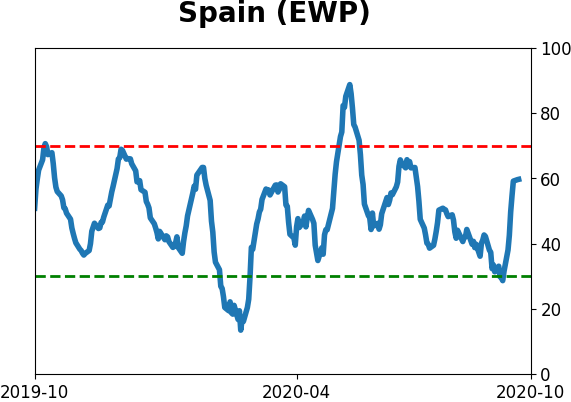
Sentiment Around The World
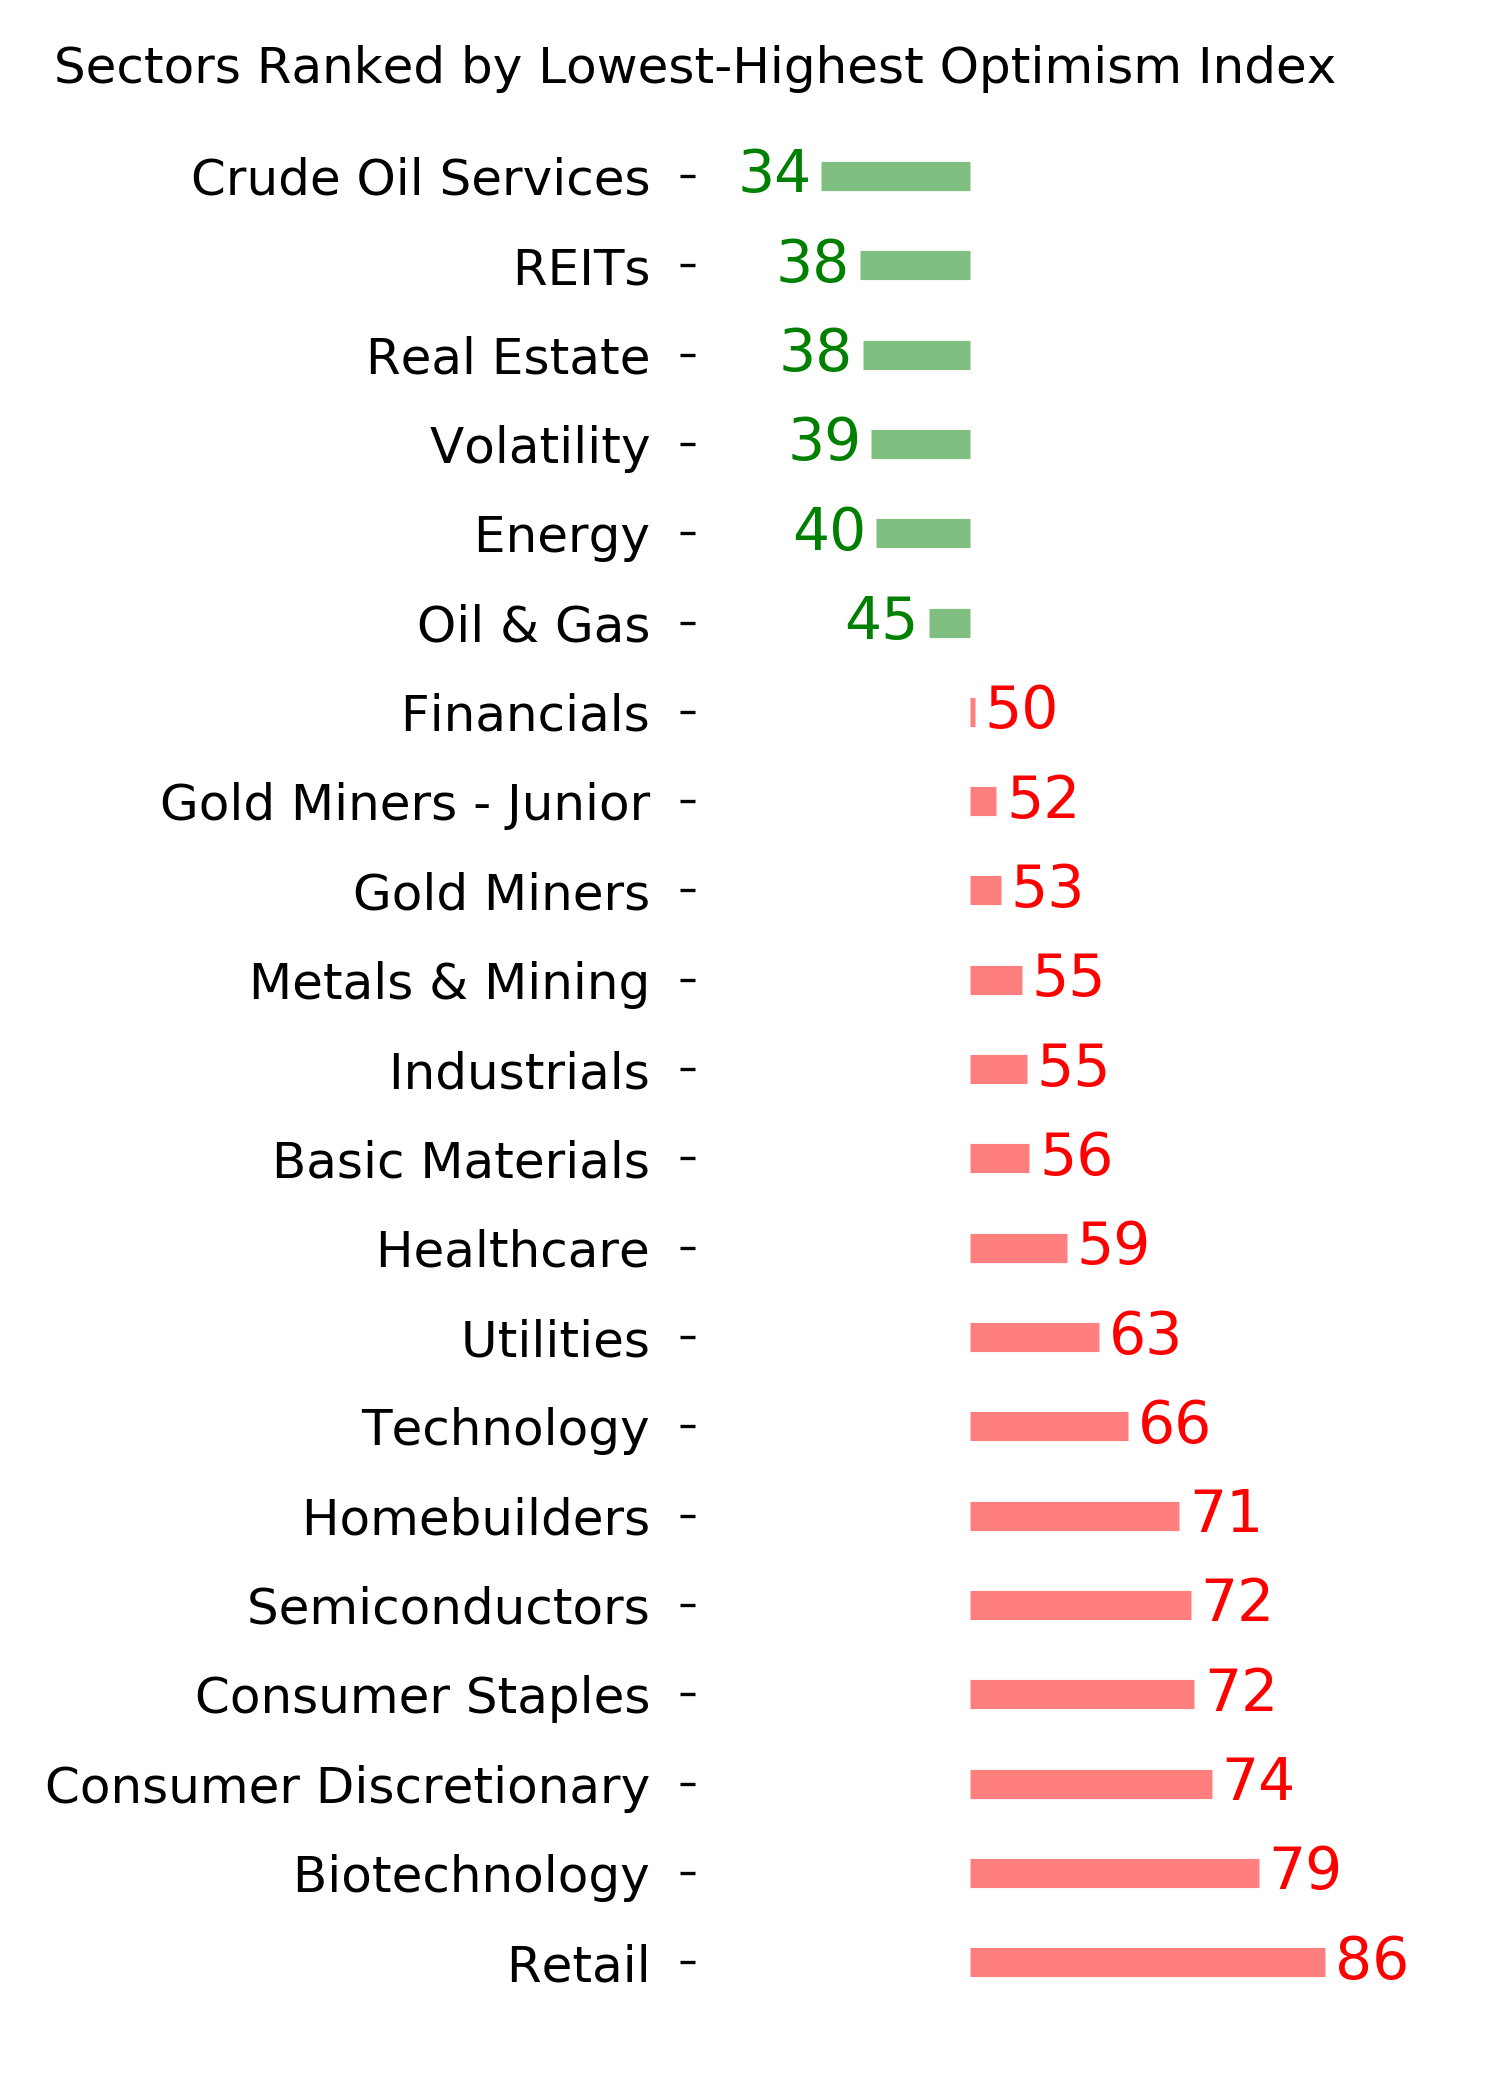
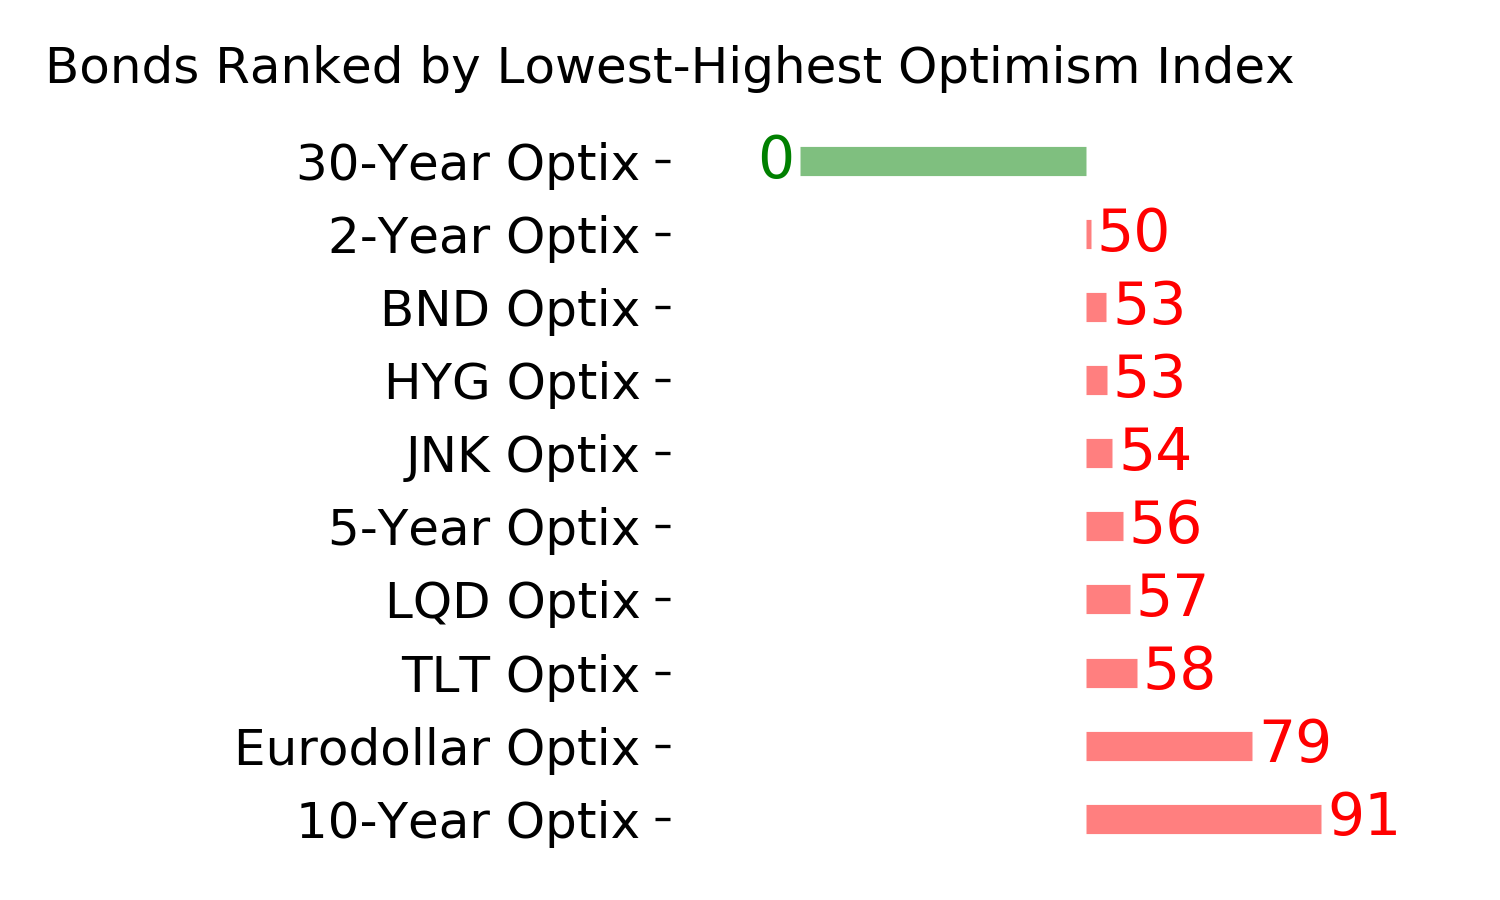
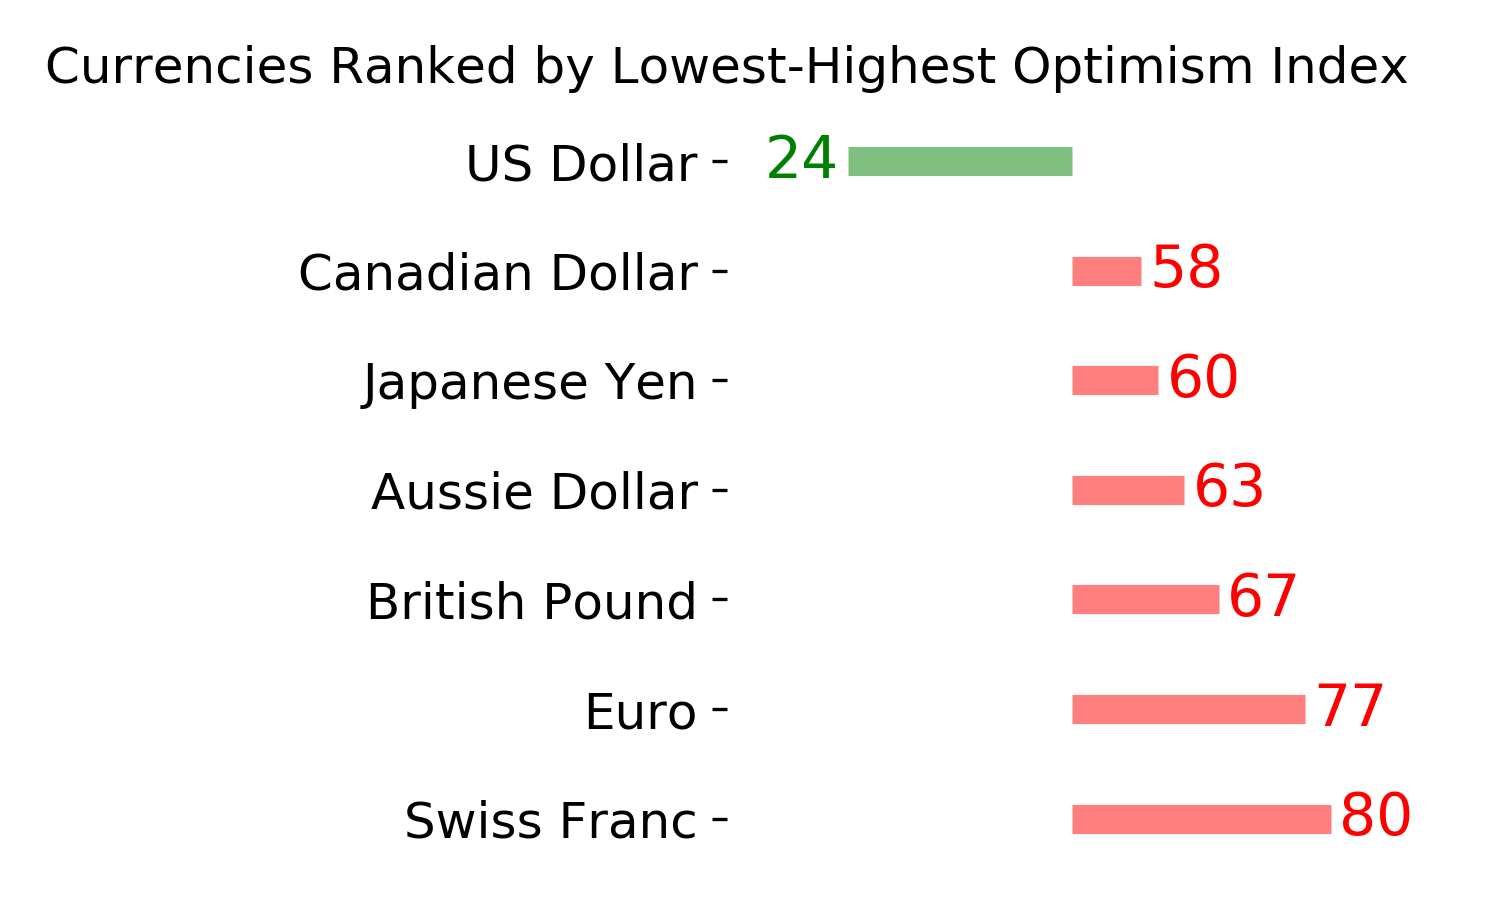
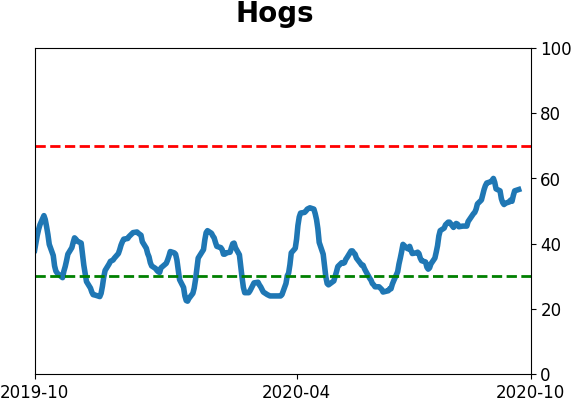
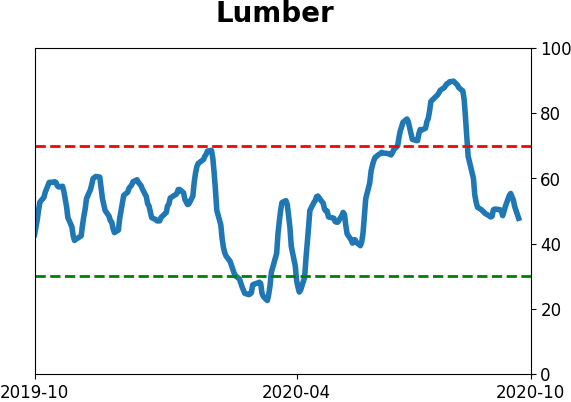
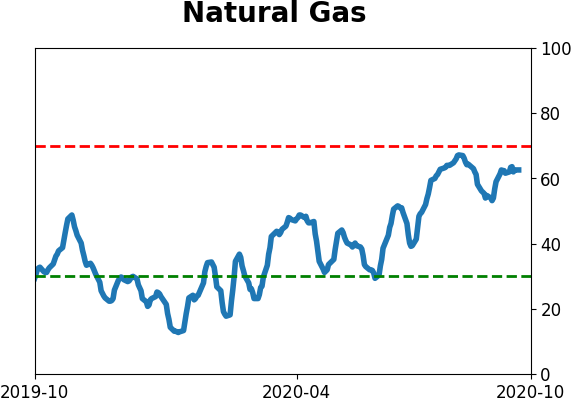
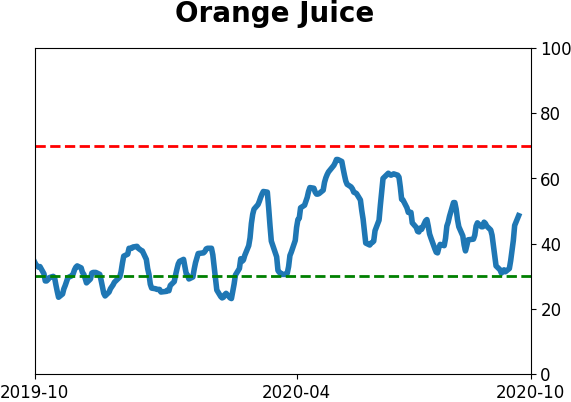
Optimism Index Thumbnails
|
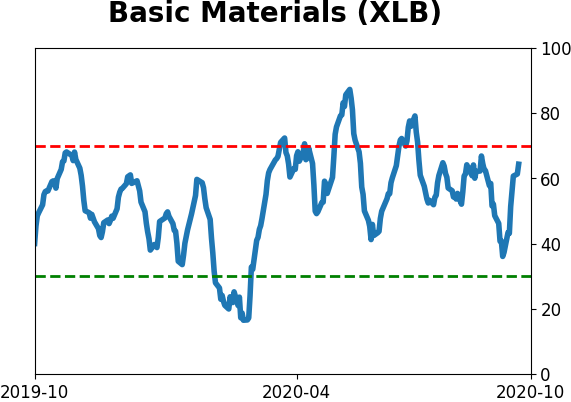
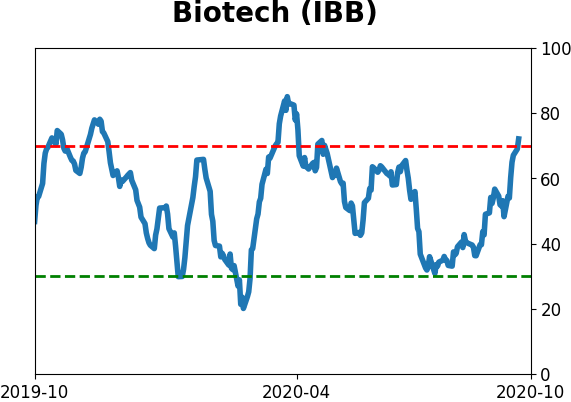
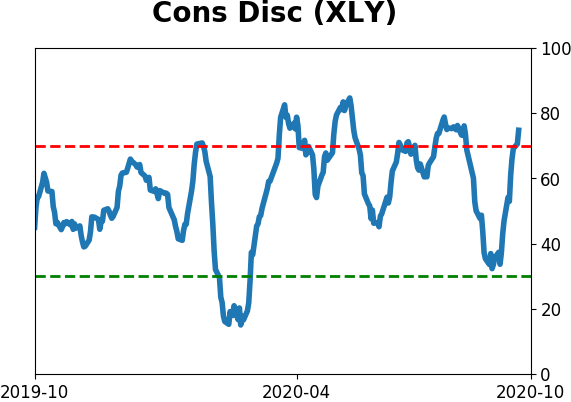
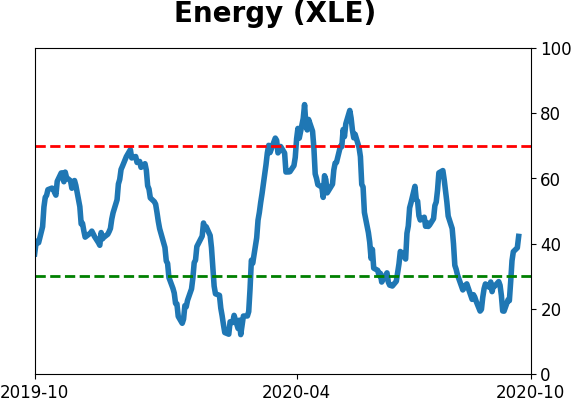
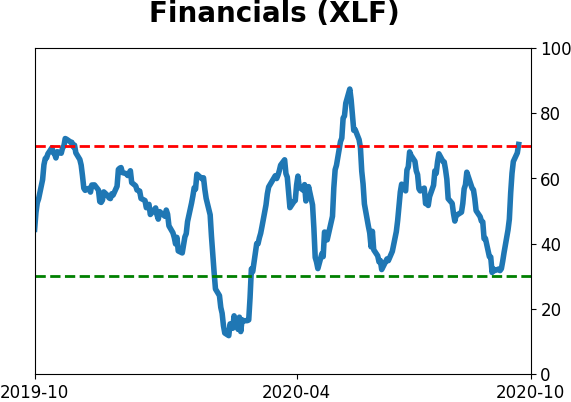
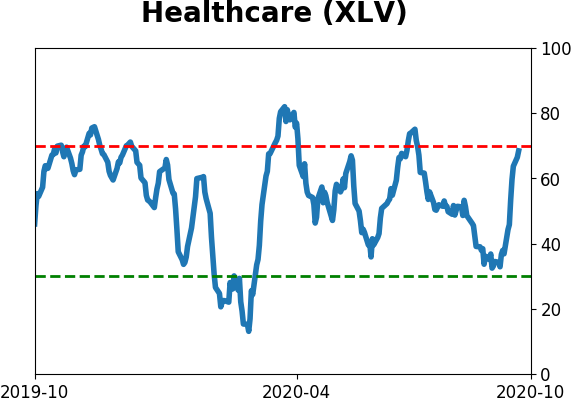
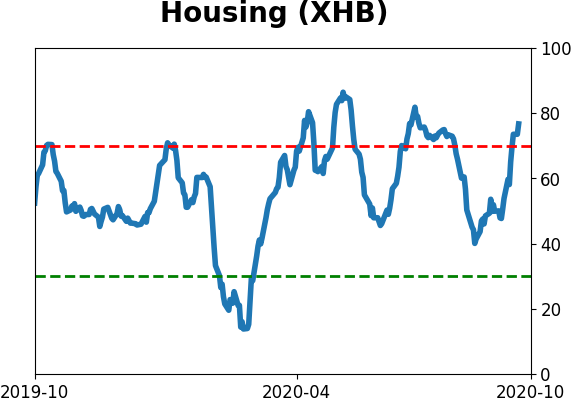
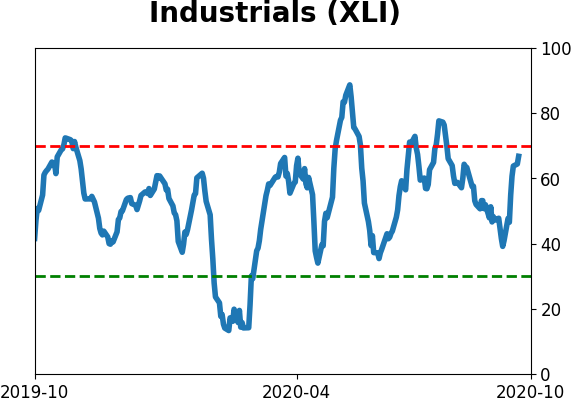
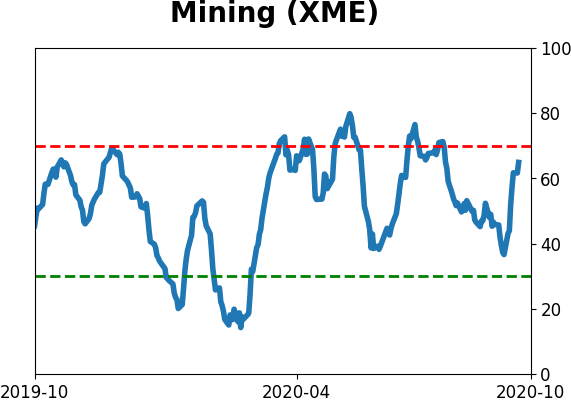
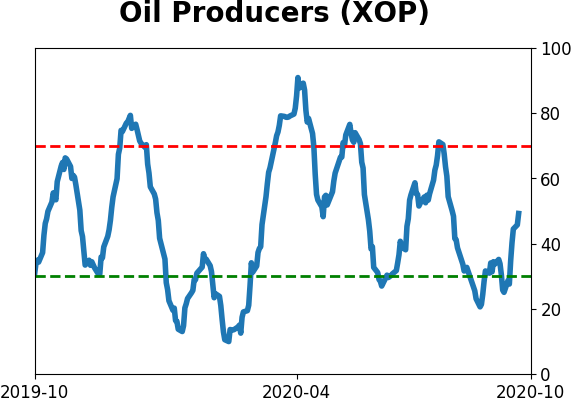
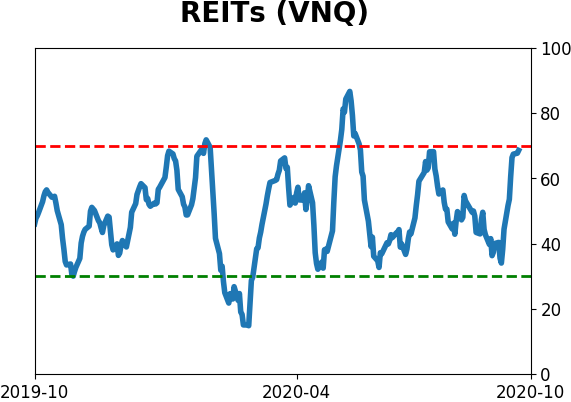
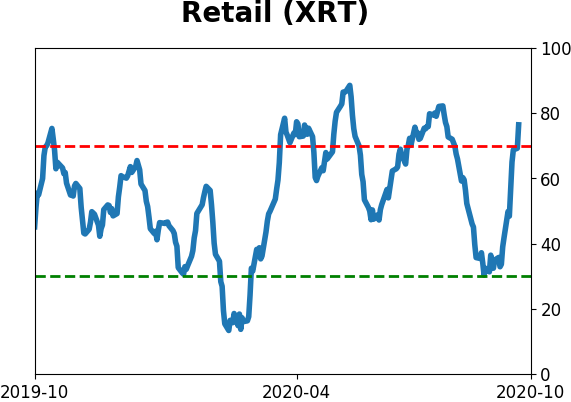
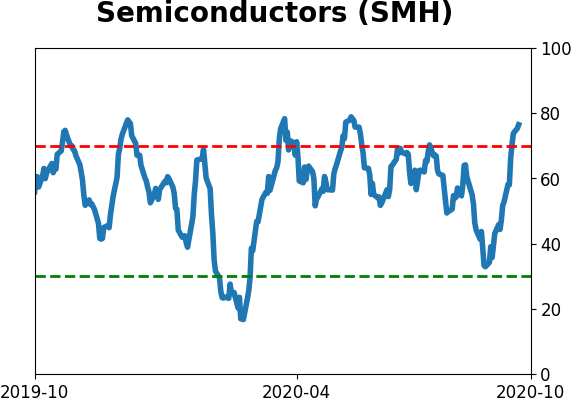
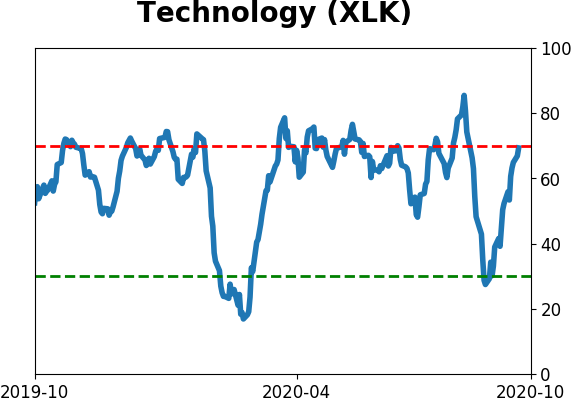
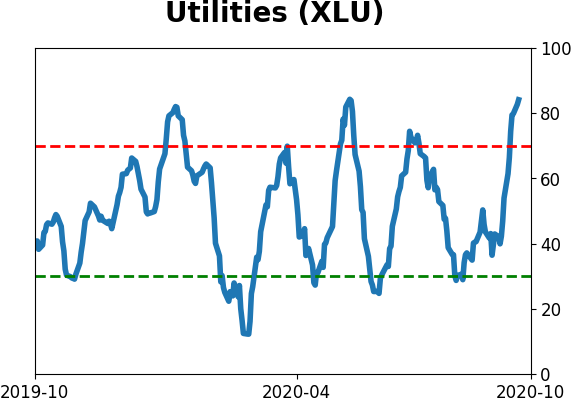
Sector ETF's - 10-Day Moving Average
|
|
|
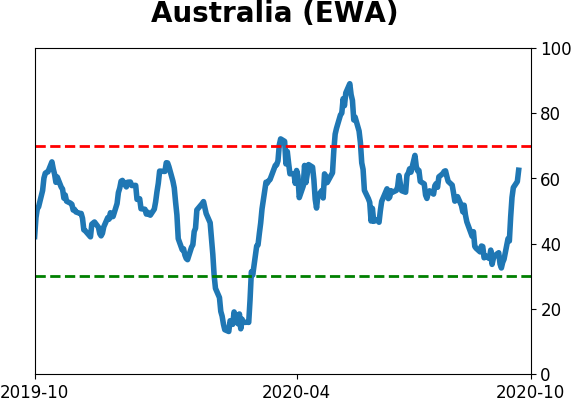
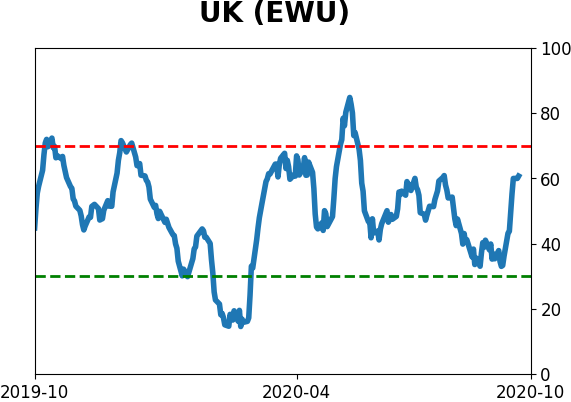
Country ETF's - 10-Day Moving Average
|
|
|
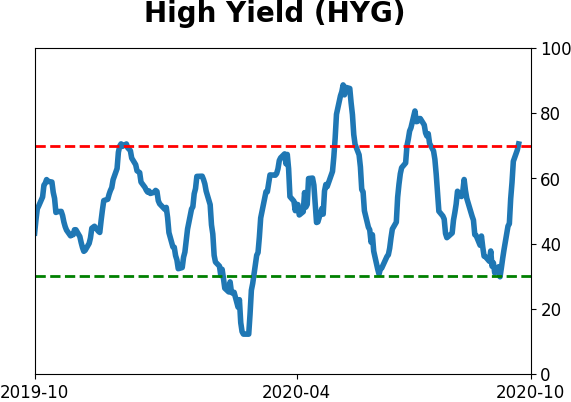
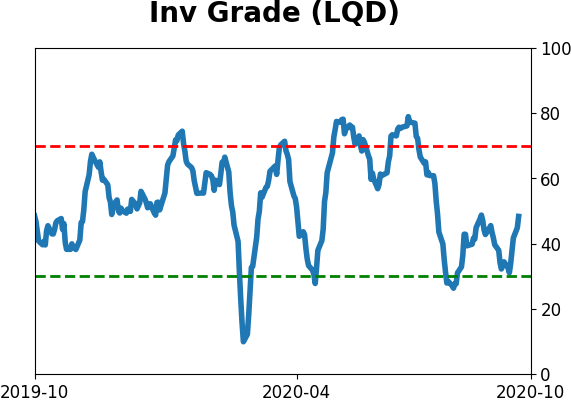
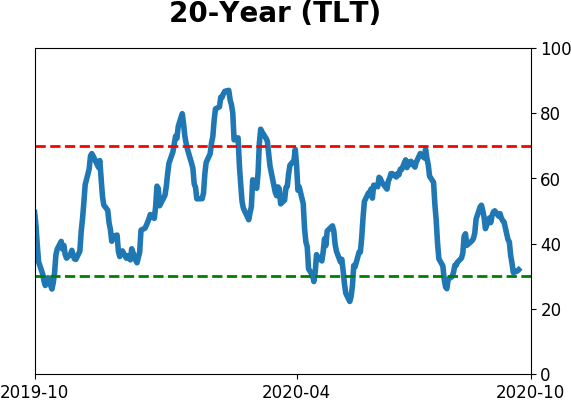
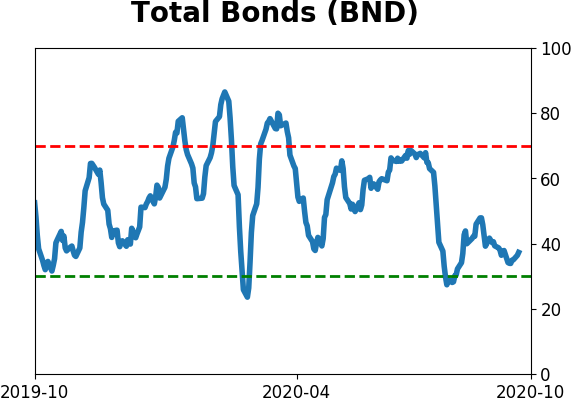
Bond ETF's - 10-Day Moving Average
|
|
|
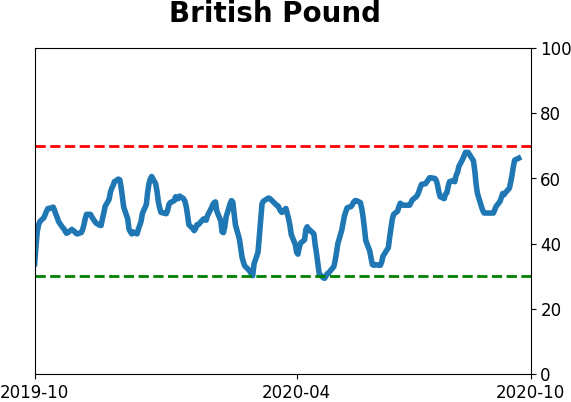
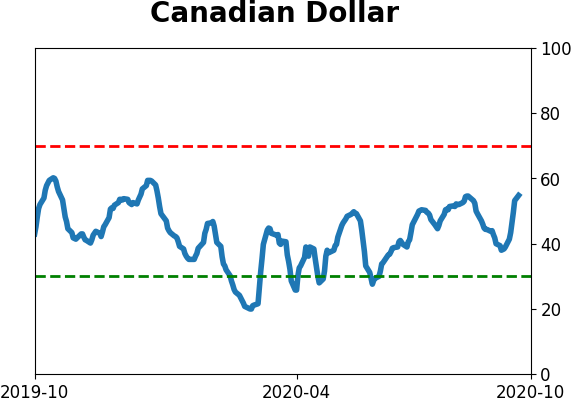
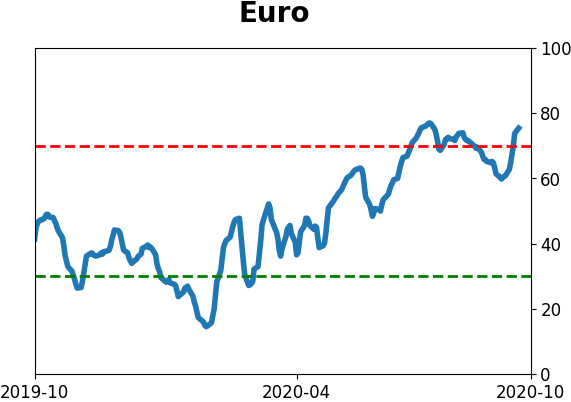
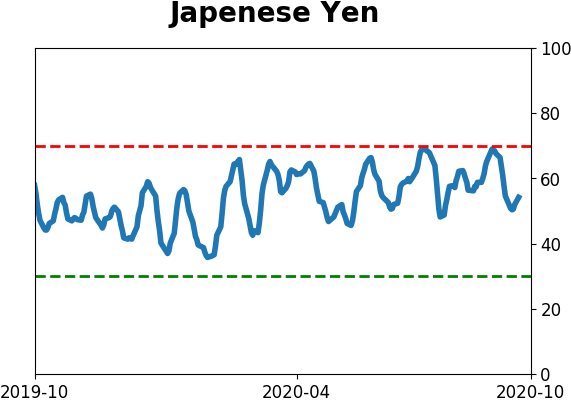
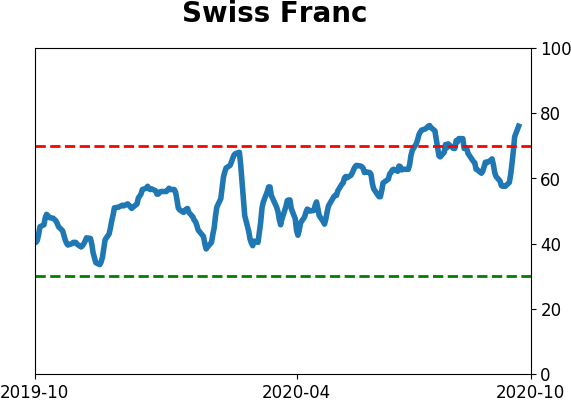
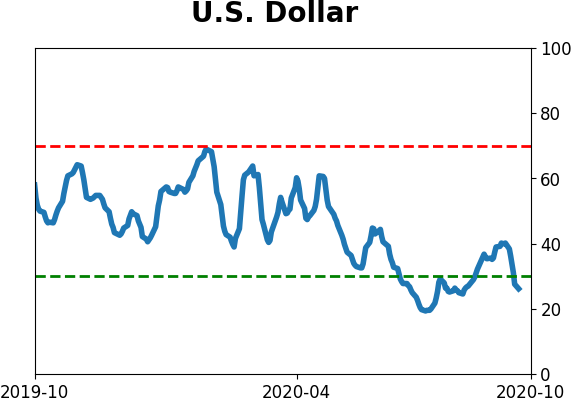
Currency ETF's - 5-Day Moving Average
|
|
|
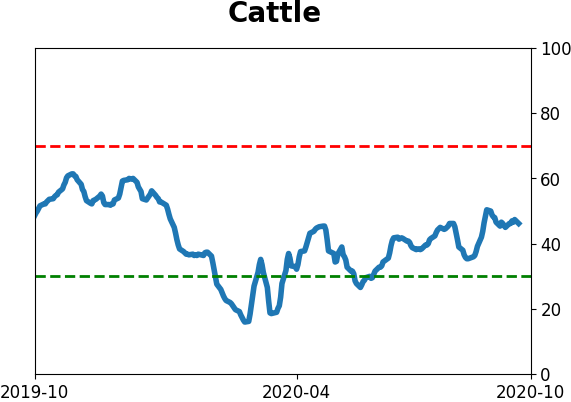
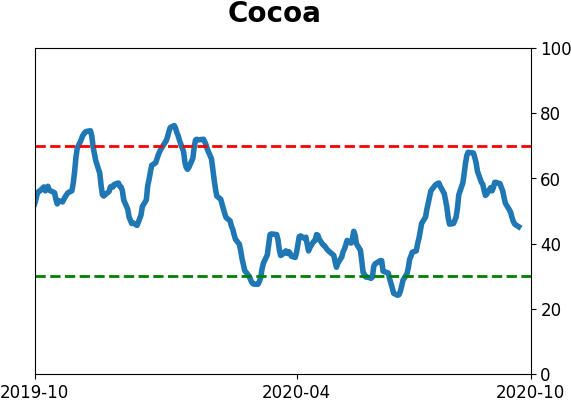
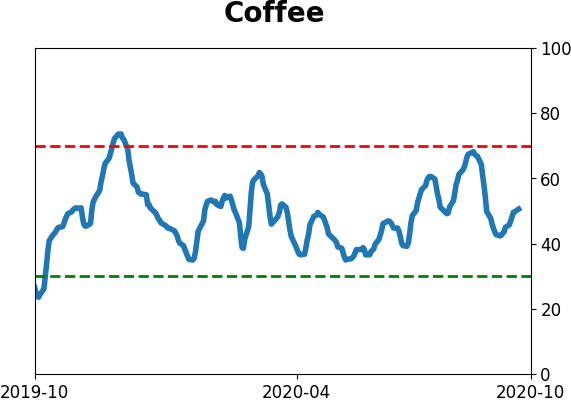
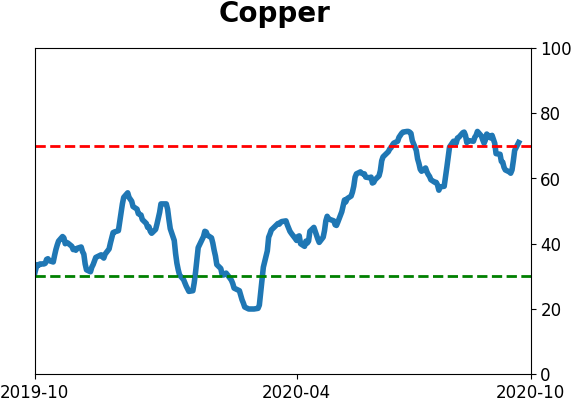
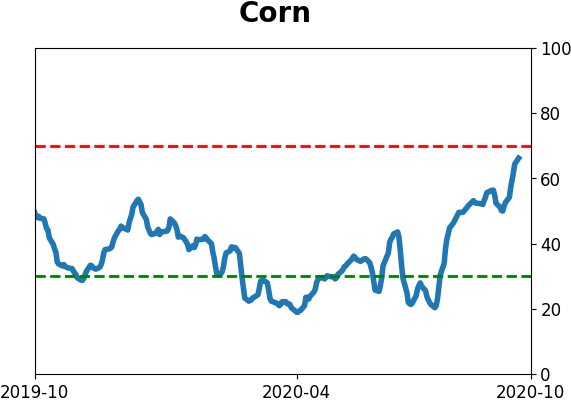
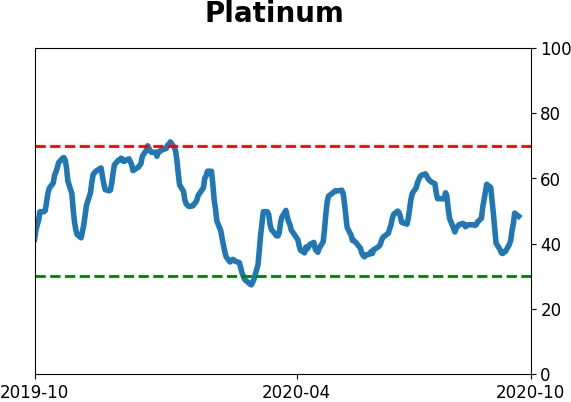
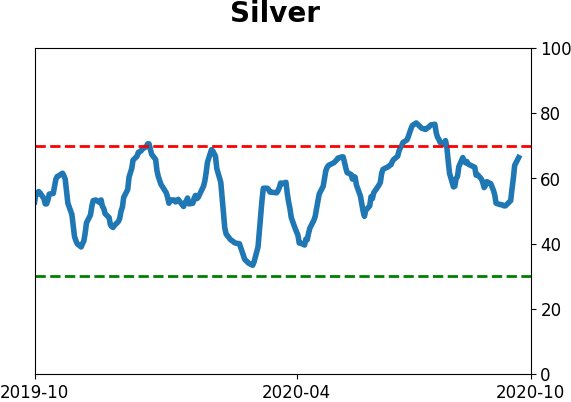
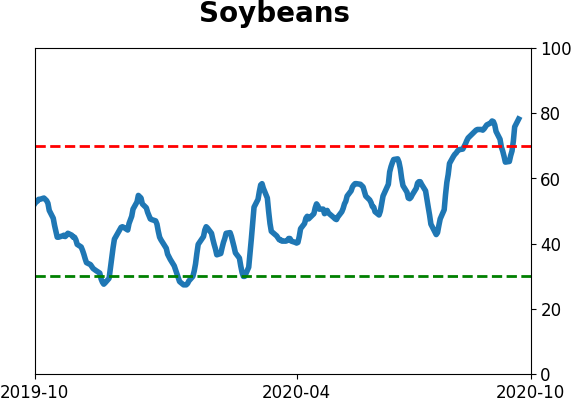
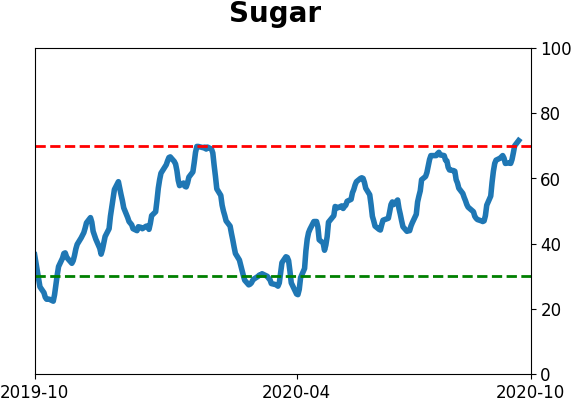
Commodity ETF's - 5-Day Moving Average
|
|