Headlines
|
|
Tech stocks see broad, and impressive, recovery:
With their recent recovery, more than 90% of stocks in the Nasdaq 100 have regained their 200-day moving averages, an impressive thrust that has preceded more gains in the past. The Cumulative Advance/Decline Line for those stocks has also broken out to a record high.
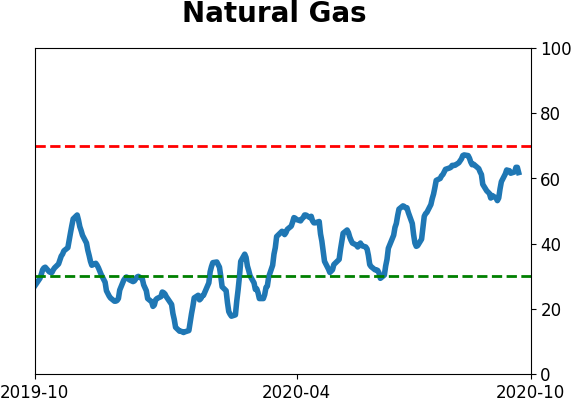
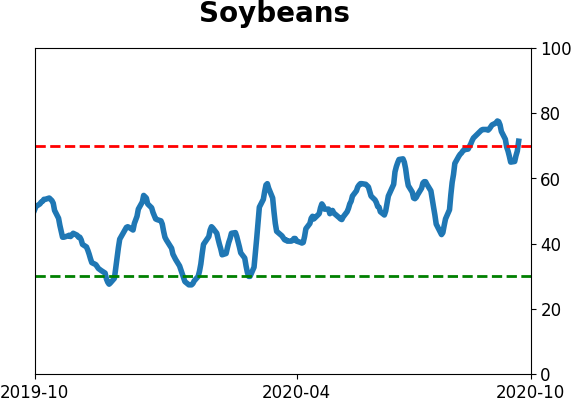
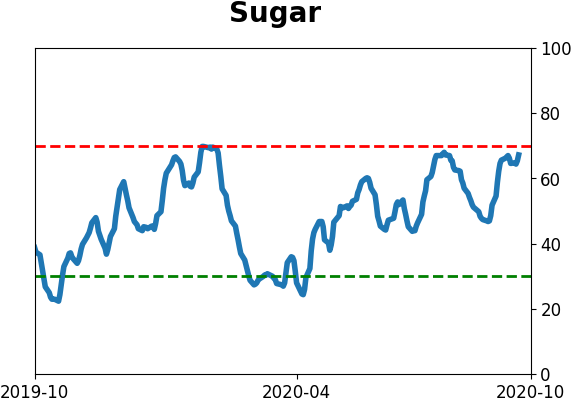
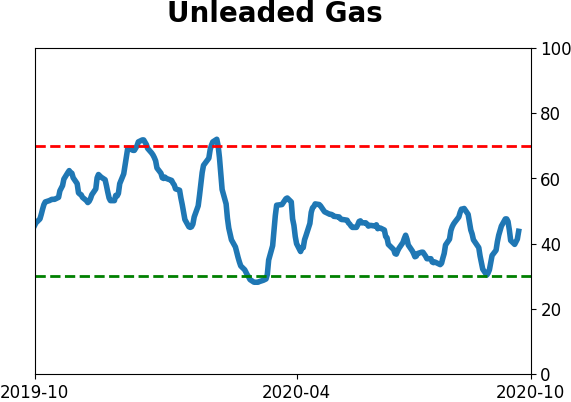
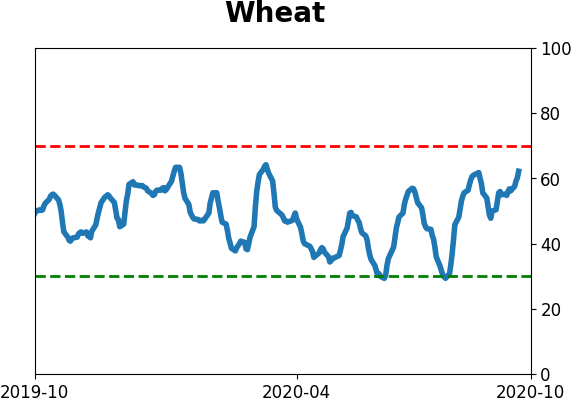
The latest Commitments of Traders report was released, covering positions through Tuesday: The 3-Year Min/Max Screen shows that "smart money" commercial hedgers continued their recent campaign of selling commodities in general, and agriculture in particular, especially sugar and soybeans. The fact that commodities have held up in spite of this is impressive - in prior years, these contracts typically buckled almost immediately. They also moved to the largest hedge against natural gas in over a decade. Hedgers continued to sell down their net long position in major equity index futures but remain net long still.
Bottom Line:
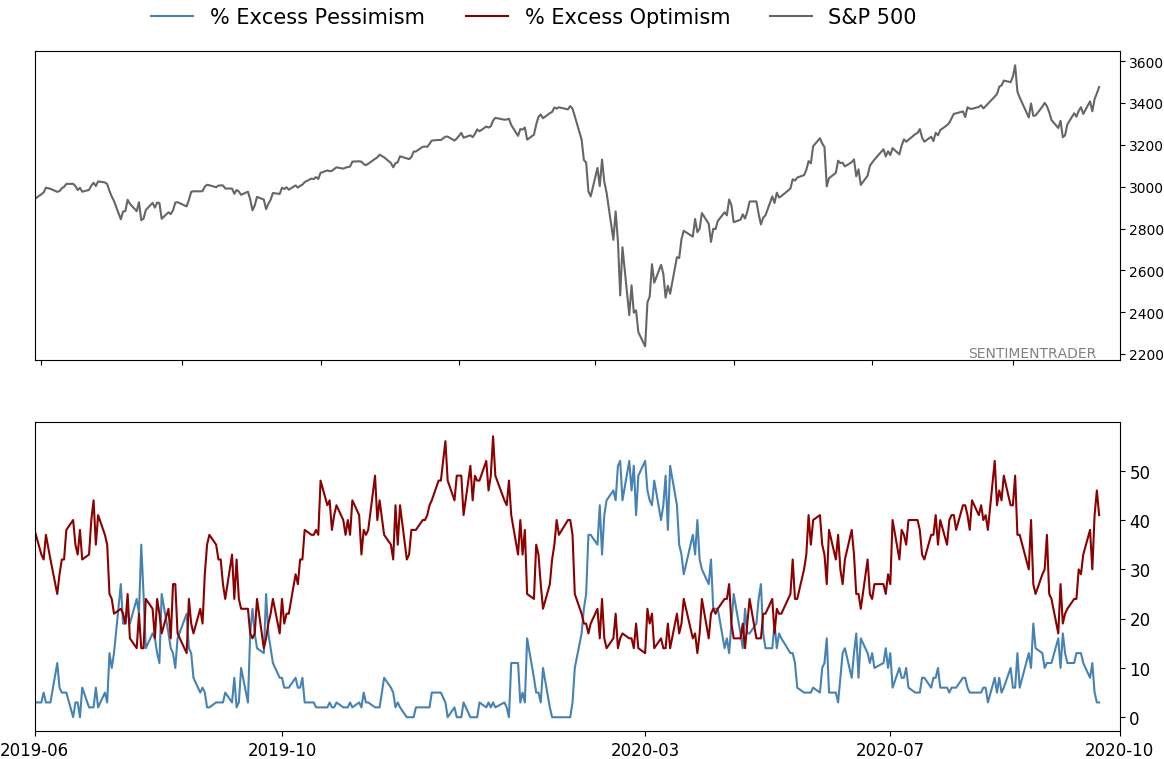
- A positive environment favors becoming aggressive on signs of excessive pessimism.
| Other Sectors and Assets |
| | Positives | Negatives | | 1. Energy (here and here) | 1. Skewed tech (here and here) |
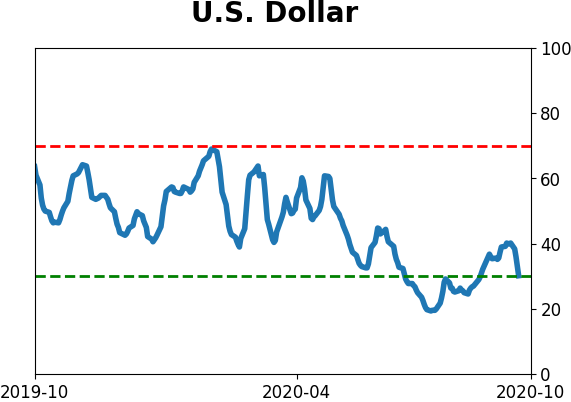
| 2. Dollar test |
|
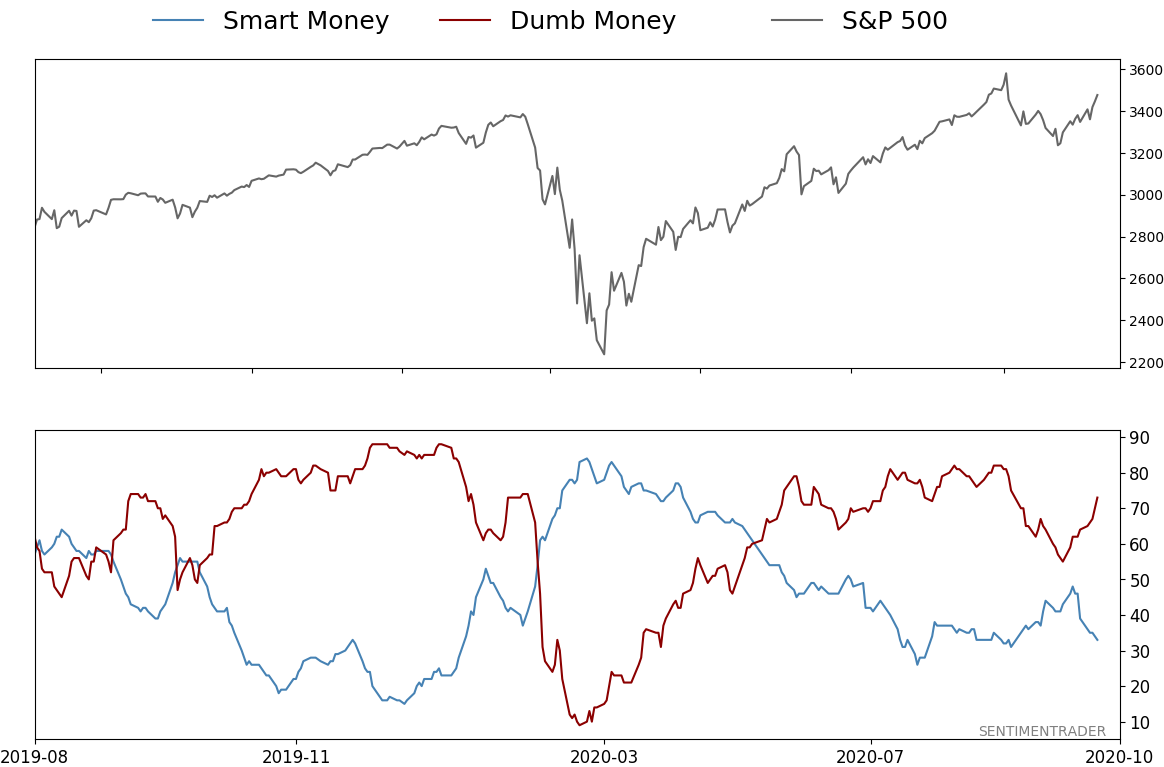
Smart / Dumb Money Confidence
|
Smart Money Confidence: 33%
Dumb Money Confidence: 73%
|
|
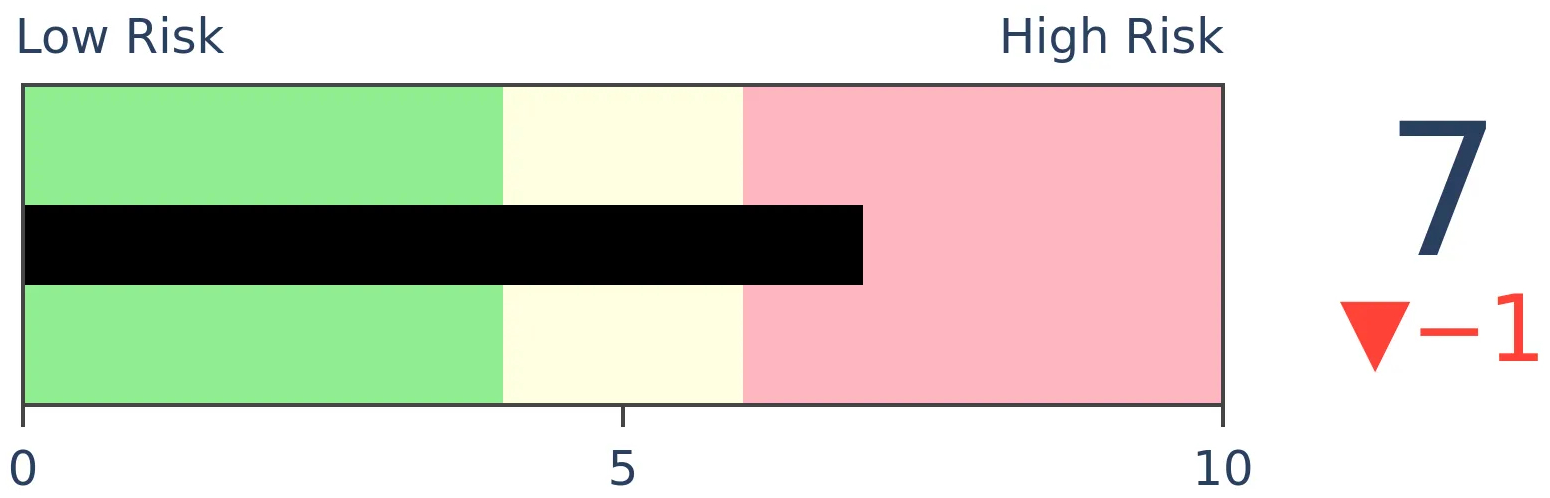
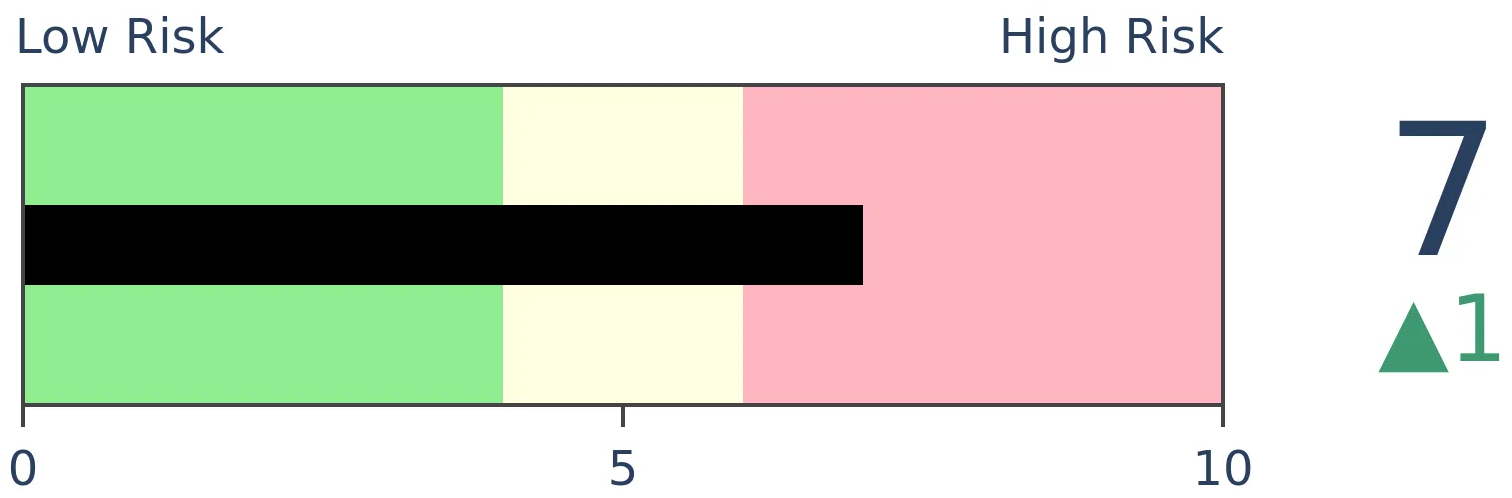
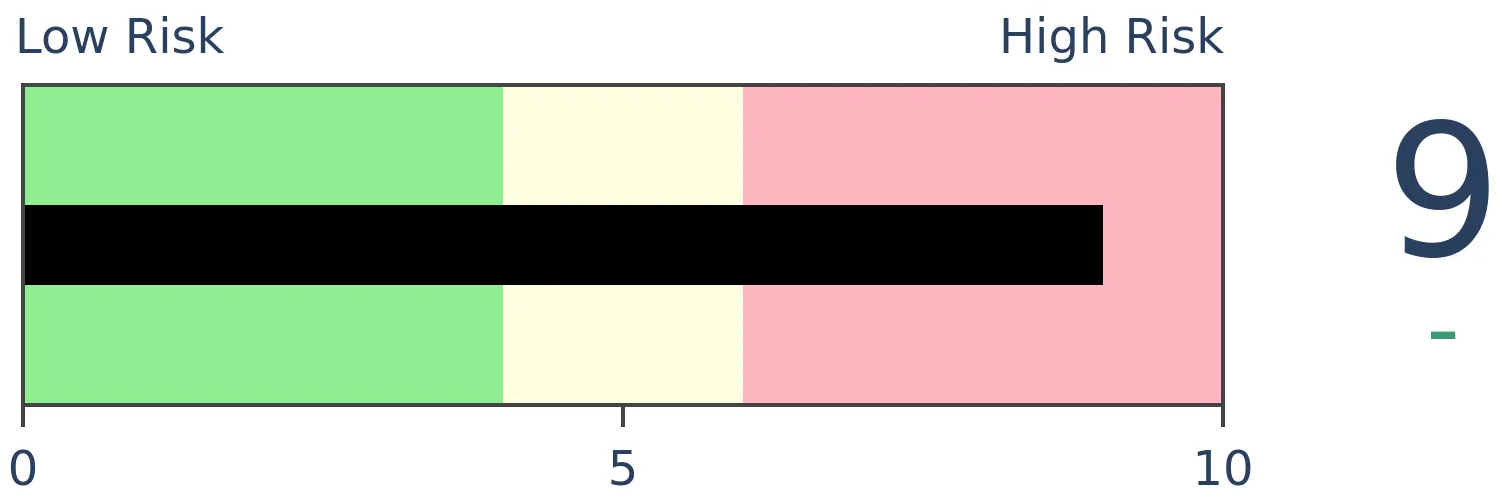
Risk Levels
Stocks Short-Term
|
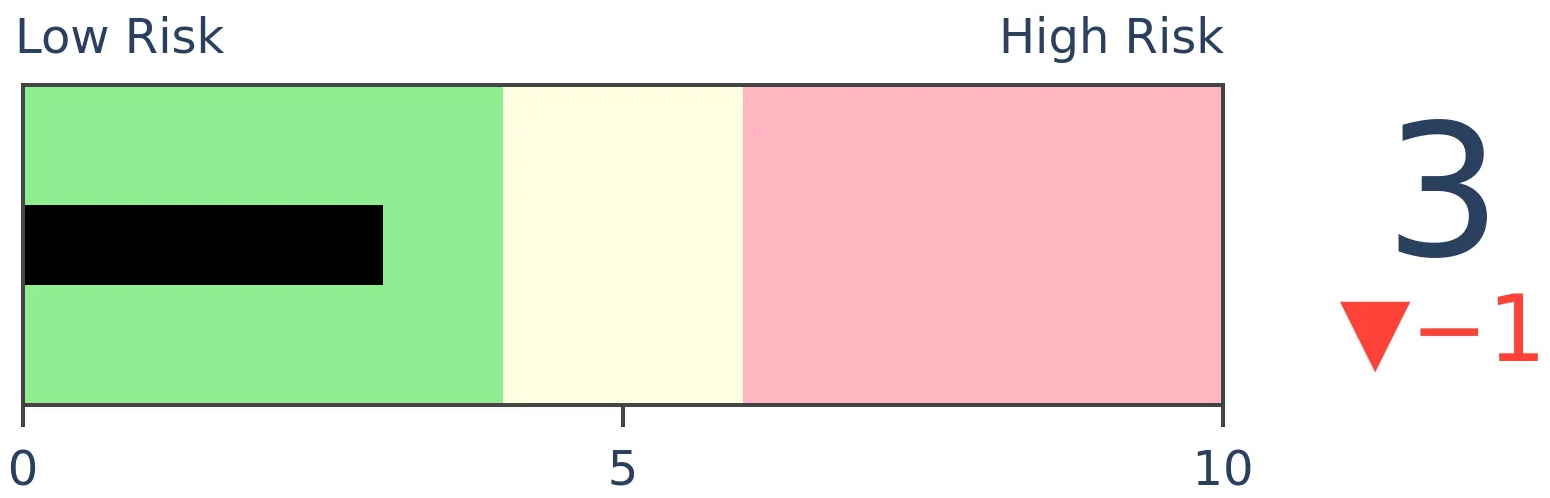
Stocks Medium-Term
|
|
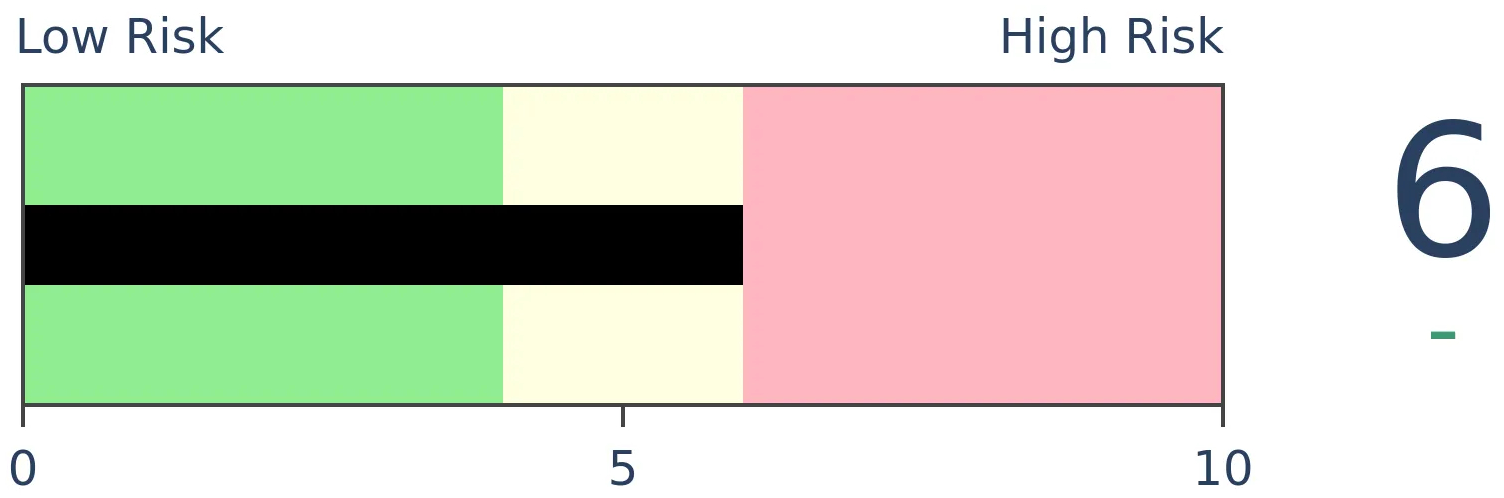
Bonds
|
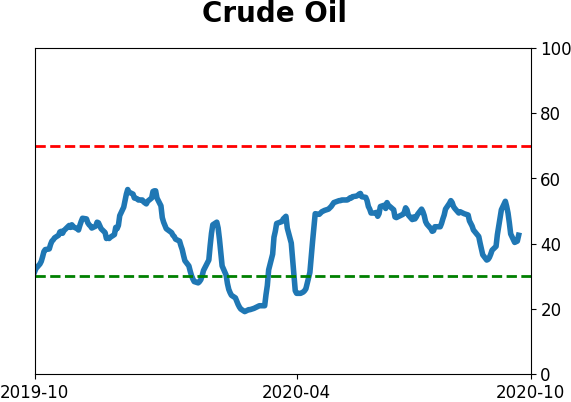
Crude Oil
|
|
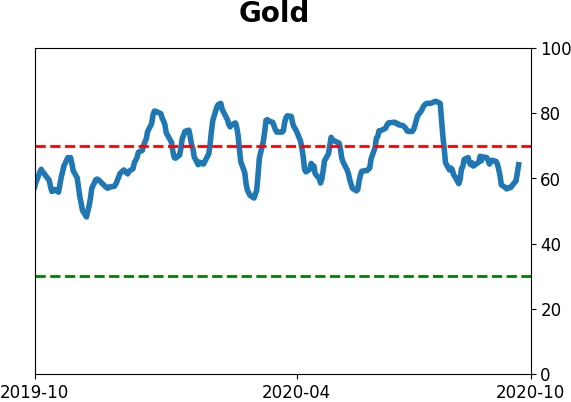
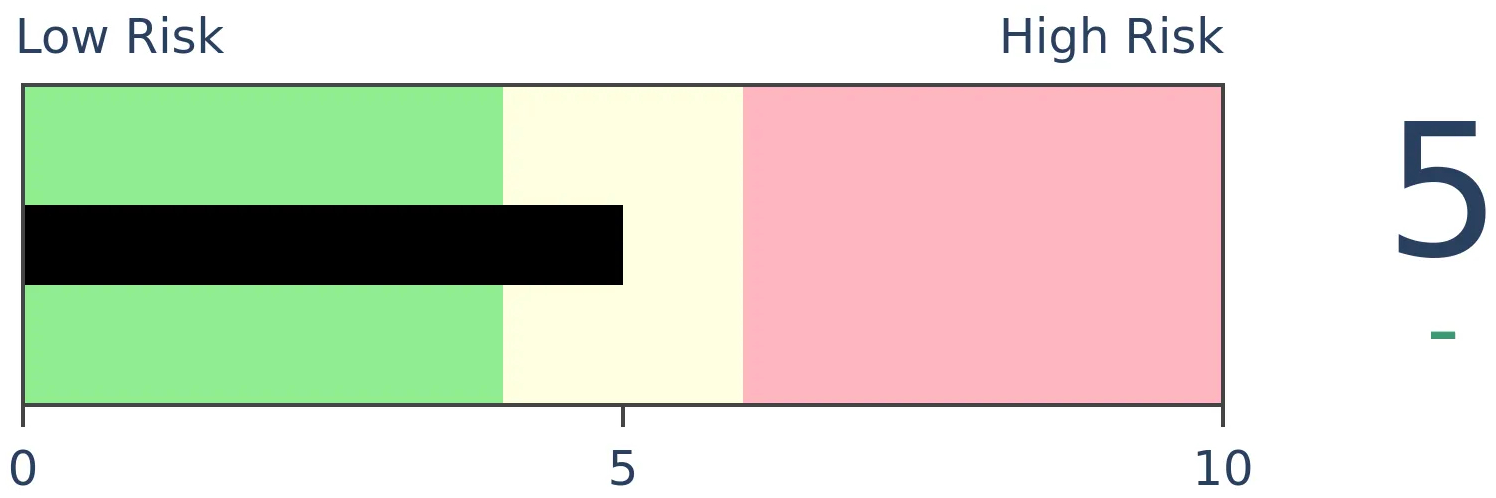
Gold
|
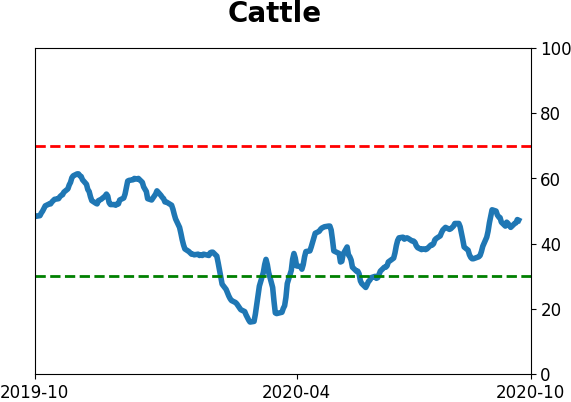
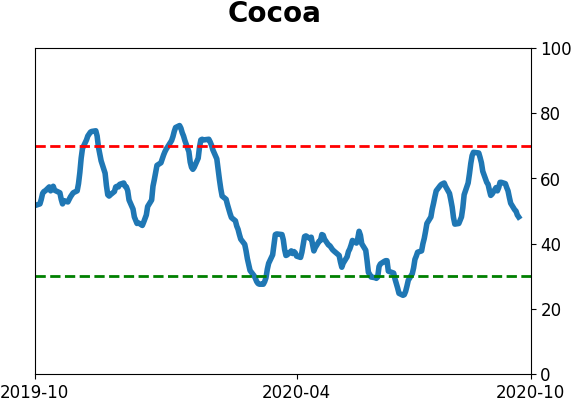
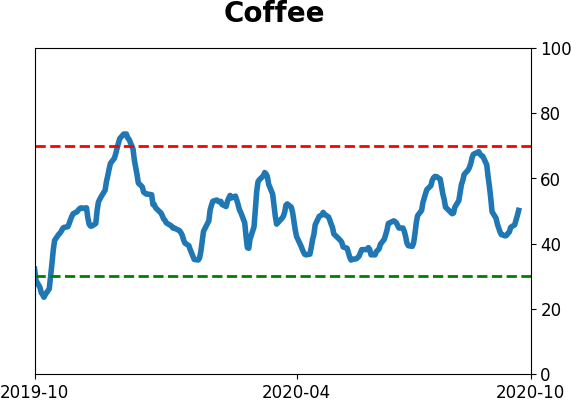
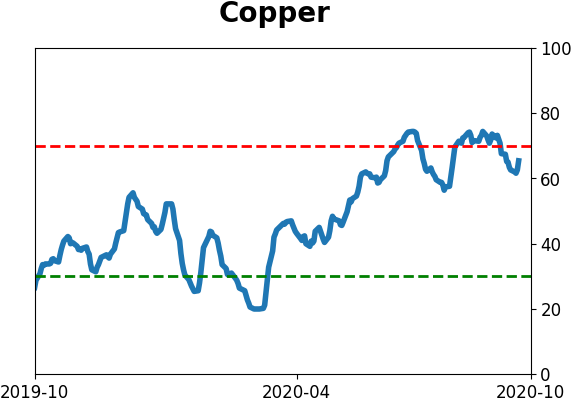
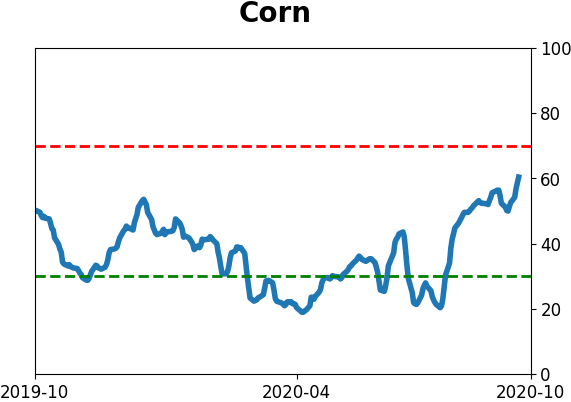
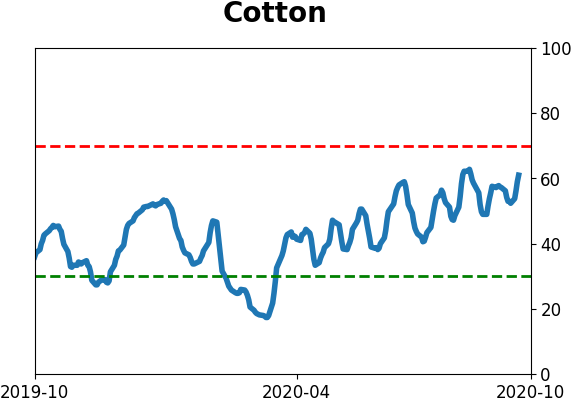
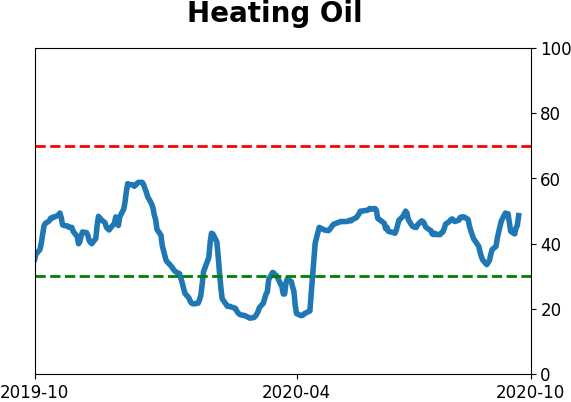
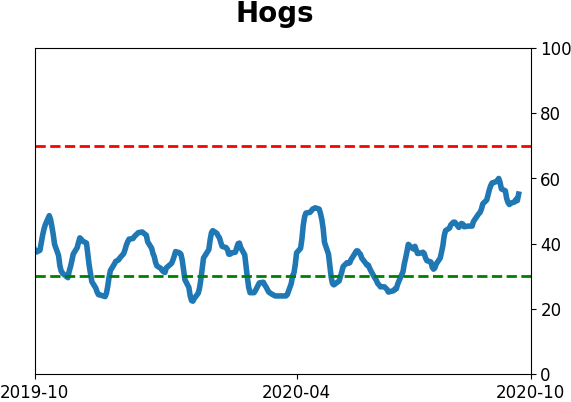
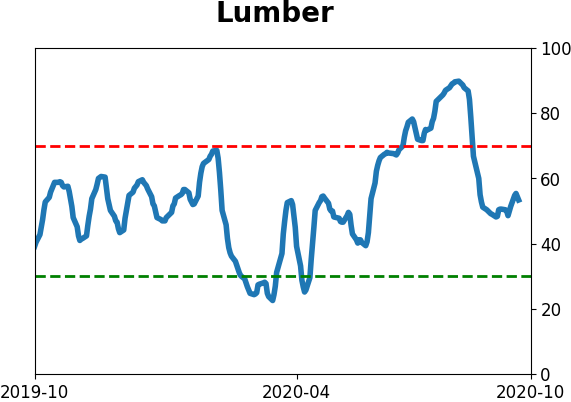
Agriculture
|
|
Research
BOTTOM LINE
With their recent recovery, more than 90% of stocks in the Nasdaq 100 have regained their 200-day moving averages, an impressive thrust that has preceded more gains in the past. The Cumulative Advance/Decline Line for those stocks has also broken out to a record high.
FORECAST / TIMEFRAME
QQQ -- Up, Medium-Term
|
Big tech stocks got all the credit when stocks were soaring into early September, then all the blame when they got hit last month.
Quietly (for those stocks, anyway), many of them have bounced back. This comes on the heels of multiple days with heavy upside volume and surging small-caps.
While more than 75% of stocks in the S&P 500 have closed above their 200-day averages as Troy mentioned in a premium note, for one of the few times in the past 20 years, more than 90% of stocks in the Nasdaq 100 (NDX) have closed above their moving averages.
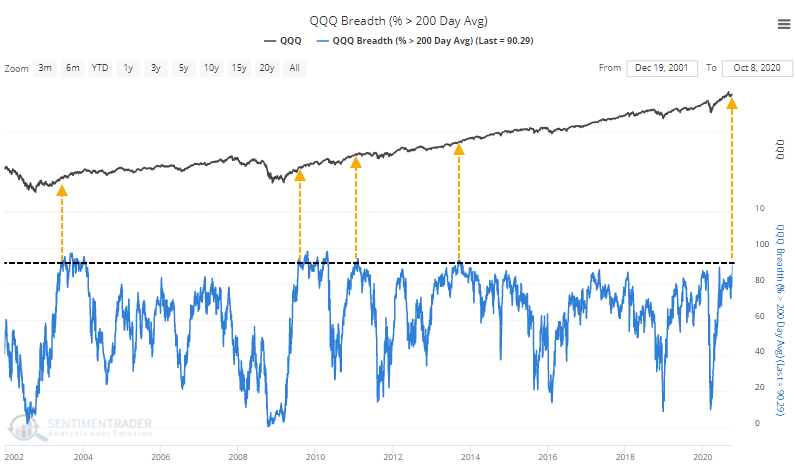
While it seems like this should equate to overbought conditions and lower future returns, that didn't prove to be the case when this many stocks rose above their averages for the first time in at least 3 months.
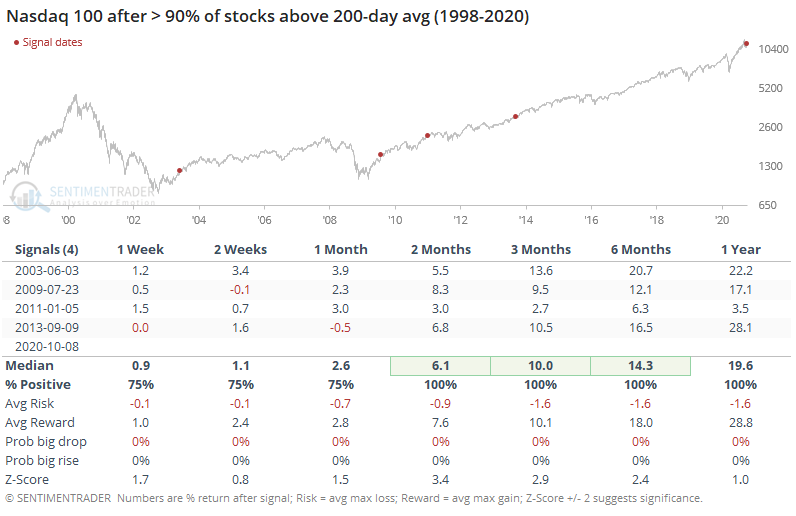
Going forward, the risk/reward ratio was heavily skewed to the upside. On average, the NDX didn't drop more than -1.6% at its worst point over the next 3 months, while rallying an average of +10.1% at its best point. The skew only got more egregiously positive from there. There were no "big rises", but because it's a volatile index, there is a very high hurdle to overcome to qualify for that.
Because of the damage done in September, more than 40% of stocks in the index are still at least 10% below their 52-week highs, despite their recent recoveries.
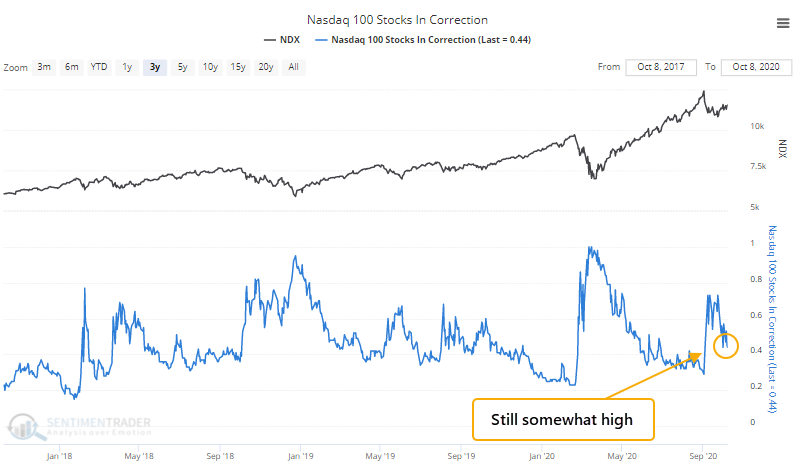
When more than 90% of stocks climbed above their averages in June 2003, 57% of them were still in a correction. In July 2009, that was 70%, so it's not unprecedented to see this figure remain elevated. It's curious that we're seeing similar behavior to the two largest recoveries in the past 20 years.
Thanks to the broad-based advance, the Cumulative Advance/Decline Line for the Nasdaq 100 just reached a new all-time high.
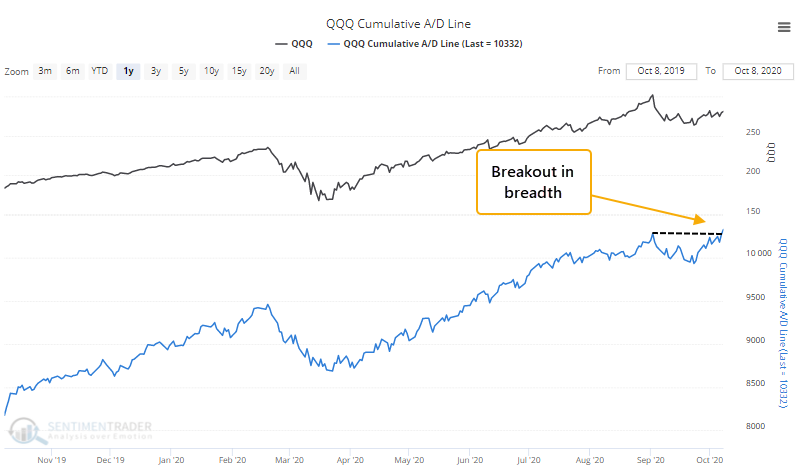
Like we saw with the S&P 500, this is evidence of the troops leading the general. There have only been a handful of other times when the NDX's A/D Line reached a 52-week high while the index itself was more than 3% below its own high.
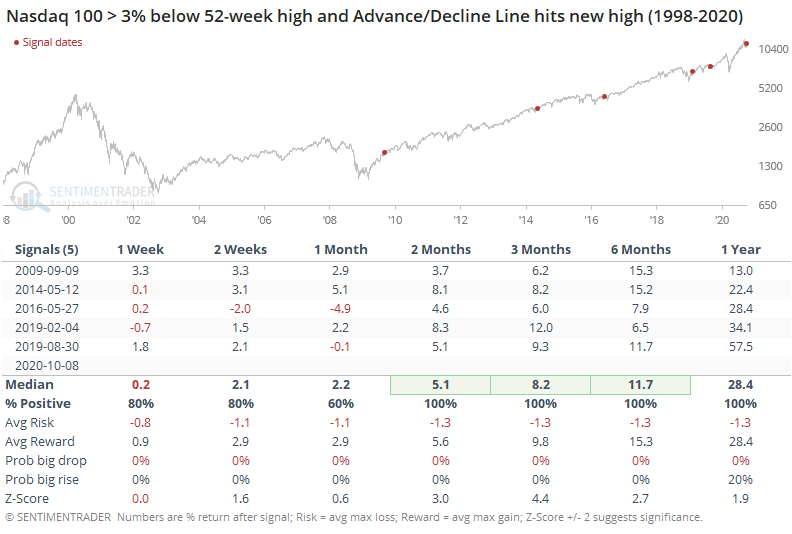
This is the 2nd-largest positive divergence since at least 1998, with the NDX more than 7% below its peak. The only signal when the index was further below its high was February 2019, when it was off by more than 9% as the A/D Line hit a new high.
The pullback-then-recovery internally has caused the long-term McClellan Summation Index for Nasdaq 100 stocks to curl higher after approaching zero.
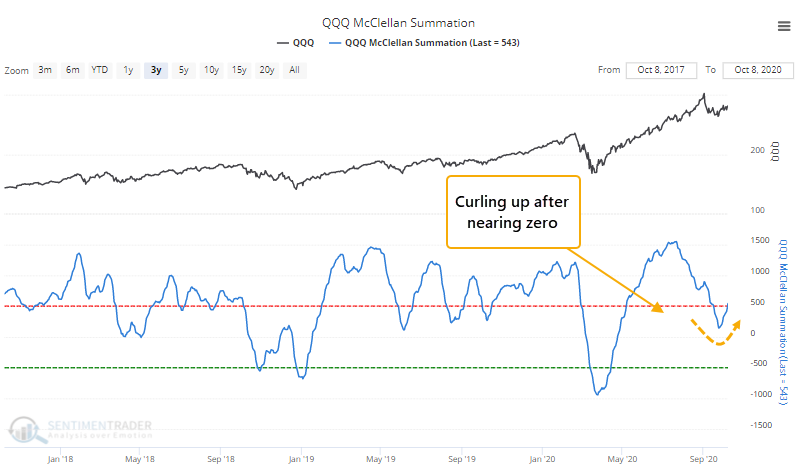
This is exactly what healthy markets do.
There are some negatives - insiders are not buying but they are selling, and options activity remains way too speculative - but it's hard to argue with the underlying strength in these stocks. September served as something of a reset, and the kind of renewed buying interest we're seeing now has a record of preceding further gains, even if the sample size is small.
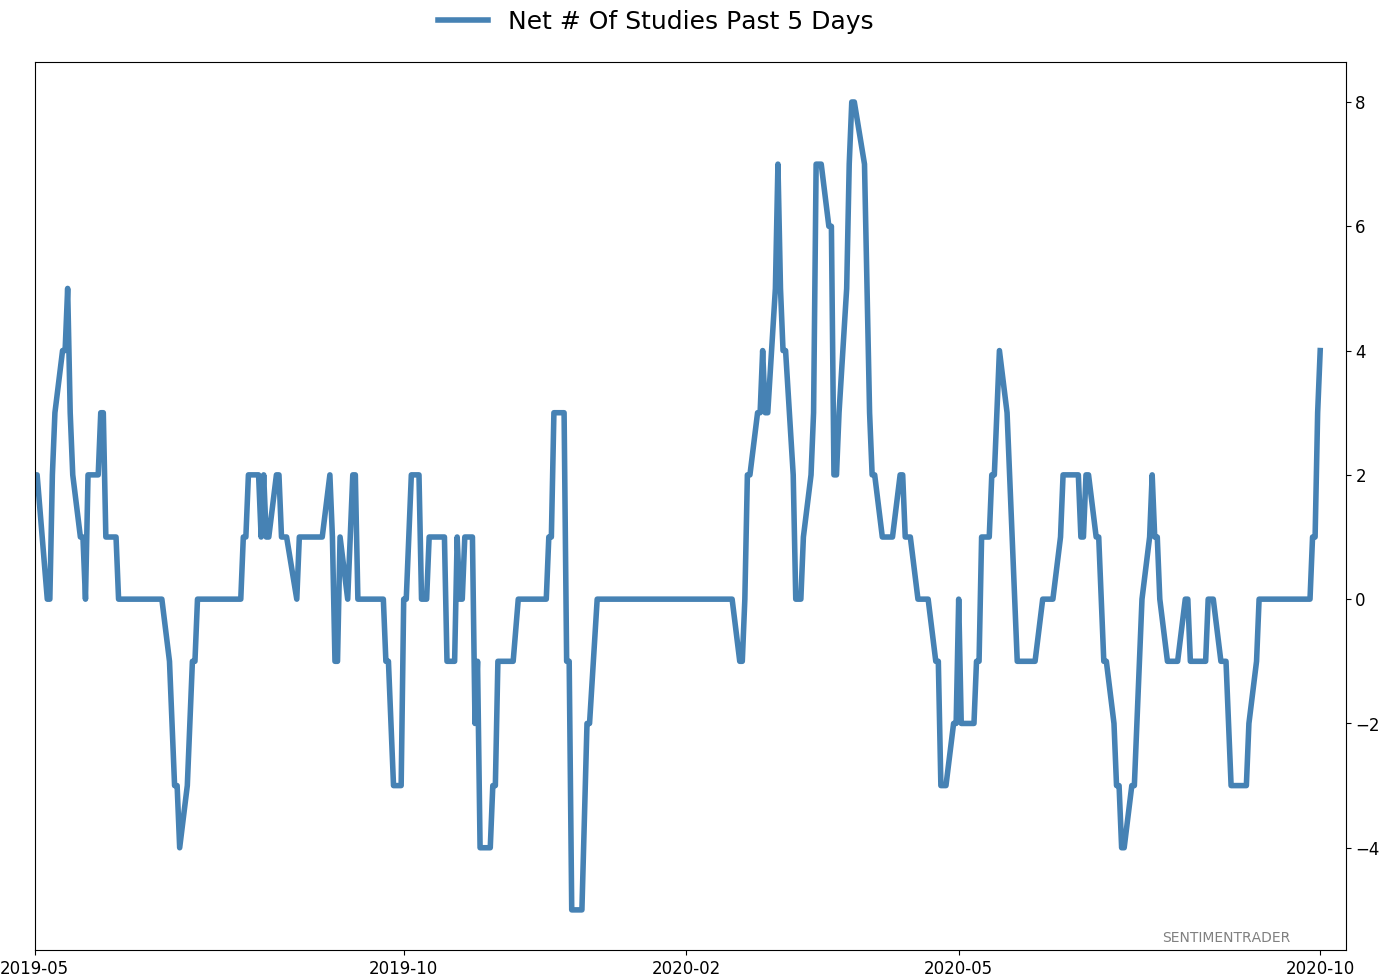
Active Studies
| Time Frame | Bullish | Bearish | | Short-Term | 0 | 0 | | Medium-Term | 4 | 8 | | Long-Term | 48 | 2 |
|
Indicators at Extremes
Portfolio
| Position | Description | Weight % | Added / Reduced | Date | | Stocks | 15.6% RSP, 10.1% VWO, 7.6% XLE | 33.3 | Added 11% | 2020-10-08 | | Bonds | 10% BND, 10% SCHP, 10% ANGL | 29.7 | Reduced 0.1% | 2020-10-02 | | Commodities | GCC | 2.4 | Reduced 2.1%
| 2020-09-04 | | Precious Metals | GDX | 4.6 | Added 5% | 2020-09-09 | | Special Situations | | 0.0 | Reduced 5% | 2020-10-02 | | Cash | | 30.0 | | |
|
Updates (Changes made today are underlined)
It's been a really mixed picture lately. In stocks, we saw huge momentum and a spike in speculation, then September managed to wring much of that out, except in the options market which is still a worry. There seem to be offsetting positives and negatives, with a mixed market environment, not the kind of setup where I feel comfortable being aggressive. I did add a bit to energy. The older I get, the less interested I am in short-term gyrations, and I don't really care about the coming days or even weeks. I'm fairly confident that the total return will be positive over a longer time frame given some of the developments we've looked in over the past week. With bonds, I decided to swap TLT for ANGL, a high-yield corporate fund with a heavy focus on energy bonds. Hedgers are heavily short 10-year Treasuries, and the high-yield market has held up well internally. I'm not generally a fan of buying into rising prices, but with the internal recovery in emerging markets from a compelling position (here and here), I started a position.
RETURN YTD: 0.0% 2019: 12.6%, 2018: 0.6%, 2017: 3.8%, 2016: 17.1%, 2015: 9.2%, 2014: 14.5%, 2013: 2.2%, 2012: 10.8%, 2011: 16.5%, 2010: 15.3%, 2009: 23.9%, 2008: 16.2%, 2007: 7.8%
|
|
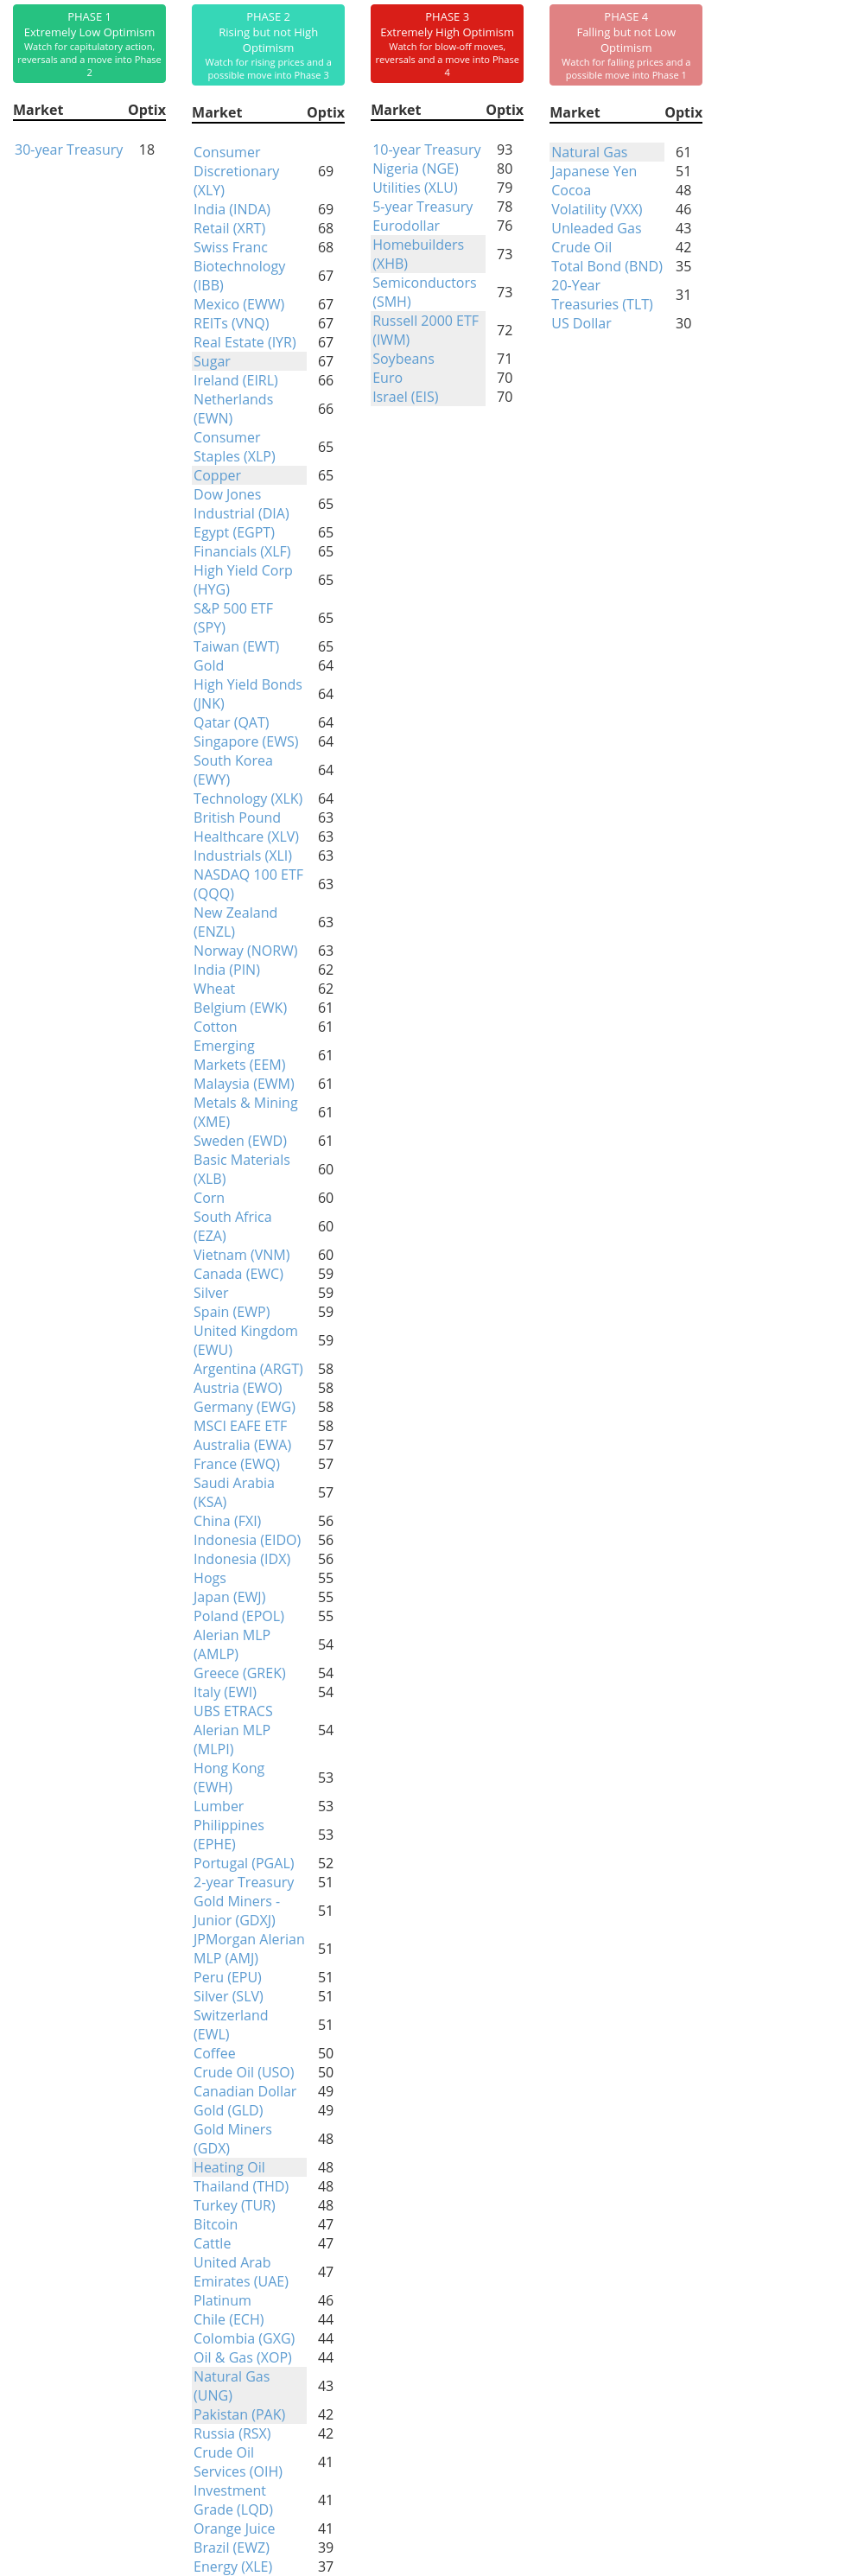
Phase Table
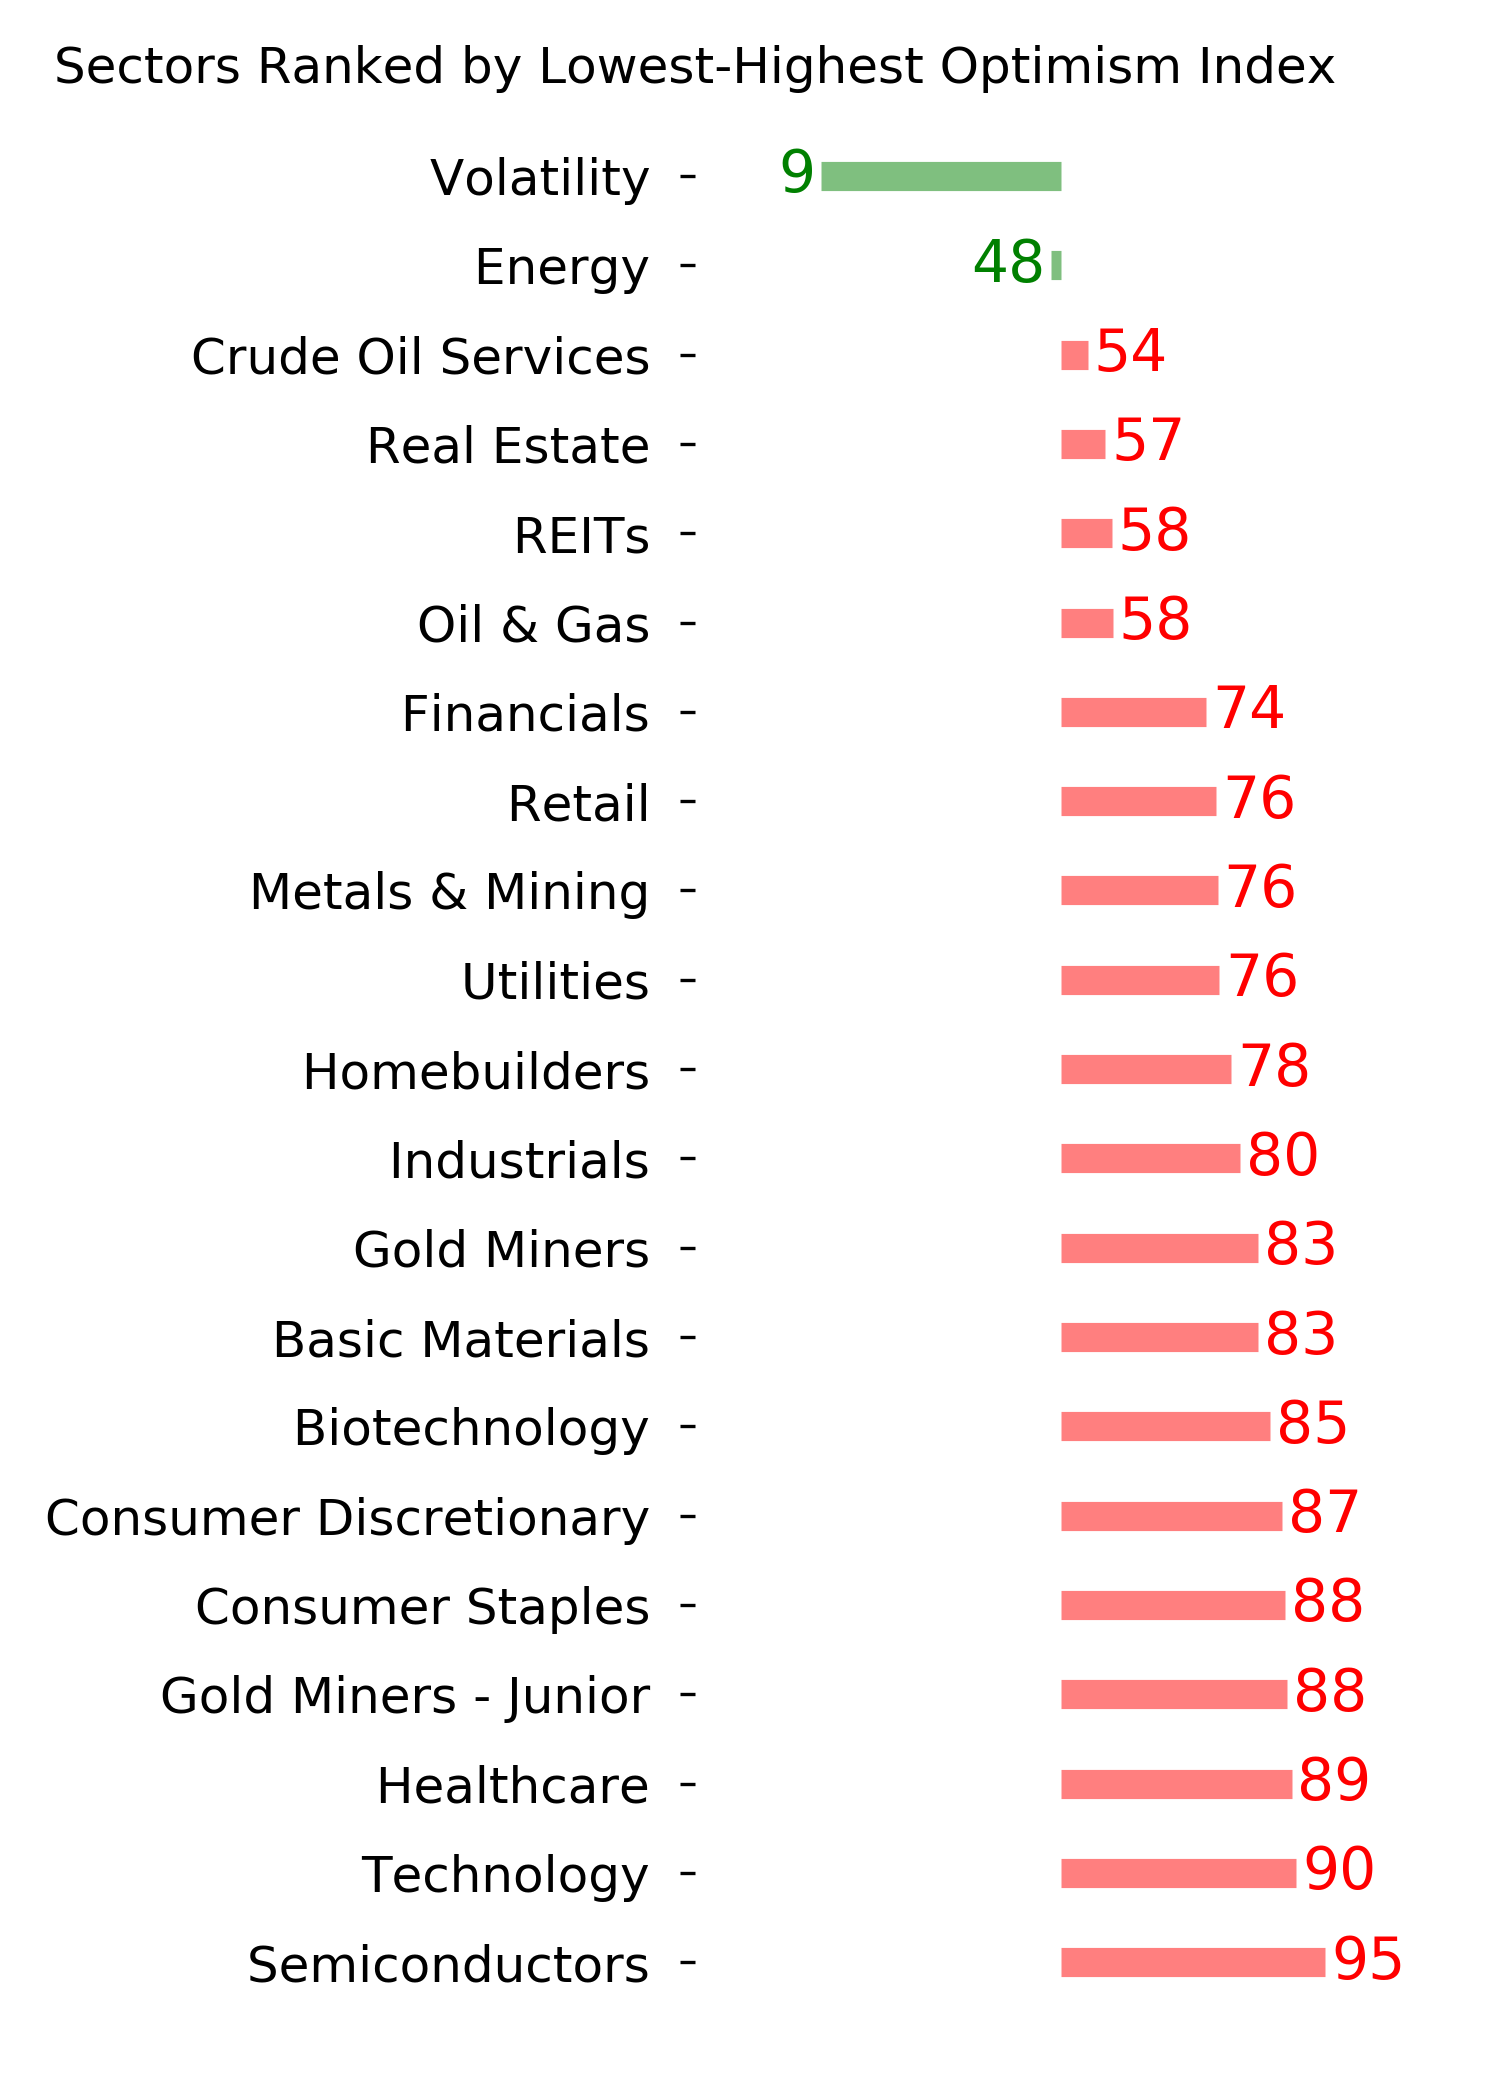
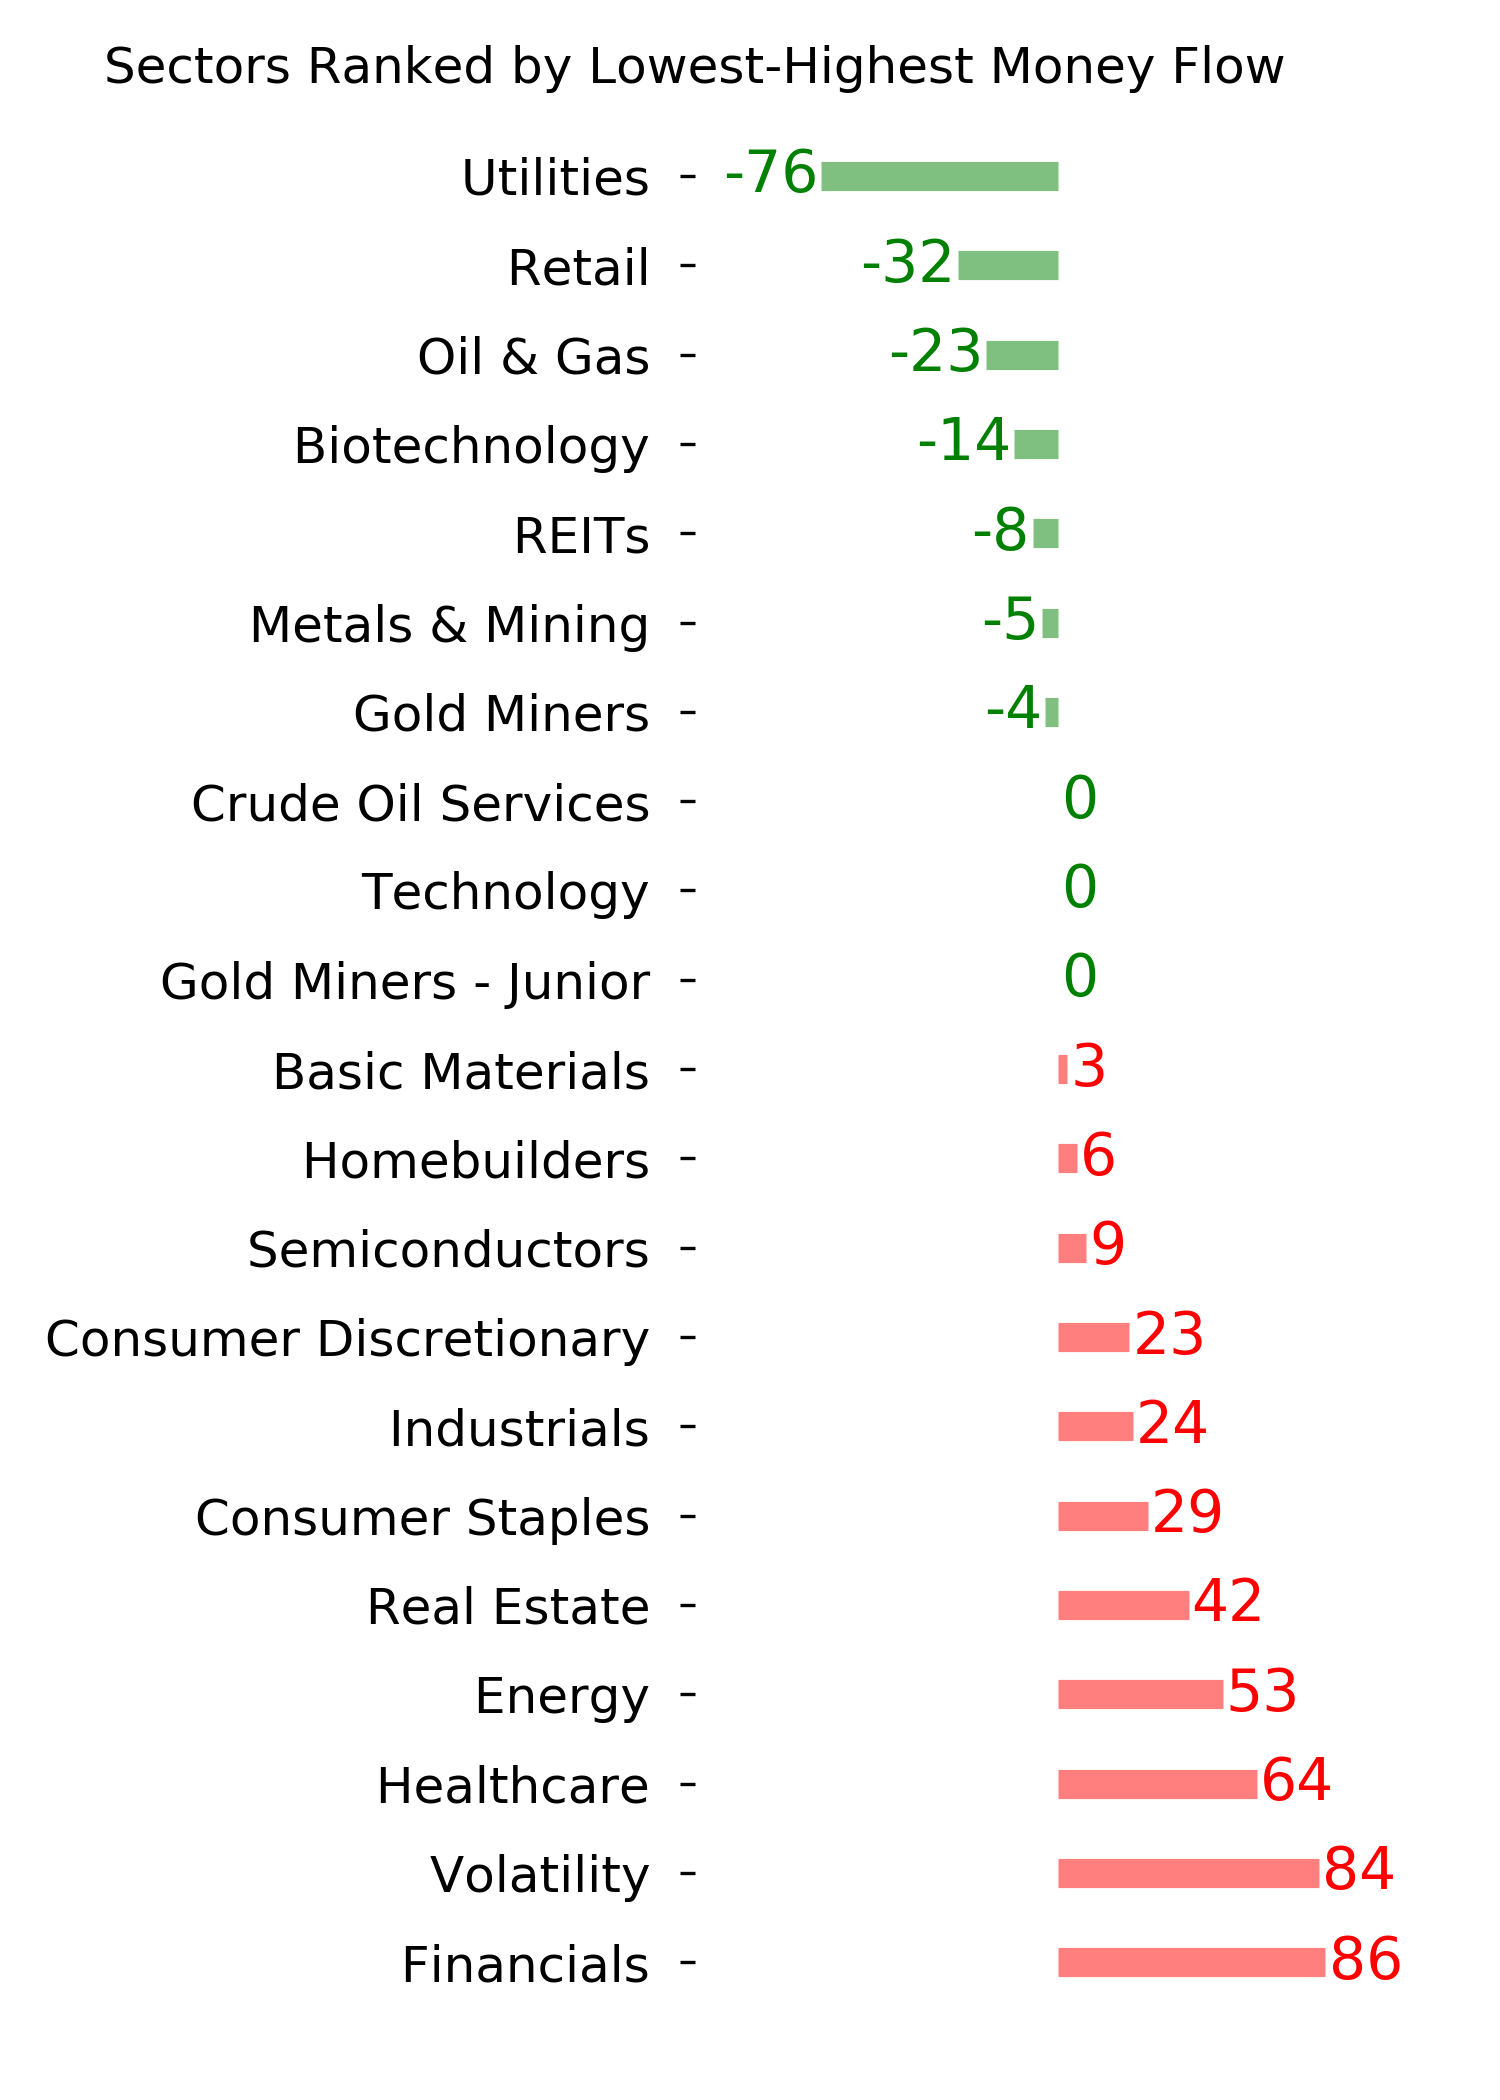
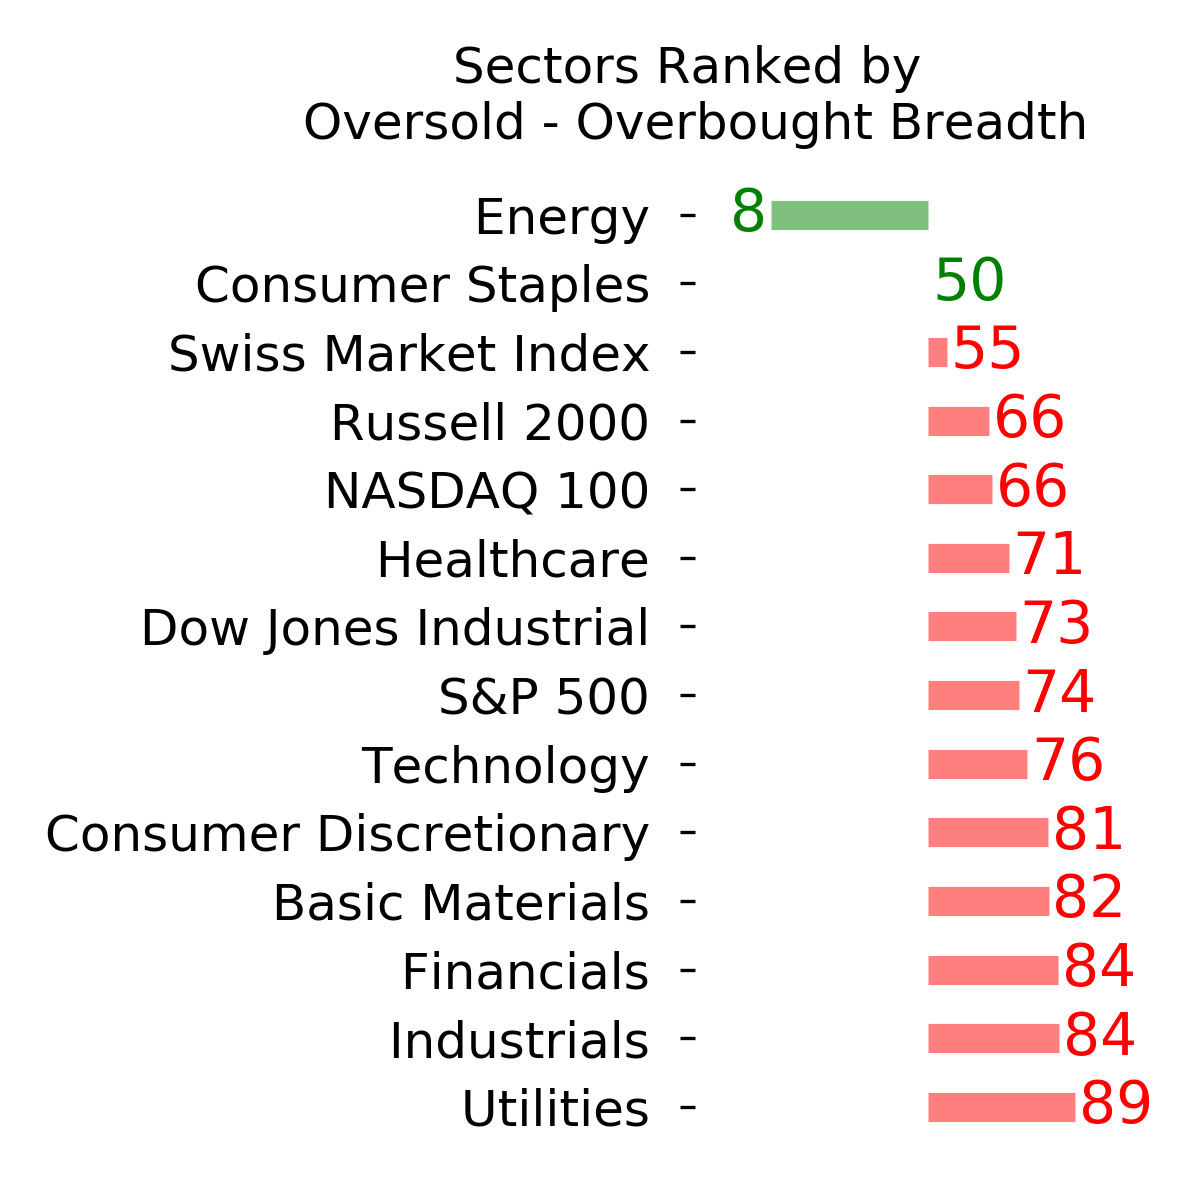
Ranks
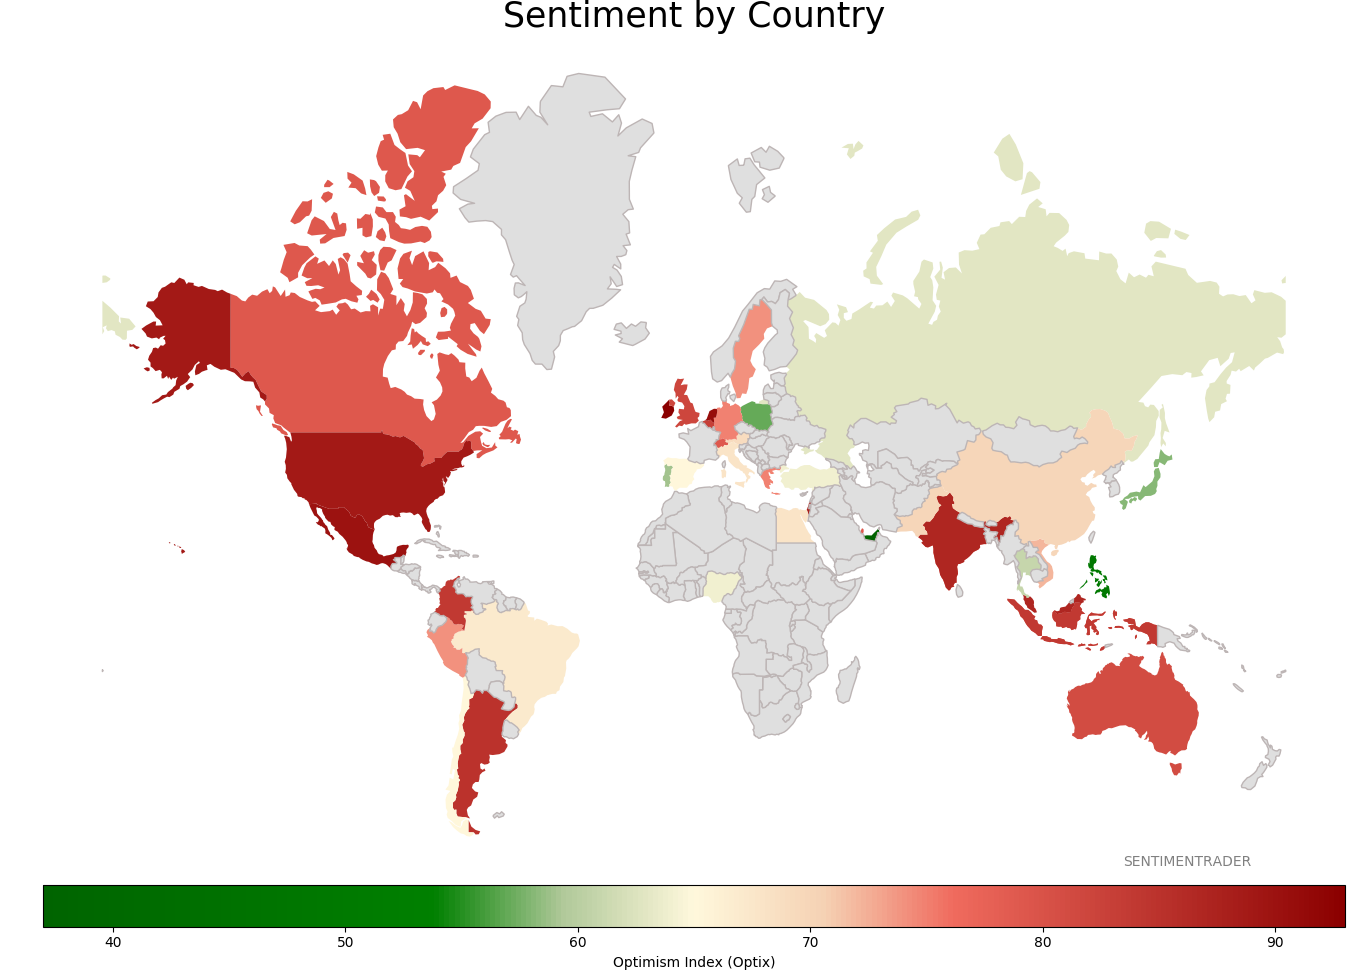
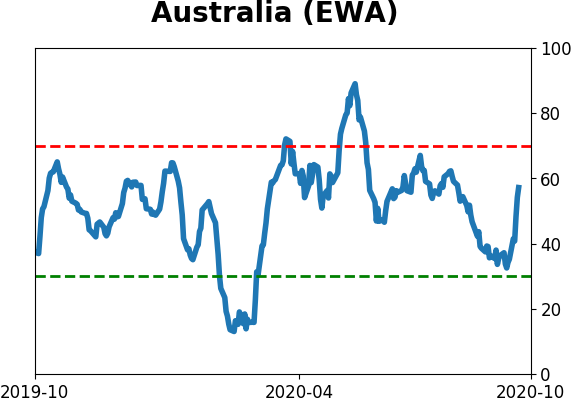
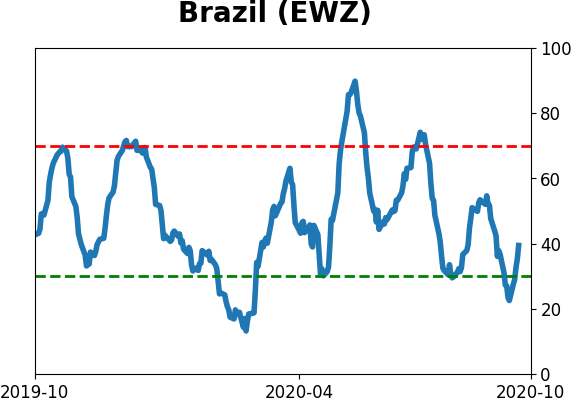
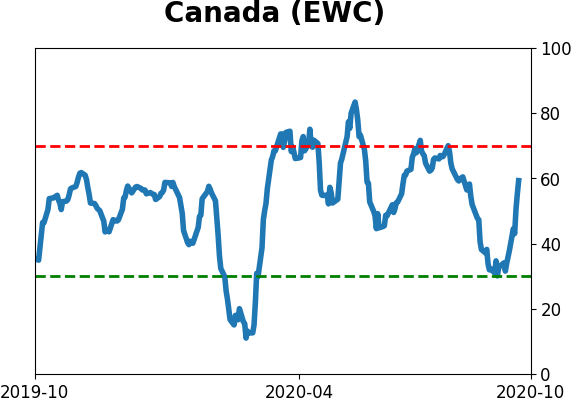
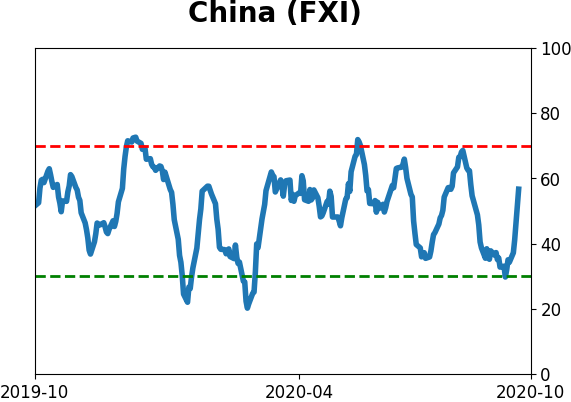
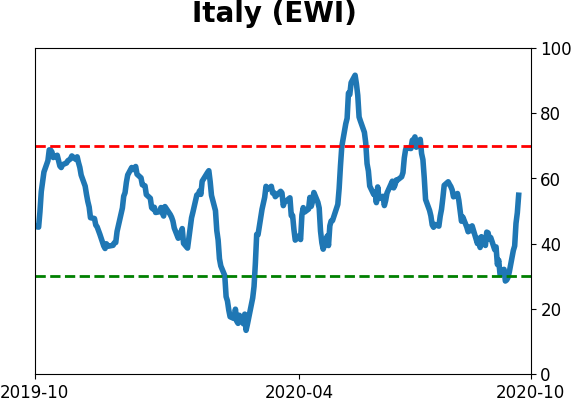
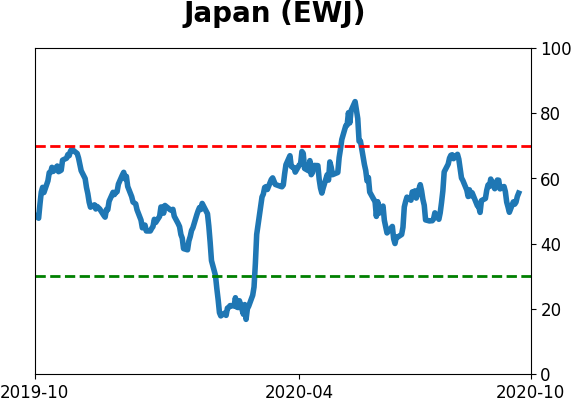
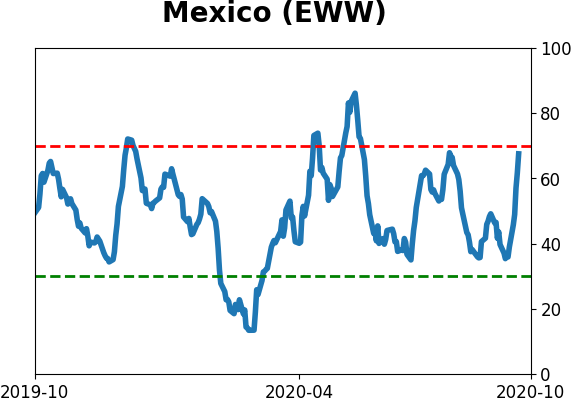
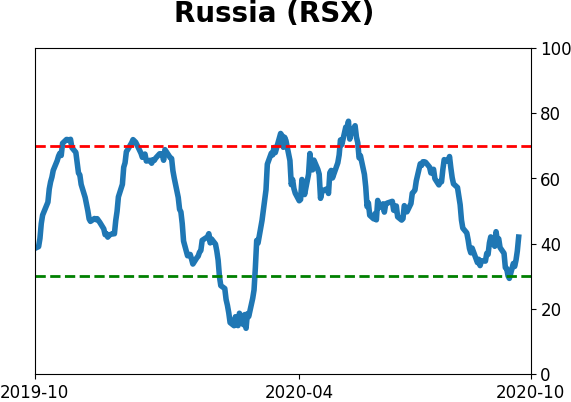
Sentiment Around The World
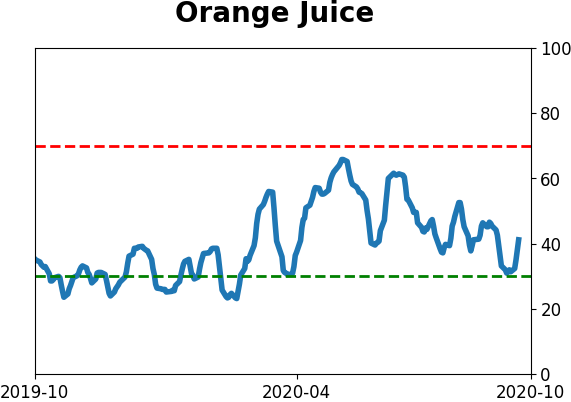
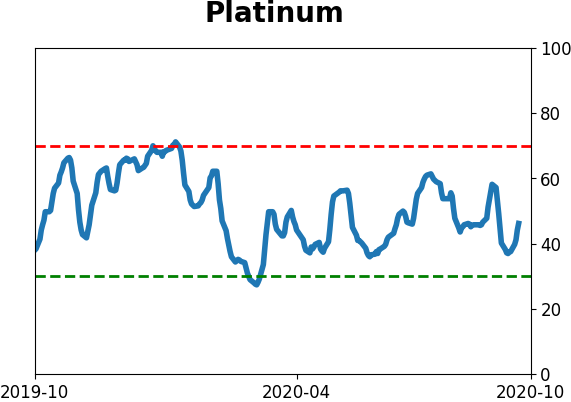
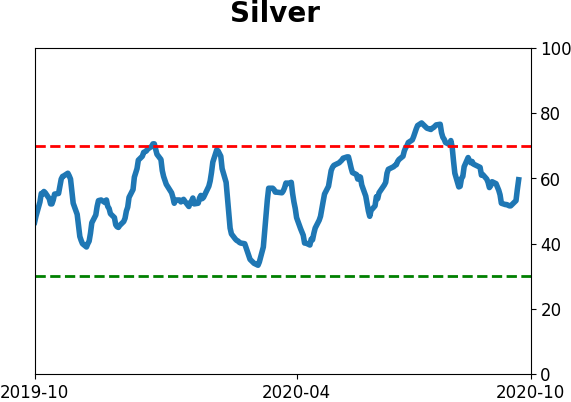
Optimism Index Thumbnails
|
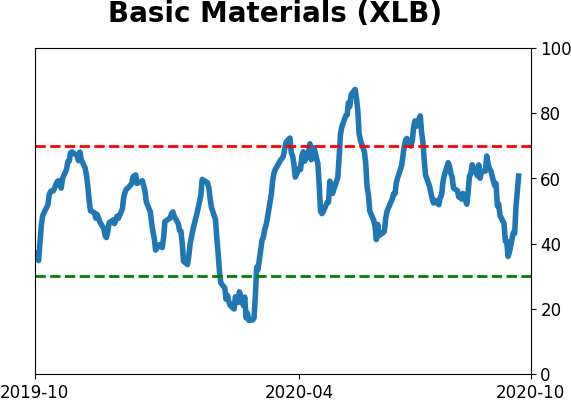
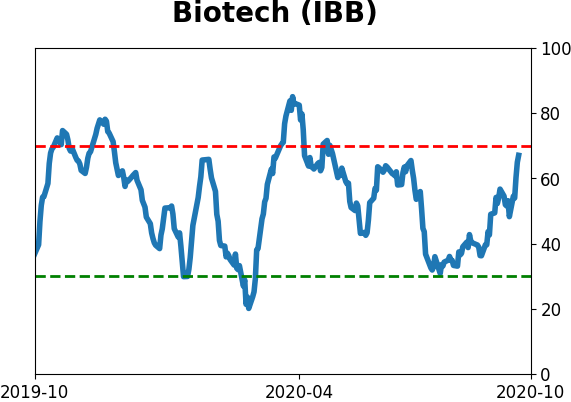
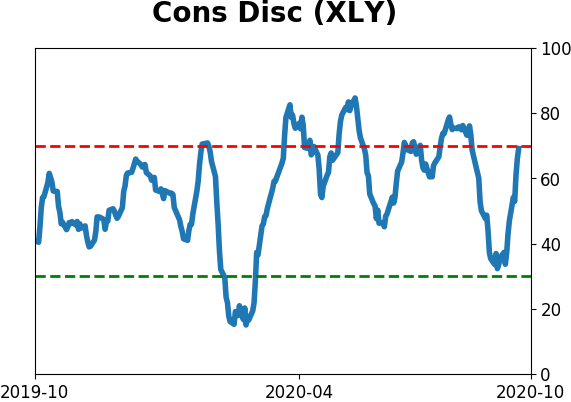
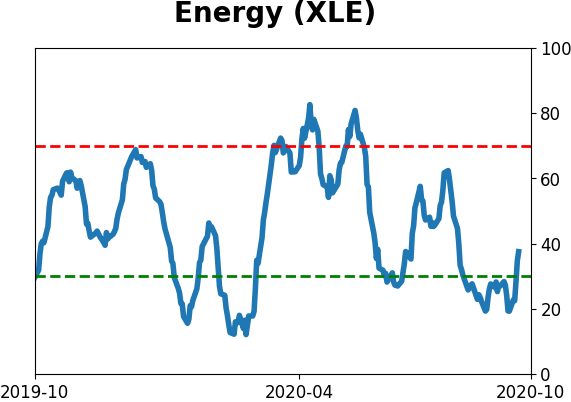
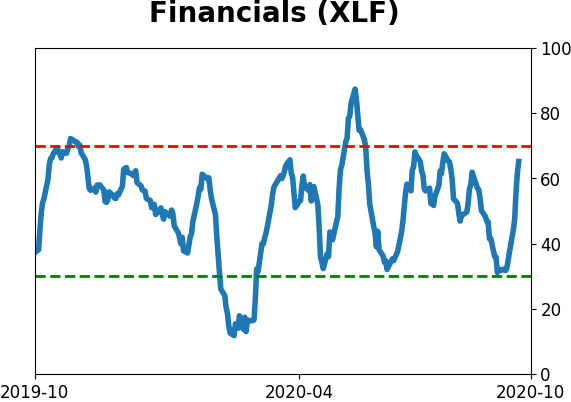
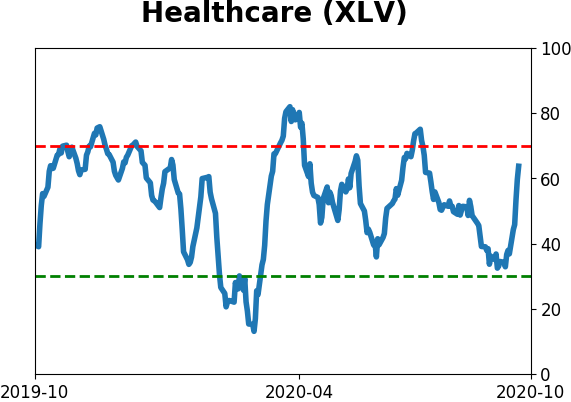
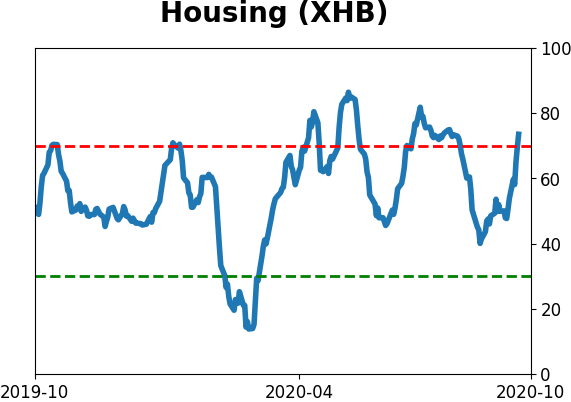
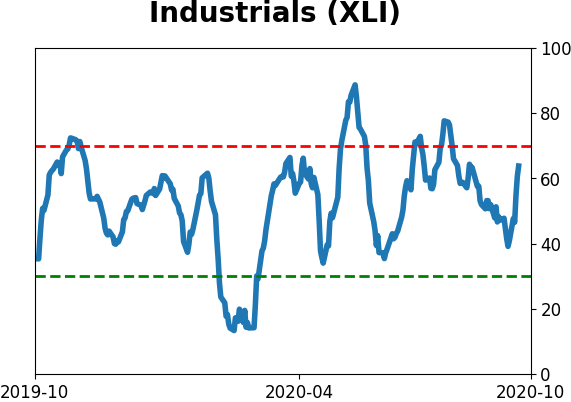
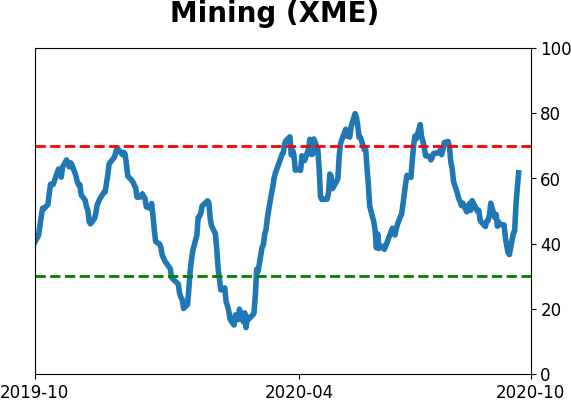
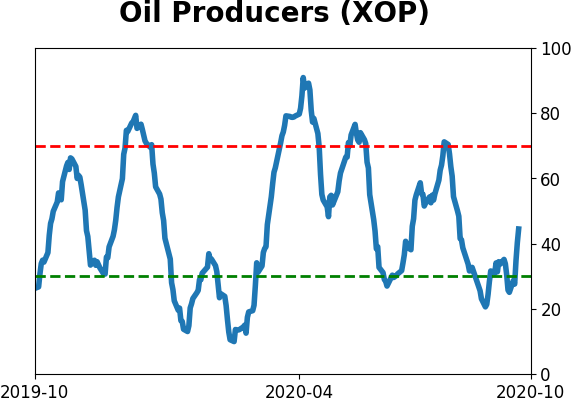
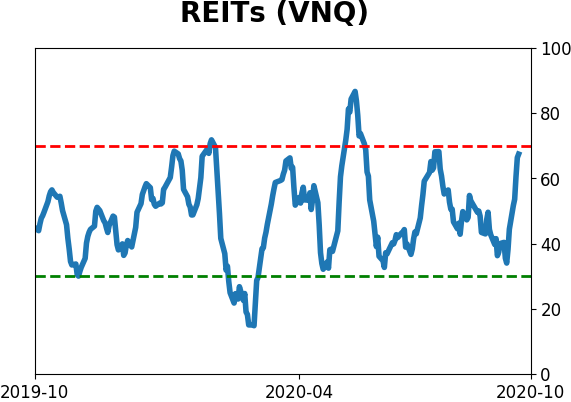
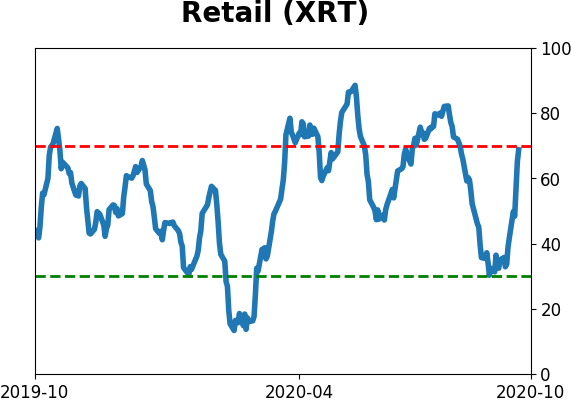
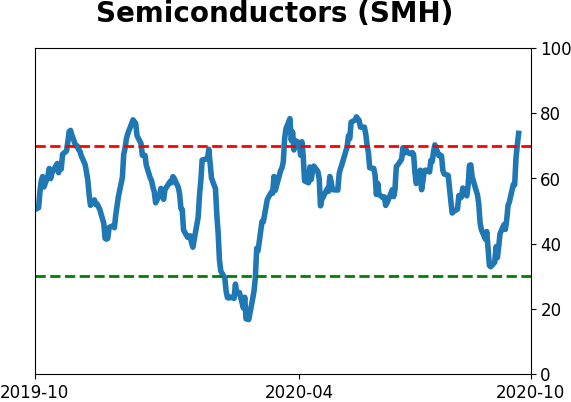
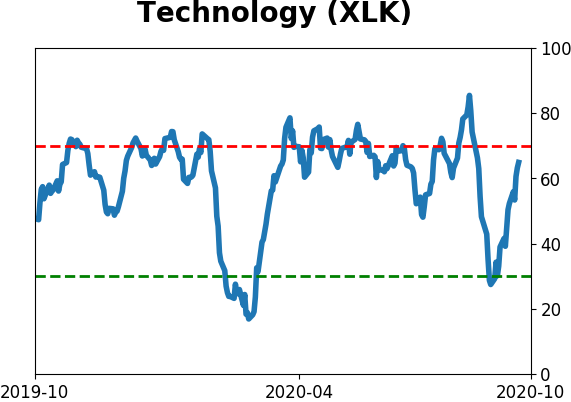
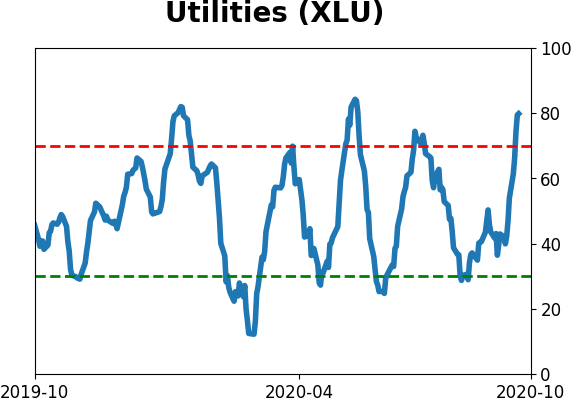
Sector ETF's - 10-Day Moving Average
|
|
|
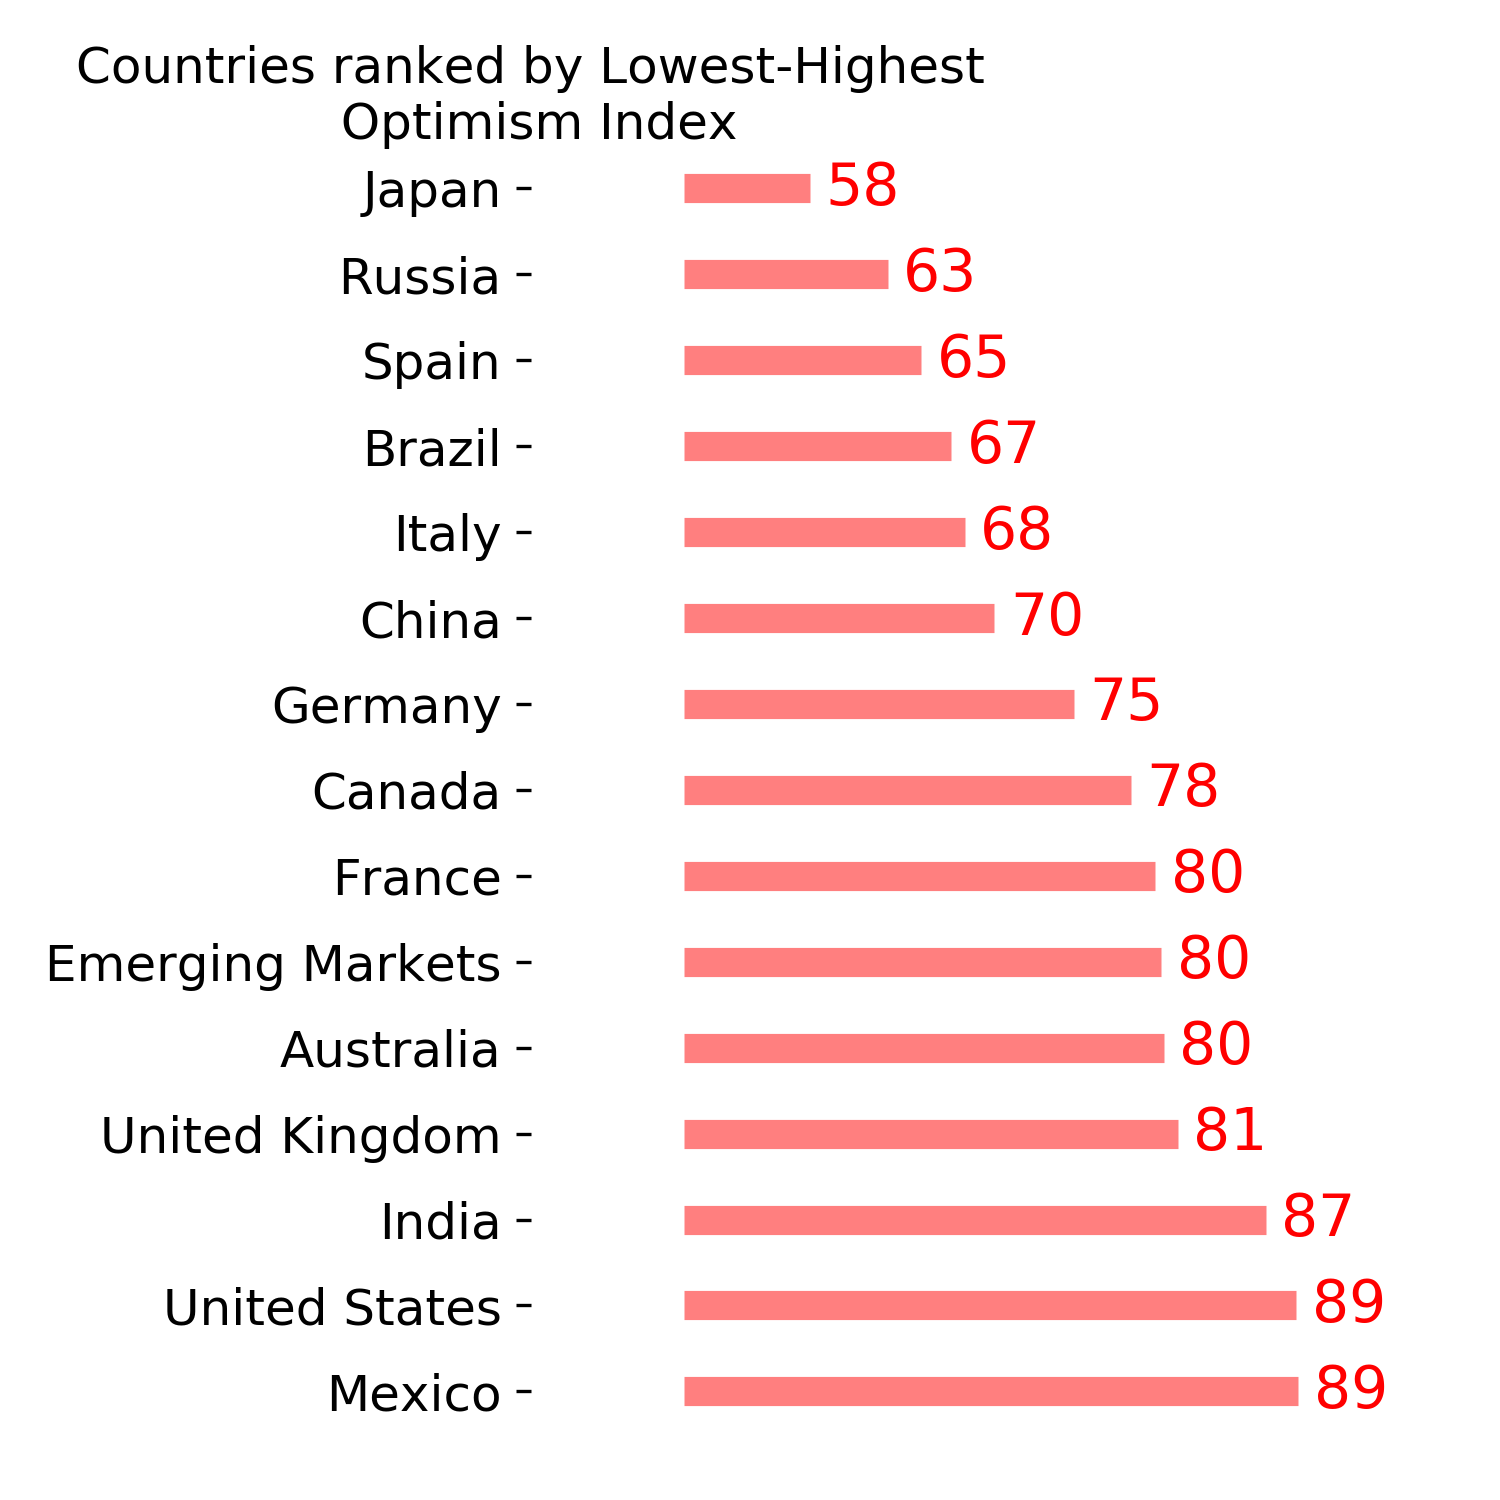
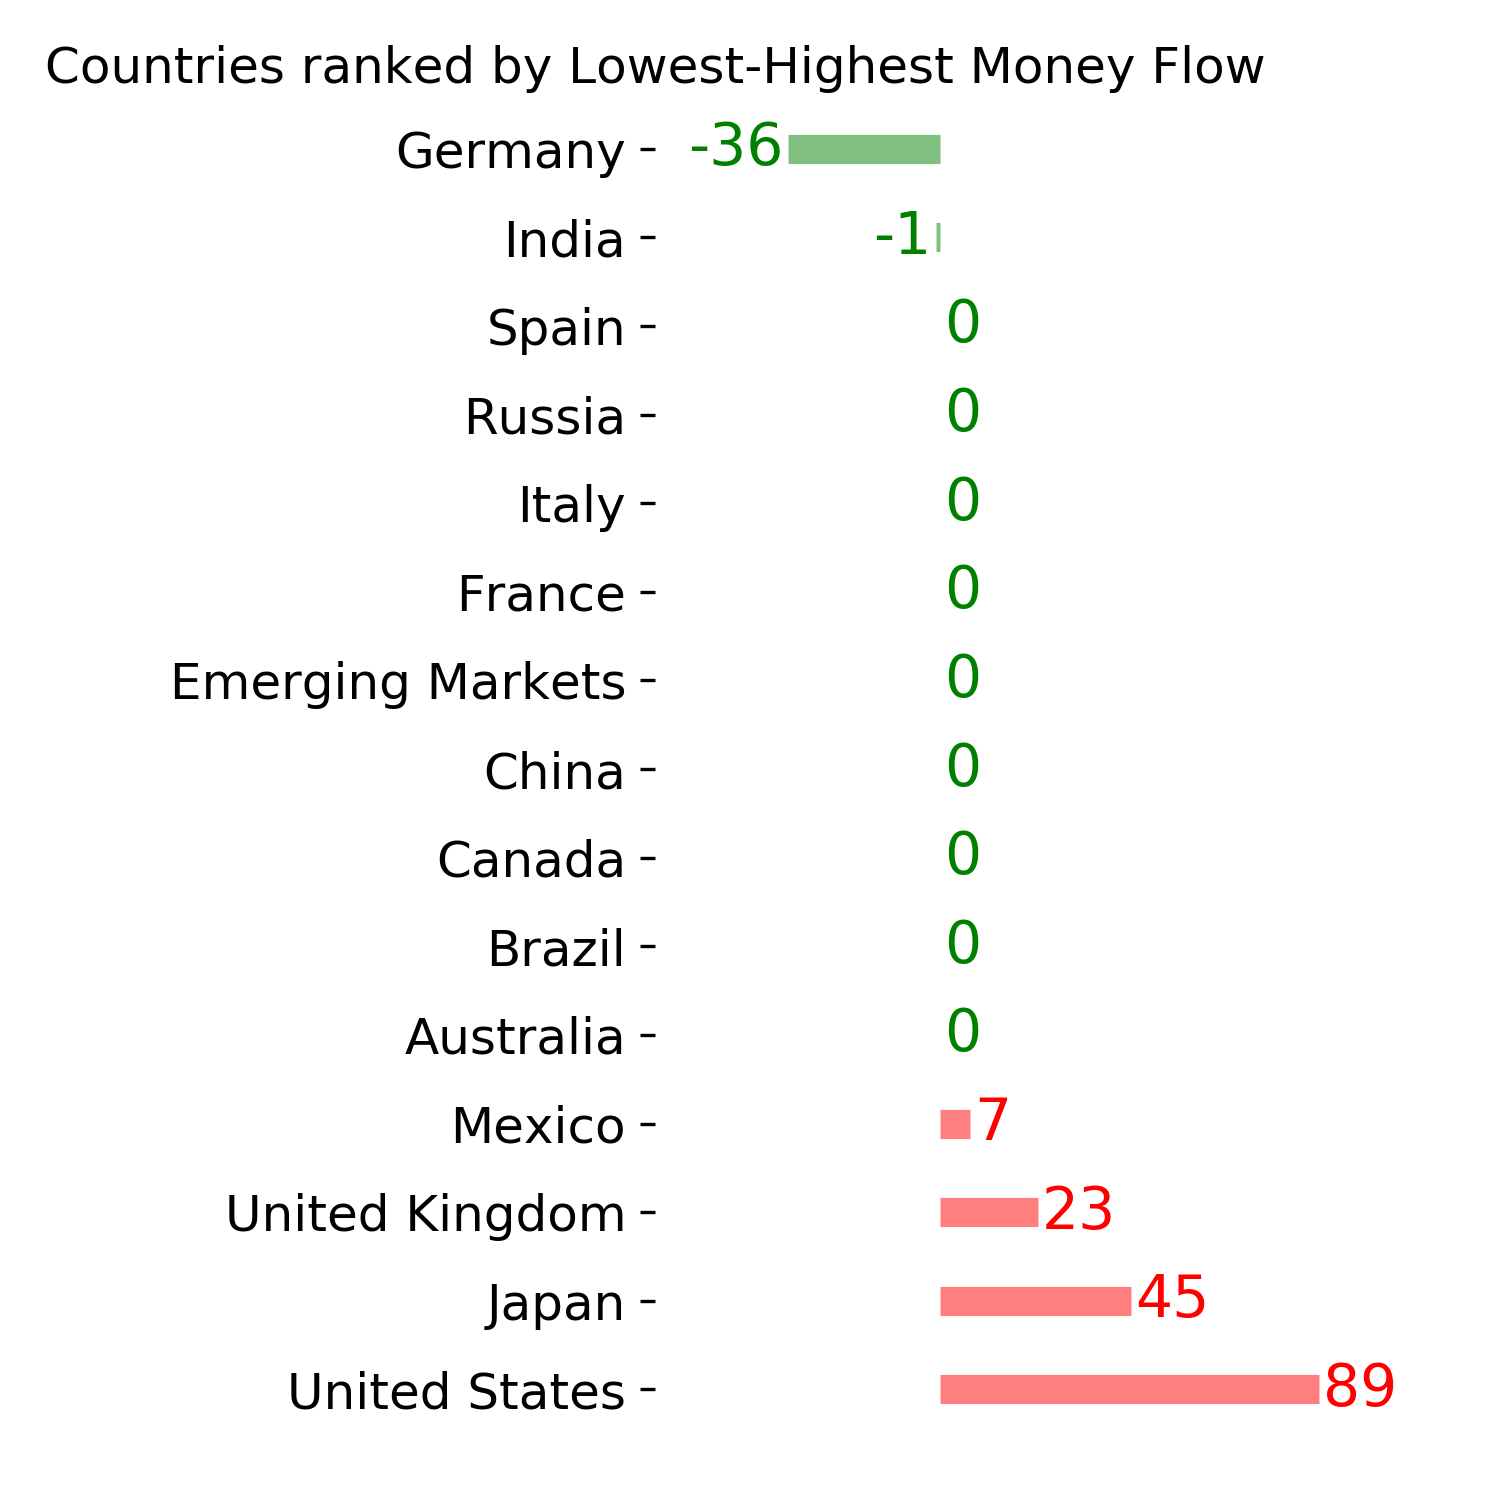
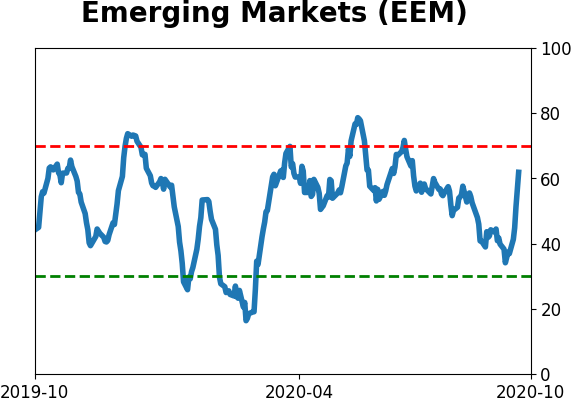
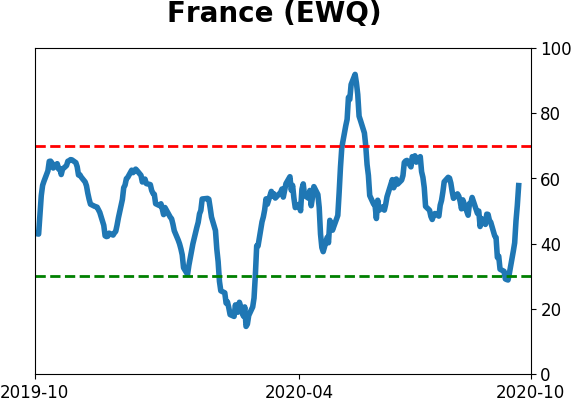
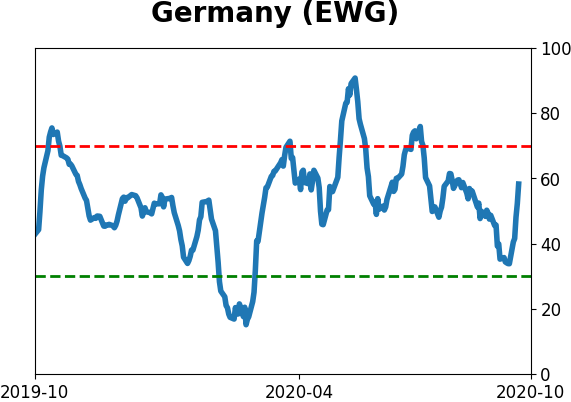
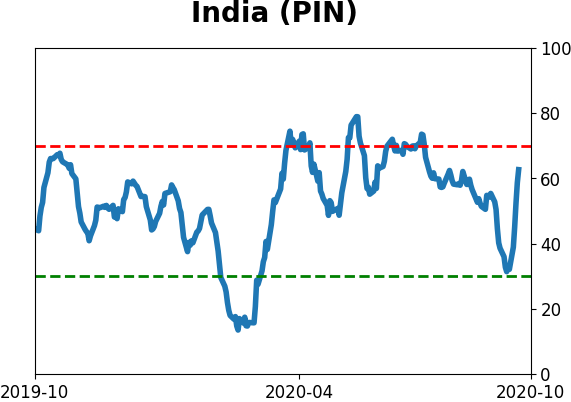
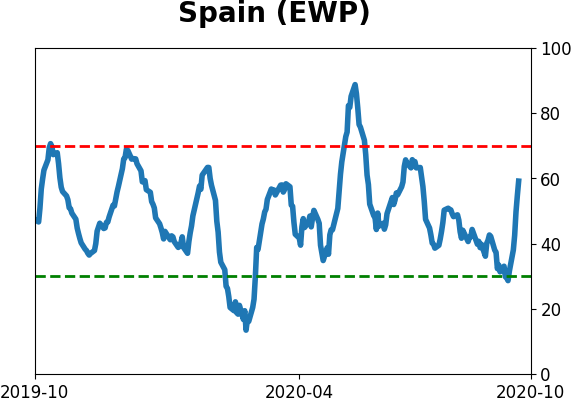
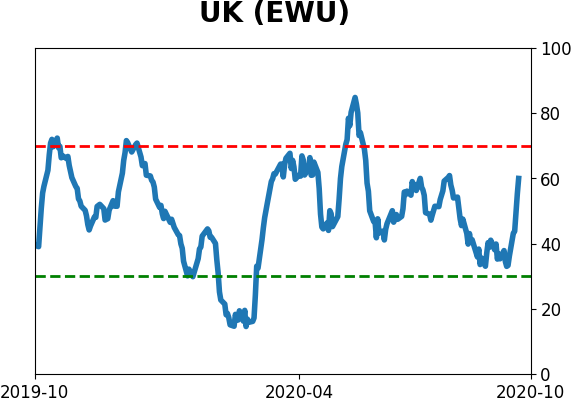
Country ETF's - 10-Day Moving Average
|
|
|
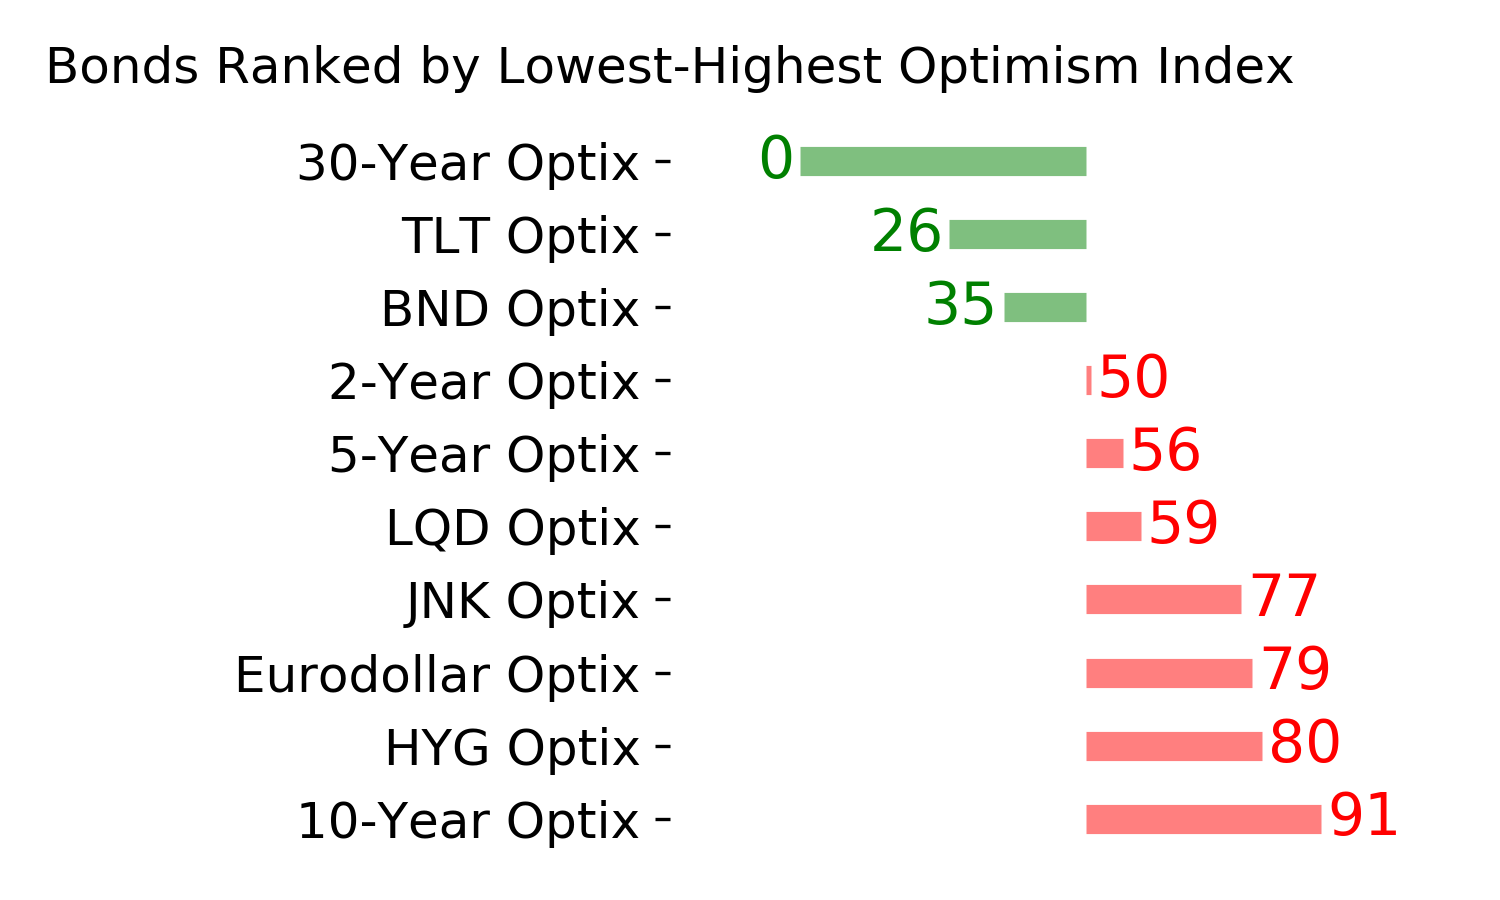
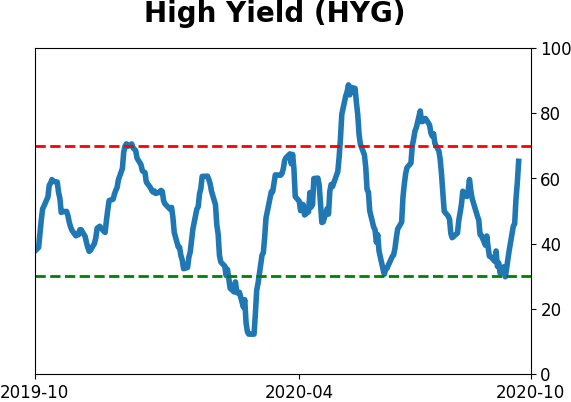
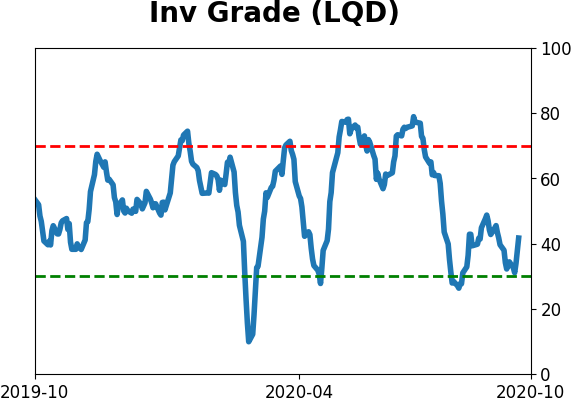
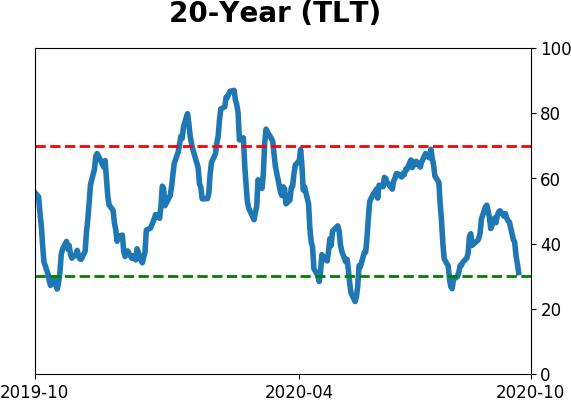
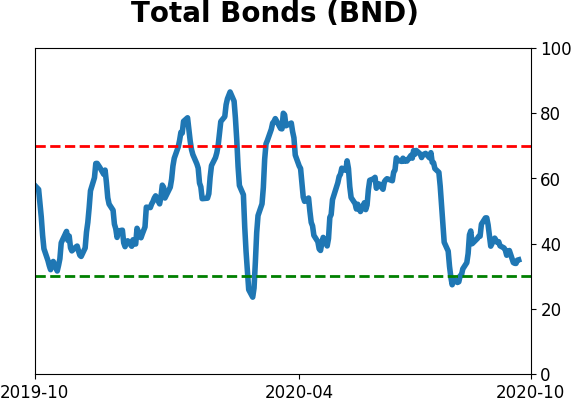
Bond ETF's - 10-Day Moving Average
|
|
|
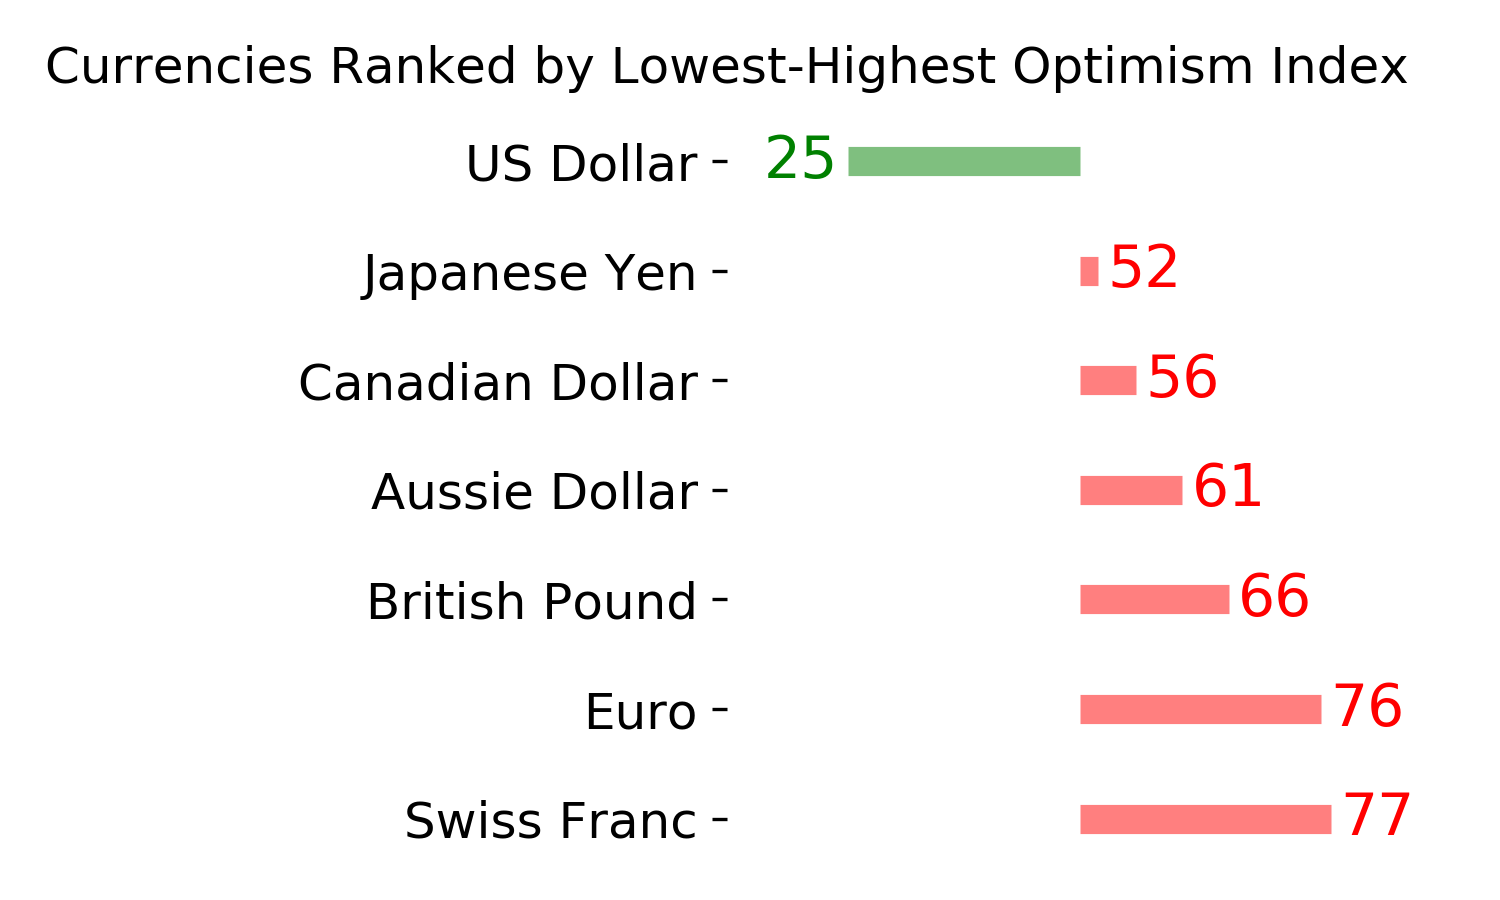
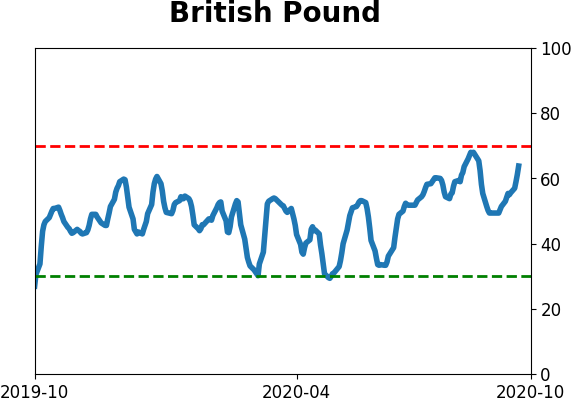
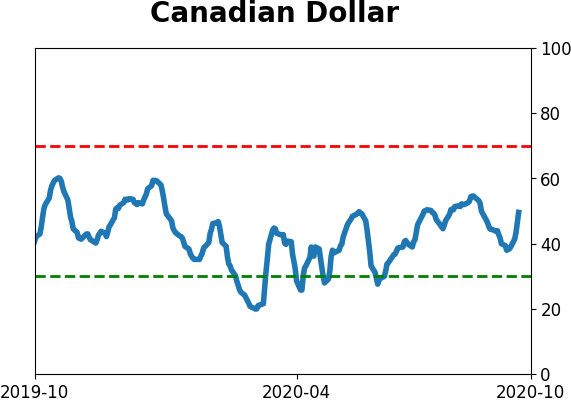
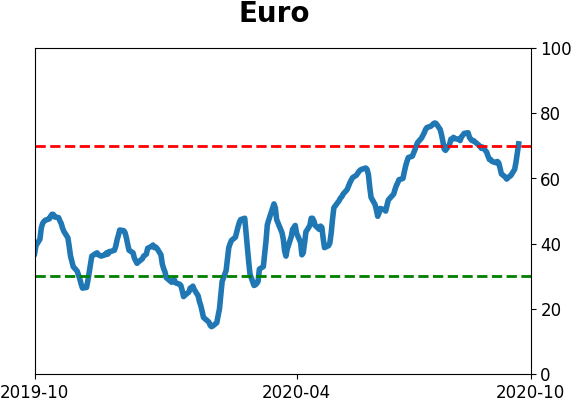
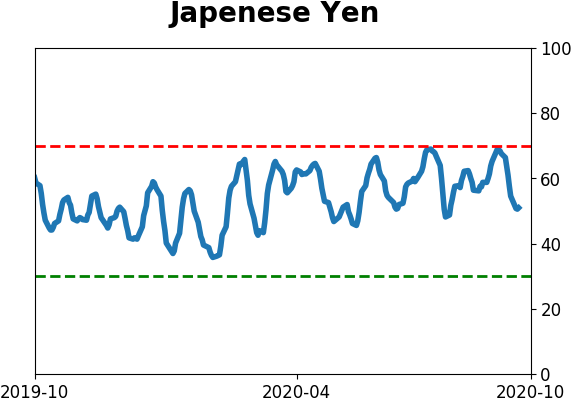
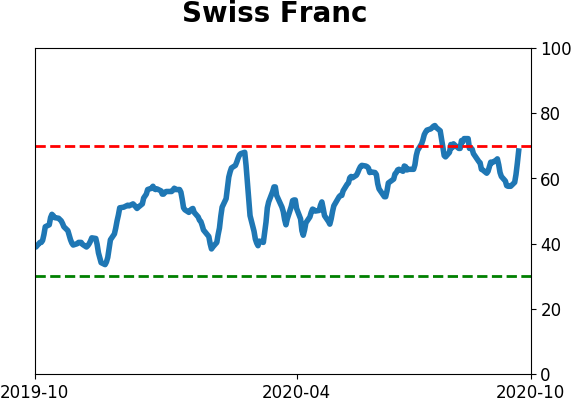
Currency ETF's - 5-Day Moving Average
|
|
|
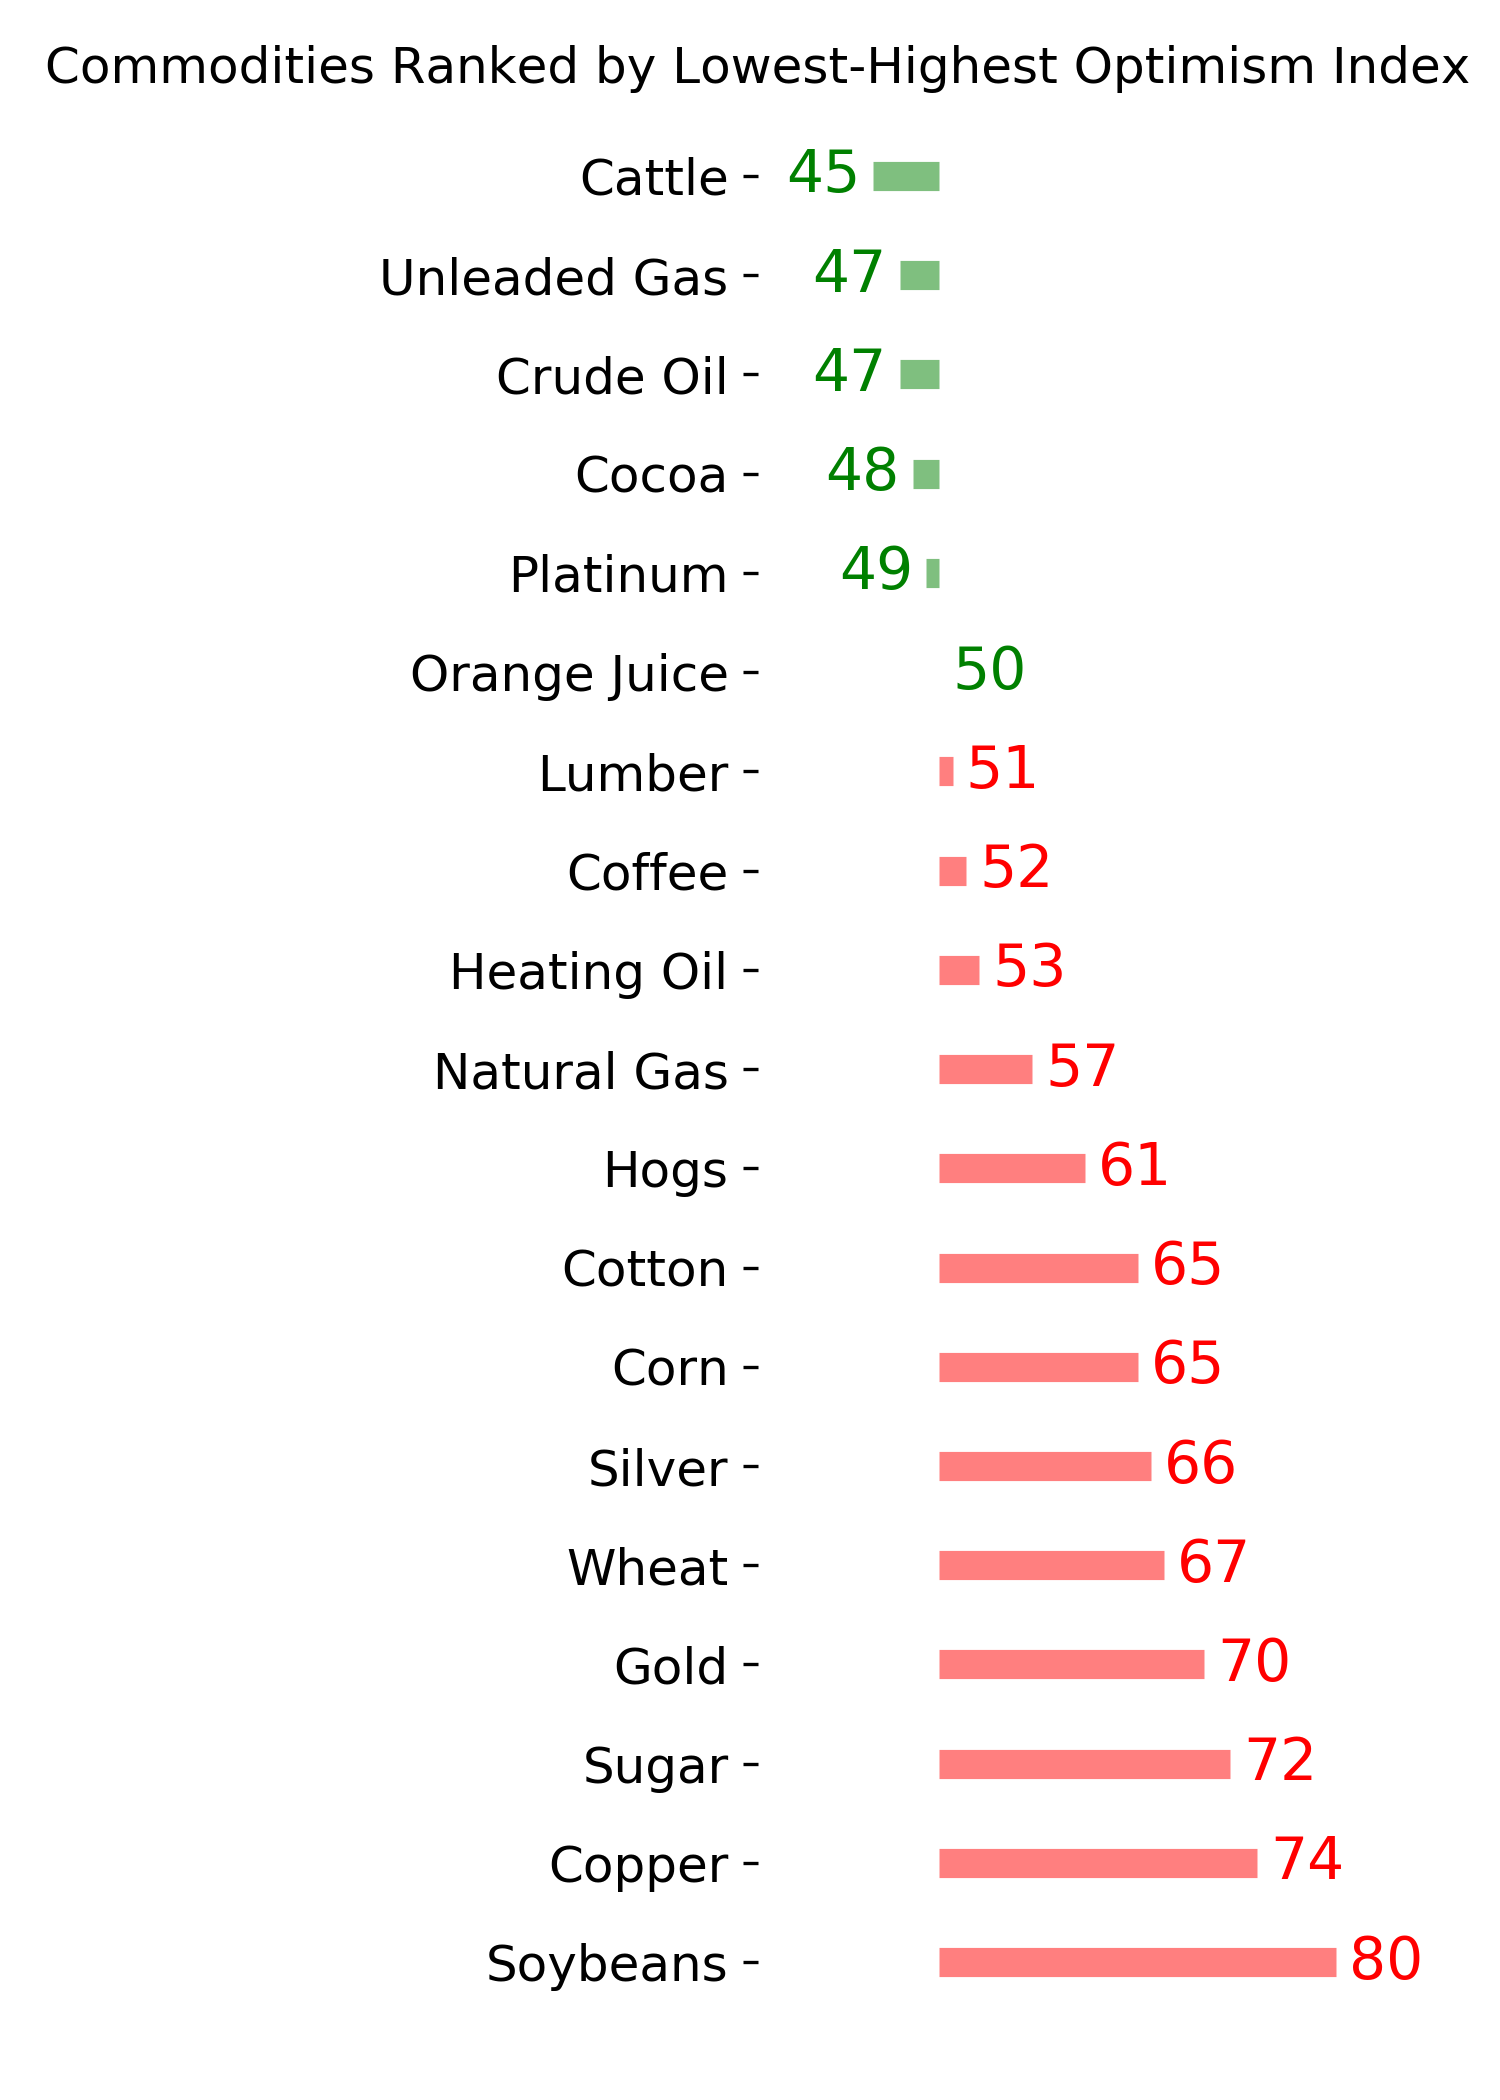
Commodity ETF's - 5-Day Moving Average
|
|