Headlines
|
|
A small-cap surge of historic proportions:
The Russell 2000 index of small-capitalization companies has surged more than 10% over the past 2 weeks. This kind of buying interest has preceded further gains in the Russell every time and typically led to higher prices for the broader market, as well.
Buyers come back in force yet again, nearing a record year:
Buying interest was enough on 2 out of 3 sessions that more than 80% of volume flowed into advancing stocks. These kinds of thrusts have a positive and consistent record. Even more notably, there have been 33 of these sessions in 2020, close to a record year since 1962.
MOAR thrusts: Adding to the string of days with 80% Up Volume as noted earlier, it triggered again on Thursday with 85% of volume flowing into advancing securities. This is the 3rd day with at least 80% Up Volume in the past 4 sessions. We have amended the earlier research to add this development.
Bottom Line:
- A positive environment favors becoming aggressive on signs of excessive pessimism.
| Other Sectors and Assets |
| | Positives | Negatives | | 1. Energy (here and here) | 1. Skewed tech (here and here) |
| 2. Dollar test |
|
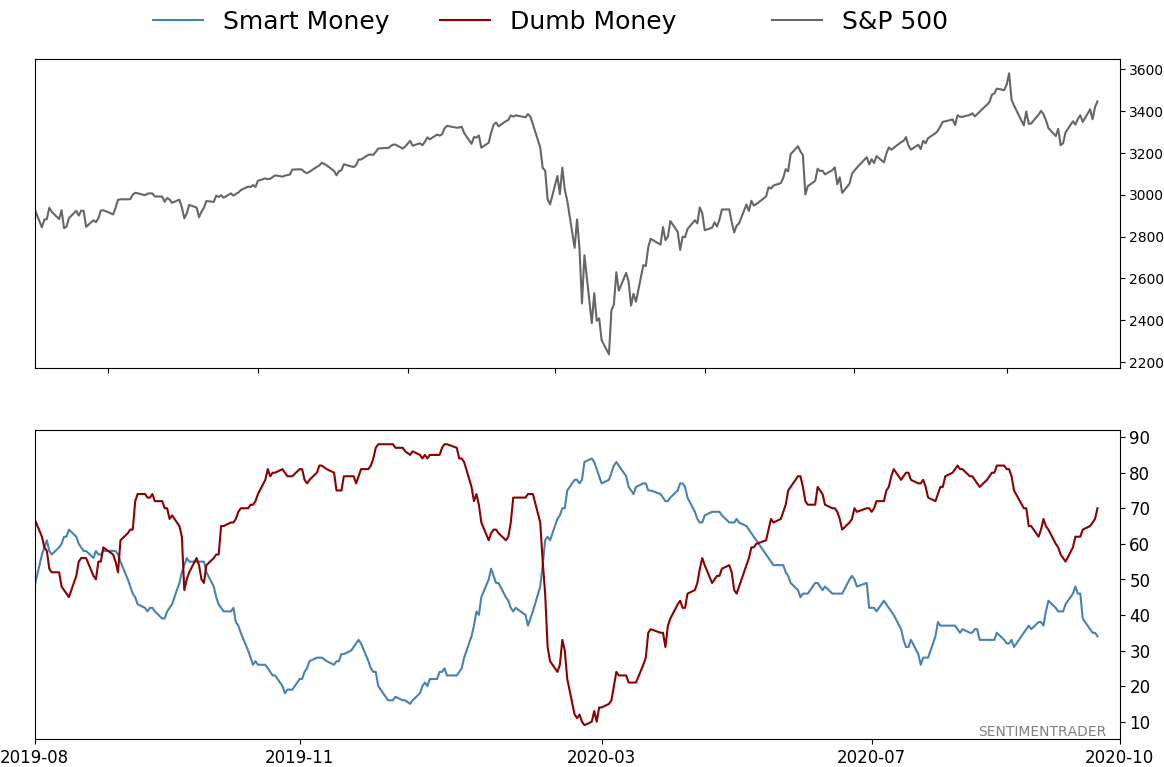
Smart / Dumb Money Confidence
|
Smart Money Confidence: 34%
Dumb Money Confidence: 70%
|
|
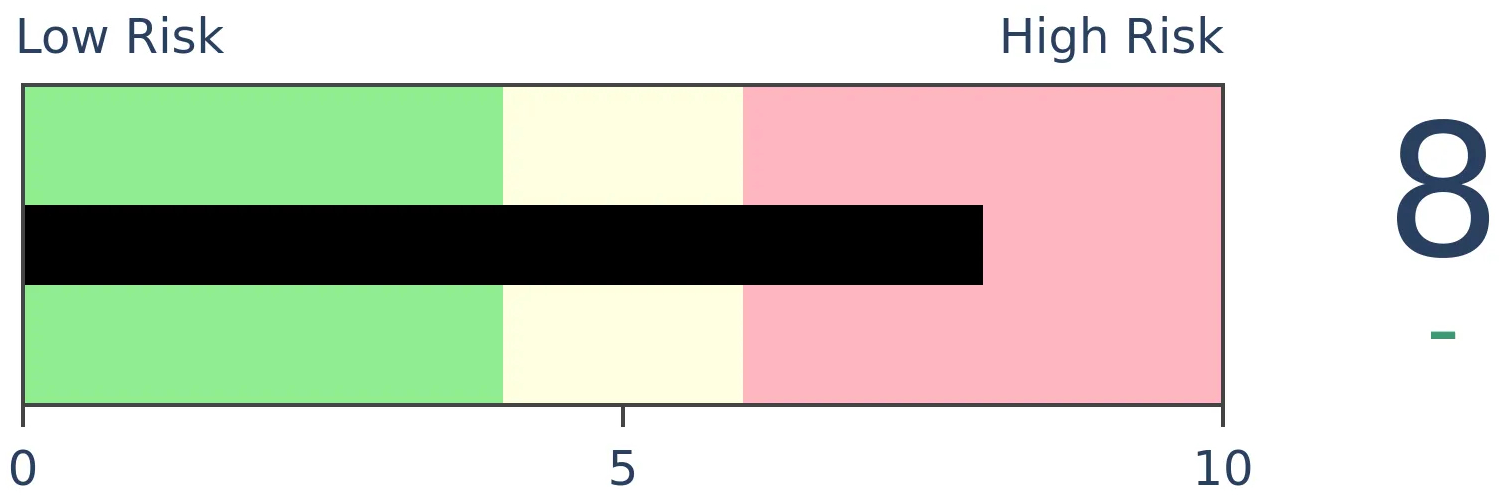
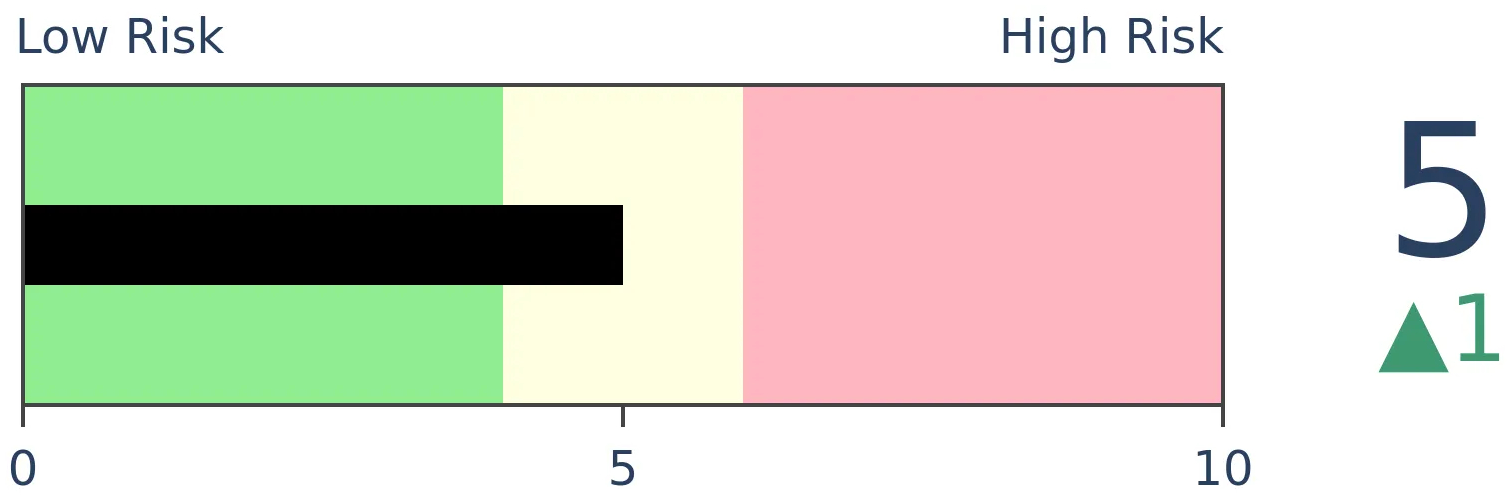
Risk Levels
Stocks Short-Term
|
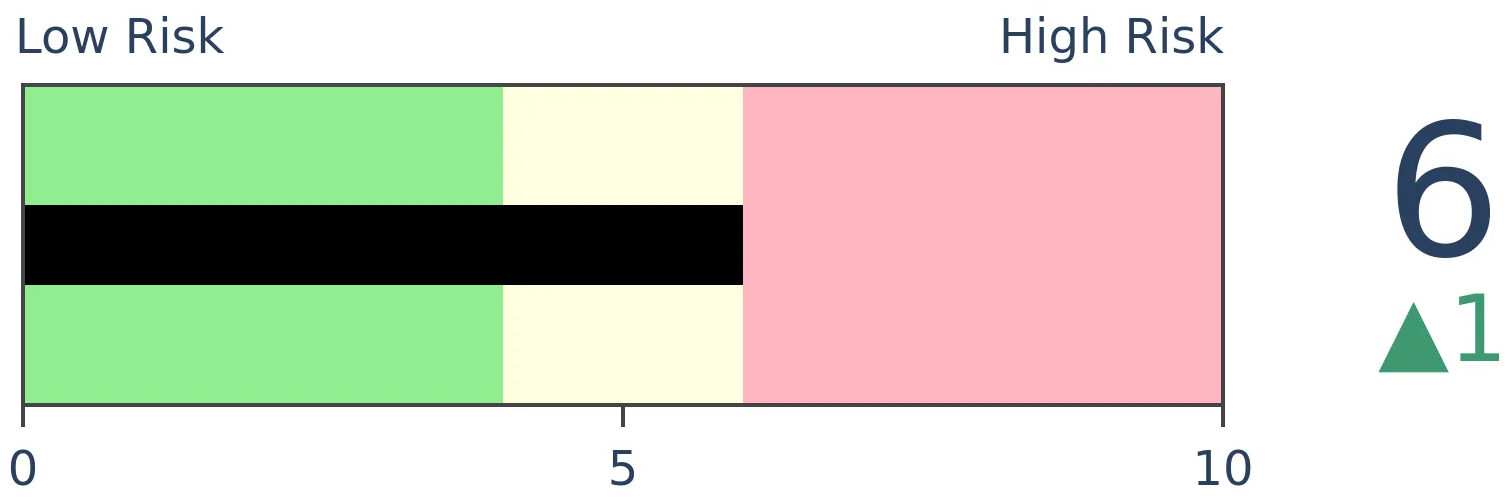
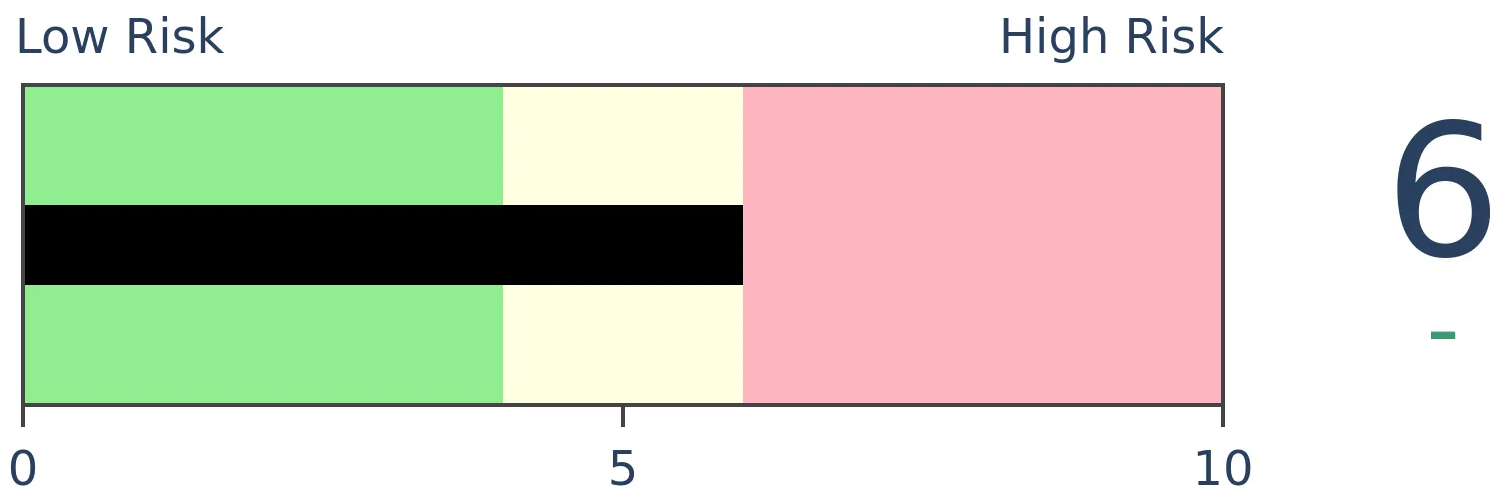
Stocks Medium-Term
|
|
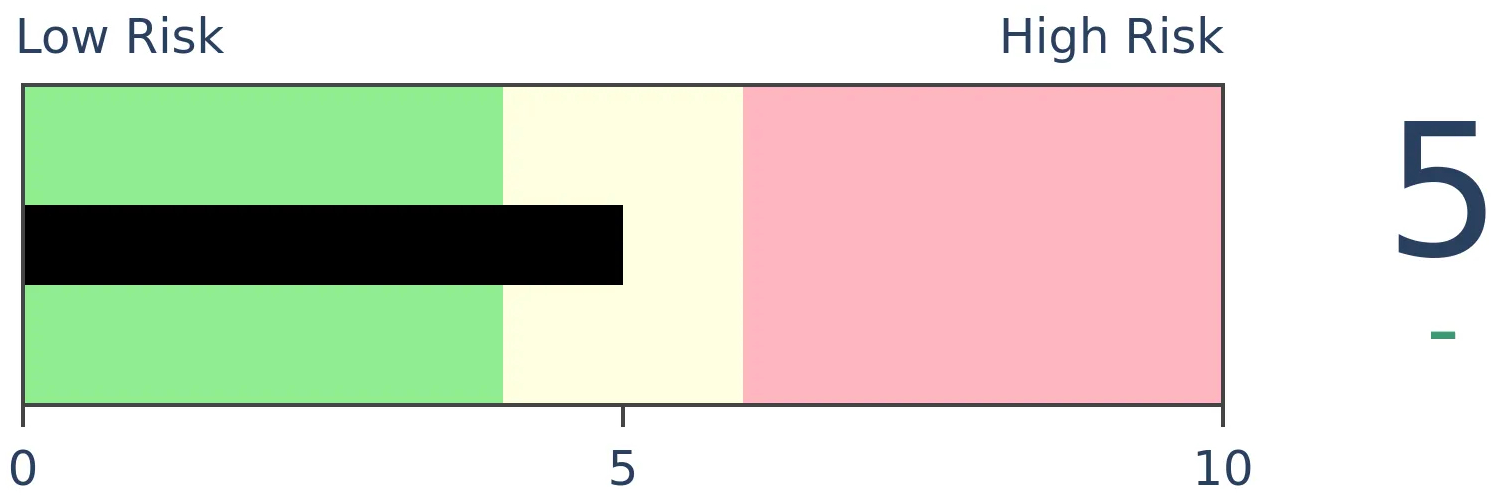
Bonds
|
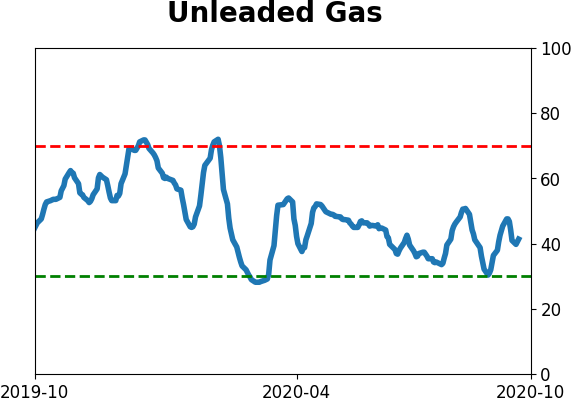
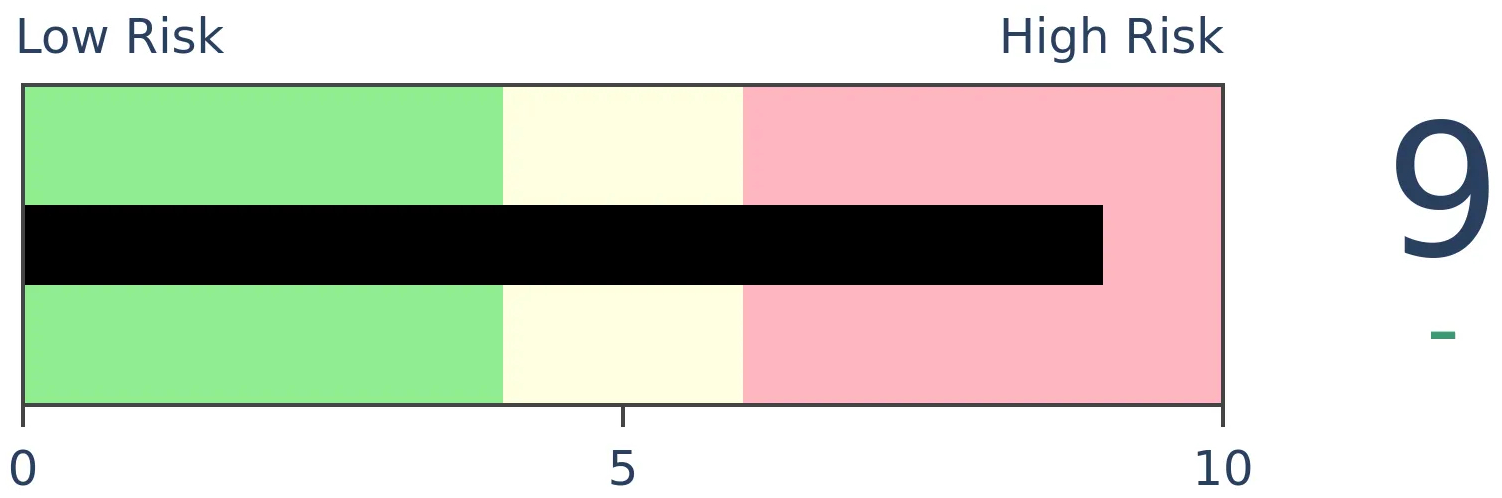
Crude Oil
|
|
Gold
|
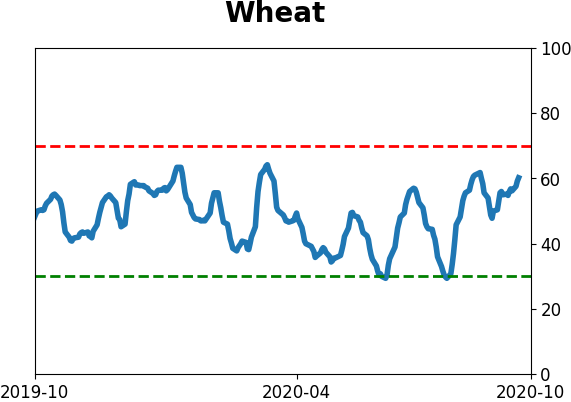
Agriculture
|
|
Research
BOTTOM LINE
The Russell 2000 index of small-capitalization companies has surged more than 10% over the past 2 weeks. This kind of buying interest has preceded further gains in the Russell every time and typically led to higher prices for the broader market, as well.
FORECAST / TIMEFRAME
IWM -- Up, Medium-Term
|
It's been one heck of a nice couple of weeks for small-cap stocks. As recently as a few weeks ago, there was a lot of talk about their relative weakness and how they tend to lag during Q4. Not so much anymore.
Over the past two weeks, the small-cap Russell 2000 has surged more than 11%, one of its largest 10-day gains since inception.
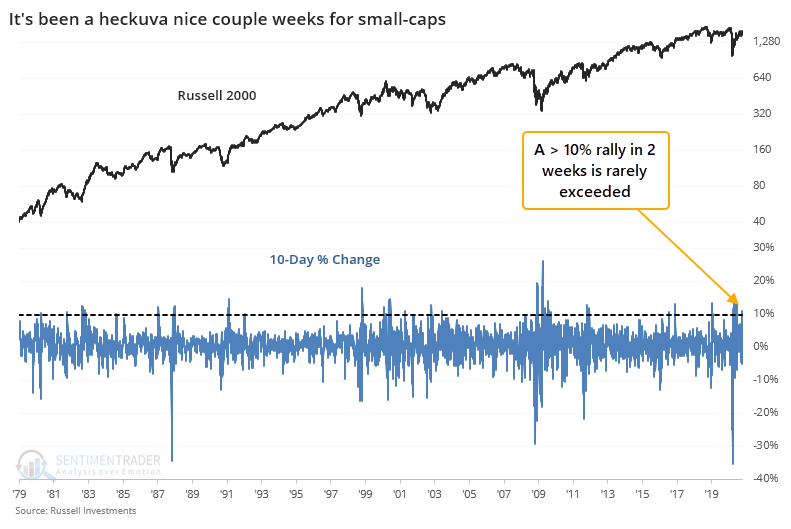
This kind of rebound typically happens after severe weakness, either on a relative or absolute basis. Either way, there have been only 20 distinct times over the past 40 years when the index shot higher by at least 10% over a 10-day stretch.
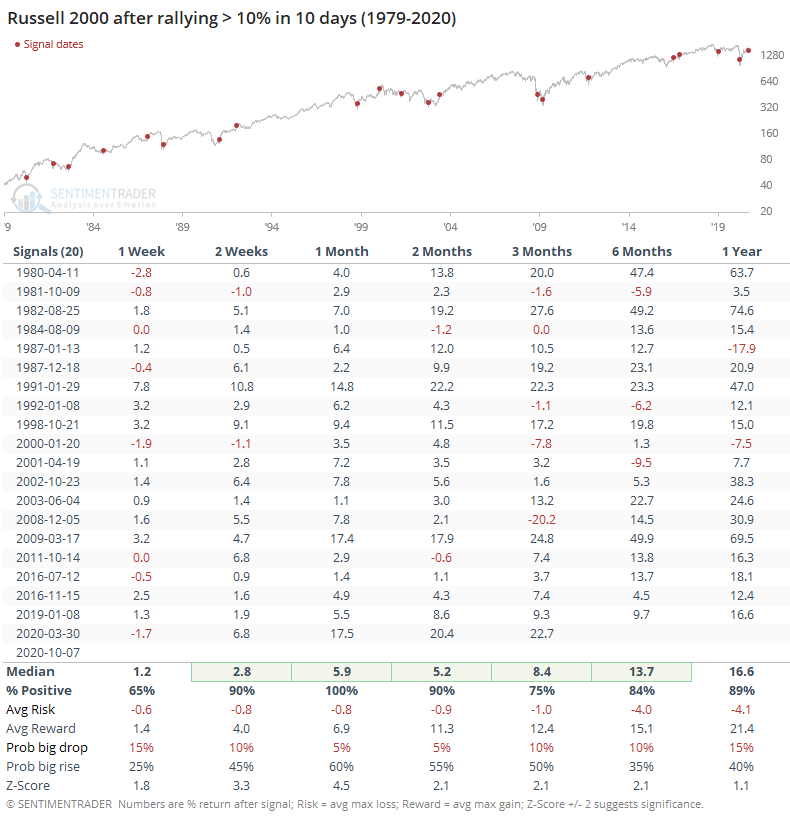
When buying interest was so intense, it tended to generate even more excitement. During the next month, the Russell never showed a loss, which is remarkable. In addition, there was a 60% probability of a big rise versus only a 5% probability of a big drop (see this Knowledge Base article for a more detailed explanation of terms).
Over the next 3 months, the risk/reward was heavily skewed toward the "reward" side, with a maximum gain that averaged more than 12% versus maximum risk that barely exceeded -1%.
It was a good sign for the broader market, as well, though not as good as for the Russell itself.
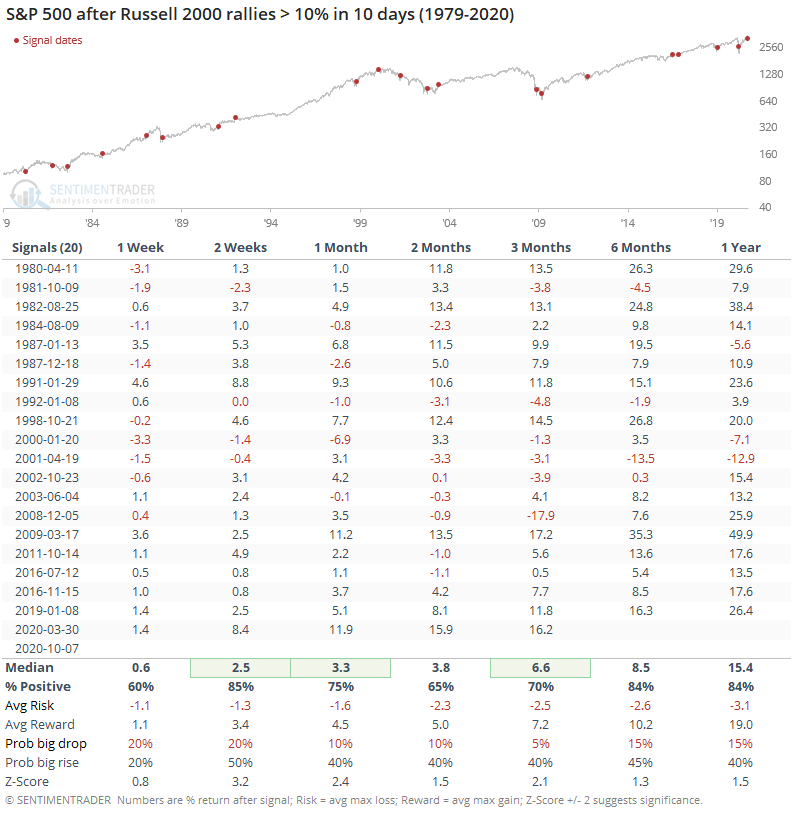
The consistency of gains, median return, and risk/reward for the S&P were quite good across all time frames, and the probability of an abnormally large rise was about 3x greater than the probability of an abnormally large loss. That didn't mean there were no losses, though - it would have hurt pretty good in 2001 and 2008.
There were only a handful of times this happened when the S&P was within 5% of a multi-year high.
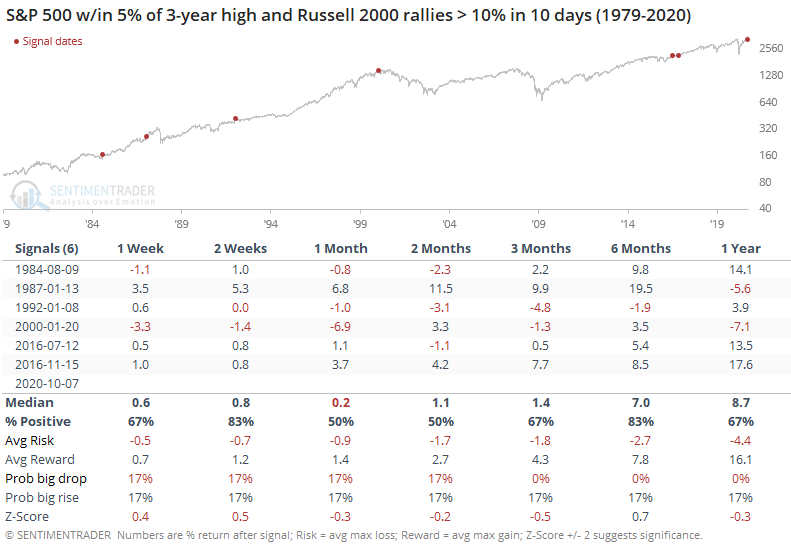
Again, this didn't prevent any losses at all, but they were at least contained. In 2000, it ultimately rolled over into a protracted bear market, but not before stocks rallied for months.
The strength in small-caps is why we're also seeing a surge in some of the breadth metrics. Those, too, have boded well for future returns.
BOTTOM LINE
Buying interest was enough on 2 out of 3 sessions that more than 80% of volume flowed into advancing stocks. These kinds of thrusts have a positive and consistent record. Even more notably, there have been 33 of these sessions in 2020, close to a record year since 1962.
FORECAST / TIMEFRAME
SPY -- Up, Long-Term
|
NOTE: We have amended this note at the end to include the fact that Up Volume once again surged above 80% after this was published.
The backbone of any positive bias since the spring has been the multitude of thrust and recovery signals. That turned a little iffy in July and August as oddities triggered, thanks to the overwhelming push by large tech stocks.
Lately, it has returned to a more normal market environment, and yet again on Wednesday, buyers were eager enough that more than 80% of volume on the NYSE exchange flowed into advancing securities.
That marked the 2nd day with more than 80% NYSE Up Volume in just the past 3 sessions.
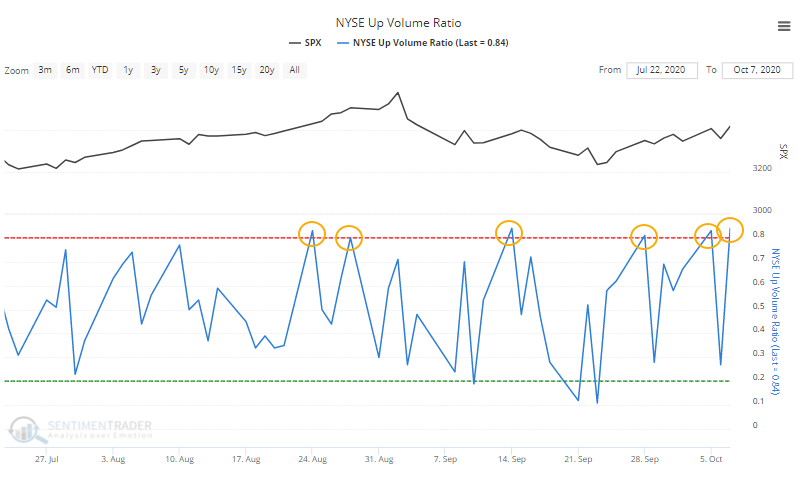
It's not uncommon to see tight clusters of these days during big downtrends, as volatility is high. It's more unusual to see it when stocks are relatively close to their highs. When it has happened, it's been a good sign for forward returns.
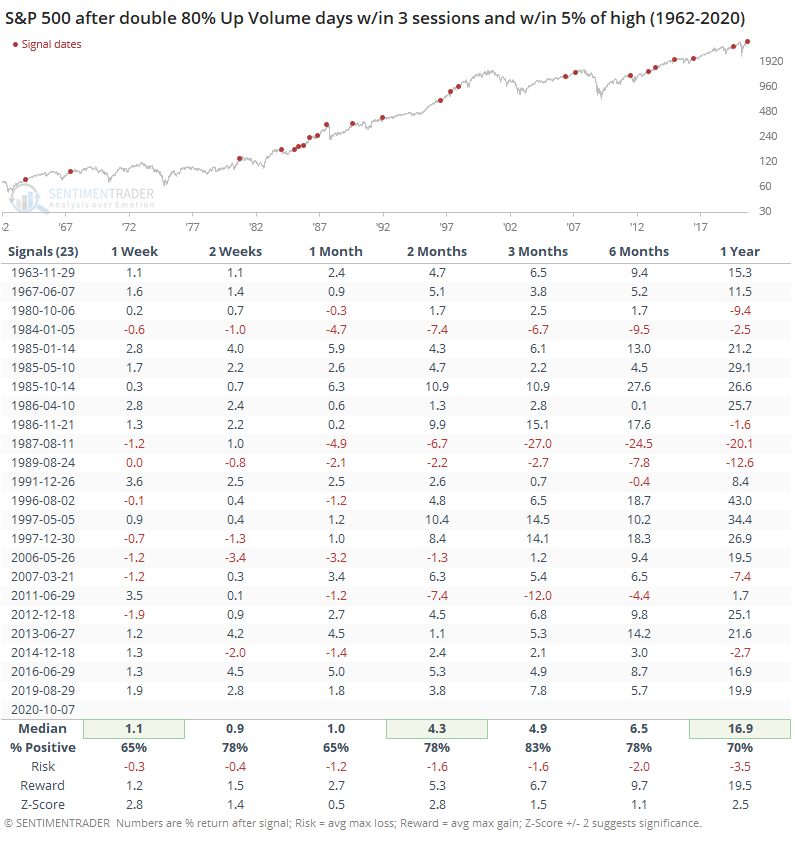
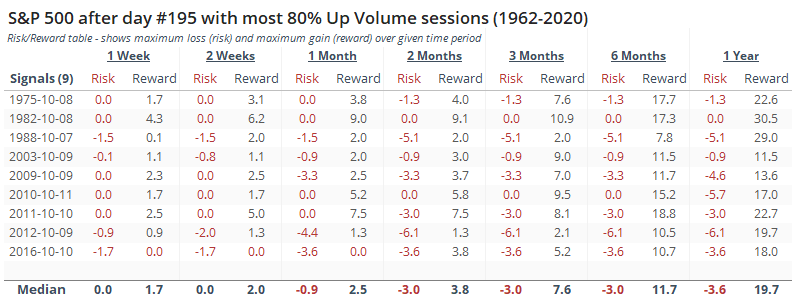
Over the next 3 months, there were 4 signals that saw a maximum loss of -5% or more at some point, compared to 16 signals that saw a maximum gain of +5% or more at some point. That helped skew the risk/reward ratio heavily to the positive side.
We can see from the chart above that the past few days have added to a multitude of 80% or greater Up Volume days since late August. Since the start of the year, there have been 33 of these days, nearing the all-time record dating back to 1962.
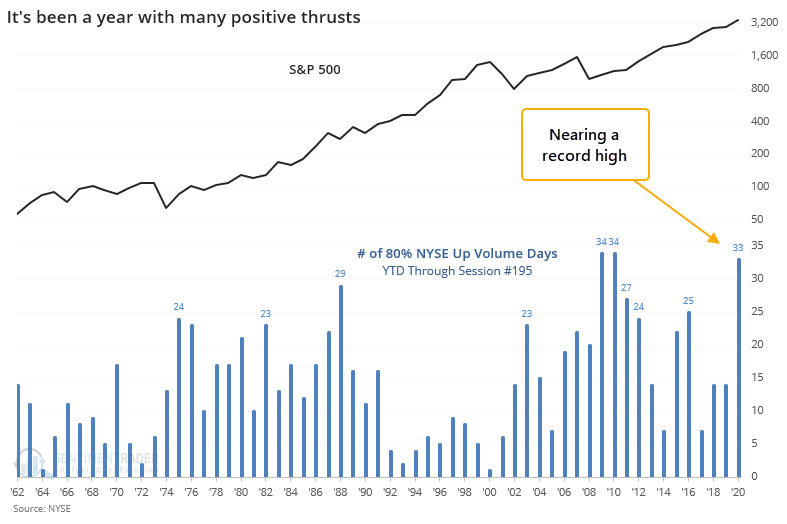
Years with a lot of these big up thrusts tended to be volatile, of course, but that didn't prevent extremely positive returns going forward.
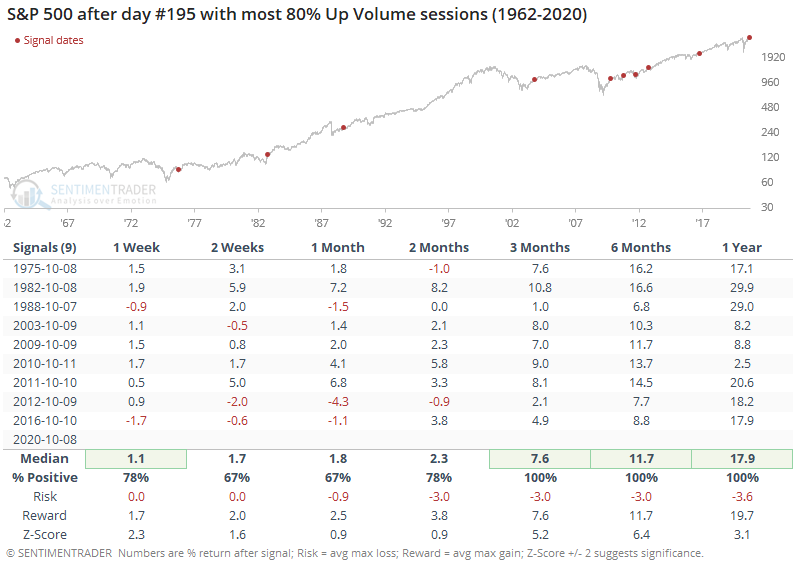
The risk/reward following these signals was almost ridiculously positive. During the next year, the most that any signal lost at any point was -6.1%. That compares to a maximum gain that was +11.5% or more after every one of them.
EDIT: The day this was published, Up Volume once again closed above 80%. This marks the 3rd day in the past 4 that saw a ratio above 80%. Below, we can see that tight clusters of such heavy buying pressure have preceded consistently positive returns.

When sentiment is positive enough that buyers are willing to plow into almost any stock that's up on the day, it says a lot about the attitude out there. Clusters of these days, like we saw several times during the spring, have an essentially unblemished record of pointing to higher stocks over the medium- to long-term. While there are troubling issues like the continued speculation of options traders, as long as we keep seeing breadth thrusts like this, it's hard to get too negative over a longer-term time frame.
Active Studies
| Time Frame | Bullish | Bearish | | Short-Term | 0 | 0 | | Medium-Term | 3 | 8 | | Long-Term | 48 | 2 |
|
Indicators at Extremes
Portfolio
| Position | Description | Weight % | Added / Reduced | Date | | Stocks | 15.6% RSP, 10.1% VWO, 7.6% XLE | 33.3 | Added 11% | 2020-10-08 | | Bonds | 10% BND, 10% SCHP, 10% ANGL | 29.7 | Reduced 0.1% | 2020-10-02 | | Commodities | GCC | 2.4 | Reduced 2.1%
| 2020-09-04 | | Precious Metals | GDX | 4.6 | Added 5% | 2020-09-09 | | Special Situations | | 0.0 | Reduced 5% | 2020-10-02 | | Cash | | 30.0 | | |
|
Updates (Changes made today are underlined)
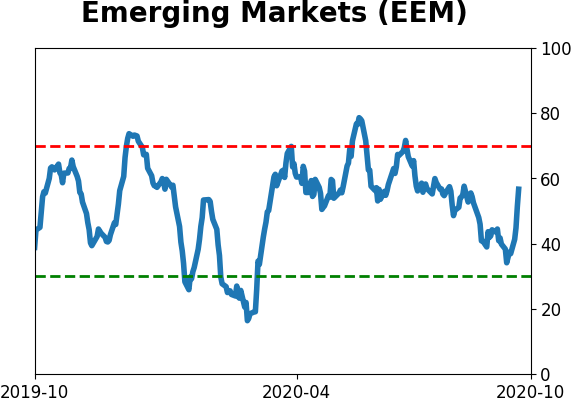
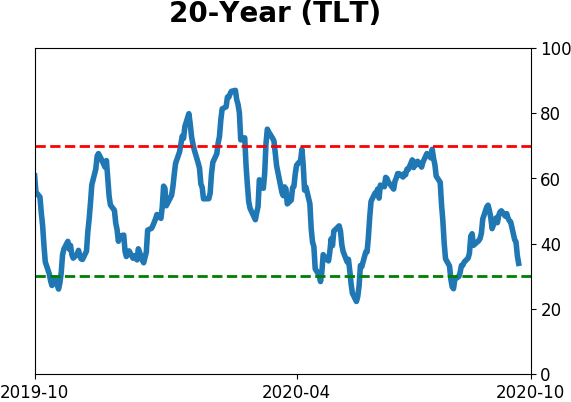
It's been a really mixed picture lately. In stocks, we saw huge momentum and a spike in speculation, then September managed to wring much of that out, except in the options market which is still a worry. There seem to be offsetting positives and negatives, with a mixed market environment, not the kind of setup where I feel comfortable being aggressive. I did add a bit to energy. The older I get, the less interested I am in short-term gyrations, and I don't really care about the coming days or even weeks. I'm fairly confident that the total return will be positive over a longer time frame given some of the developments we've looked in over the past week. With bonds, I decided to swap TLT for ANGL, a high-yield corporate fund with a heavy focus on energy bonds. Hedgers are heavily short 10-year Treasuries, and the high-yield market has held up well internally. I'm not generally a fan of buying into rising prices, but with the internal recovery in emerging markets from a compelling position (here and here), I started a position.
RETURN YTD: -0.4% 2019: 12.6%, 2018: 0.6%, 2017: 3.8%, 2016: 17.1%, 2015: 9.2%, 2014: 14.5%, 2013: 2.2%, 2012: 10.8%, 2011: 16.5%, 2010: 15.3%, 2009: 23.9%, 2008: 16.2%, 2007: 7.8%
|
|
Phase Table
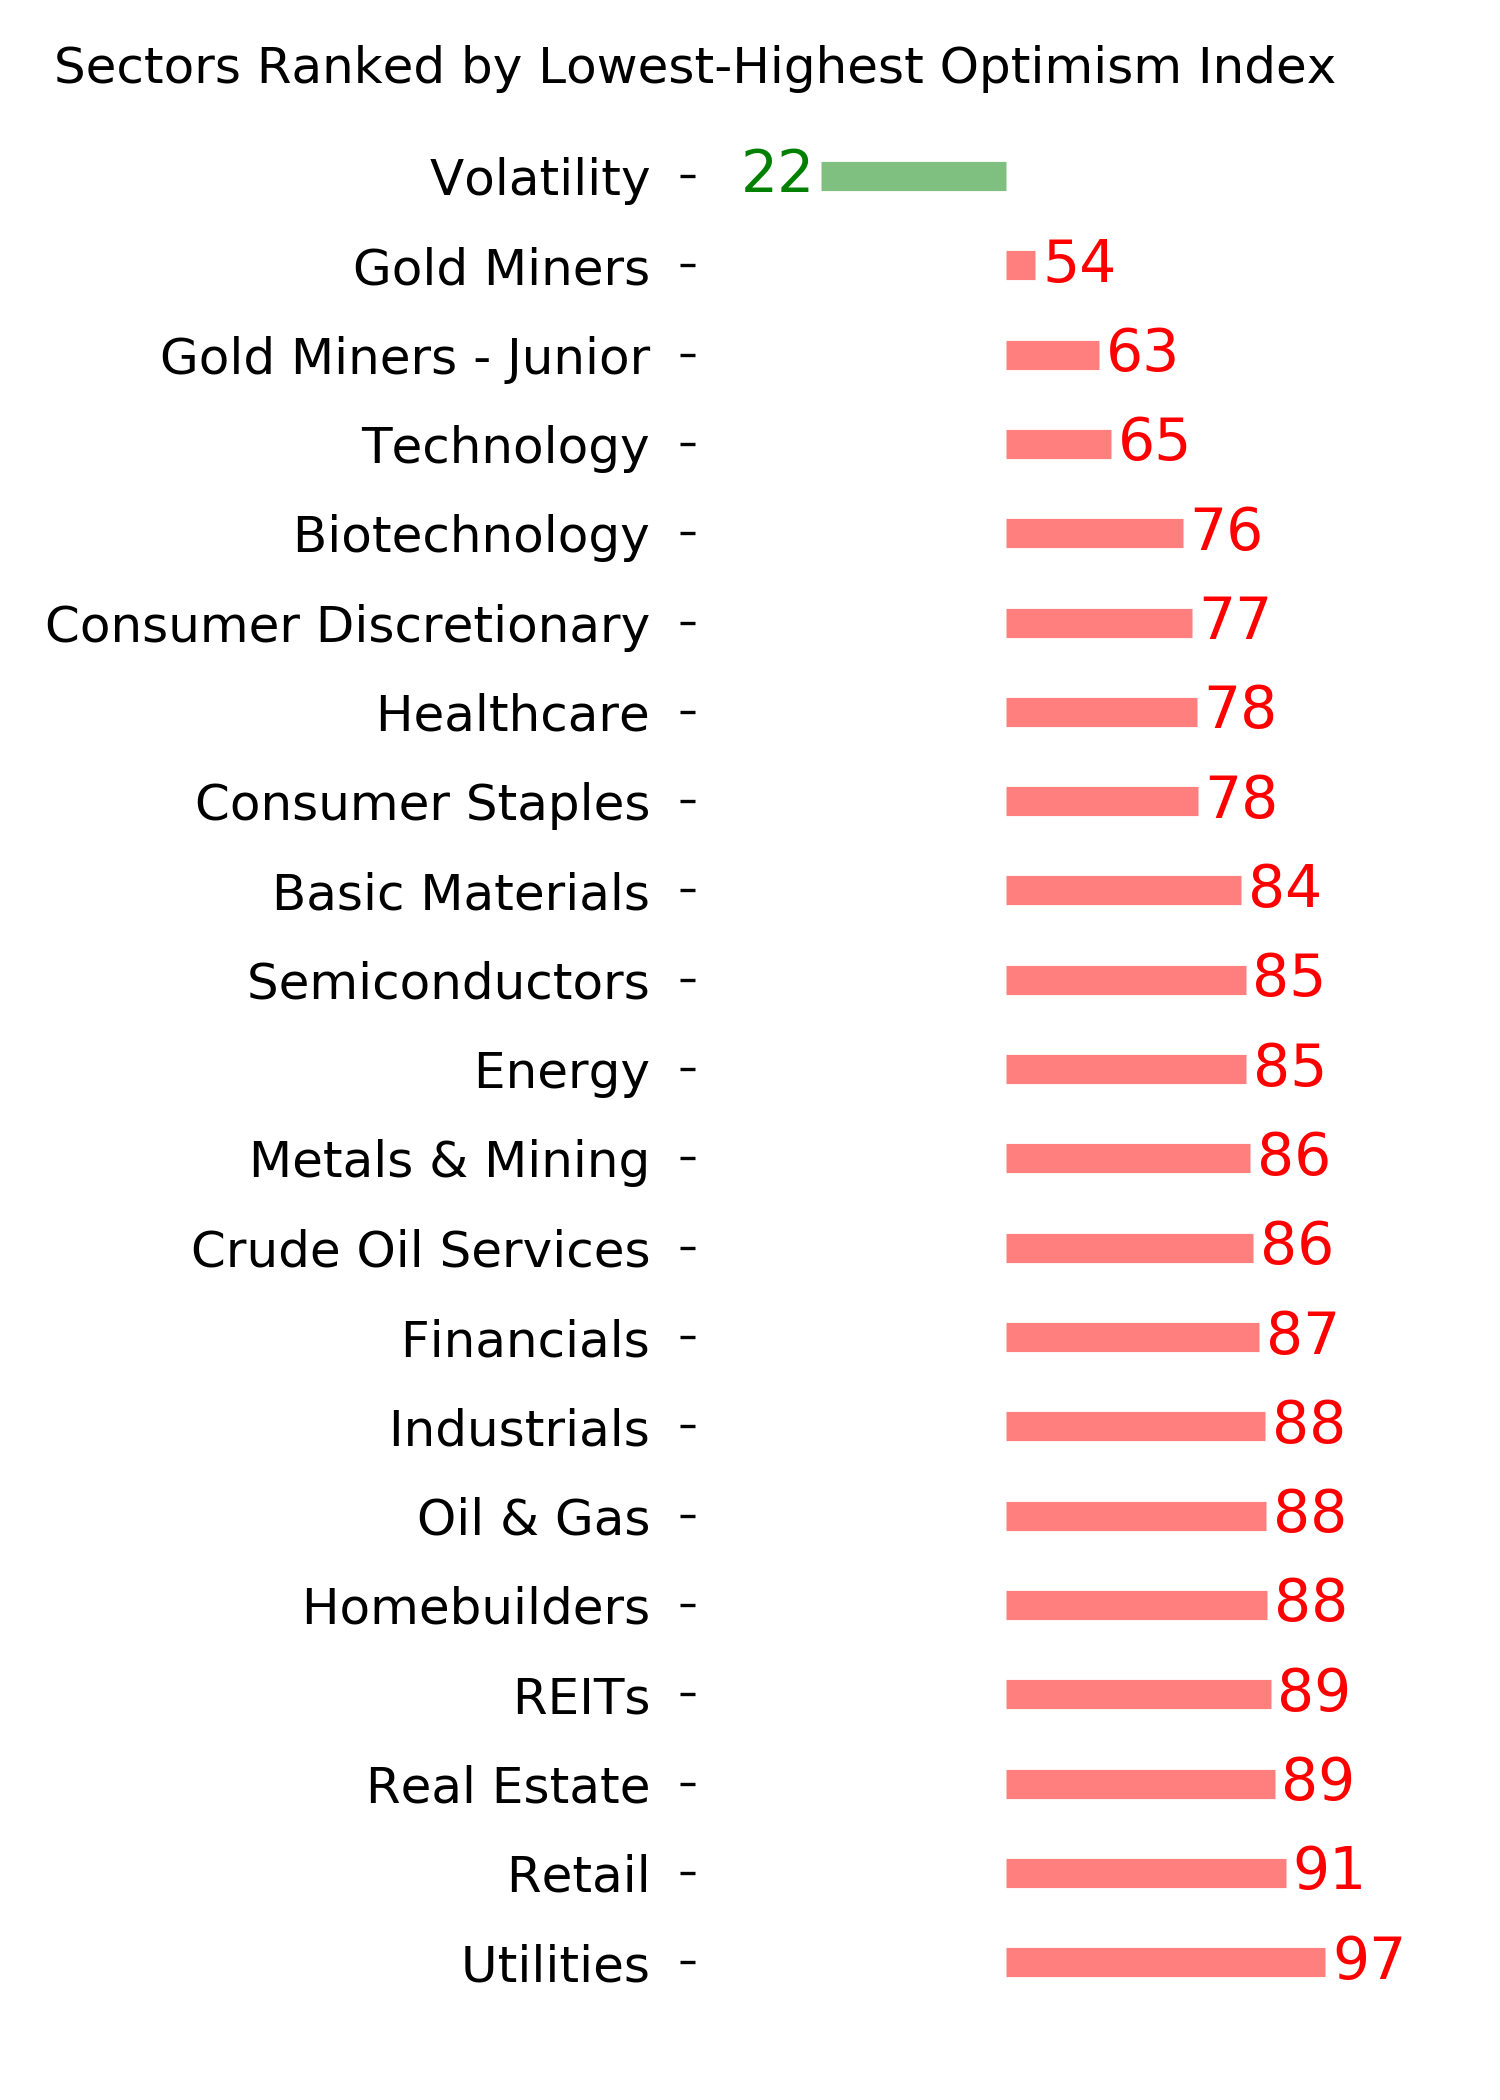
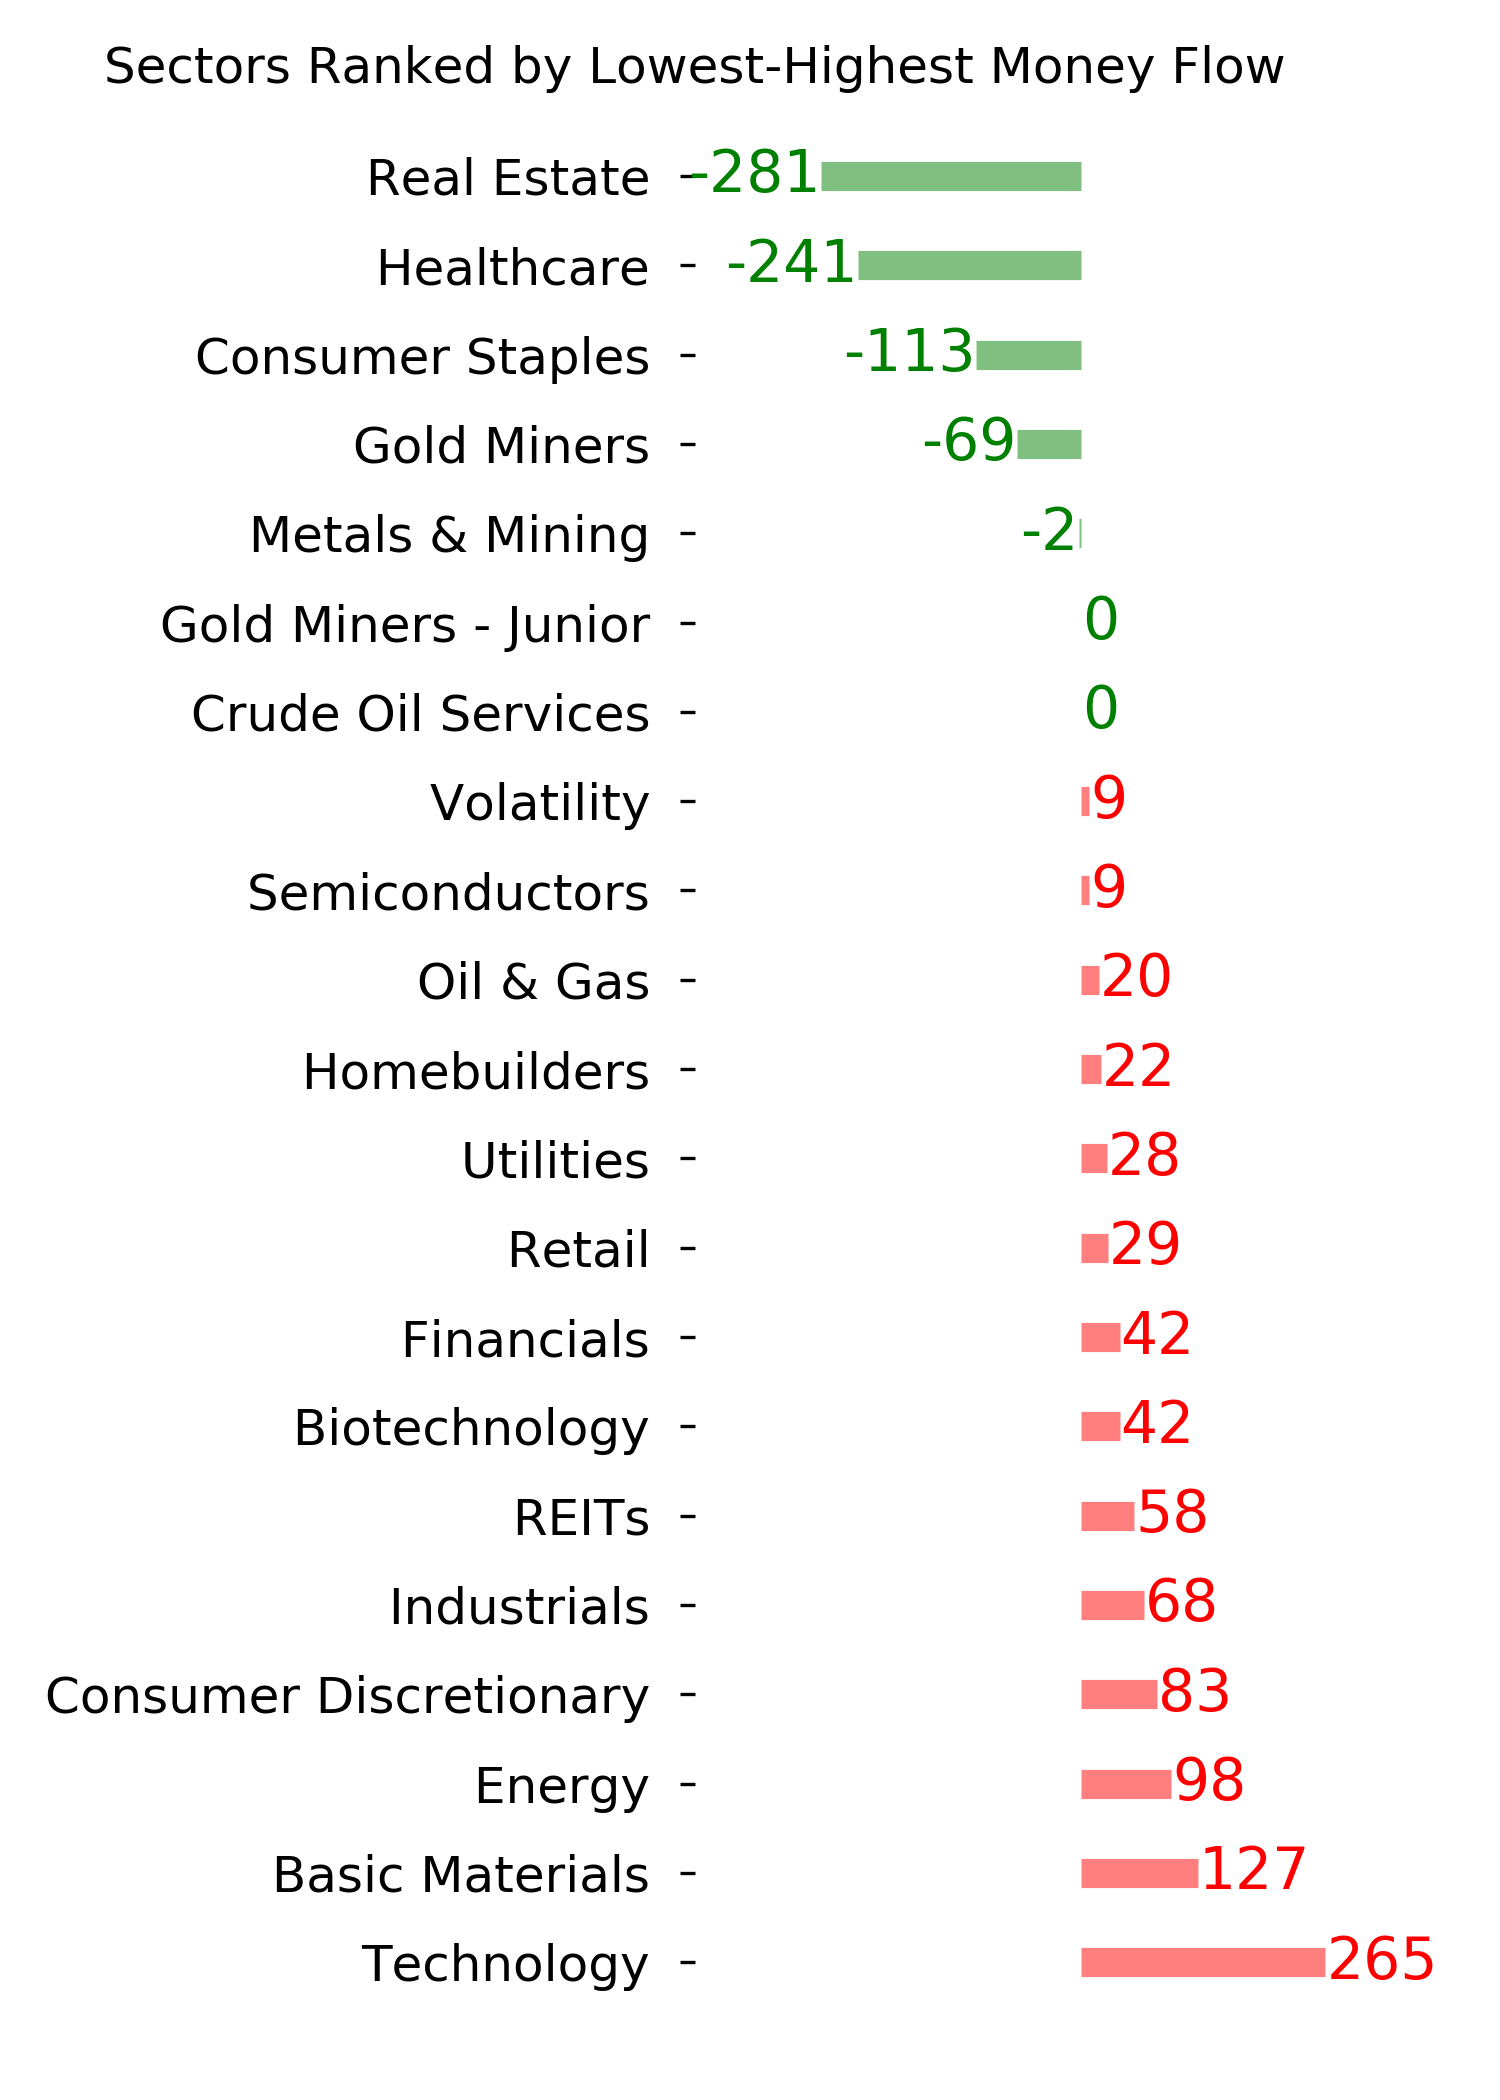
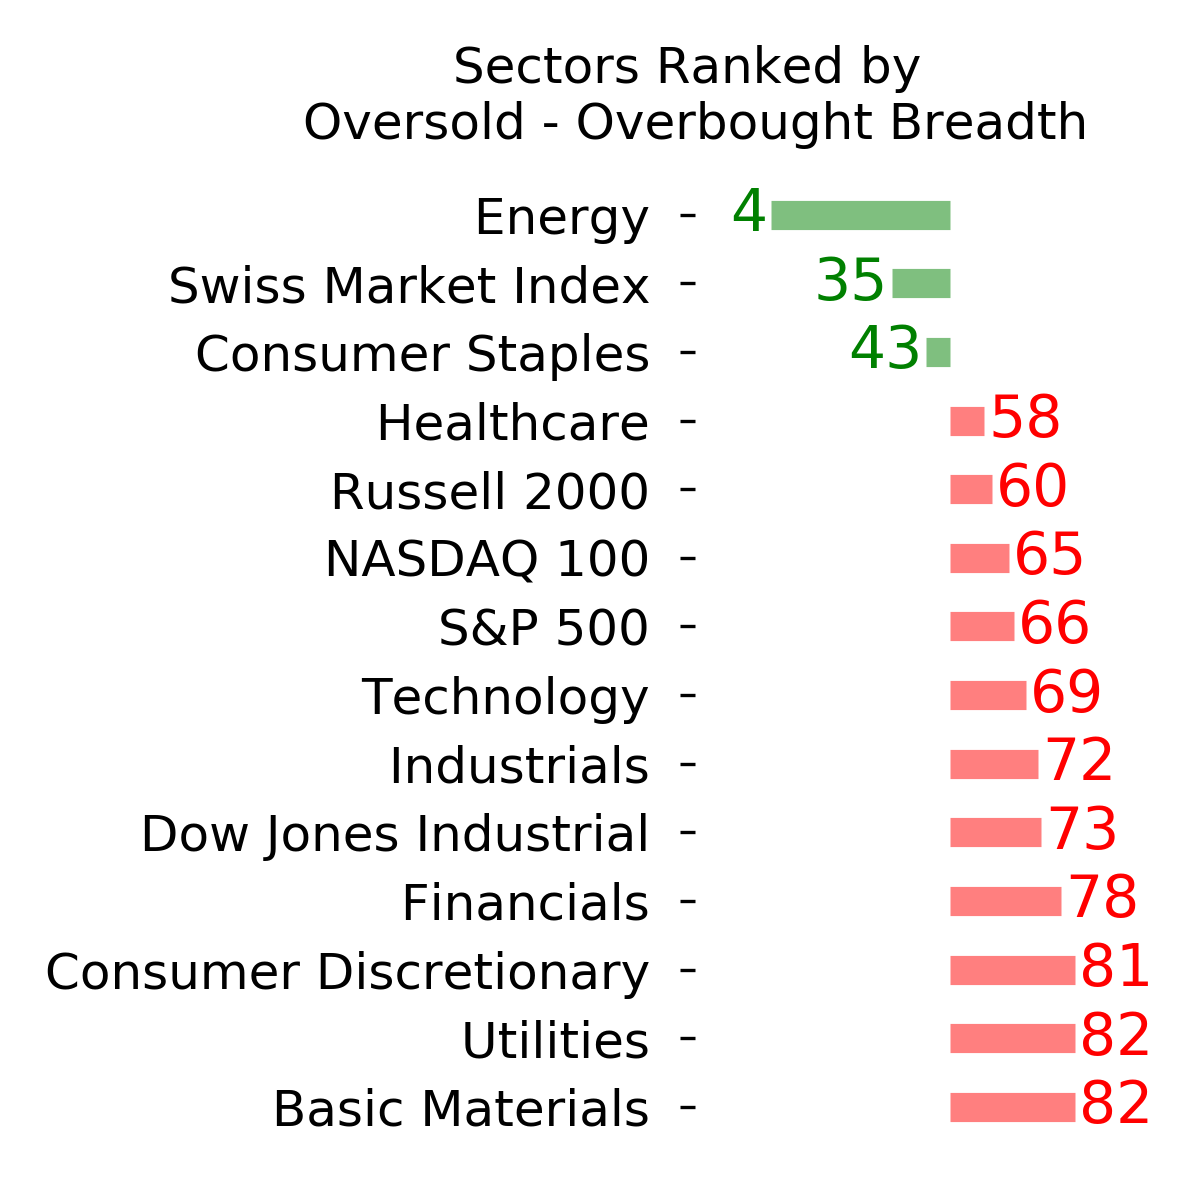
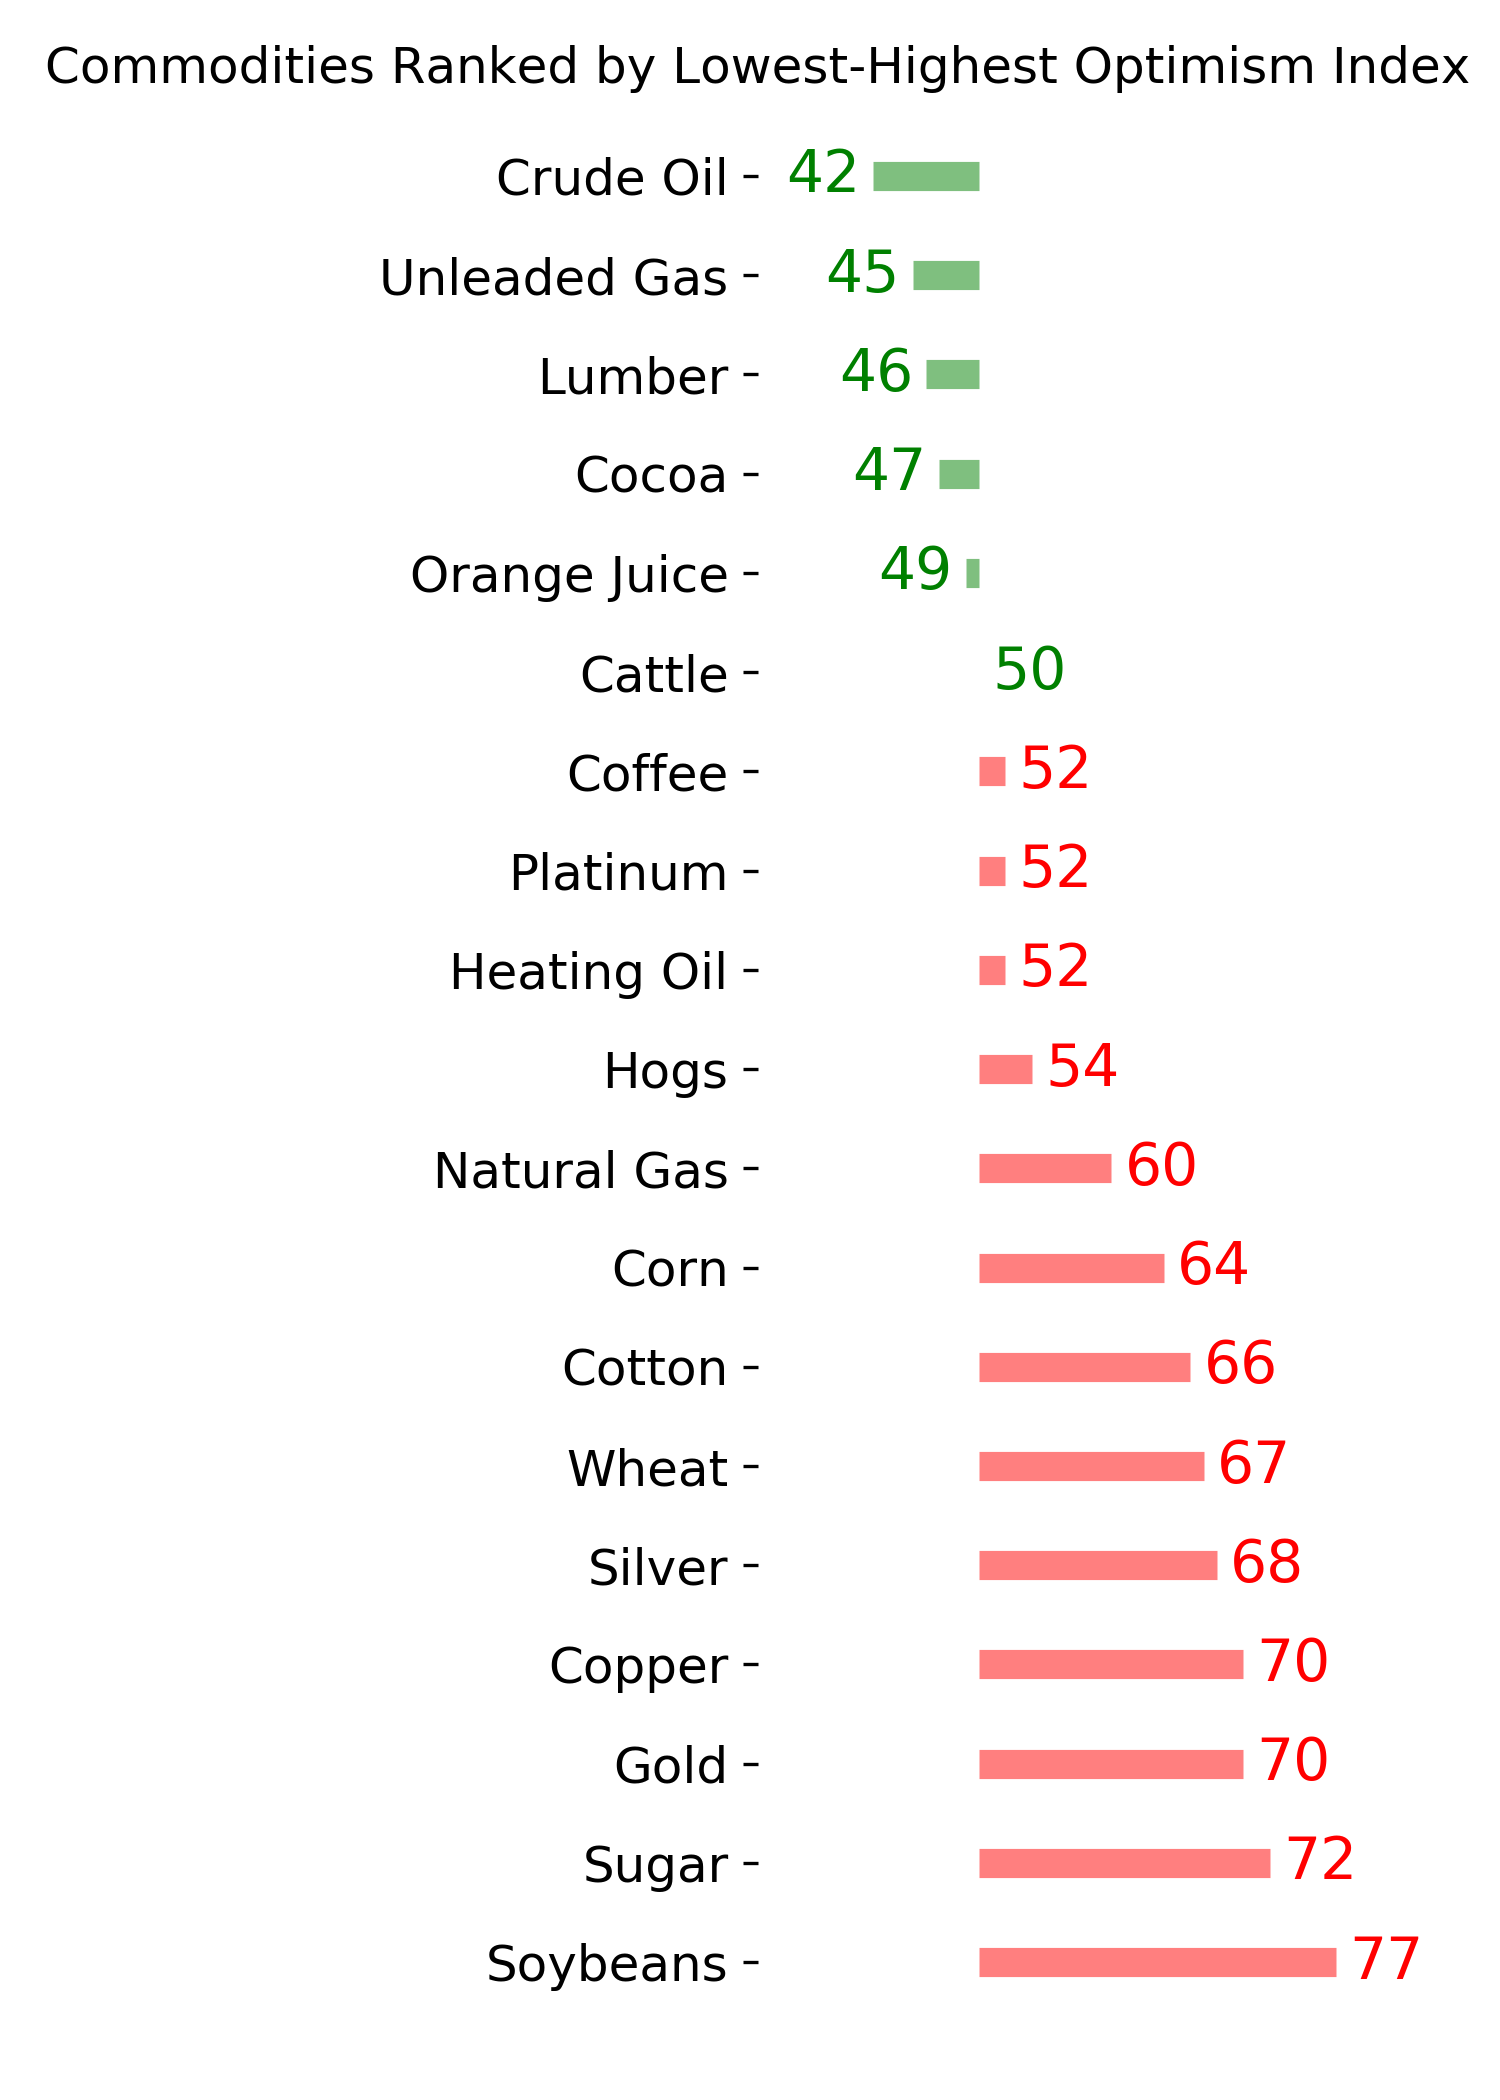
Ranks
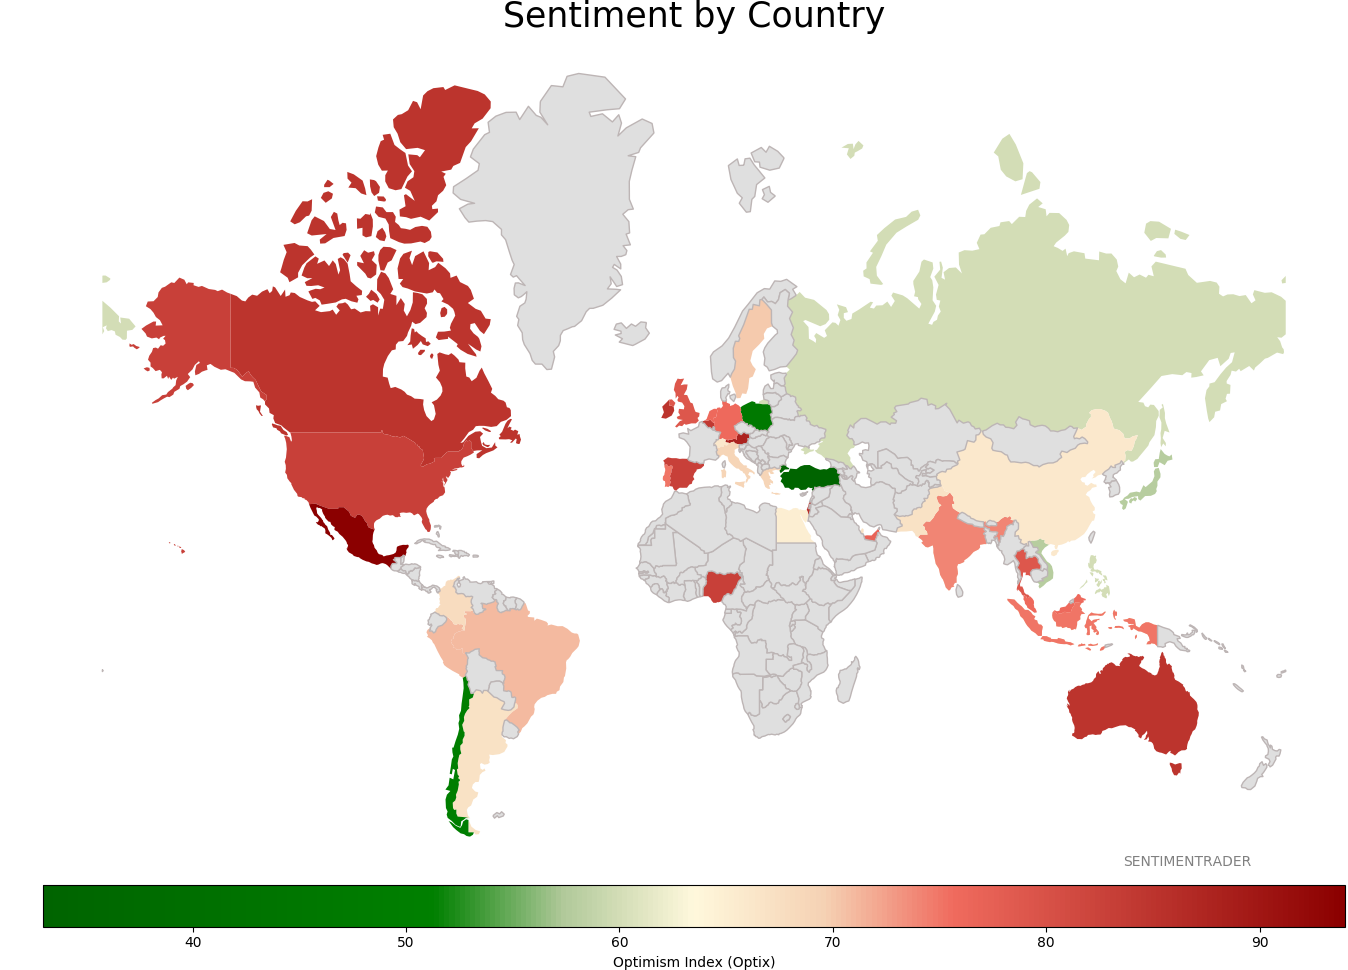
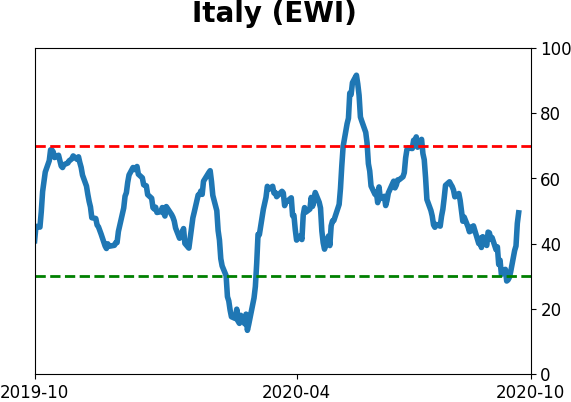
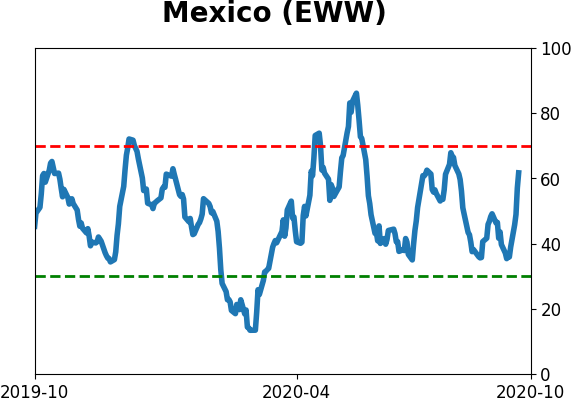
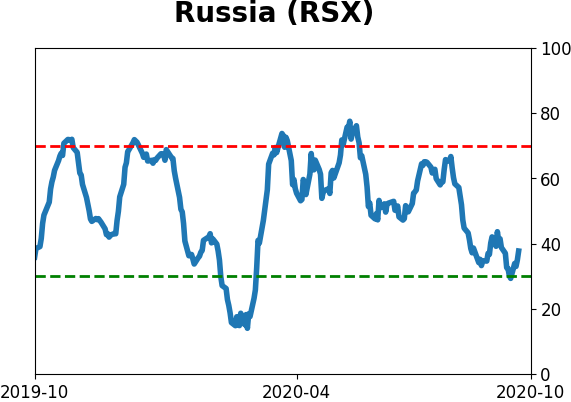
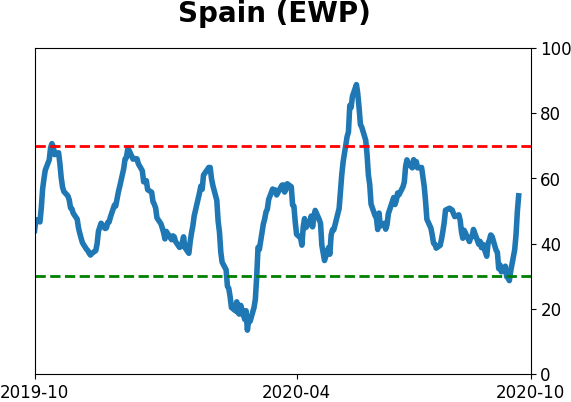
Sentiment Around The World
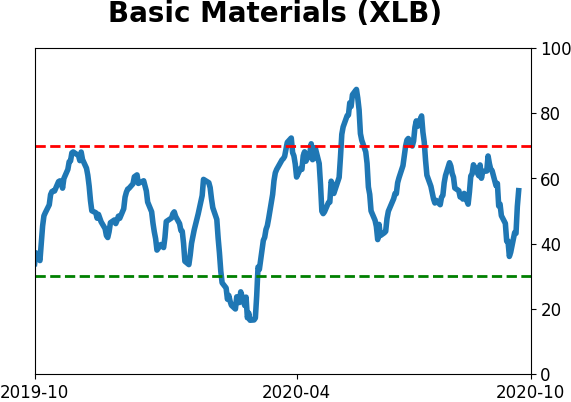
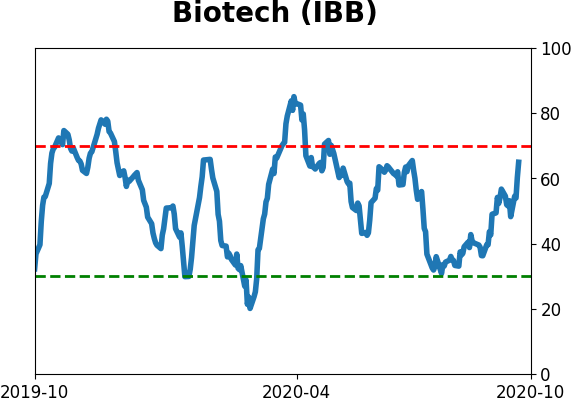
Optimism Index Thumbnails
|
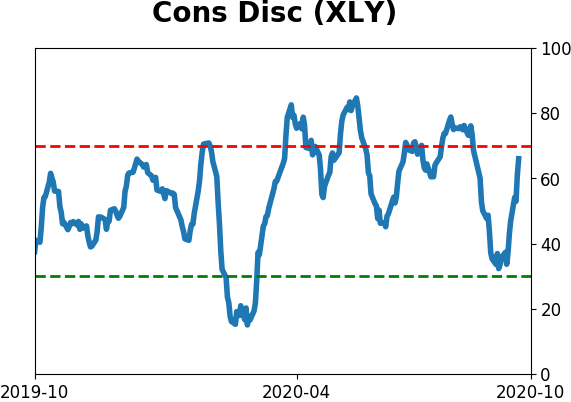
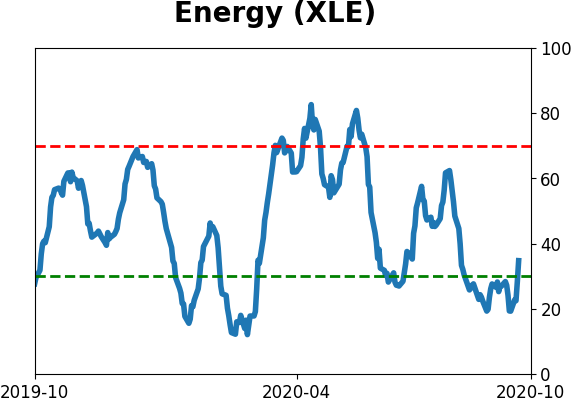
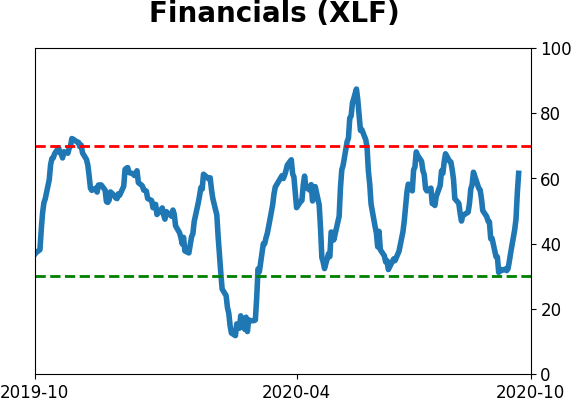
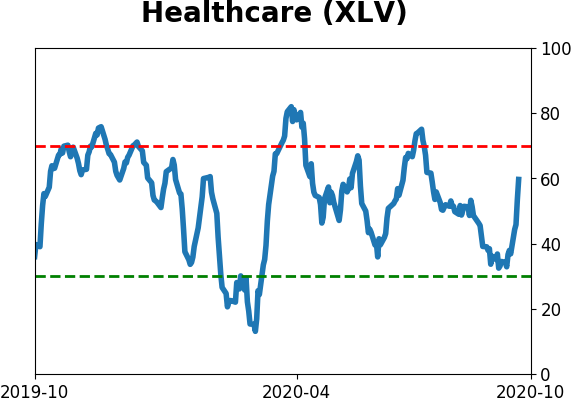
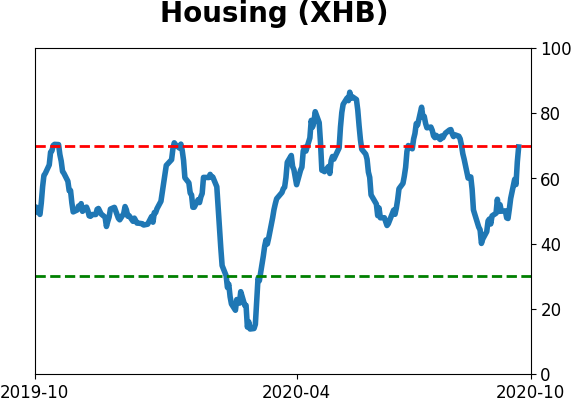
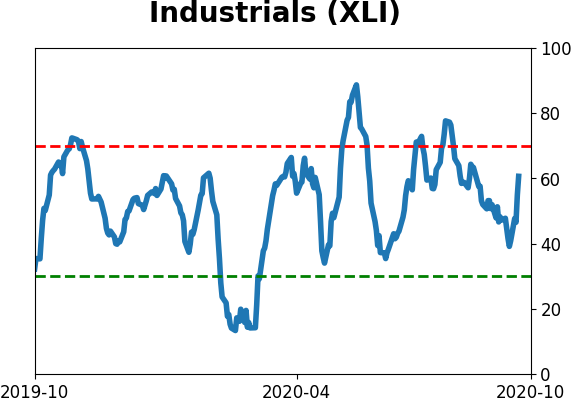
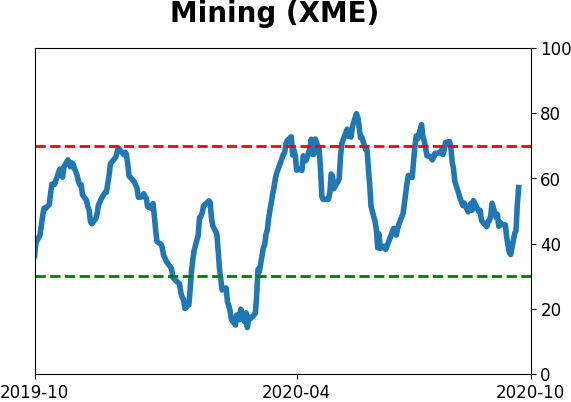
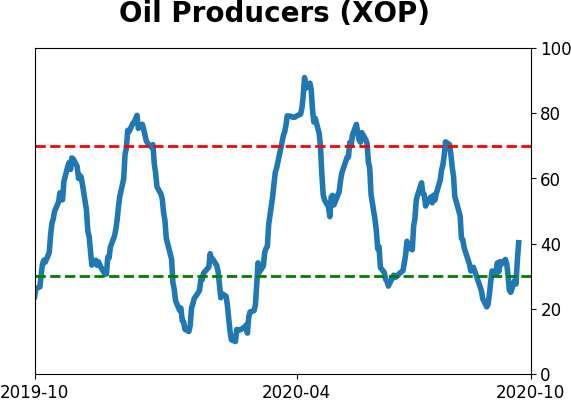
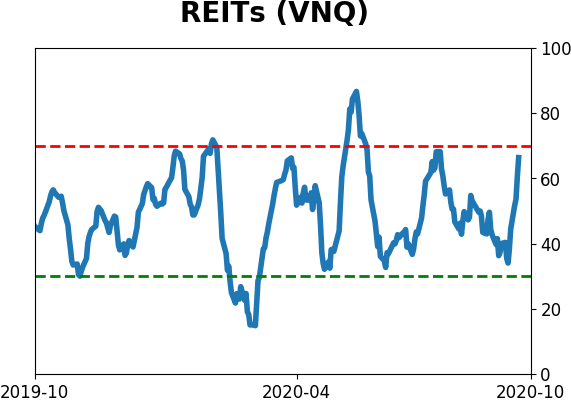
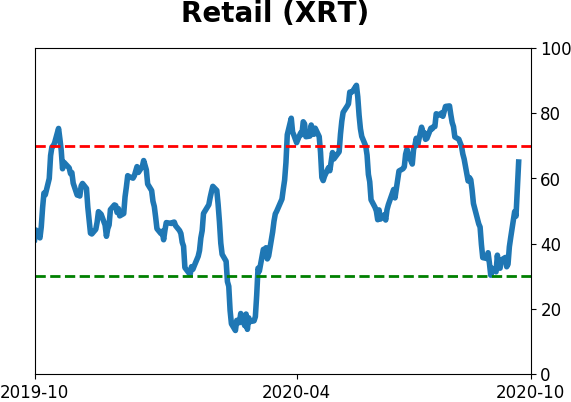
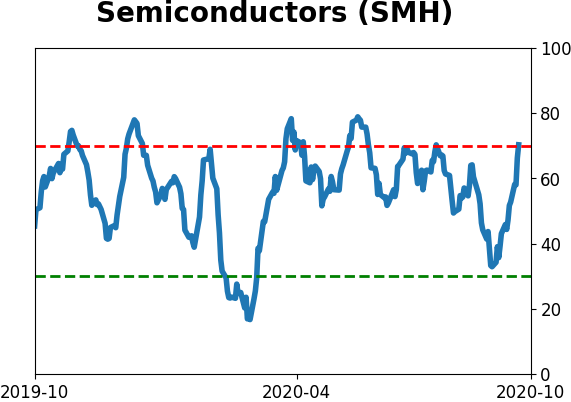
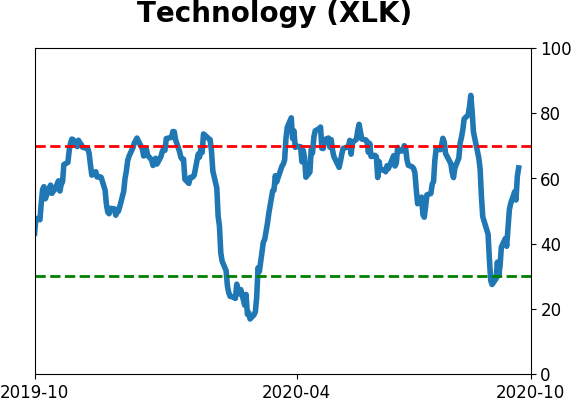
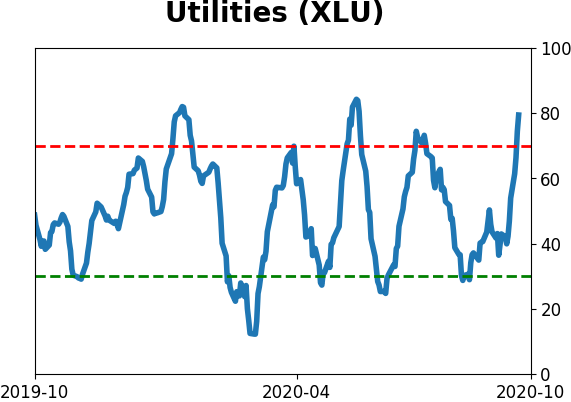
Sector ETF's - 10-Day Moving Average
|
|
|
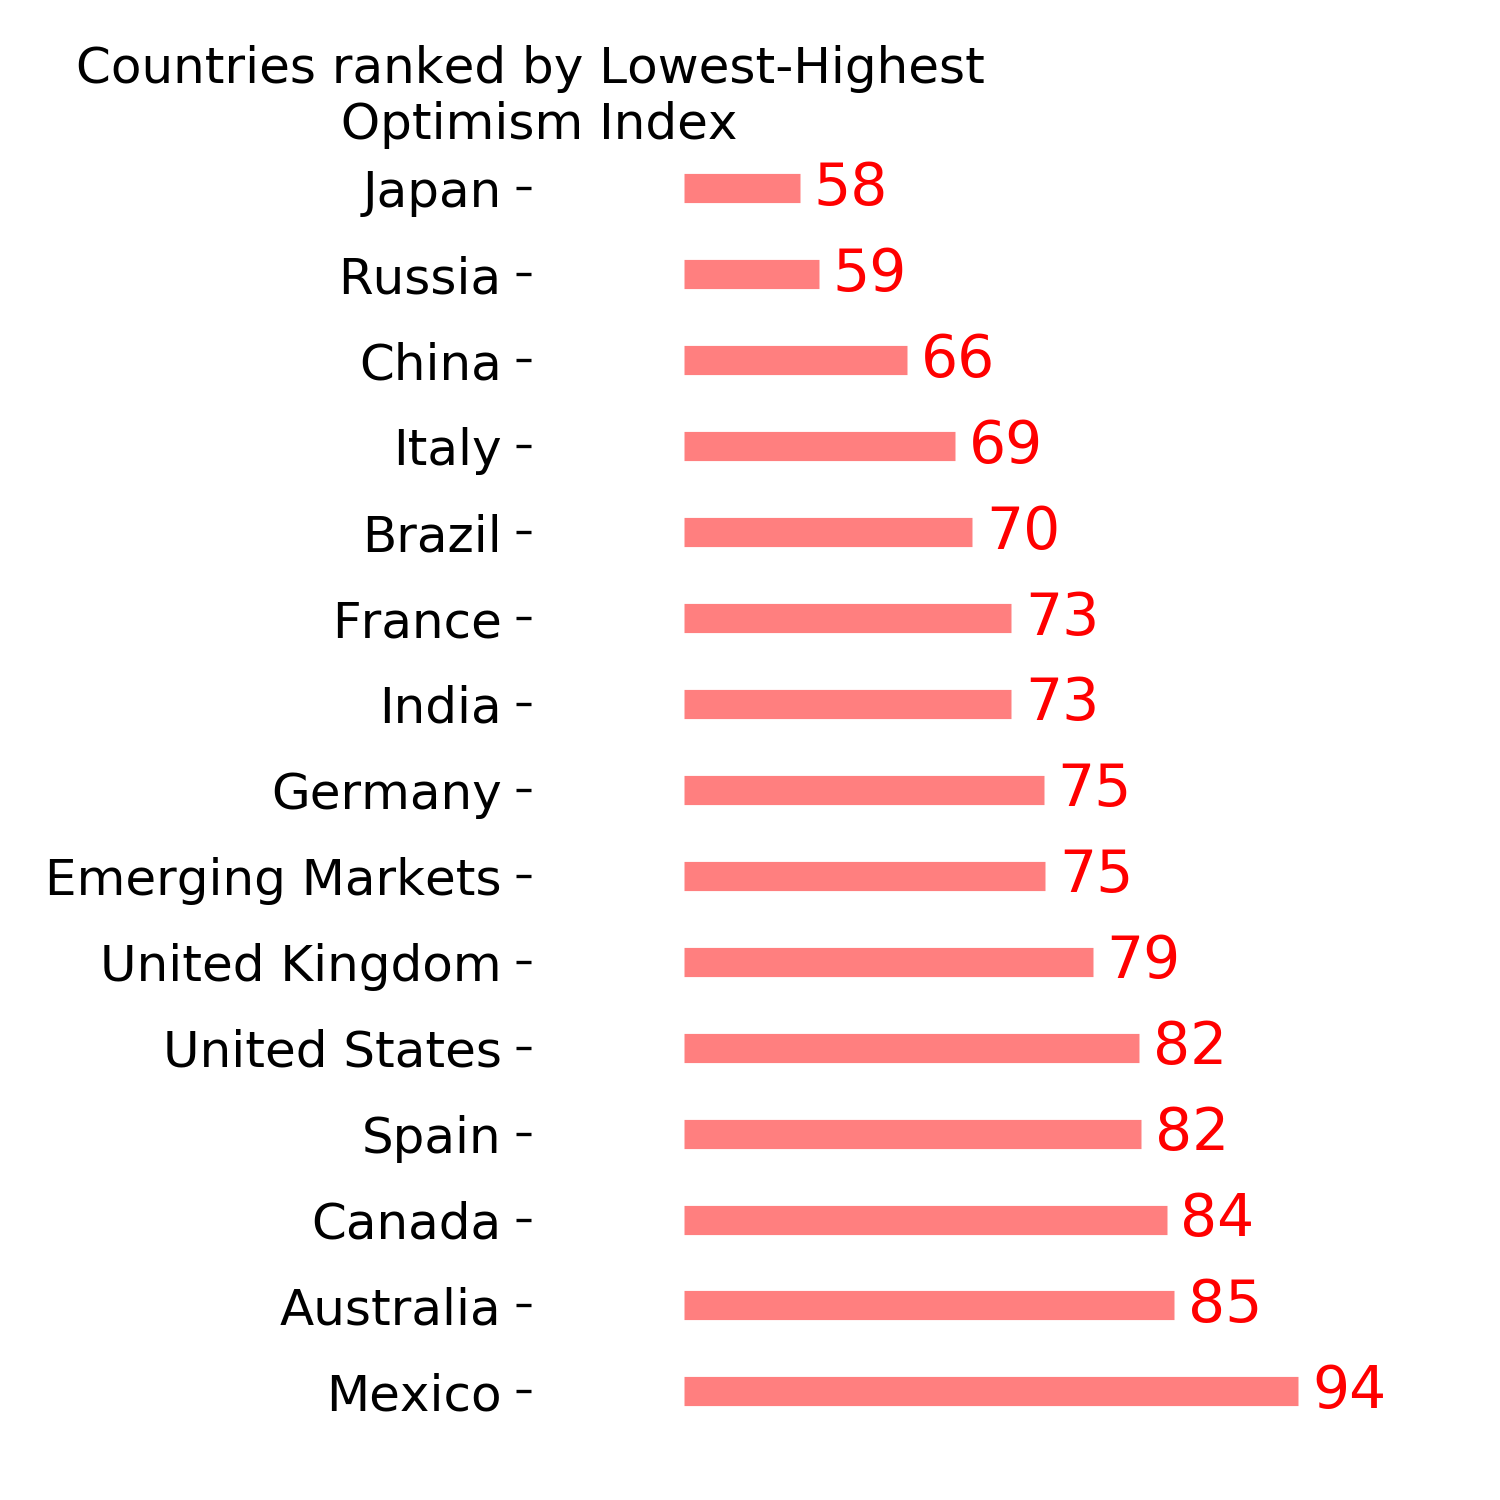
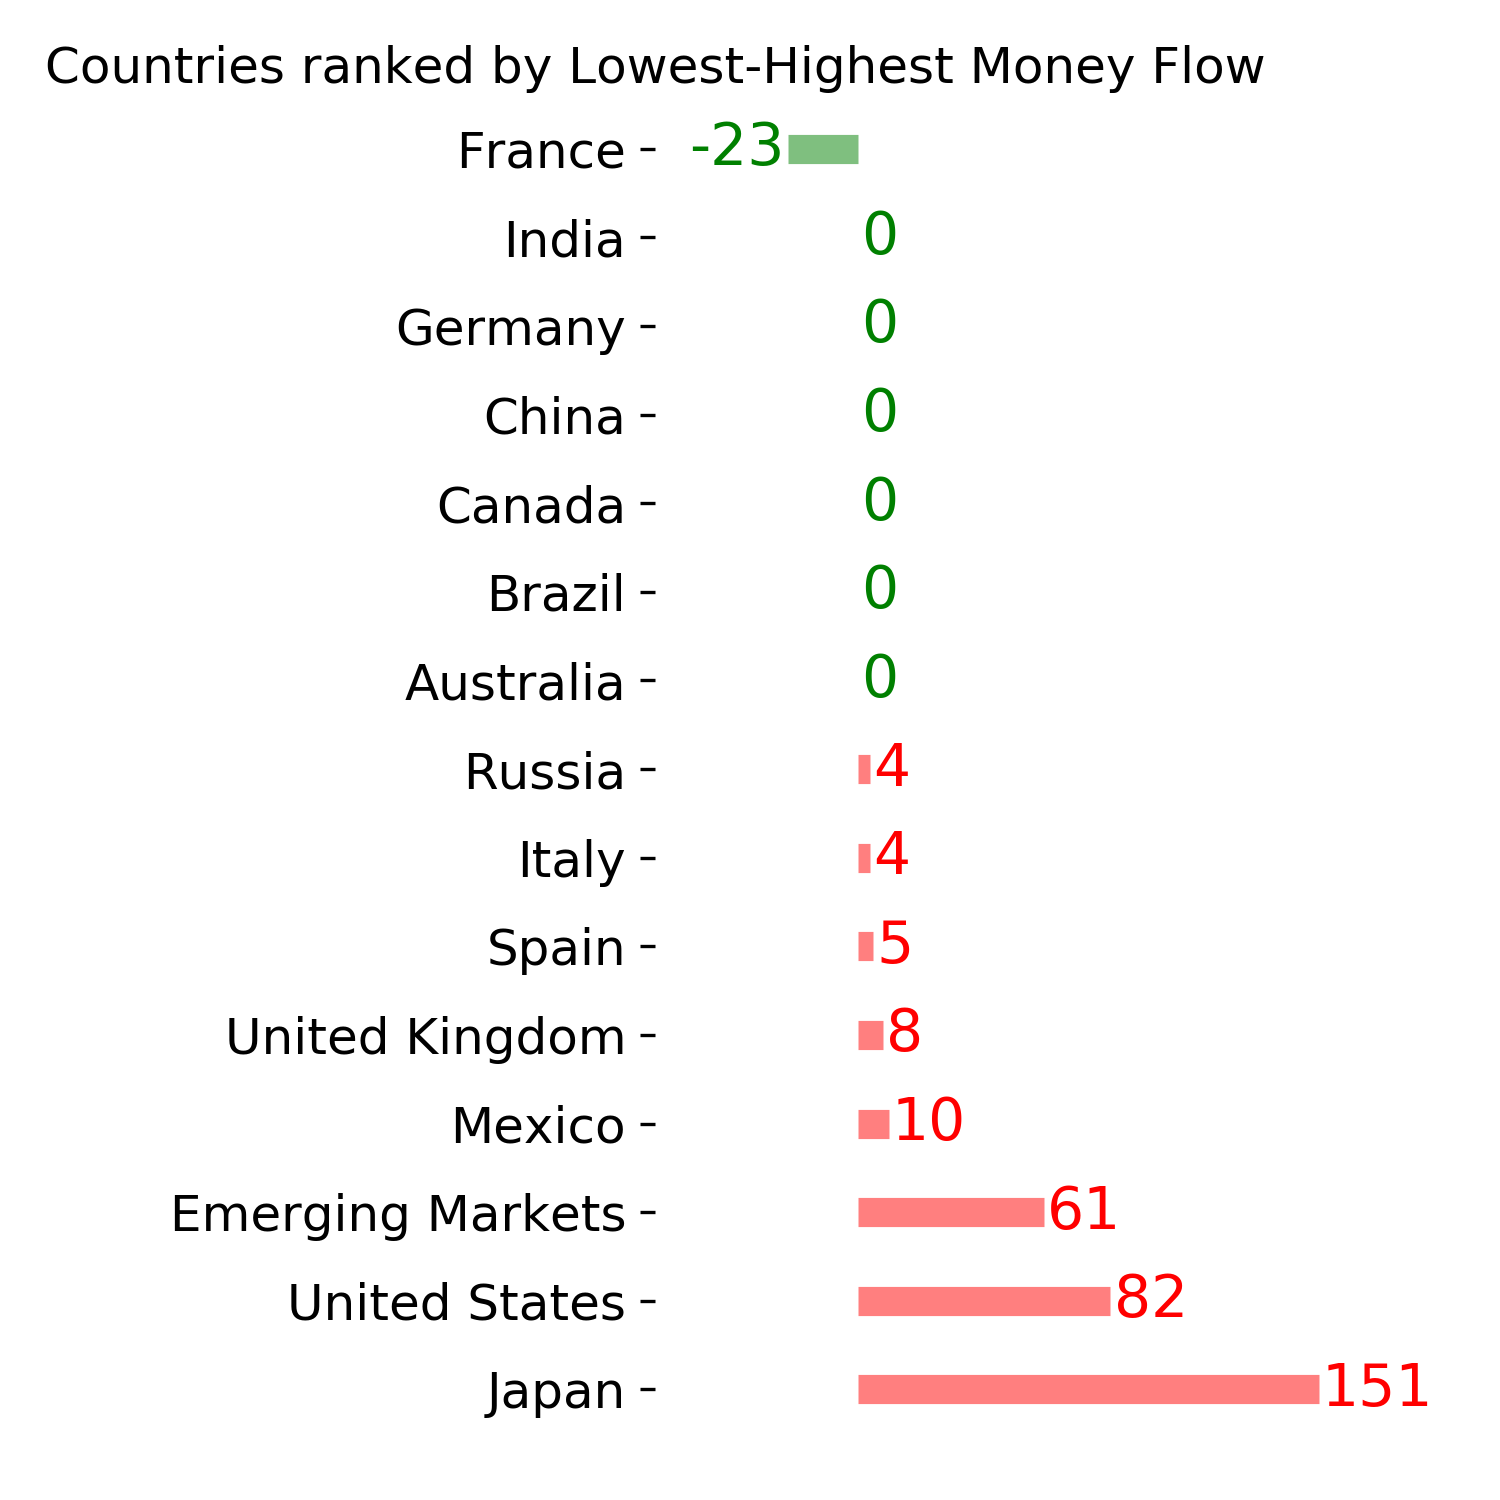
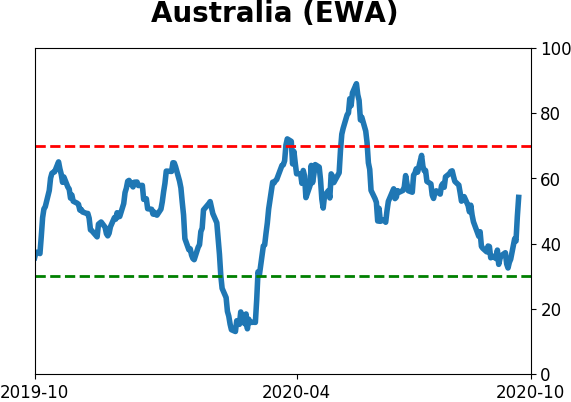
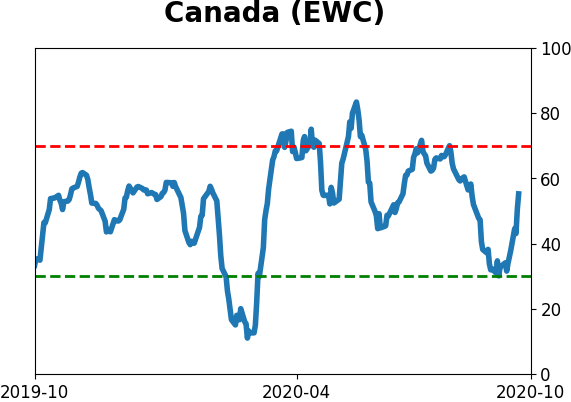
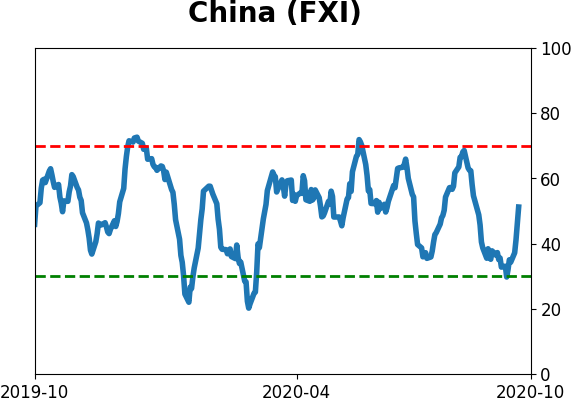
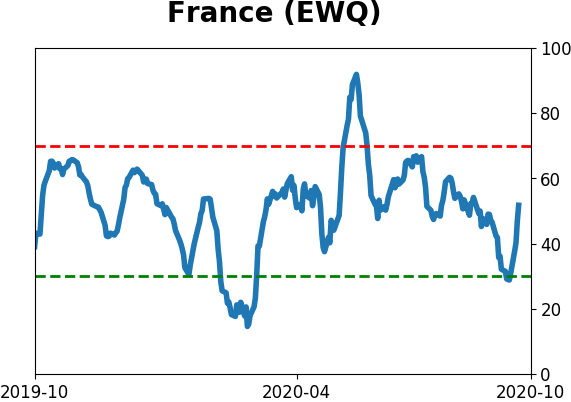
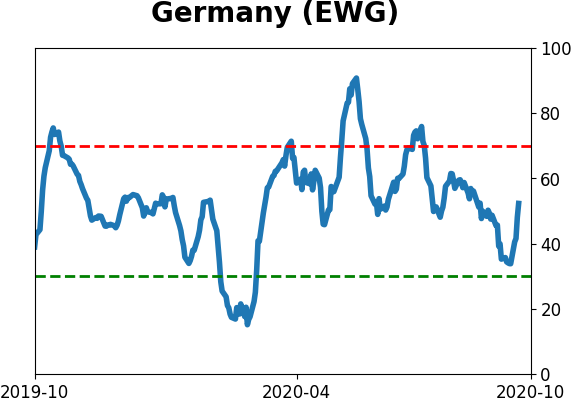
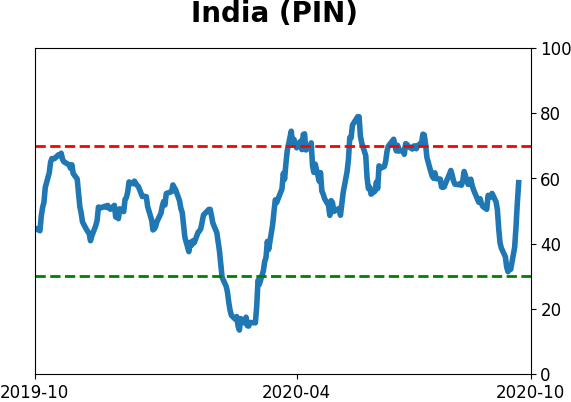
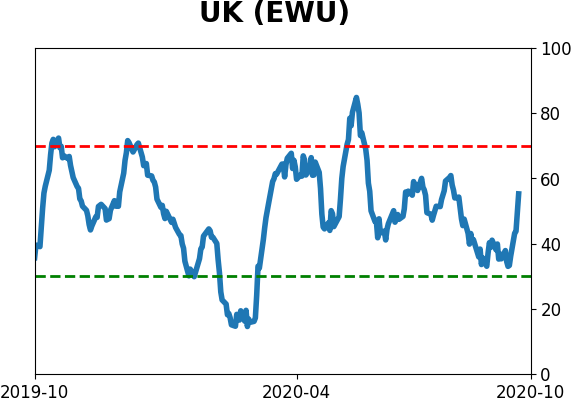
Country ETF's - 10-Day Moving Average
|
|
|
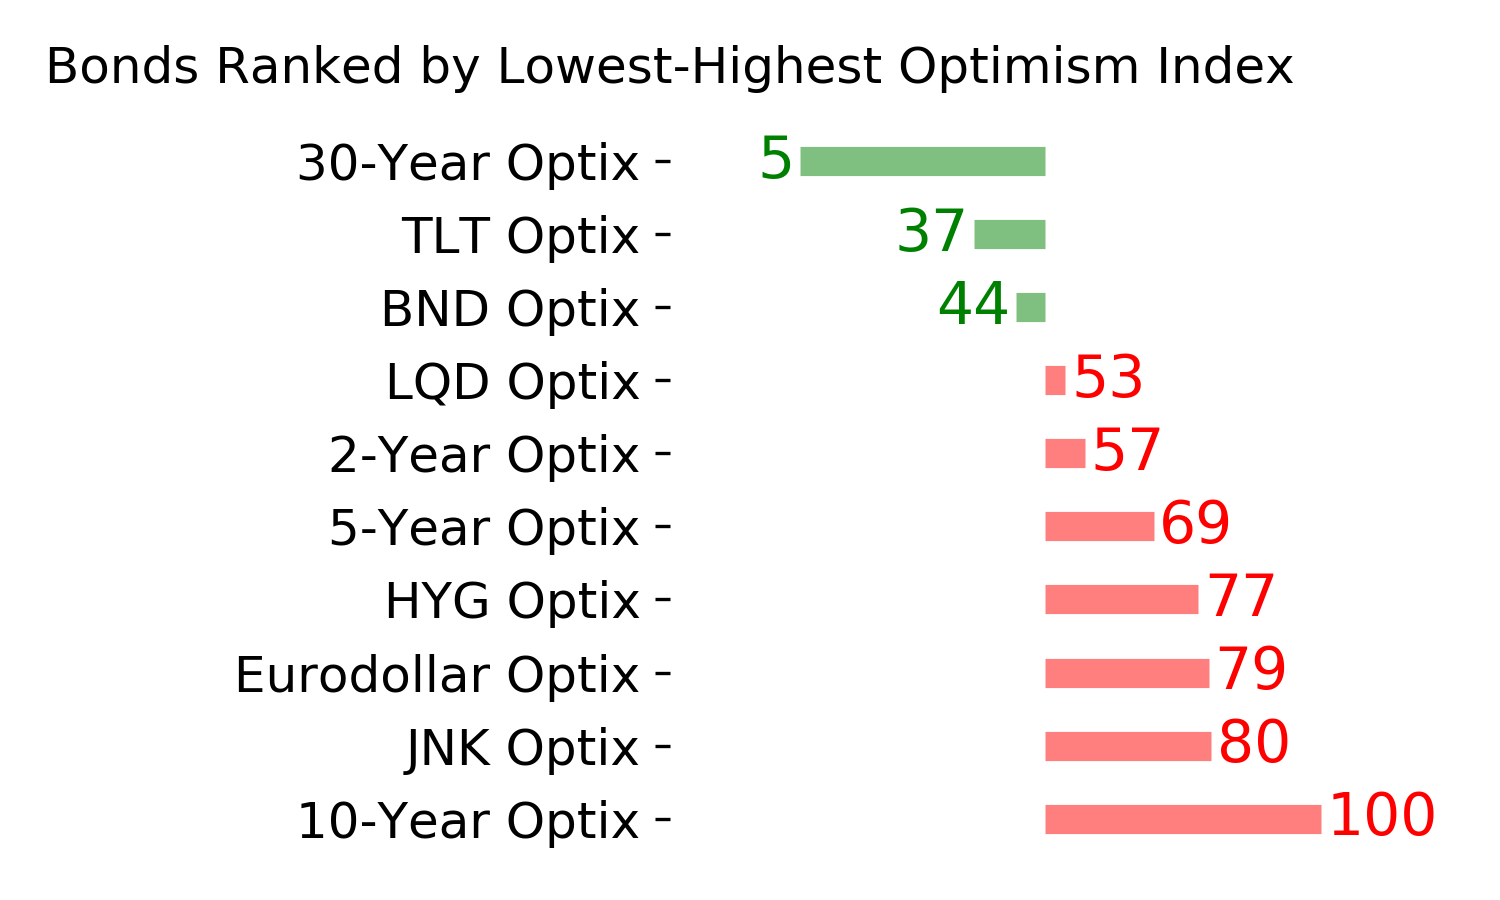
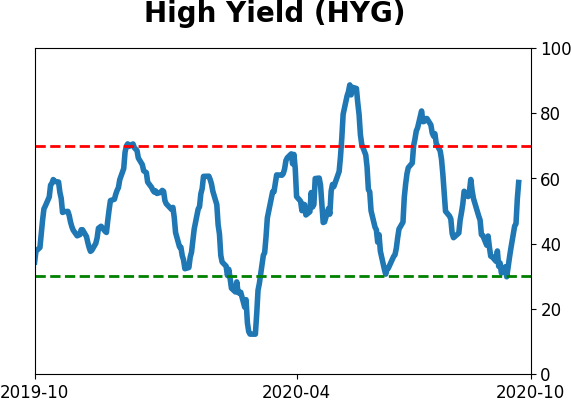
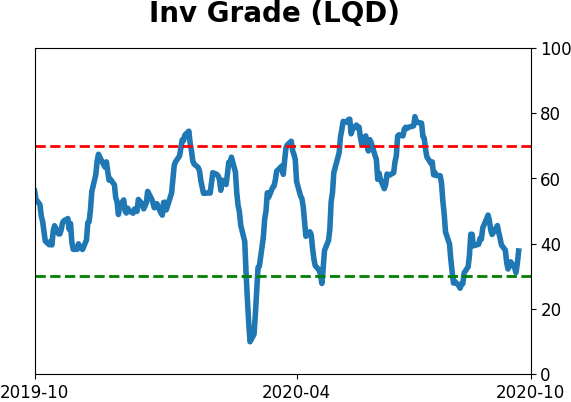
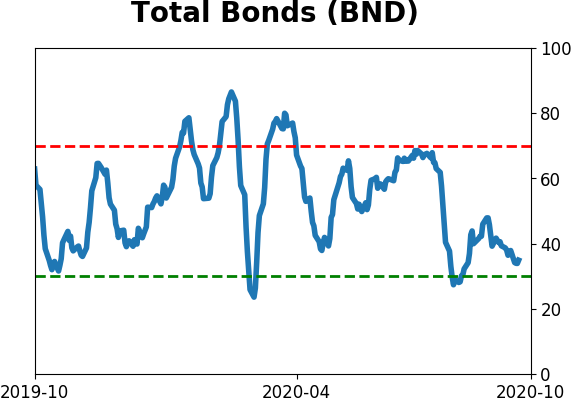
Bond ETF's - 10-Day Moving Average
|
|
|
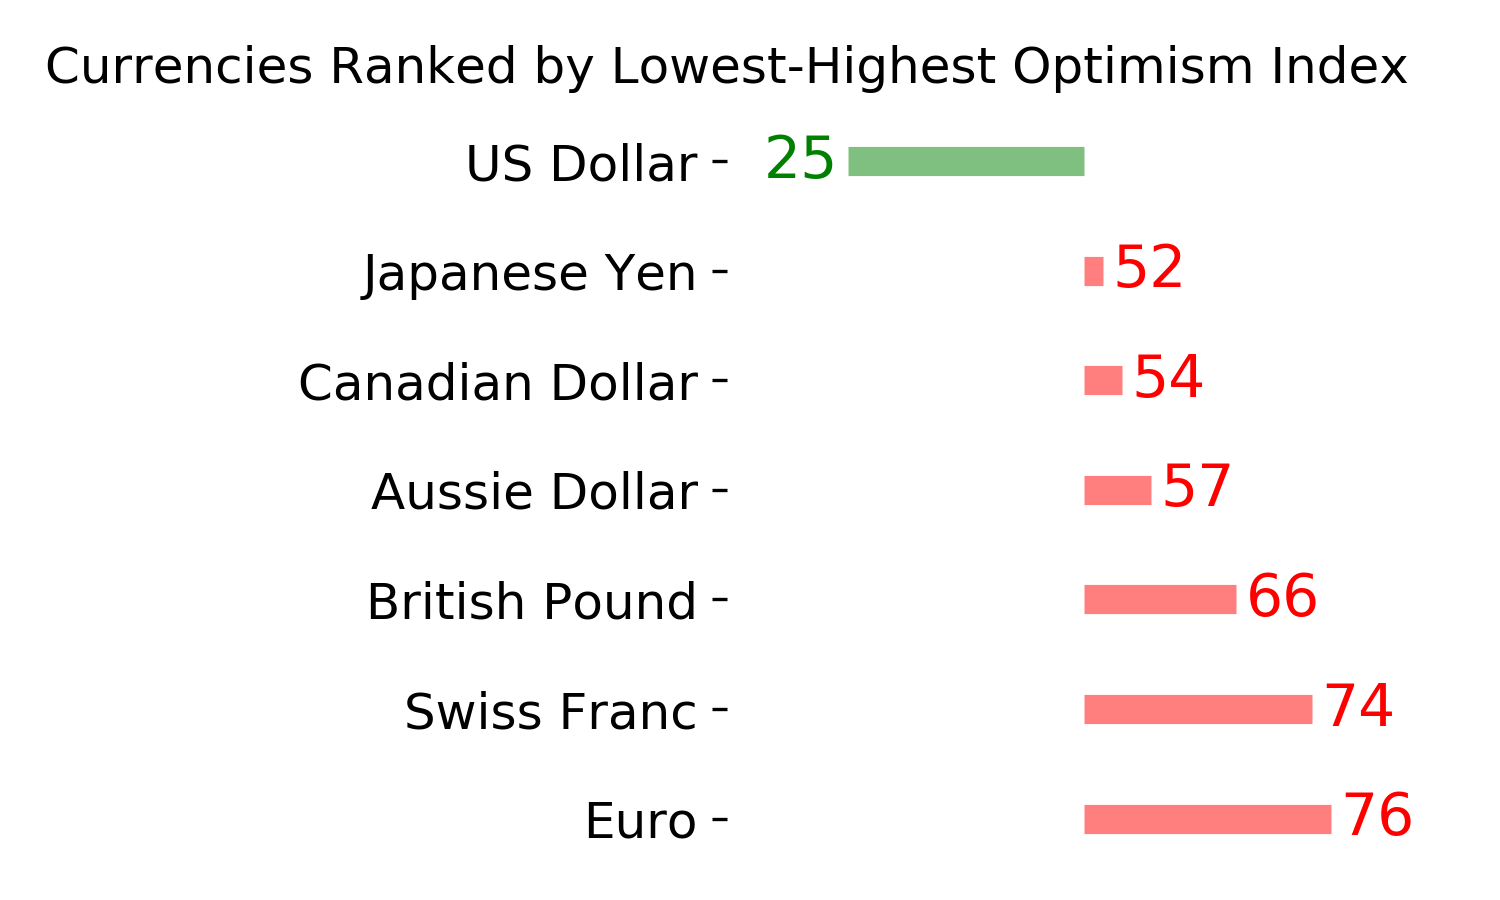
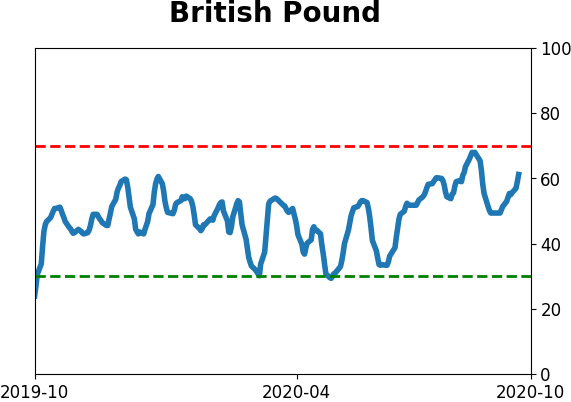
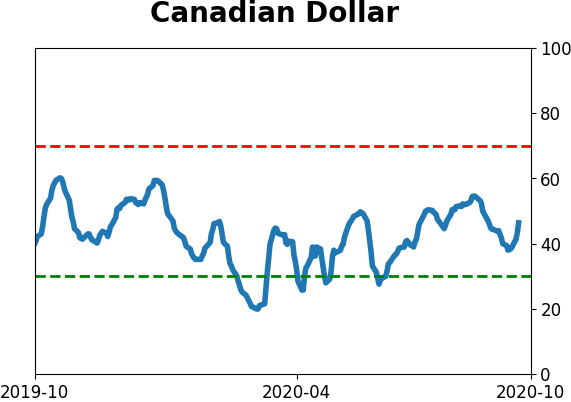
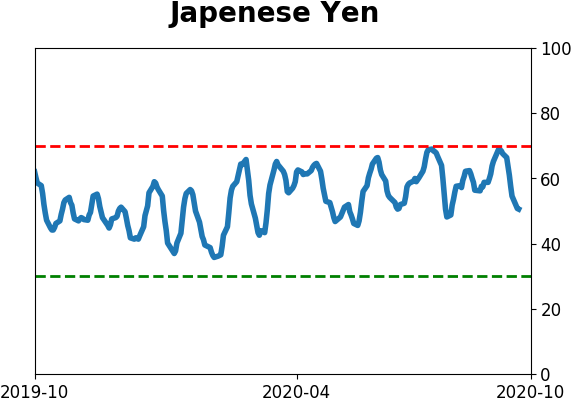
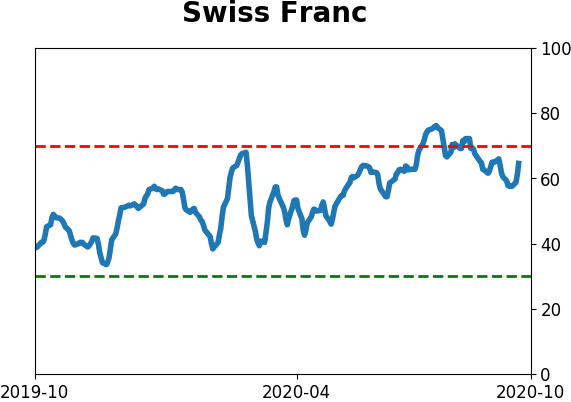
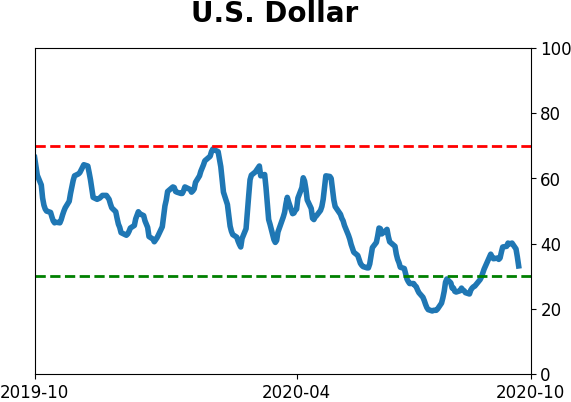
Currency ETF's - 5-Day Moving Average
|
|
|
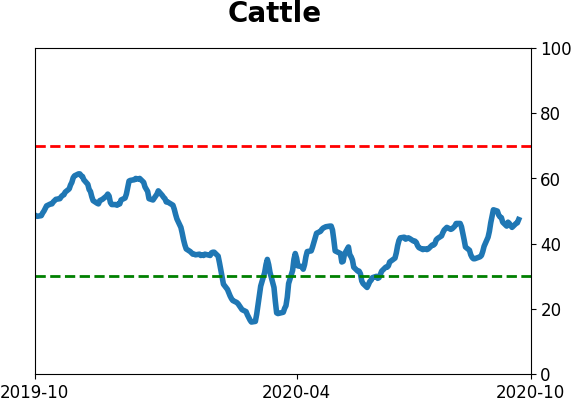
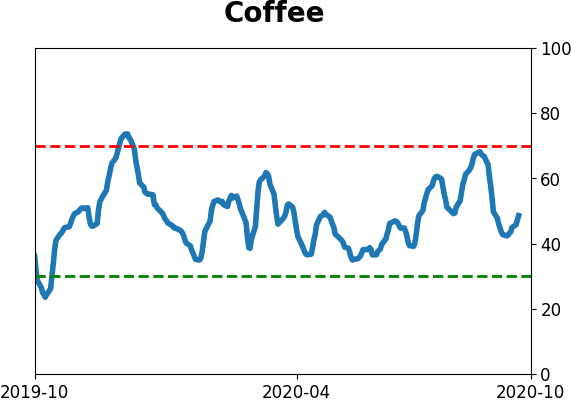
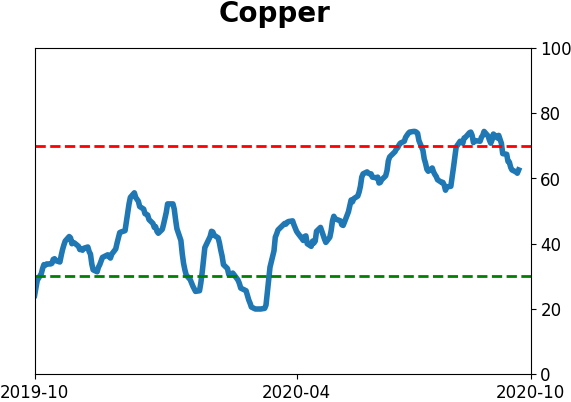
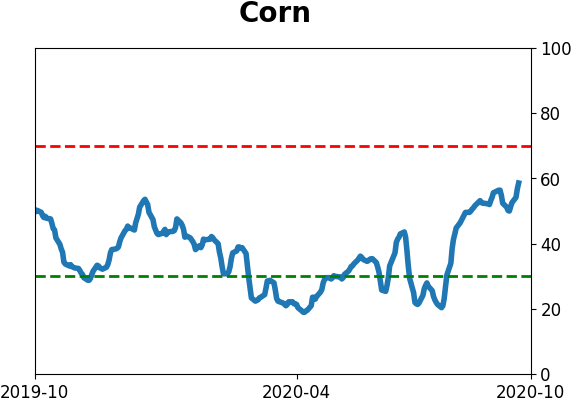
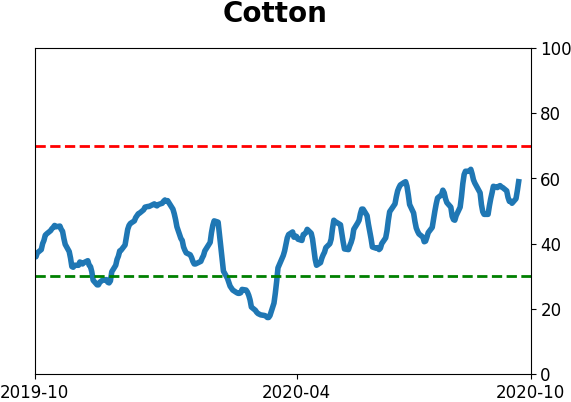
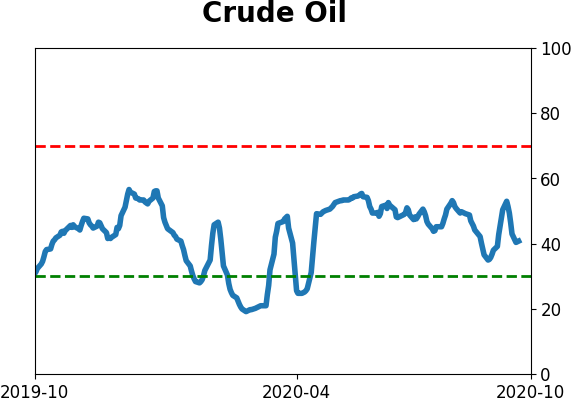
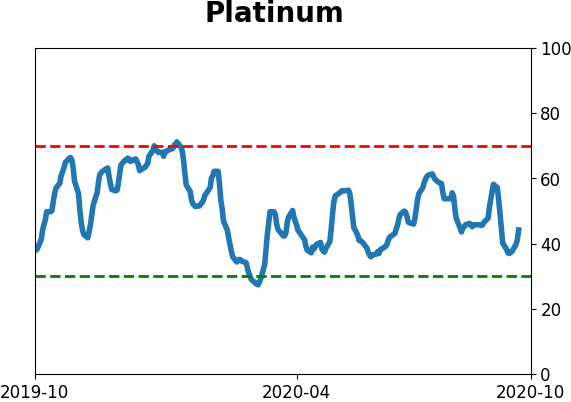
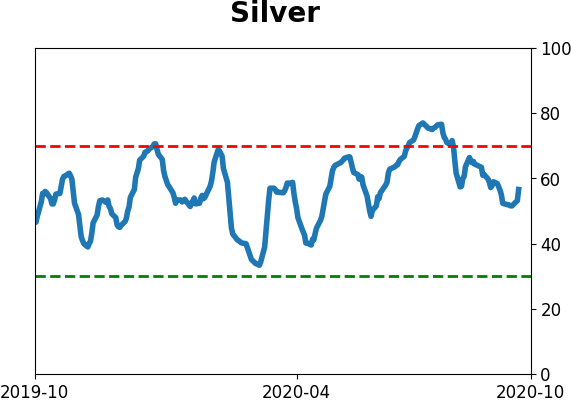
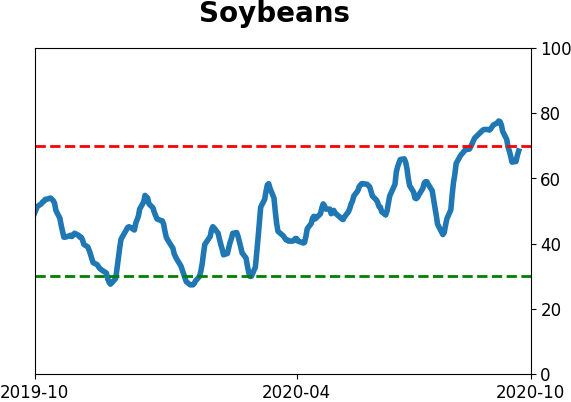
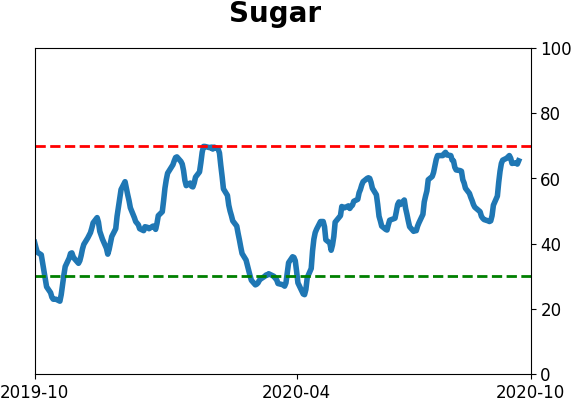
Commodity ETF's - 5-Day Moving Average
|
|