Headlines
|
|
Utilities strength:
Utility stocks have rallied in recent days, accompanied by a surge in breadth. ETF traders have been fleeing, but corporate insiders have never had fewer sales among companies in the sector. These kinds of developments have usually been a shorter-term negative and longer-term positive.
World woes: Fund investors have had a thing against overseas mutual funds and ETFs for months and it's not letting up. Outflows over a 12-week period neared a record low in May, and investors don't seem to be regretting their decisions. According to the Investment Company Institute, investors pulled more than $10.9 billion from these funds in the week ended September 30. That's the 2nd-largest outflow since at least 2006, slightly eclipsed by the week ending October 15, 2008. Over the past 26 weeks, investors have pulled $104 billion, surpassing the 6-month outflow ending in March 2009 of "only" $81.9 billion.
Bottom Line:
- A mixed environment favors becoming defensive if optimism is high and aggressive if low; currently, there is conflicting evidence but would slightly favor becoming more aggressive should optimistic extremes recede further
| Other Sectors and Assets |
| | Positives | Negatives | | 1. Energy (here and here) | 1. Skewed tech (here and here) |
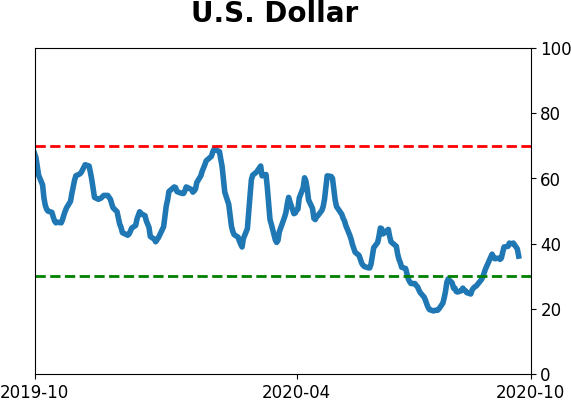
| 2. Dollar test |
|
Smart / Dumb Money Confidence
|
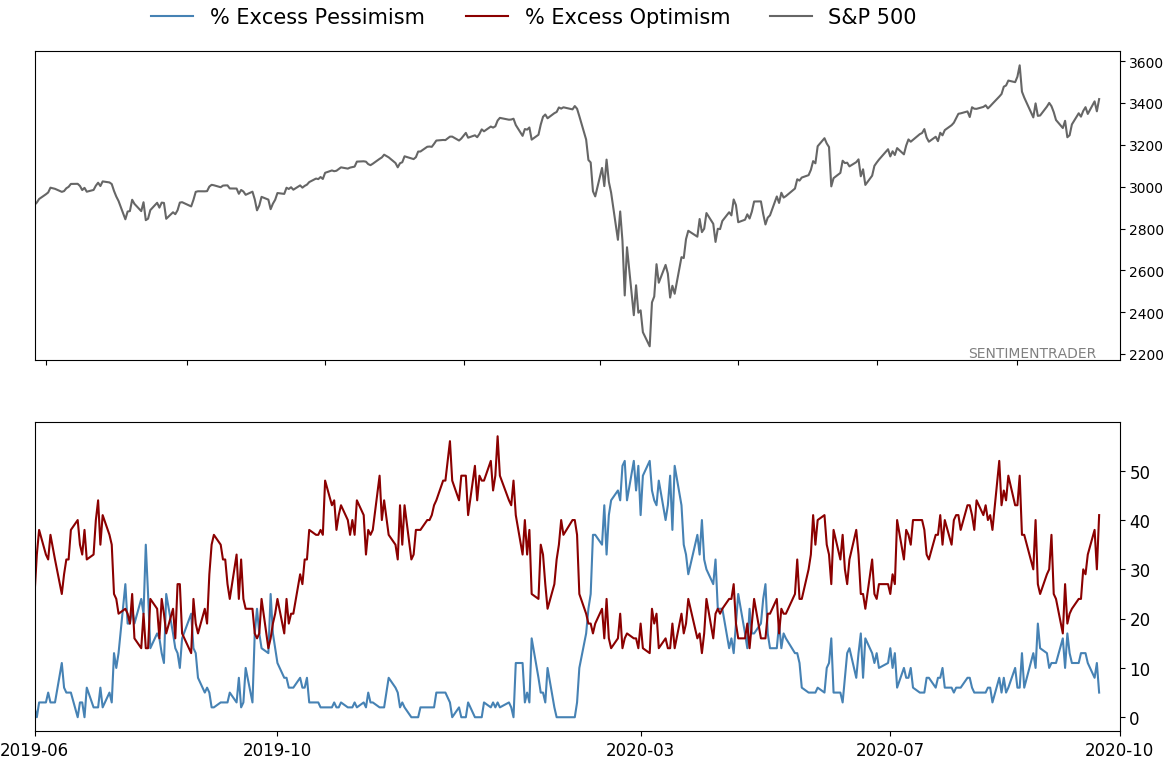
Smart Money Confidence: 35%
Dumb Money Confidence: 67%
|
|
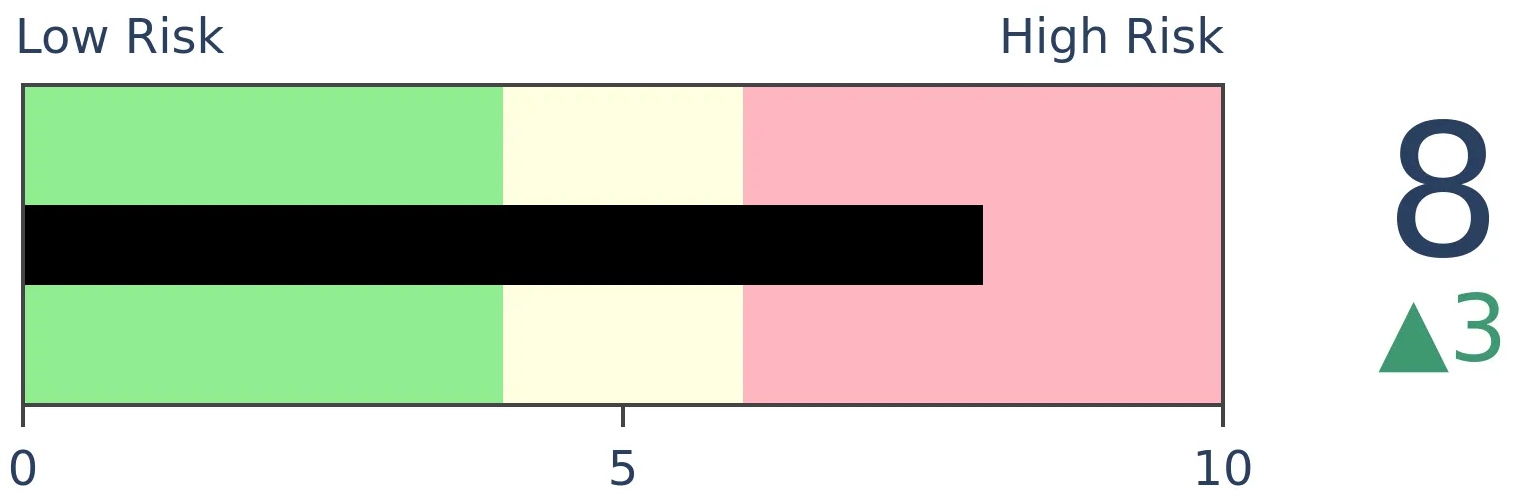
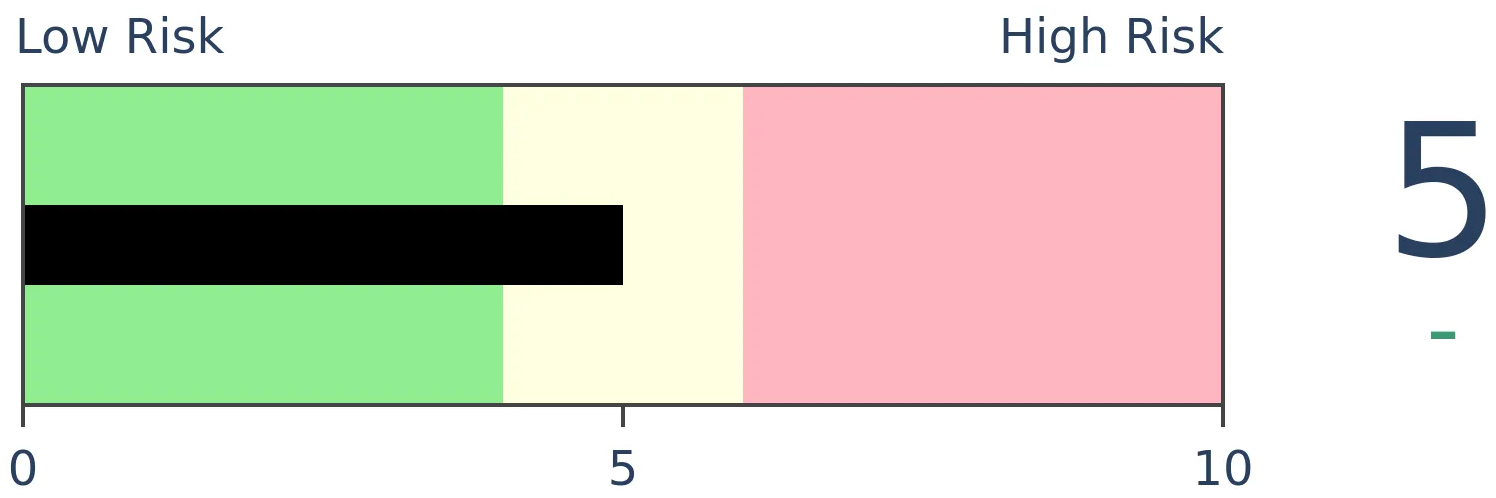
Risk Levels
Stocks Short-Term
|
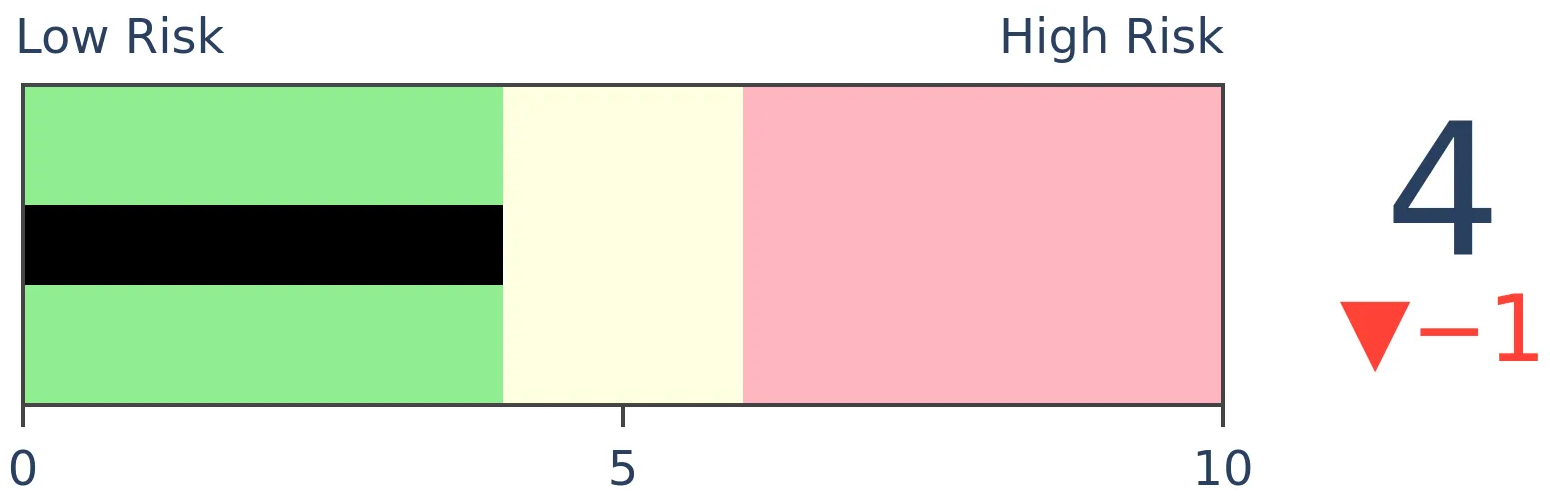
Stocks Medium-Term
|
|
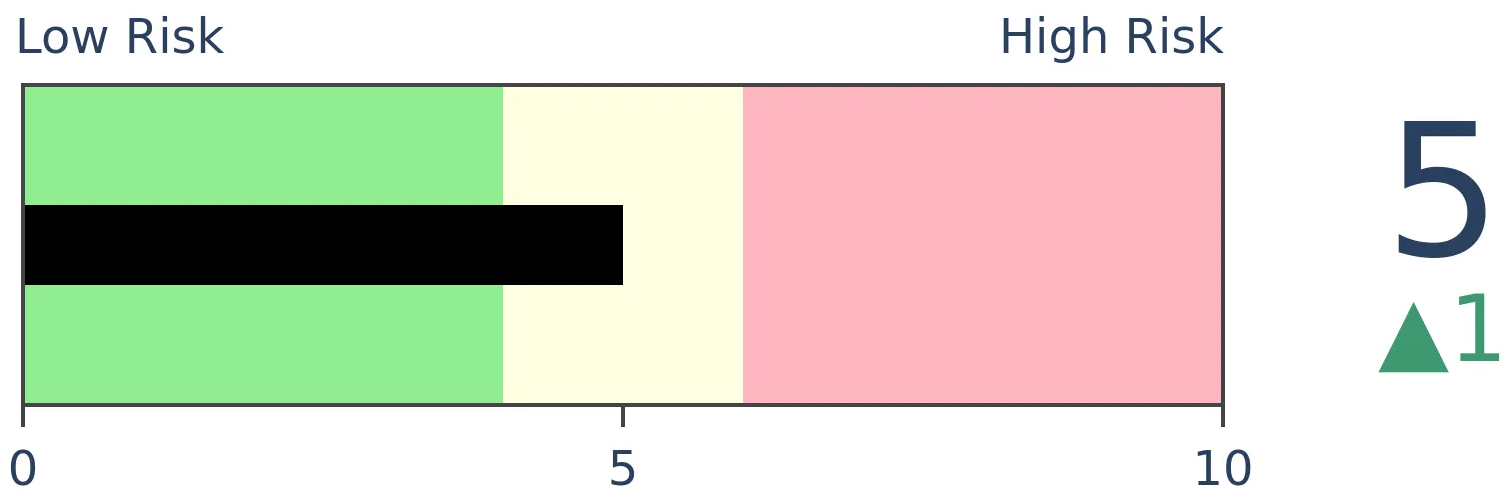
Bonds
|
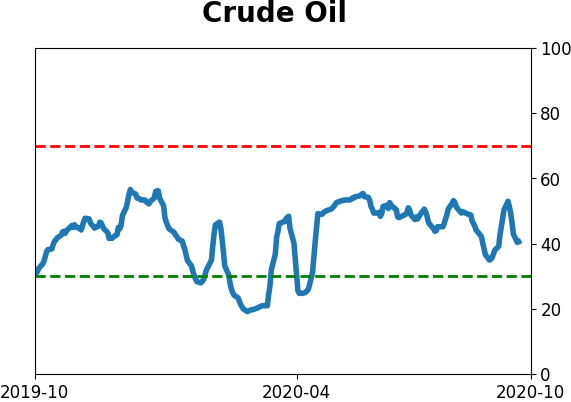
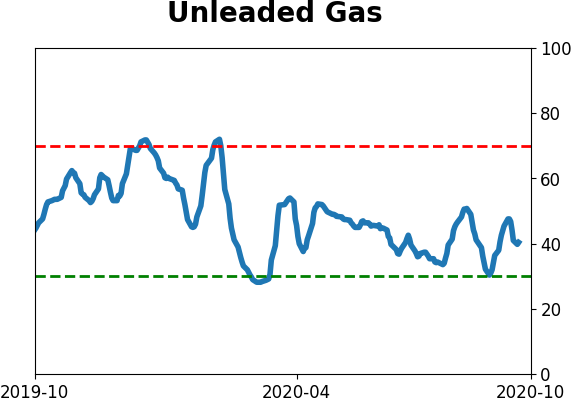
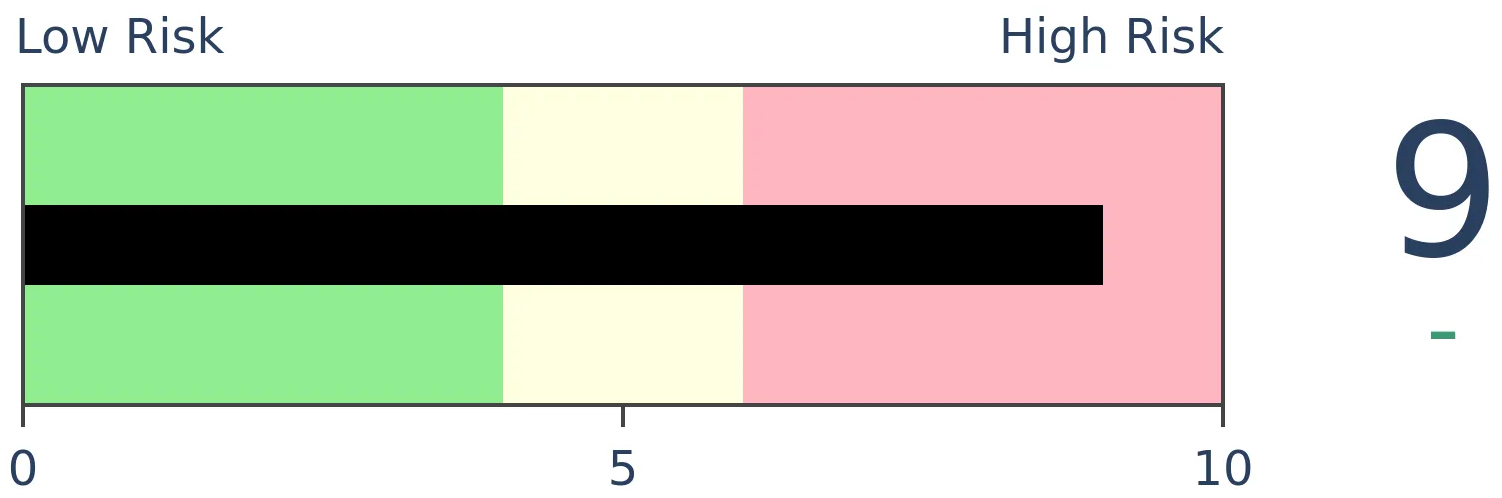
Crude Oil

|
|
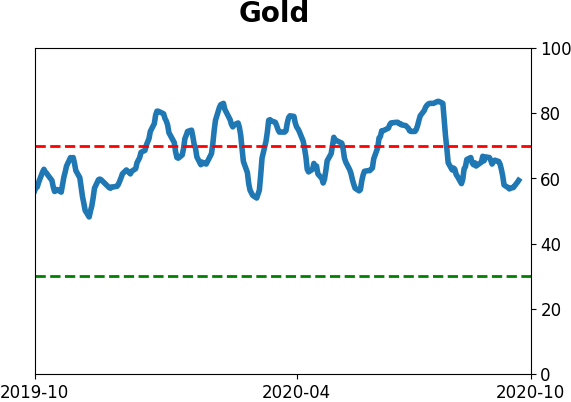
Gold
|
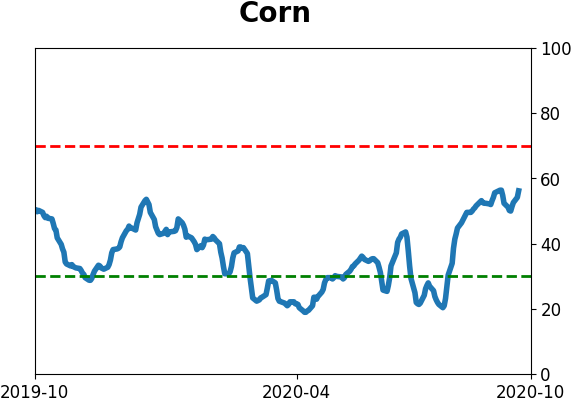
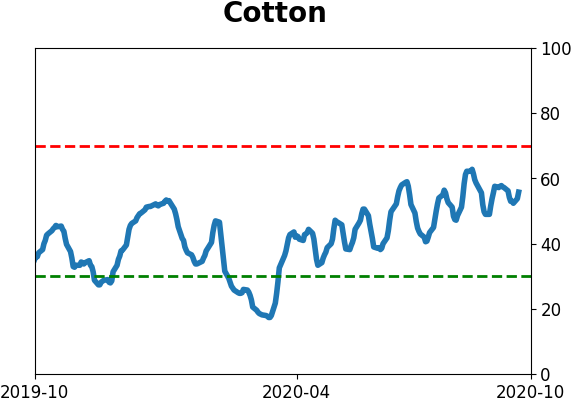
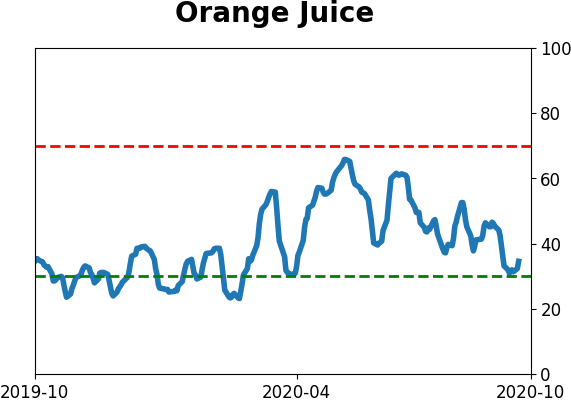
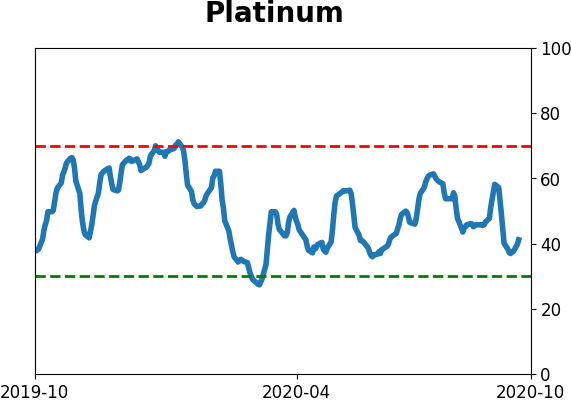
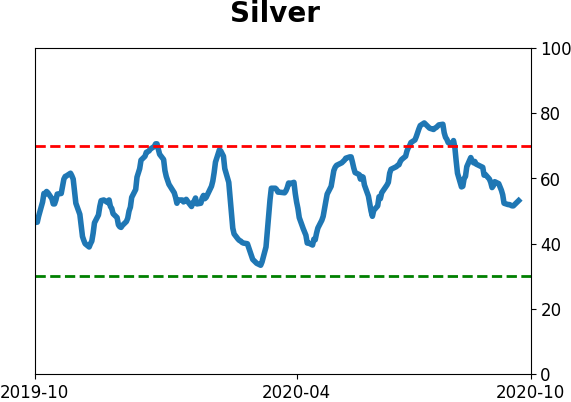
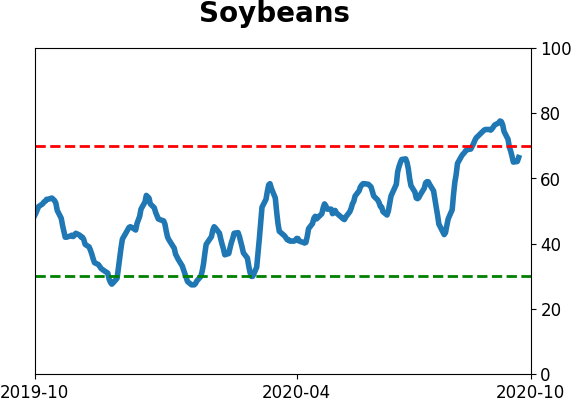
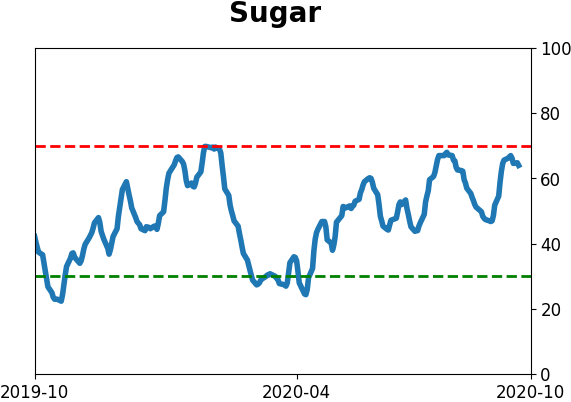
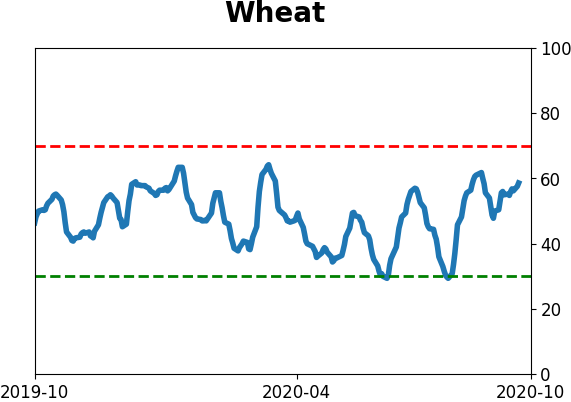
Agriculture
|
|
Research
BOTTOM LINE
Utility stocks have rallied in recent days, accompanied by a surge in breadth. ETF traders have been fleeing, but corporate insiders have never had fewer sales among companies in the sector. These kinds of developments have usually been a shorter-term negative and longer-term positive.
FORECAST / TIMEFRAME
None
|
NOTE: This was originally published earlier by Troy. I have added to the post at the end with the tag [Jason].
The past few days have seen U.S. stocks chop up and down. One of the few exceptions has been the utilities sector, which on a total return basis reached the highest level since the March crash:
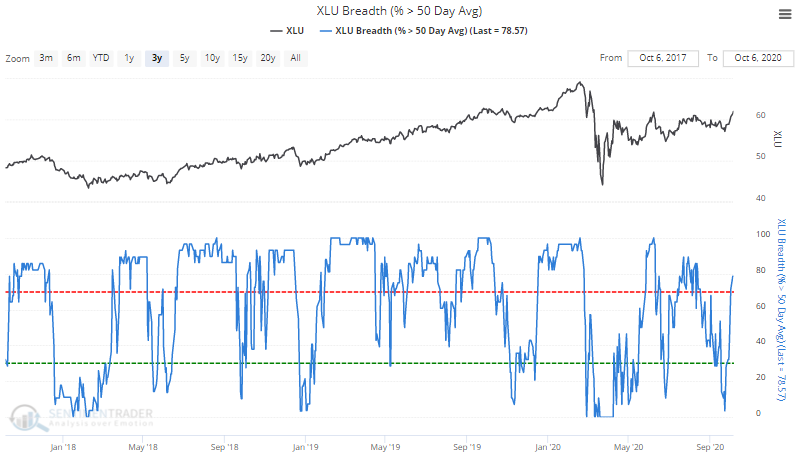
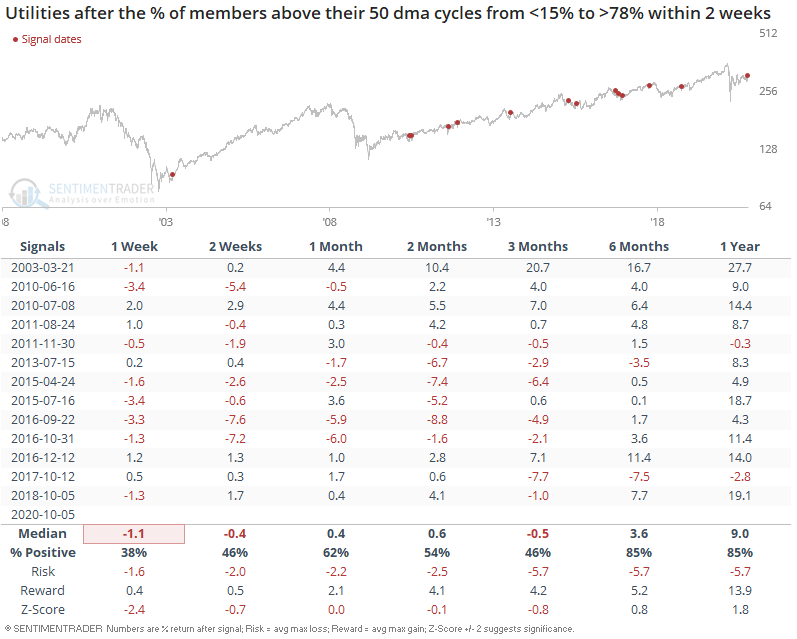
As a result, the % of utilities stocks above their 50 dma surged from less than 15% to greater than 78% within 2 weeks. When the utilities sector rebounded this quickly in the past, it usually took a breather over the next 1-2 weeks:
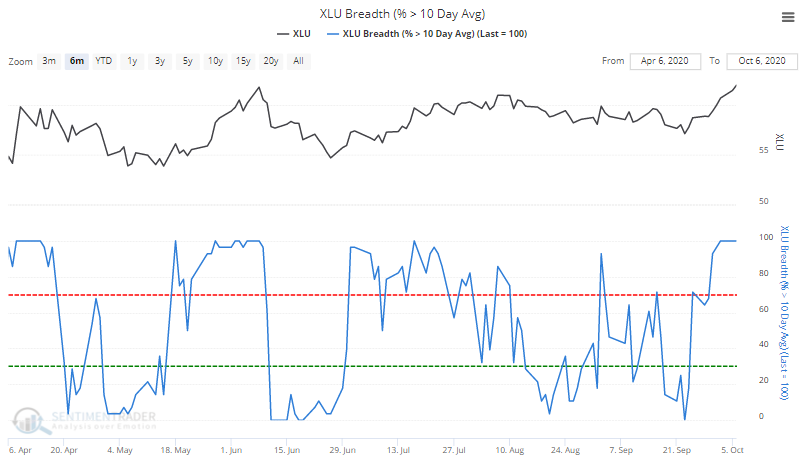
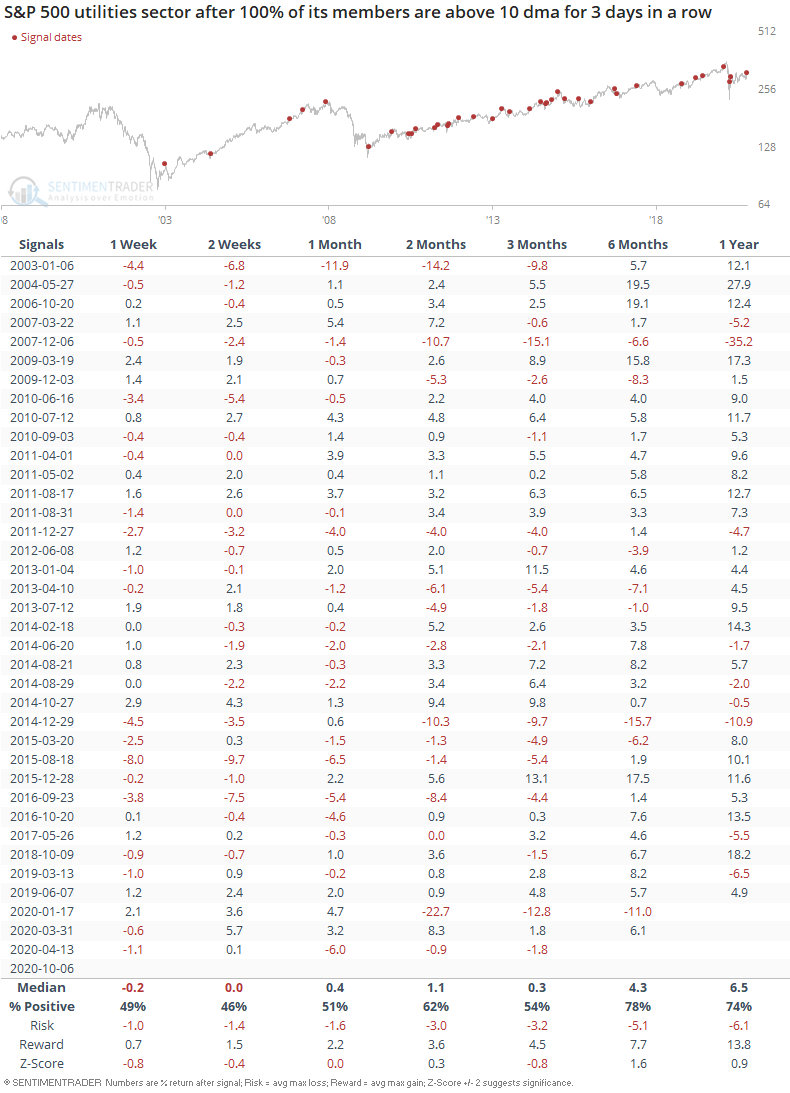
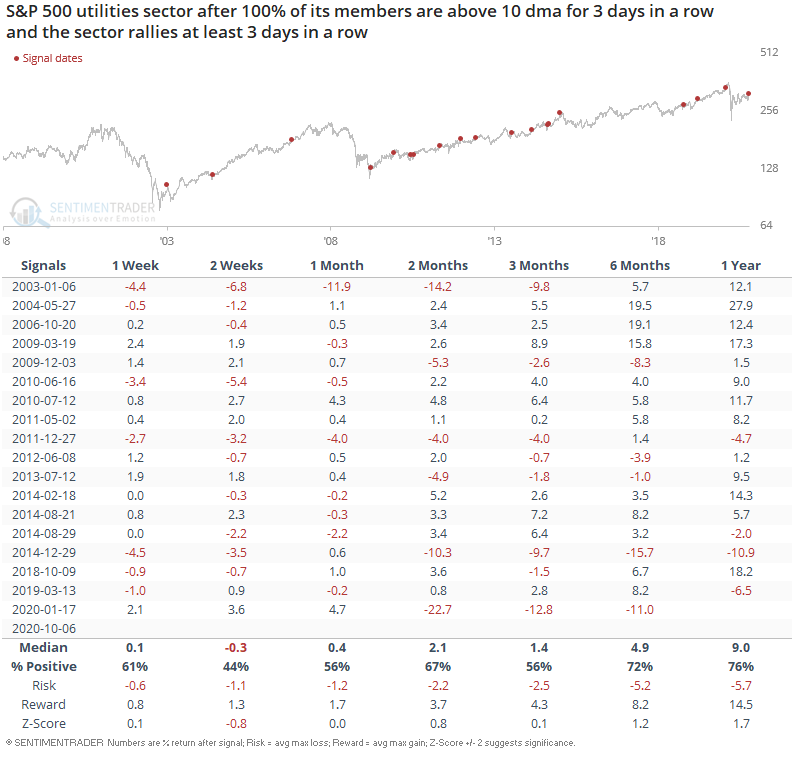
The recent strength in utilities saw 3 consecutive days in which all utilities stocks were above their 10 dma:
On its own, this is a bit of a mixed signal:
But when combined with the fact that utilities are up 5 days in a row, such a strong show of momentum usually saw the utilities sector rally further over the next year:
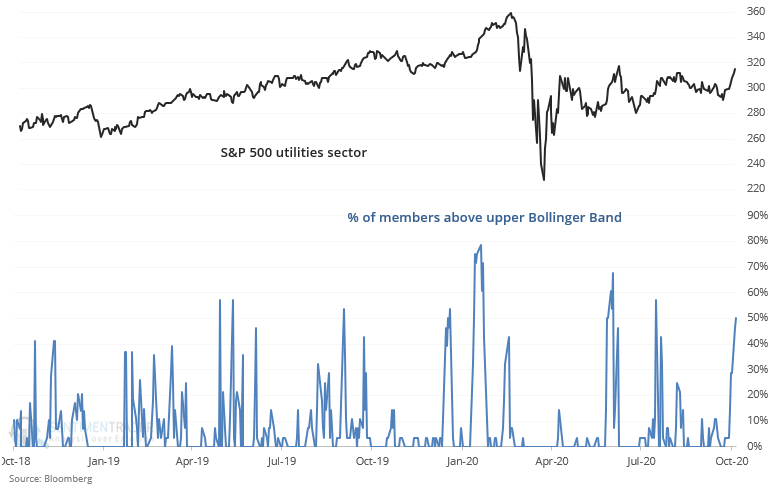
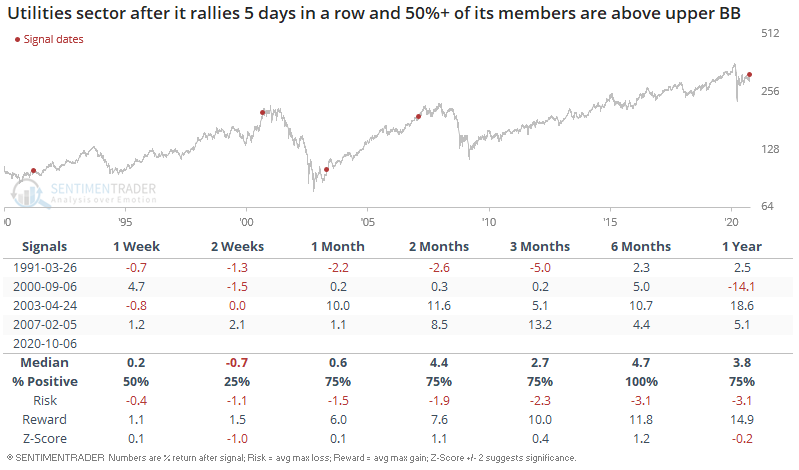
And lastly, half of the utilities sector are above their upper Bollinger Band.
When this happened while the utilities sector rallied 5 days in a row, 3 out of 4 historical cases saw weakness over the next 1-2 weeks:
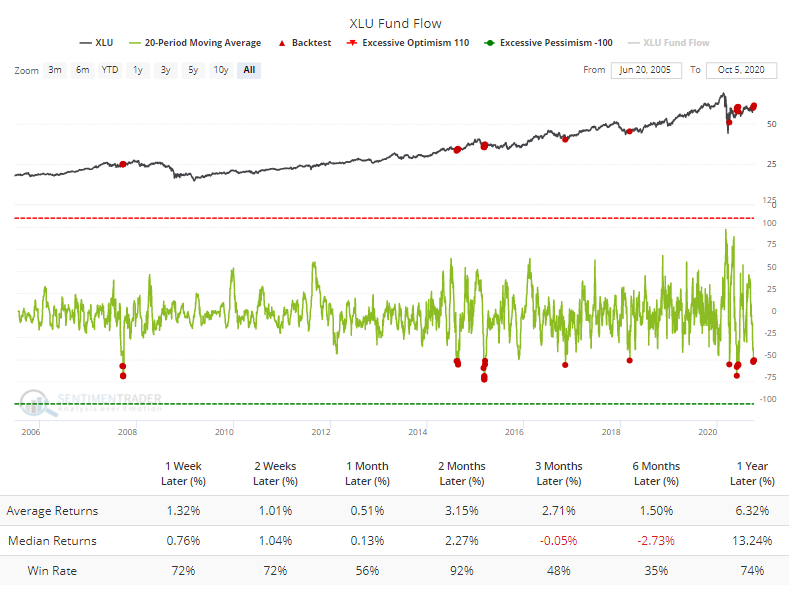
[Jason] Despite the mostly impressive performance of these stocks, ETF traders have been pulling out. The XLU fund has seen an average of more than $50 million per day leaving the fund over the past month. The Backtest Engine shows this was typically a contrary indicator, though the 3-6 month time frame was sketchy.
Among corporate insiders at utility companies, buying transactions have tapered off, but sales have trailed even more and have never been fewer over a 6-month time frame. That means the Buy/Sell Ratio is still historically high.
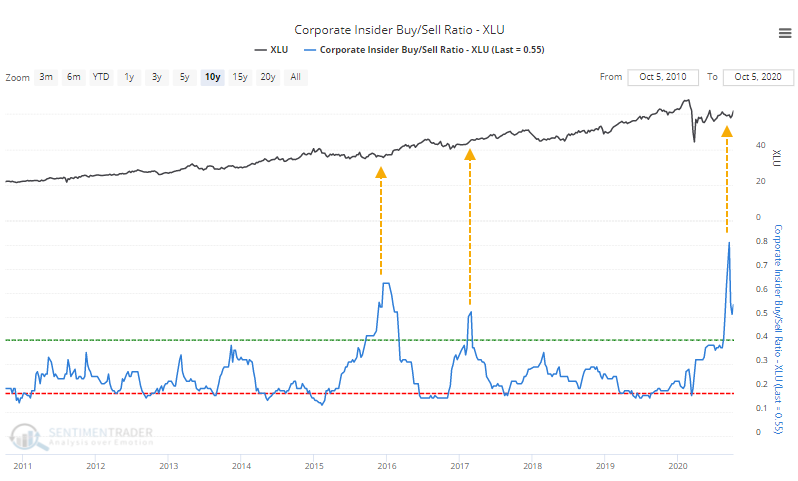
The swift decline in the ratio means that Velocity is extremely negative, but it has not been effective at preceding lower returns, unlike that measure for the broader market.
We've seen repeatedly in the past that a staid sector like utilities does not tend to do well in the short-term after big bouts of positive momentum. There are some signs of that here, and shorter-term returns have been mostly weak as noted above. Longer-term, however, the bias was solidly higher.
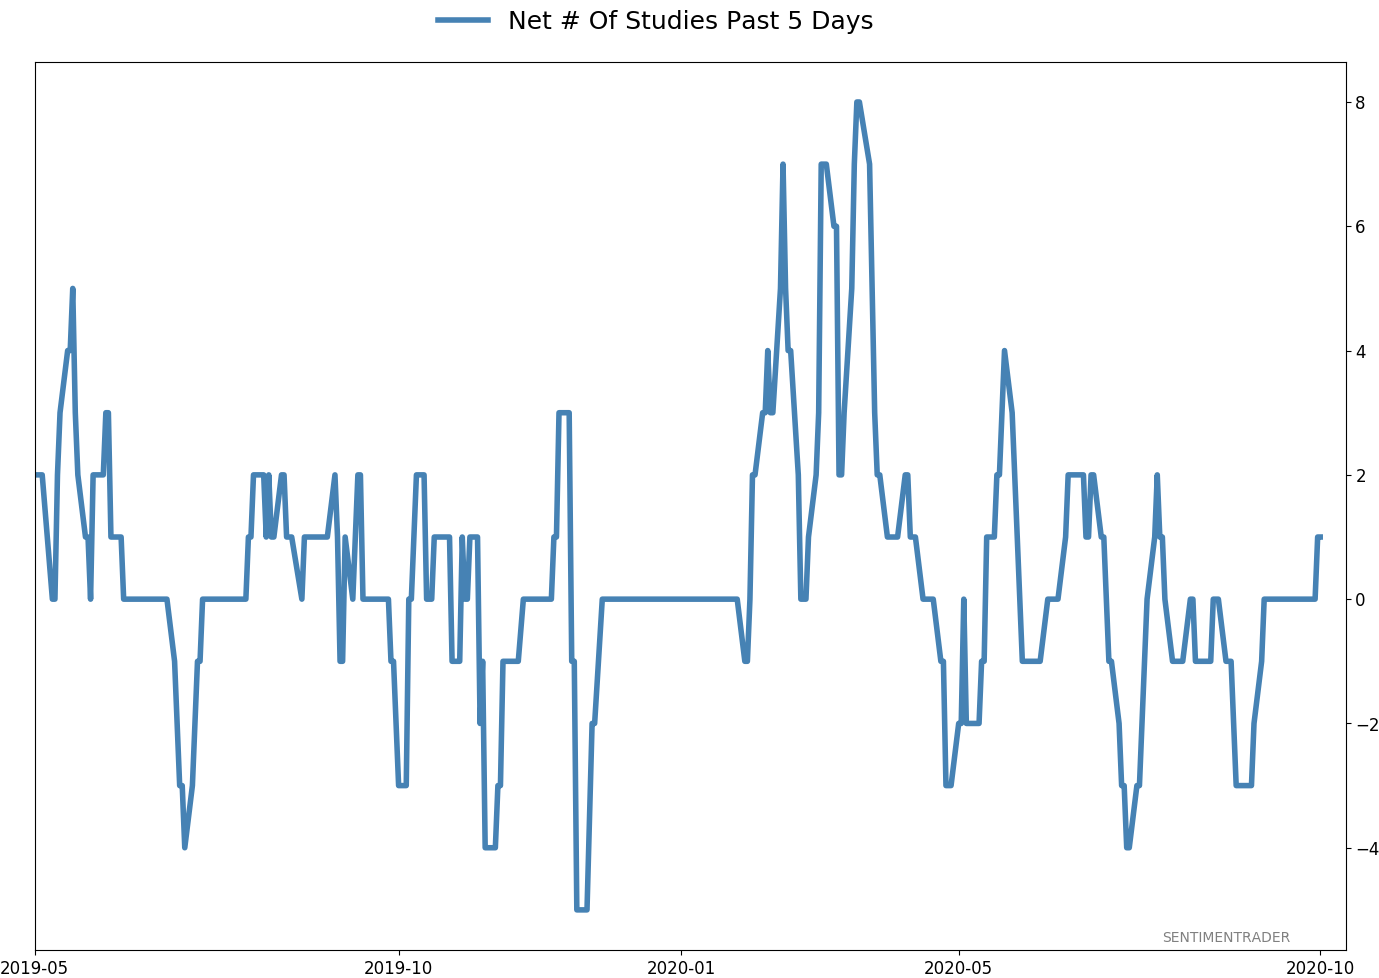
Active Studies
| Time Frame | Bullish | Bearish | | Short-Term | 0 | 0 | | Medium-Term | 2 | 8 | | Long-Term | 47 | 2 |
|
Indicators at Extremes
Portfolio
| Position | Description | Weight % | Added / Reduced | Date | | Stocks | 15.2% RSP, 7.2% XLE | 22.4 | Added 3% | 2020-10-02 | | Bonds | 10% BND, 10% SCHP, 10% ANGL | 29.9 | Reduced 0.1% | 2020-10-02 | | Commodities | GCC | 2.4 | Reduced 2.1%
| 2020-09-04 | | Precious Metals | GDX | 4.7 | Added 5% | 2020-09-09 | | Special Situations | | 0.0 | Reduced 5% | 2020-10-02 | | Cash | | 40.6 | | |
|
Updates (Changes made today are underlined)
It's been a really mixed picture lately. In stocks, we saw huge momentum and a spike in speculation, then September managed to wring much of that out, except in the options market which is still a worry. There seem to be offsetting positives and negatives, with a mixed market environment, not the kind of setup where I feel comfortable being aggressive. I did add a bit to energy. The older I get, the less interested I am in short-term gyrations, and I don't really care about the coming days or even weeks. I'm fairly confident that the total return will be positive over a longer time frame given some of the developments we've looked in over the past week. With bonds, I decided to swap TLT for ANGL, a high-yield corporate fund with a heavy focus on energy bonds. Hedgers are heavily short 10-year Treasuries, and the high-yield market has held up well internally.
RETURN YTD: -0.9% 2019: 12.6%, 2018: 0.6%, 2017: 3.8%, 2016: 17.1%, 2015: 9.2%, 2014: 14.5%, 2013: 2.2%, 2012: 10.8%, 2011: 16.5%, 2010: 15.3%, 2009: 23.9%, 2008: 16.2%, 2007: 7.8%
|
|
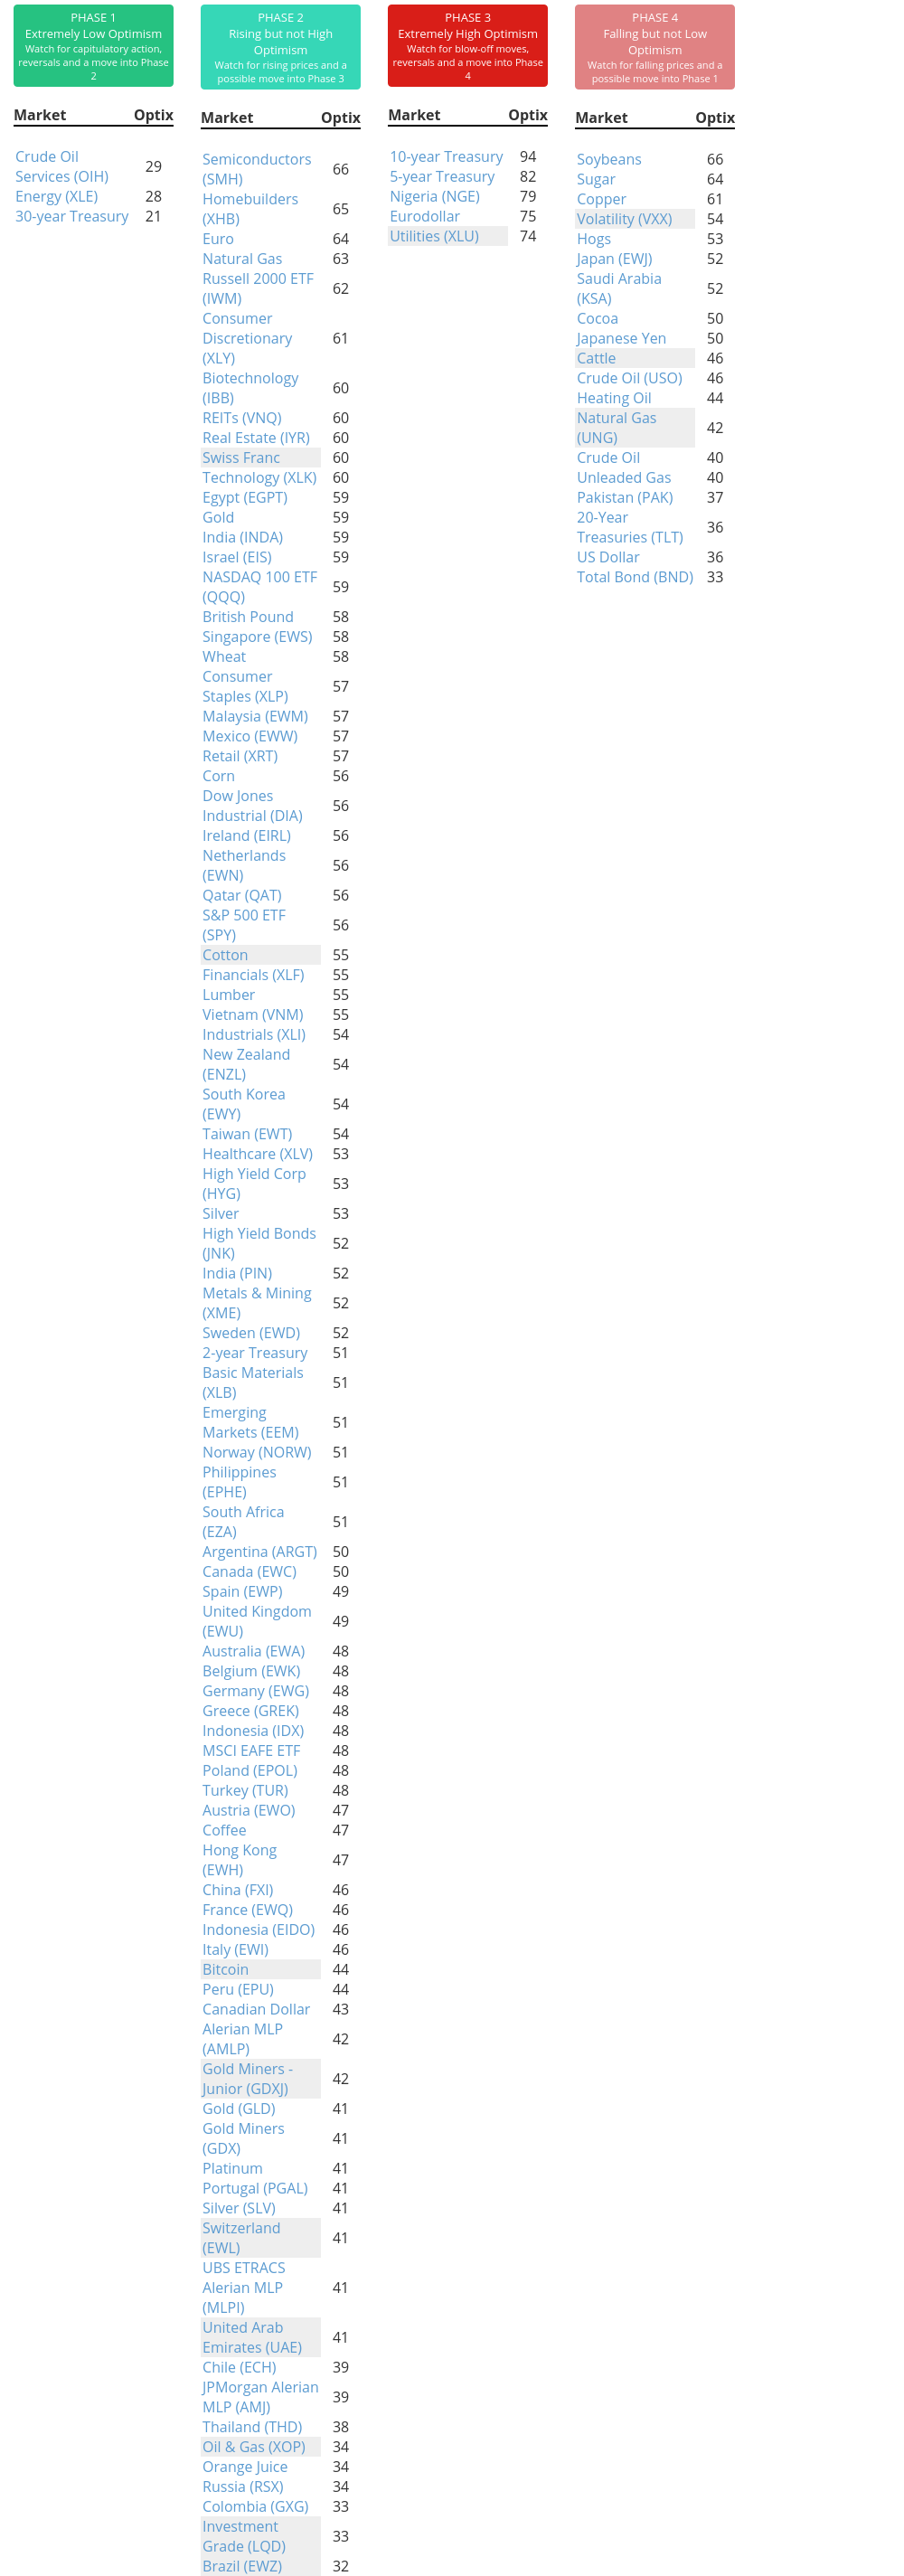
Phase Table
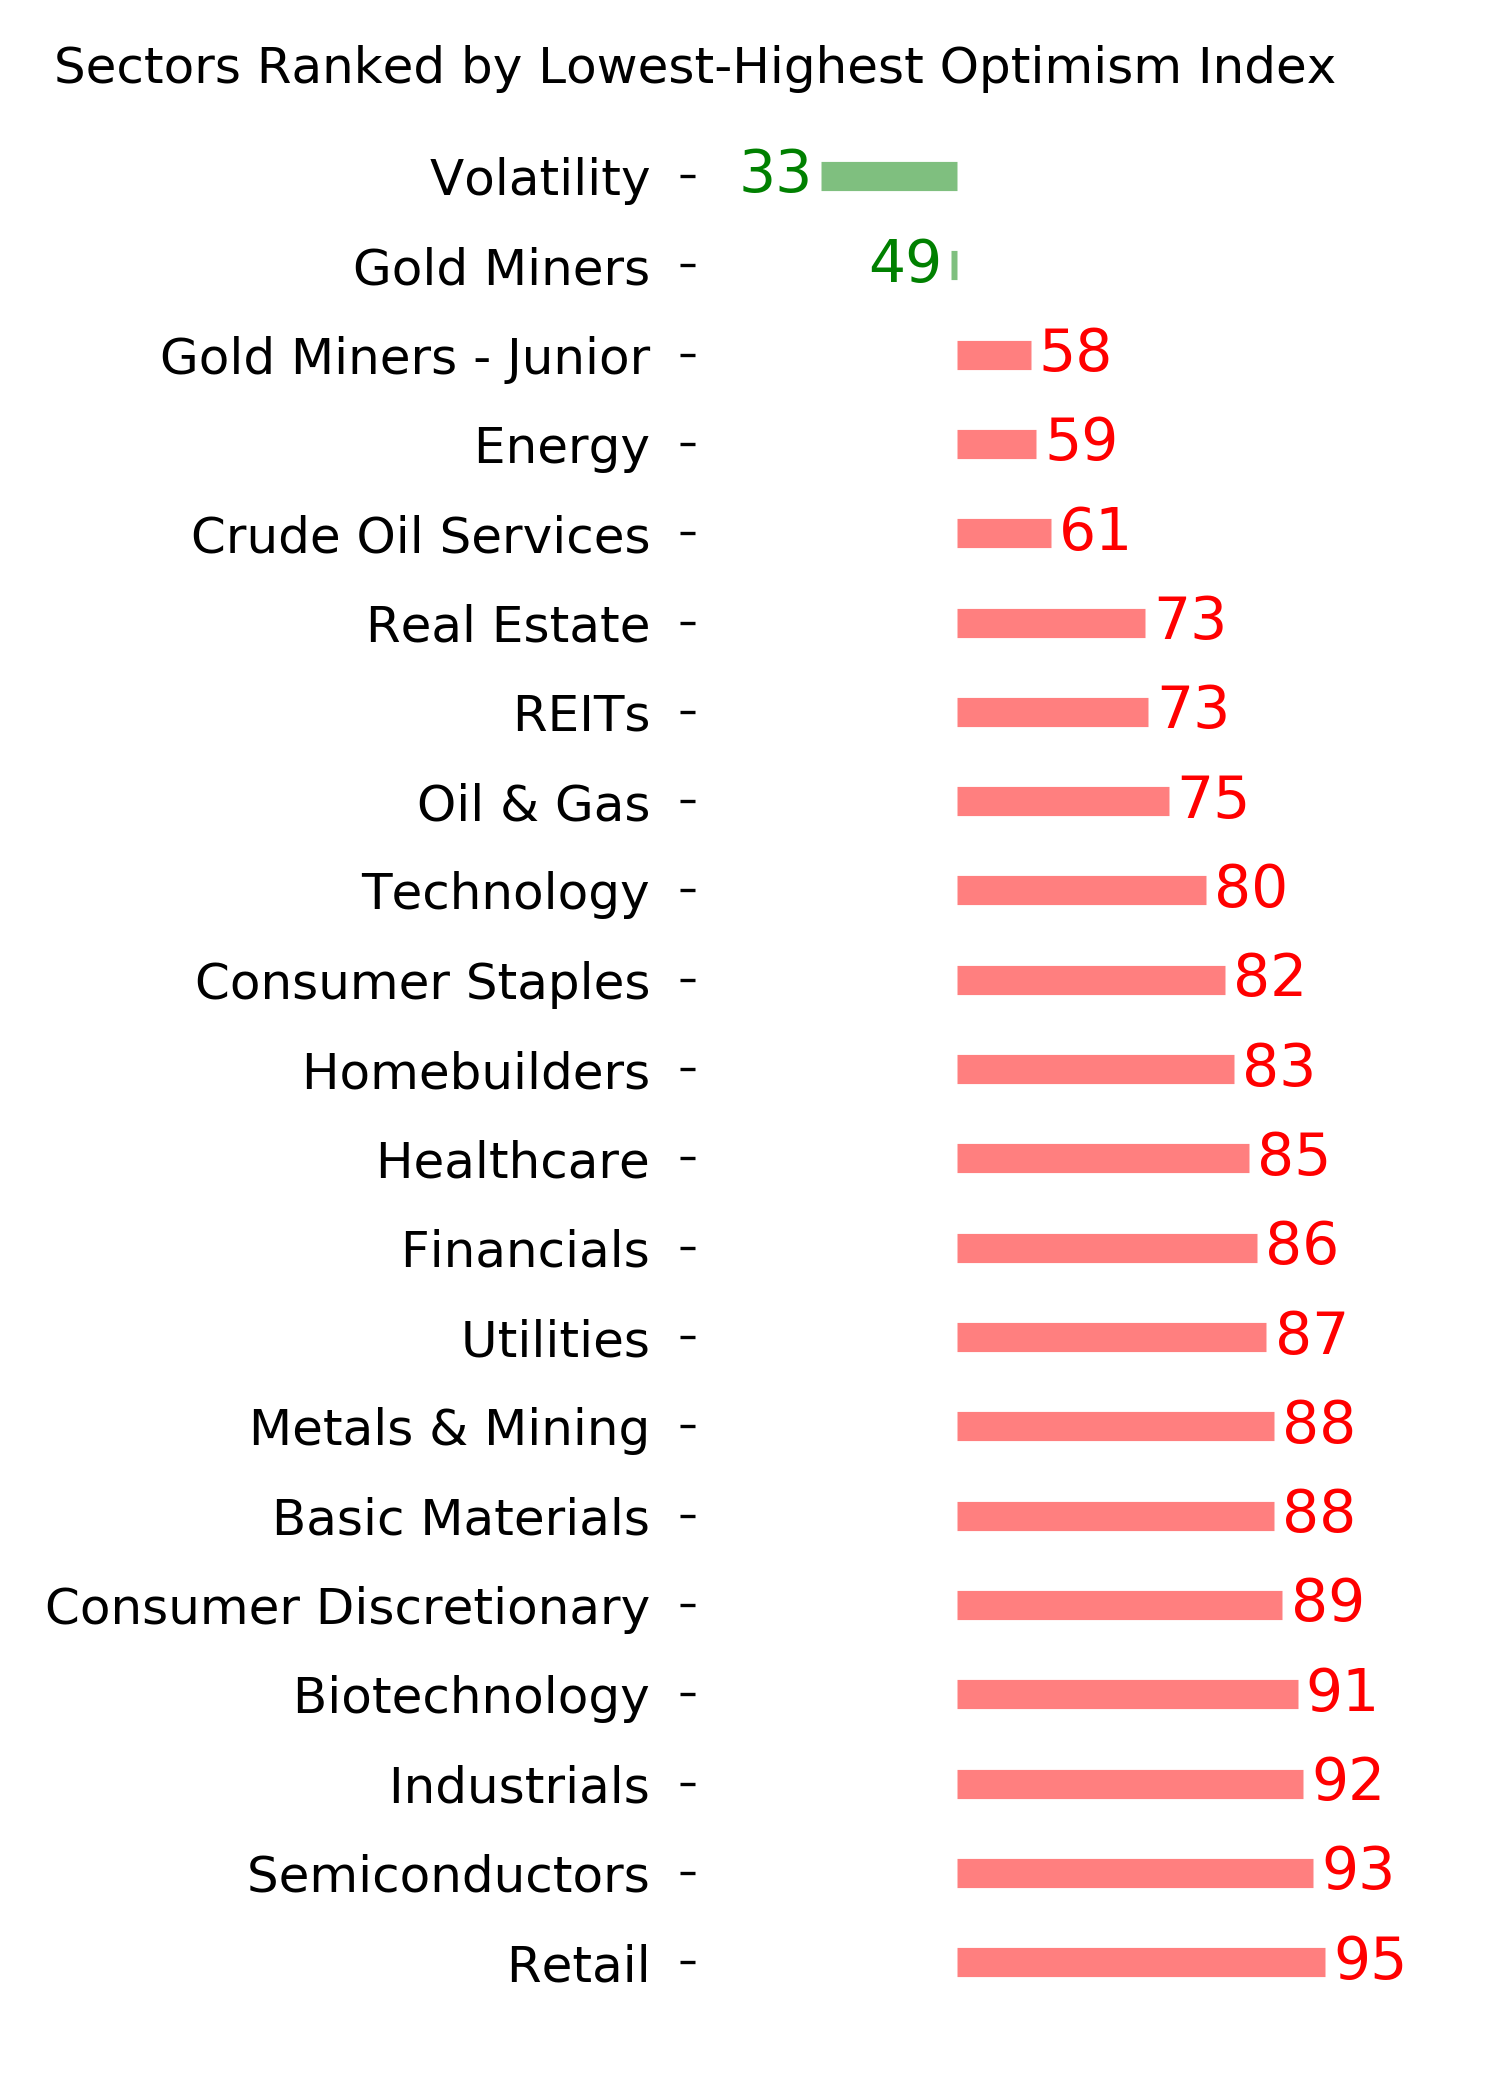
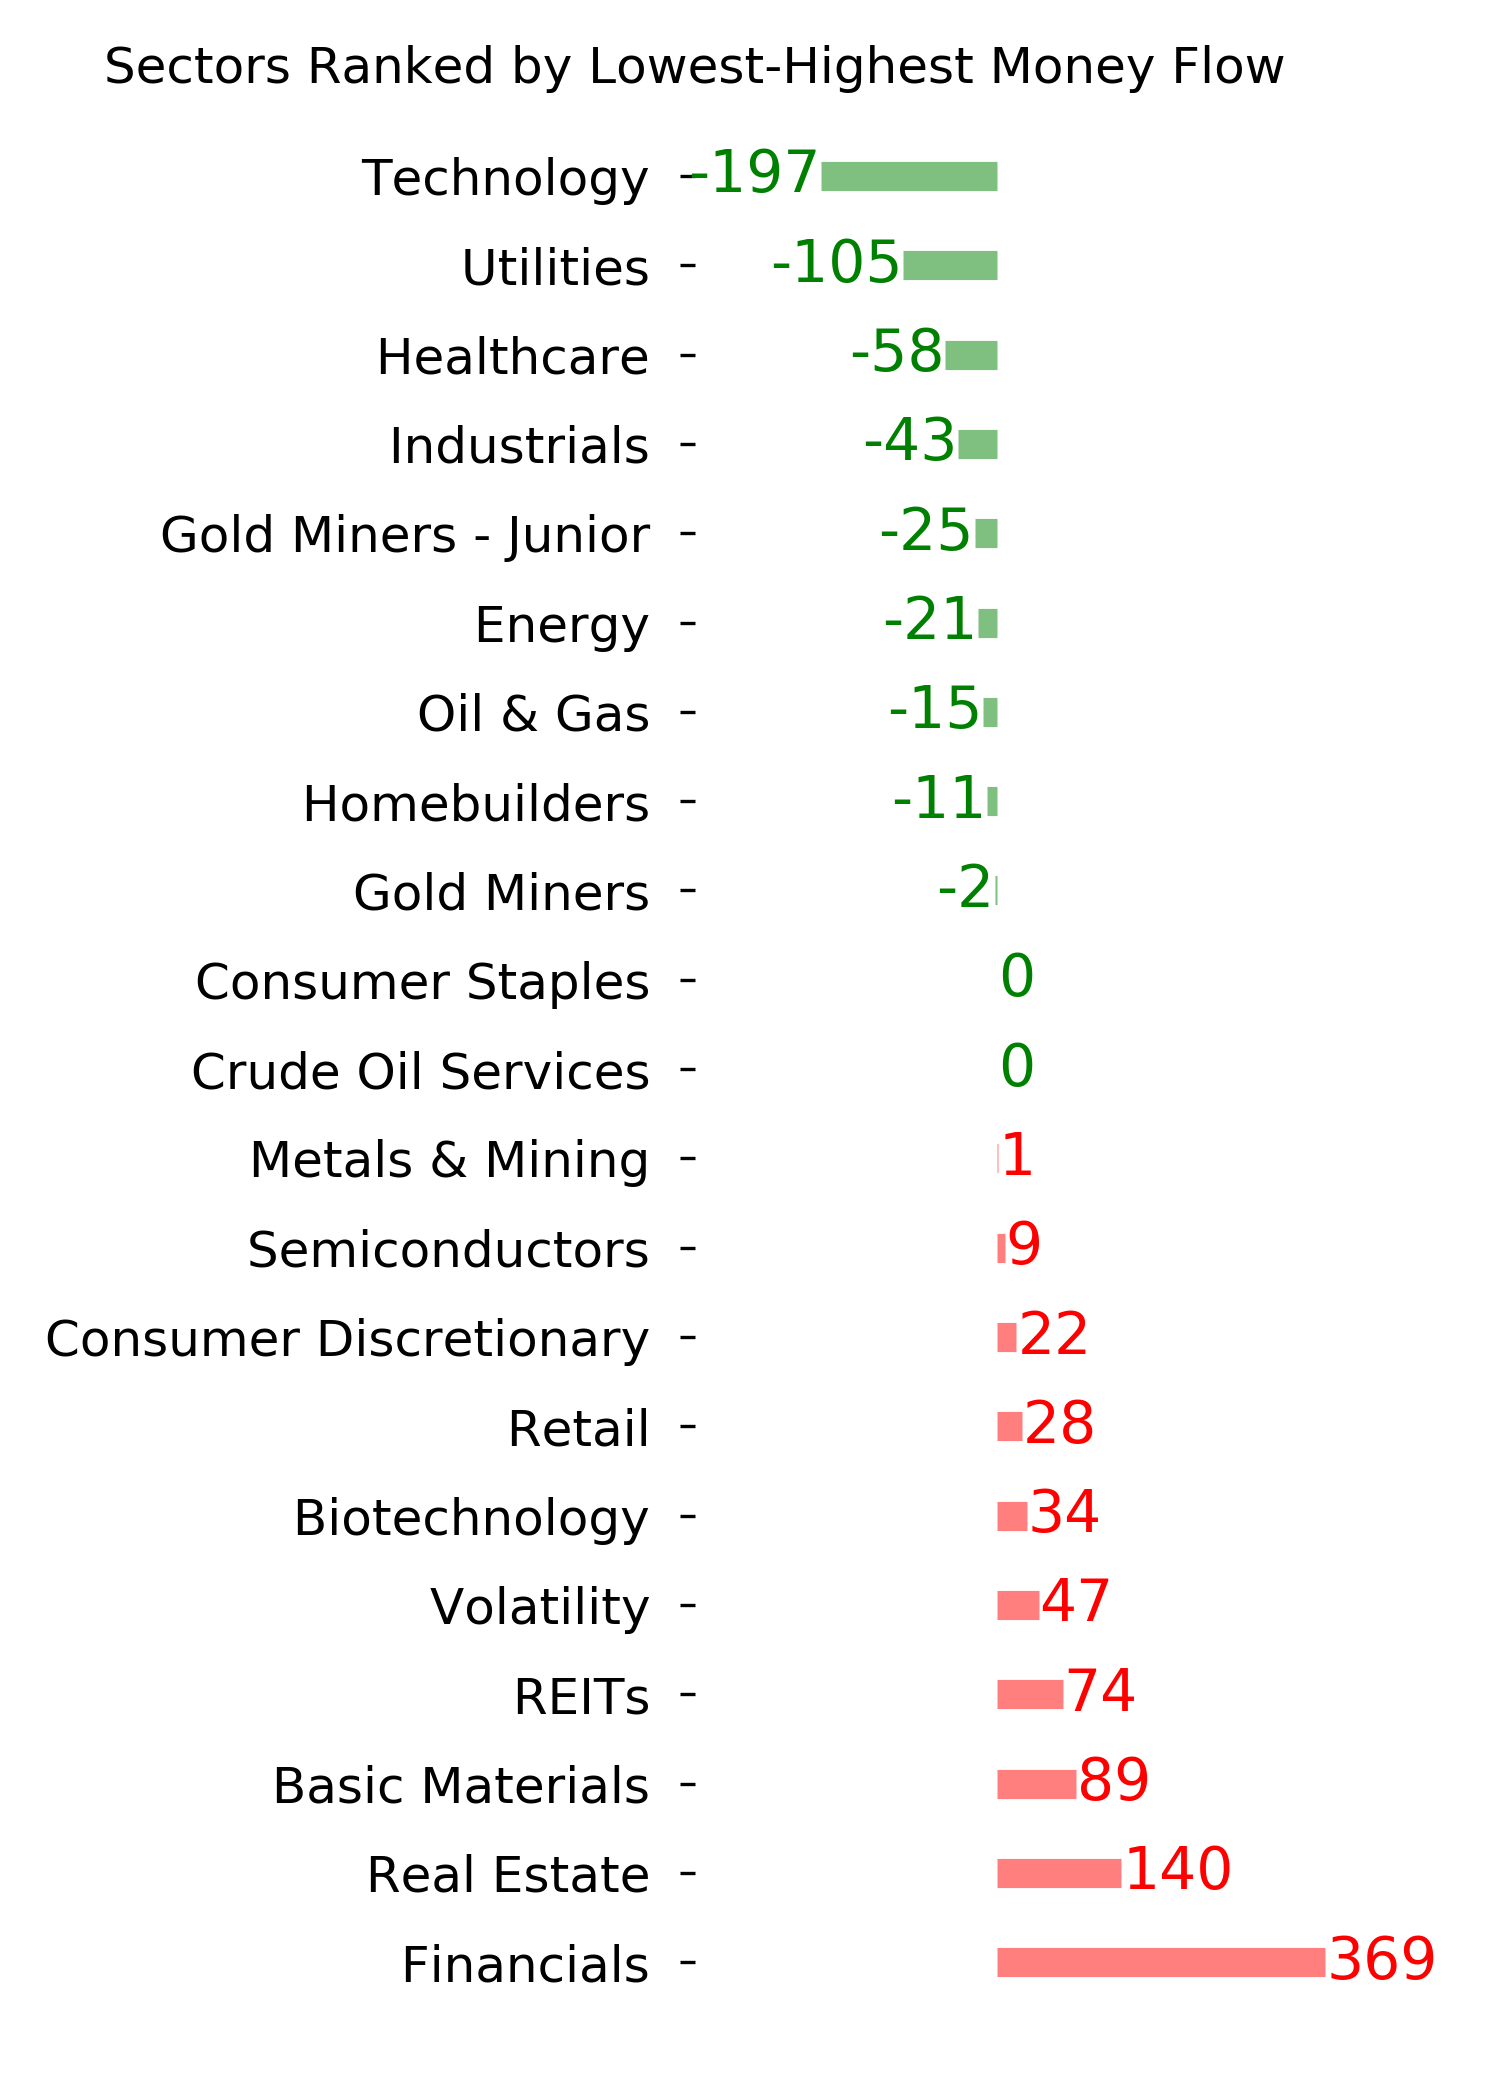
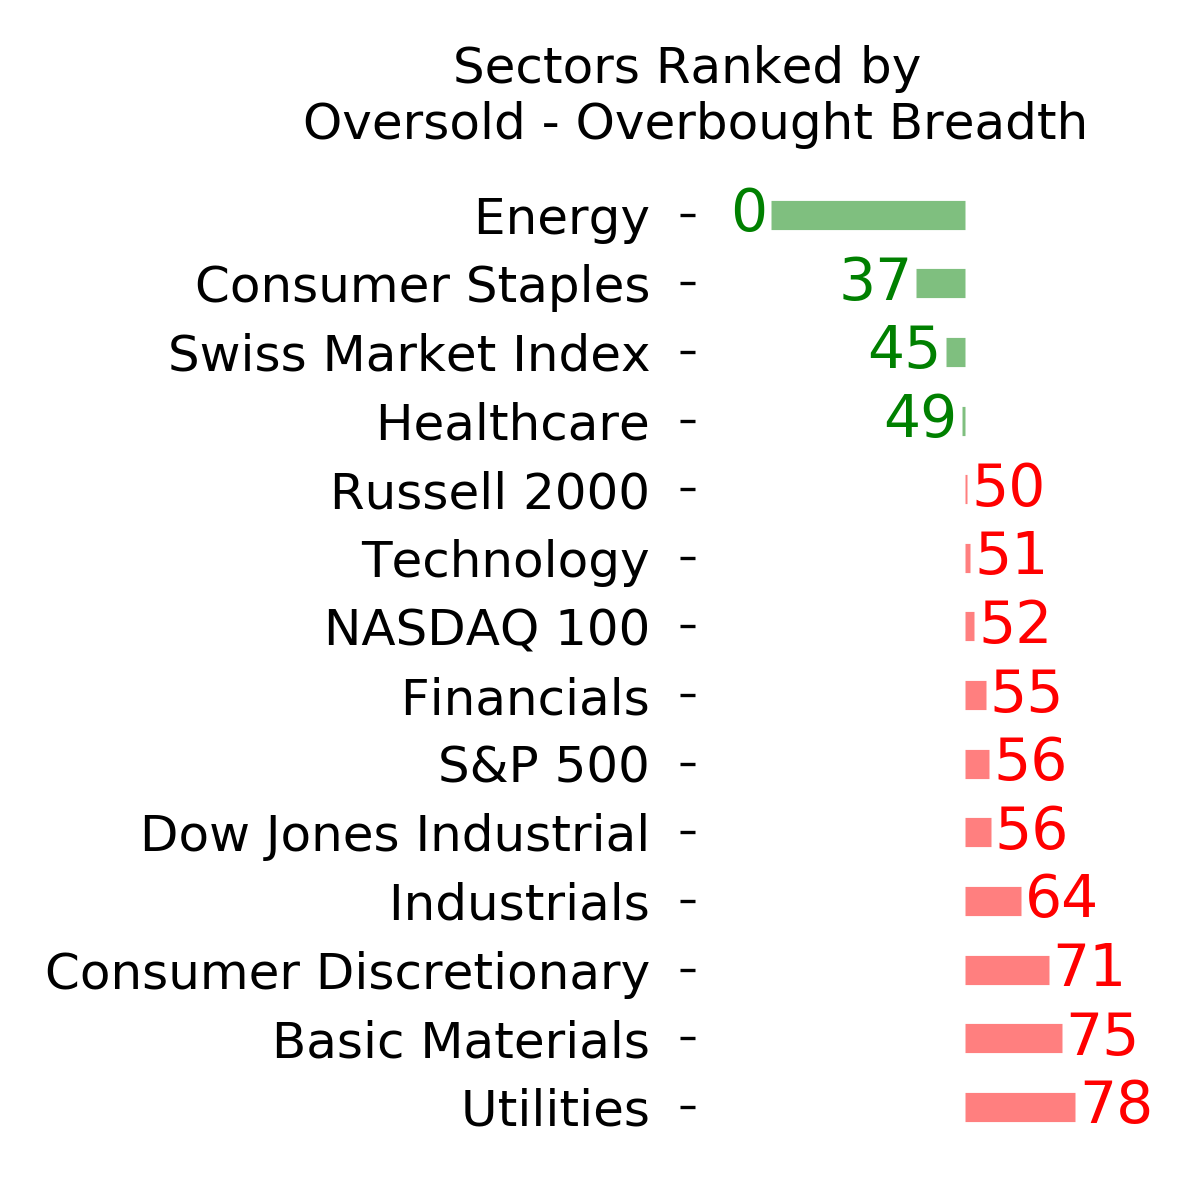
Ranks
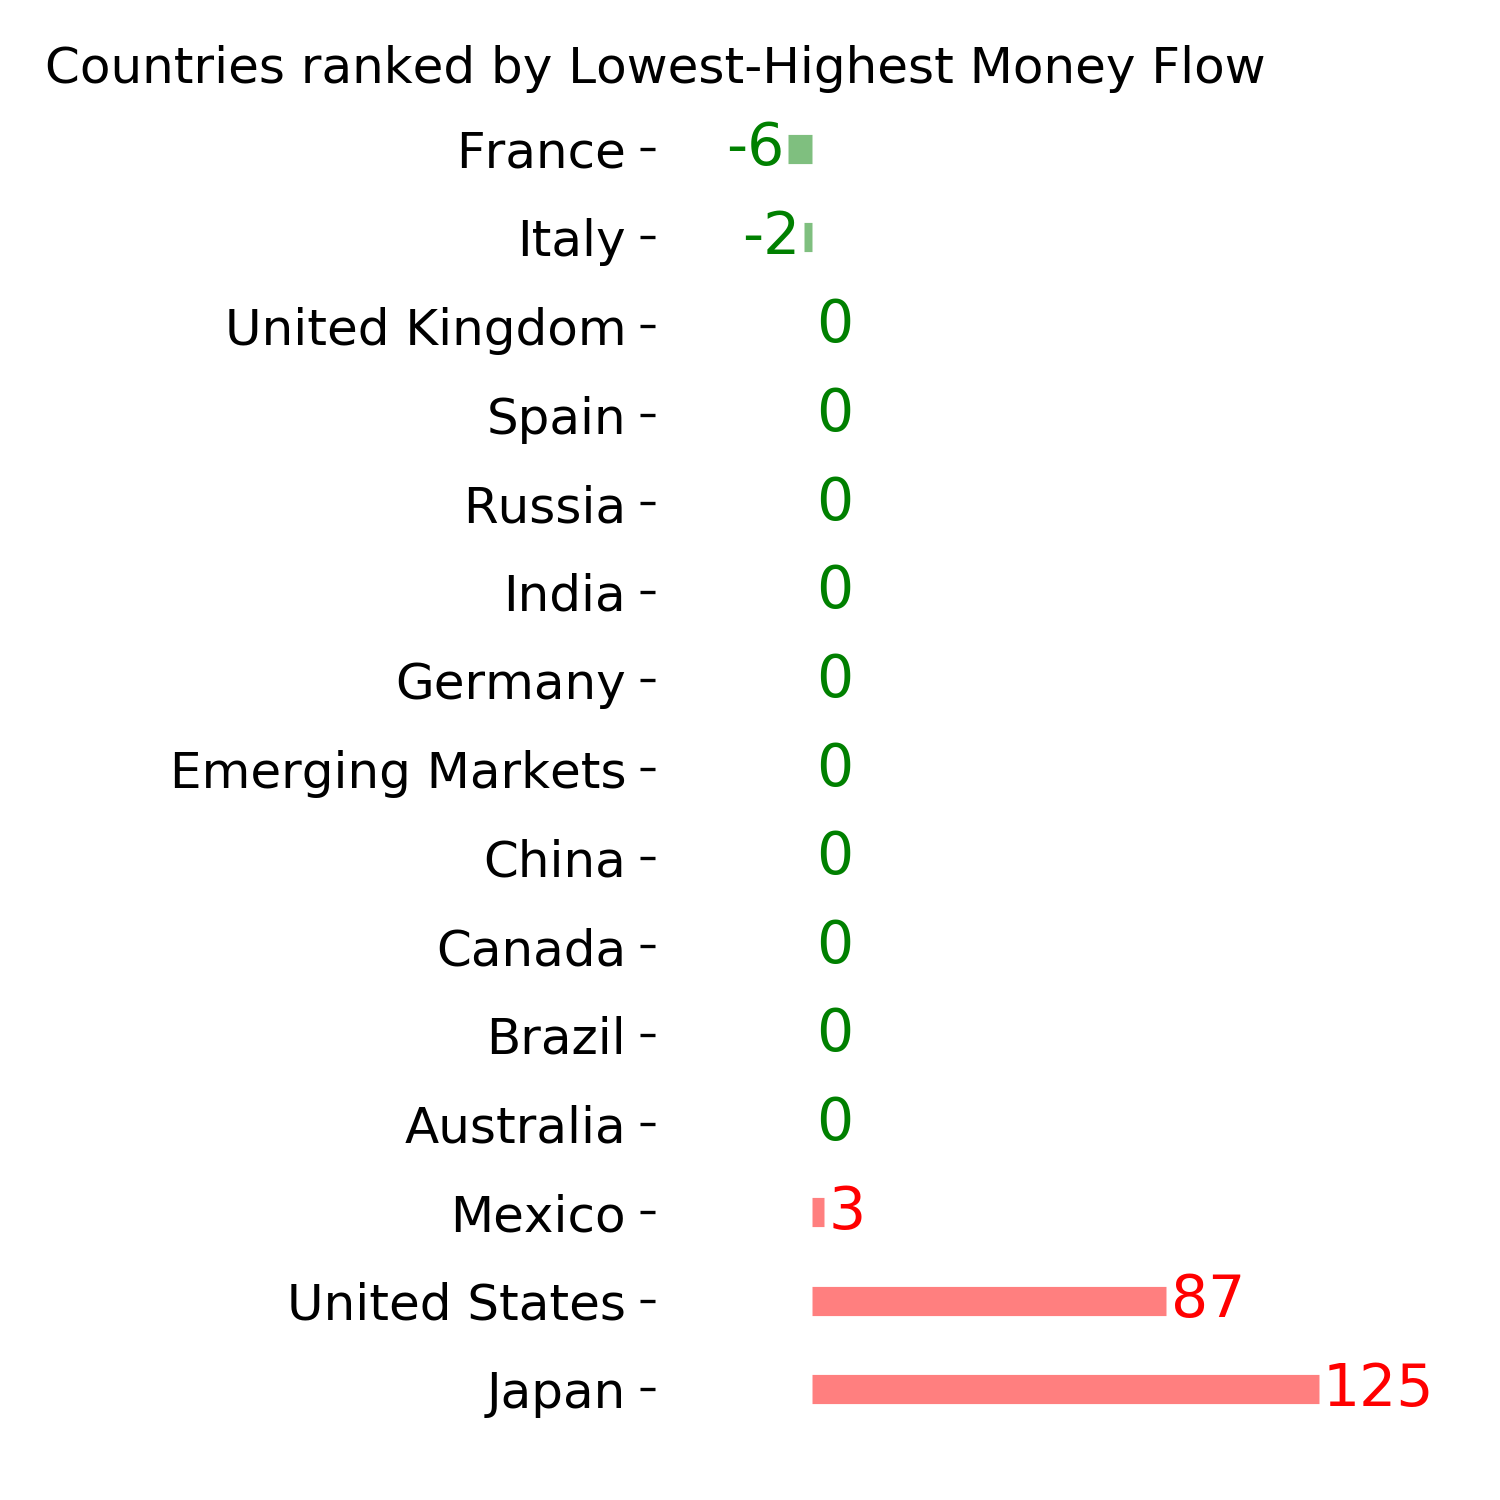
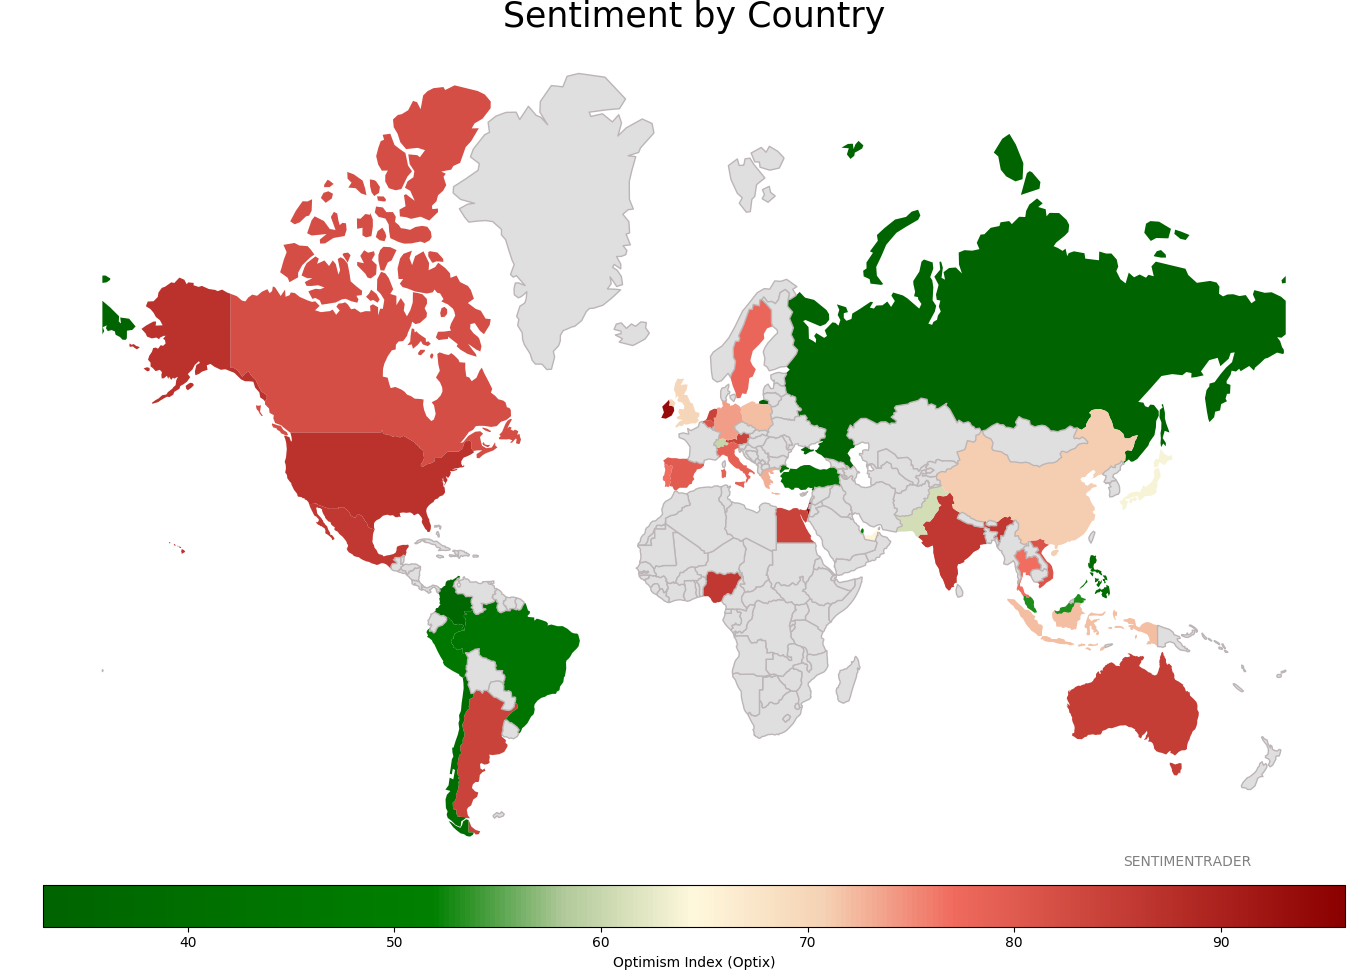
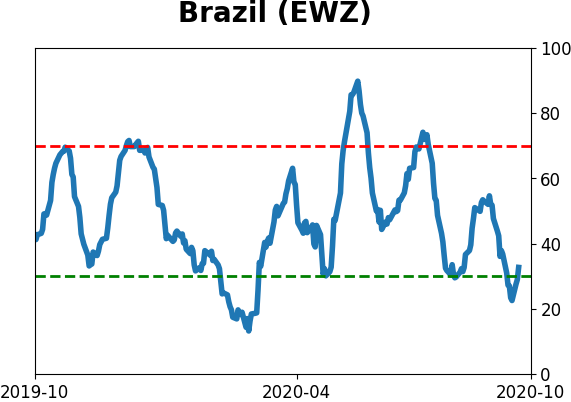
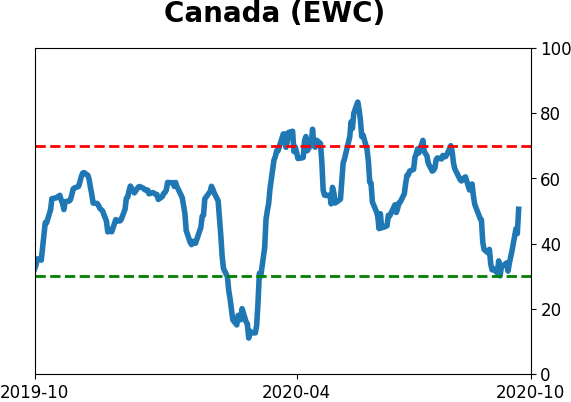
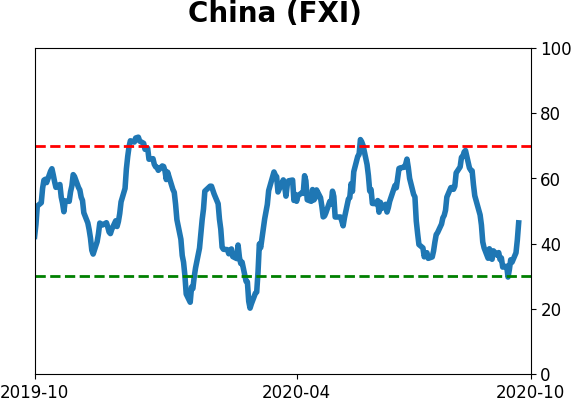
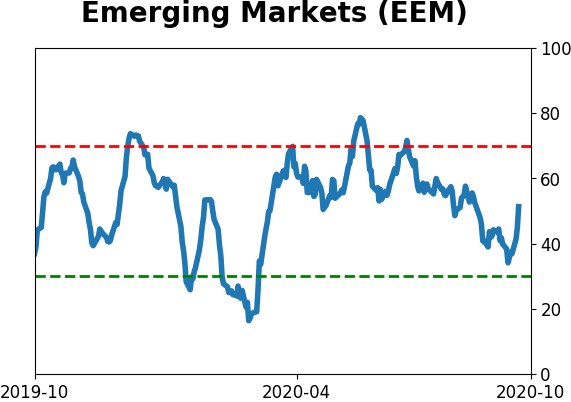
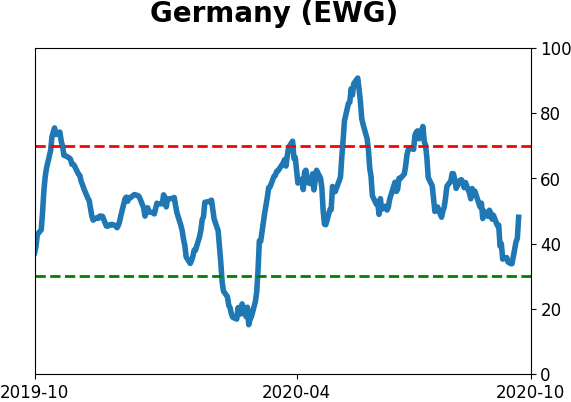
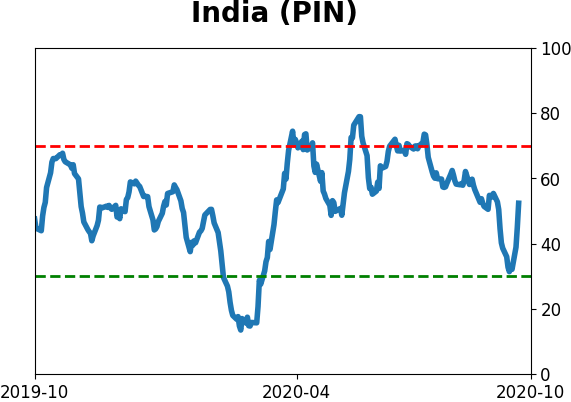
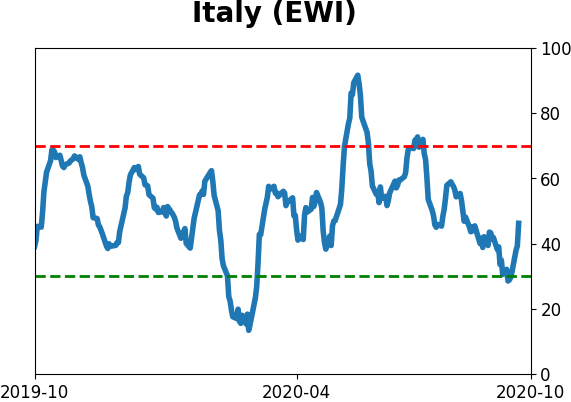
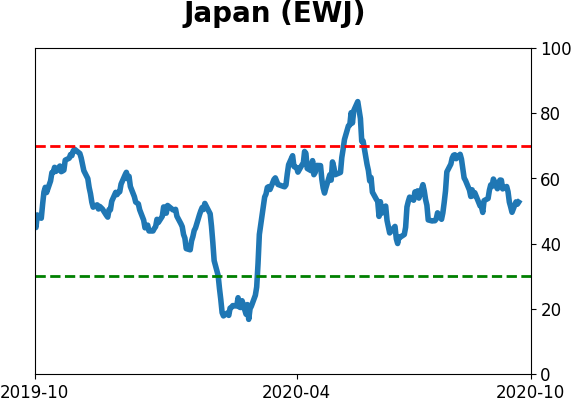
Sentiment Around The World
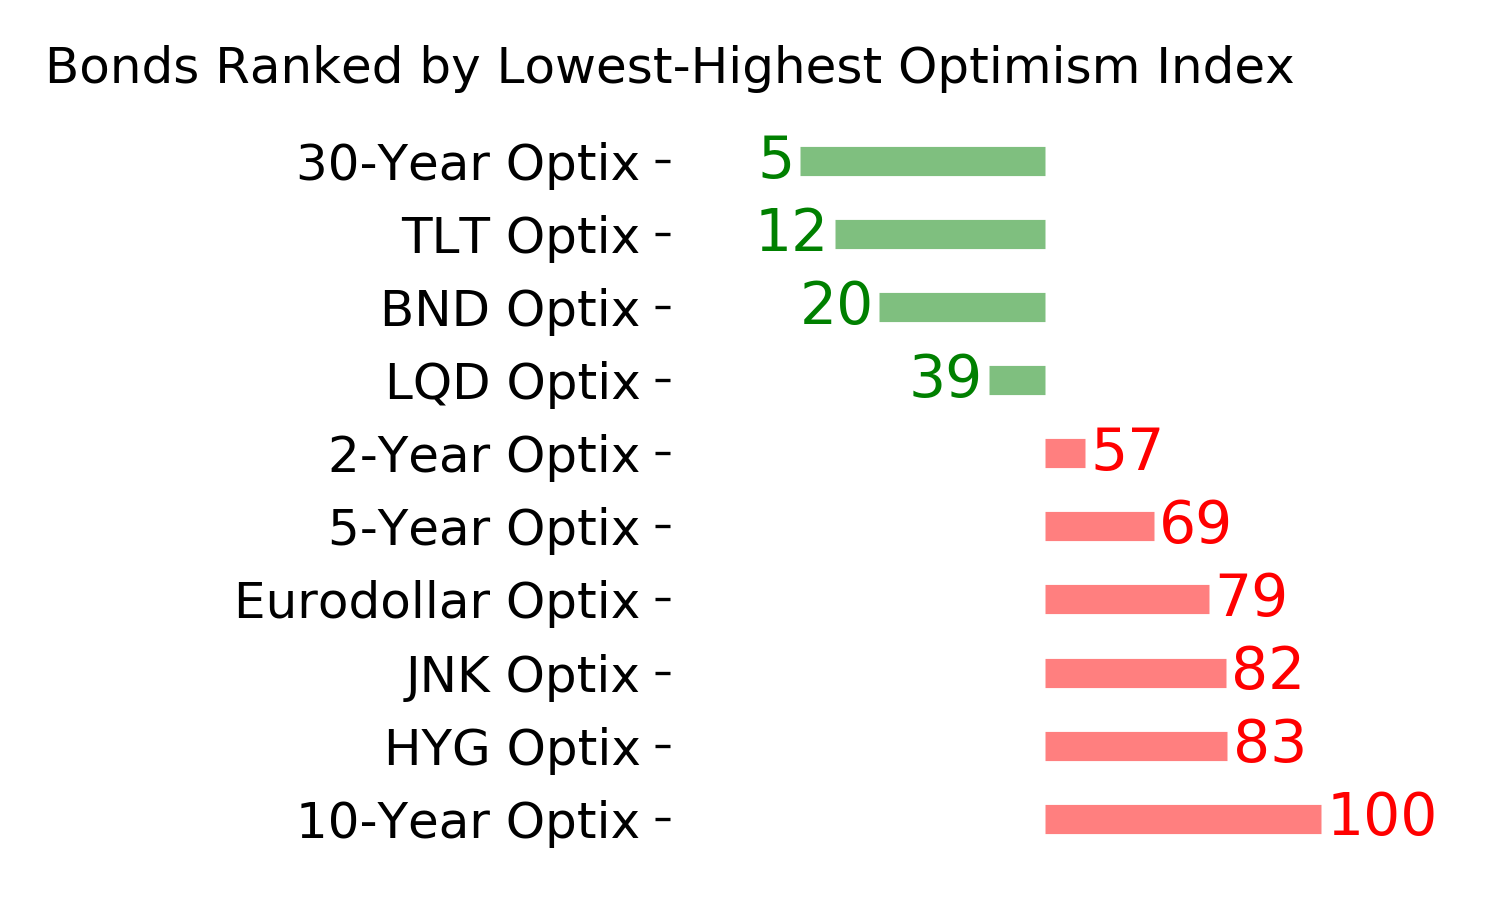
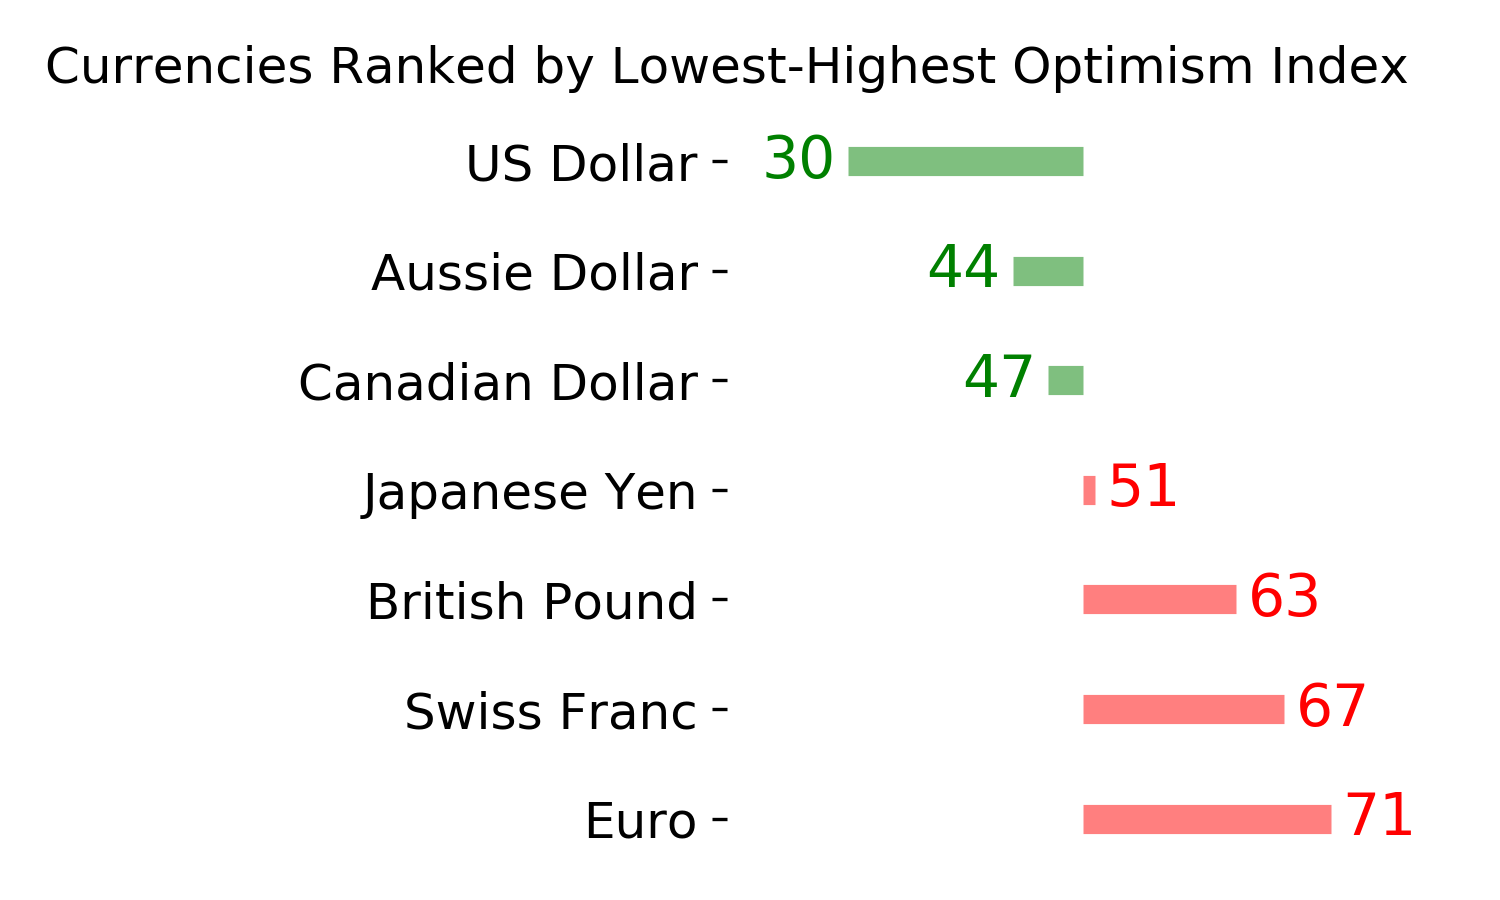
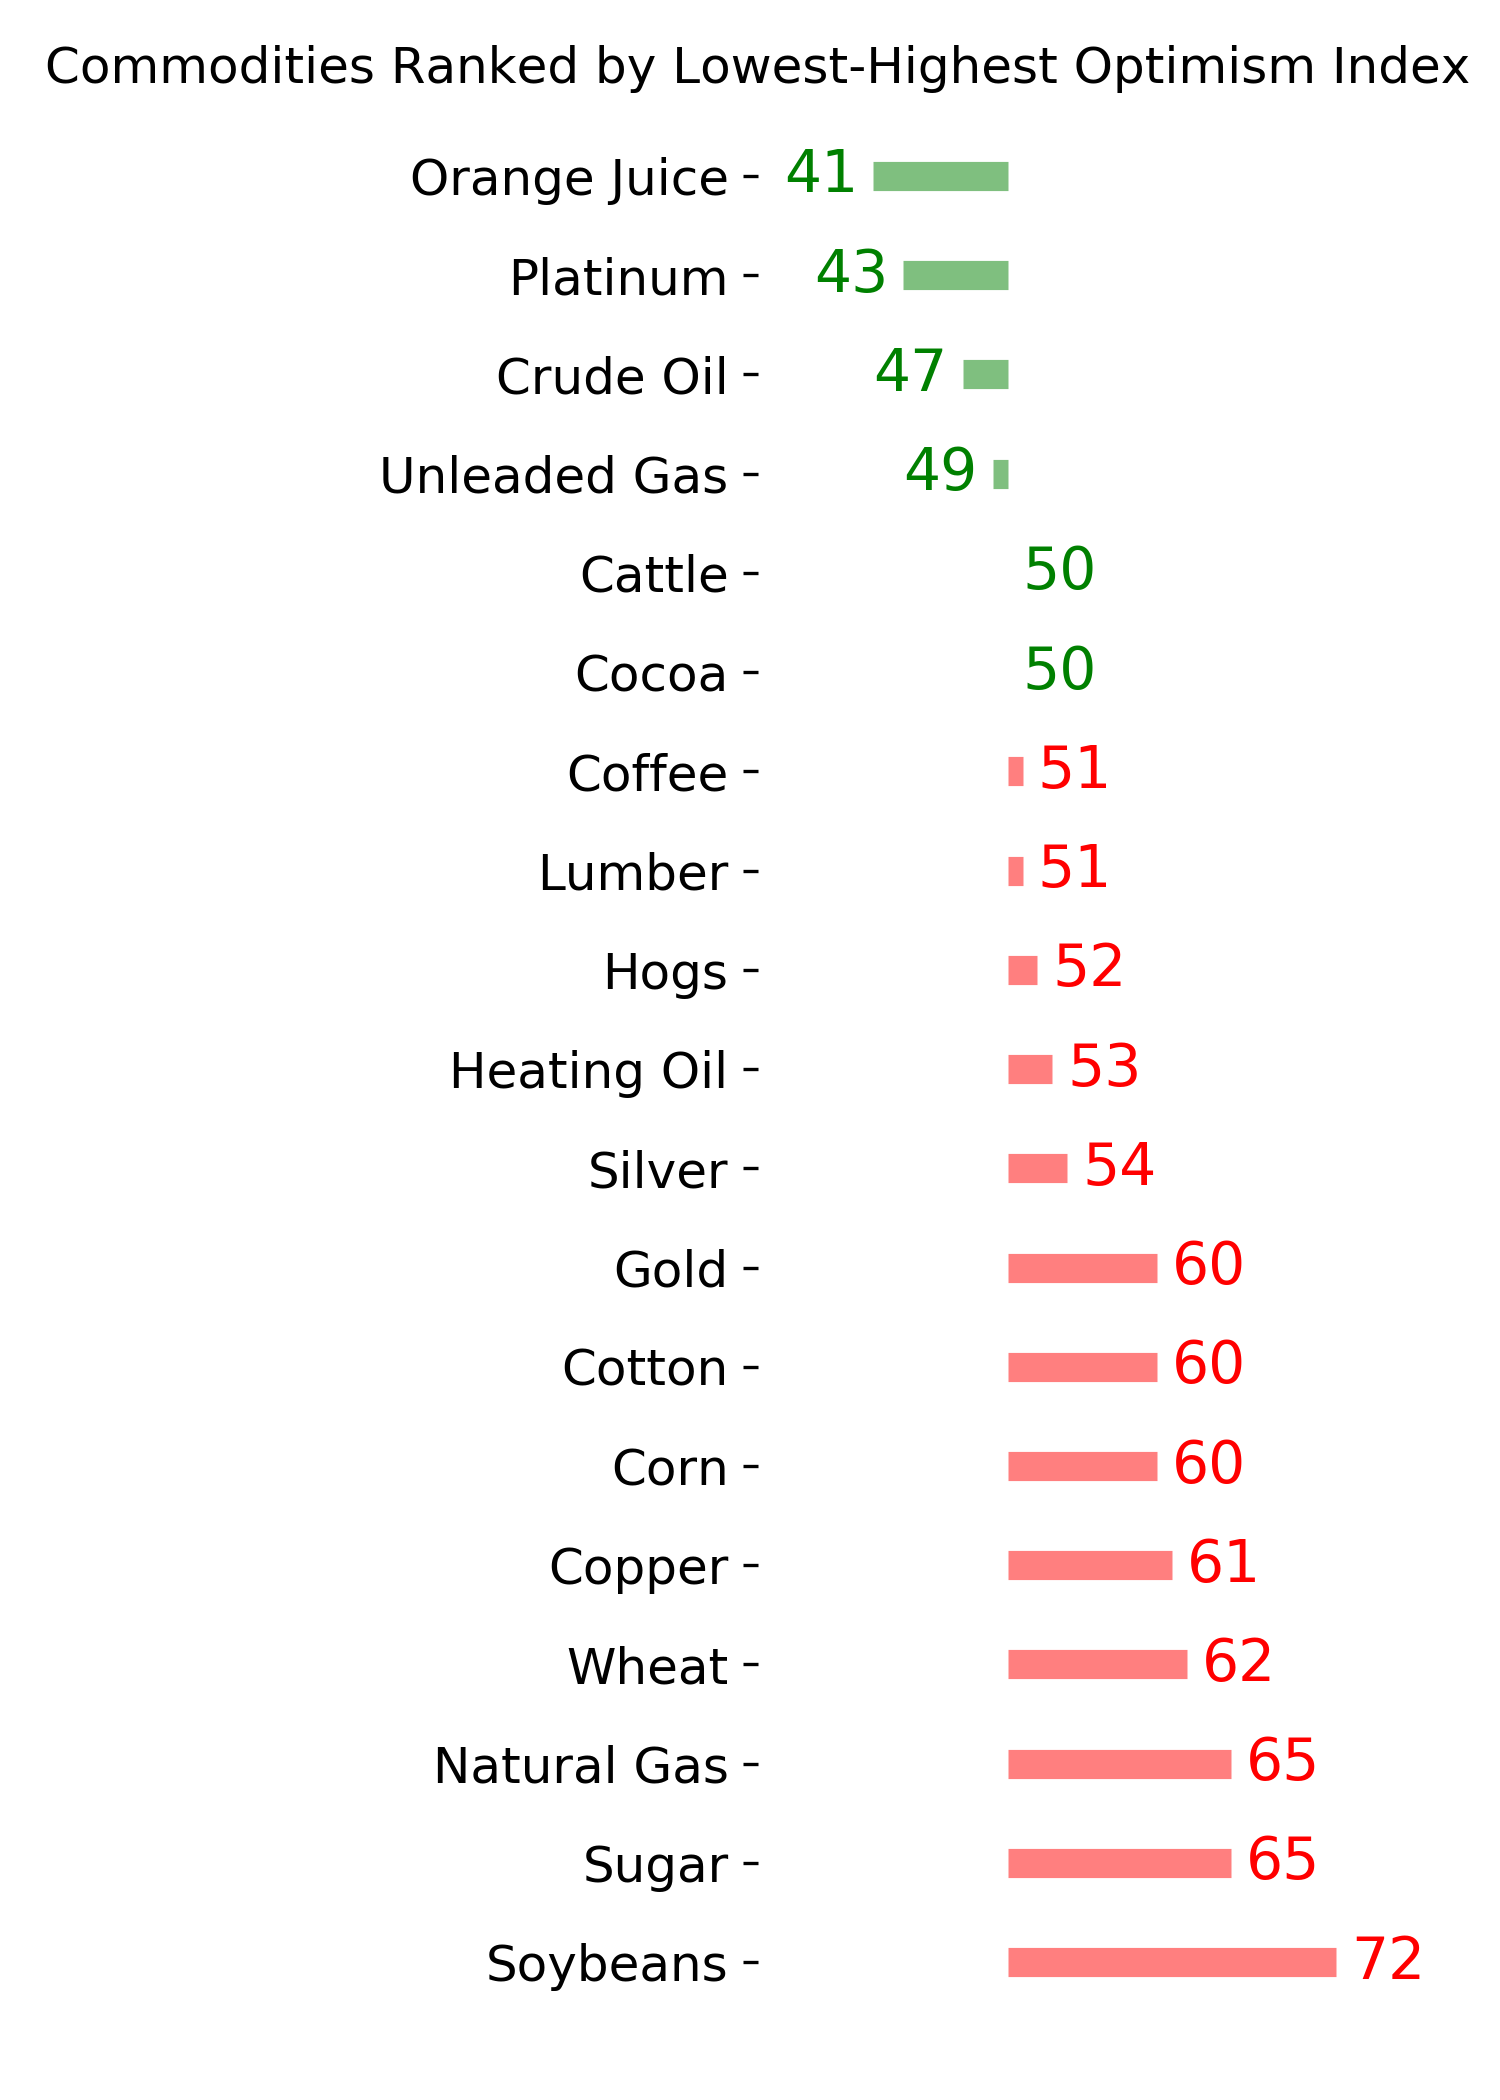
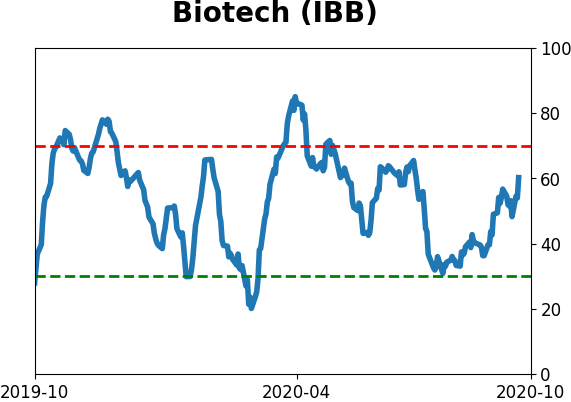
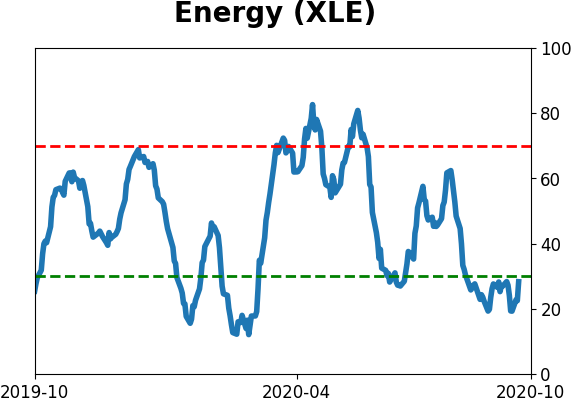
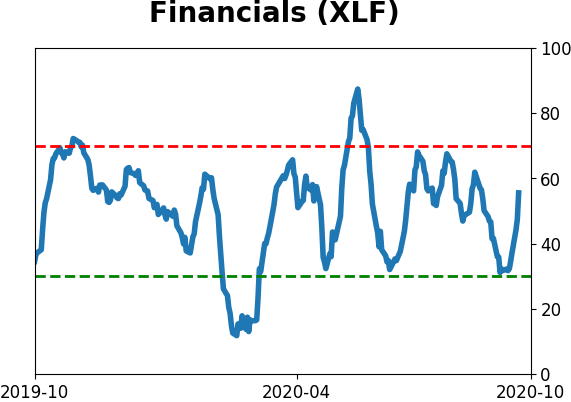
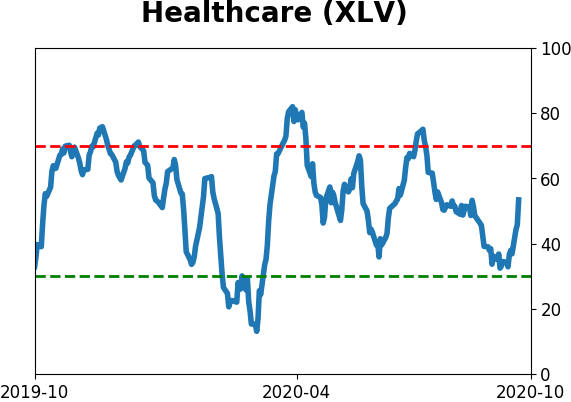
Optimism Index Thumbnails
|
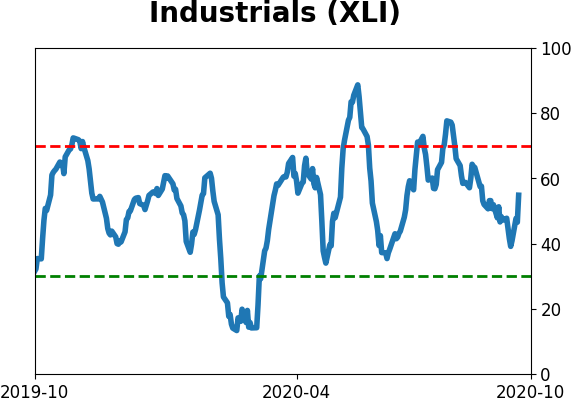
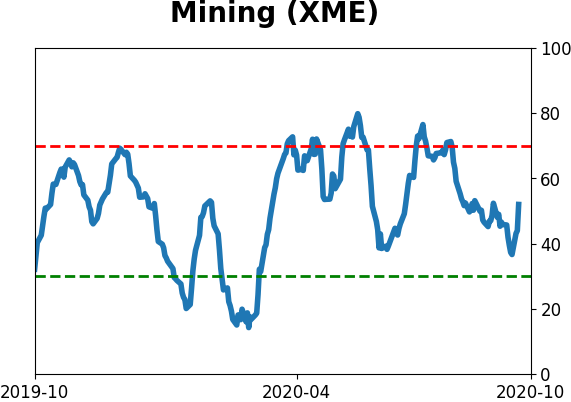
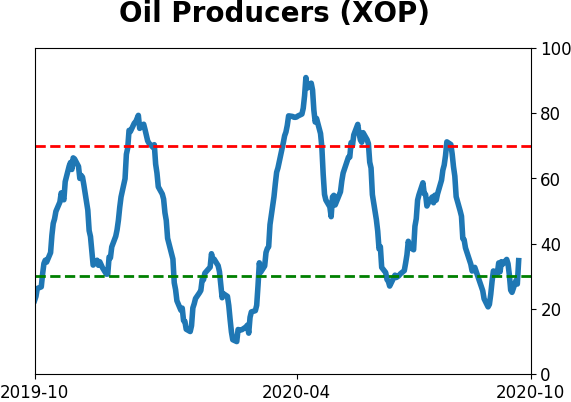
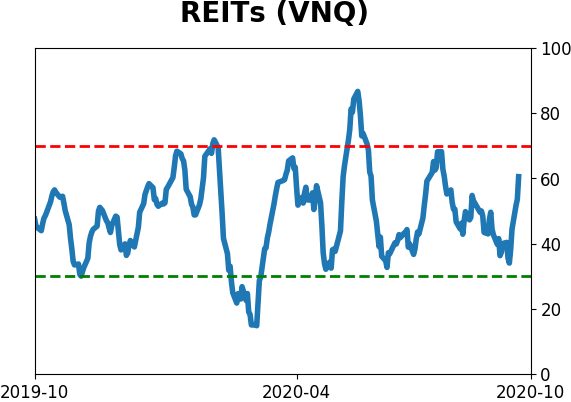
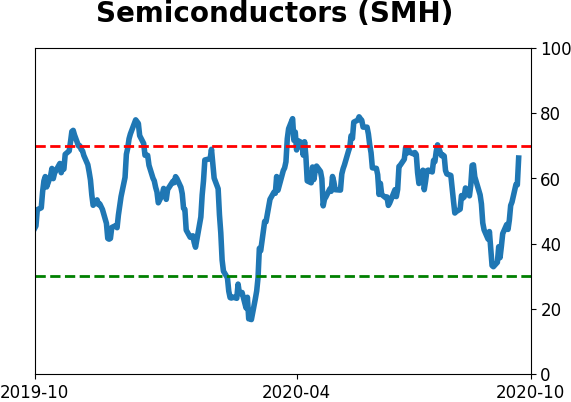
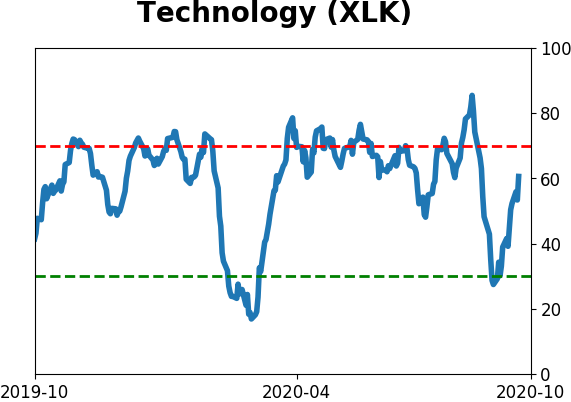
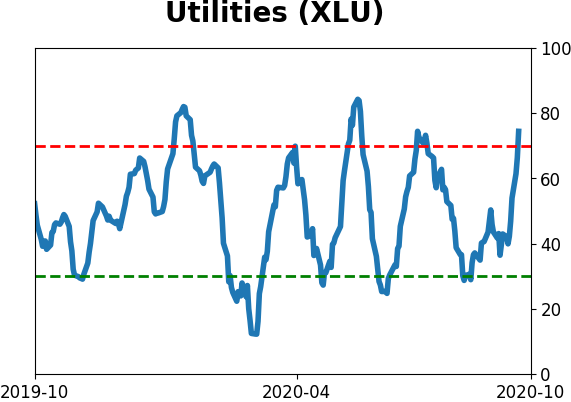
Sector ETF's - 10-Day Moving Average
|
|
|
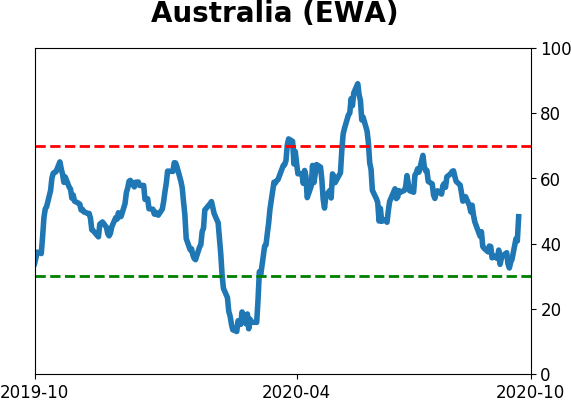
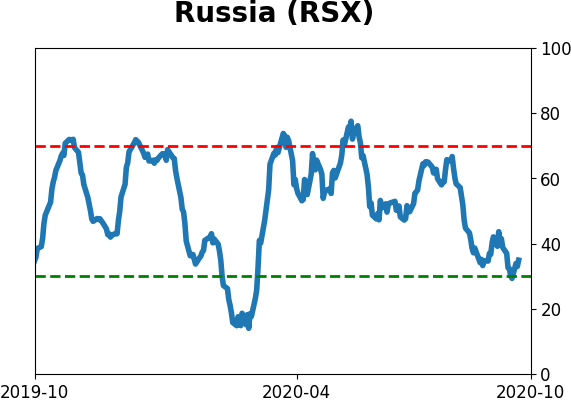
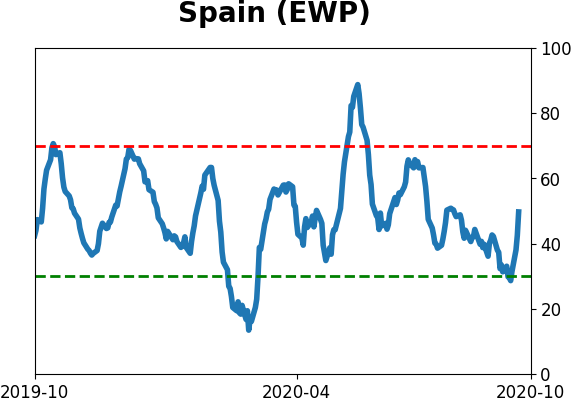
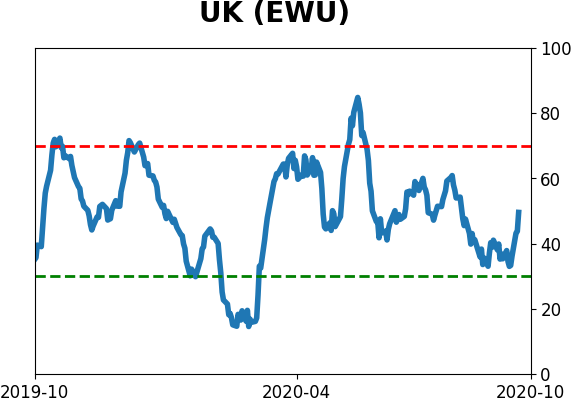
Country ETF's - 10-Day Moving Average
|
|
|
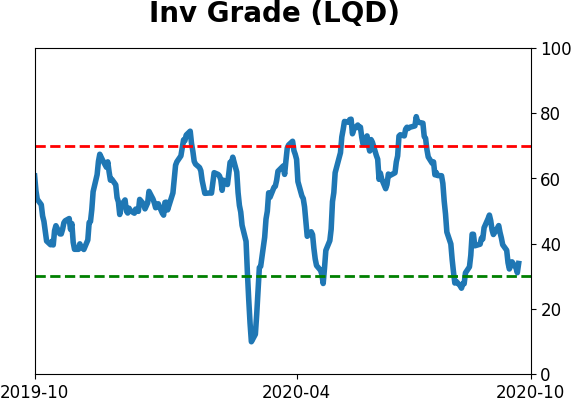
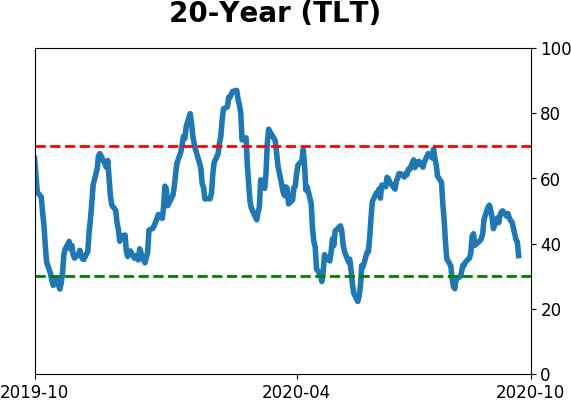
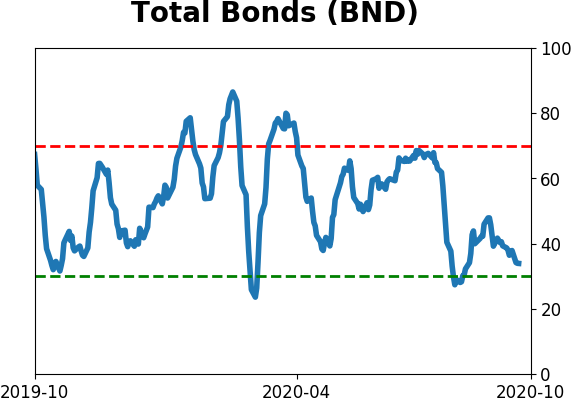
Bond ETF's - 10-Day Moving Average
|
|
|
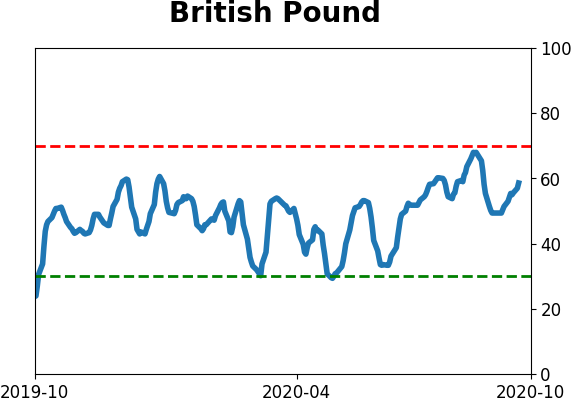
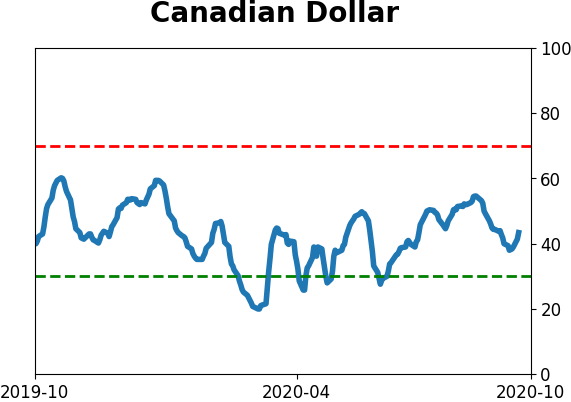
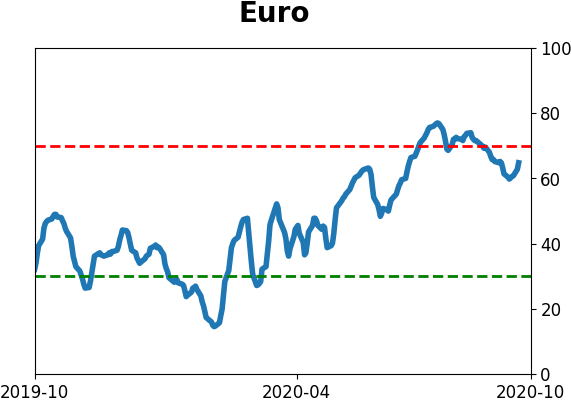
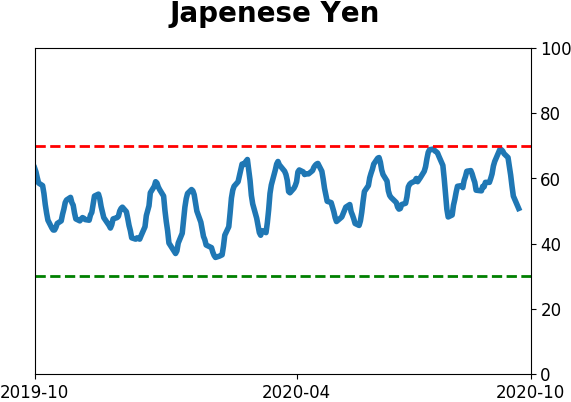
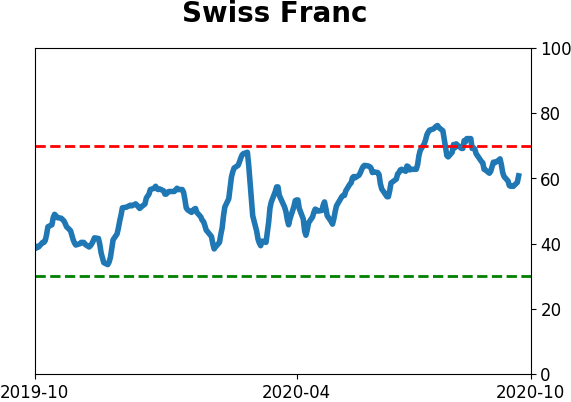
Currency ETF's - 5-Day Moving Average
|
|
|
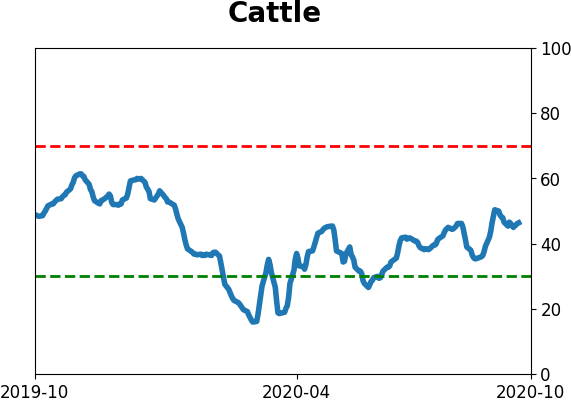
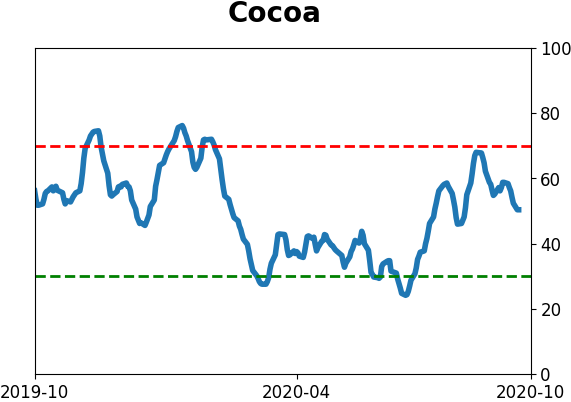
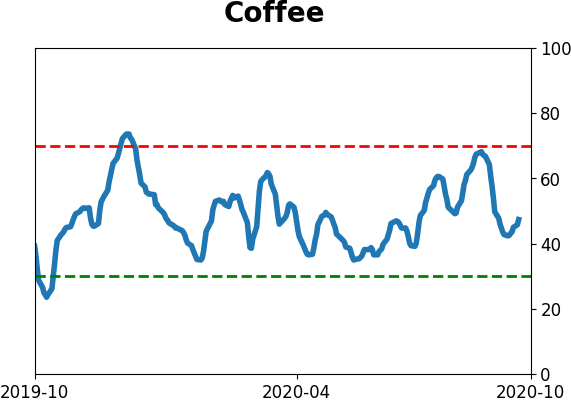
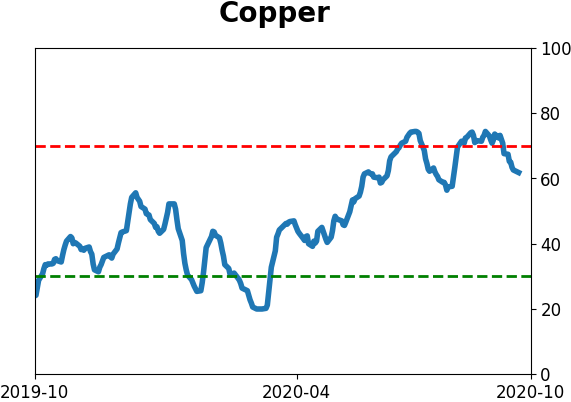
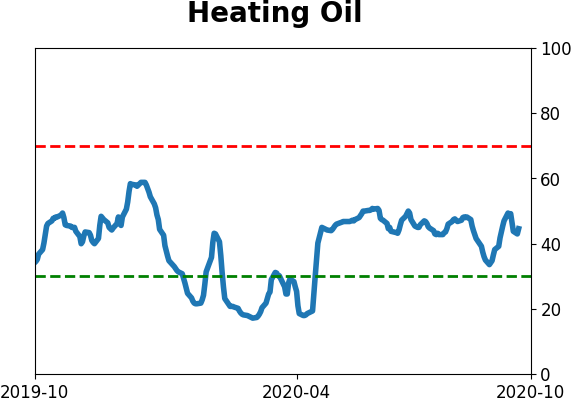
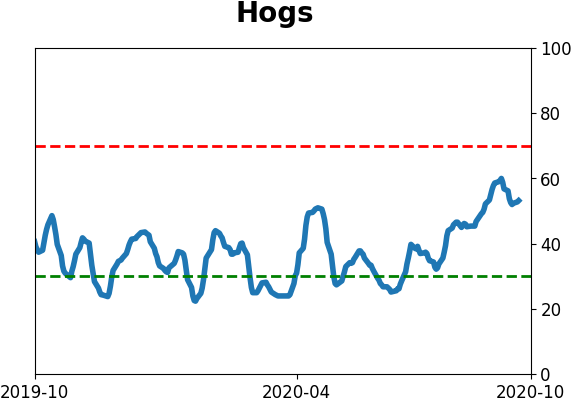
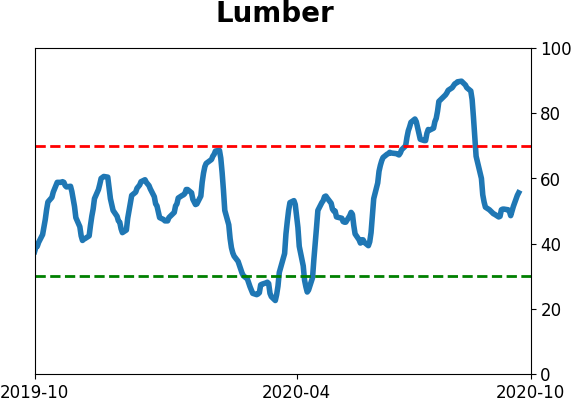
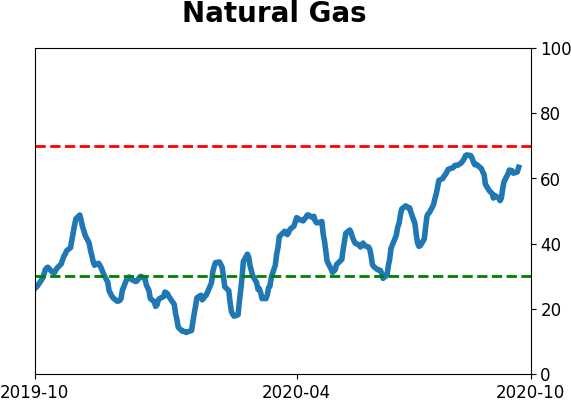
Commodity ETF's - 5-Day Moving Average
|
|