Headlines
|
|
The troops are leading the general:
The S&P 500's Cumulative Advance/Decline Line hit a new all-time high as the rally has broadened. This is leading the S&P 500 index itself, which is still below its own high. When the troops lead the general like this, it has typically led to positive forward returns.
Futures traders' odd position in Treasuries:
In recent weeks, hedgers in 10-year Treasury futures have gone net short, while being long the 30-year contract. It has happened to this degree only twice before, both of which preceded a massively steeper yield curve, falling dollar, and rising gold.
Bottom Line:
- A mixed environment favors becoming defensive if optimism is high and aggressive if low; currently, there is conflicting evidence but would slightly favor becoming more aggressive should optimistic extremes recede further
| Other Sectors and Assets |
| | Positives | Negatives | | 1. Energy (here and here) | 1. Skewed tech (here and here) |
| 2. Dollar test |
|
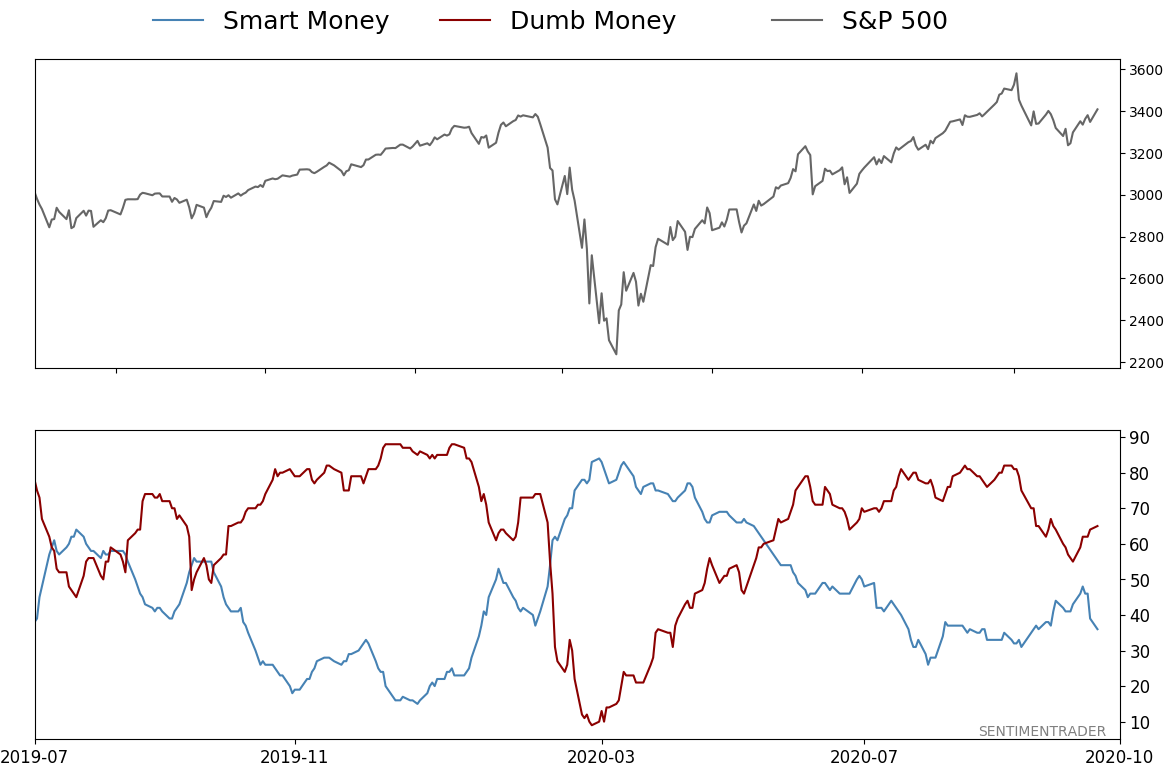
Smart / Dumb Money Confidence
|
Smart Money Confidence: 36%
Dumb Money Confidence: 65%
|
|
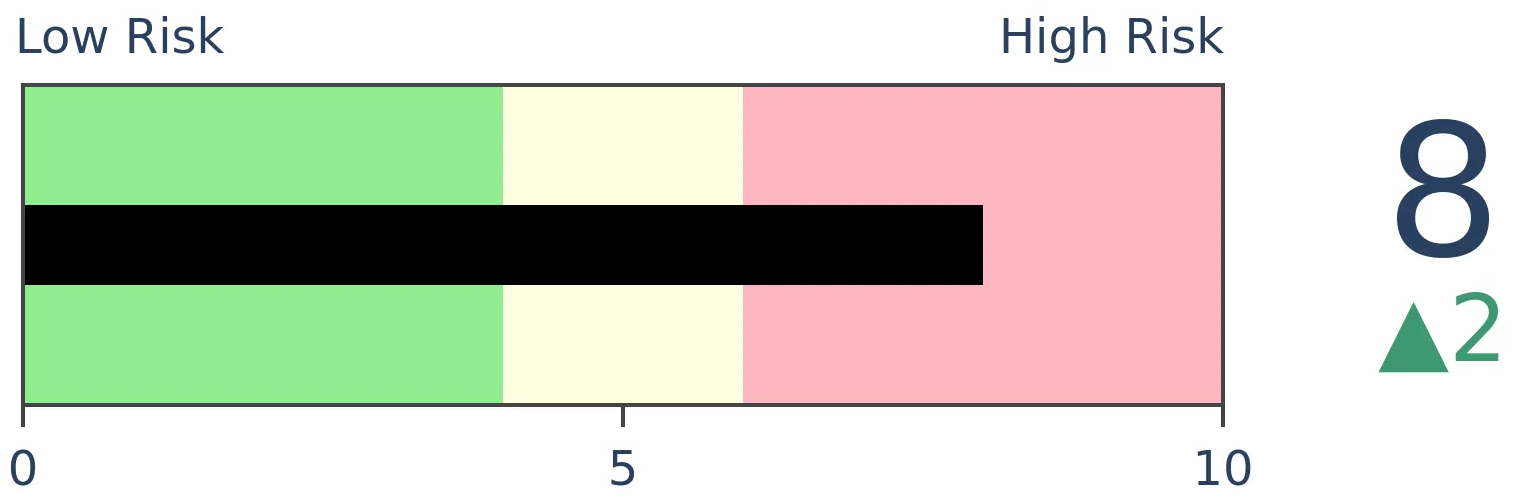
Risk Levels
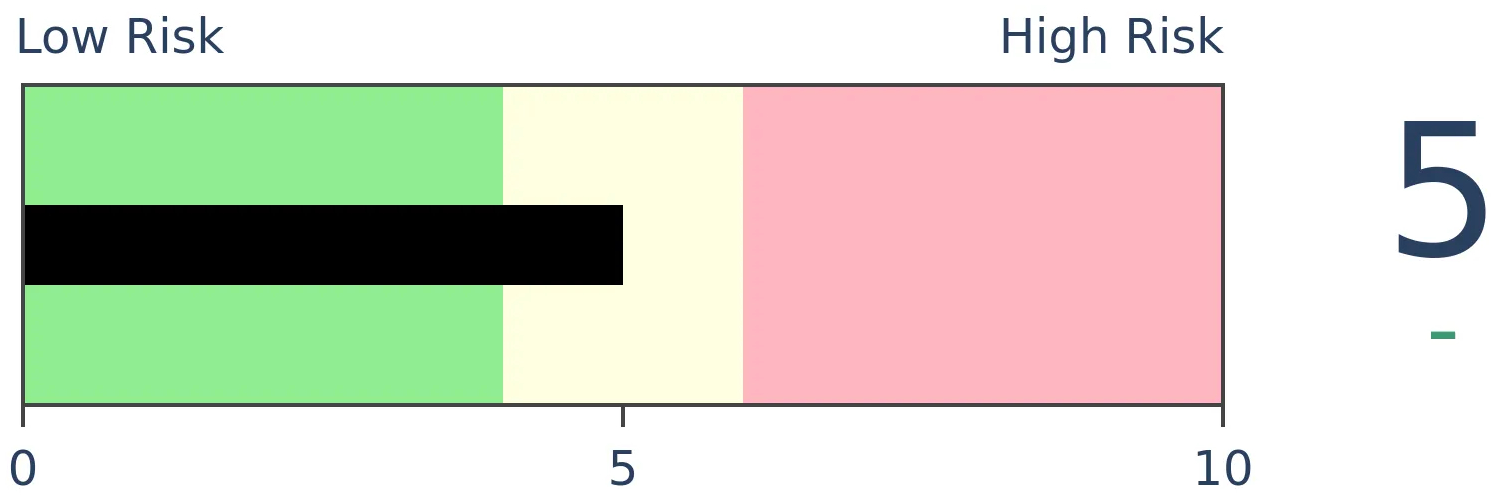
Stocks Short-Term
|
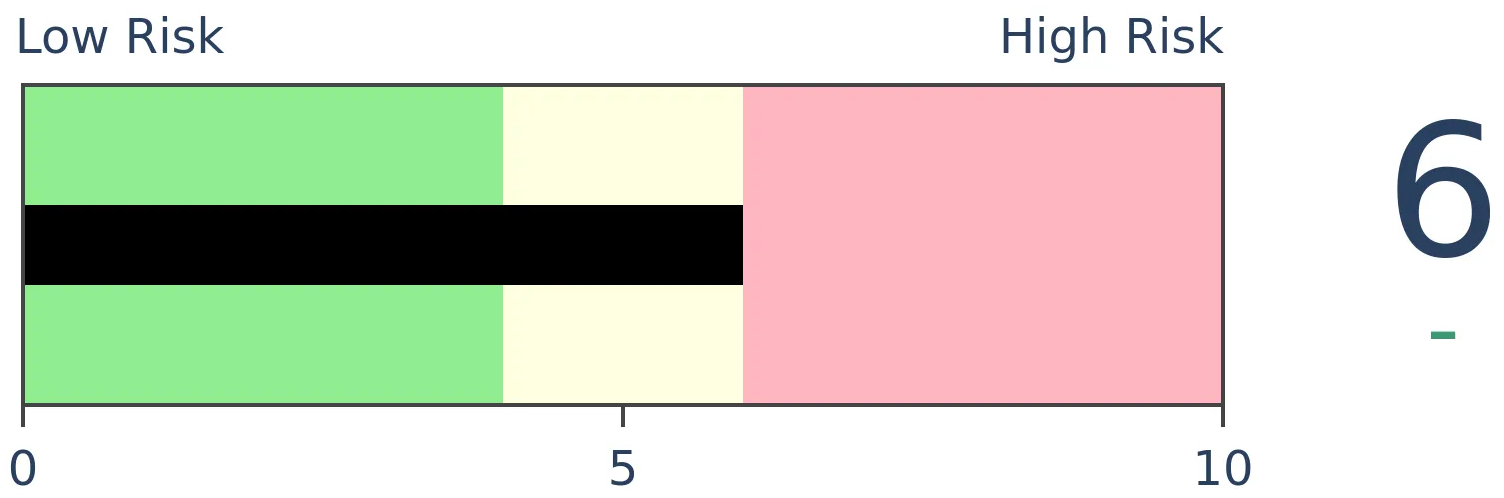
Stocks Medium-Term

|
|
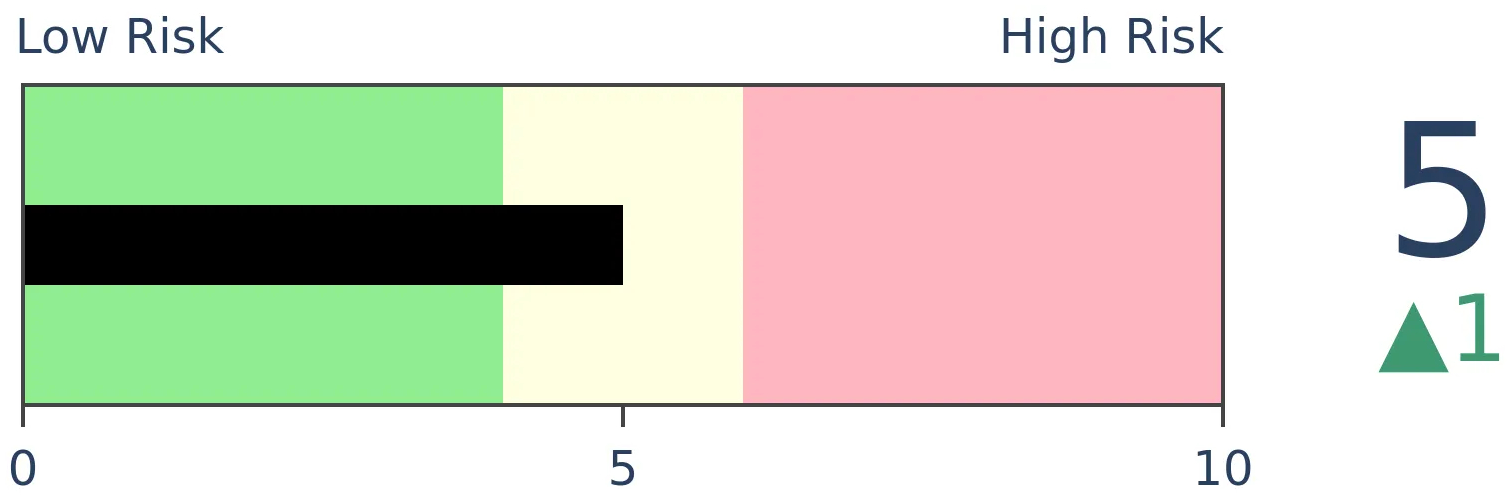
Bonds
|
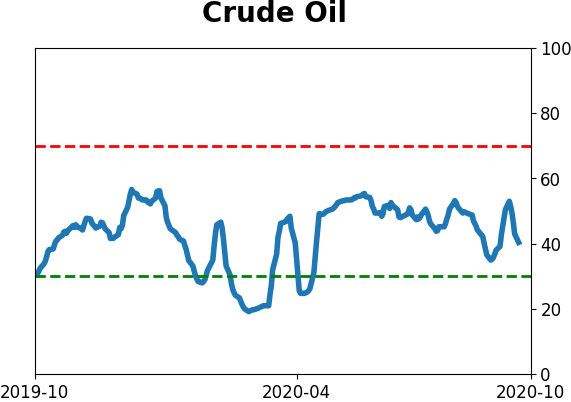
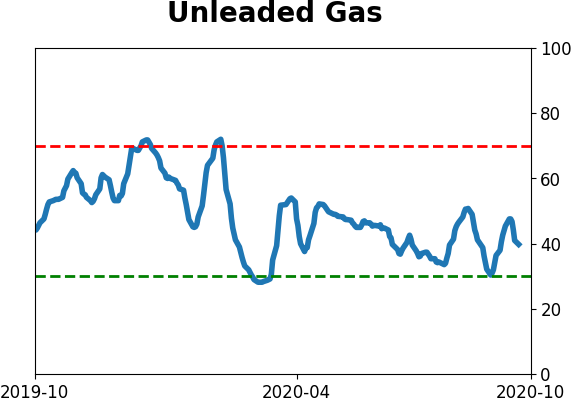
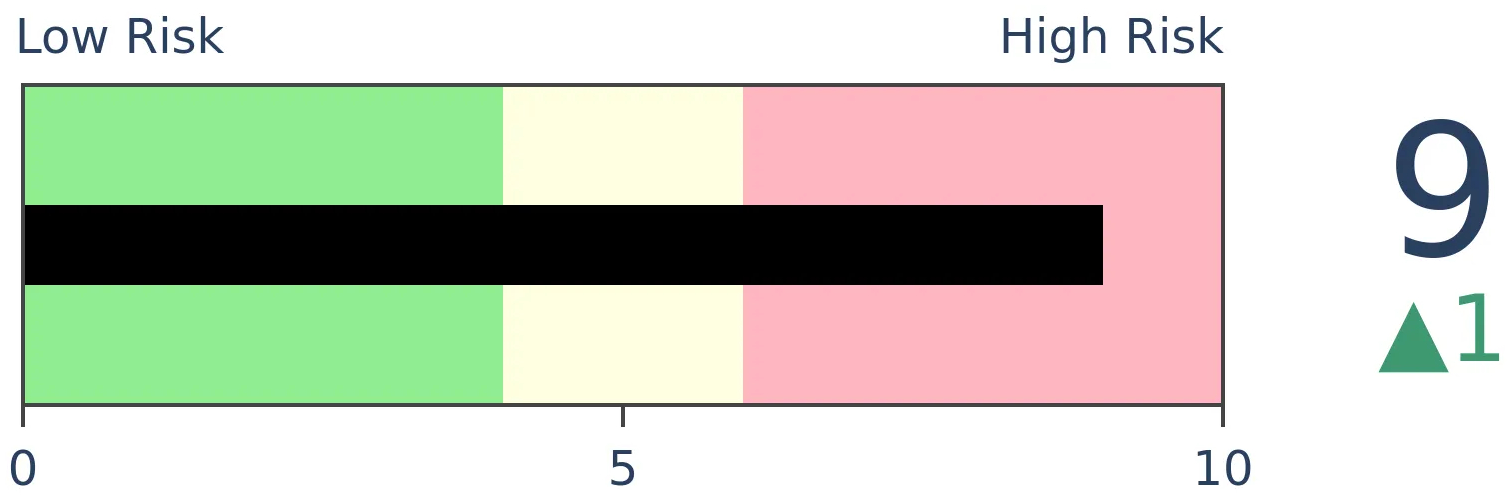
Crude Oil
|
|
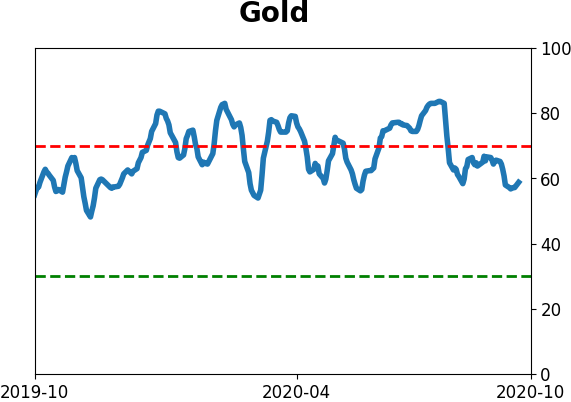
Gold
|
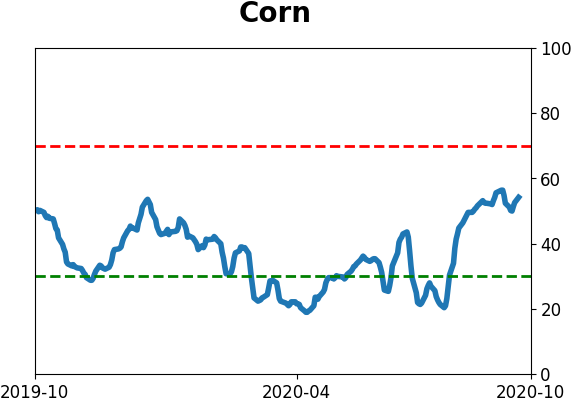
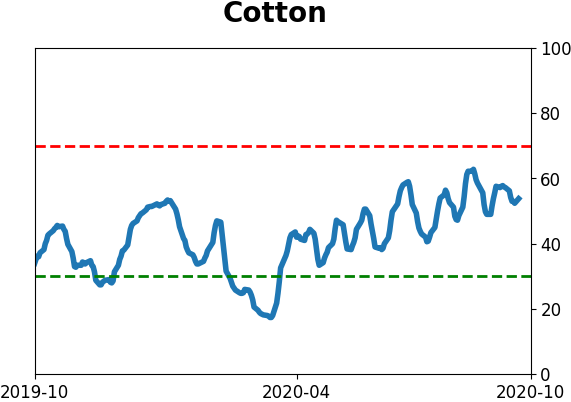
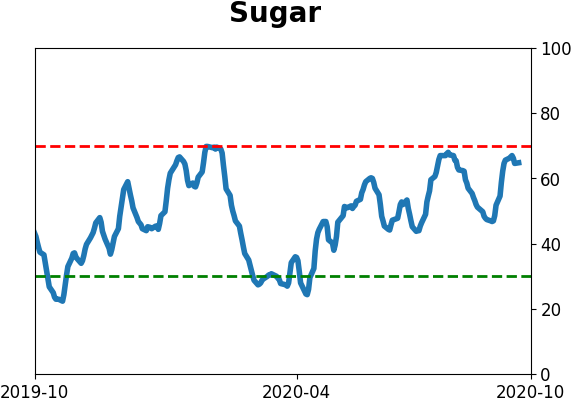
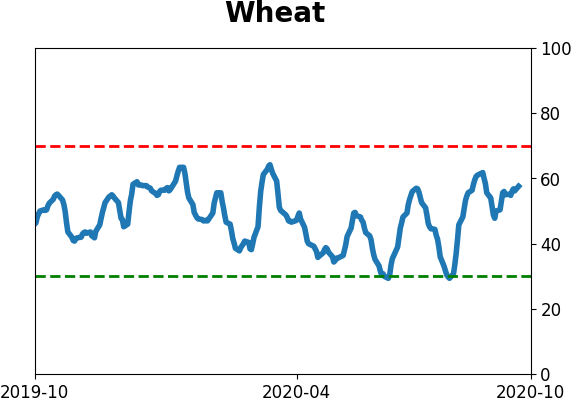
Agriculture
|
|
Research
BOTTOM LINE
The S&P 500's Cumulative Advance/Decline Line hit a new all-time high as the rally has broadened. This is leading the S&P 500 index itself, which is still below its own high. When the troops lead the general like this, it has typically led to positive forward returns.
FORECAST / TIMEFRAME
SPY -- Up, Medium-Term
|
For the first time in a month, there have been enough stocks in the S&P 500 rallying versus declining to push its Cumulative Advance/Decline Line to a 52-week (and all-time) high.
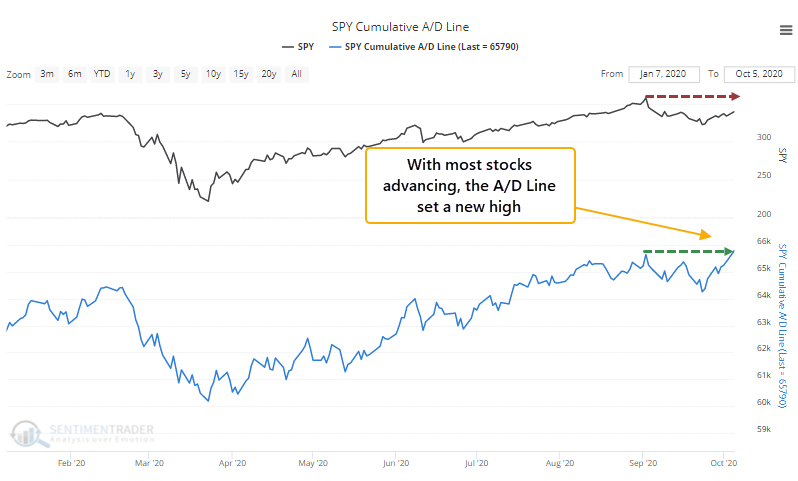
This may be notable, because the S&P 500 itself was dragged lower by some of the big tech stocks that had the air let out of them in September. It's a case where the troops are leading the general.
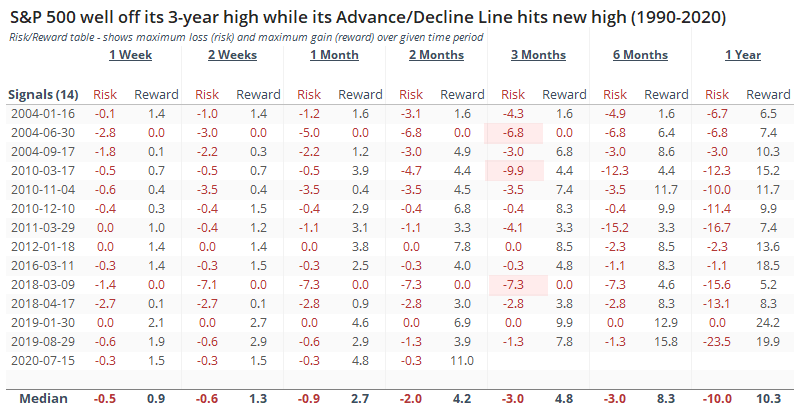
This is supposed to be wildly bullish, so let's check. We'll look for every time when the S&P's A/D Line made a 52-week high for the first time in at least a month, while the S&P 500 itself was more than 2.5% below its own high.
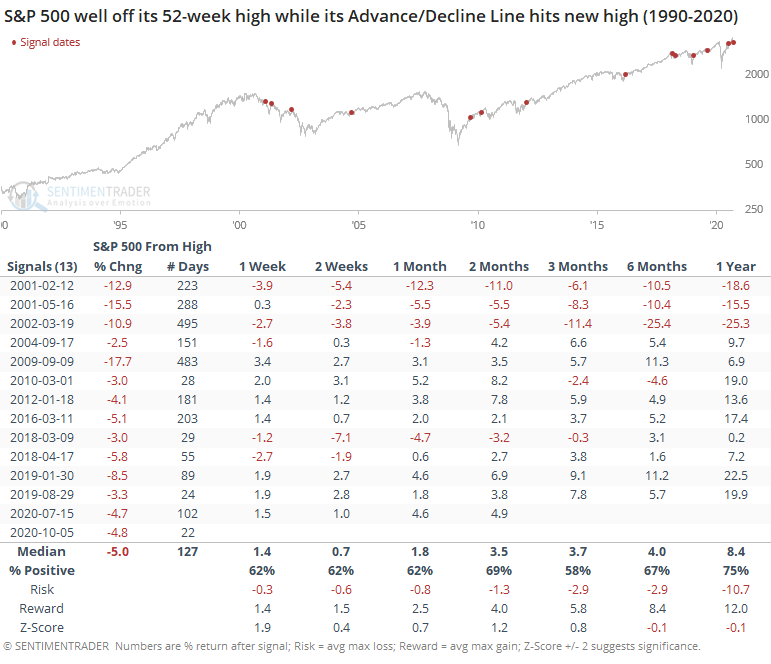
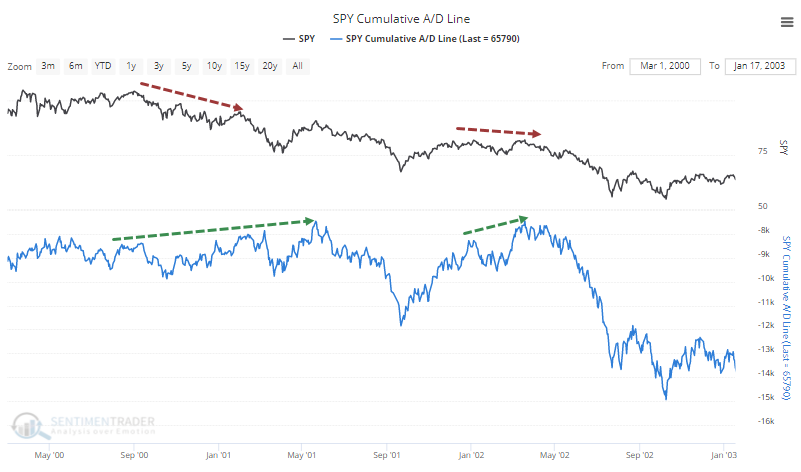
This was mostly a good sign. The only real exceptions were in 2001-02 when the A/D Line kept hitting new 52-week highs even while the S&P itself was mired in a pattern of lower lows and lower highs.
That's being a bit myopic because we're only looking at the A/D Line hitting its highest level in 52 weeks. On Monday, it hit a new all-time high. So if we look at larger extremes, at least over a 3-year time period, then forward returns improve.
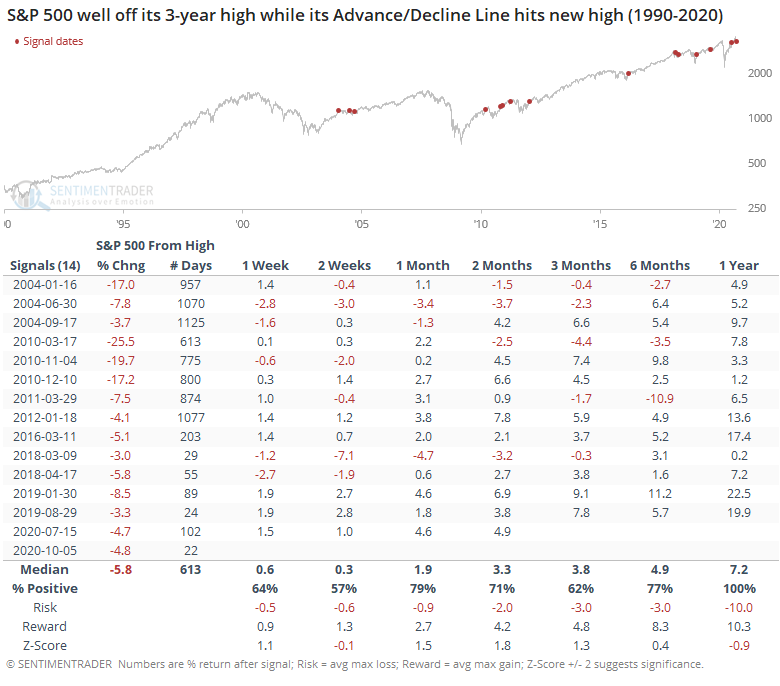
This was not a signal to put all spare cash to work and rush into a leveraged long position. Several of these signals saw medium-term choppiness, but at least the losses were fairly limited. Looking at the Risk/Reward table, only 3 of the 14 signals saw a loss of more than -5% at any point within the next 3 months.
This looks to be one of the cases where improving breadth despite a weak index has preceded better-than-average returns, at least over a medium-term time frame. The broader NYSE Cumulative Advance/Decline Line and the one only including common stocks have not yet set new highs for this move, so it would help if they also got in line in the coming days.
BOTTOM LINE
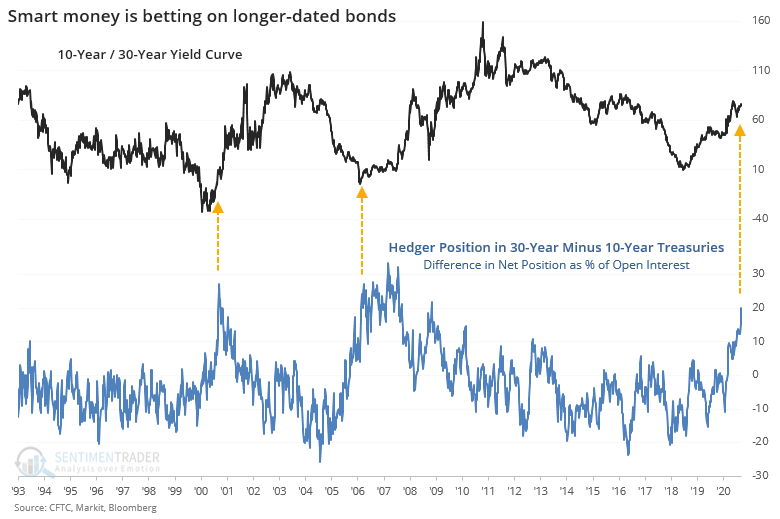
In recent weeks, hedgers in 10-year Treasury futures have gone net short, while being long the 30-year contract. It has happened to this degree only twice before, both of which preceded a massively steeper yield curve, falling dollar, and rising gold.
FORECAST / TIMEFRAME
None
|
In recent weeks, futures traders have been taking unusual positions in long-term Treasury contracts. As noted by Bloomberg, it looks like bets on the yield curve.
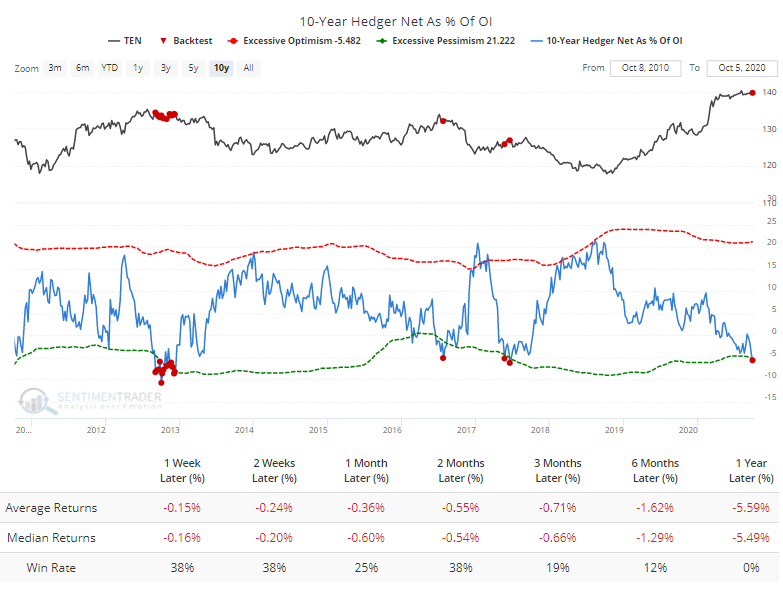
The differences in positioning are stark depending on whether we look at the 10-year note or 30-year bond. In the 10-year, "smart money" commercial hedgers are net short more than 5% of the open interest. Over the past decade, the Backtest Engine shows that the note declined after similar extremes.
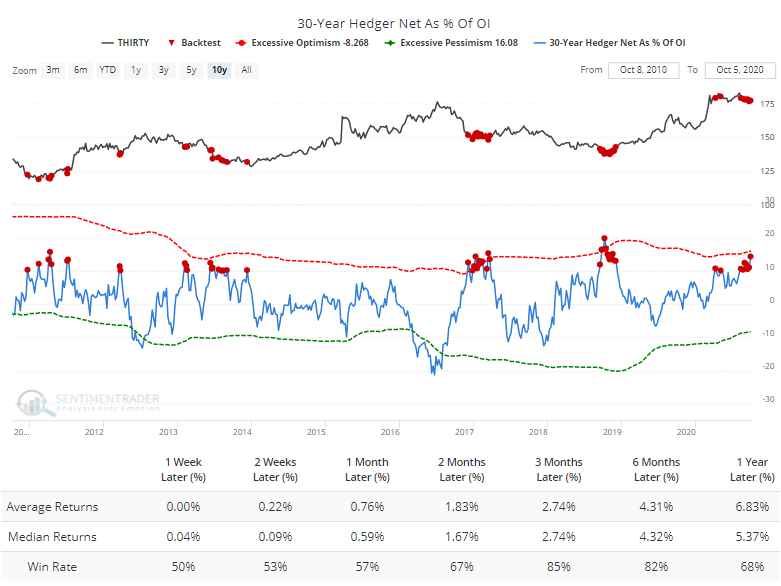
But in the 30-year contract, hedgers are heavily net long, which the Engine shows has led to mostly higher returns. This is exactly as it should be for a "smart money" indicator.
To see whether these bets have meant anything for the yield curve in the past, the chart below shows the difference in hedger positions in 30-year minus 10-year Treasury futures, expressed as a percentage of open interest. The higher the blue line, the more hedgers are betting on rising long-term bond prices and/or against intermediate-term note prices.
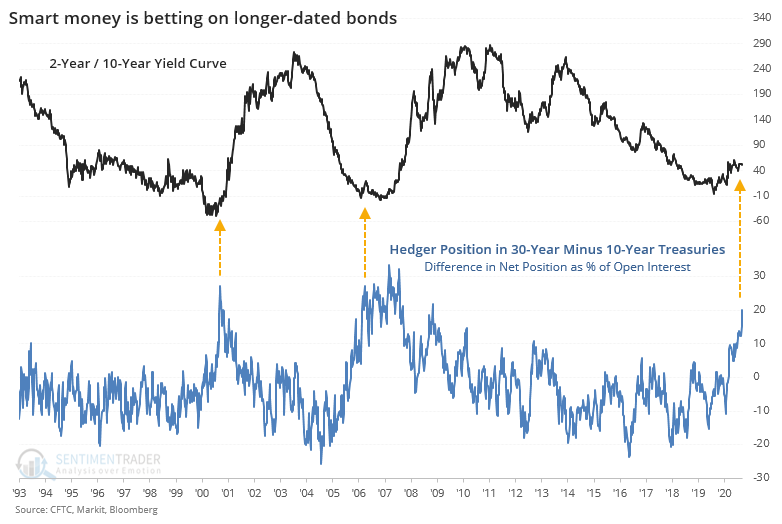
Looking at the typical 2-year / 10-year yield curve, this spread is rather astounding - it reached +20% right before the spread blew out and soared higher over the next 2-3 years. Both times, the spread went from being negative to the 10-year yielding at least 2.5% more than the 2-year.
If we instead use the yield curve of the 10-year and 30-year contracts themselves, then it's a similar story. Both times, the yield on the 30-year jumped much more than that of the 10-year, which may not be what we would expect given how the contracts have behaved over the past decade following extremes in this data.
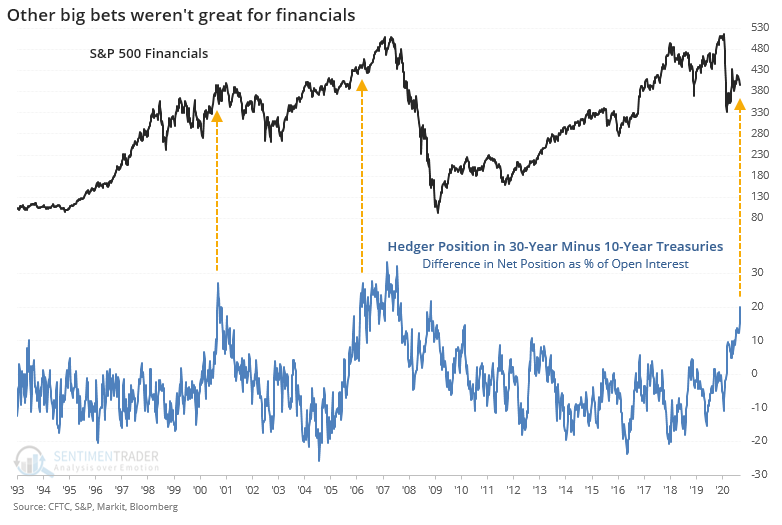
This is often used as a fundamental input for the financial sector. Using that as the comparison index does not look encouraging. While not necessarily top-ticking the bull markets, financials struggled mightily.
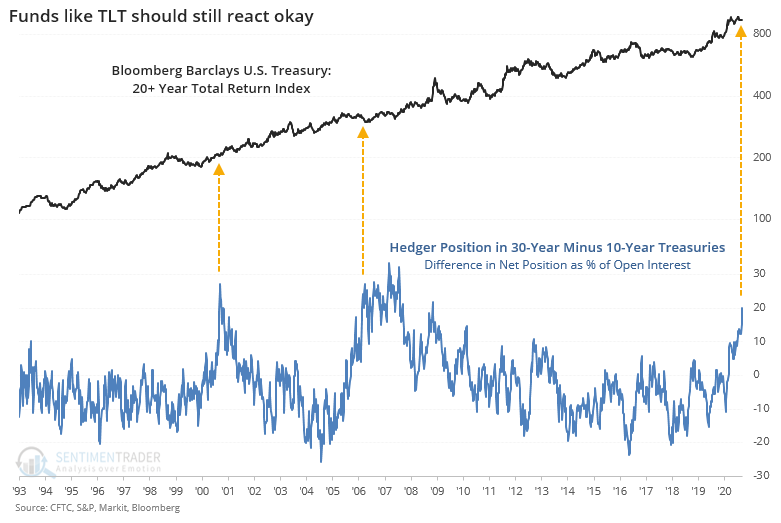
This difference in positioning causes a dilemma for the mom-and-pop trader, who uses funds like TLT as a proxy for "bonds" yet key off the 10-year yield as their guide to what the "bond market" is up to. The TLT fund has an effective maturity of about 25 years, so definitely skewed toward the longer end. When the spread in hedger positions reached this extreme the other two times, the total return of the underlying index fared very well, rising more than 44% within the next 3 years both times.
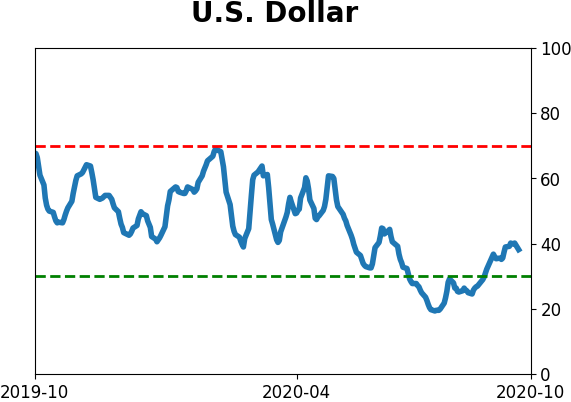
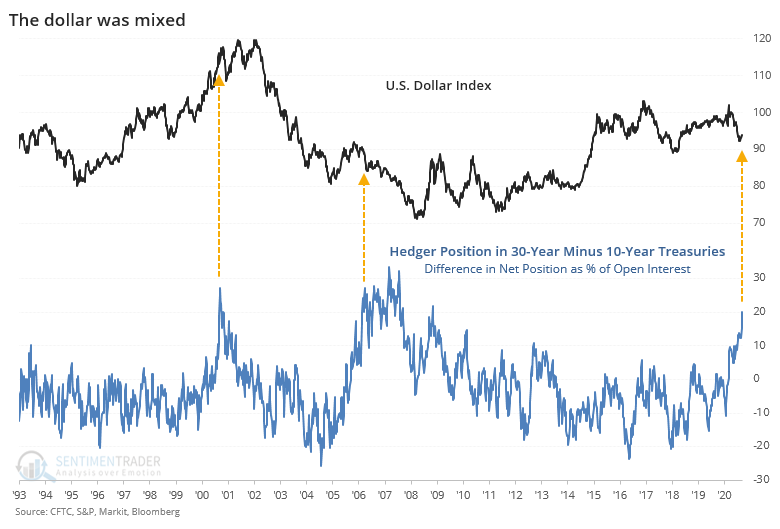
For the U.S. dollar, it preceded a couple of choppy years then a plunge the first time, and just a plunge the second time.
Both preceded massive gains for gold, rising more than 40% within the first 3 years of the September 2000 signal and 78% after the March 2006 one.
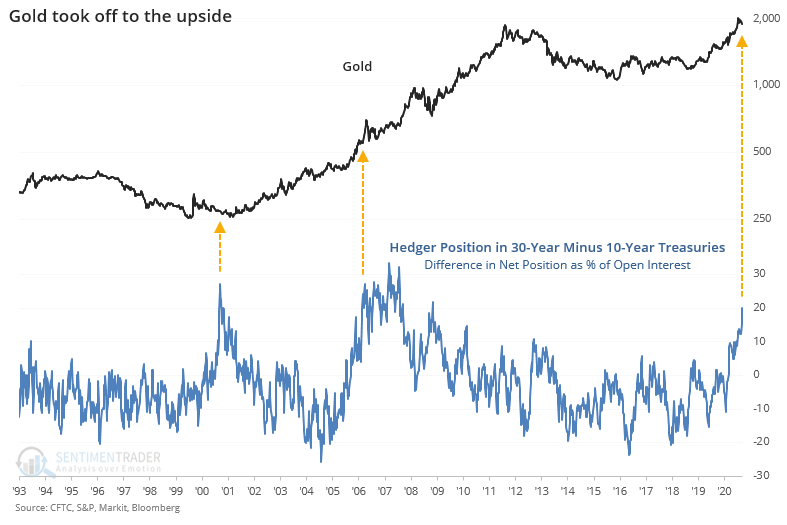
There are a whole lot of guesses about the upcoming presidential election, deficit spending, and economic recovery. While the sample size is painfully small, using the positioning of traders in 10- and 30-year Treasuries, it looks like a good bet is a steeper yield curve and rising gold.
Active Studies
| Time Frame | Bullish | Bearish | | Short-Term | 0 | 0 | | Medium-Term | 2 | 8 | | Long-Term | 47 | 2 |
|
Indicators at Extremes
Portfolio
| Position | Description | Weight % | Added / Reduced | Date | | Stocks | 15.2% RSP, 7.2% XLE | 22.4 | Added 3% | 2020-10-02 | | Bonds | 10% BND, 10% SCHP, 10% ANGL | 29.9 | Reduced 0.1% | 2020-10-02 | | Commodities | GCC | 2.4 | Reduced 2.1%
| 2020-09-04 | | Precious Metals | GDX | 4.7 | Added 5% | 2020-09-09 | | Special Situations | | 0.0 | Reduced 5% | 2020-10-02 | | Cash | | 40.6 | | |
|
Updates (Changes made today are underlined)
It's been a really mixed picture lately. In stocks, we saw huge momentum and a spike in speculation, then September managed to wring much of that out, except in the options market which is still a worry. There seem to be offsetting positives and negatives, with a mixed market environment, not the kind of setup where I feel comfortable being aggressive. I did add a bit to energy. The older I get, the less interested I am in short-term gyrations, and I don't really care about the coming days or even weeks. I'm fairly confident that the total return will be positive over a longer time frame given some of the developments we've looked in over the past week. With bonds, I decided to swap TLT for ANGL, a high-yield corporate fund with a heavy focus on energy bonds. Hedgers are heavily short 10-year Treasuries, and the high-yield market has held up well internally.
RETURN YTD: -1.2% 2019: 12.6%, 2018: 0.6%, 2017: 3.8%, 2016: 17.1%, 2015: 9.2%, 2014: 14.5%, 2013: 2.2%, 2012: 10.8%, 2011: 16.5%, 2010: 15.3%, 2009: 23.9%, 2008: 16.2%, 2007: 7.8%
|
|
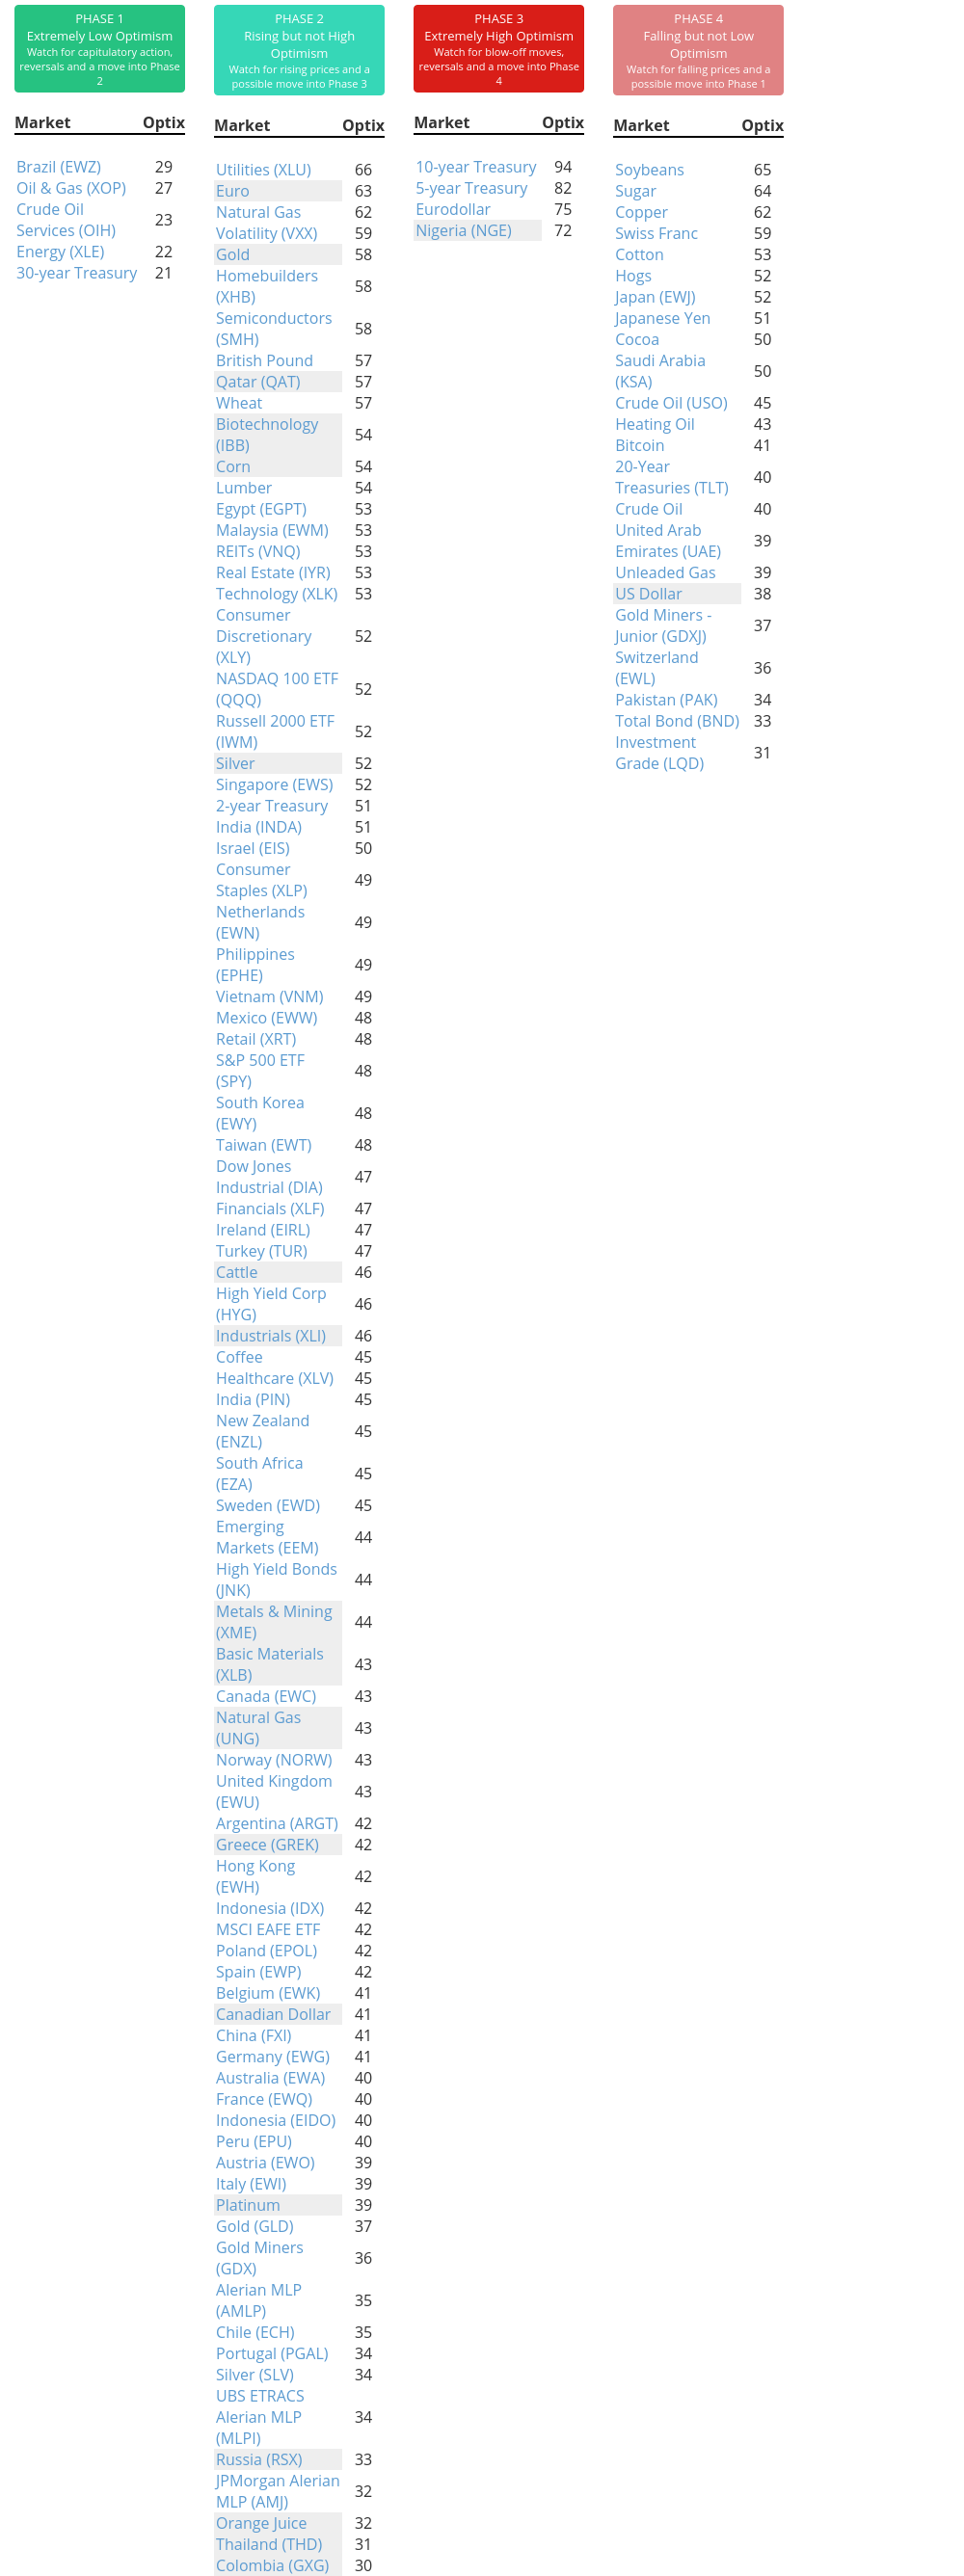
Phase Table
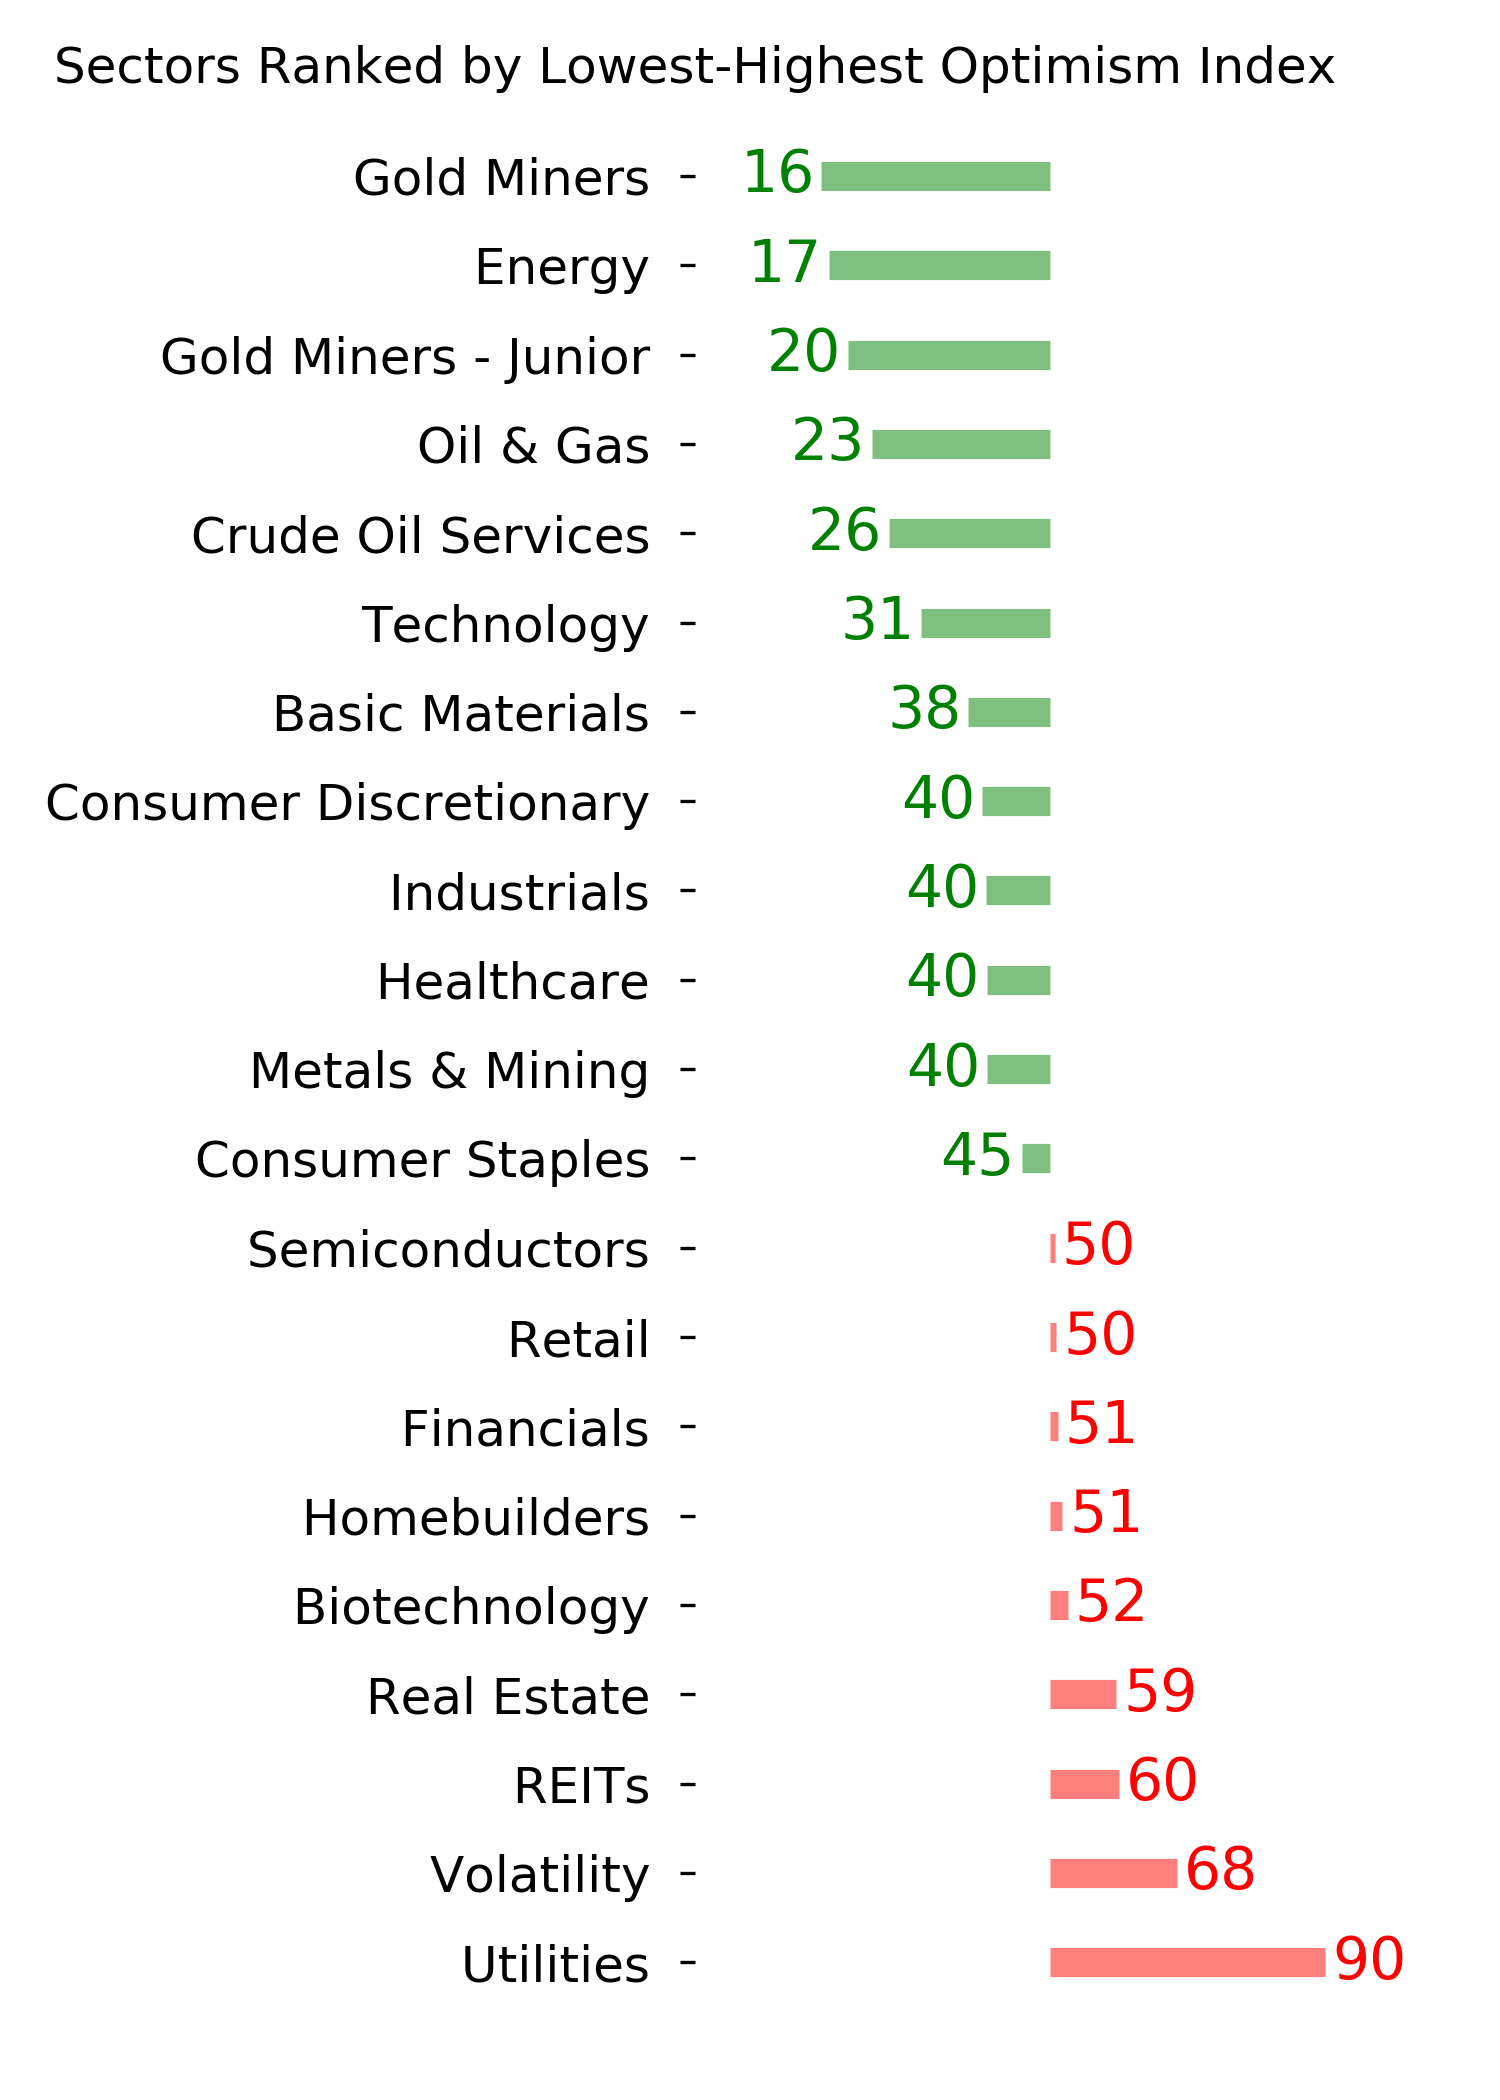
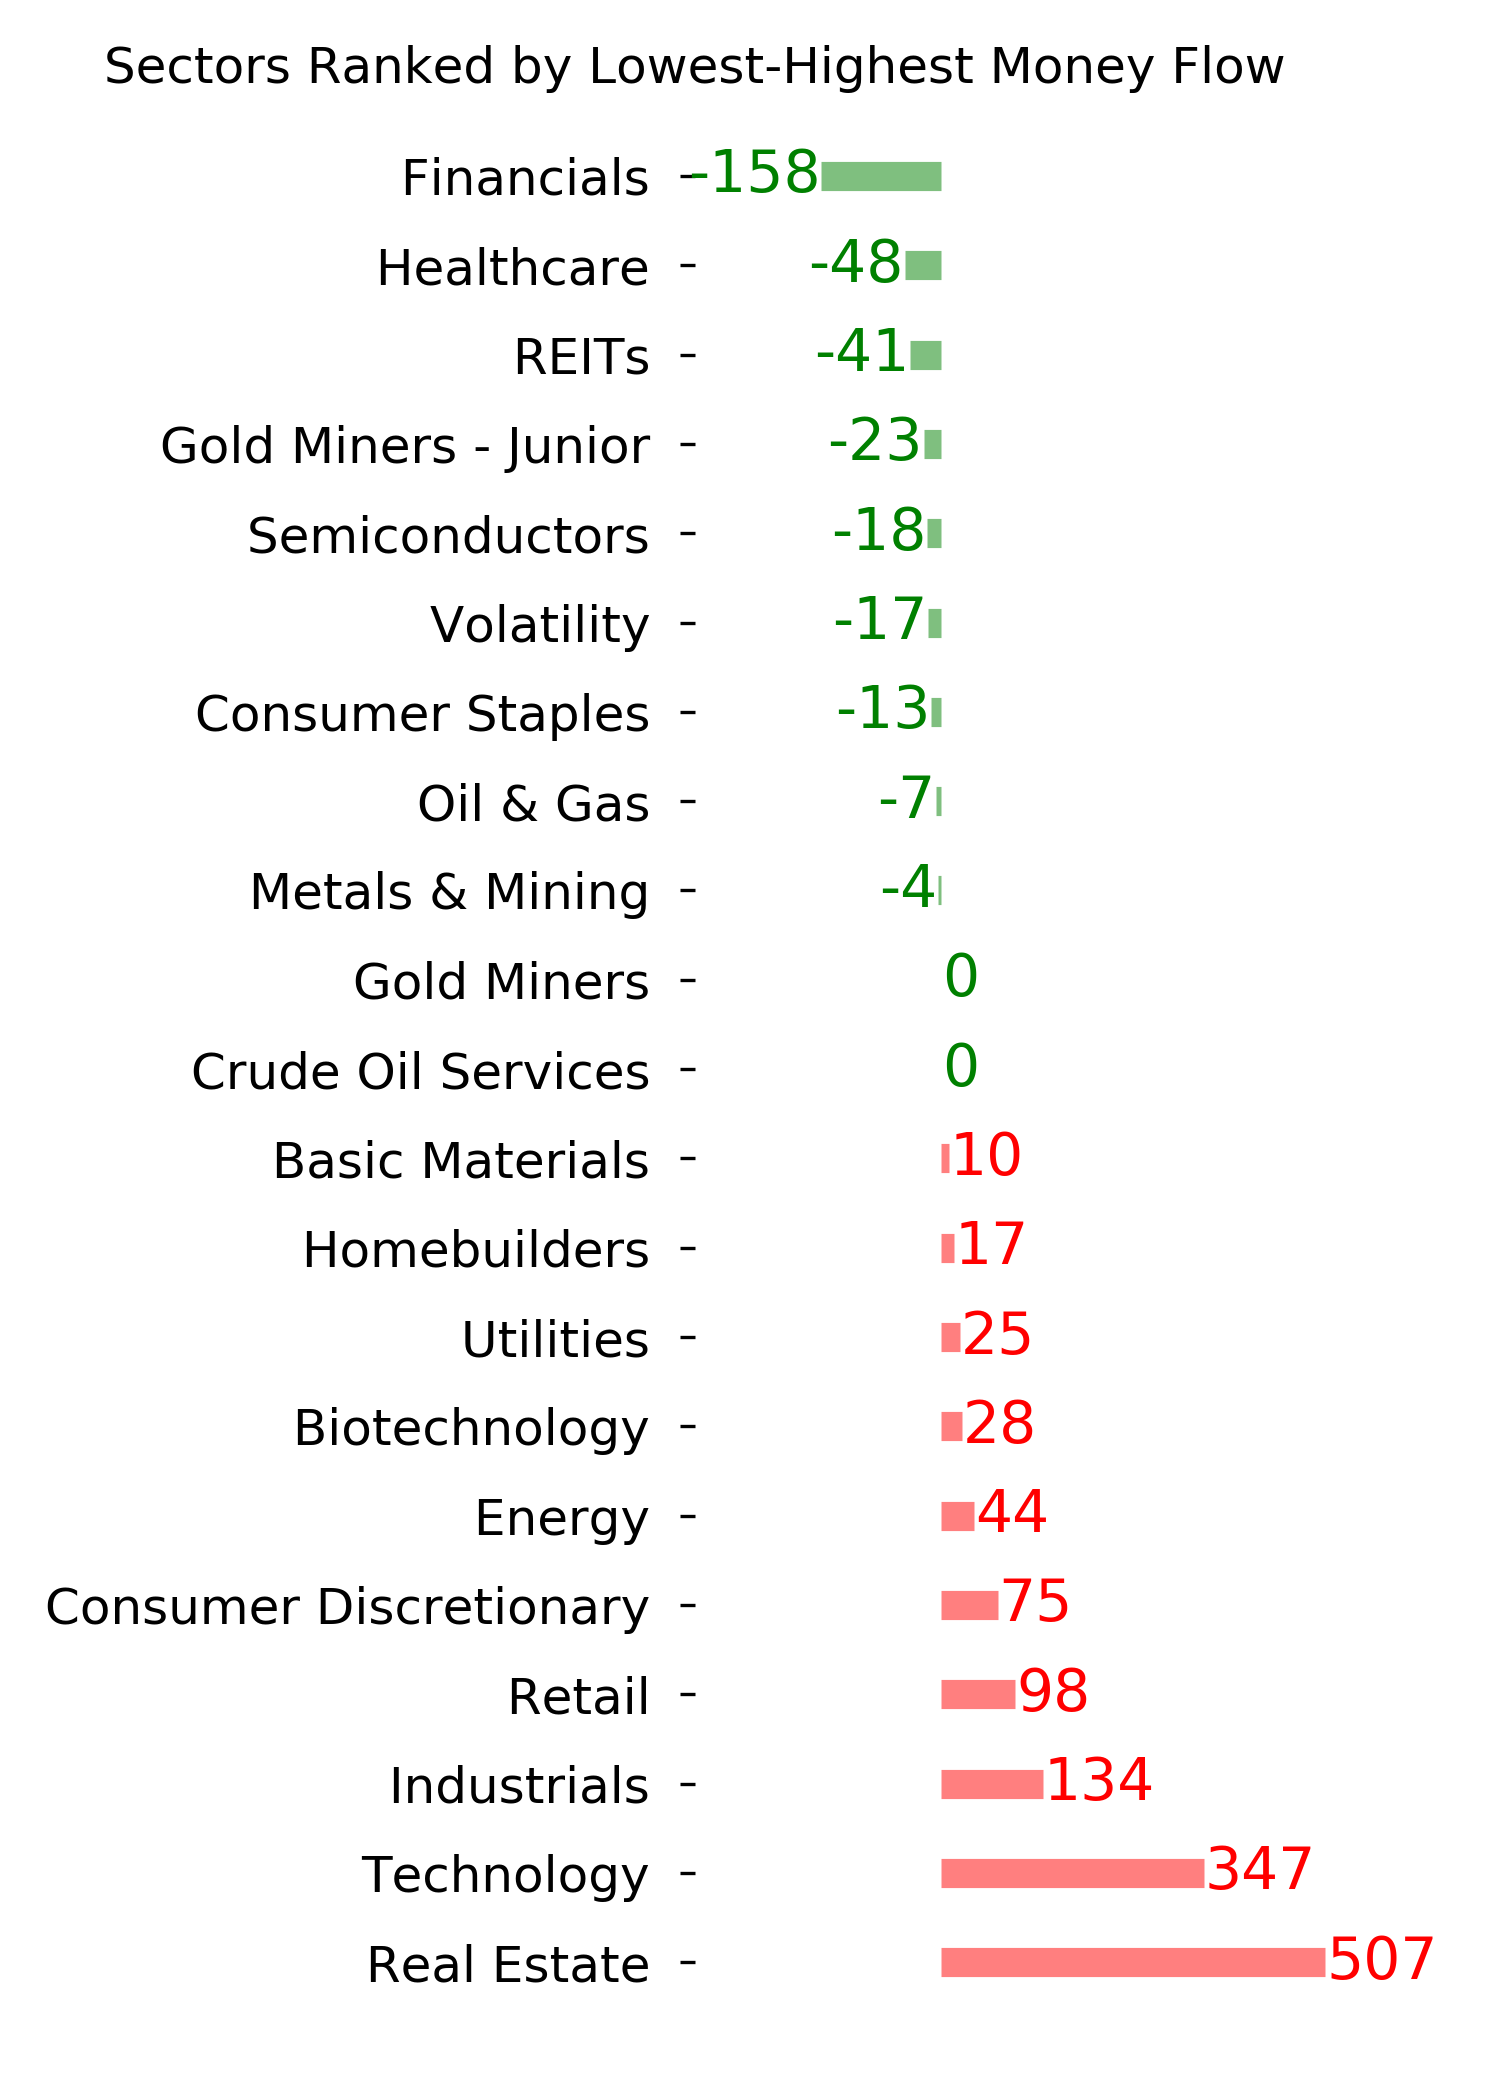
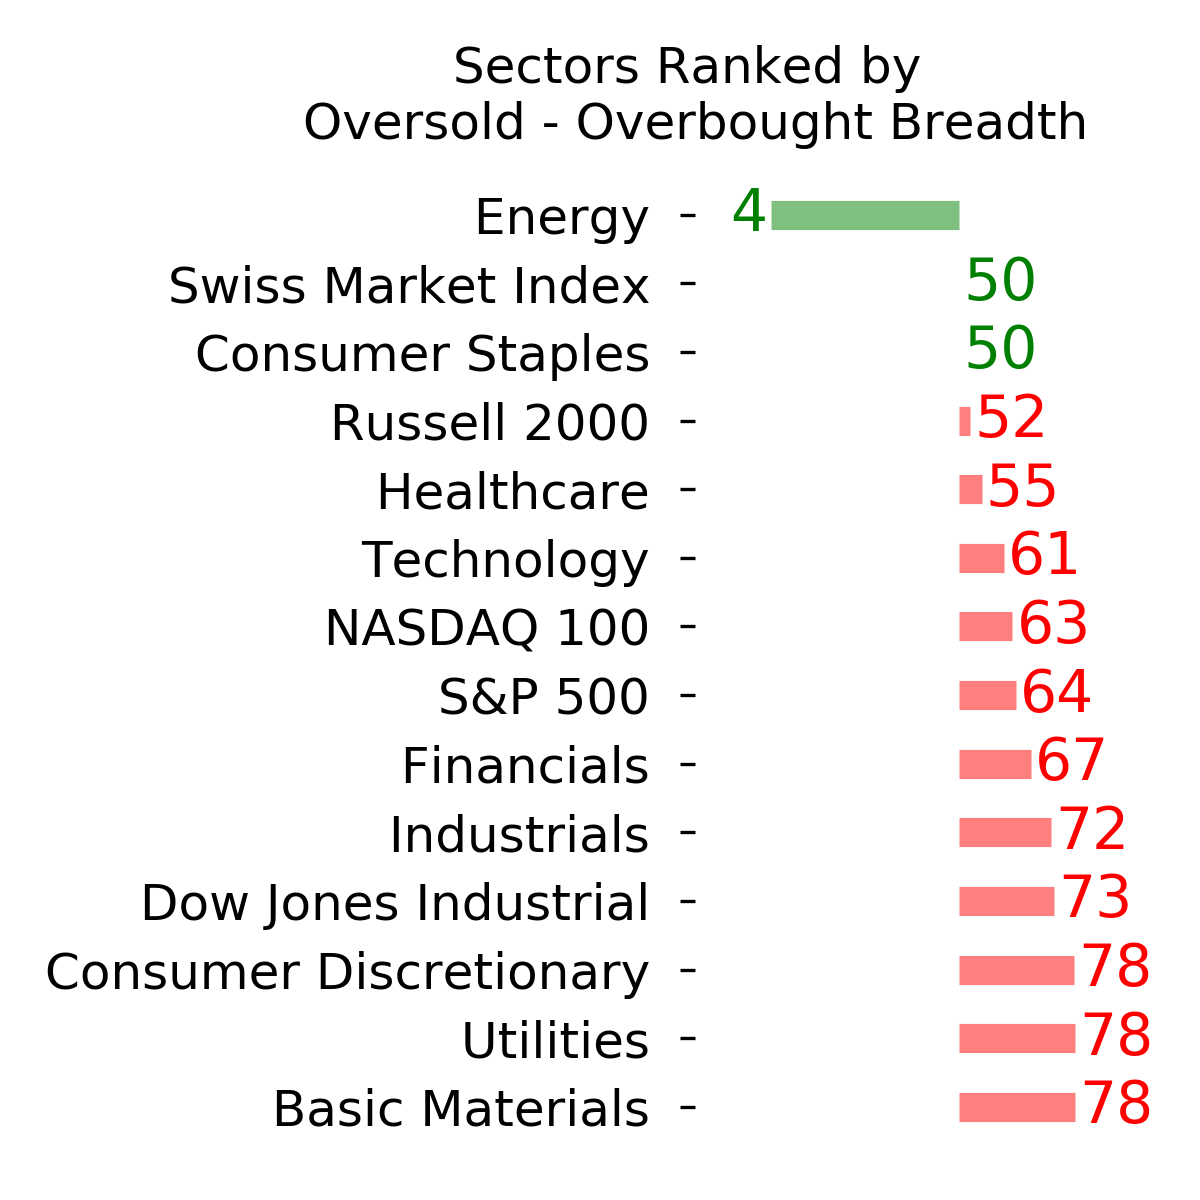
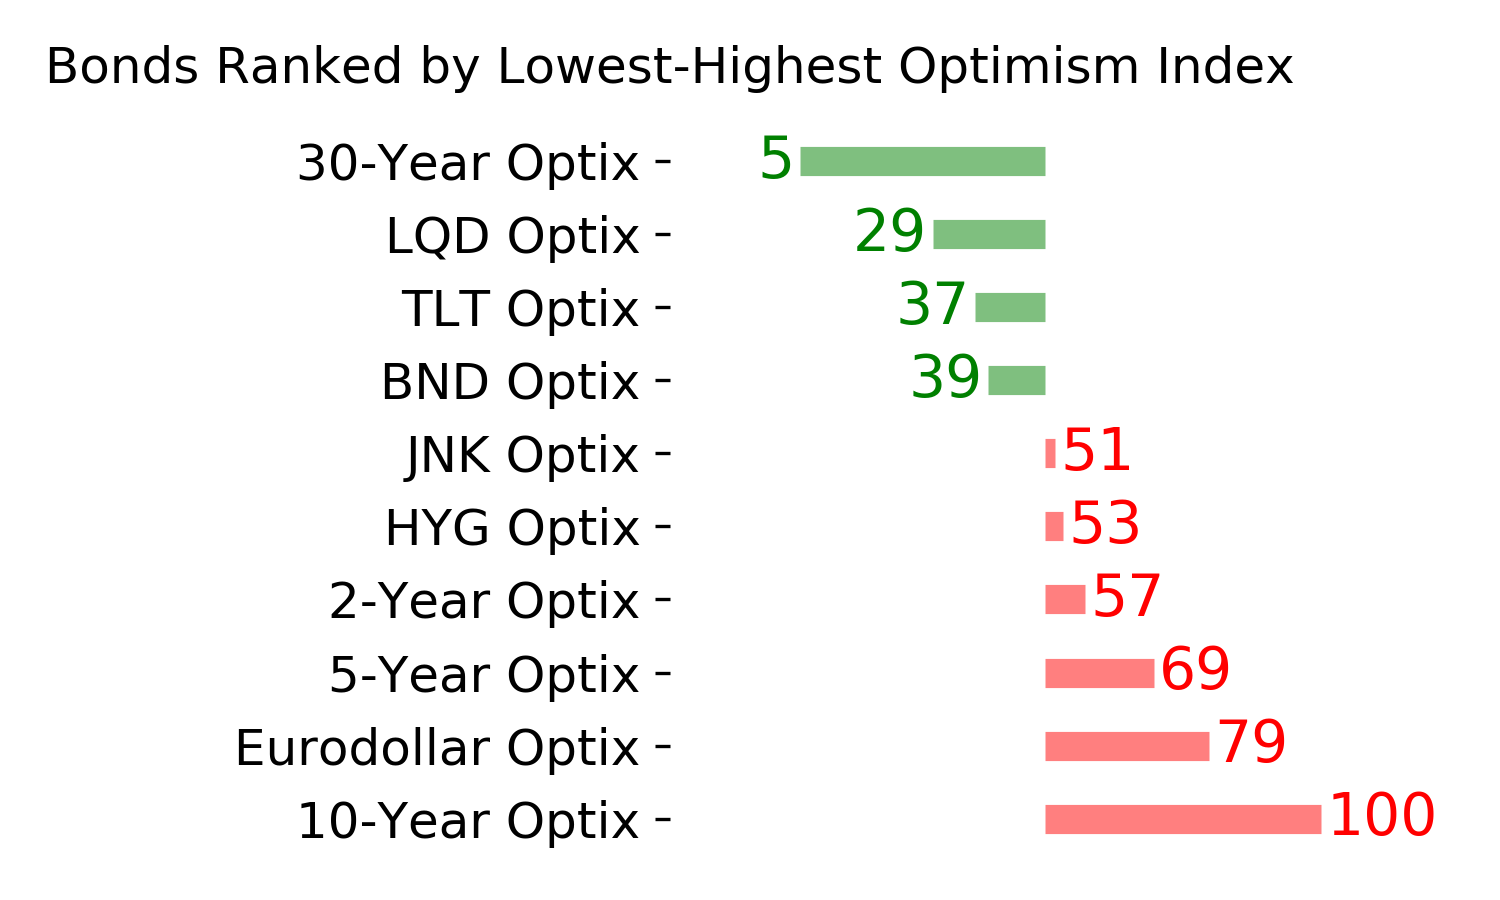
Ranks
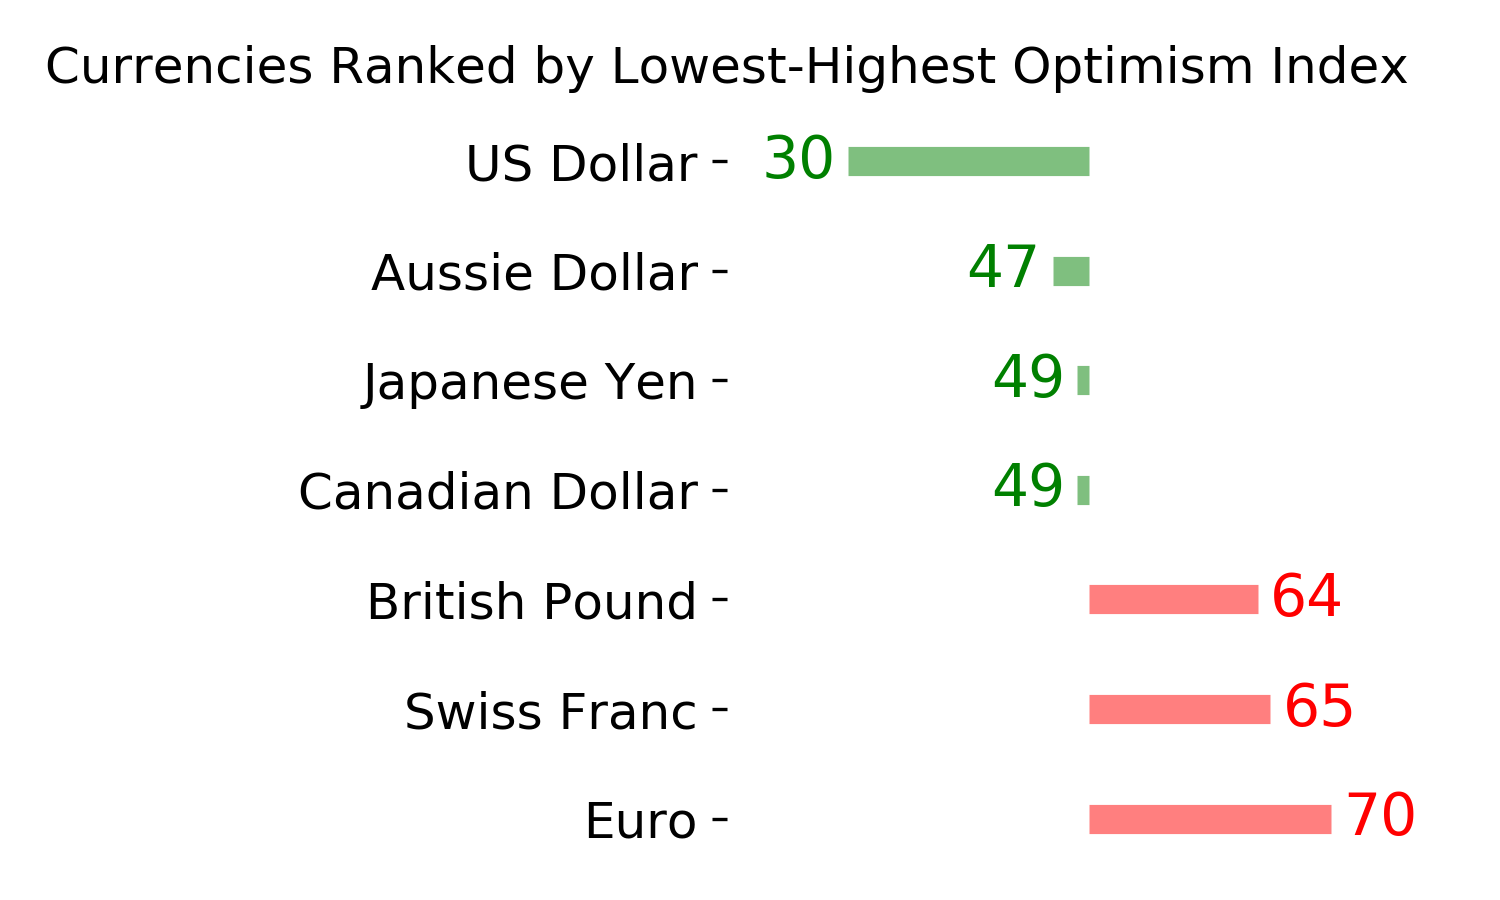
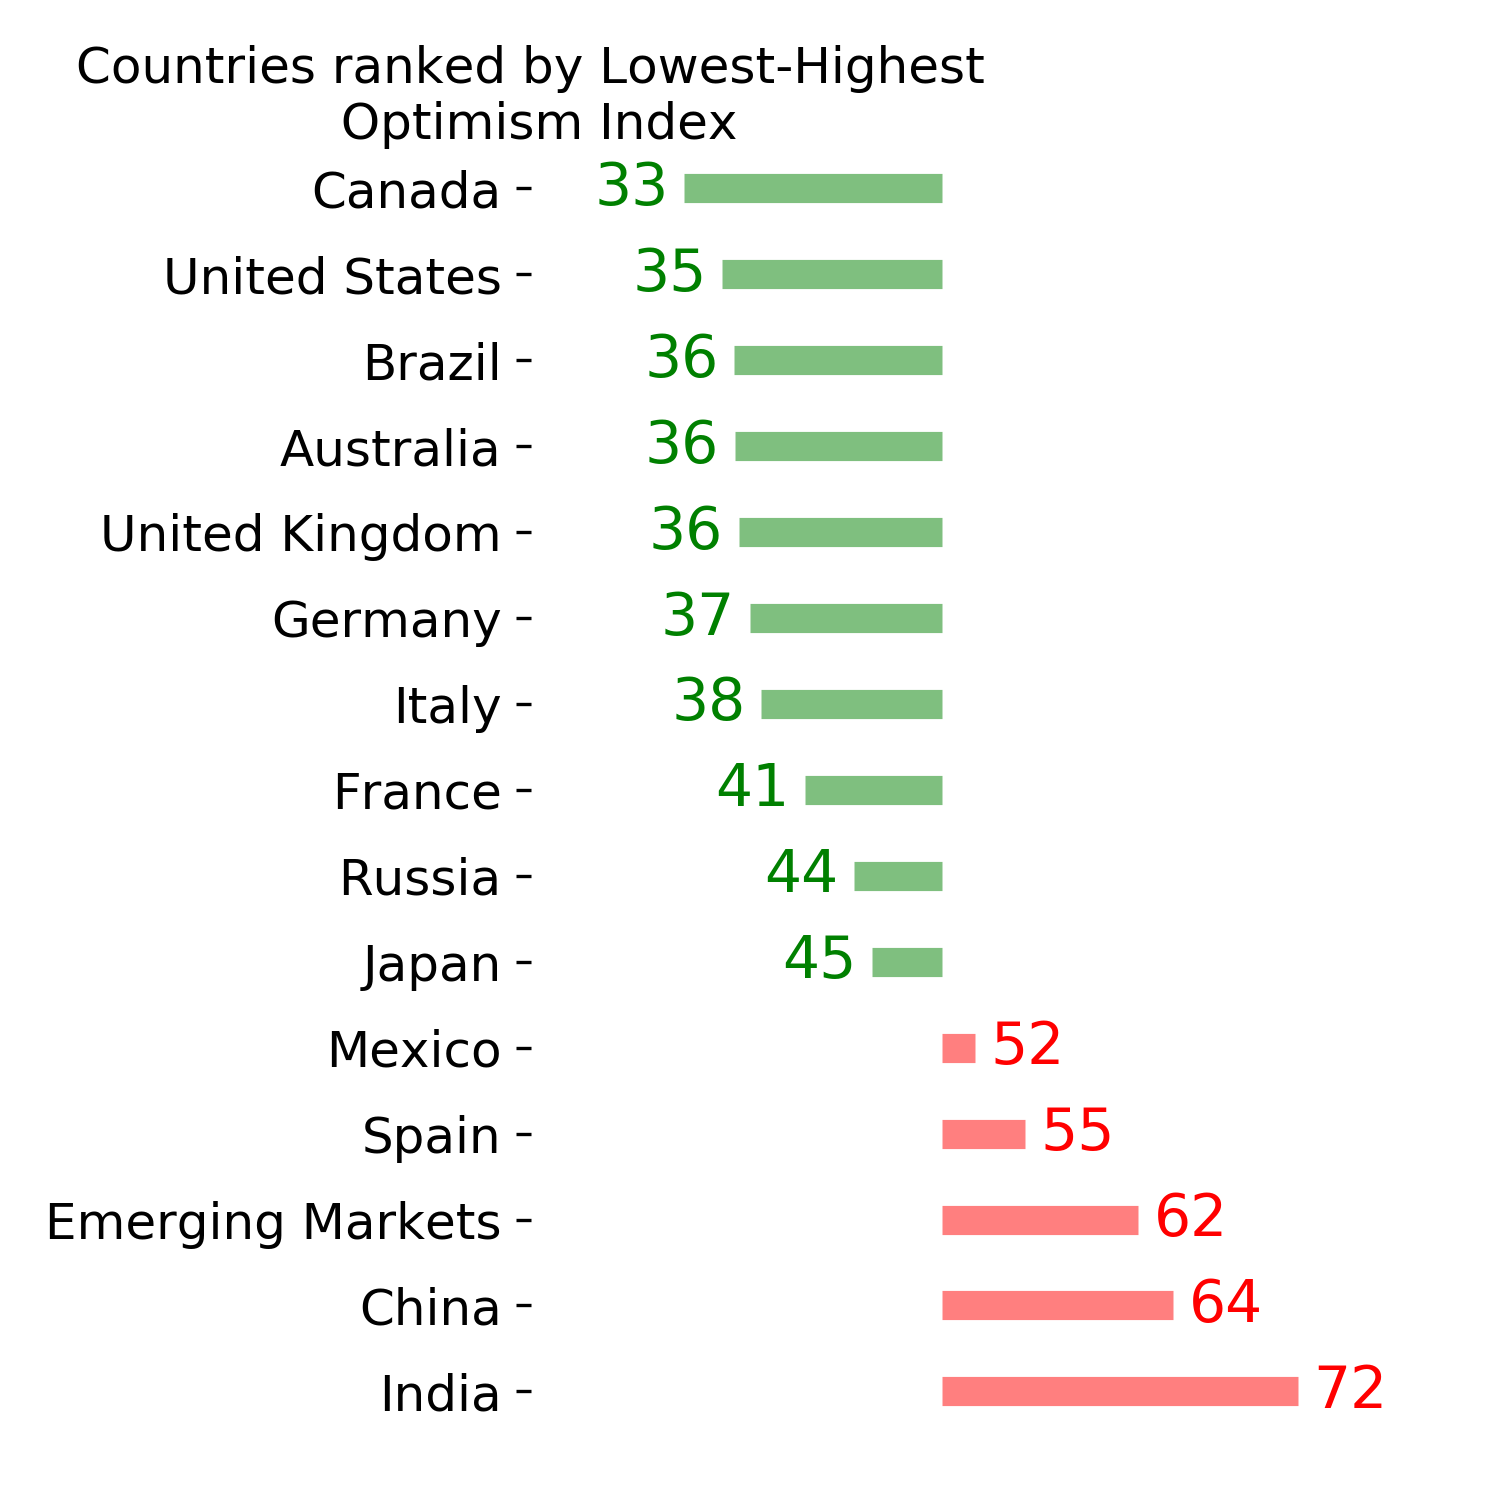
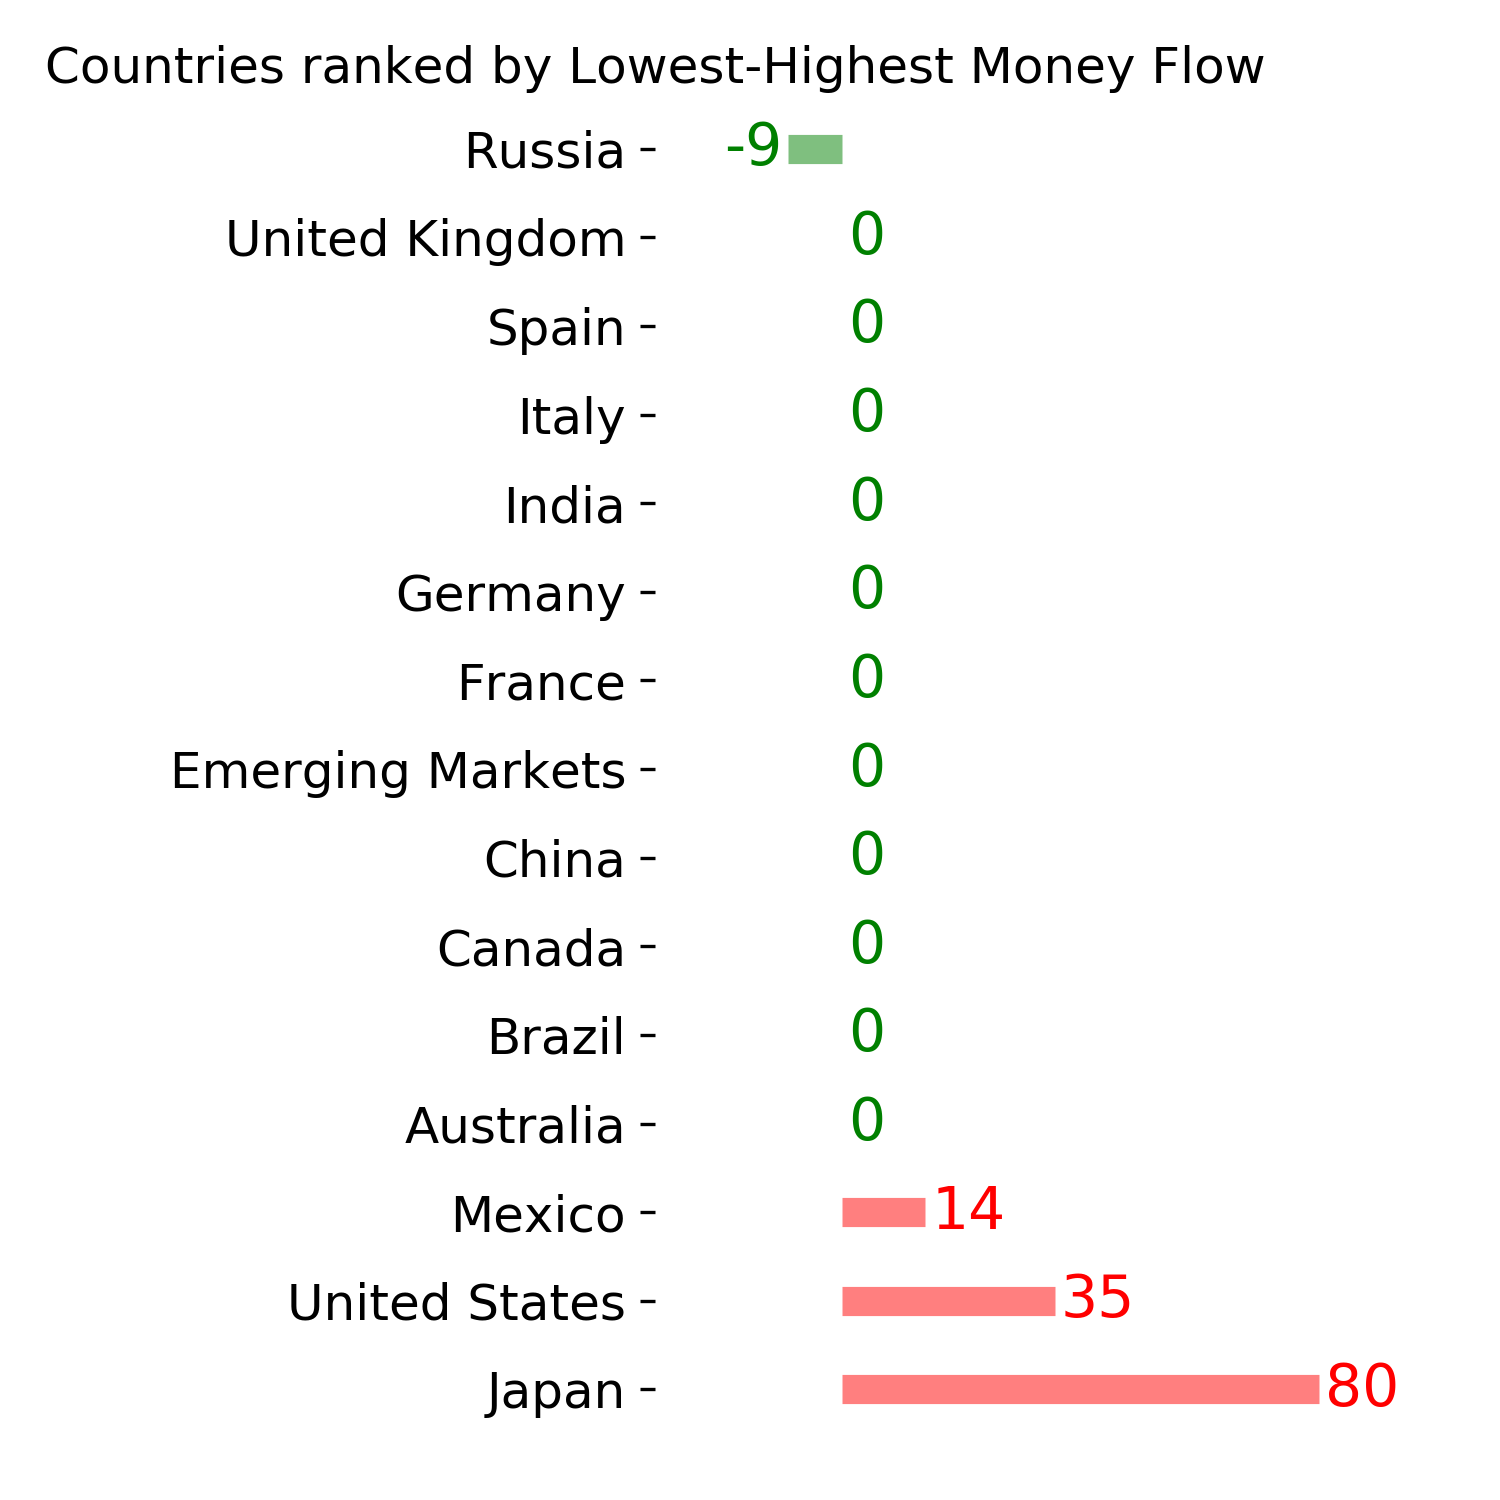
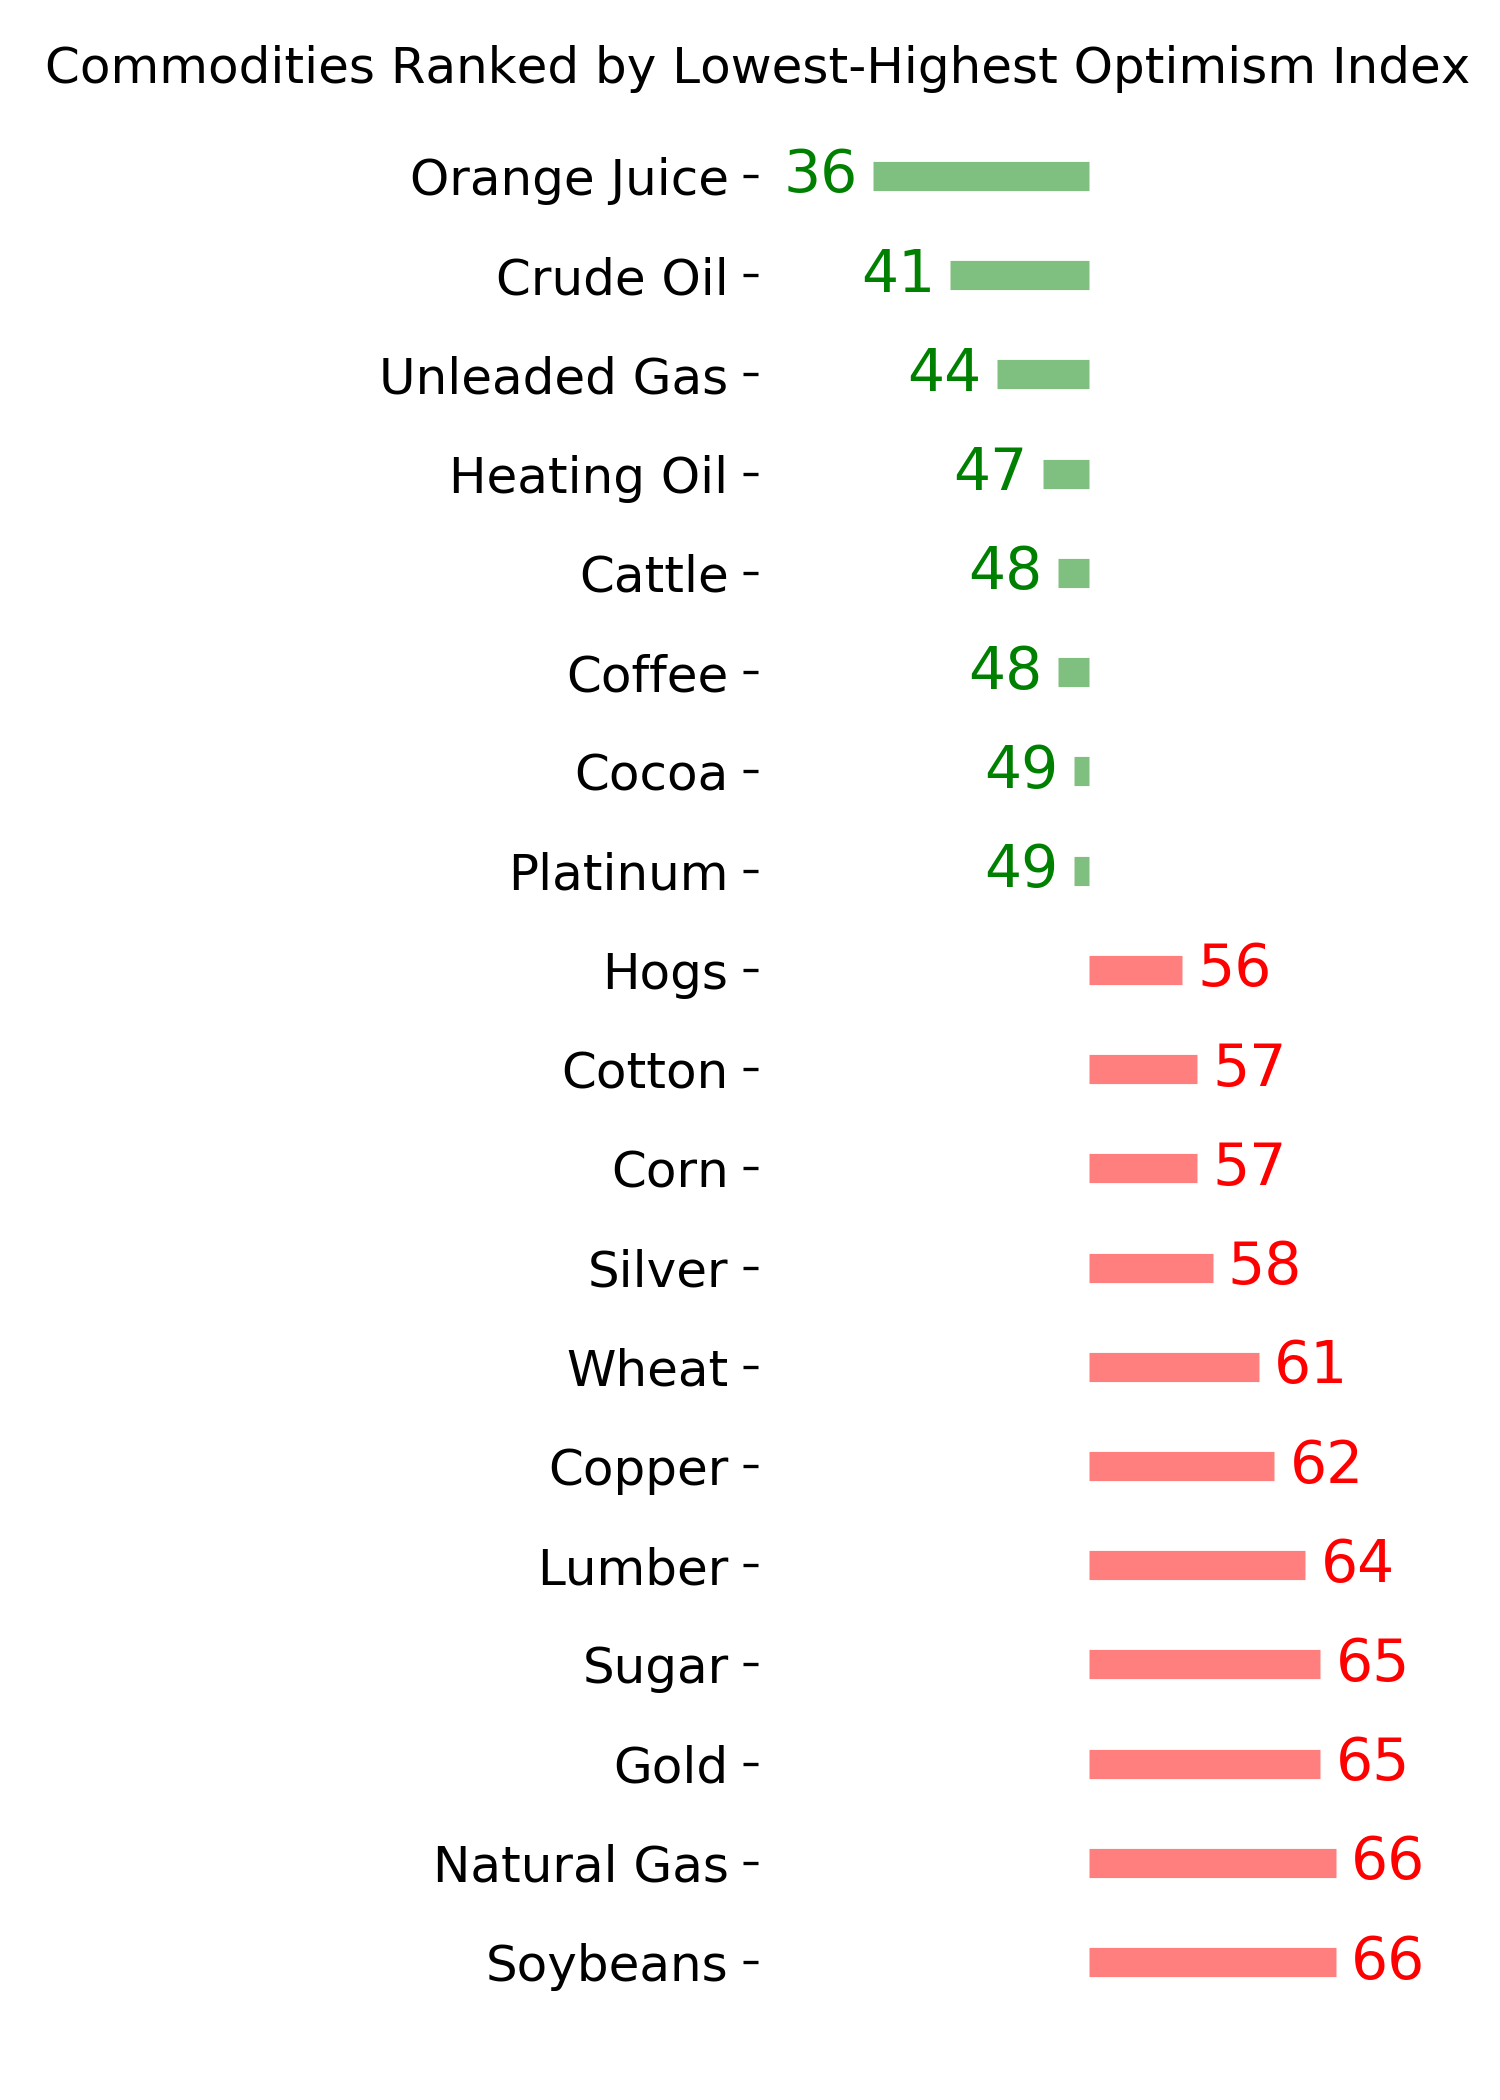
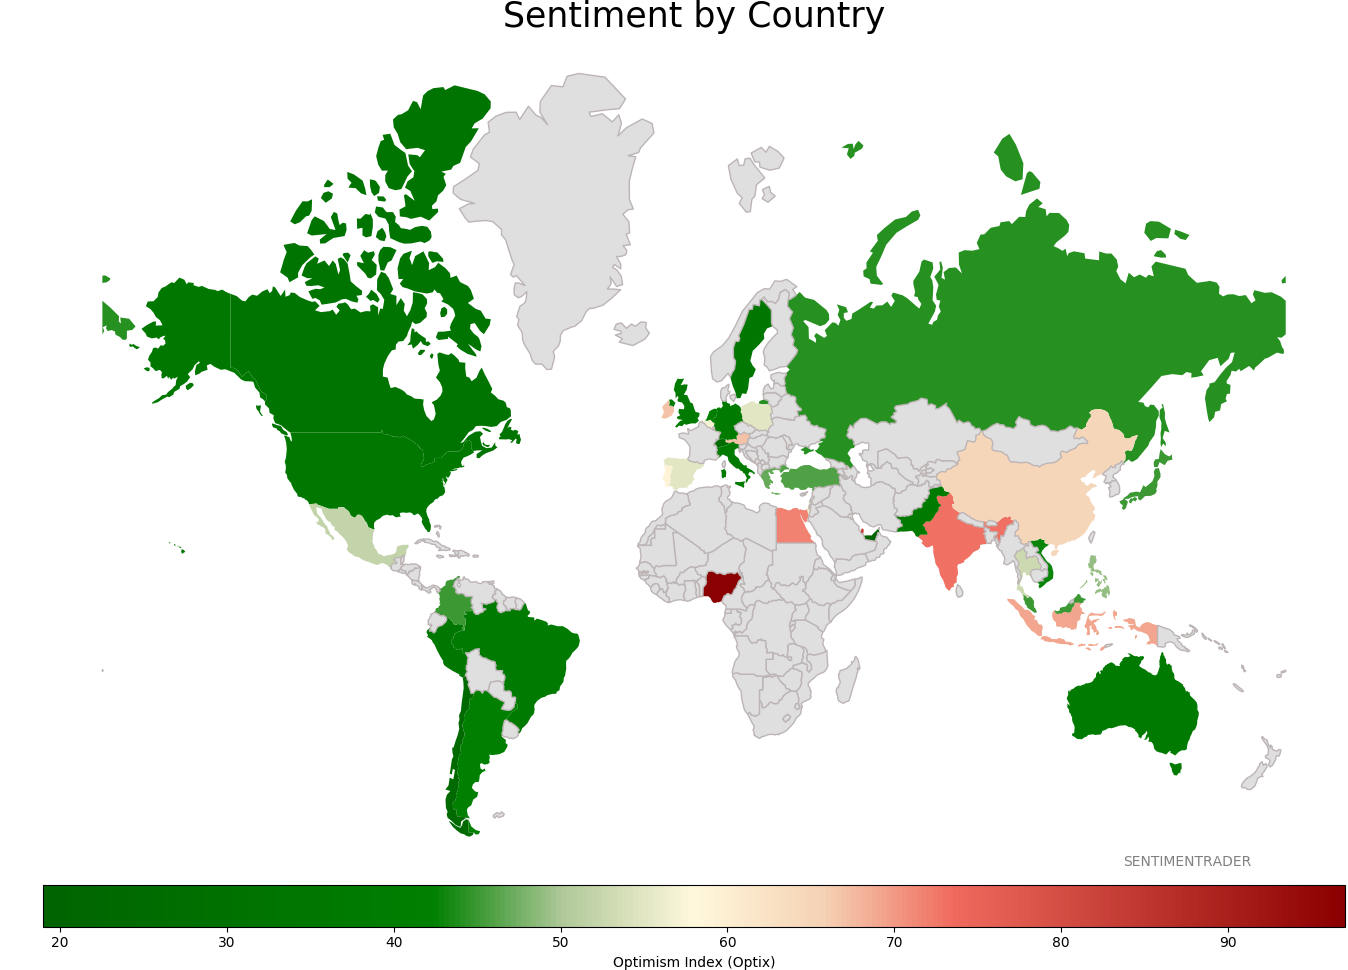
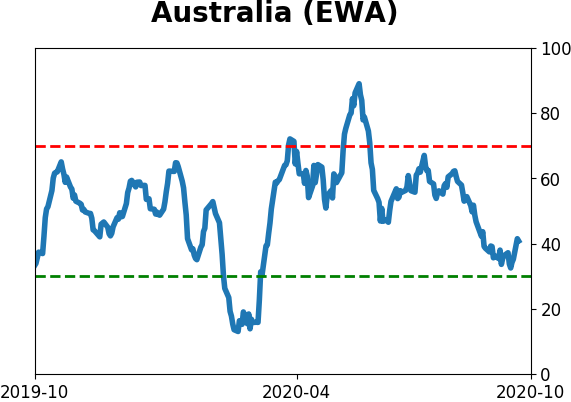
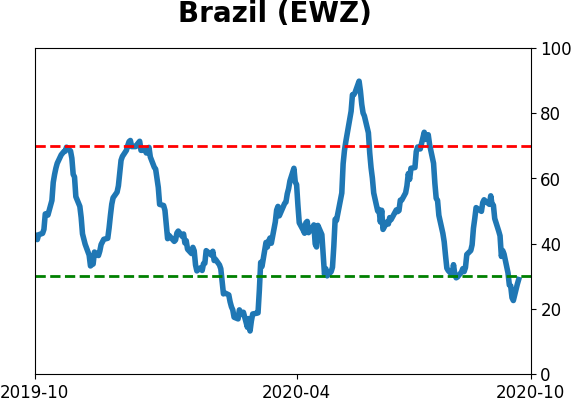
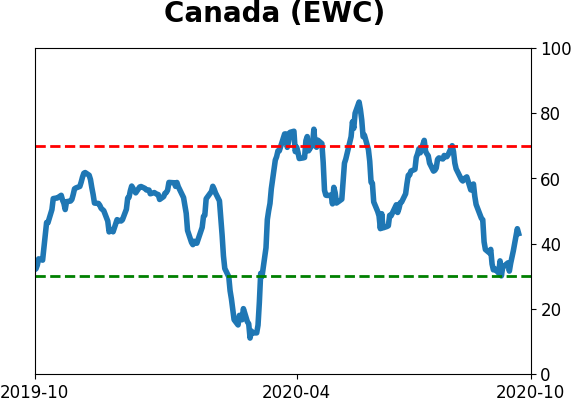
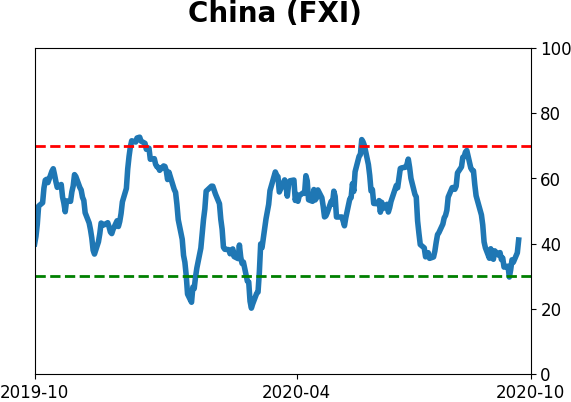
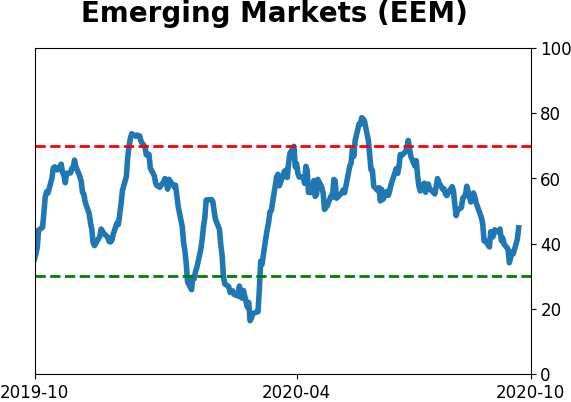
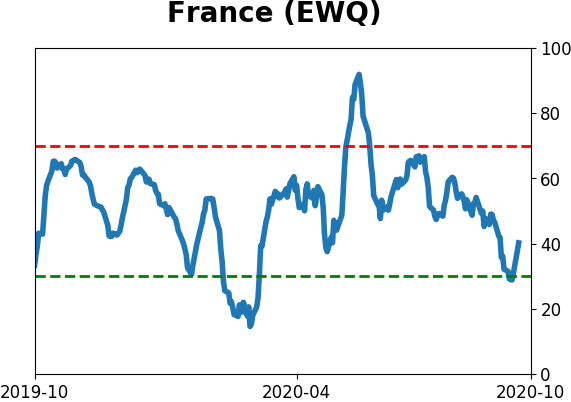
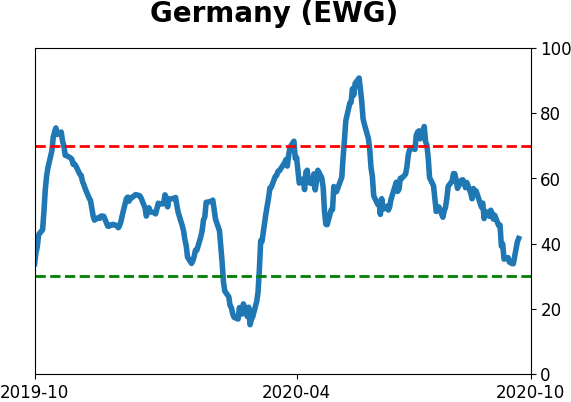
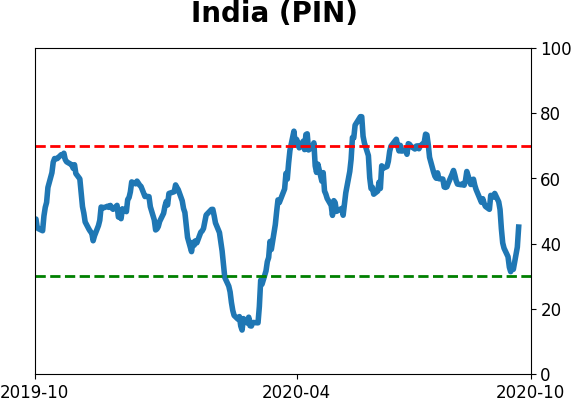
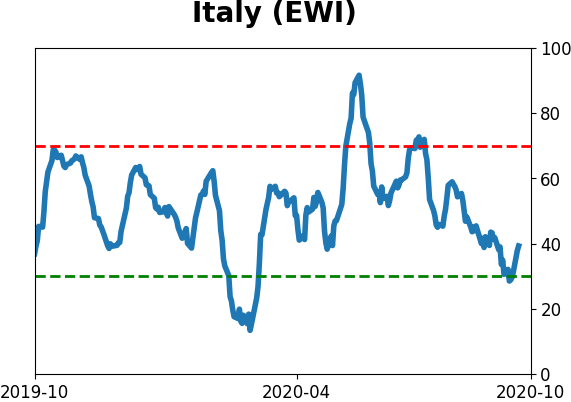
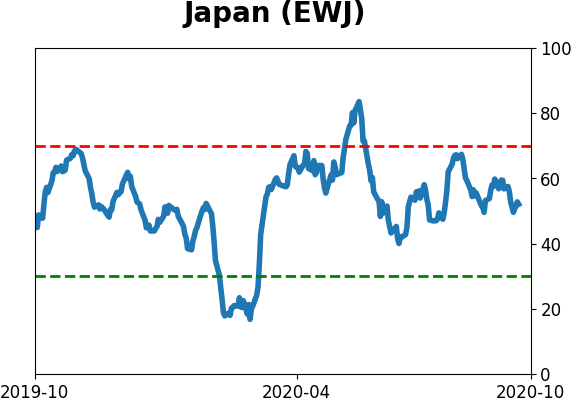
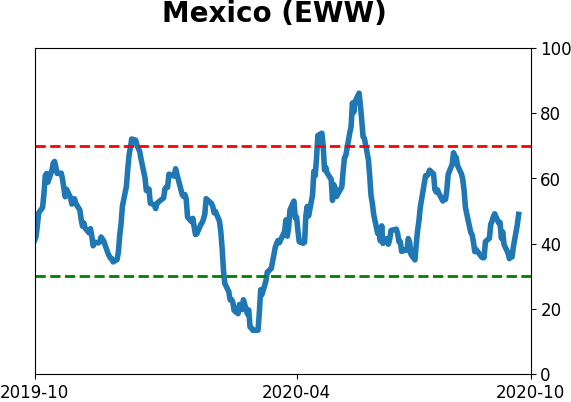
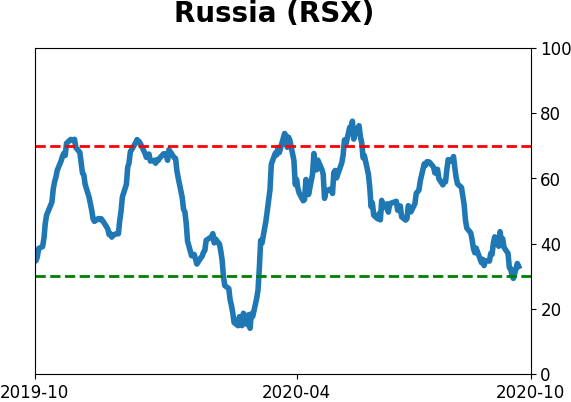
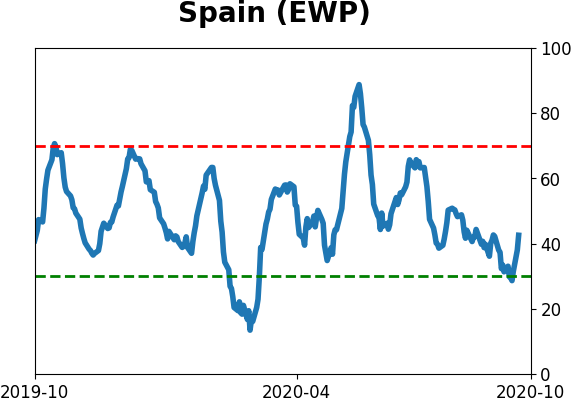
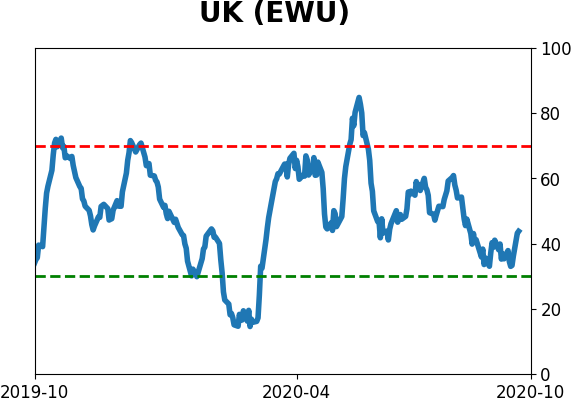
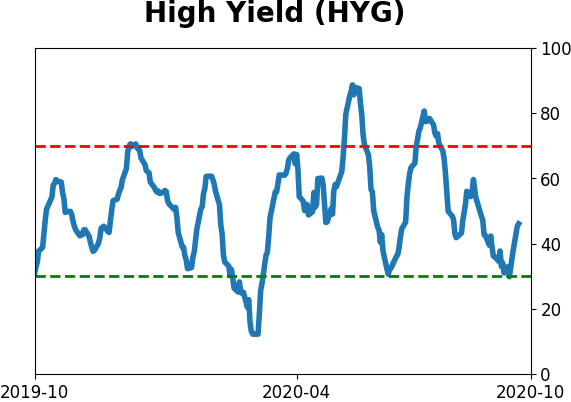
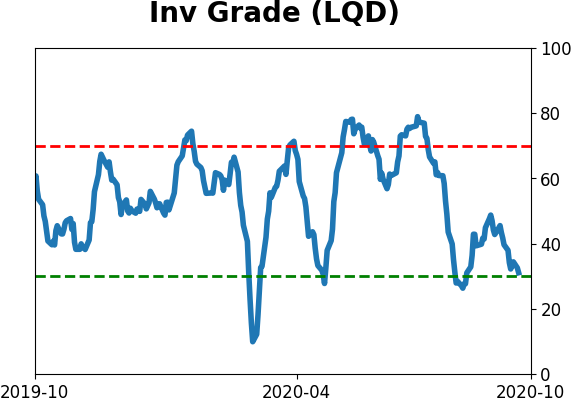
Sentiment Around The World
Optimism Index Thumbnails
|
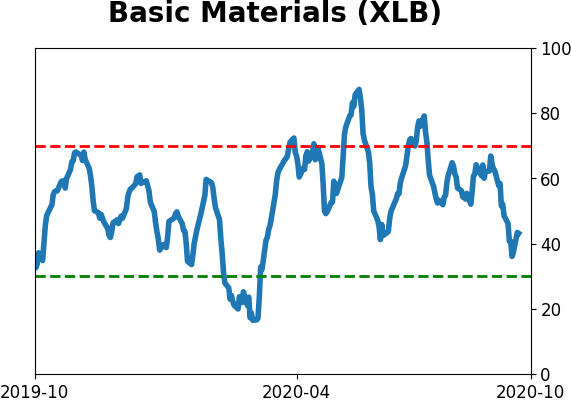
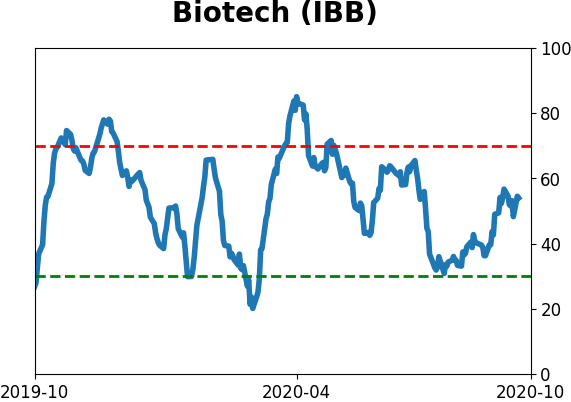
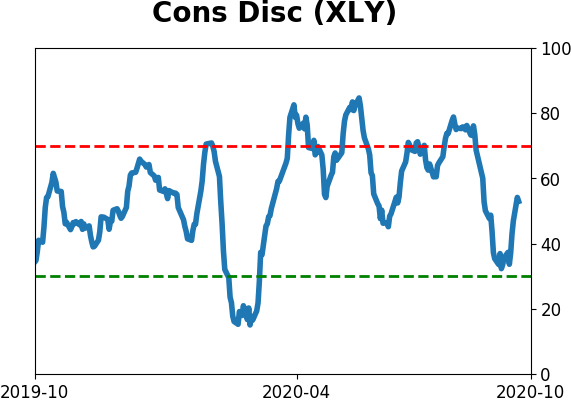
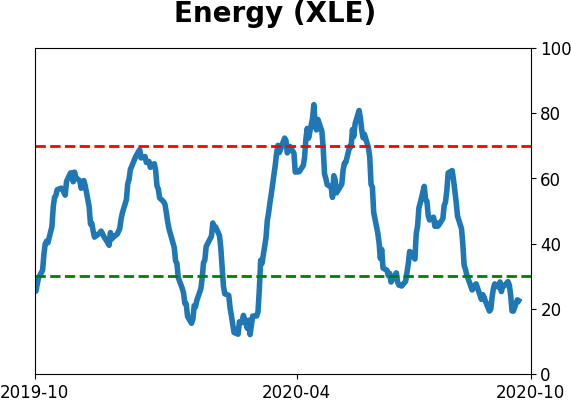
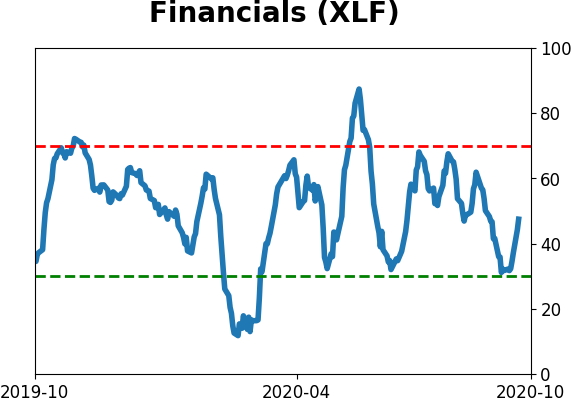
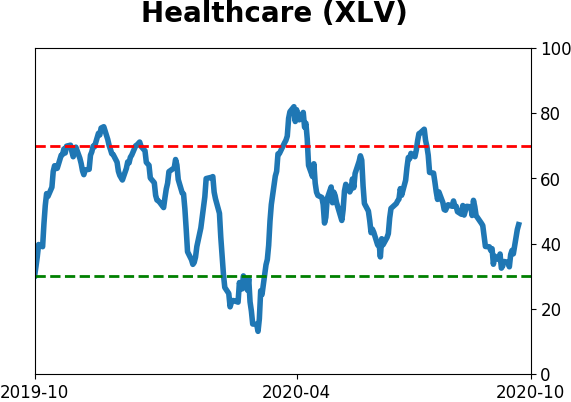
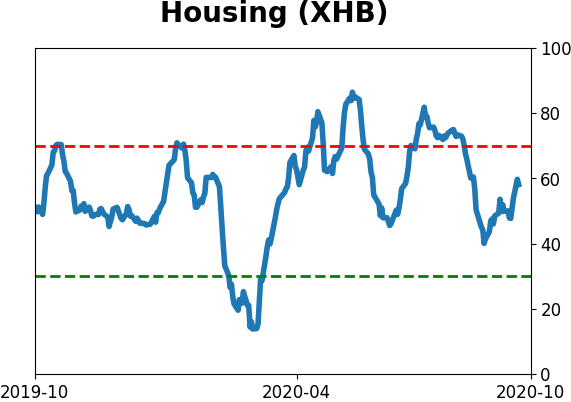
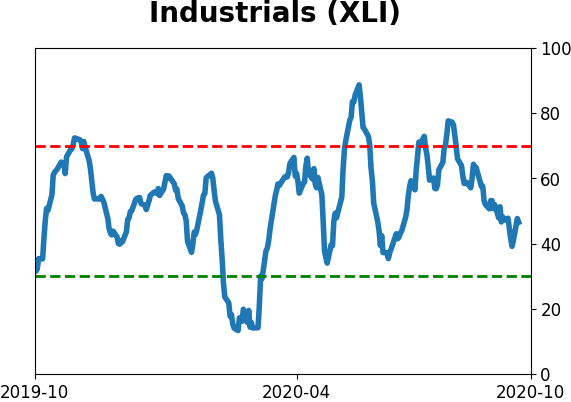
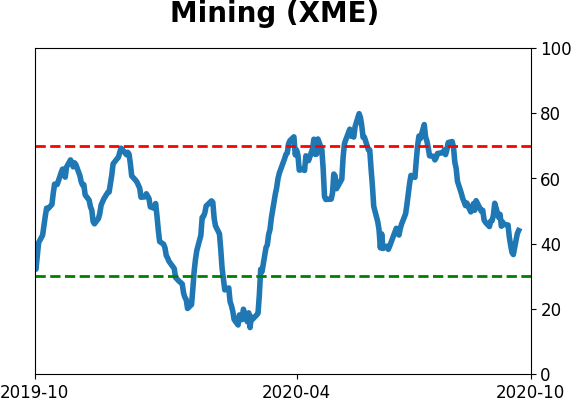
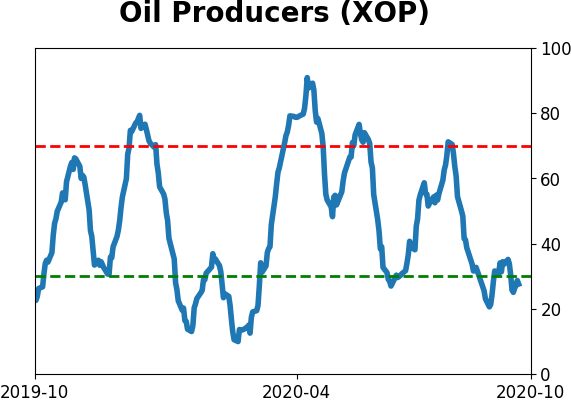
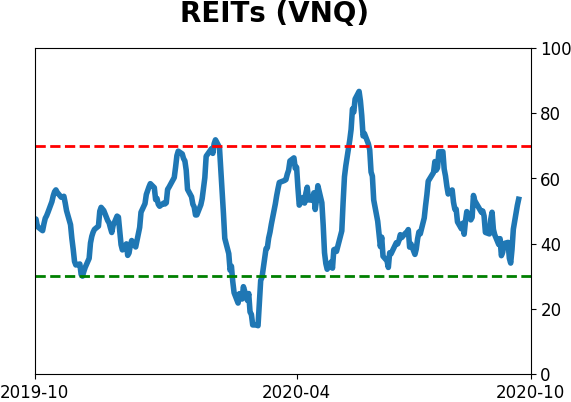
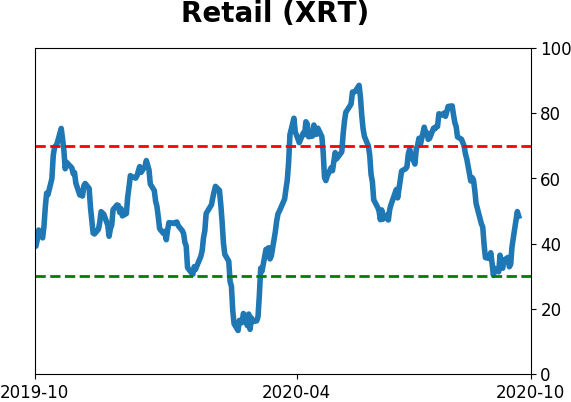
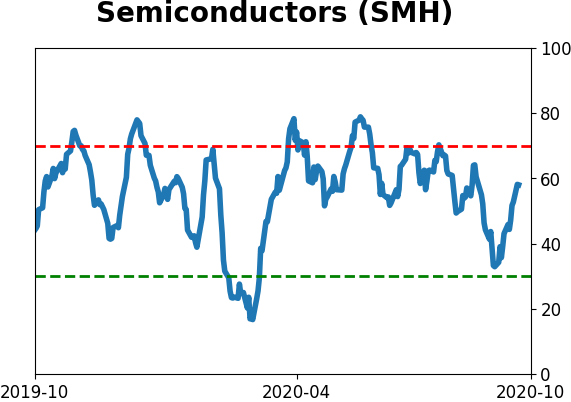
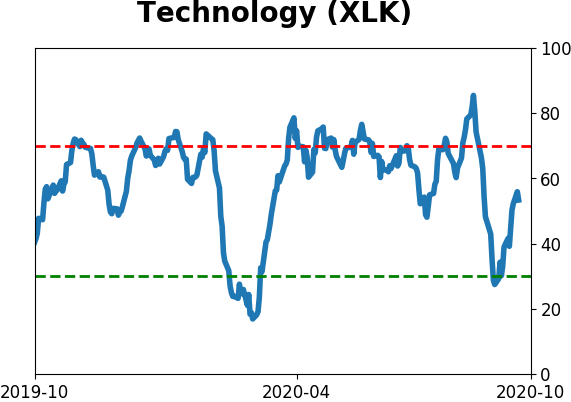
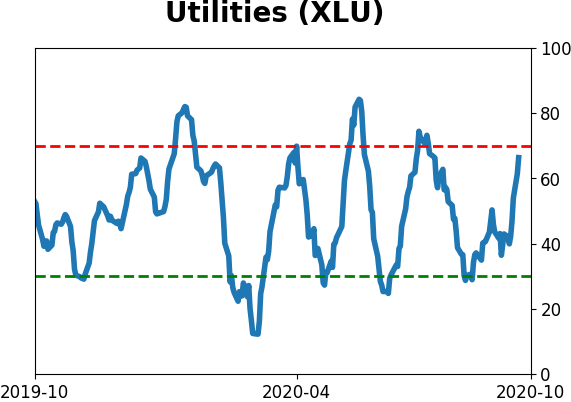
Sector ETF's - 10-Day Moving Average
|
|
|
Country ETF's - 10-Day Moving Average
|
|
|
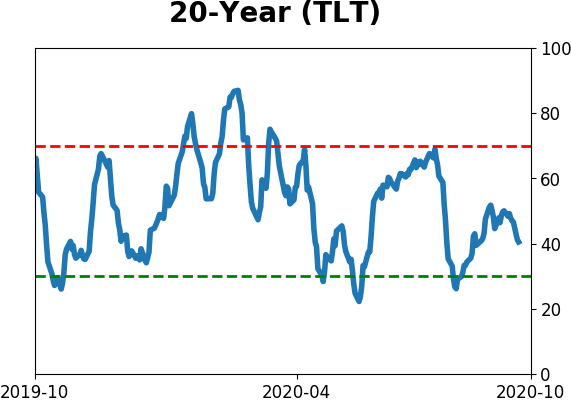
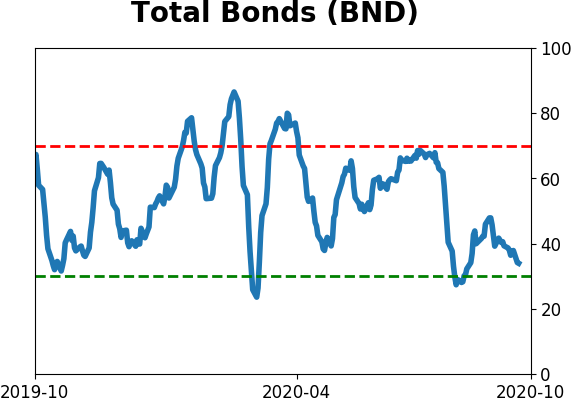
Bond ETF's - 10-Day Moving Average
|
|
|
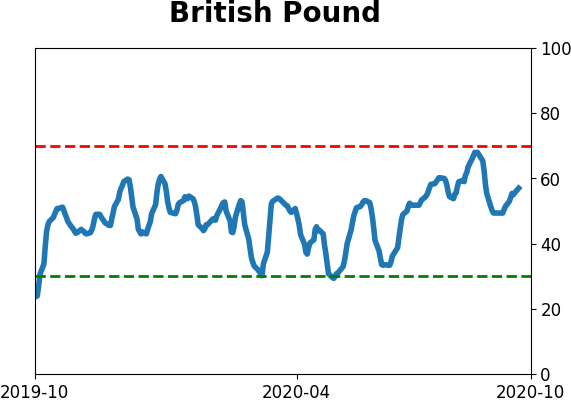
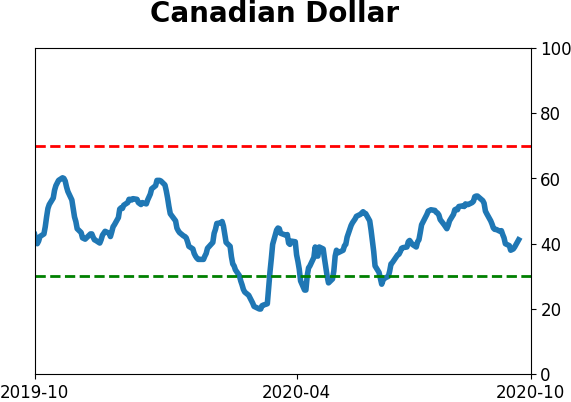
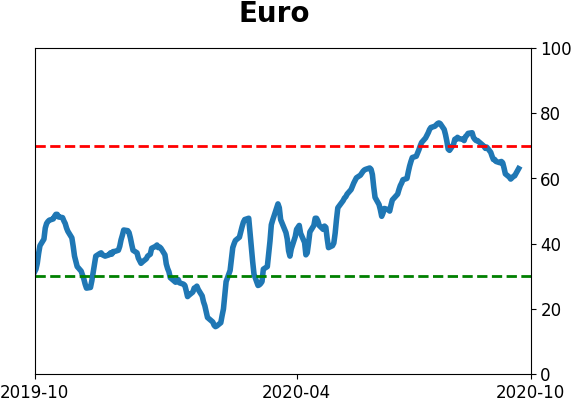
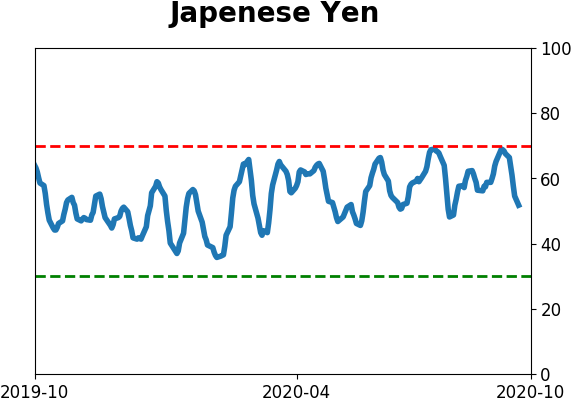
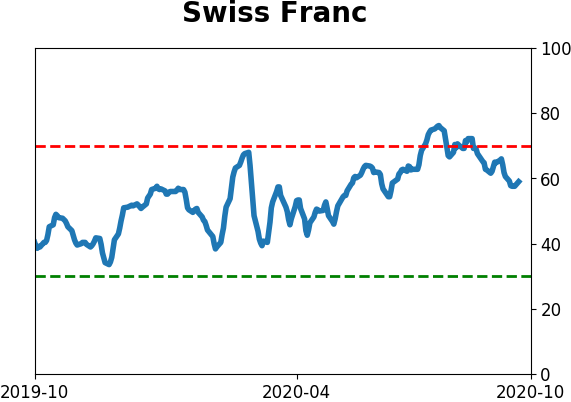
Currency ETF's - 5-Day Moving Average
|
|
|
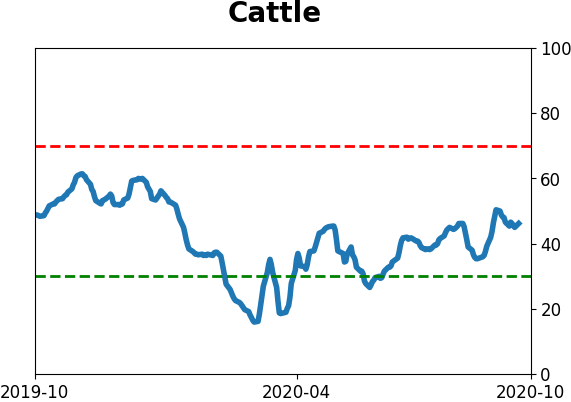
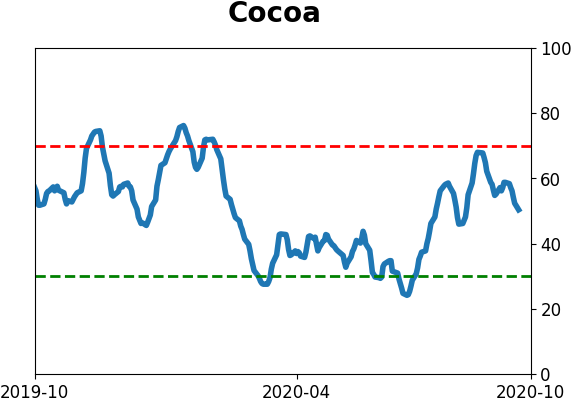
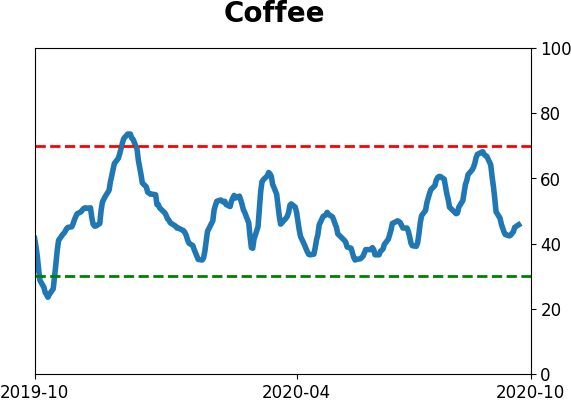
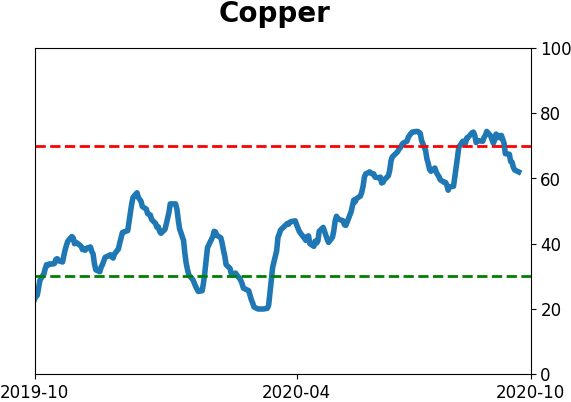
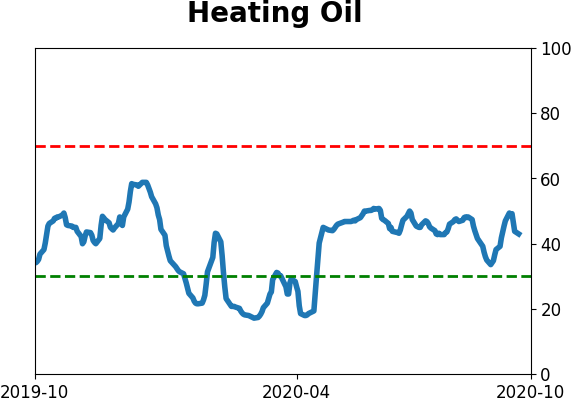
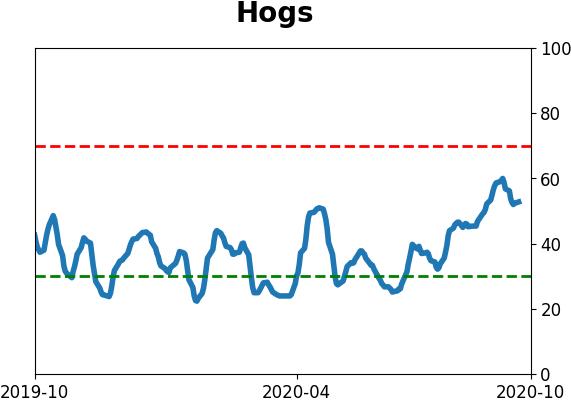
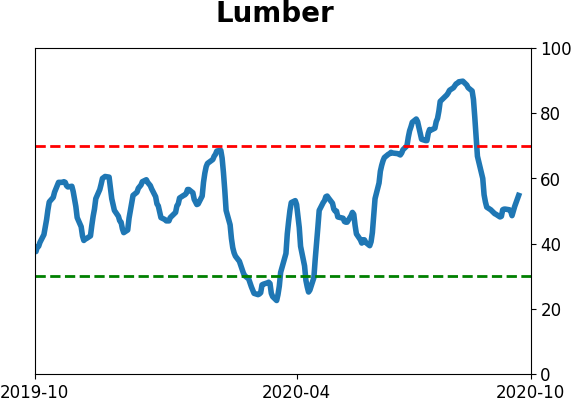
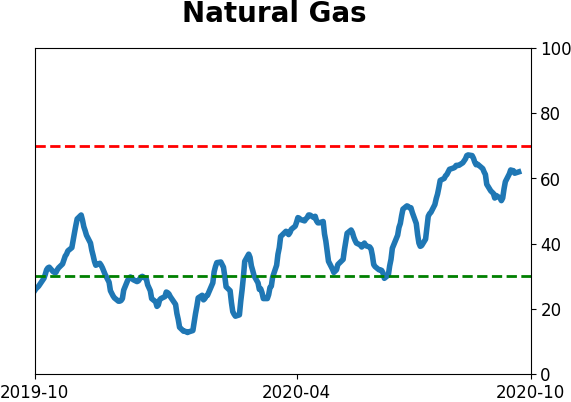
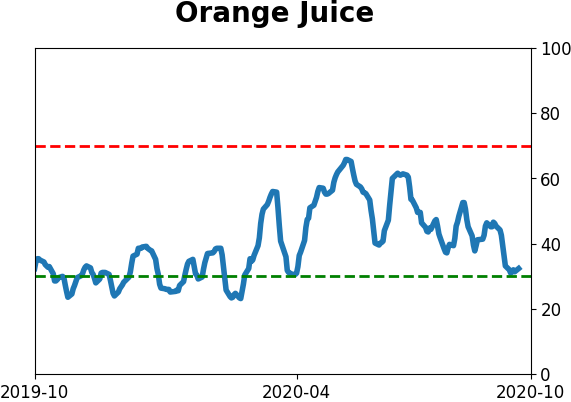
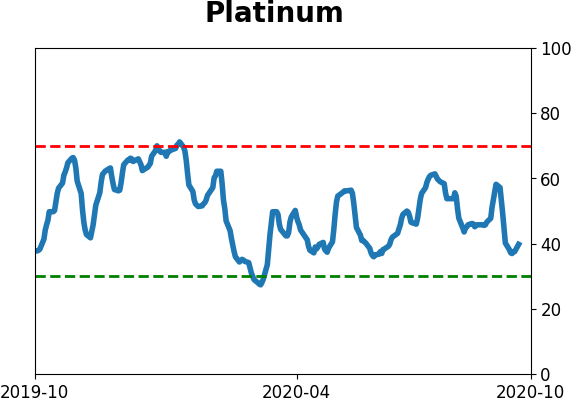
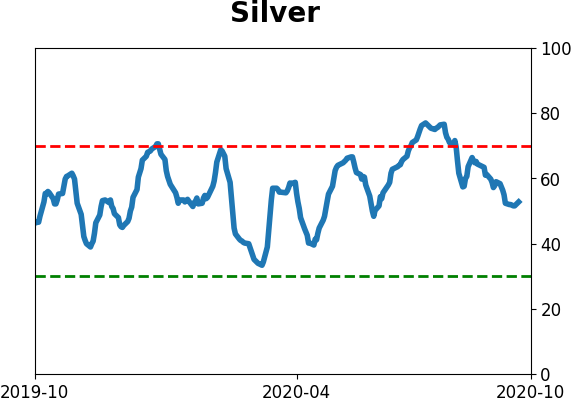
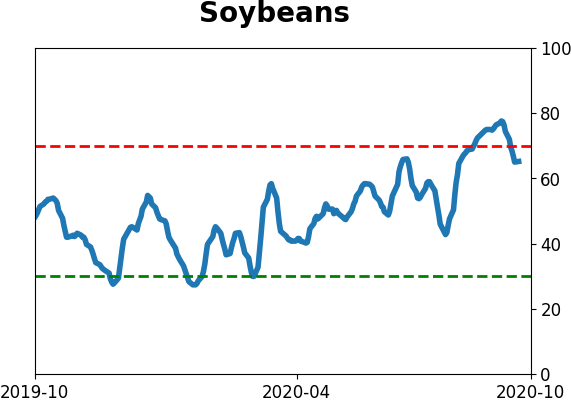
Commodity ETF's - 5-Day Moving Average
|
|