Headlines
|
|
Brazilian weakness leading to deep selling in emerging markets:
There has been heavy and persistent internal selling pressure in emerging markets, particularly in Brazil. This has pushed some longer-term breadth metrics well into oversold territory. They're showing early signs of reversing, which has been a good medium- to long-term sign.
Stocks jump as turnover plunges: Major ETFs like SPY and QQQ jumped by more than 1.5% on Monday on volume that was about half (or less) what it was on Friday. This is usually considered a negative. For SPY, it has rallied more than 1.5% on volume that dropped by 40% or more 17 times since 1993. Its worst returns were 3 days later, with a 41% win rate and -0.3% average return. After that, returns were mixed. For QQQ, it triggered 24 times, with returns that were about in line with random going forward until 2-3 months later when they were weak. This type of activity tends to happen during bear markets, so results skew toward the negative.
Bottom Line:
- A mixed environment favors becoming defensive if optimism is high and aggressive if low; currently, there is conflicting evidence but would slightly favor becoming more aggressive should optimistic extremes recede further
| Other Sectors and Assets |
| | Positives | Negatives | | 1. Energy (here and here) | 1. Skewed tech (here and here) |
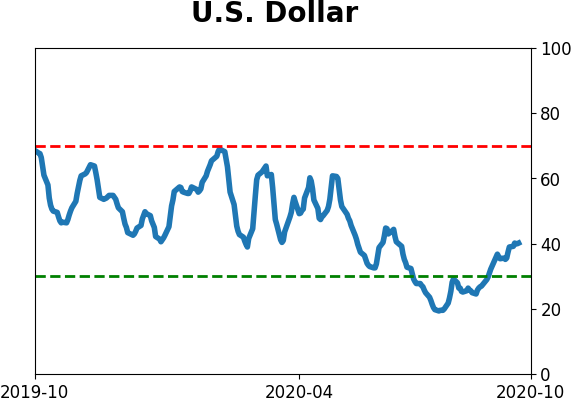
| 2. Dollar test |
|
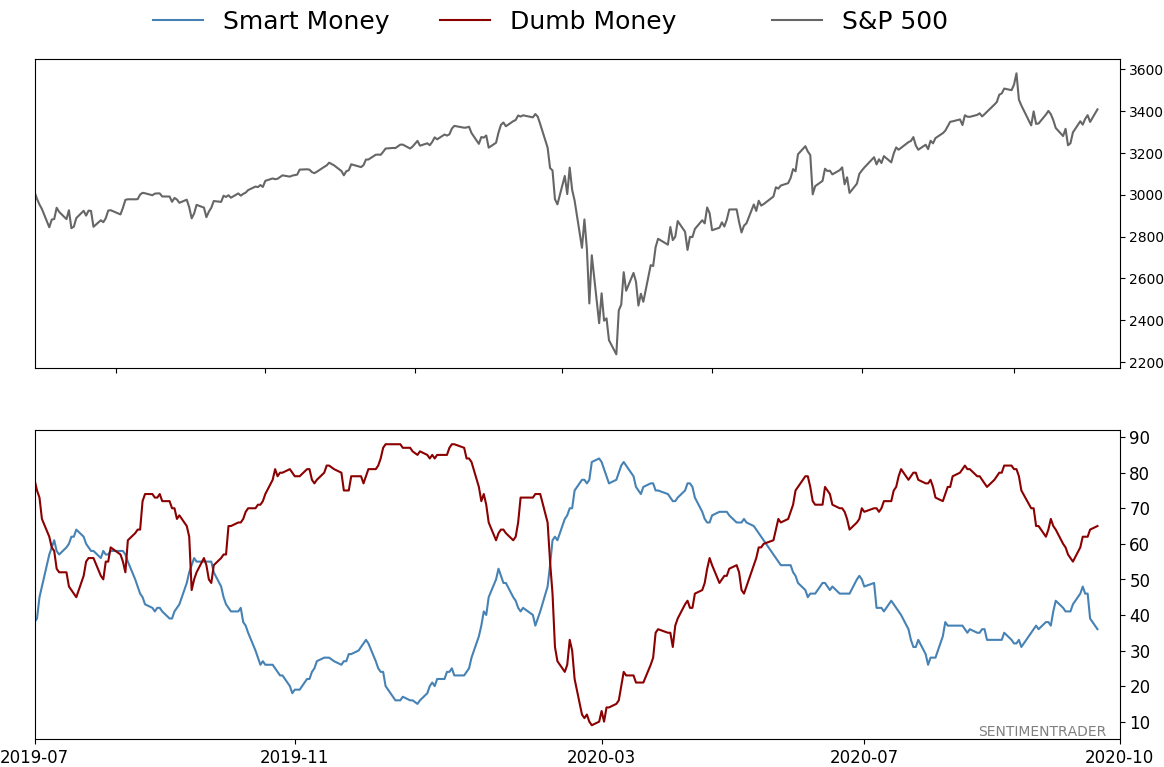
Smart / Dumb Money Confidence
|
Smart Money Confidence: 36%
Dumb Money Confidence: 65%
|
|
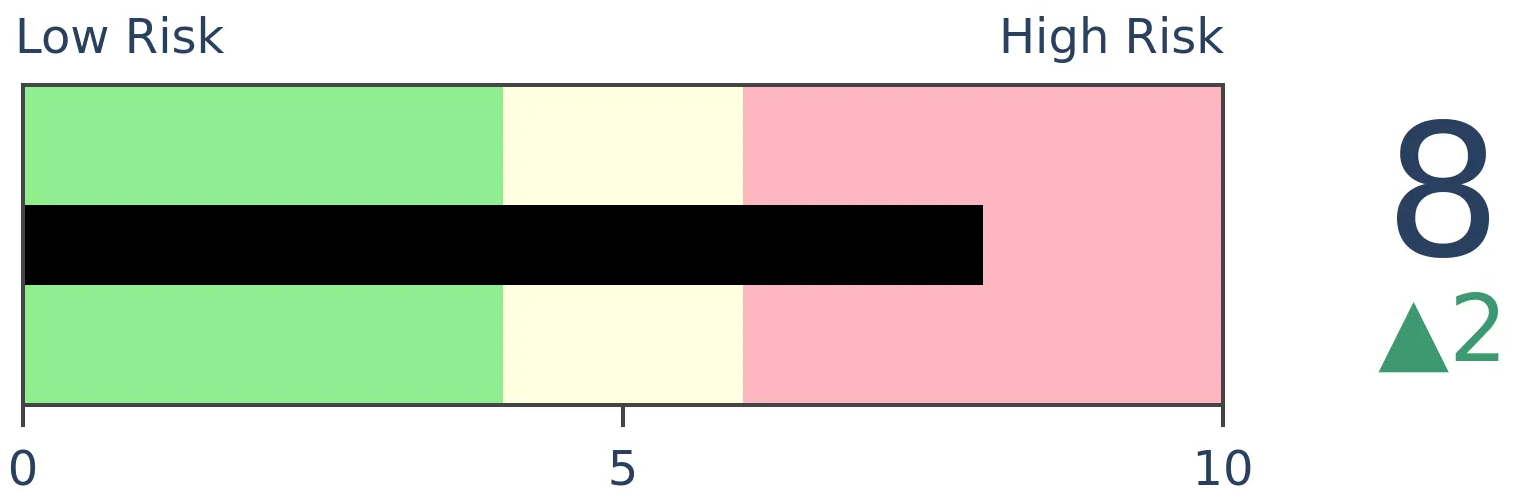
Risk Levels
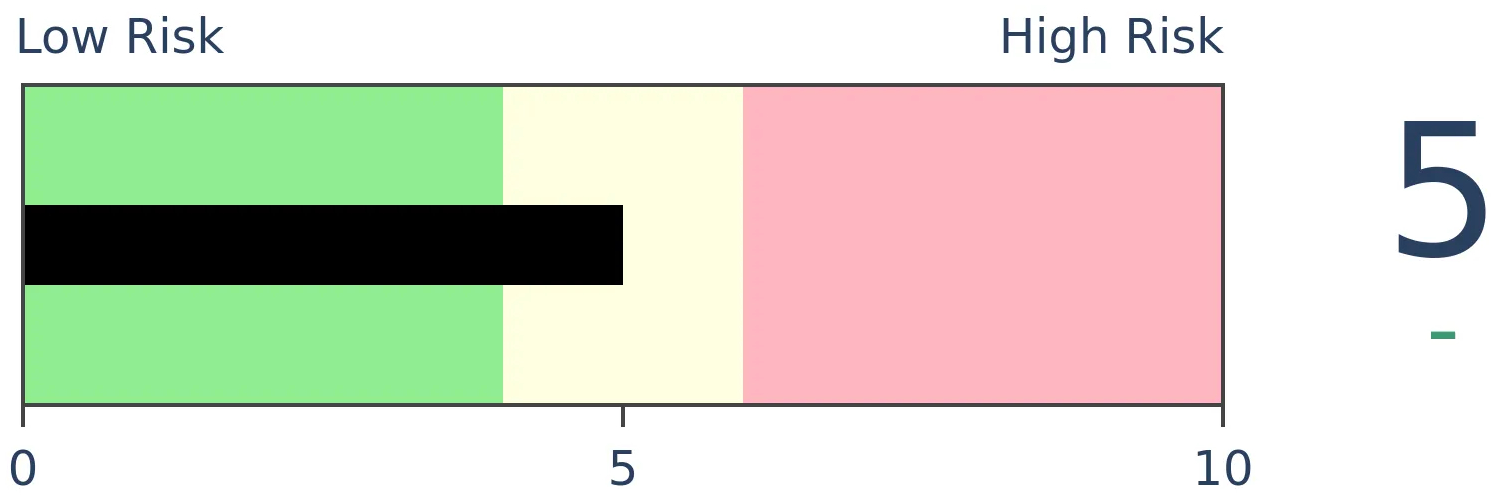
Stocks Short-Term
|
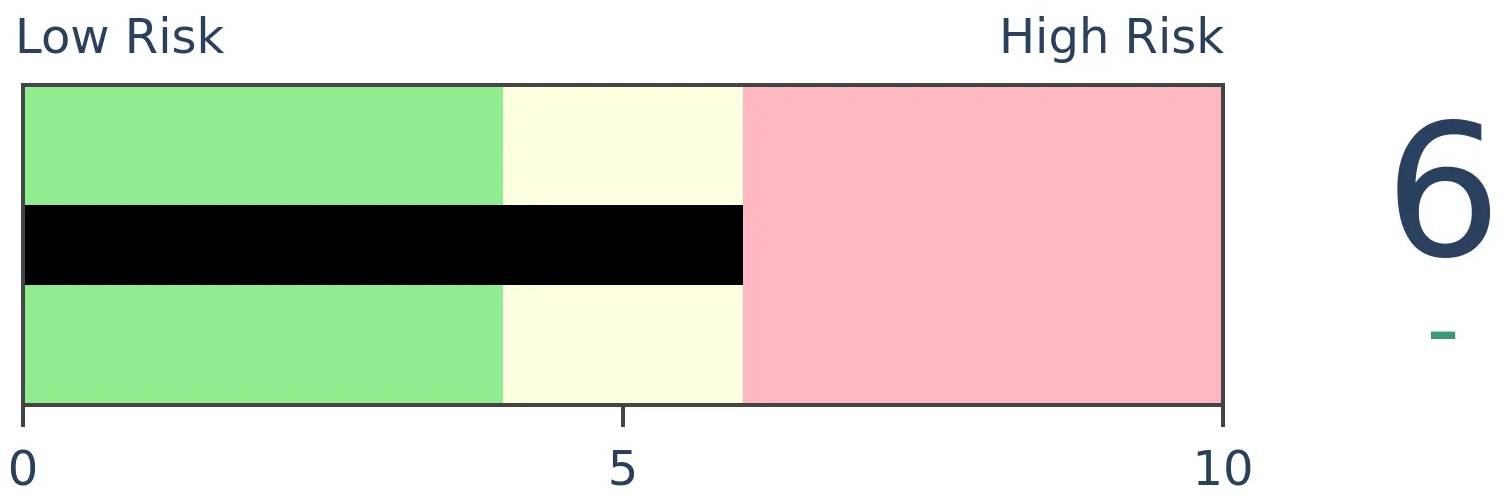
Stocks Medium-Term

|
|
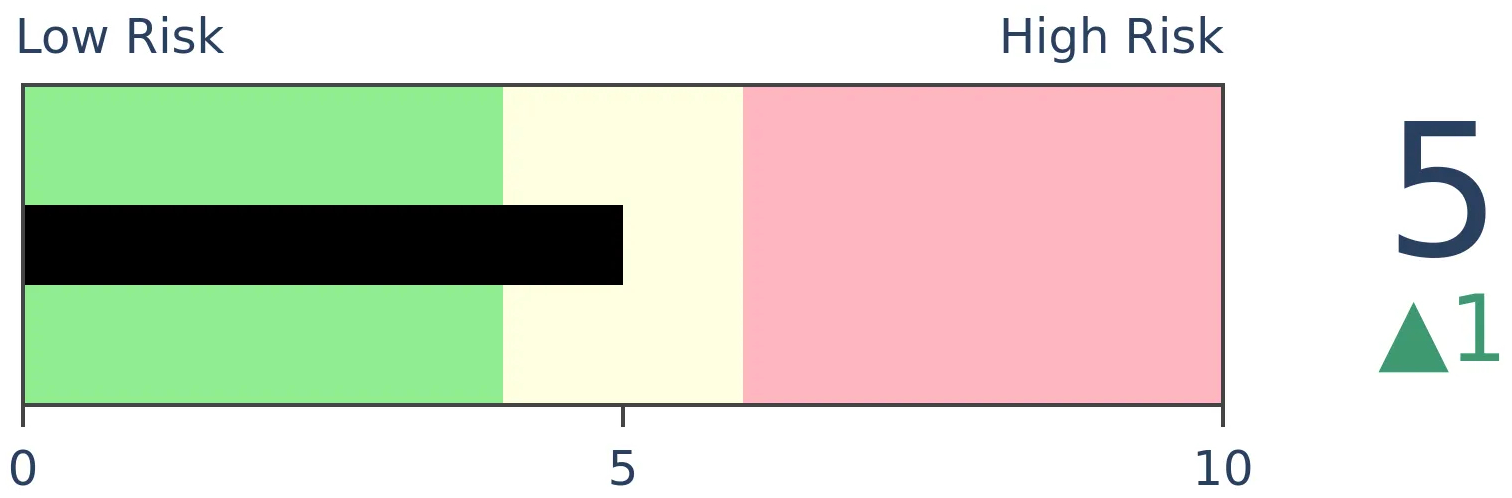
Bonds
|
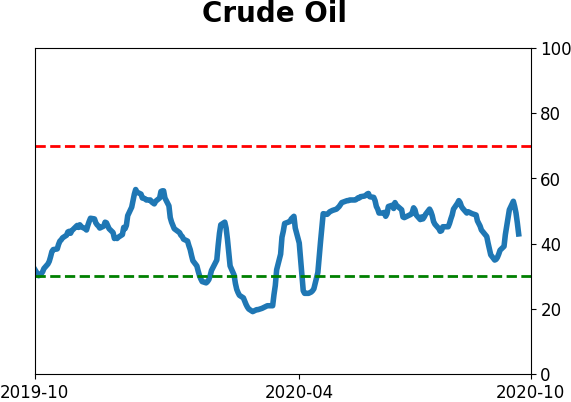
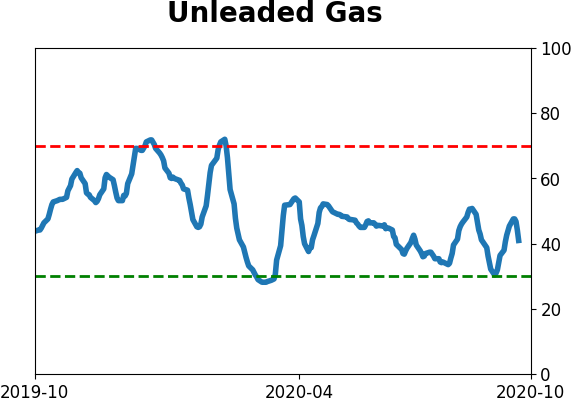
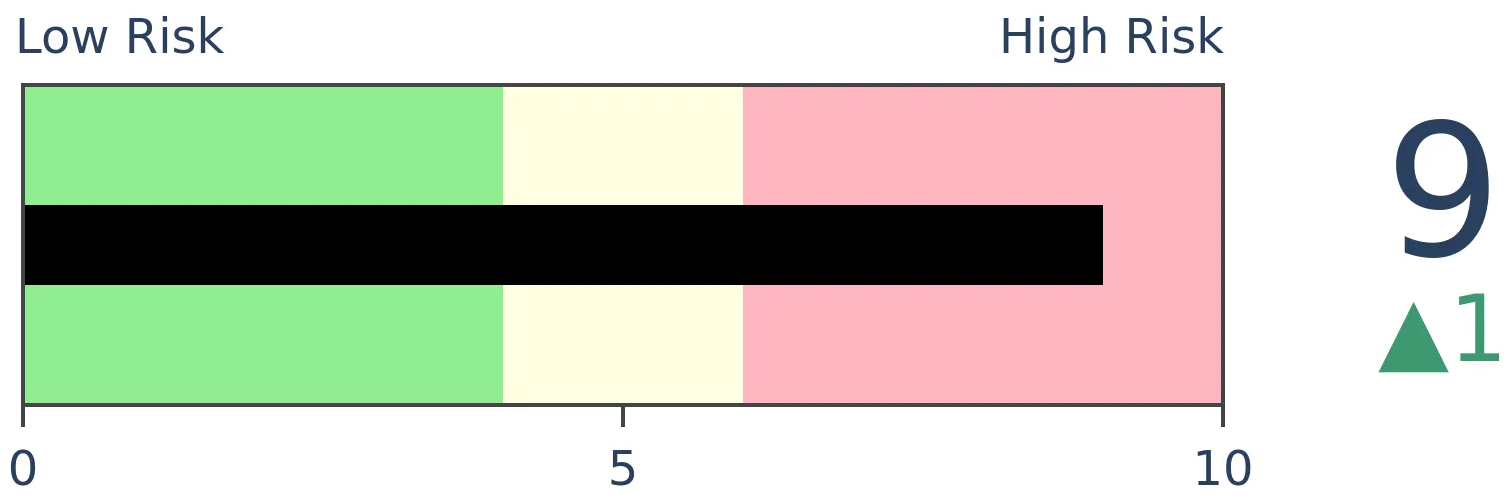
Crude Oil
|
|
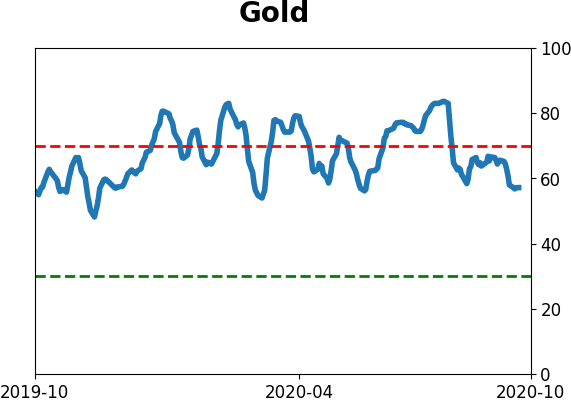
Gold
|
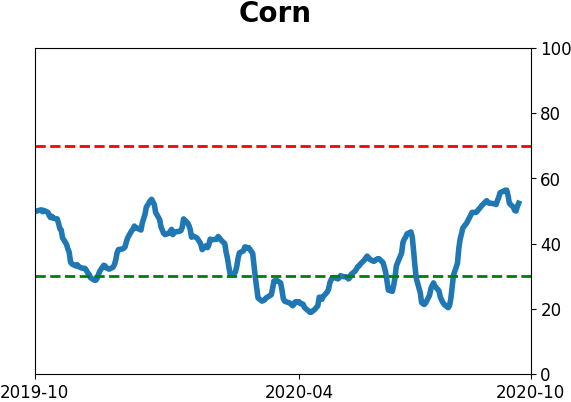
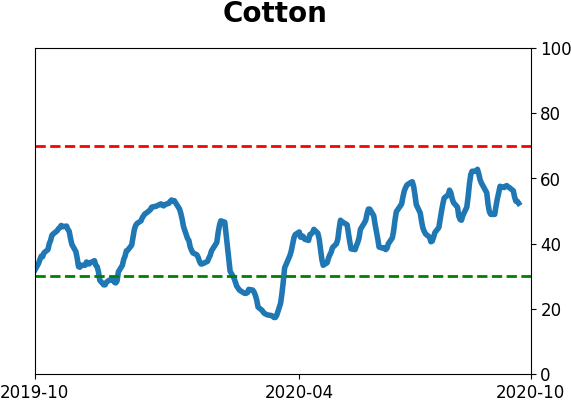
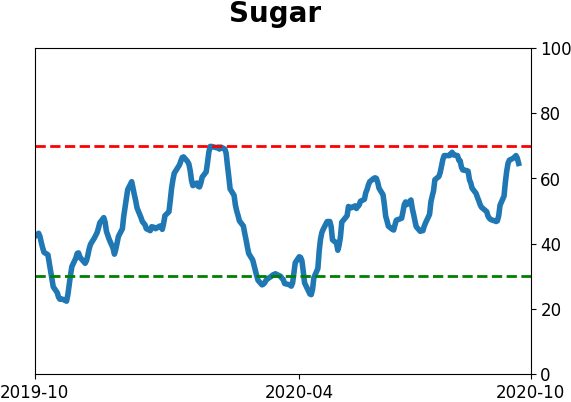
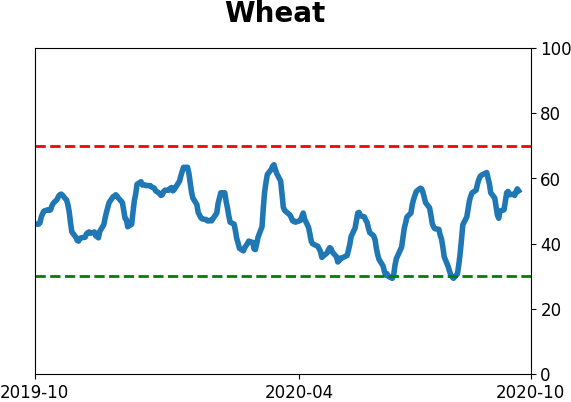
Agriculture
|
|
Research
BOTTOM LINE
There has been heavy and persistent internal selling pressure in emerging markets, particularly in Brazil. This has pushed some longer-term breadth metrics well into oversold territory. They're showing early signs of reversing, which has been a good medium- to long-term sign.
FORECAST / TIMEFRAME
EEM -- Up, Medium-Term
|
Last week, we saw that even while economic reports in emerging market countries were gaining strength relative to countries like the U.S., many of the stocks in those markets were declining. The McClellan Summation Index for emerging markets was dropping well into oversold territory.
The oddity is that even while emerging market indexes have held up, it's not because of most stocks rising. The Cumulative Advance/Decline Line has plunged in recent months, diverging from the indexes.
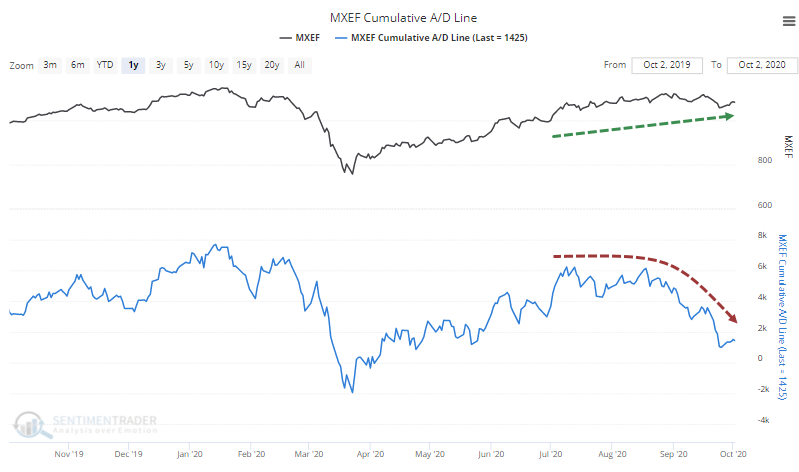
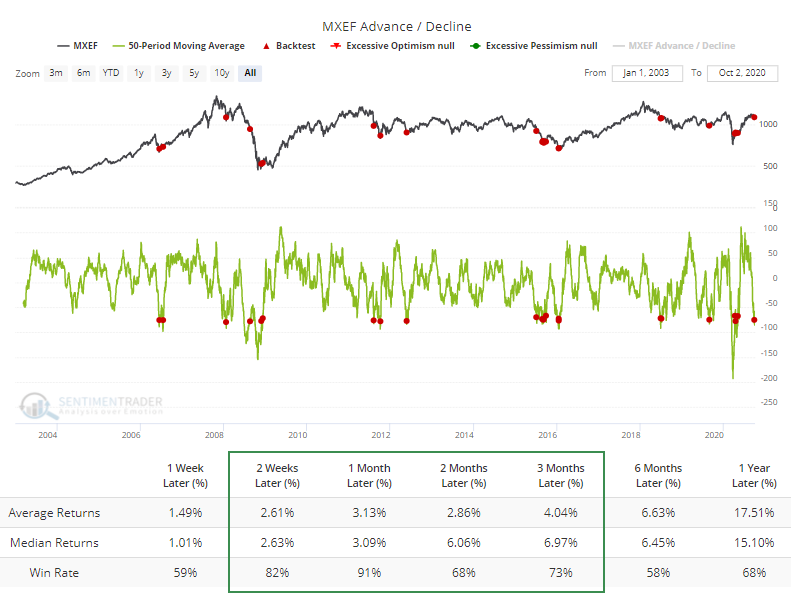
Over the past 50 days, an average of 80 more stocks declined each day than advanced. That's a historically extreme reading that's just now starting to improve. The Backtest Engine shows good forward returns when this has triggered before.
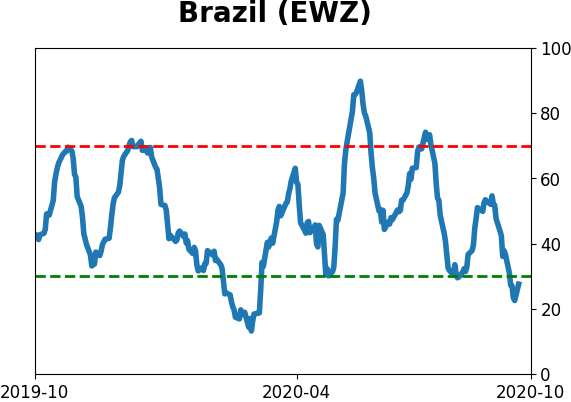
Part of this weakness comes from Brazil, where the Cumulative A/D Line has been even worse, now below even the March lows.
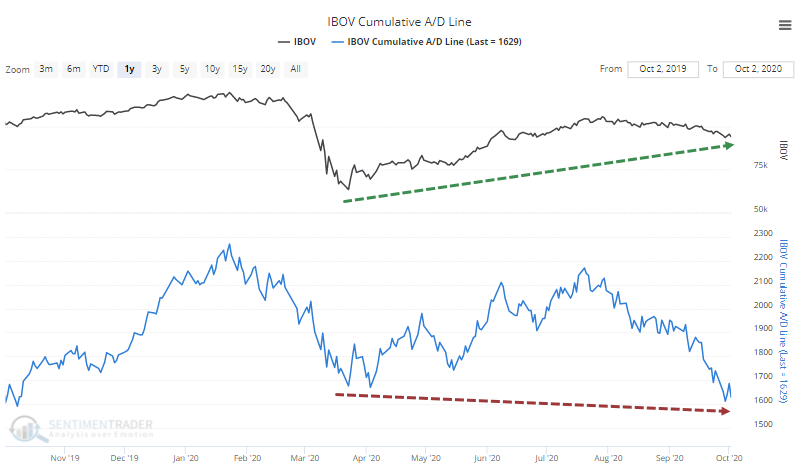
Again, over the past 50 days there have been an average of more declining than advancing stocks, enough to register a historical extreme that's only now starting to curl higher. The Backtest Engine shows poor short-term returns but excellent longer-term ones after prior signals.
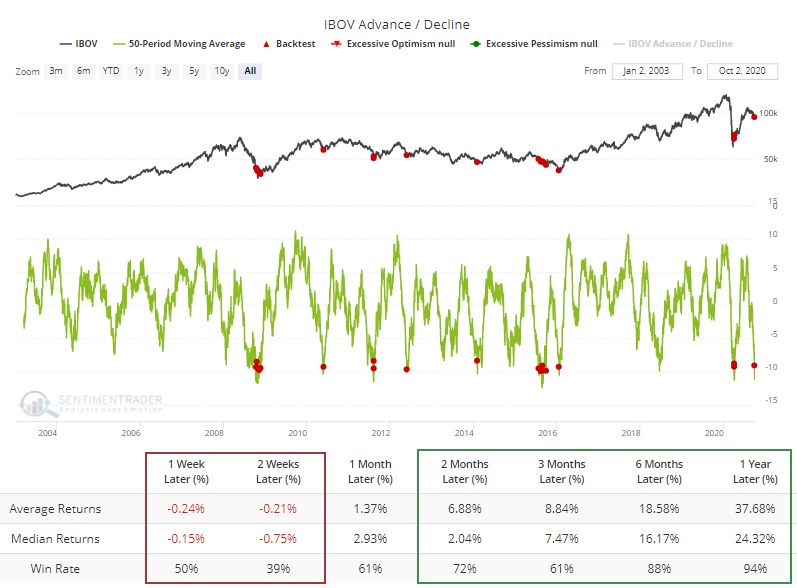
Such persistent internal weakness has pushed the McClellan Summation Index for the Ibovespa down to a rarefied extreme. Once again, the Backtest Engine shows impressive forward returns. The only real exception was in August 2015 when there was no sustained positive reaction to the oversold conditions. After the others, if there was any further short-term weakness, then it was quickly and emphatically reversed in the months ahead.
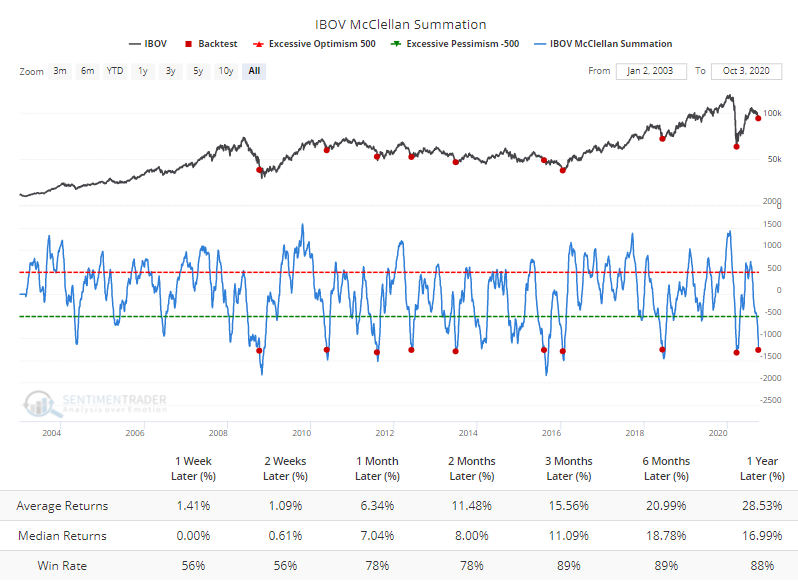
When markets reach these kinds of extremes and show signs of recovery, they tend to keep going, which is a good sign for the medium-term. One concern is that much of this weakness has been under the surface, as the indexes themselves haven't corrected much. Some would suggest that the indexes will fall in order to catch up with the weakness shown in the majority of stocks, but in historical tests, that theory is not reliable. From a medium- to long-term point of view, the internal selling has been enough to consistently precede positive returns.
Active Studies
| Time Frame | Bullish | Bearish | | Short-Term | 0 | 0 | | Medium-Term | 1 | 8 | | Long-Term | 47 | 2 |
|
Indicators at Extremes
Portfolio
| Position | Description | Weight % | Added / Reduced | Date | | Stocks | 15.2% RSP, 7.2% XLE | 22.4 | Added 3% | 2020-10-02 | | Bonds | 10% BND, 10% SCHP, 10% ANGL | 29.9 | Reduced 0.1% | 2020-10-02 | | Commodities | GCC | 2.4 | Reduced 2.1%
| 2020-09-04 | | Precious Metals | GDX | 4.7 | Added 5% | 2020-09-09 | | Special Situations | | 0.0 | Reduced 5% | 2020-10-02 | | Cash | | 40.6 | | |
|
Updates (Changes made today are underlined)
It's been a really mixed picture lately. In stocks, we saw huge momentum and a spike in speculation, then September managed to wring much of that out, except in the options market which is still a worry. There seem to be offsetting positives and negatives, with a mixed market environment, not the kind of setup where I feel comfortable being aggressive. I did add a bit to energy. The older I get, the less interested I am in short-term gyrations, and I don't really care about the coming days or even weeks. I'm fairly confident that the total return will be positive over a longer time frame given some of the developments we've looked in over the past week. With bonds, I decided to swap TLT for ANGL, a high-yield corporate fund with a heavy focus on energy bonds. Hedgers are heavily short 10-year Treasuries, and the high-yield market has held up well internally.
RETURN YTD: -1.2% 2019: 12.6%, 2018: 0.6%, 2017: 3.8%, 2016: 17.1%, 2015: 9.2%, 2014: 14.5%, 2013: 2.2%, 2012: 10.8%, 2011: 16.5%, 2010: 15.3%, 2009: 23.9%, 2008: 16.2%, 2007: 7.8%
|
|
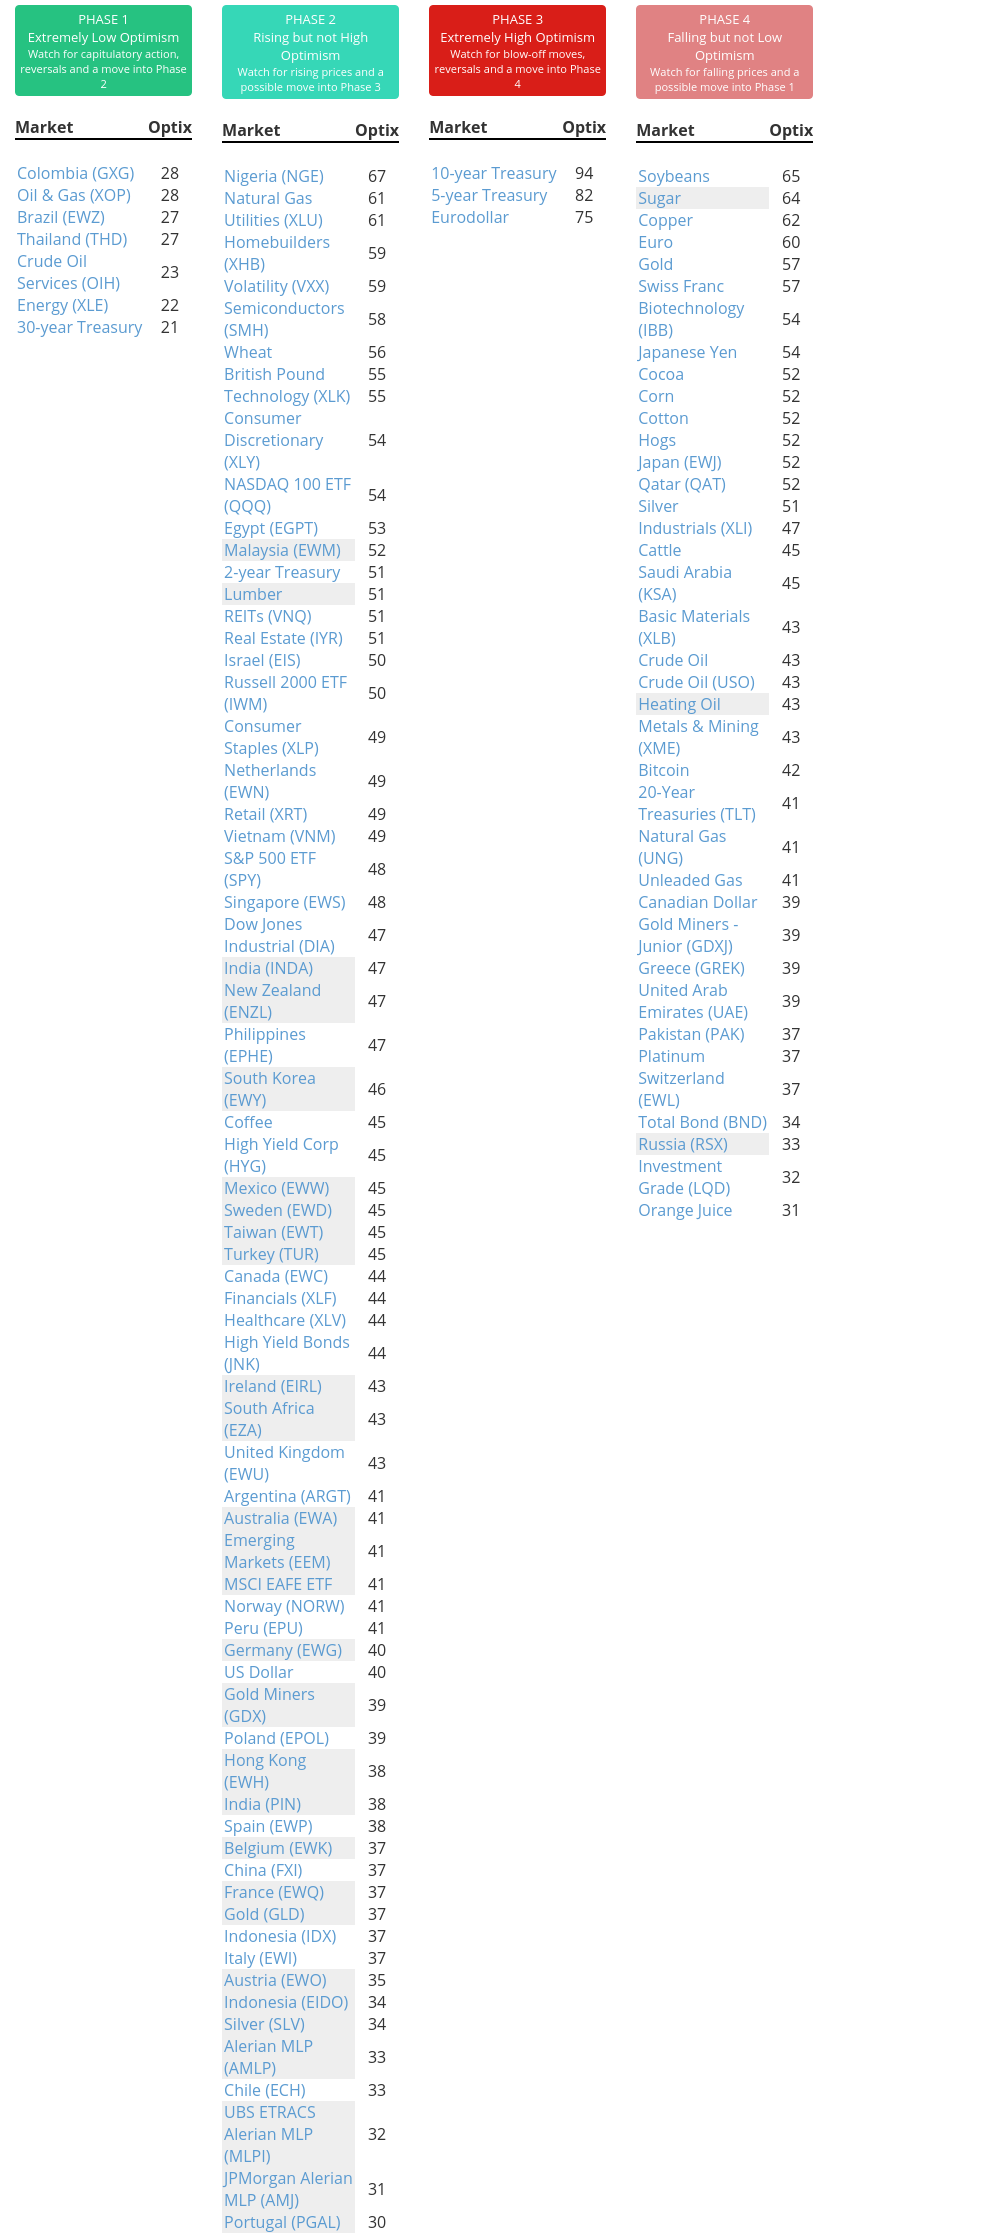
Phase Table
Ranks
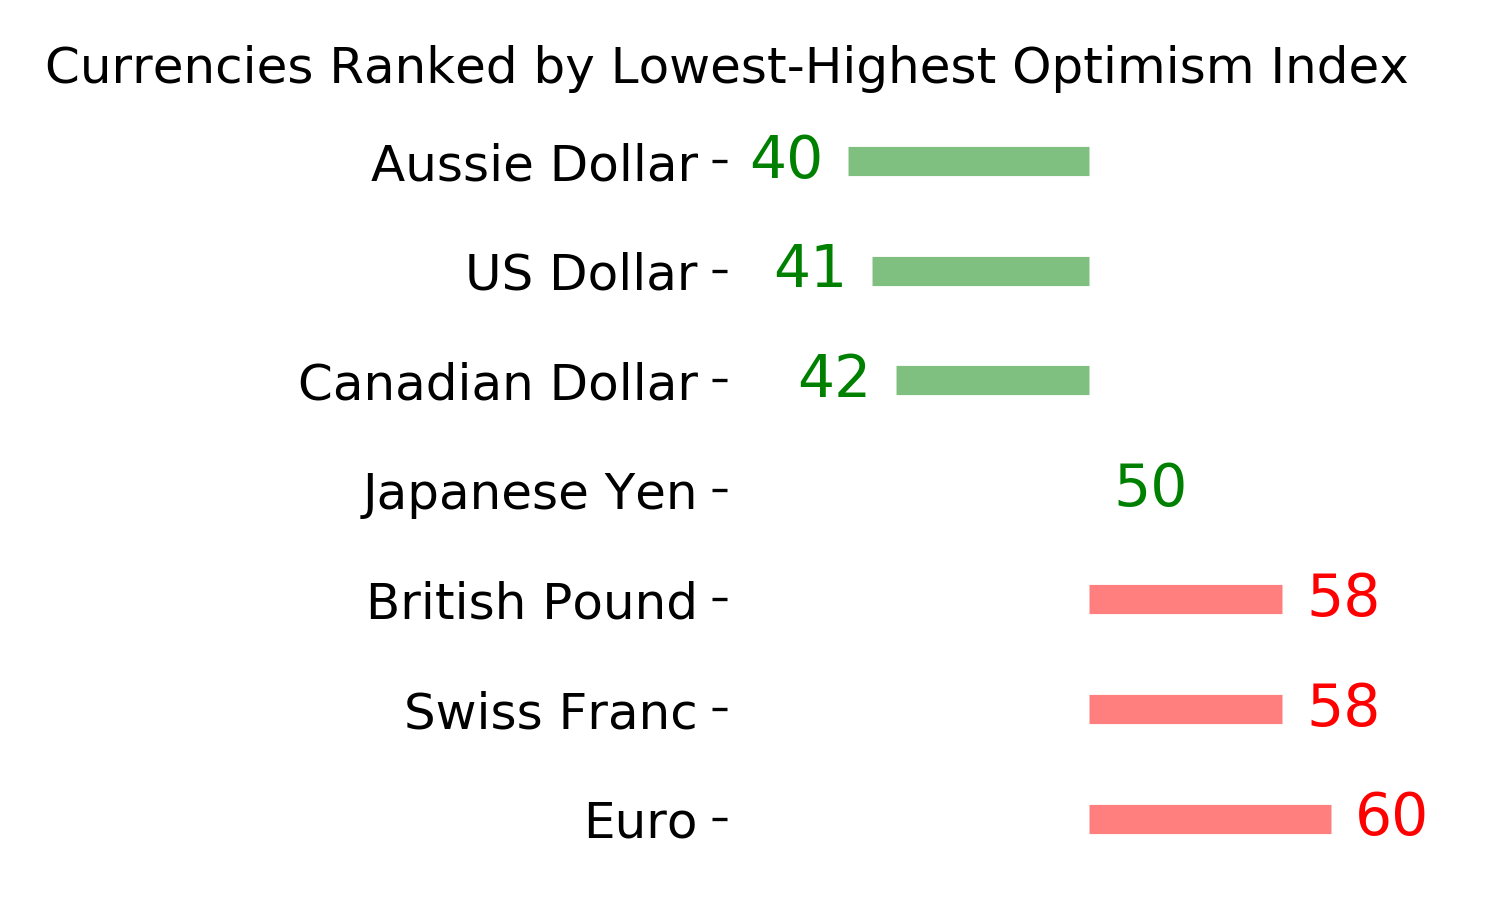
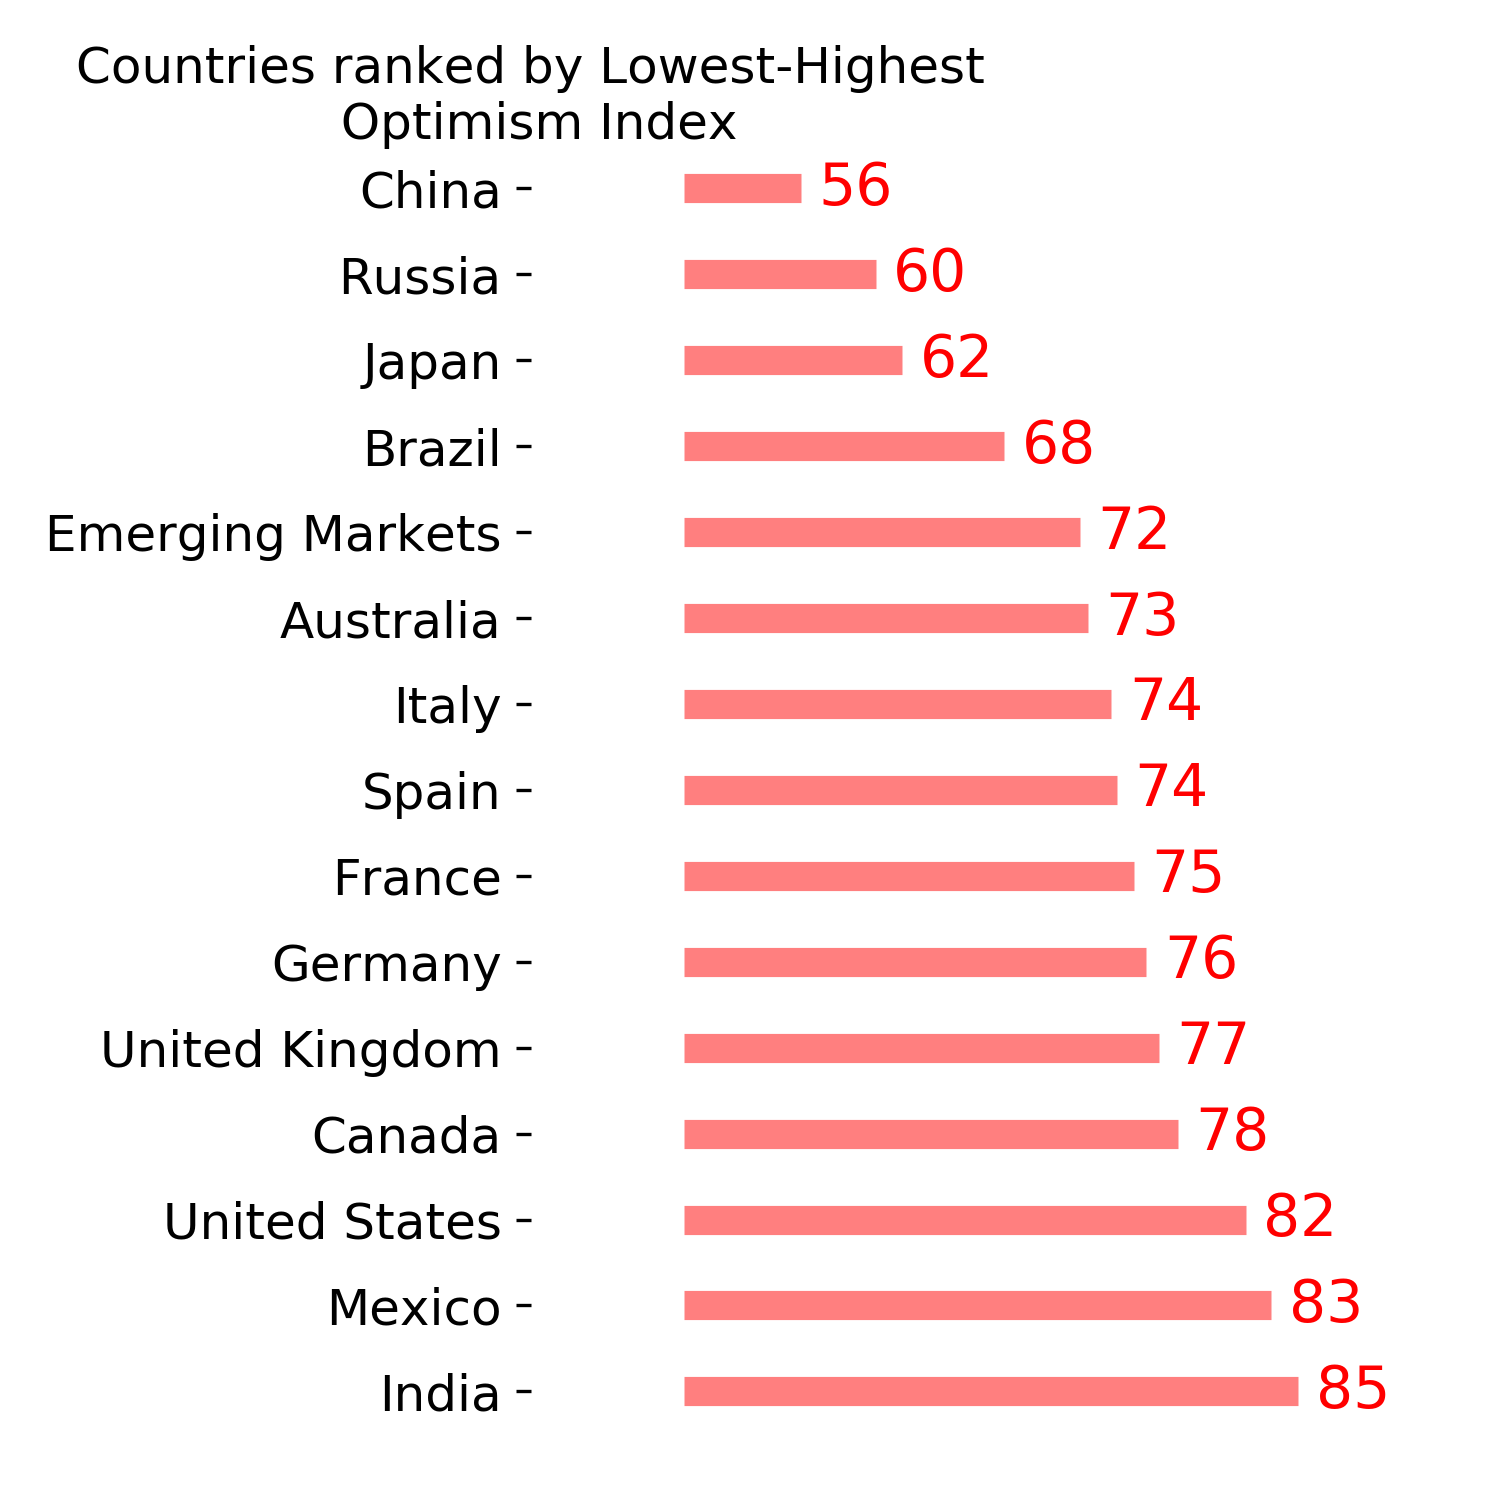
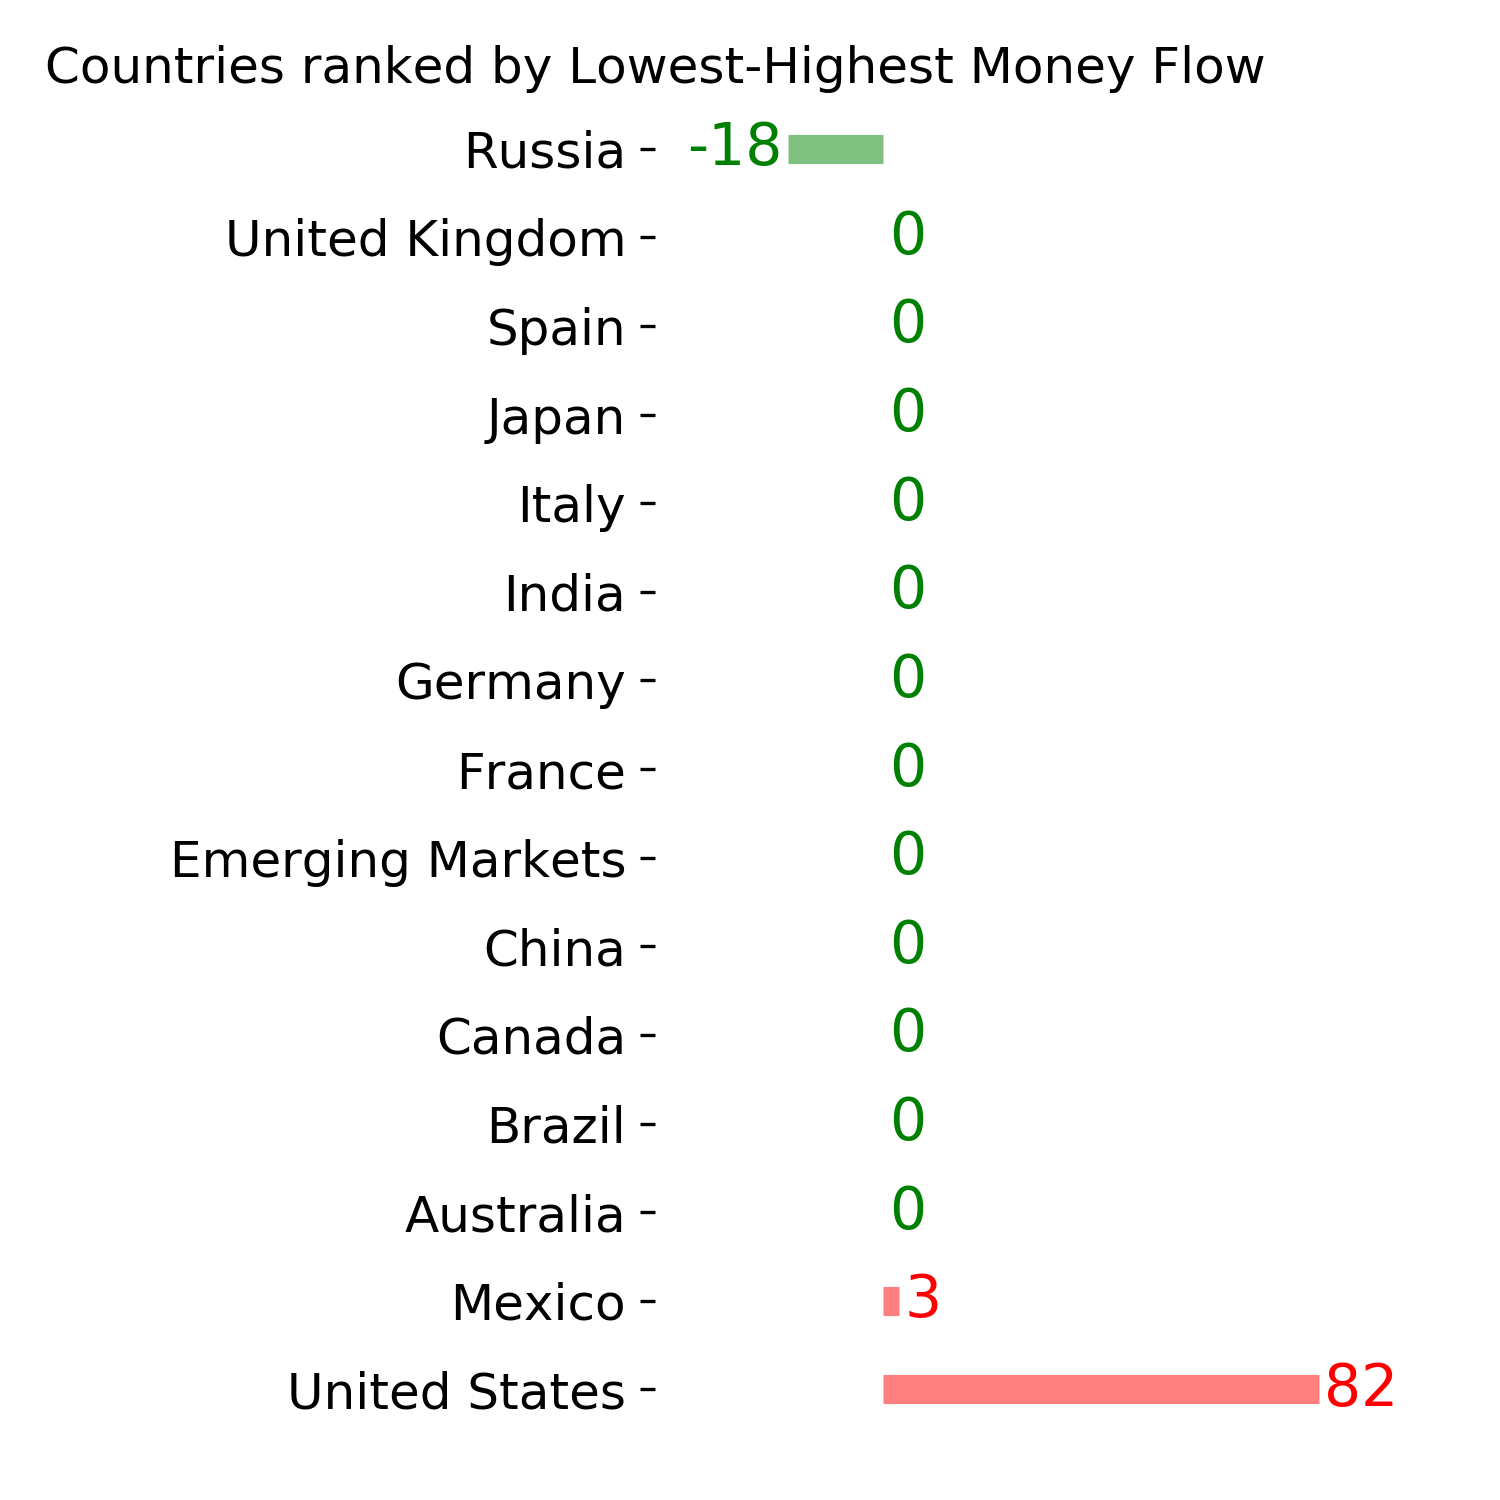
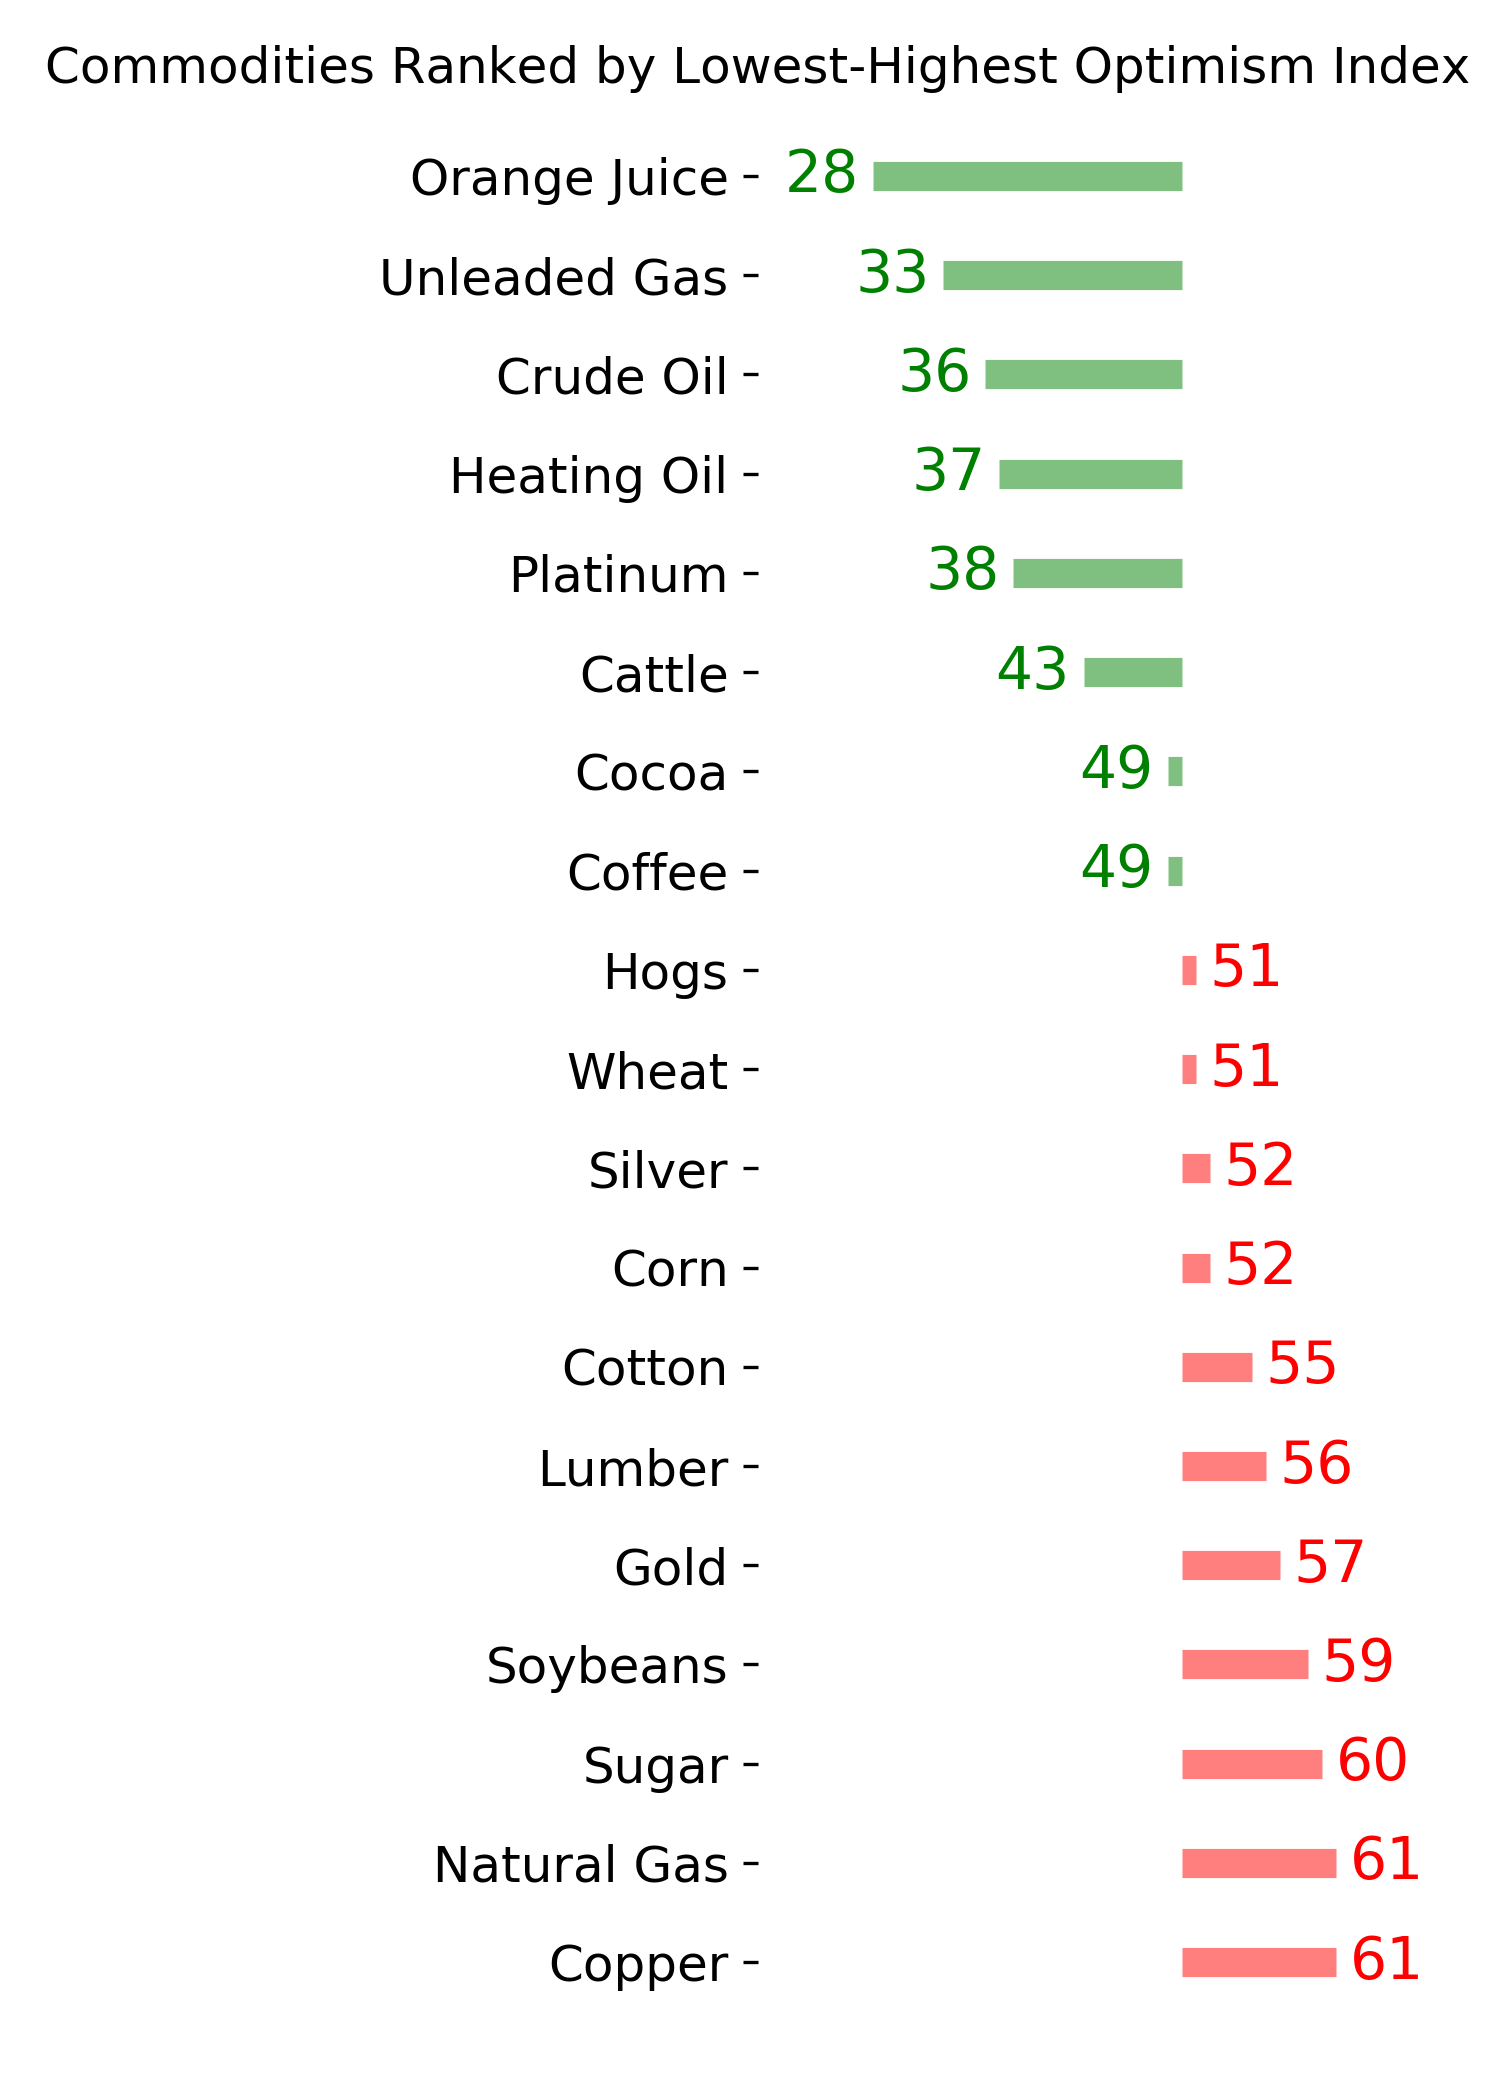
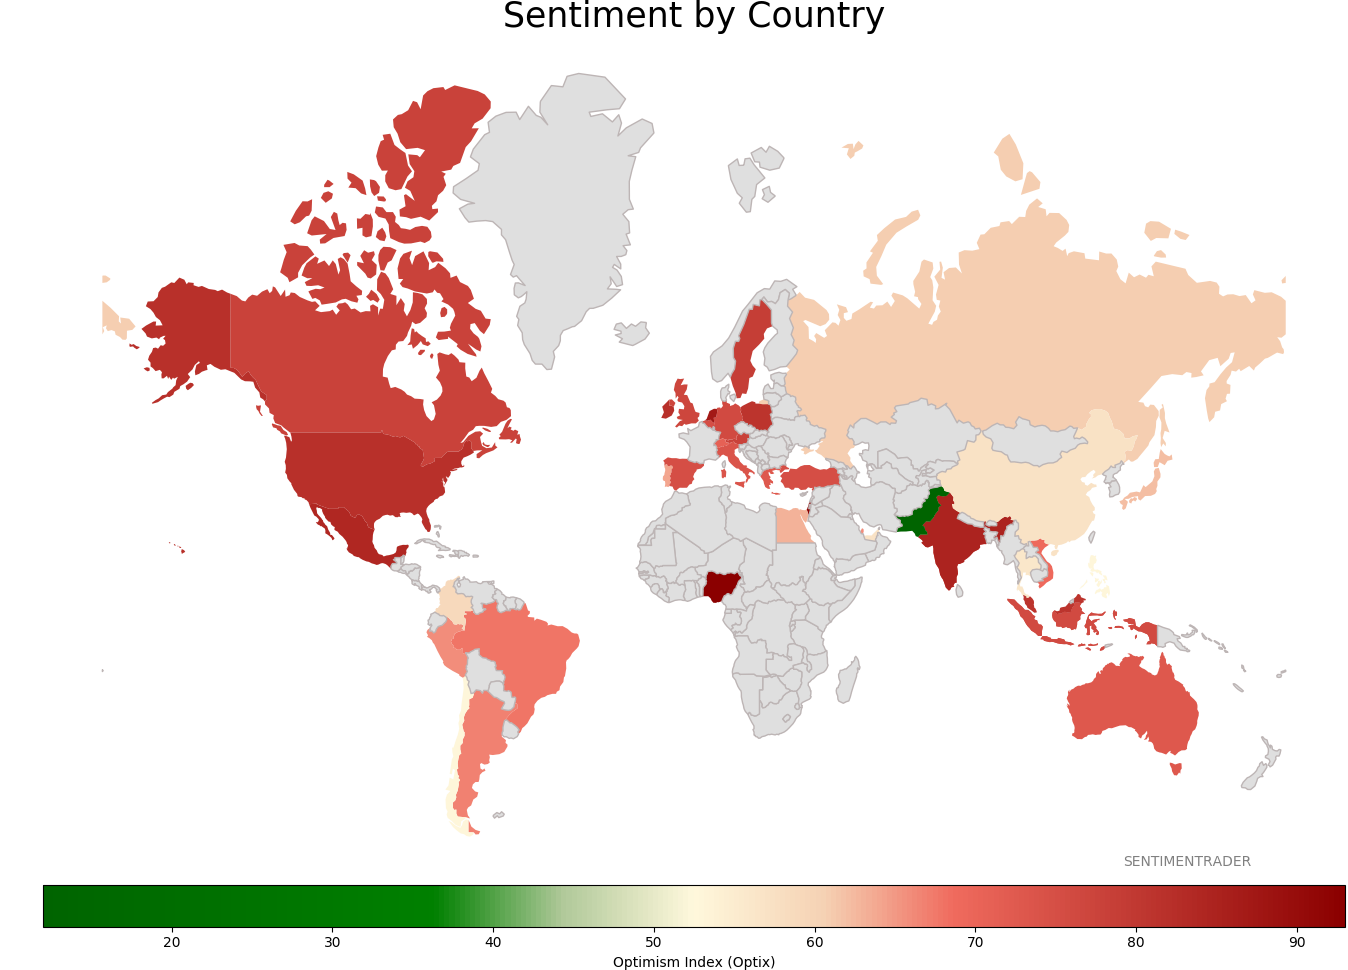
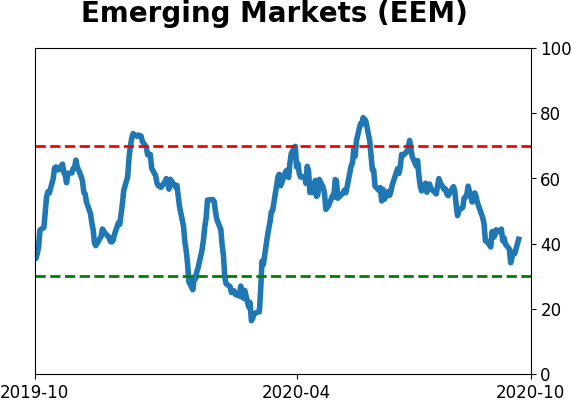
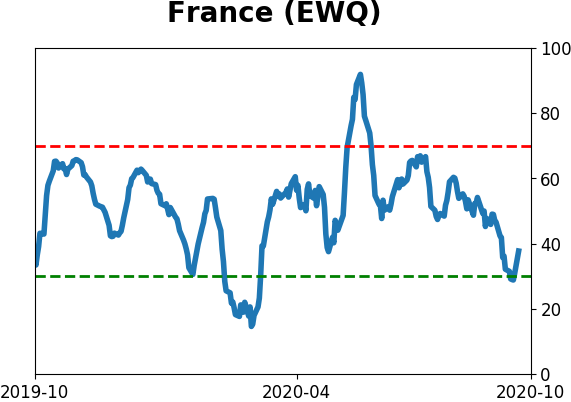
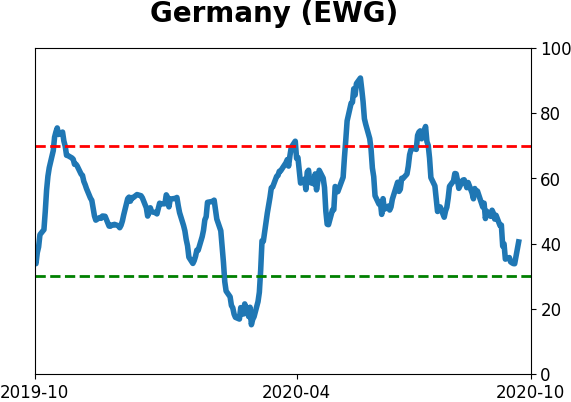
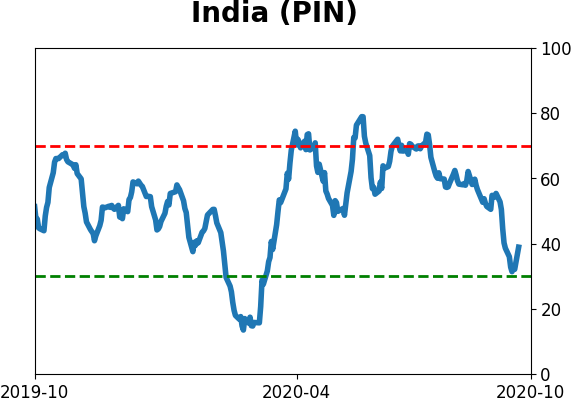
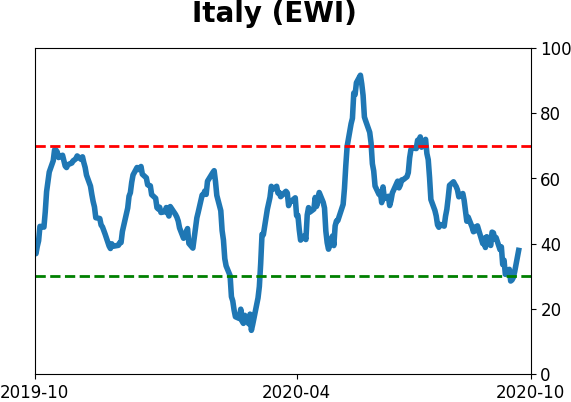
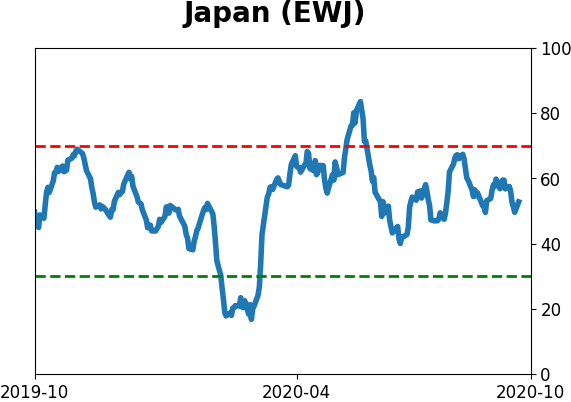
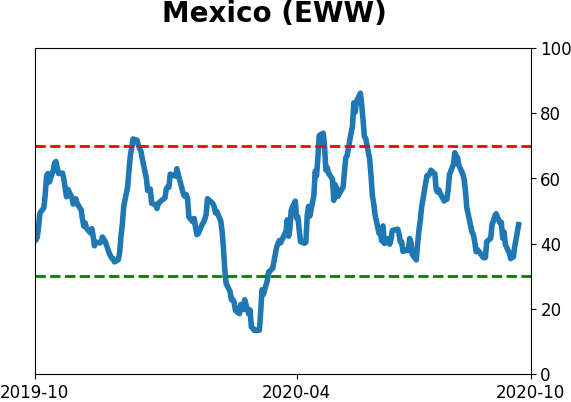
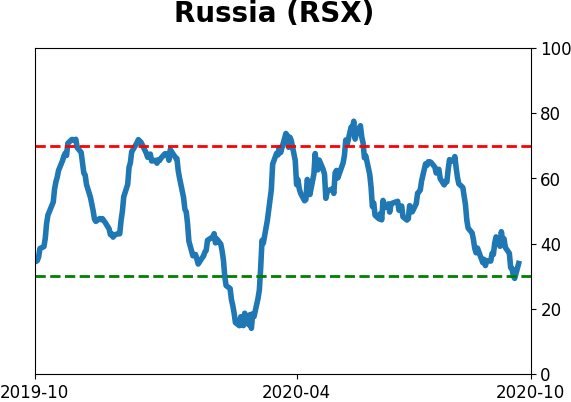
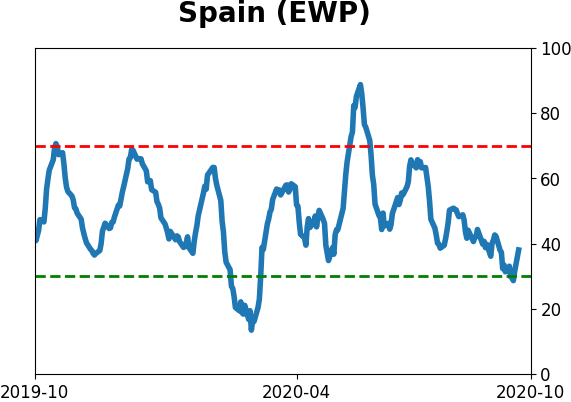
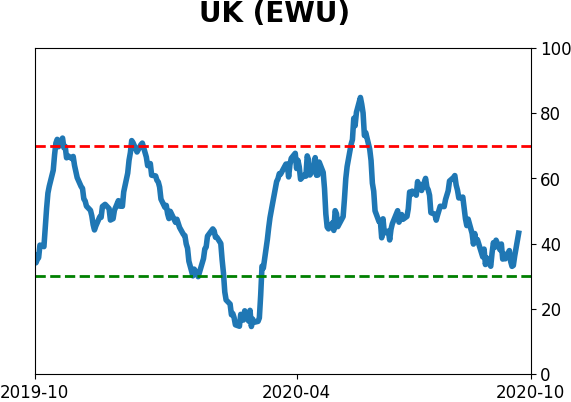
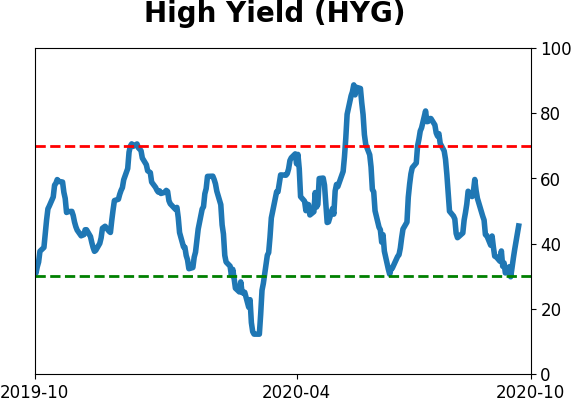
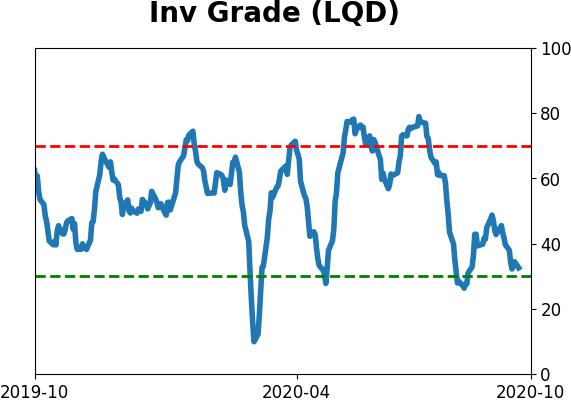
Sentiment Around The World
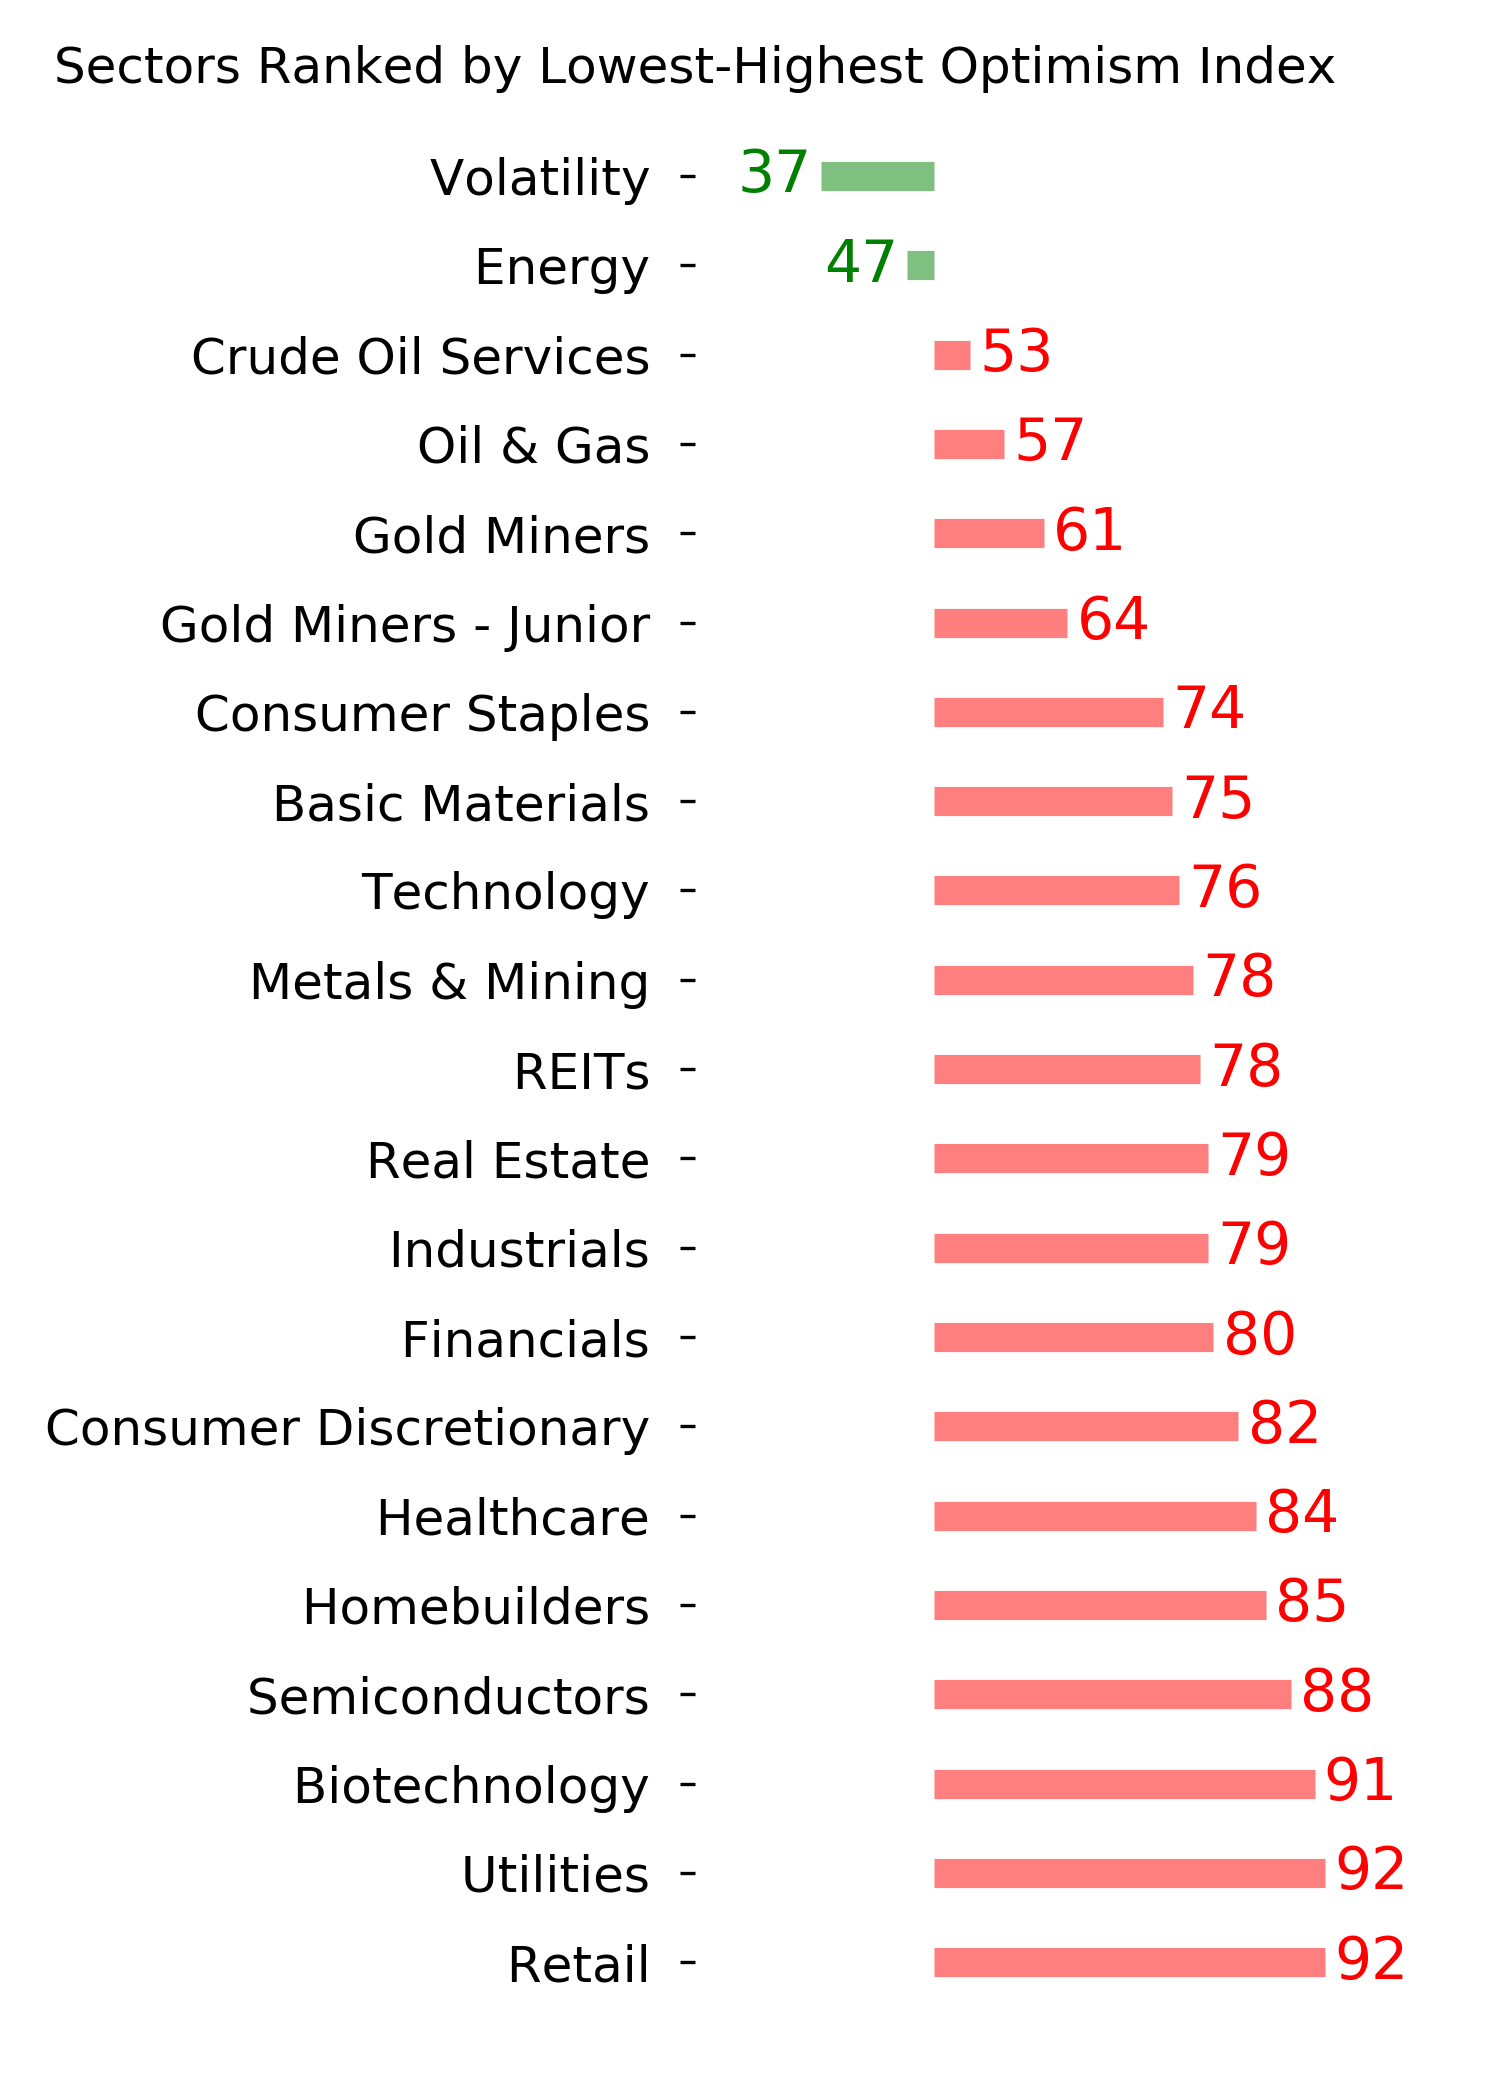
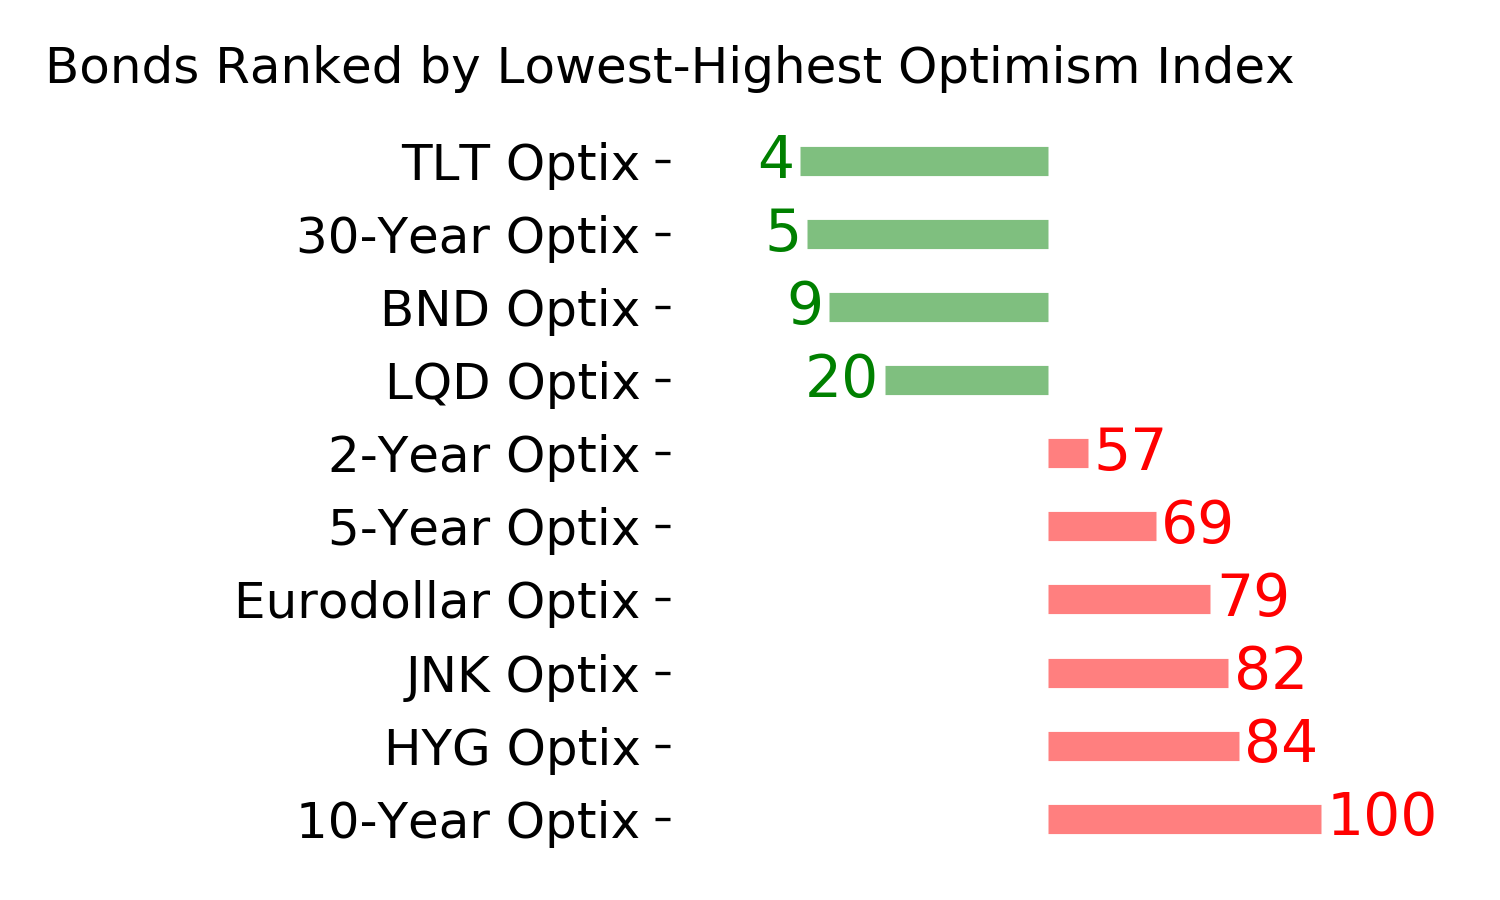
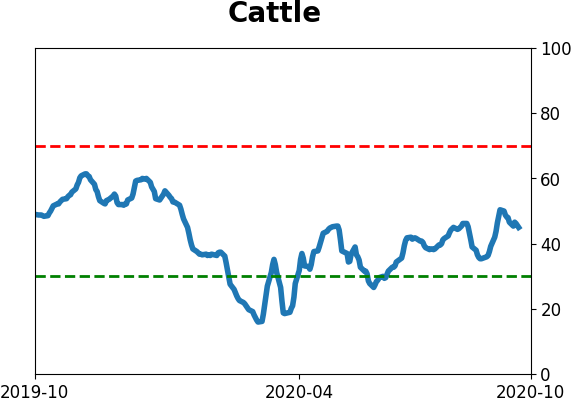
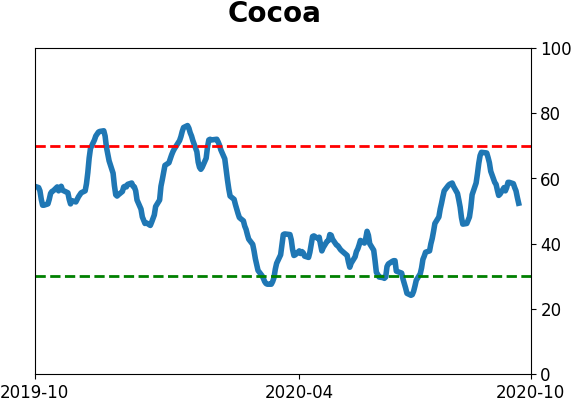
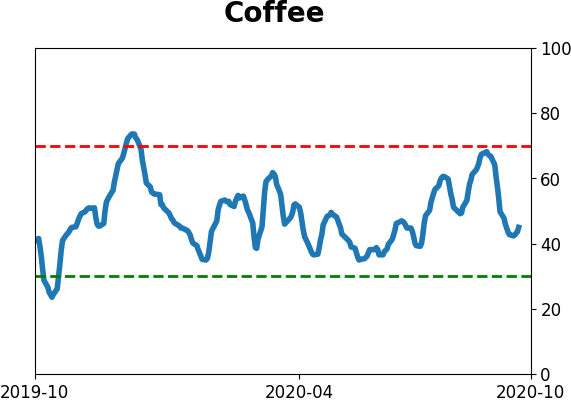
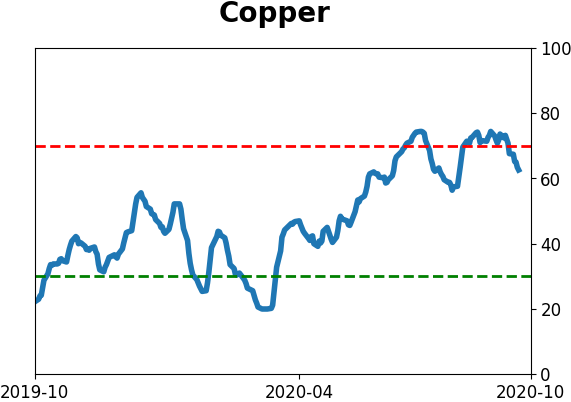
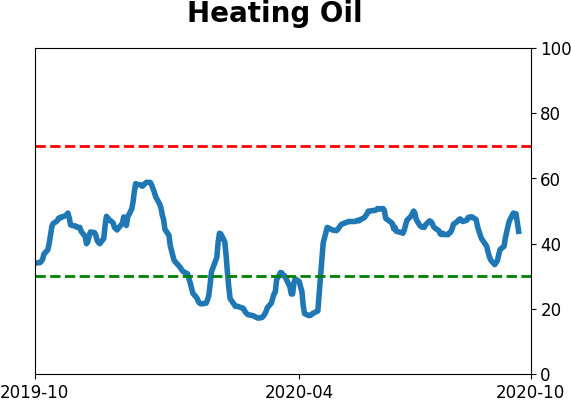
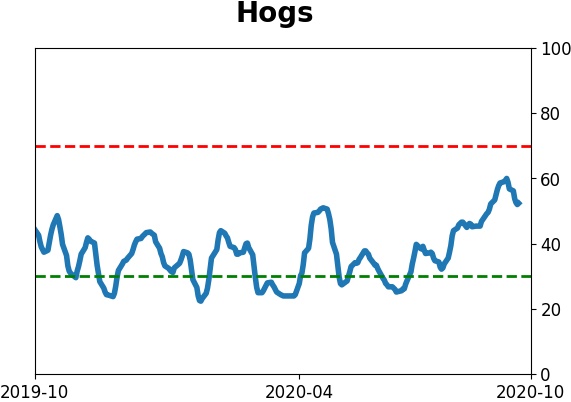
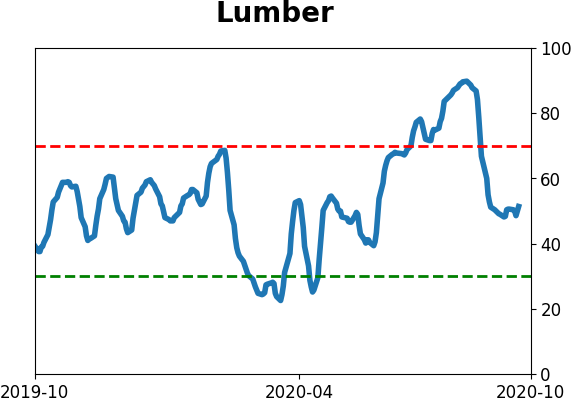
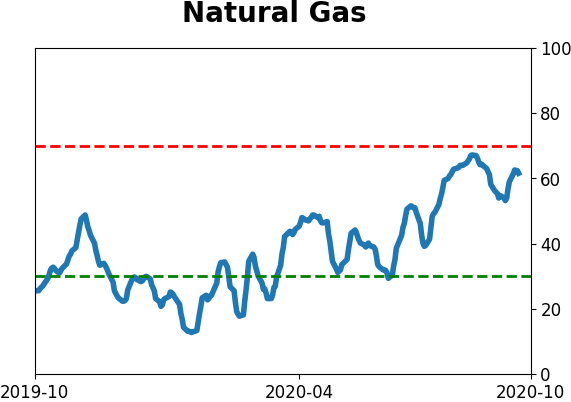
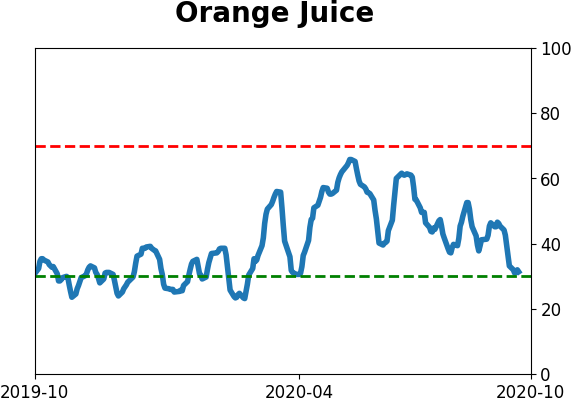
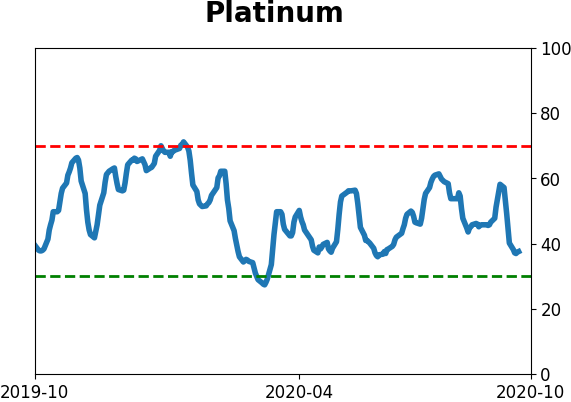
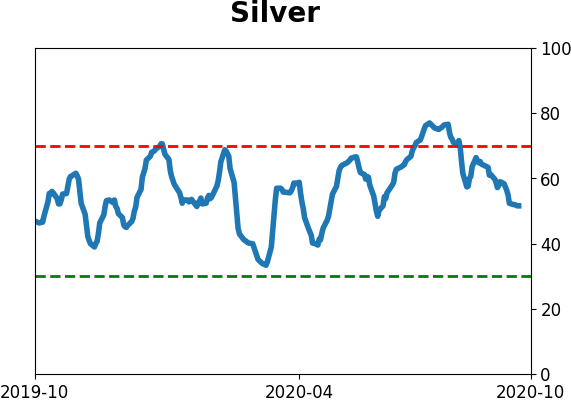
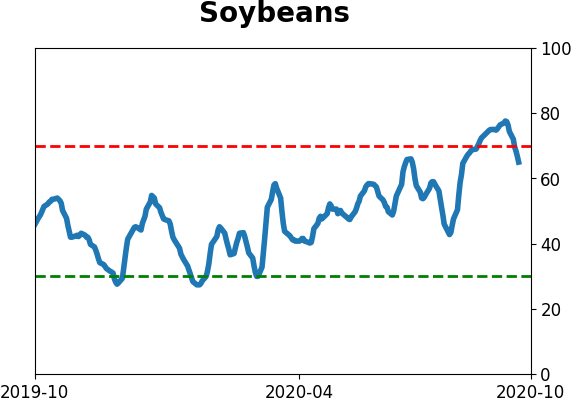
Optimism Index Thumbnails
|
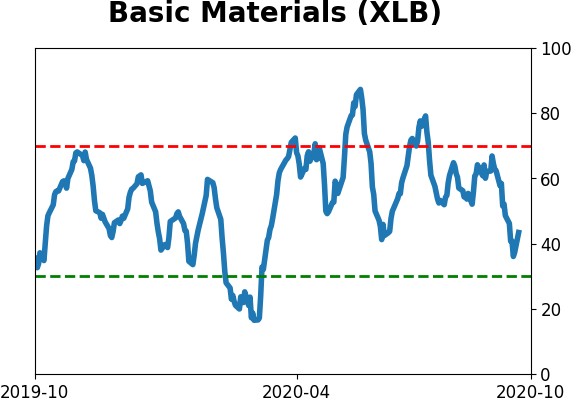
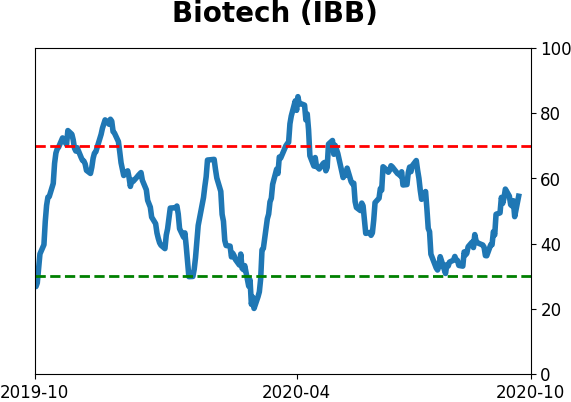
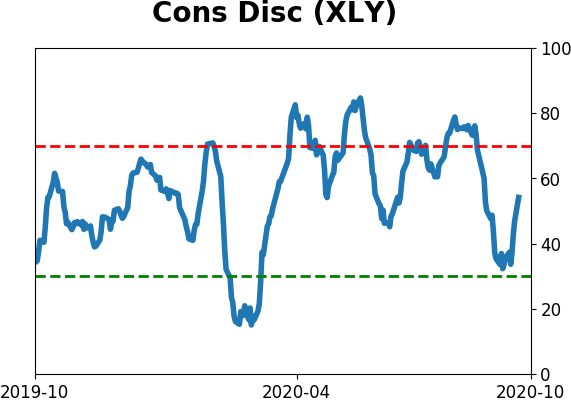
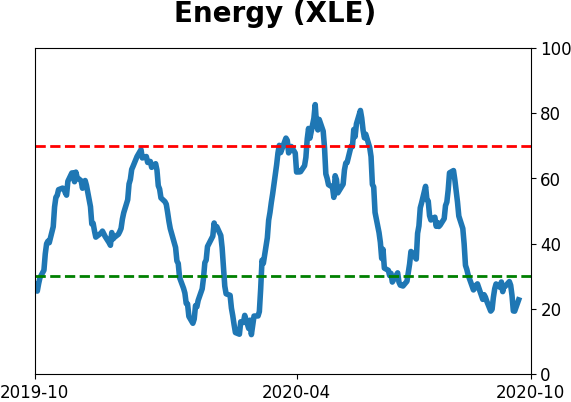
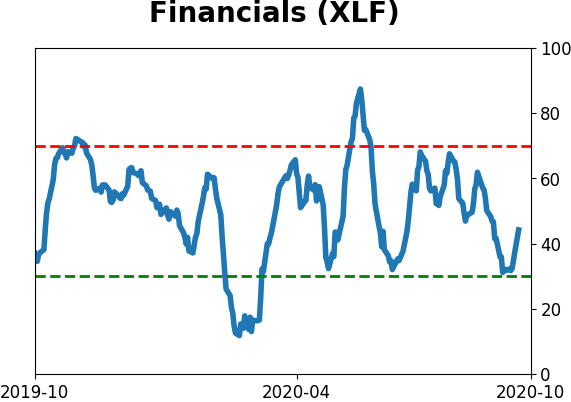
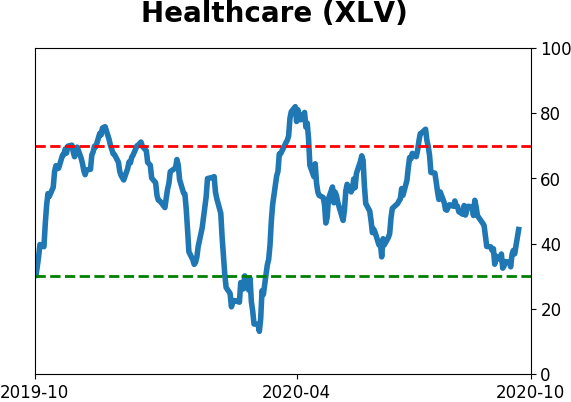
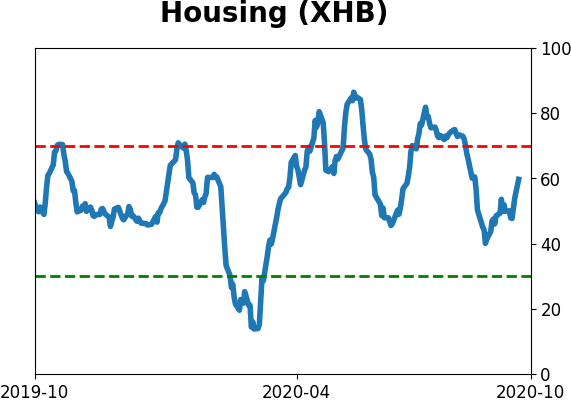
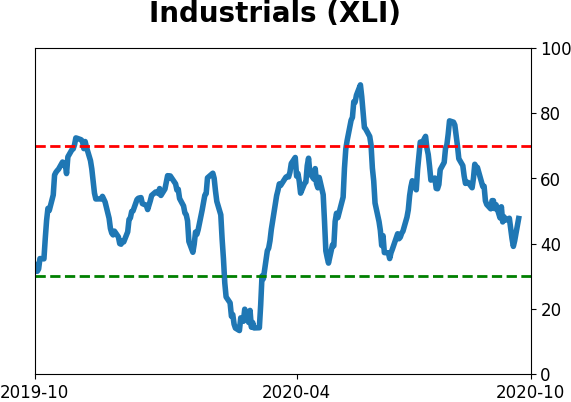
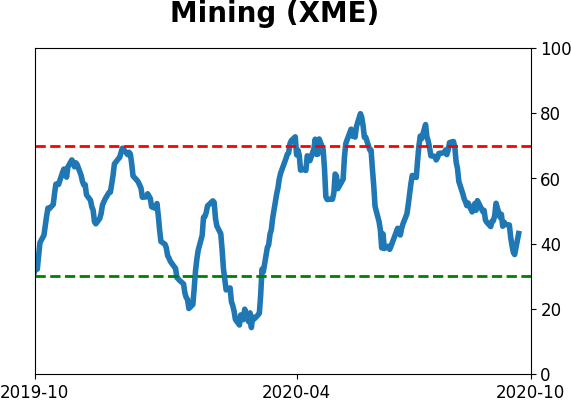
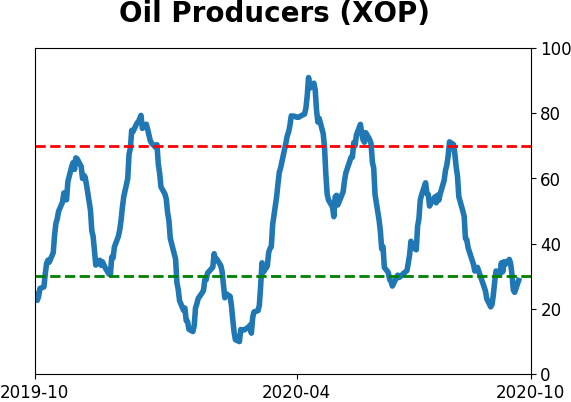
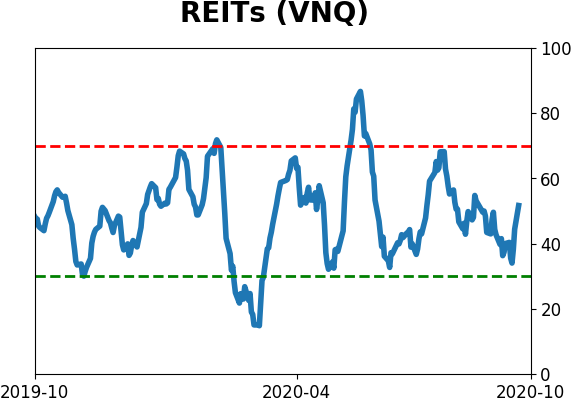
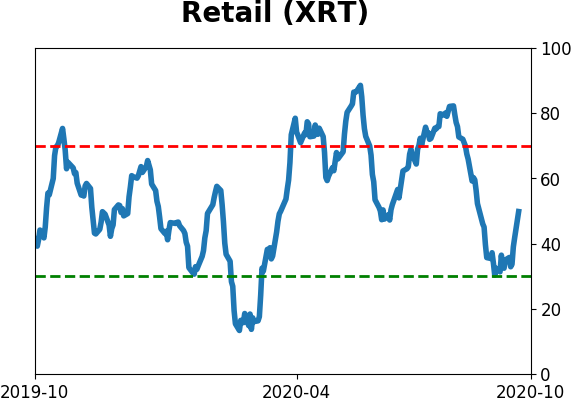
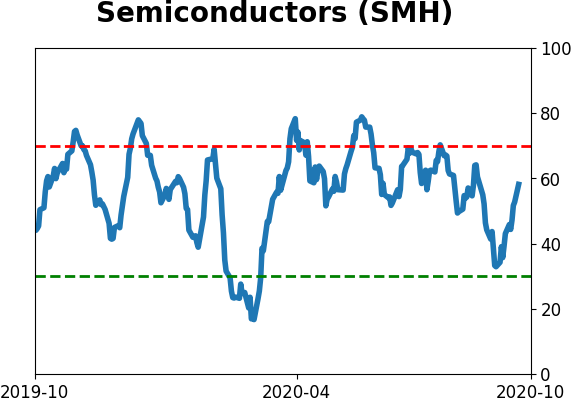
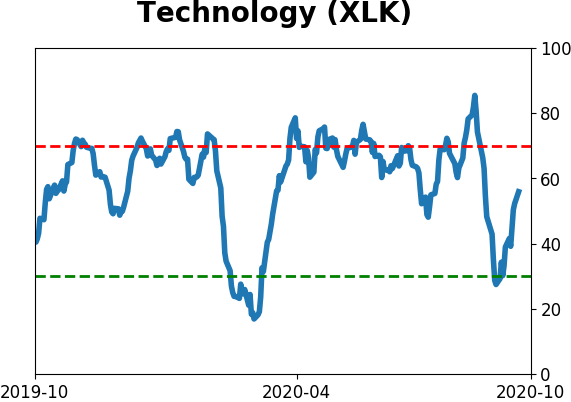
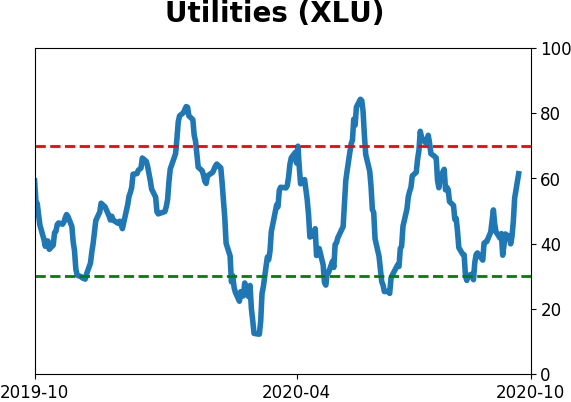
Sector ETF's - 10-Day Moving Average
|
|
|
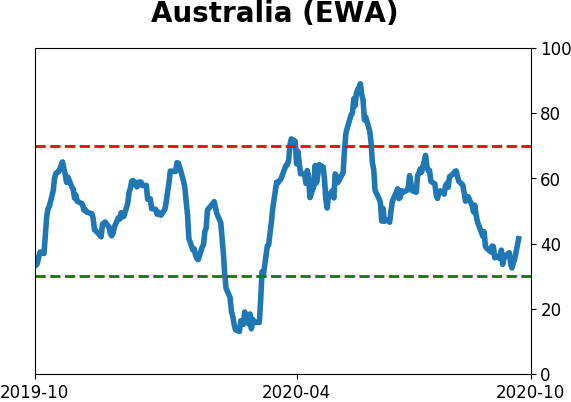
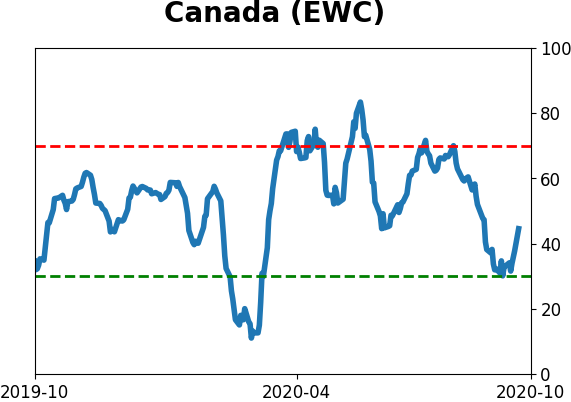
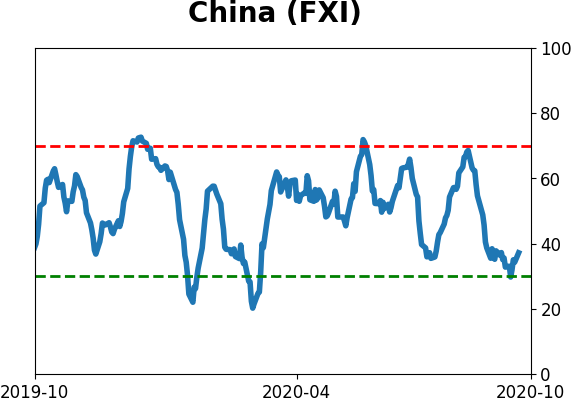
Country ETF's - 10-Day Moving Average
|
|
|
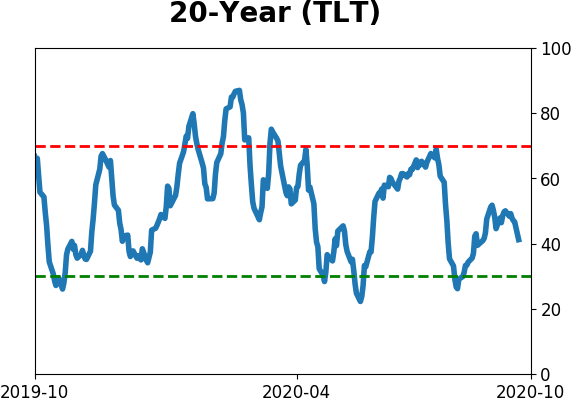
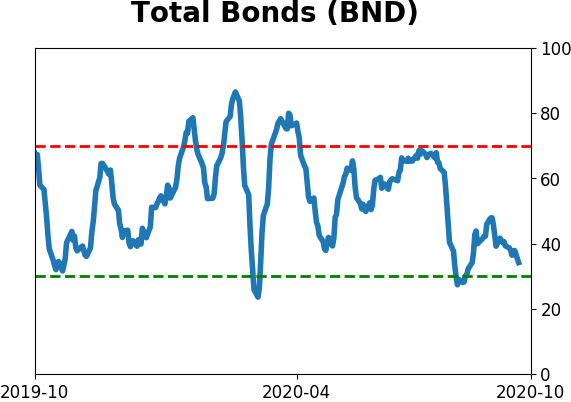
Bond ETF's - 10-Day Moving Average
|
|
|
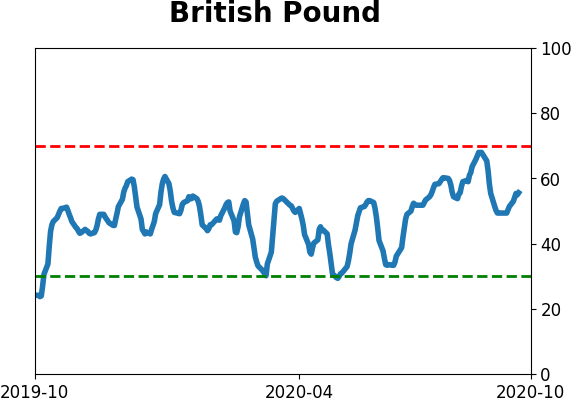
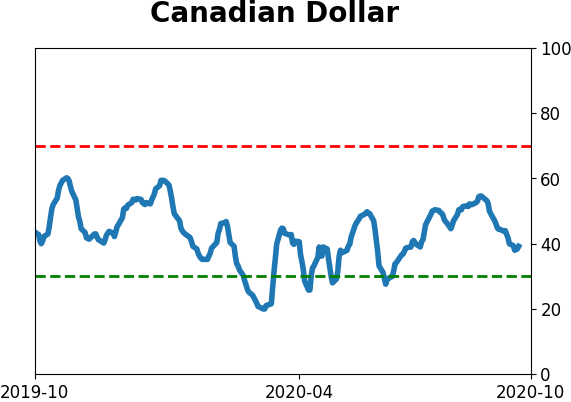
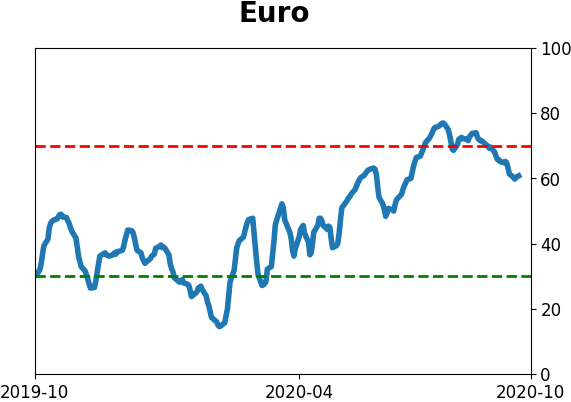
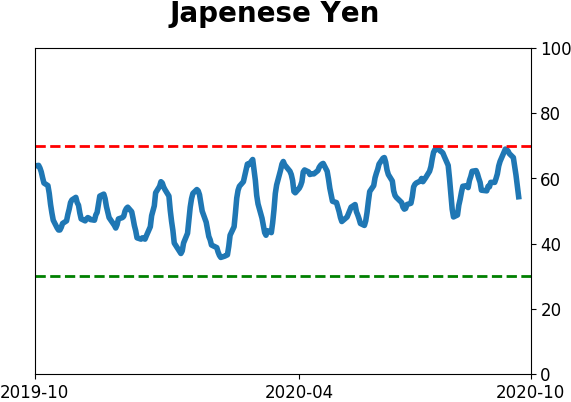
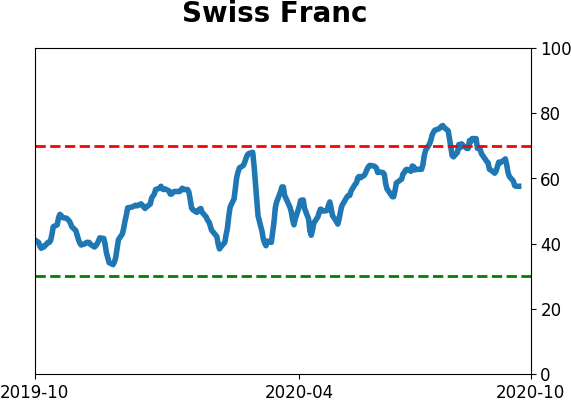
Currency ETF's - 5-Day Moving Average
|
|
|
Commodity ETF's - 5-Day Moving Average
|
|