Headlines
|
|
Investors fear a bubble while others recover from depression:
In recent weeks, news articles containing the word "bubble" have soared to the highest since the year 2000. But other news sources show a near-depression level of sentiment. Those data points give a conflicting view of future returns, which has become more common lately.
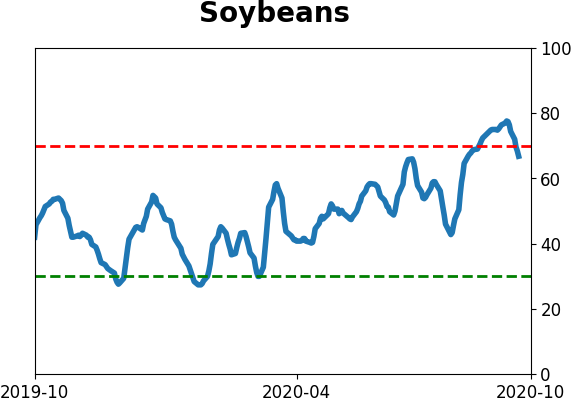
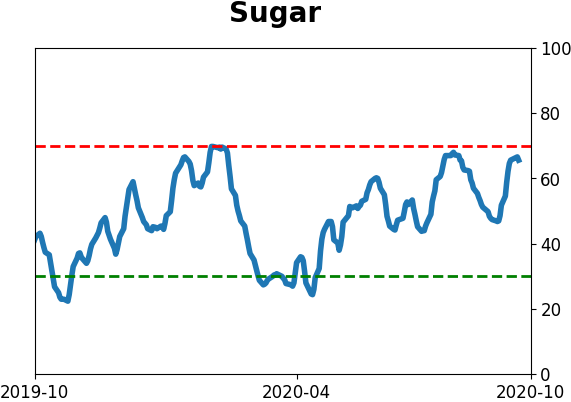
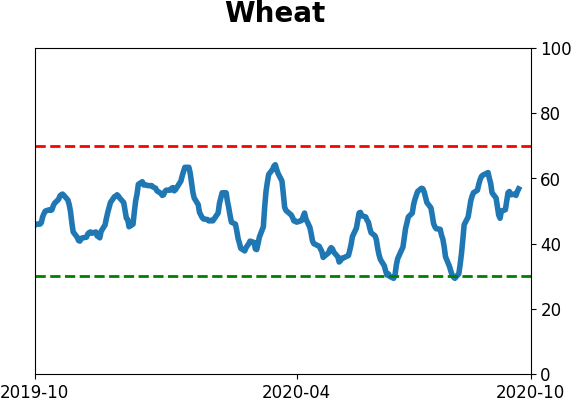
The latest Commitments of Traders report was released, covering positions through Tuesday: The 3-Year Min/Max Screen shows that "smart money" commercial hedgers continued to sell commodities aggressively. Thanks to adding short exposure to contracts like soybeans, their total shorts against agriculture contracts moved to another multi-year low and to commodities in general an all-time low. It's been extremely hard for commodities to gain ground when hedgers were betting this heavily against them. They also added to shorts against 10-year Treasuries. And for the 1st time since the spring, they sold equity index futures aggressively, reducing their net long position by a massive $39 billion in a single week. The prior record reduction was about $24 billion in September 2007 but we don't read too much into week-to-week gyrations. Over the past decade, stocks have done well when hedgers were net long, which they continue to be.
Every energy stock is dropping: For one of the few times in 30 years, by Thursday's close, every energy stock was below its 10-, 50- and 200-day moving average. That kind of selling on all time frames has happened 8 other distinct times since 1990, mostly preceding gains but with a dreadfully early entry in 2008.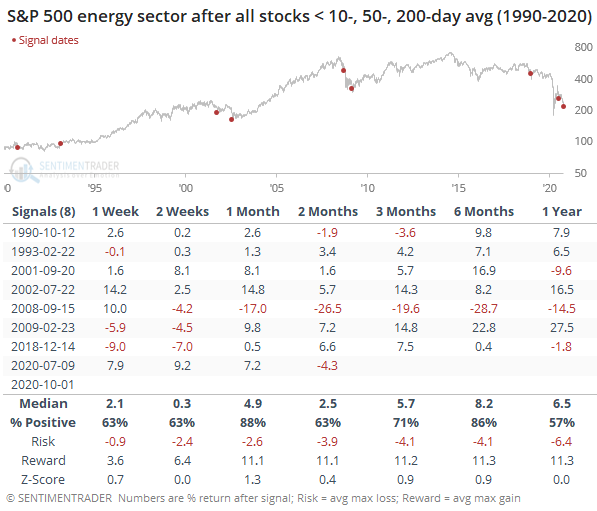
Bottom Line:
- A mixed environment favors becoming defensive if optimism is high and aggressive if low; currently, there is conflicting evidence but would slightly favor becoming more aggressive should optimistic extremes recede further
| Market environment |
| | Positives | Negatives | | 1. Price pattern (barely) | 1. McClellan Summation | | 2. Moving averages | 2. % of Stocks in Correction | | 3. % Stocks > 200-Day |
| | 4. Net New Highs / Lows |
|
| Other Sectors and Assets |
| | Positives | Negatives | | 1. Energy (here and here) | 1. Skewed tech (here and here) |
| 2. Dollar test |
|
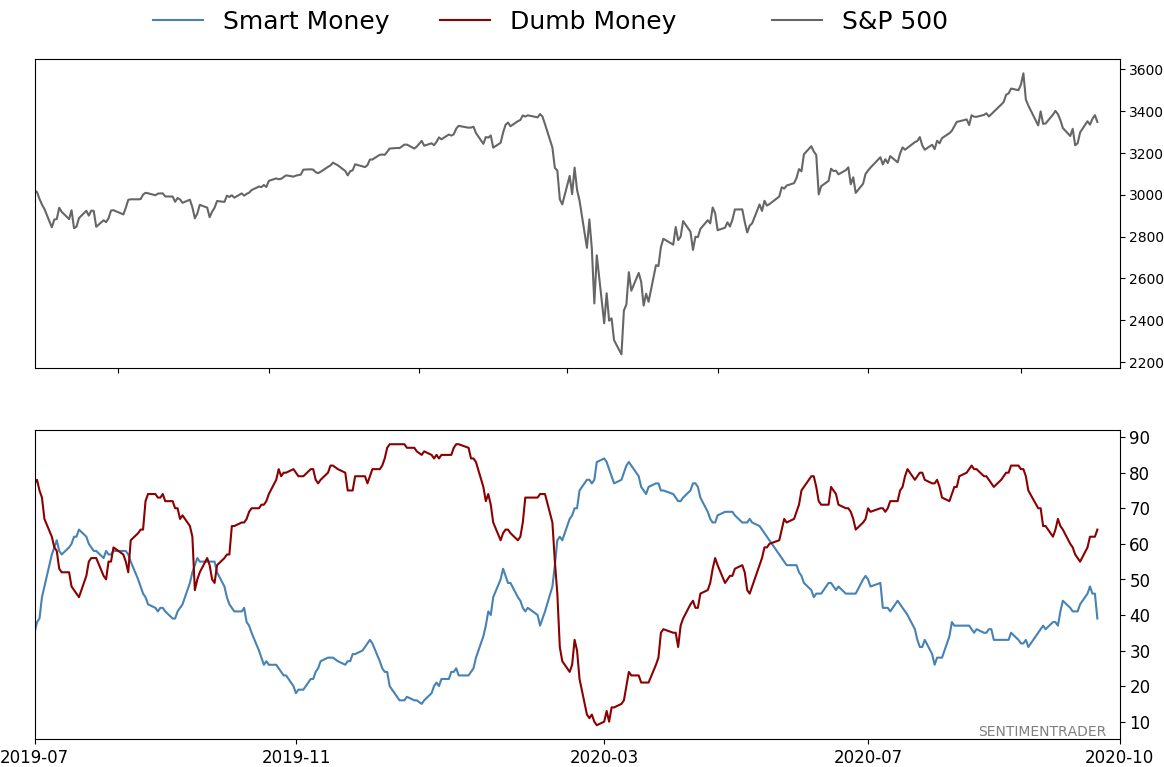
Smart / Dumb Money Confidence
|
Smart Money Confidence: 39%
Dumb Money Confidence: 64%
|
|
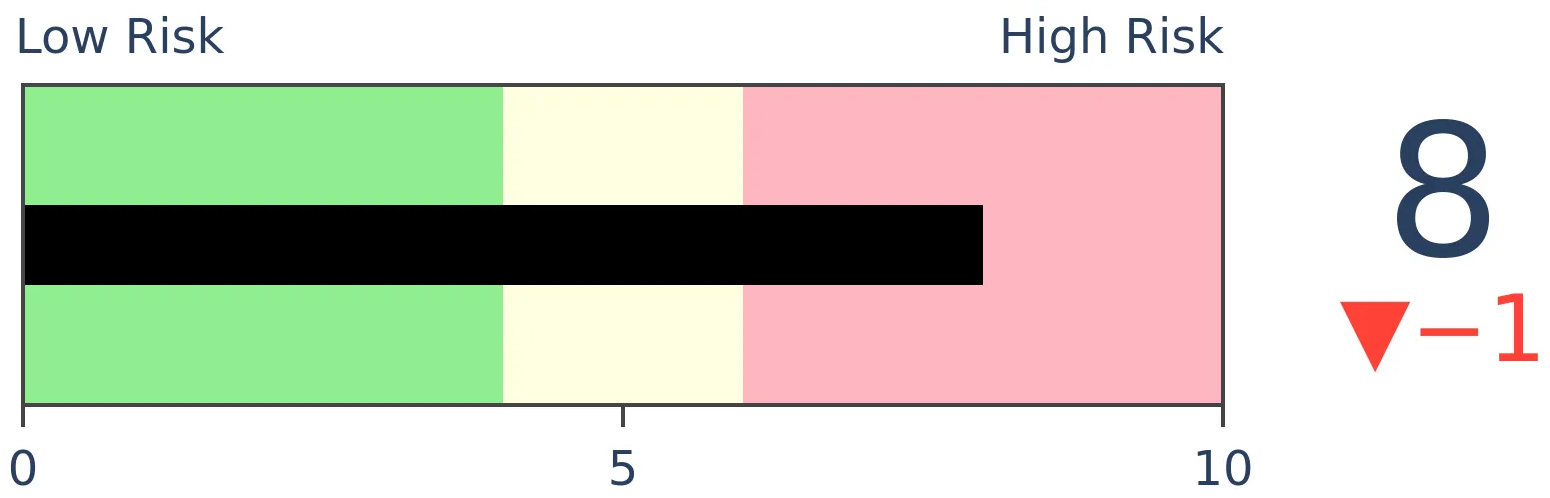
Risk Levels
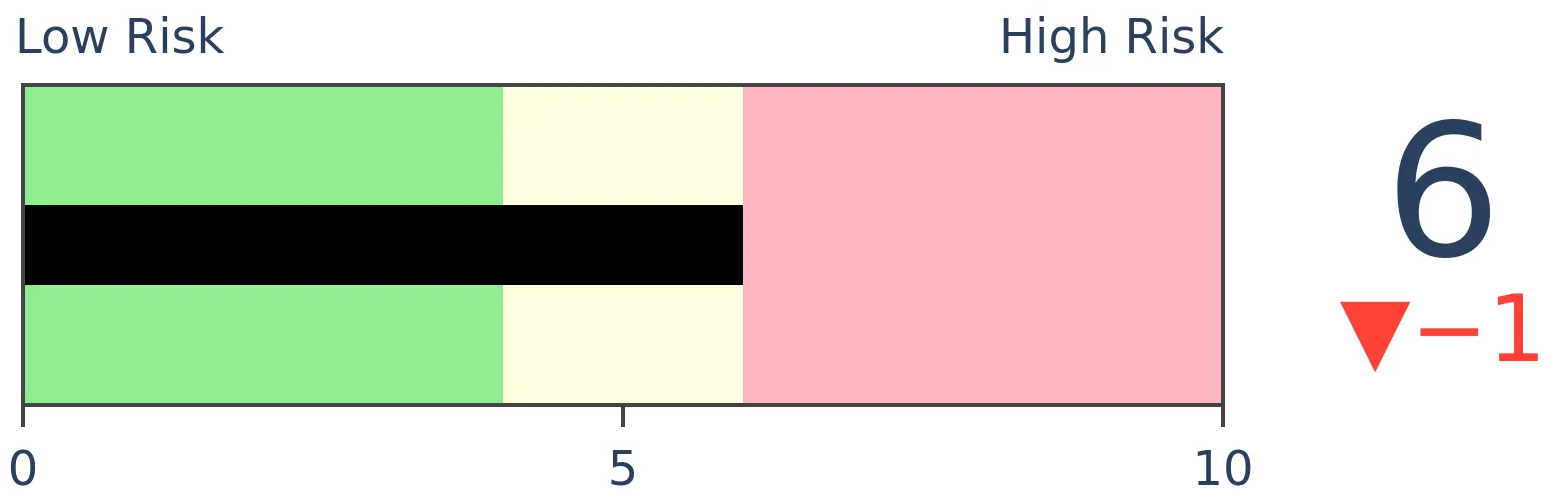
Stocks Short-Term
|
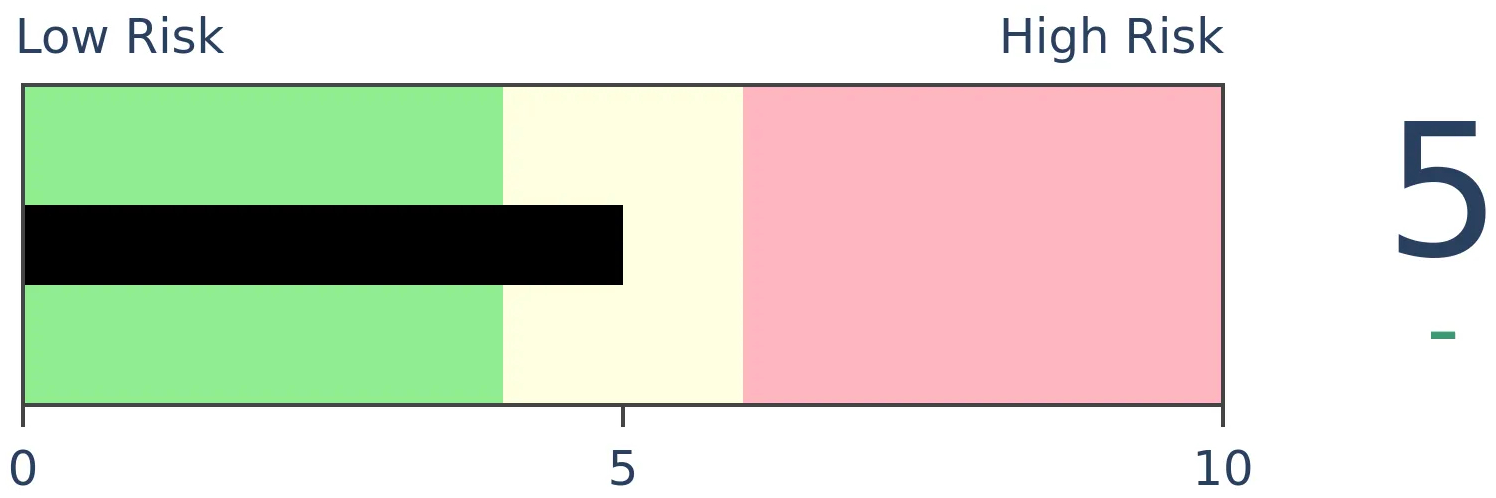
Stocks Medium-Term
|
|
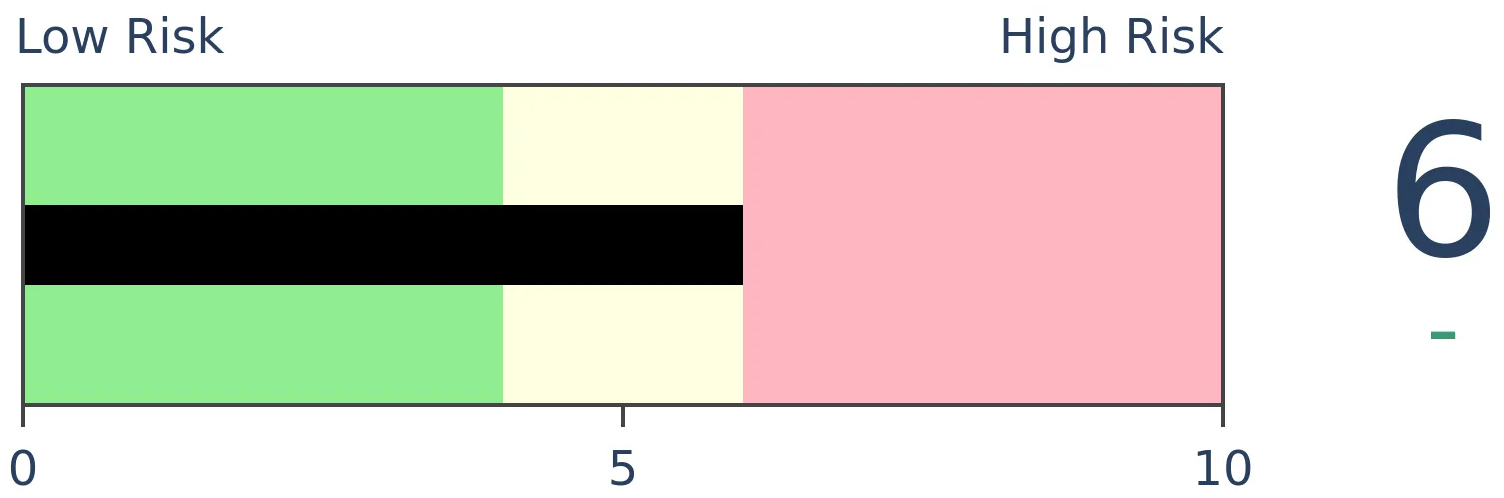
Bonds

|
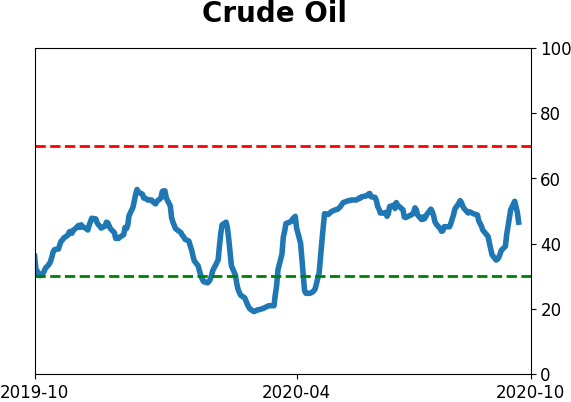
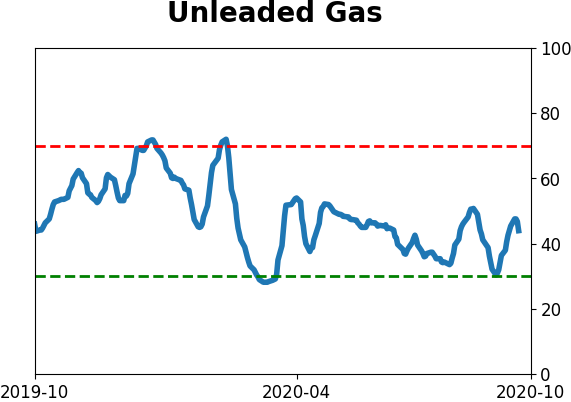
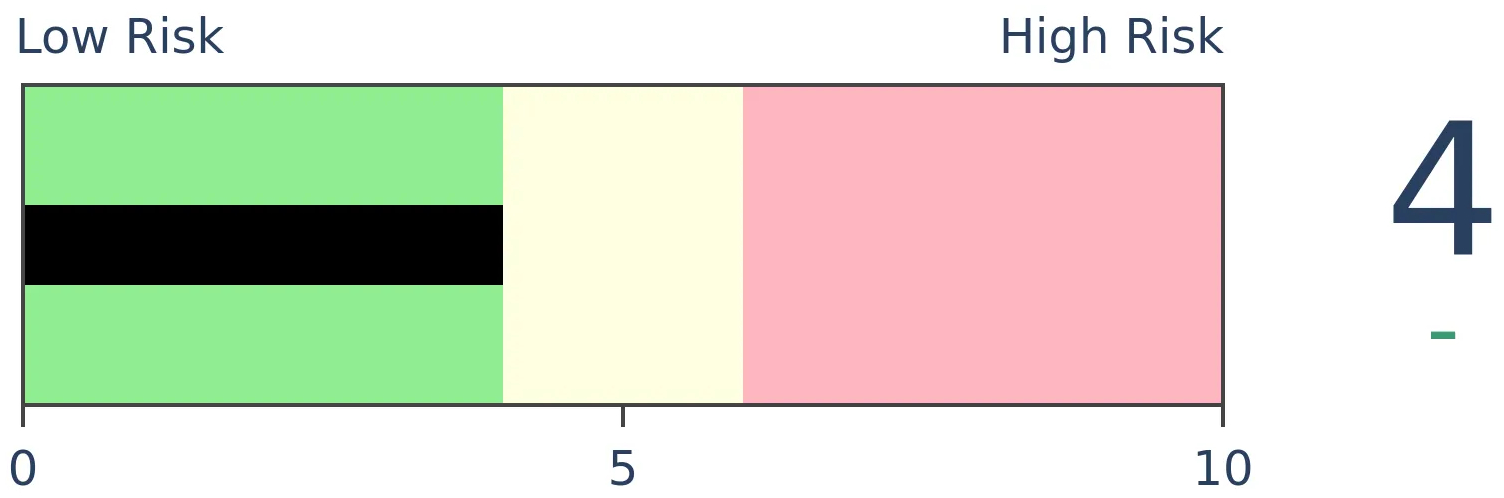
Crude Oil
|
|
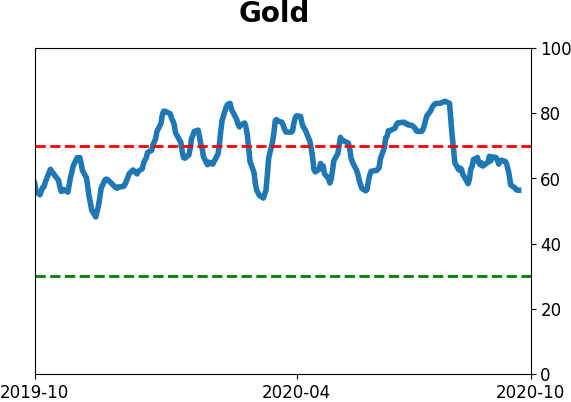
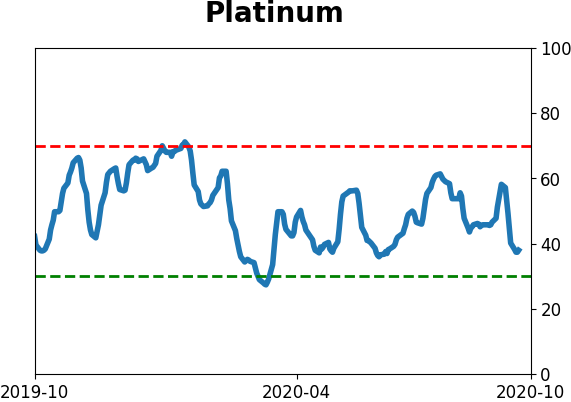
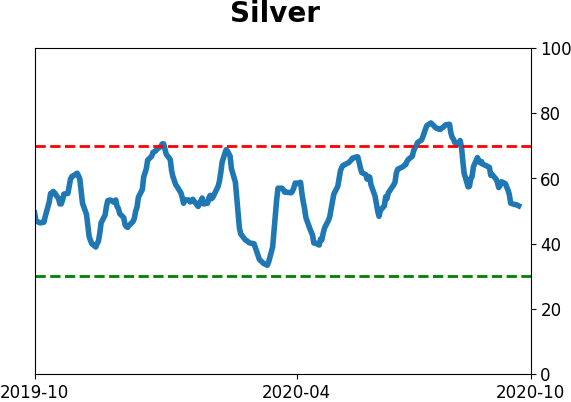
Gold
|
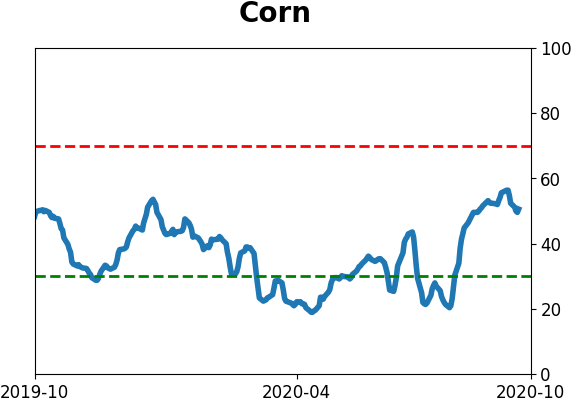
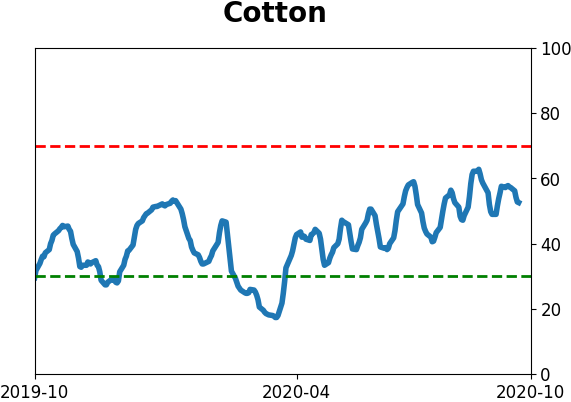
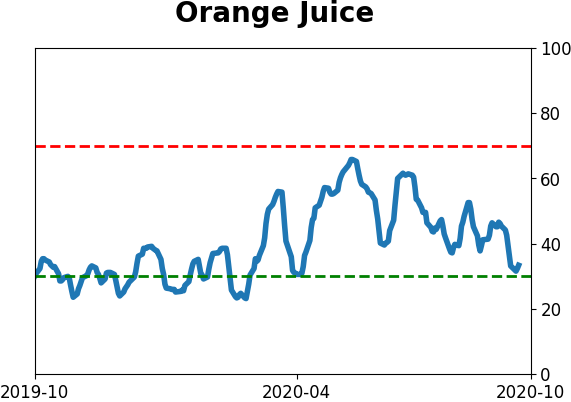
Agriculture
|
|
Research
BOTTOM LINE
In recent weeks, news articles containing the word "bubble" have soared to the highest since the year 2000. But other news sources show a near-depression level of sentiment. Those data points give a conflicting view of future returns, which has become more common lately.
FORECAST / TIMEFRAME
None
|
Investors continue to show demand for new issues, which has gotten even more extreme since the last time we looked at it a couple of weeks ago. Perhaps the unfortunate news about President Trump and uncertainty surrounding the next month will put something of a damper on this, but it's way too early to tell.
Investors have been so welcoming of risk that they're handing over money blindly in the form of SPACs. These blank-check companies have few investor protections, misaligned incentives, and have never been hotter. Now there's even an ETF to "take advantage of this new trend."
Investors were even warm enough to absorb the selling of insiders from Palantir, which according to the Wall Street Journal, has ”one of the most aggressive governance structures ever seen.” Even a known huckster was able to attract capital based on nothing but promises. This is the kind of thing that money manager Howard Marks was referring to in his book, Mastering the Market Cycle (edited for brevity):
"Wall Street never allows demand to go unmet...A generous capital market is usually associated with the following: fear of missing out on profitable opportunities reduced risk aversion and skepticism (and, accordingly, reduced due diligence) too much money chasing too few deals willingness to buy securities in increased quantity willingness to buy securities of reduced quality high asset prices, low prospective returns, high risk and skimpy risk premiums.
Risk-averse investors limit quantities issued and demand high quality. High-quality issuance leads to low default rates. Low default rates cause investors to become complacent and risk-tolerant. Risk tolerance opens investors to increased issuance and lower quality."
Wall Street fears a bubble
One of the silliest tropes when it comes to markets is that we can't be in a bubble if everyone thinks we're in a bubble. That's garbage. Most of the time, the idea that markets are bubbly is foremost in investors' minds. They just think that they will be able to sell to a greater fool.
Currently, there has been a lot of talk about bubbles; ergo we're not in one. This is one of those places where investors try to get cute about being contrarian, and it's easily disproven.
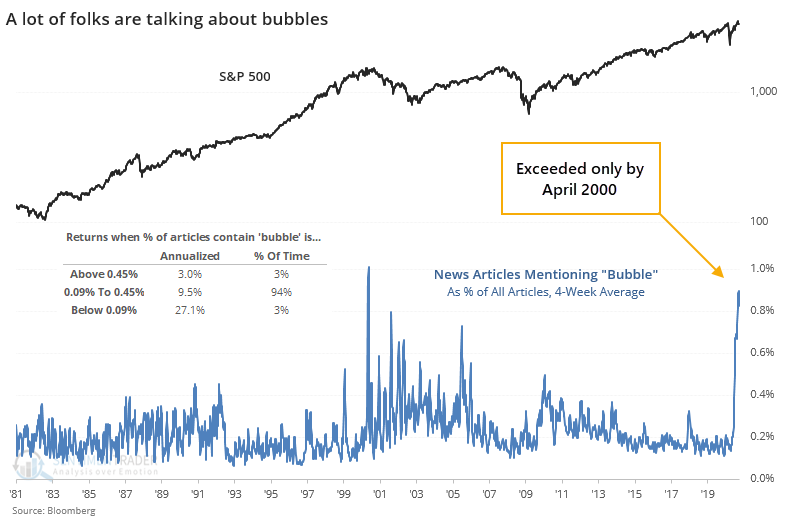
Over the past 4 weeks, articles mentioning "bubble" have averaged about 0.9% of stories in the Bloomberg database of sources. The only time this was higher was April 2000. Clearly, investors were cognizant of the likelihood we were in a bubble at the time, and yet that didn't prevent it.
When the 4-week average of these articles was more than 0.45% of the total, the S&P 500 returned an annualized +3.0%, but when there were relatively few "bubble" articles, that return jumped to +27.1%. The more that investors thought that they were in a bubble, the worse that forward returns were. Knee-jerk contrarianism would have us believe the opposite.
Main Street fears a depression
While investors may be fretting about a bubble, the broader populace has a different focus. Peter Atwater popularised the term "K-shaped recovery" and it has proven apt in many respects. Wall Street and its ilk have soared while pretty much everyone else has suffered.
We can see this split in the news, too. Wall Street-focused articles might be fairly obsessed with the idea of a bubble, but most other sources have been near depression. The Daily News Sentiment Index put out by the Federal Reserve is only now showing a bit of improvement.
As they note (edited for brevity):
"The Daily News Sentiment Index is a high-frequency measure of economic sentiment based on lexical analysis of economics-related news articles. The newspapers cover all major regions of the country, including some with extensive national coverage such as the New York Times and the Washington Post. SSW selected articles with at least 200 words where LexisNexis identified the article’s topic as “economics” and the country subject as “United States.”
SSW aggregate the individual article scores into a daily time-series measure of news sentiment, relying on a statistical adjustment that accounts for changes over time in the composition of the sample across newspapers. The Daily News Sentiment Index is constructed as a trailing weighted-average of time series, with weights that decline geometrically with the length of time since article publication.
The 100-day average of this index has finally started to curl up from a near-record low.
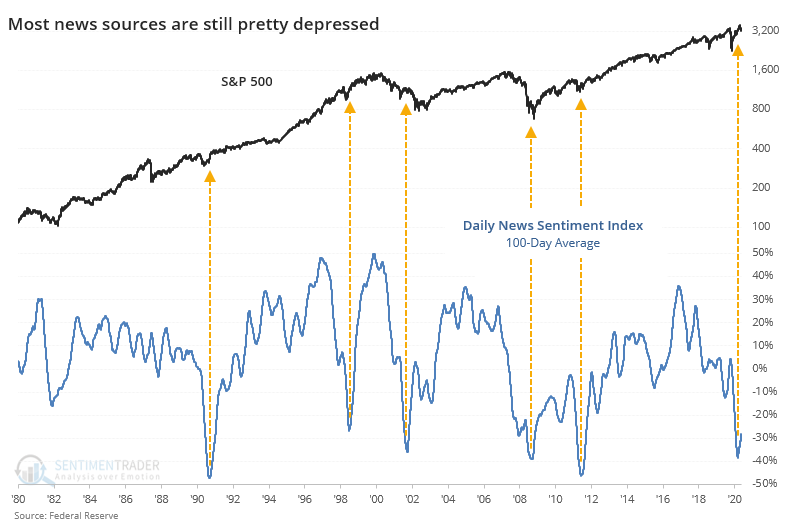
As is obvious from the chart, this has typically occurred after protracted declines in the economy and stocks.
So, which is it? Should we be positive because overall news sentiment is turning up from depressed levels, or negative because investors seem to be rightly concerned about bubbly markets?
I don't know.
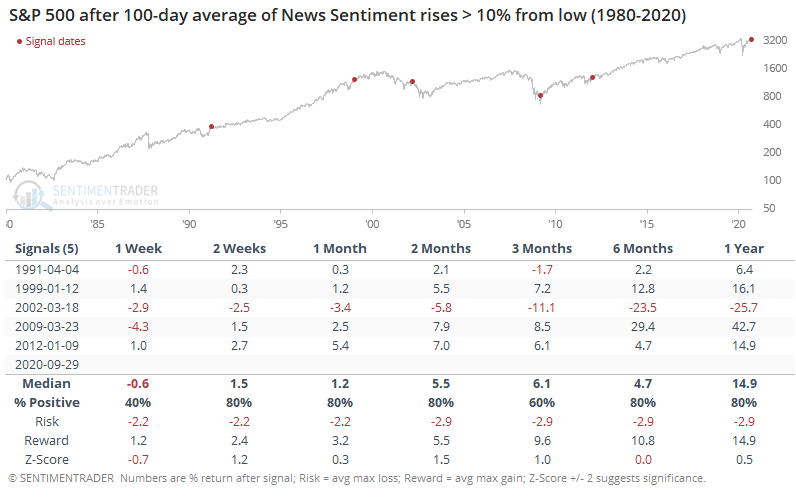
Both are compelling and from a signal-based perspective, the News Sentiment indicator has a more consistent track record. But the bottom line is that they conflict, which is something we're seeing consistently right now. Options traders are gorging on speculative trades, yet futures speculators are heavily short the major indexes. Allocations to stocks are near record highs, yet fund flows are near record lows. There have been bouts of breadth thrusts, yet longer-term momentum is waning.
It's all a muddled mess, which adds up to a poor edge, where risk and reward can't be estimated with any degree of confidence. There tend to be several times each year when most everything lines up in one direction or the other. This is not one of those times.
Active Studies
| Time Frame | Bullish | Bearish | | Short-Term | 0 | 0 | | Medium-Term | 1 | 8 | | Long-Term | 47 | 2 |
|
Indicators at Extremes
Portfolio
| Position | Description | Weight % | Added / Reduced | Date | | Stocks | 15.2% RSP, 7.2% XLE | 22.4 | Added 3% | 2020-10-02 | | Bonds | 10% BND, 10% SCHP, 10% ANGL | 29.9 | Reduced 0.1% | 2020-10-02 | | Commodities | GCC | 2.4 | Reduced 2.1%
| 2020-09-04 | | Precious Metals | GDX | 4.7 | Added 5% | 2020-09-09 | | Special Situations | | 0.0 | Reduced 5% | 2020-10-02 | | Cash | | 40.6 | | |
|
Updates (Changes made today are underlined)
It's been a really mixed picture lately. In stocks, we saw huge momentum and a spike in speculation, then September managed to wring much of that out, except in the options market which is still a worry. There seem to be offsetting positives and negatives, with a mixed market environment, not the kind of setup where I feel comfortable being aggressive. I did add a bit to energy. The older I get, the less interested I am in short-term gyrations, and I don't really care about the coming days or even weeks. I'm fairly confident that the total return will be positive over a longer time frame given some of the developments we've looked in over the past week. With bonds, I decided to swap TLT for ANGL, a high-yield corporate fund with a heavy focus on energy bonds. Hedgers are heavily short 10-year Treasuries, and the high-yield market has held up well internally. A note on the allocations - it makes more sense to include sector funds with "stocks" instead of "special situations" so that's where the jump in exposure comes from - moving XLE from one category to the other.
RETURN YTD: -1.6% 2019: 12.6%, 2018: 0.6%, 2017: 3.8%, 2016: 17.1%, 2015: 9.2%, 2014: 14.5%, 2013: 2.2%, 2012: 10.8%, 2011: 16.5%, 2010: 15.3%, 2009: 23.9%, 2008: 16.2%, 2007: 7.8%
|
|
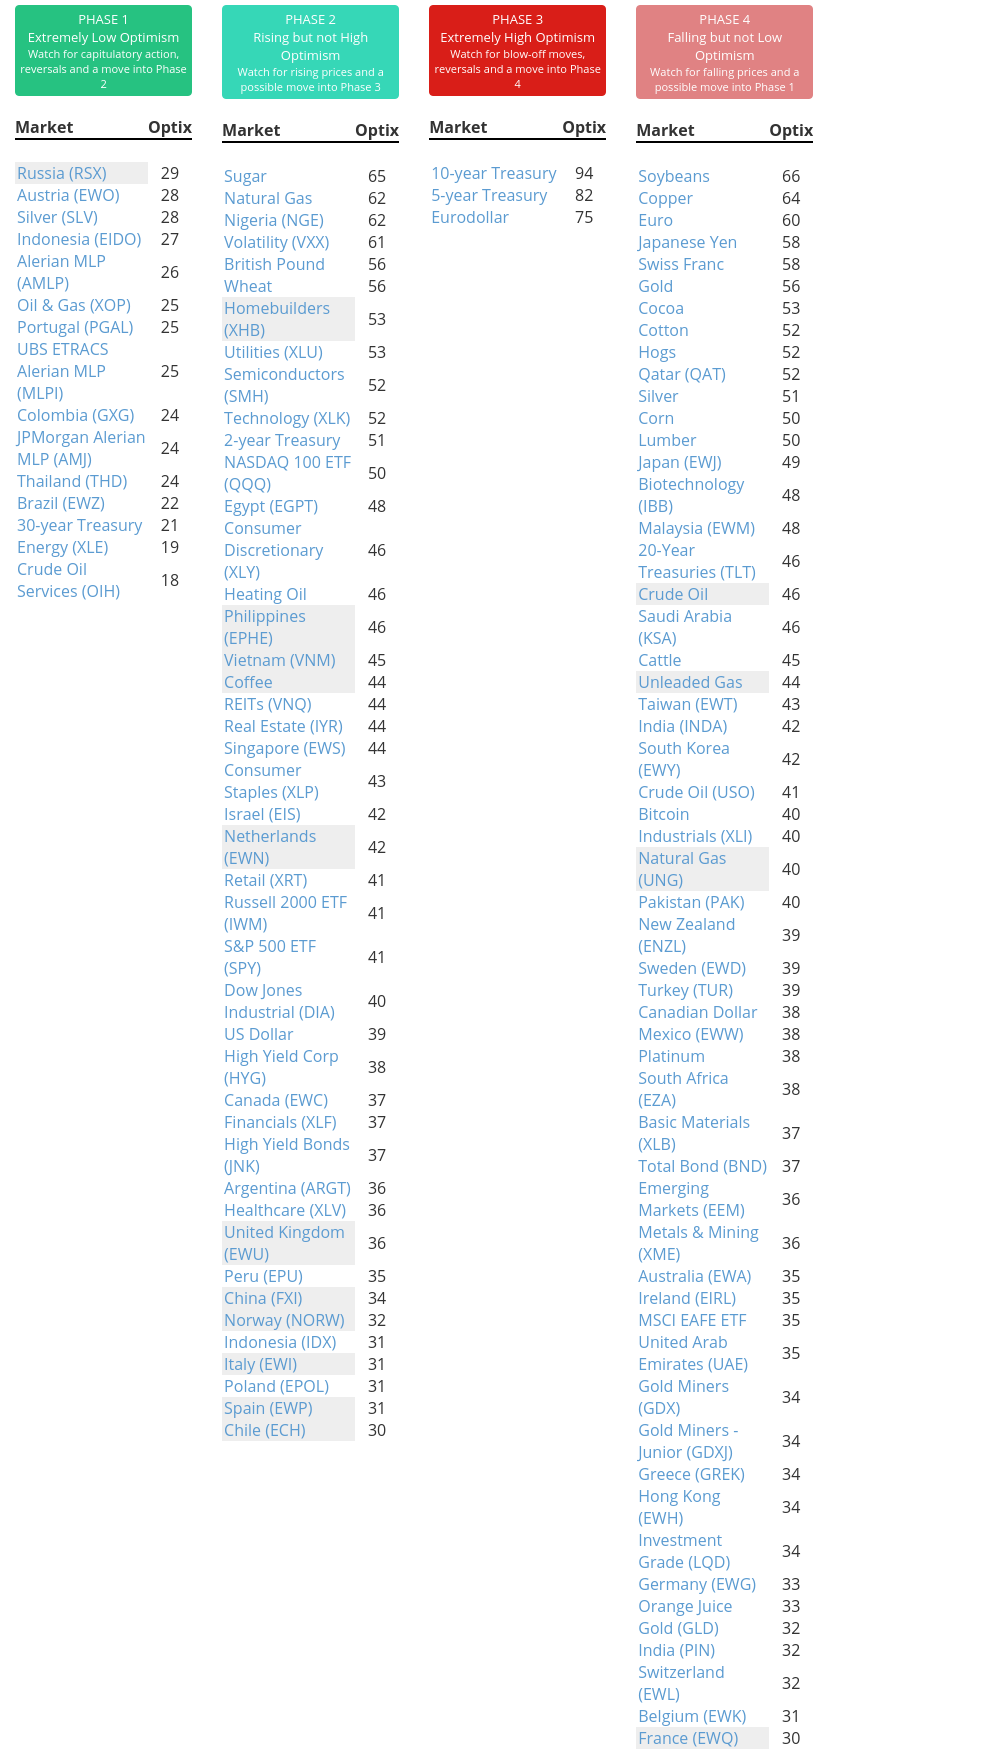
Phase Table
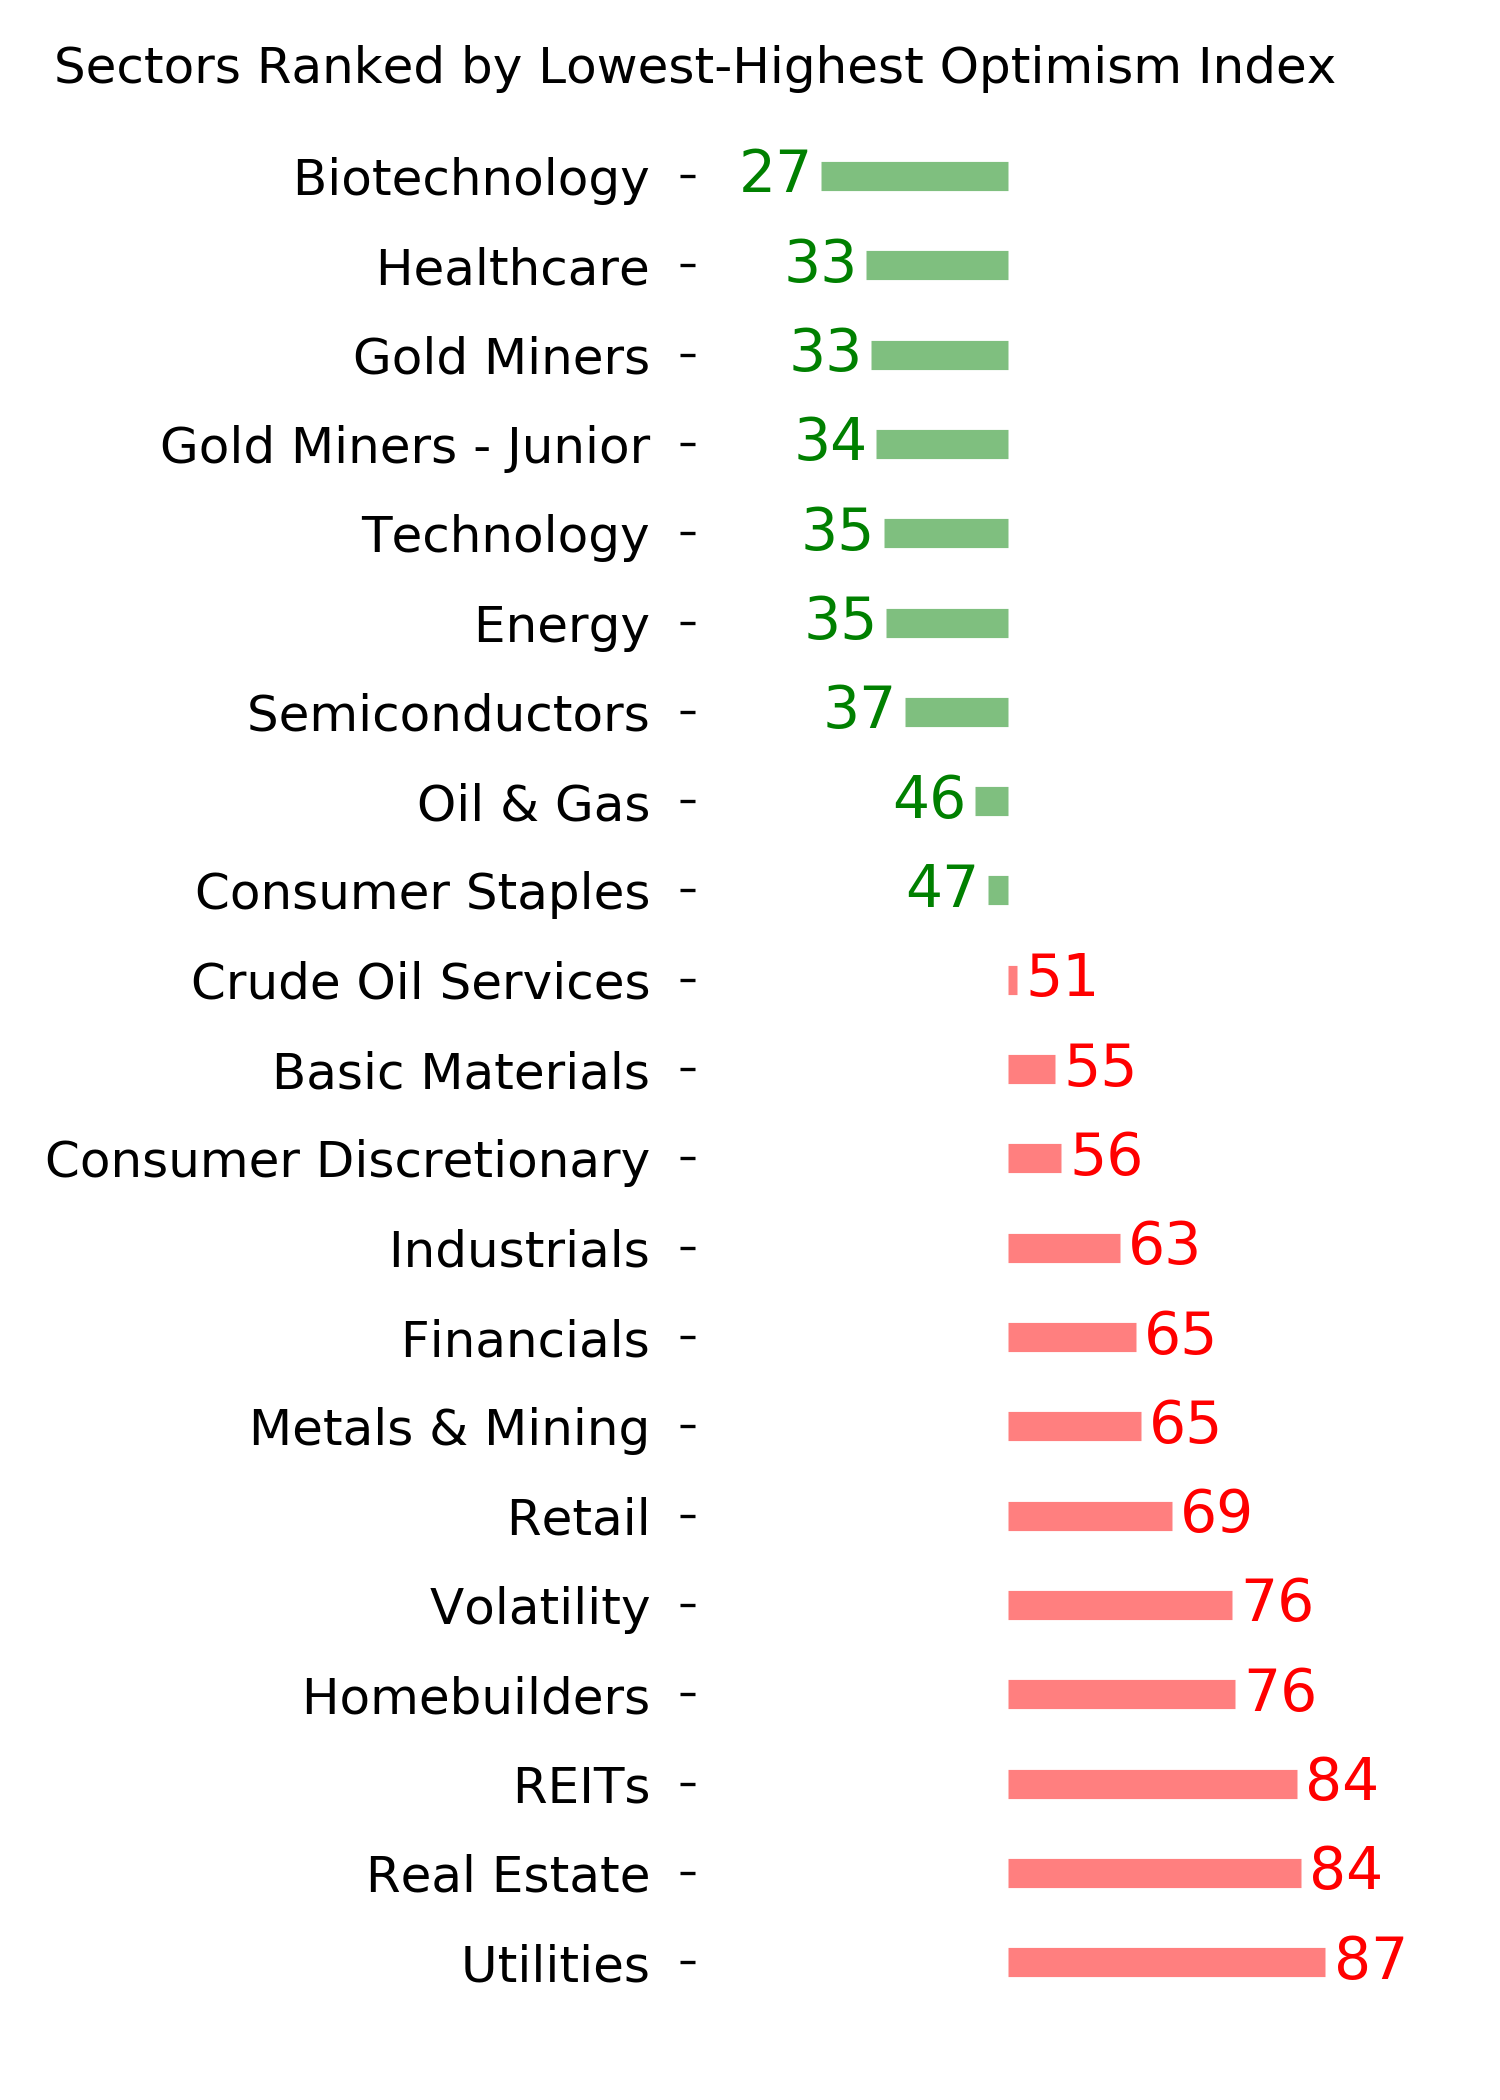
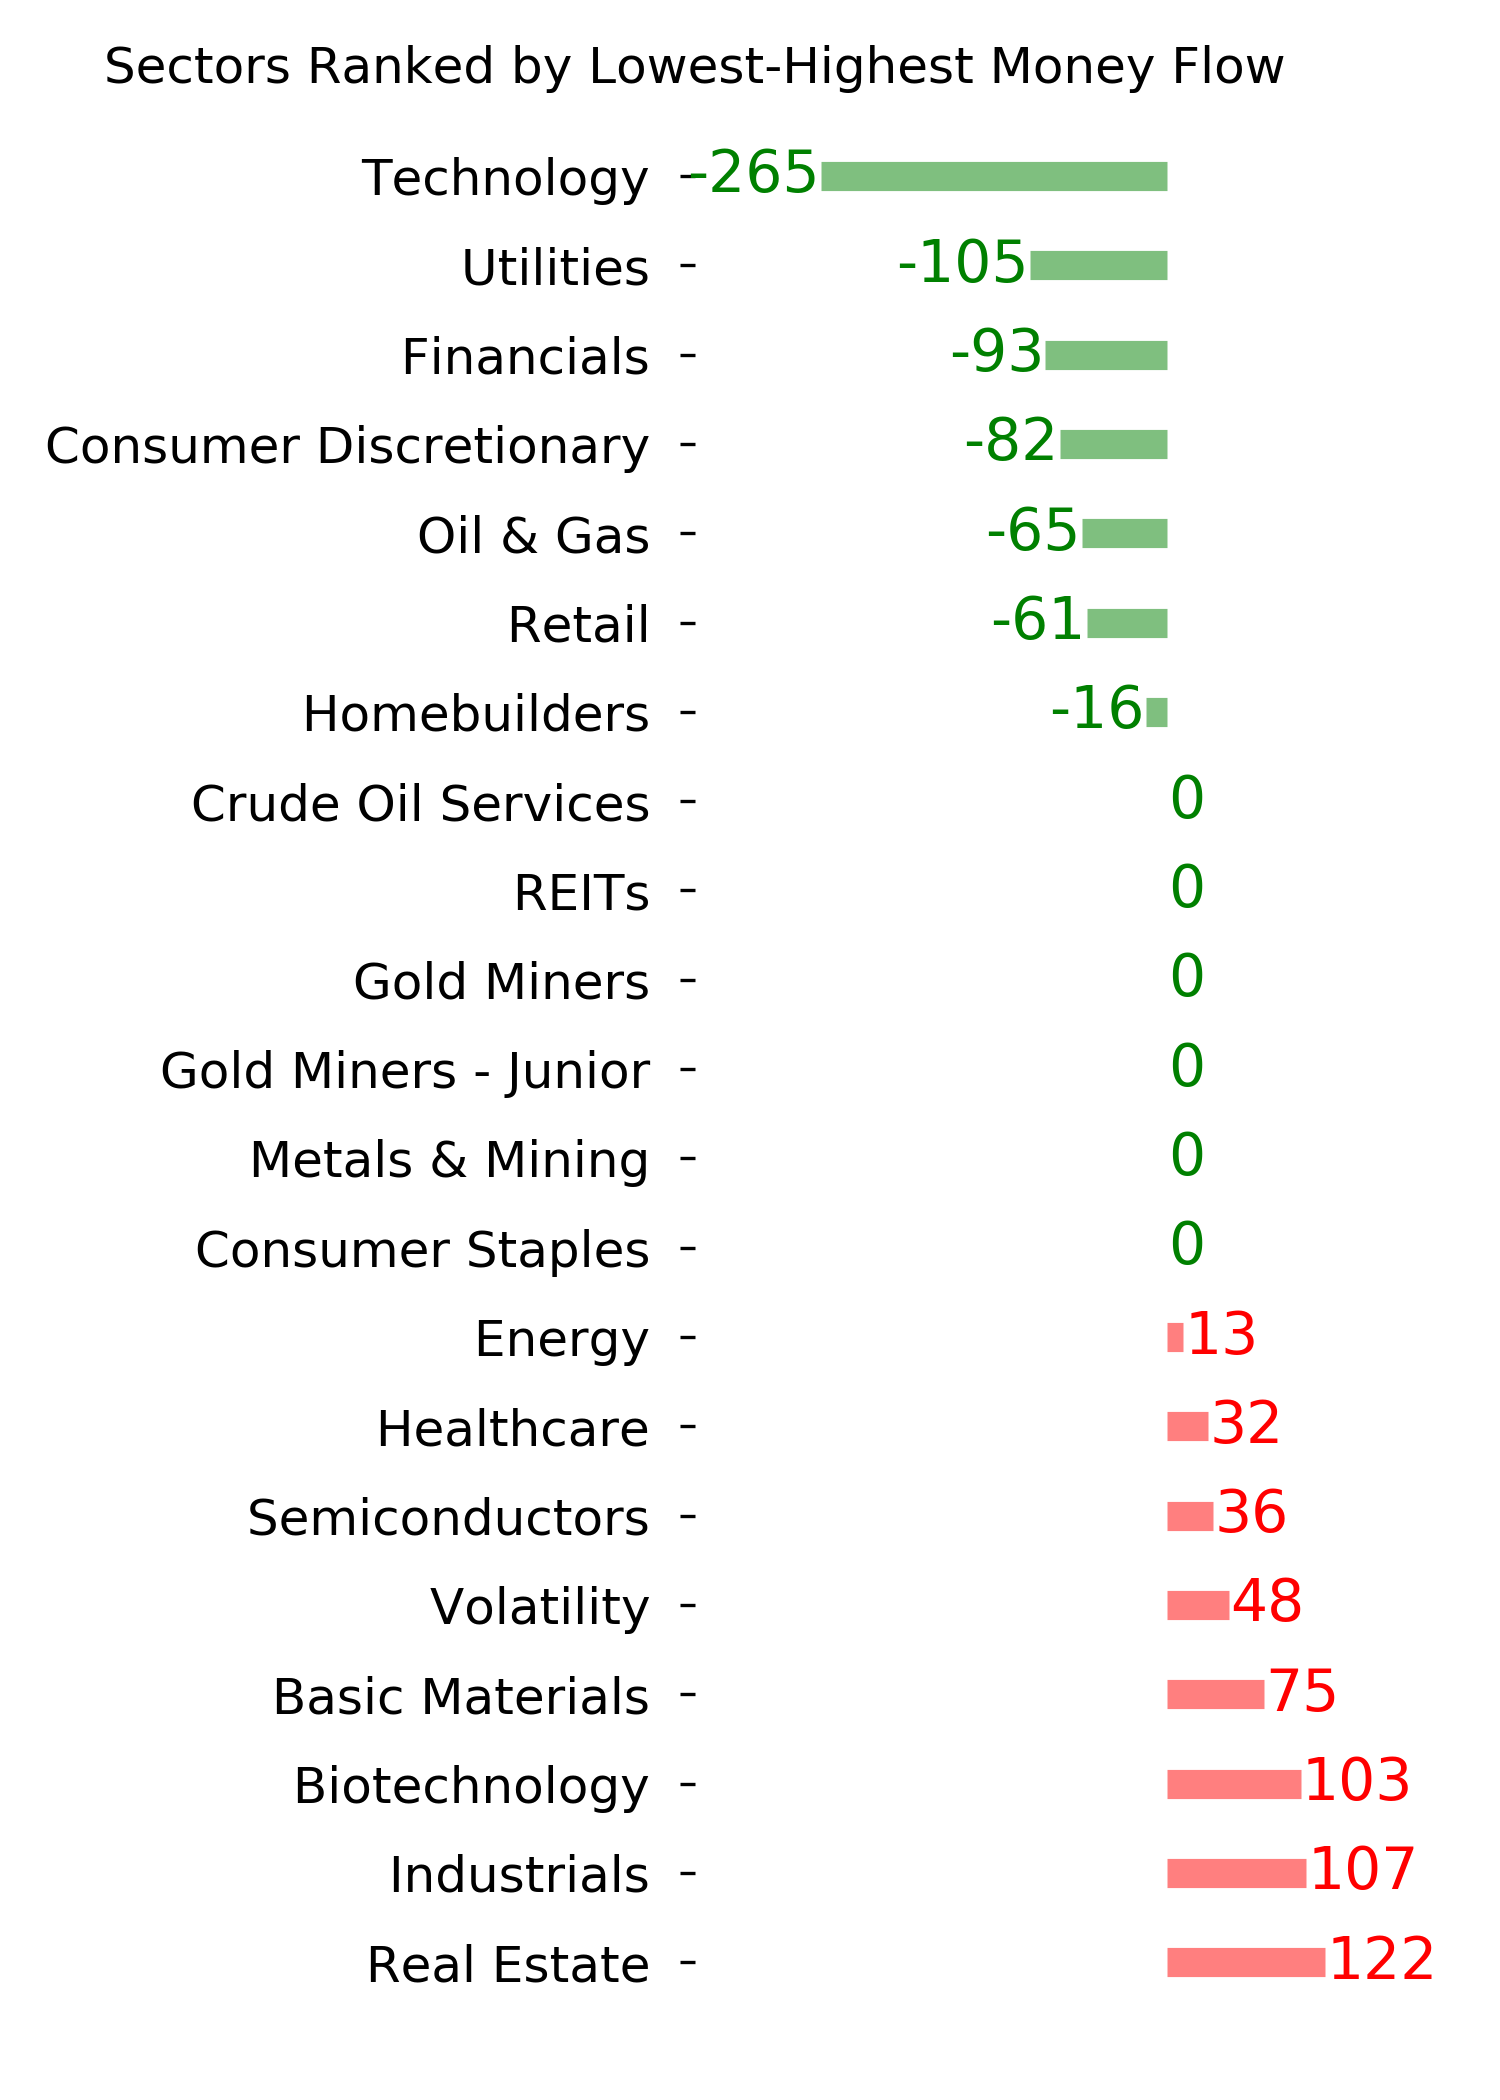
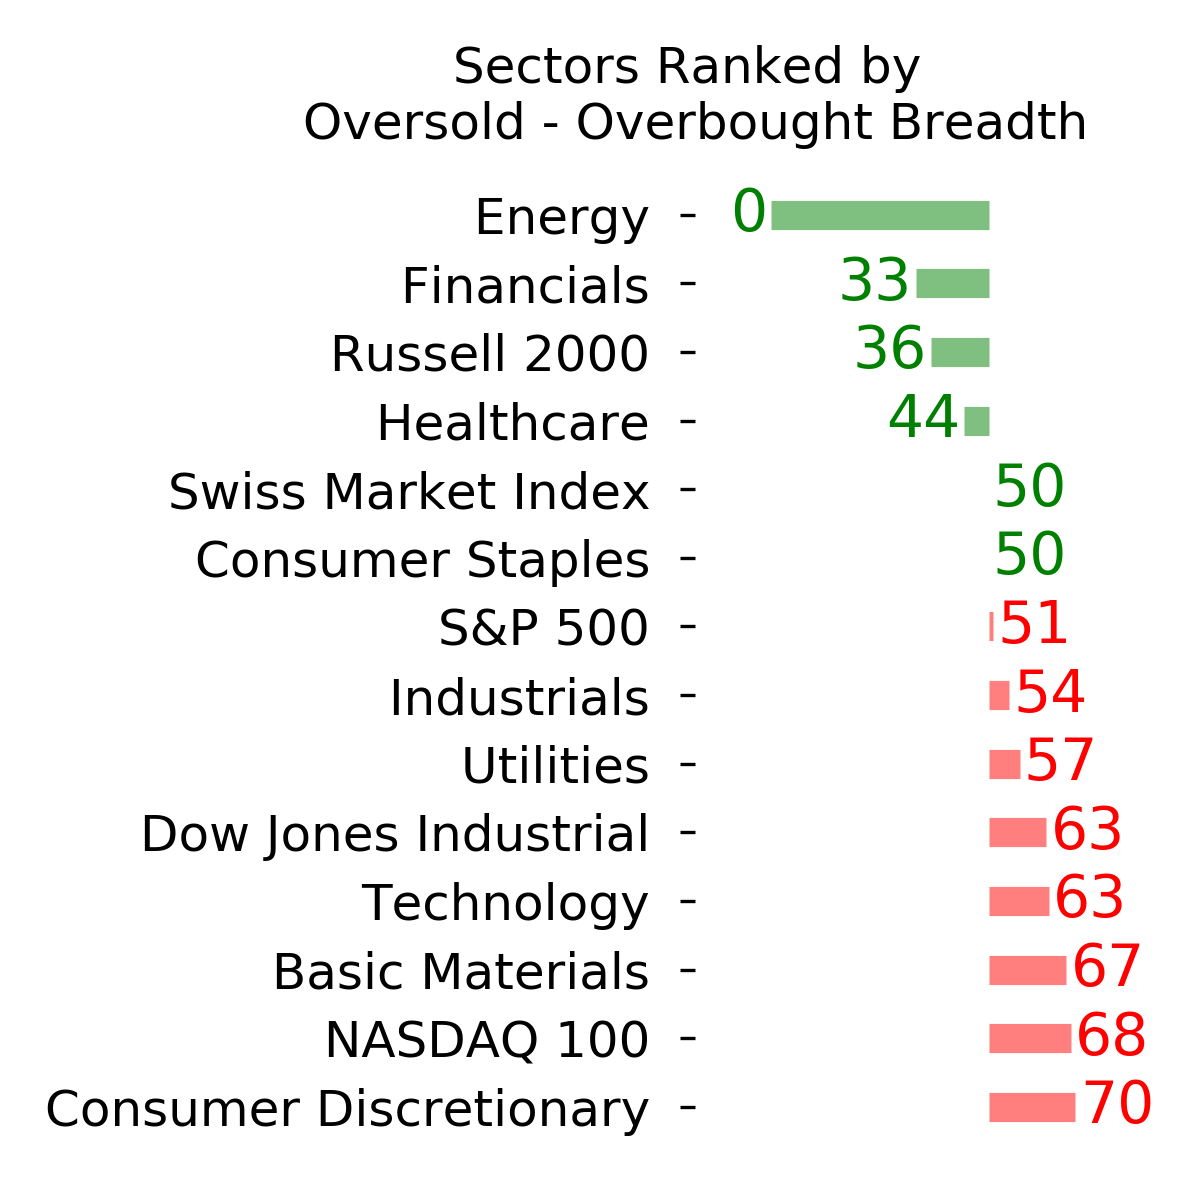
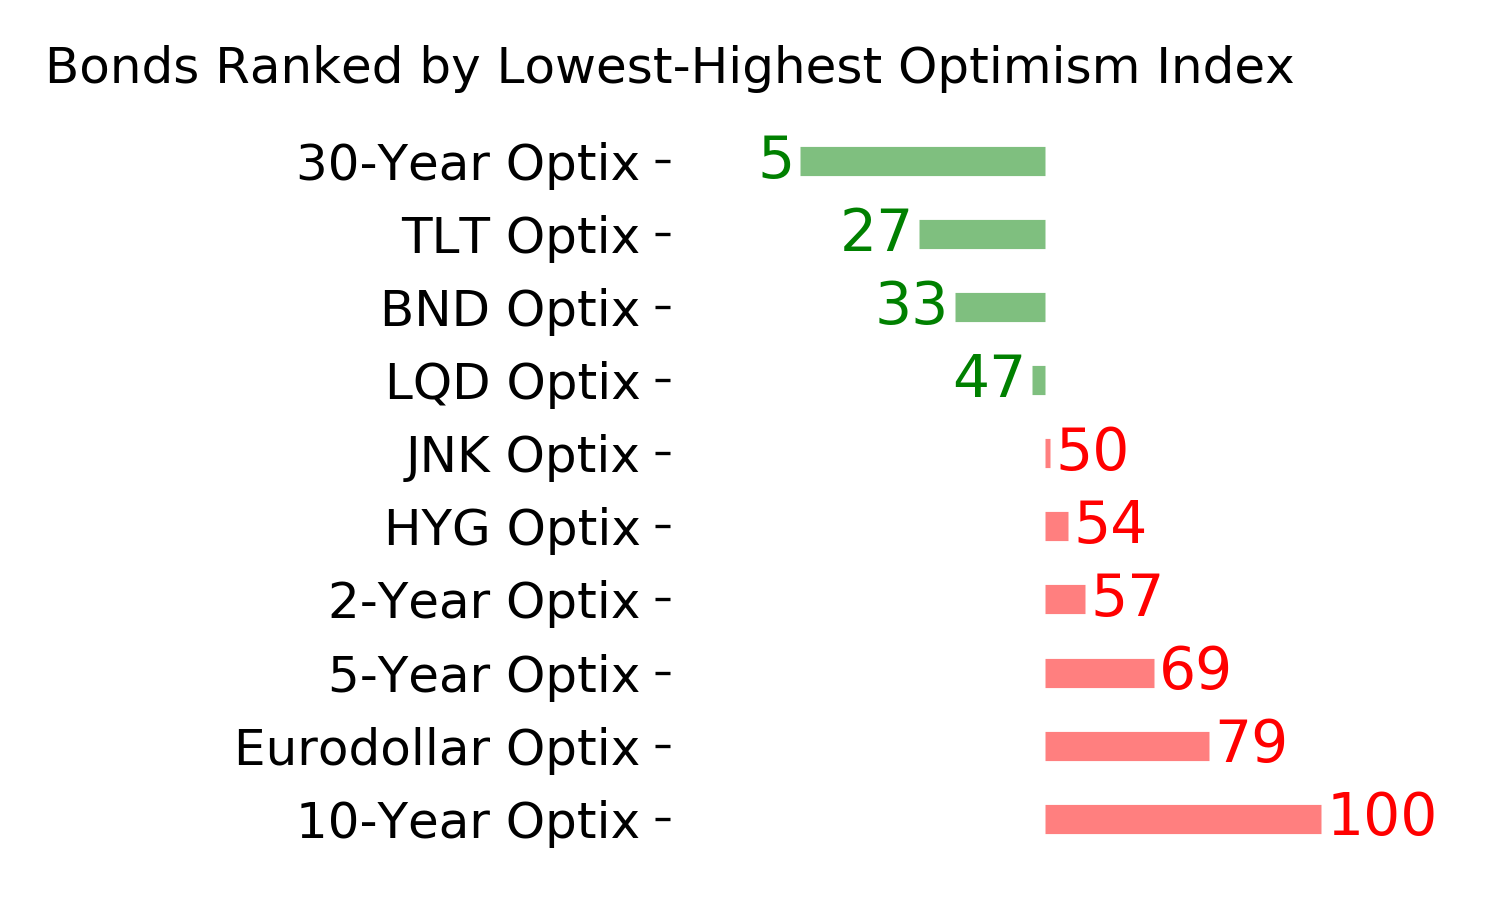
Ranks
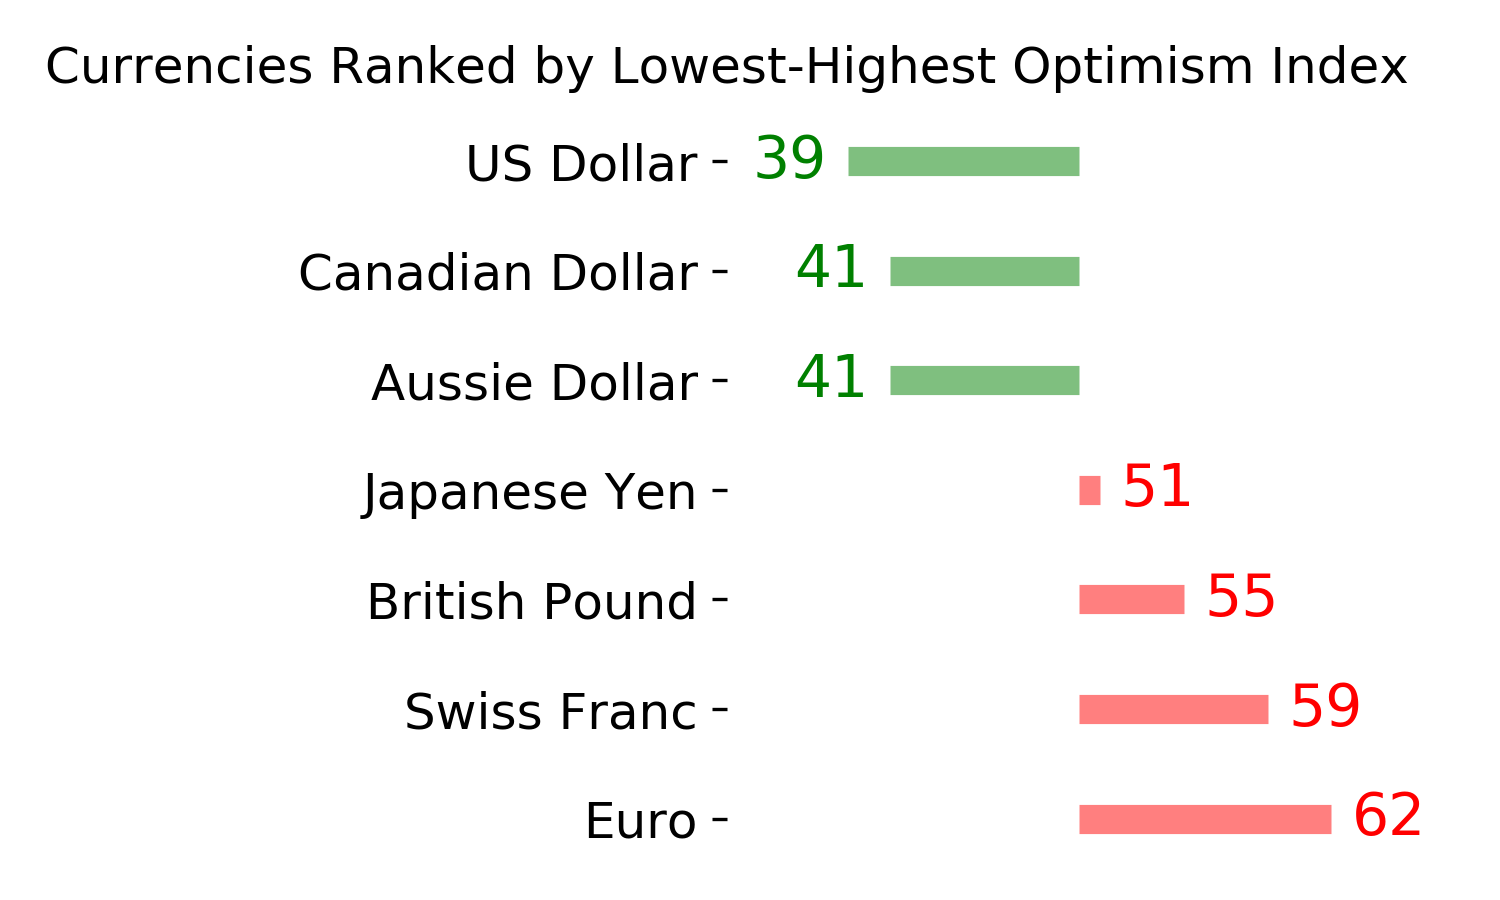
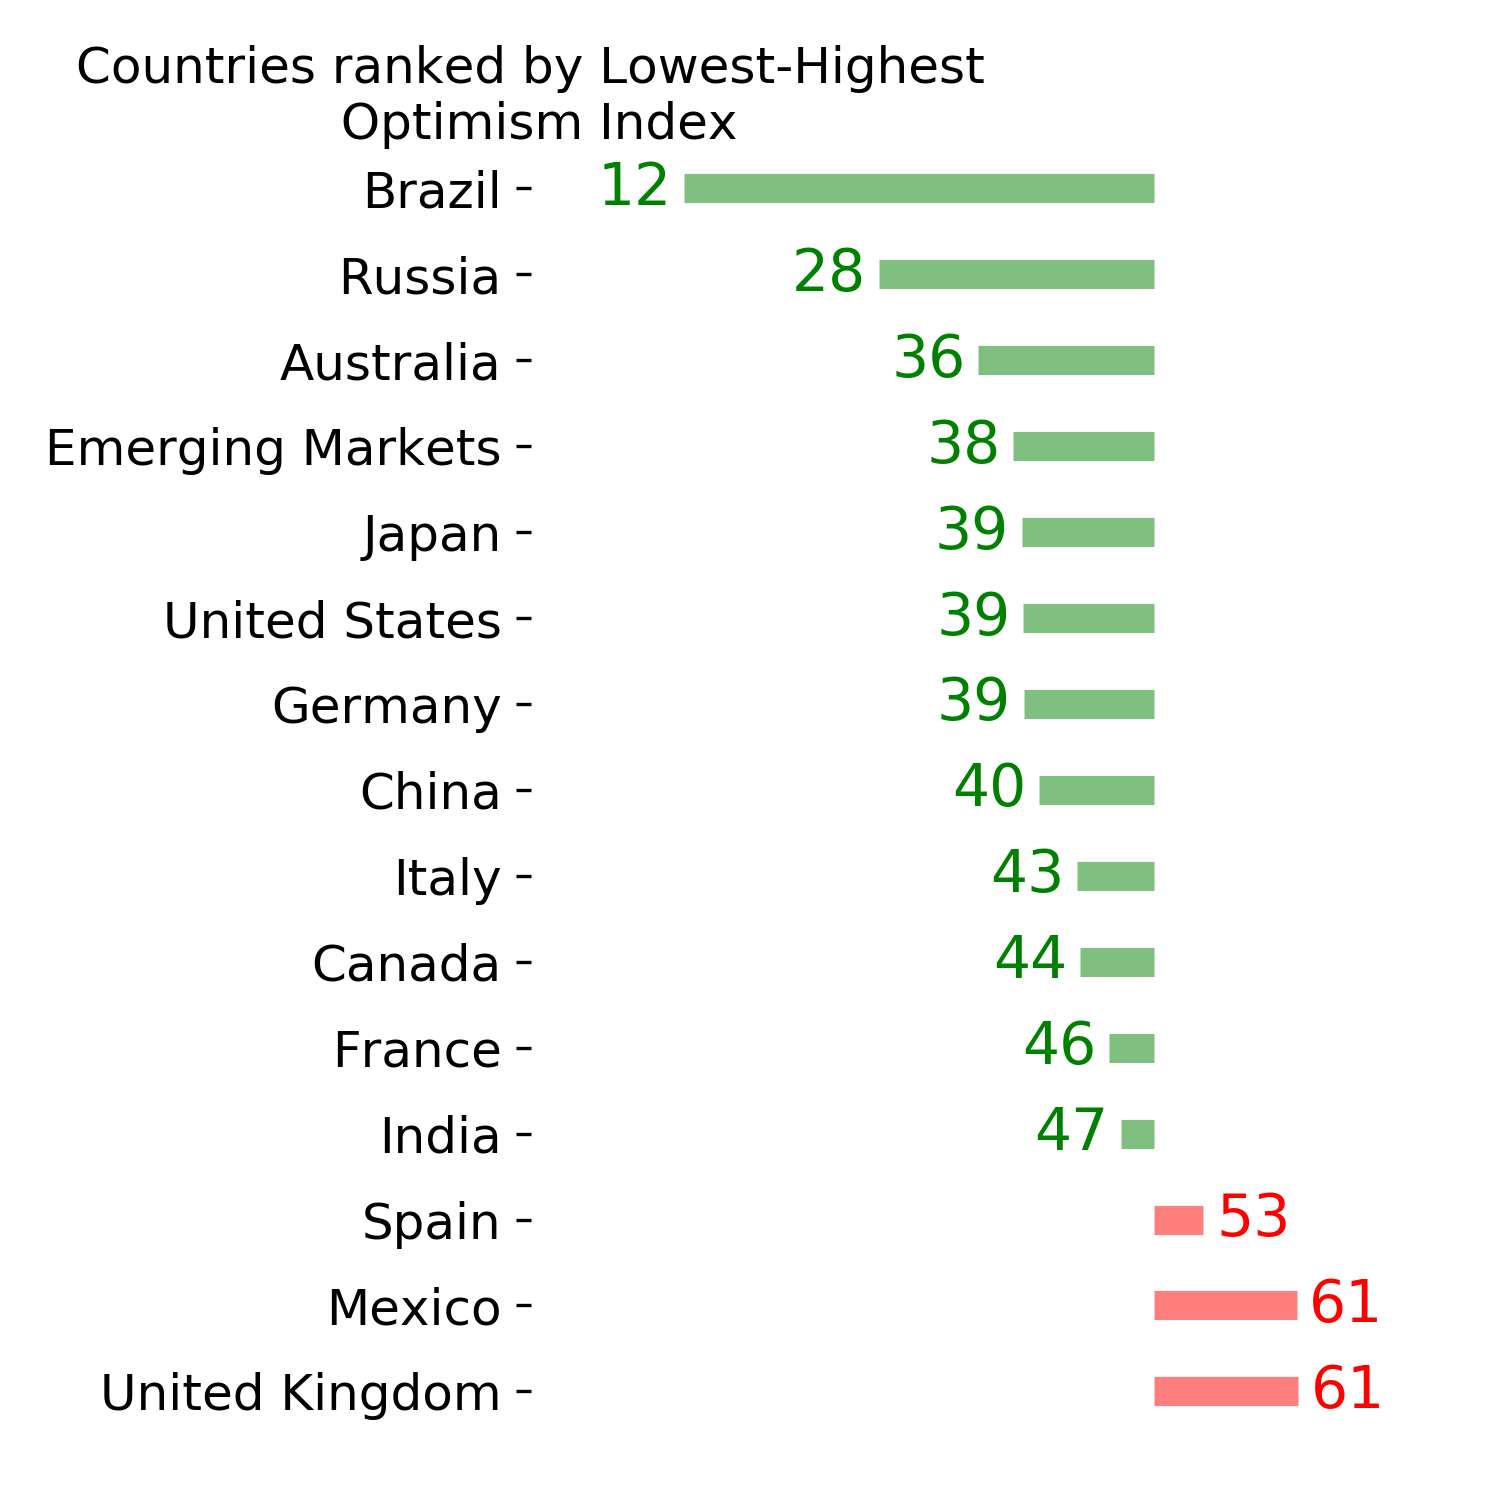
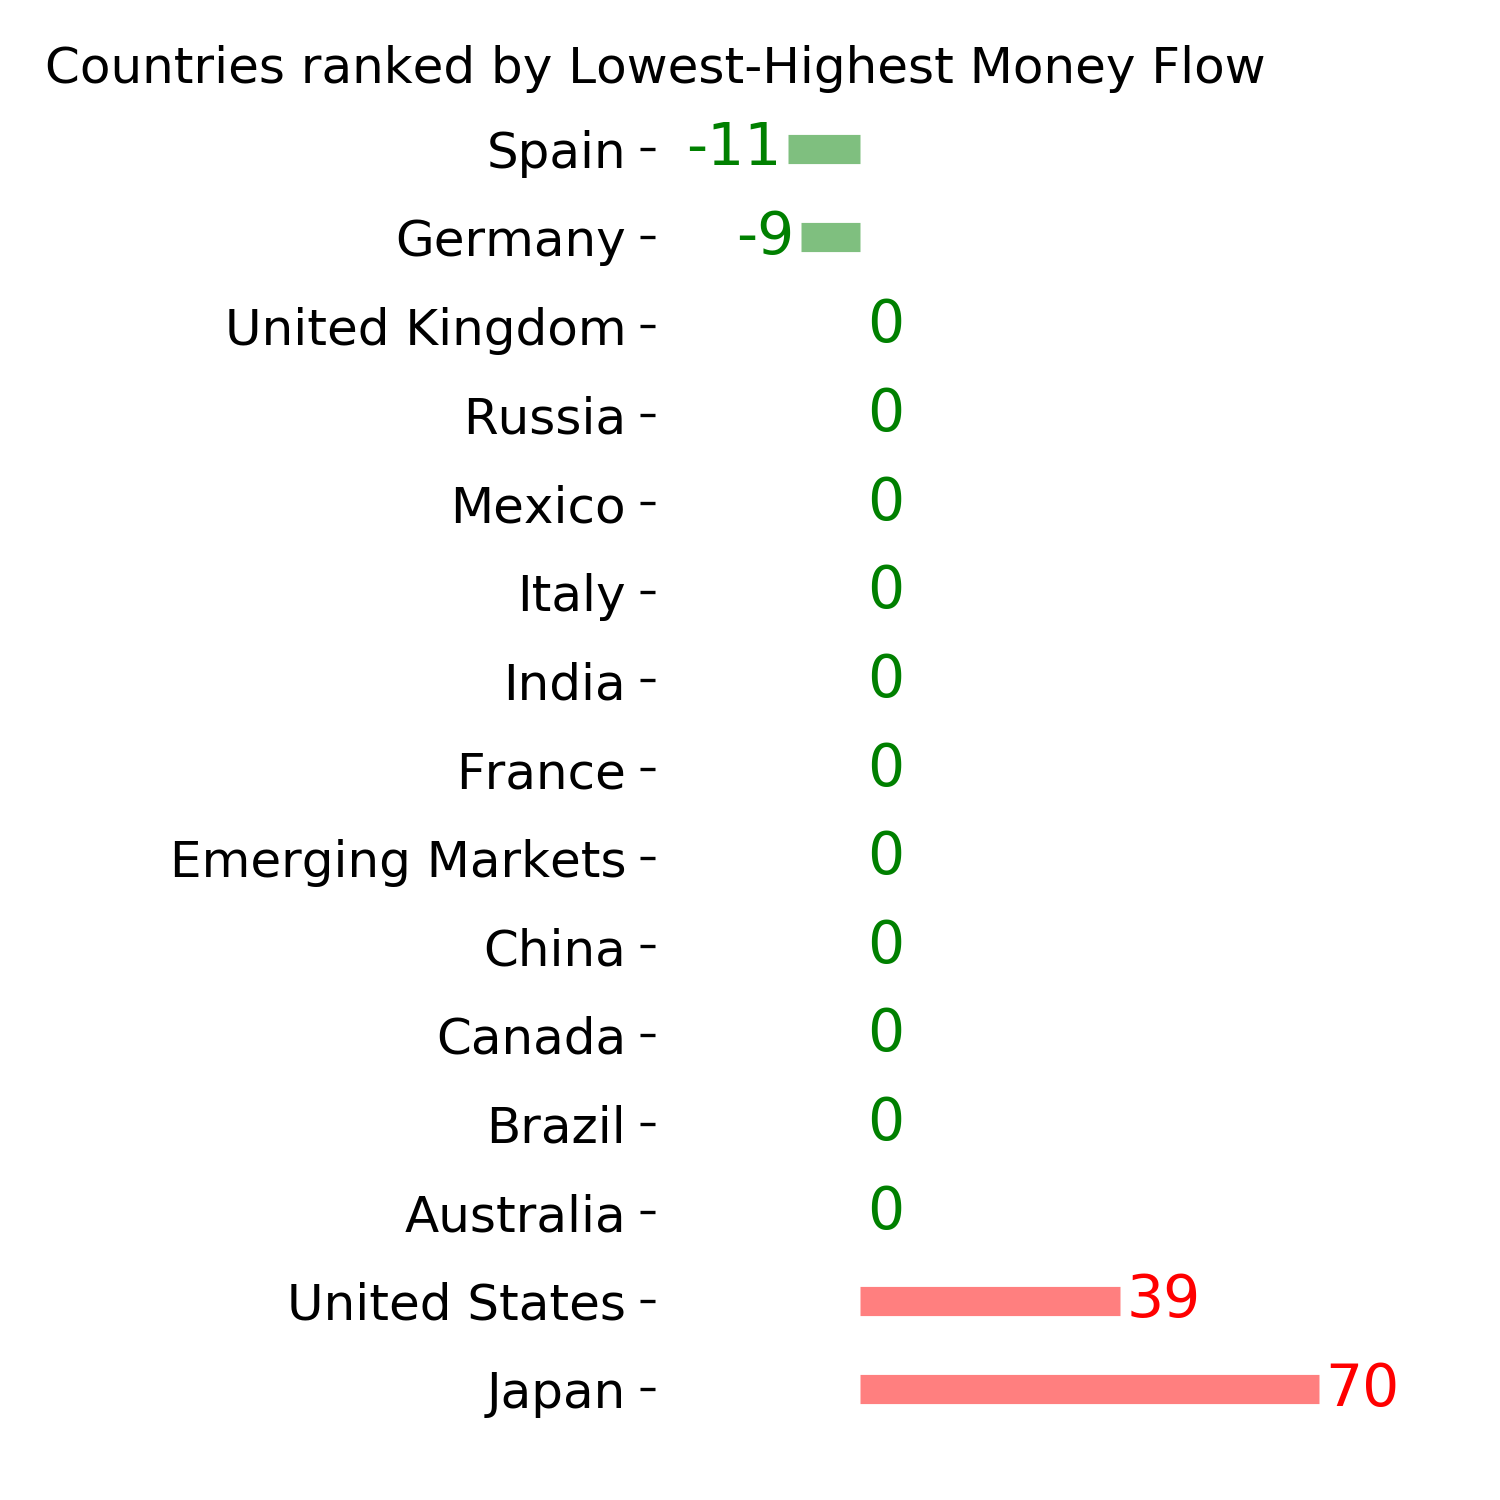
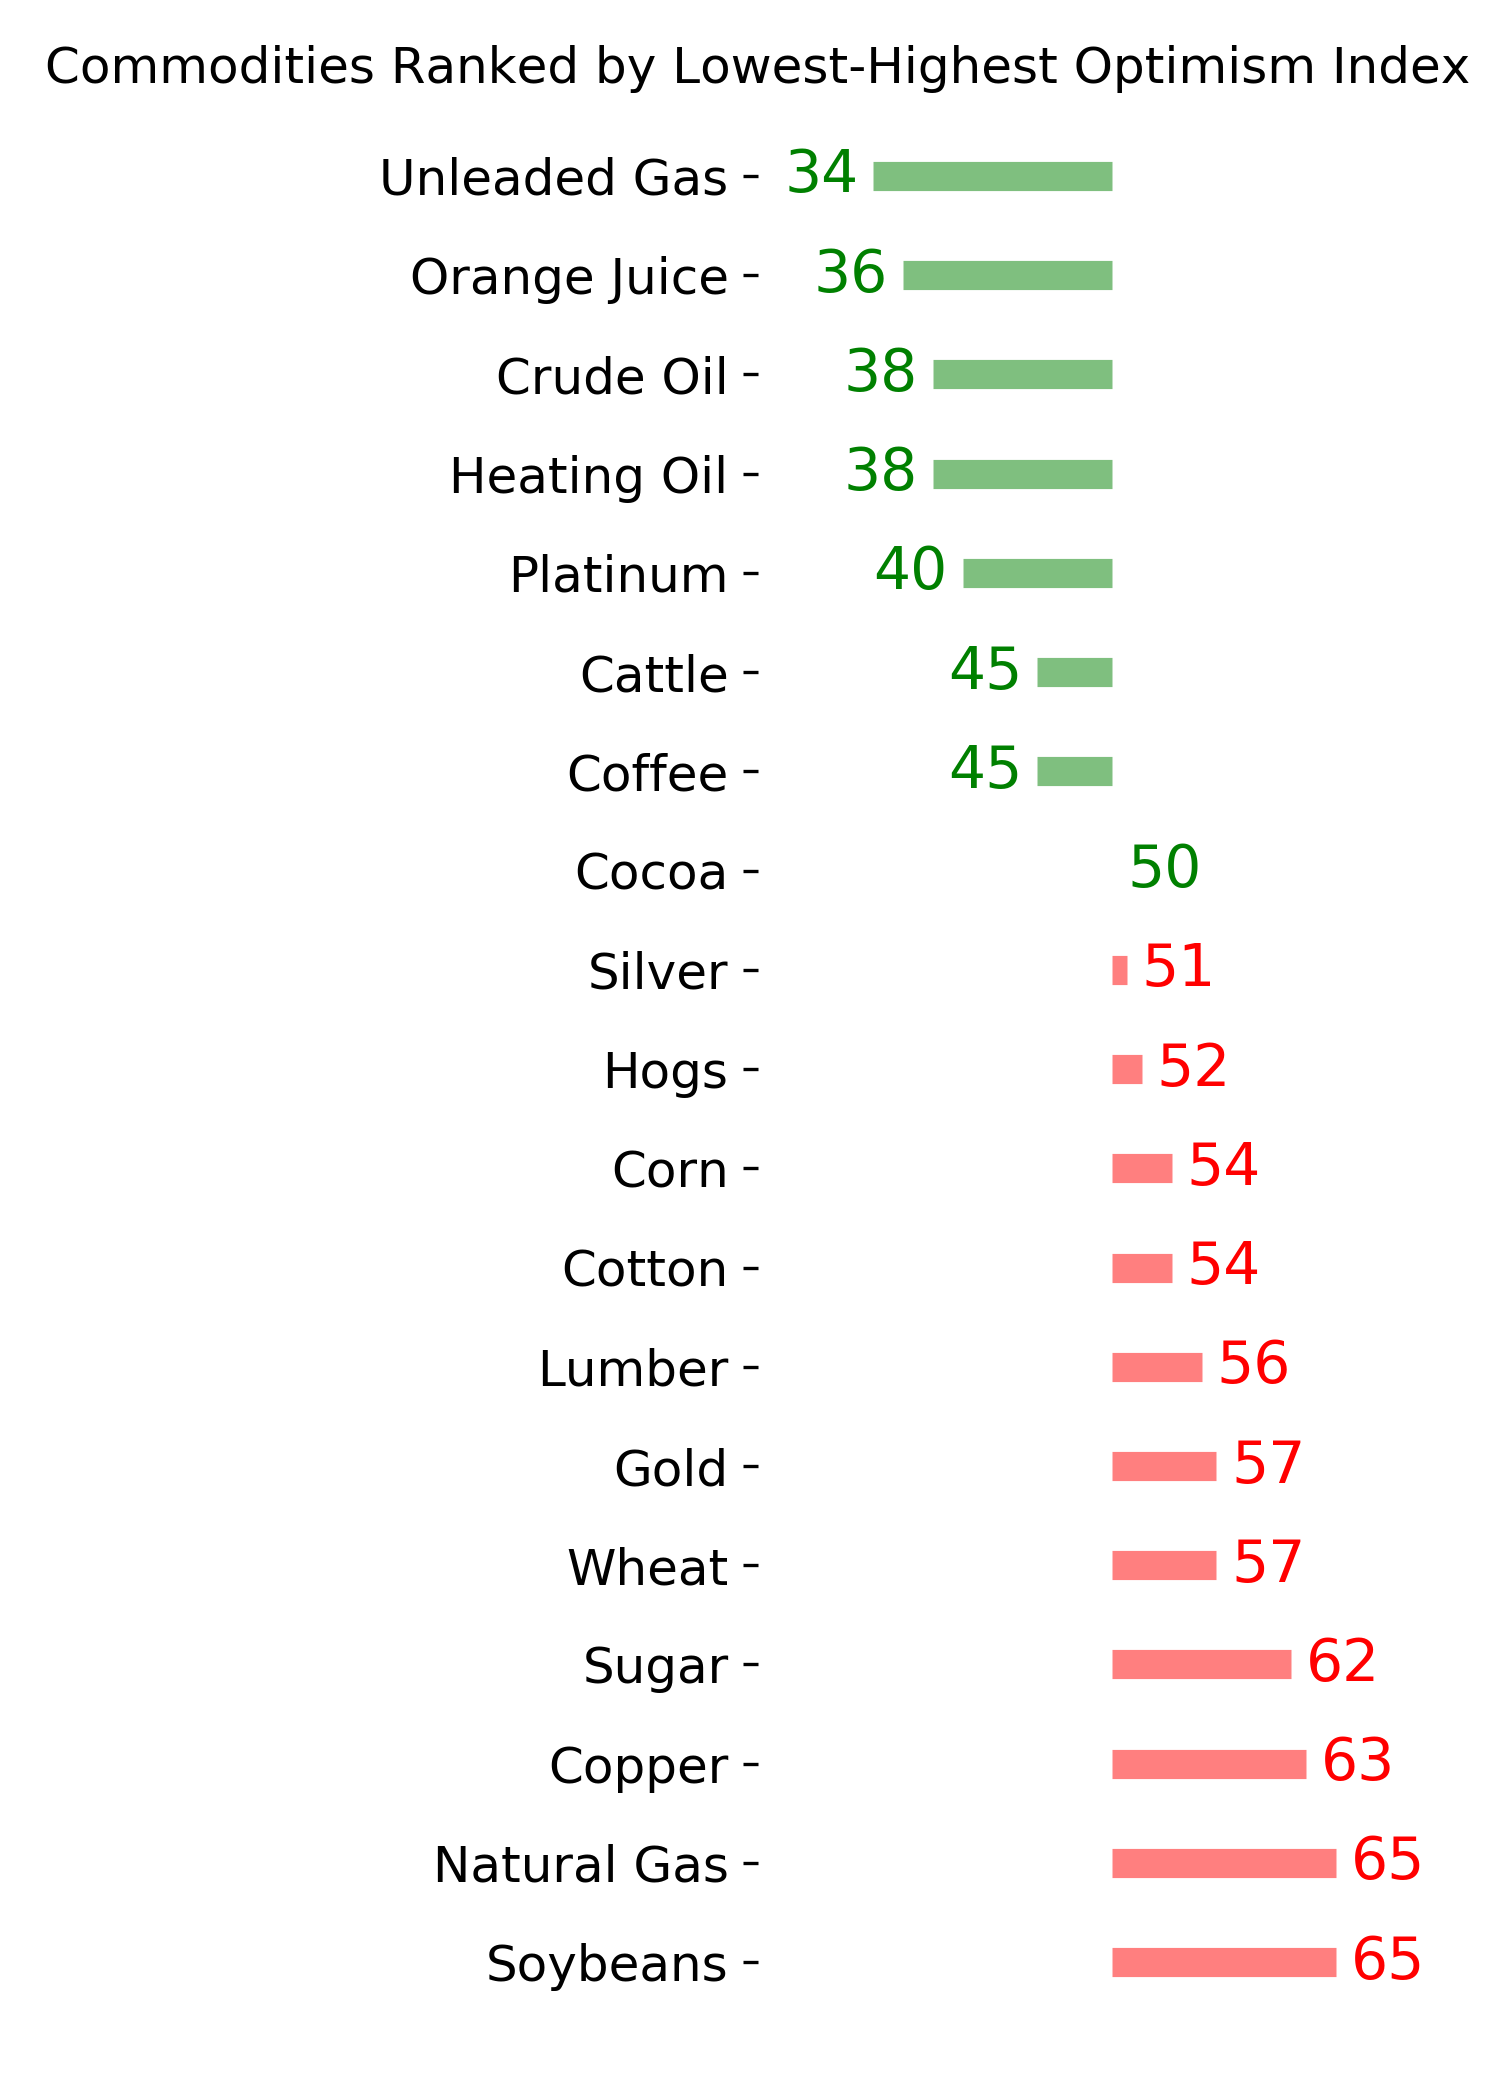
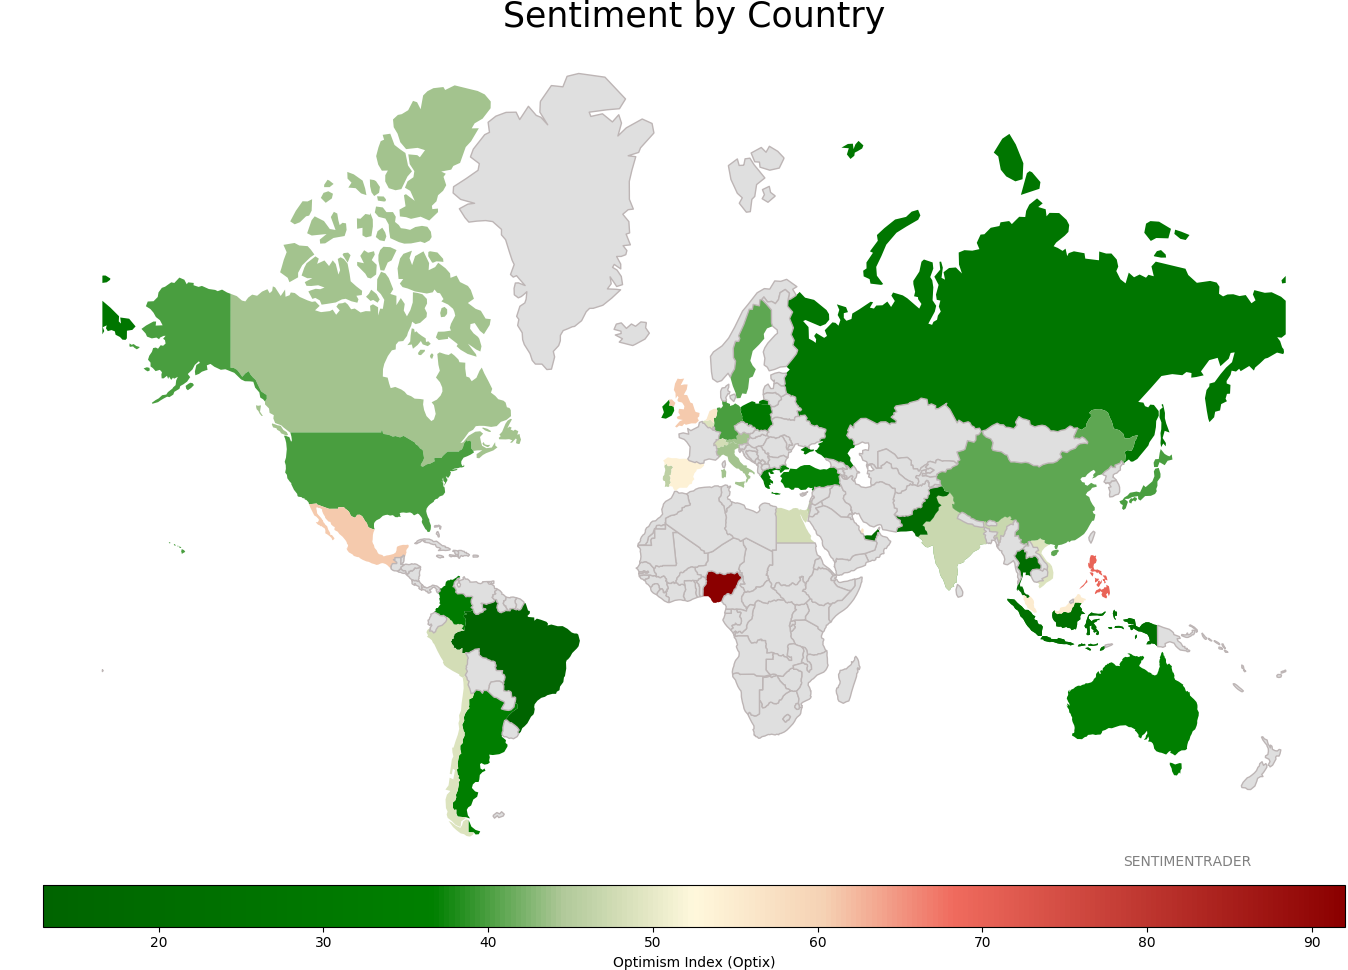
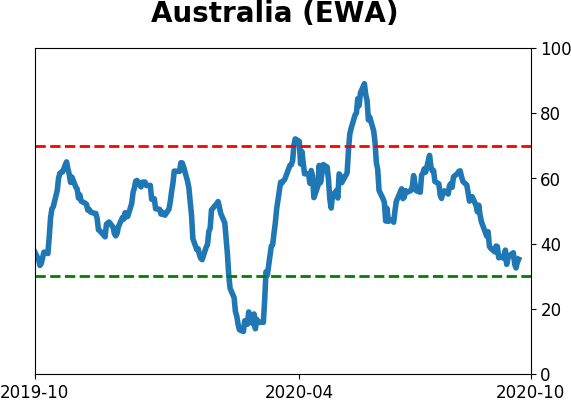
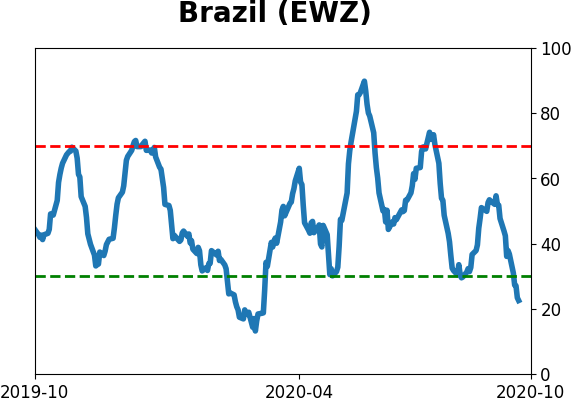
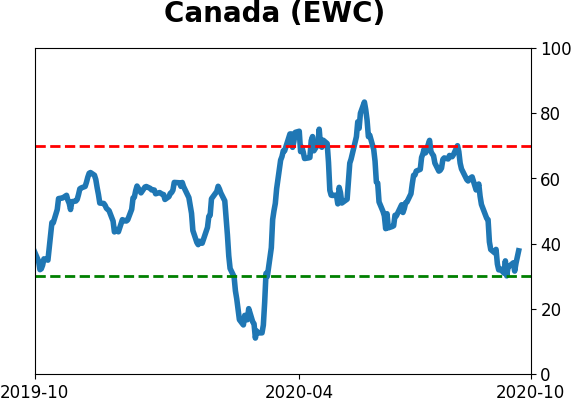
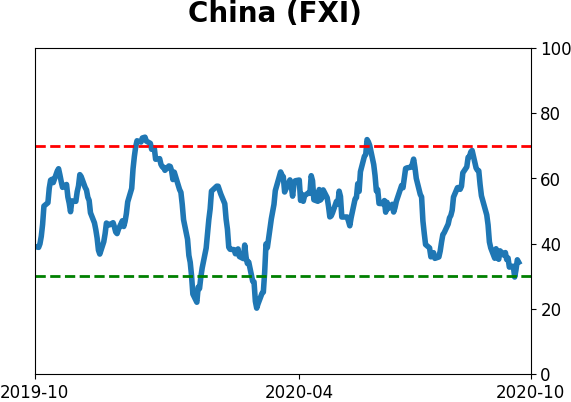
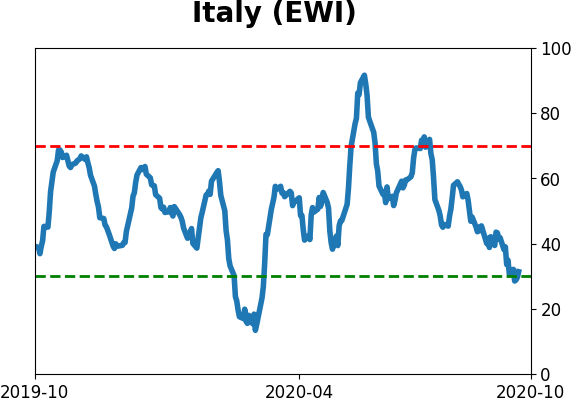
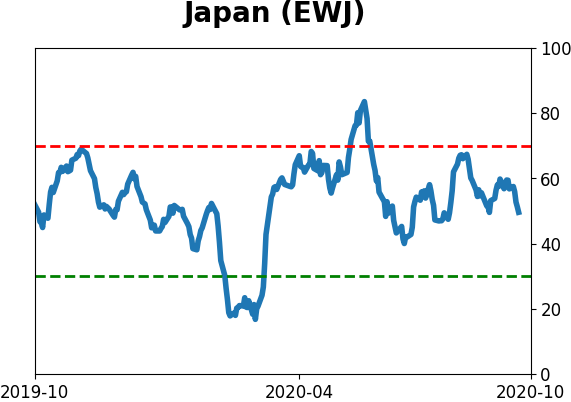
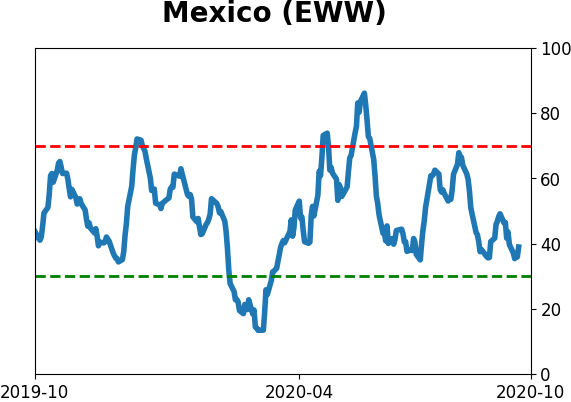
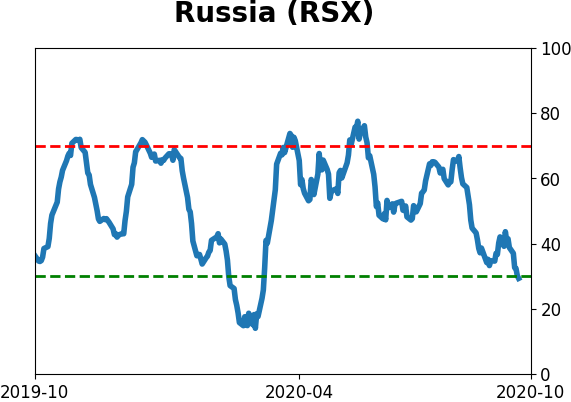
Sentiment Around The World
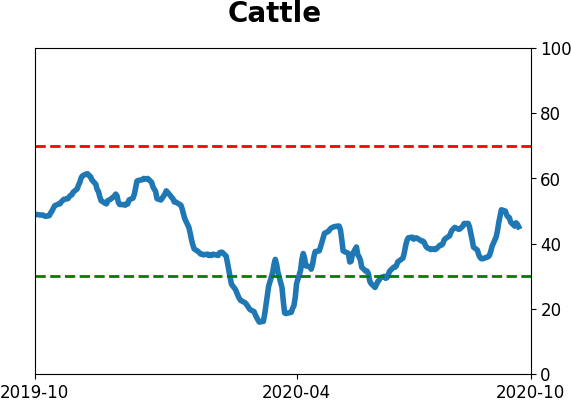
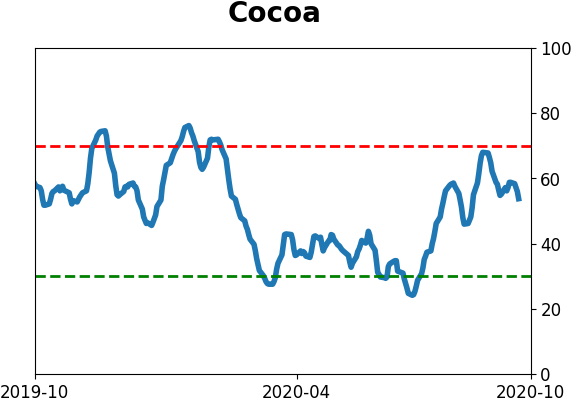
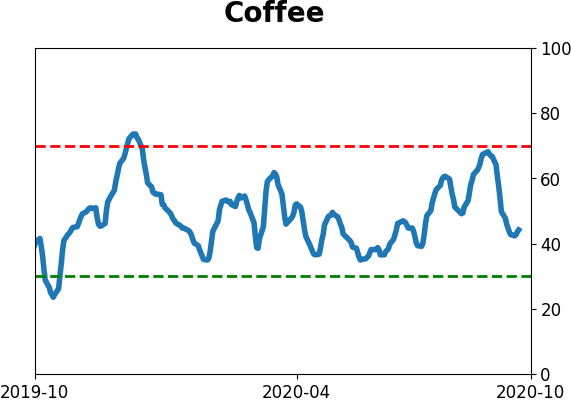
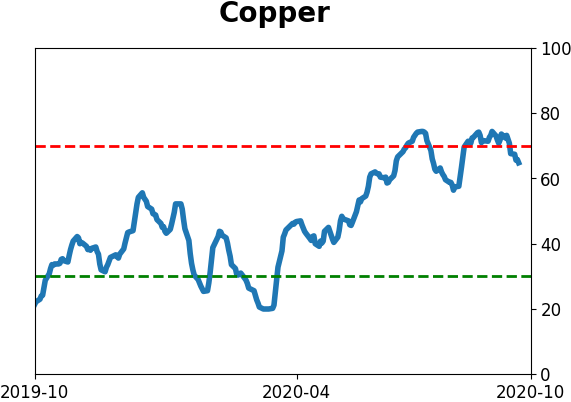
Optimism Index Thumbnails
|
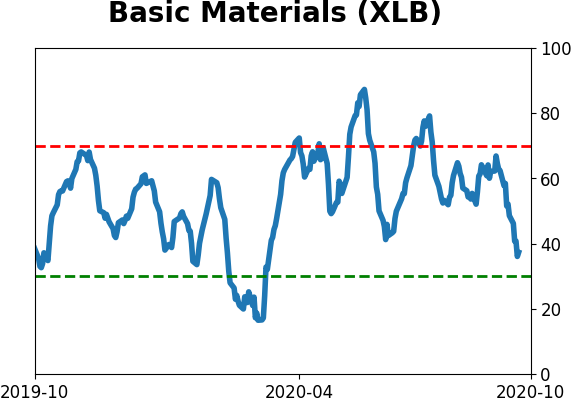
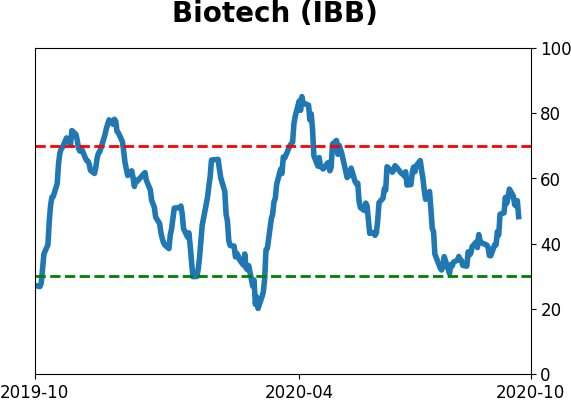
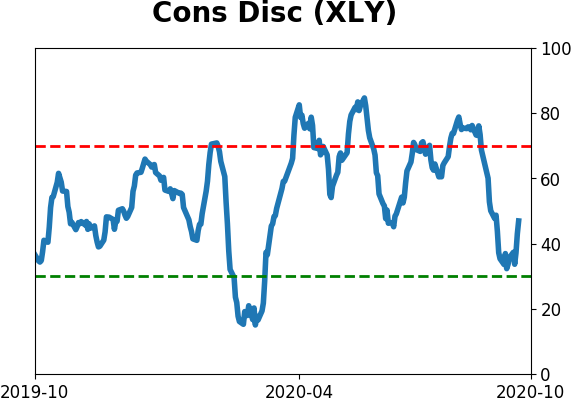
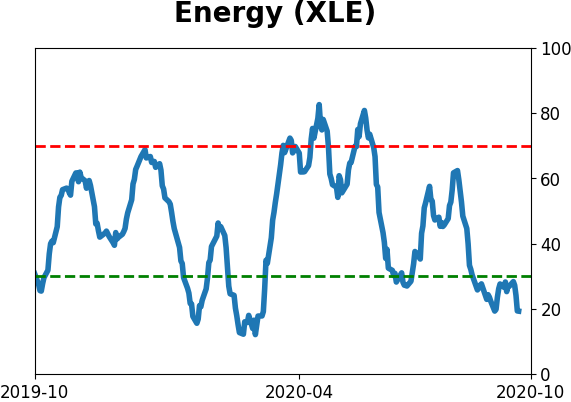
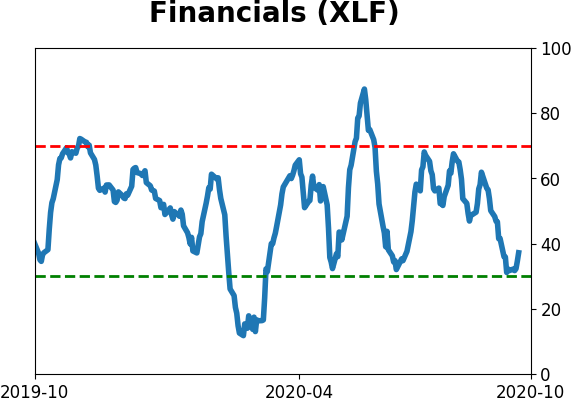
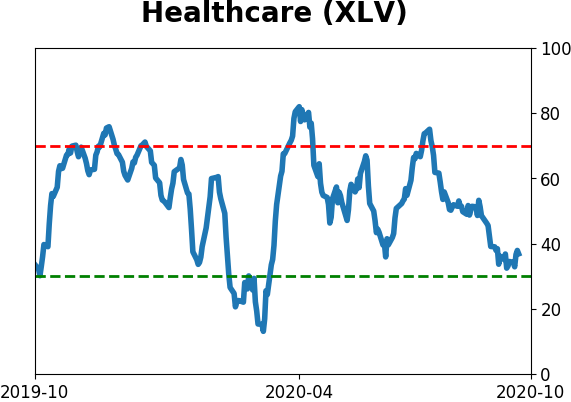
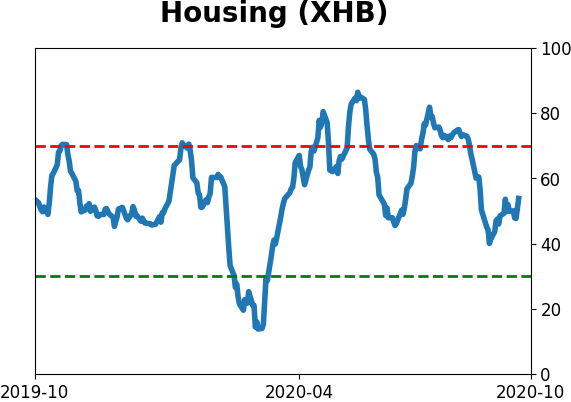
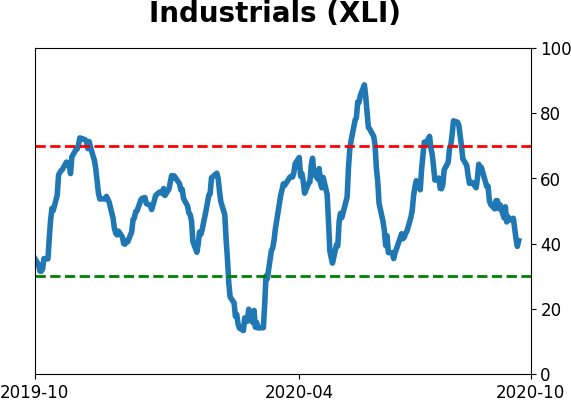
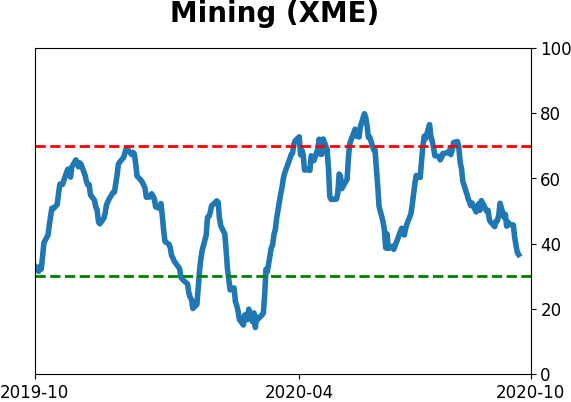
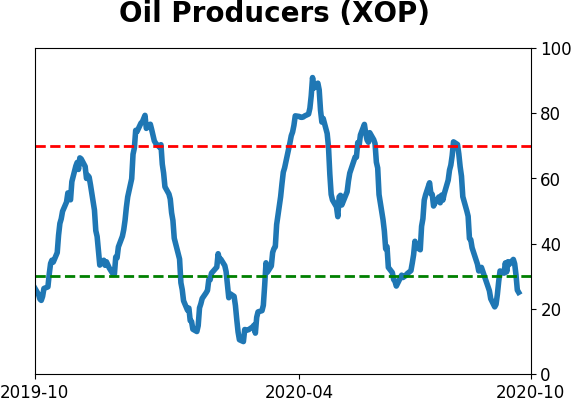
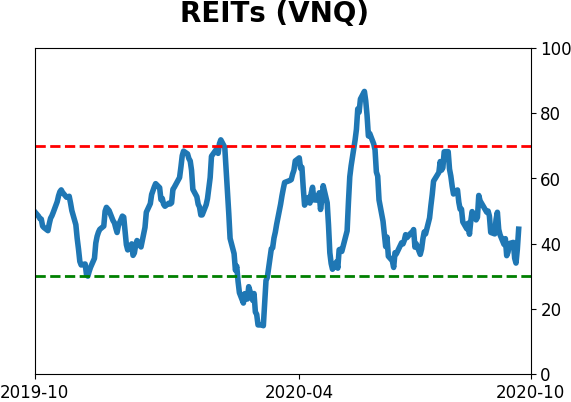
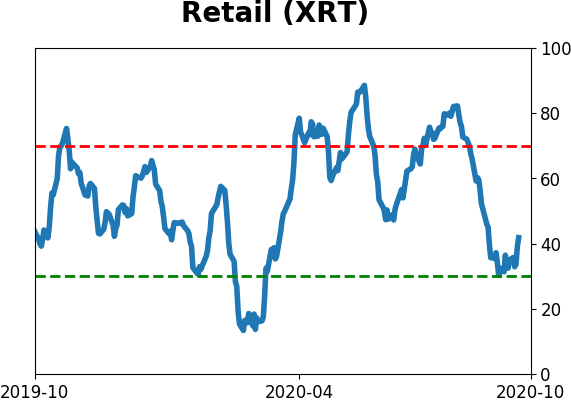
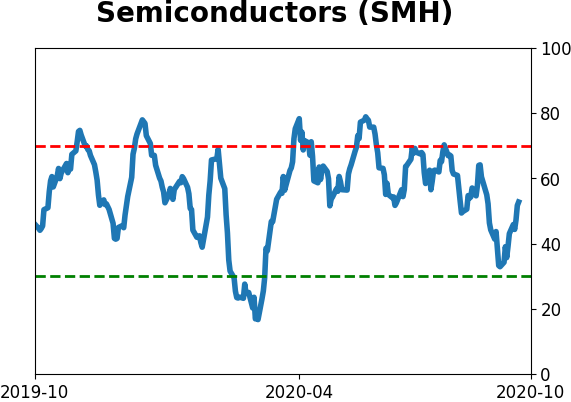
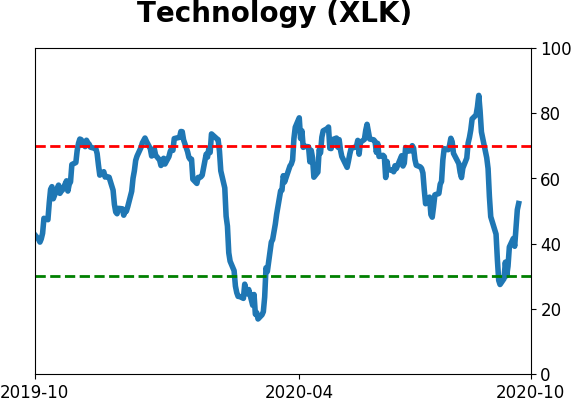
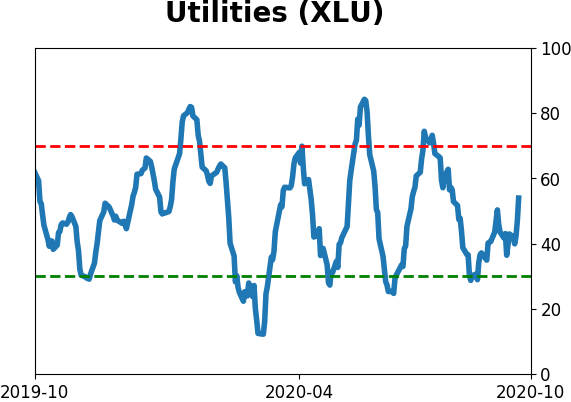
Sector ETF's - 10-Day Moving Average
|
|
|
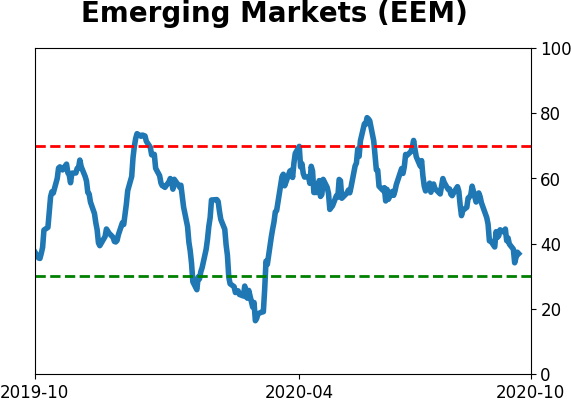
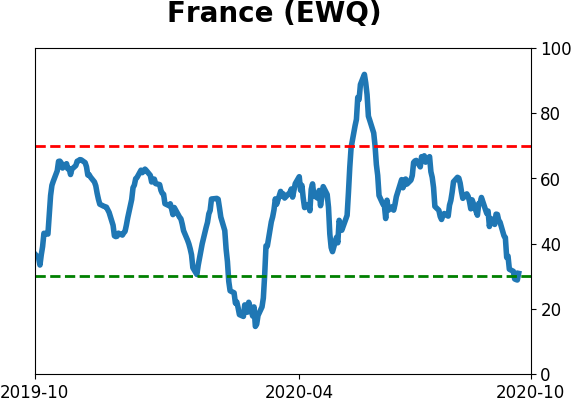
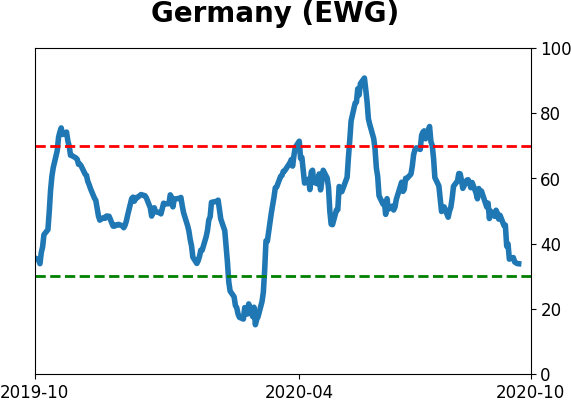
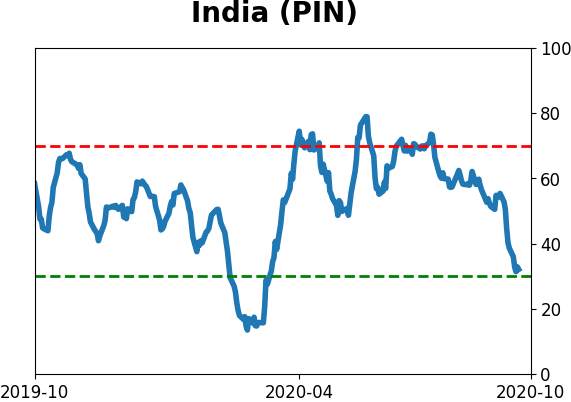
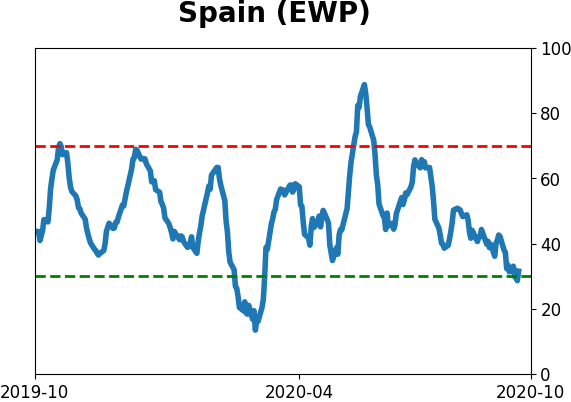
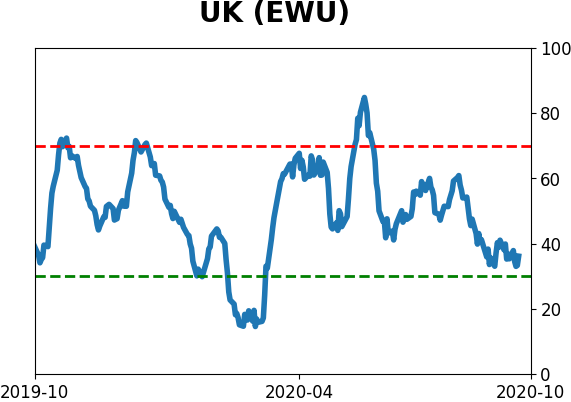
Country ETF's - 10-Day Moving Average
|
|
|
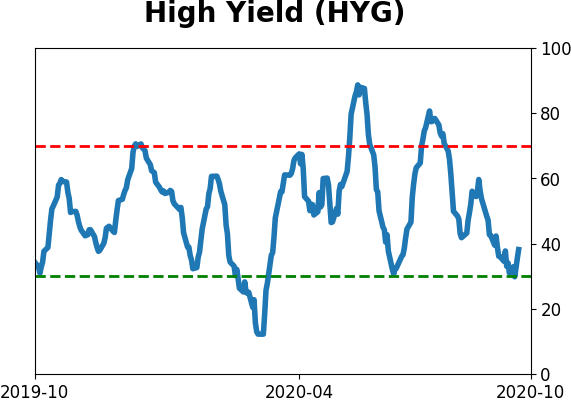
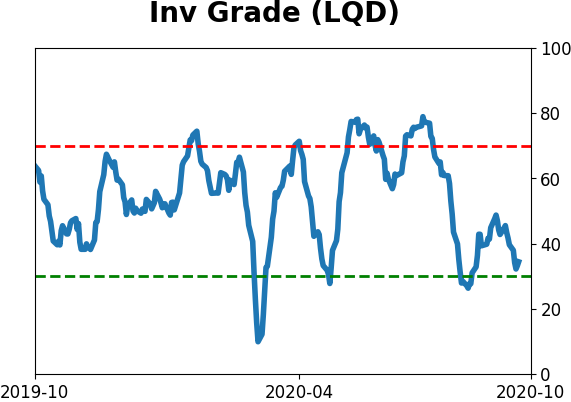
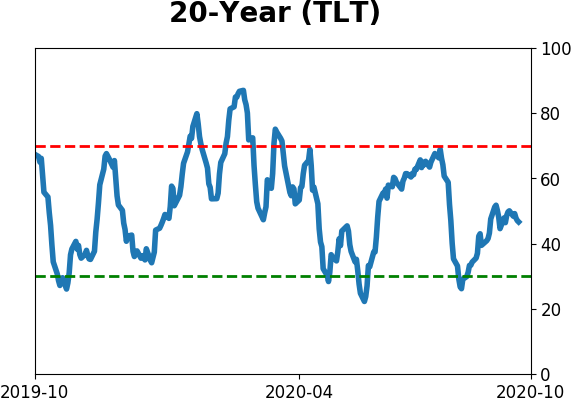
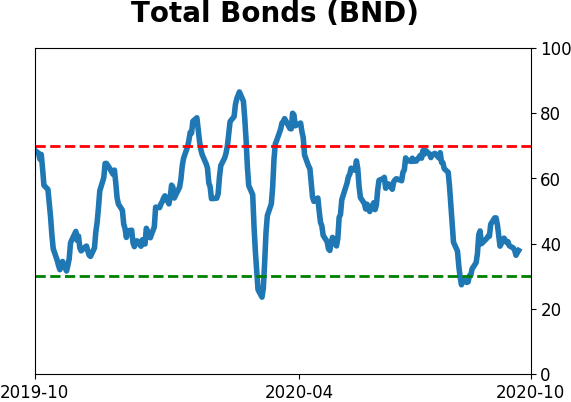
Bond ETF's - 10-Day Moving Average
|
|
|
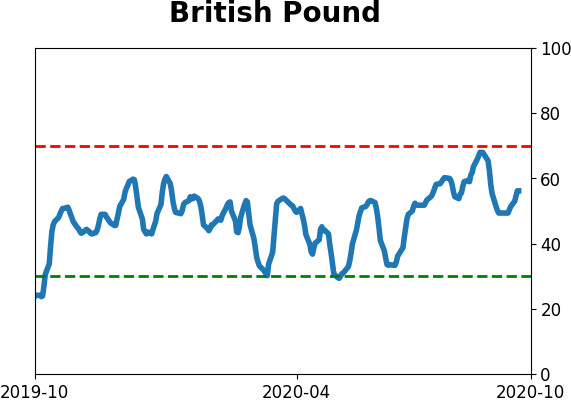
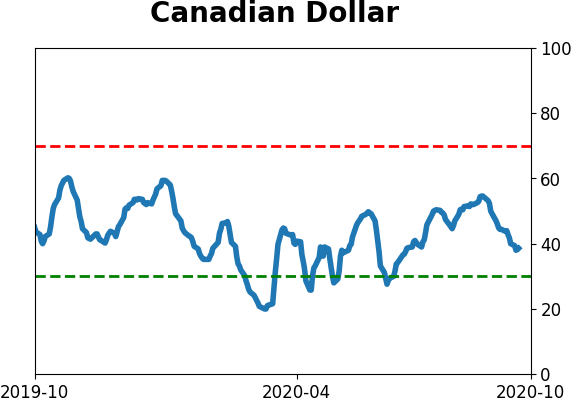
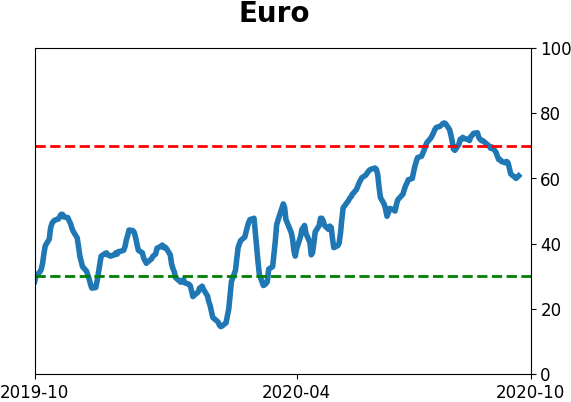
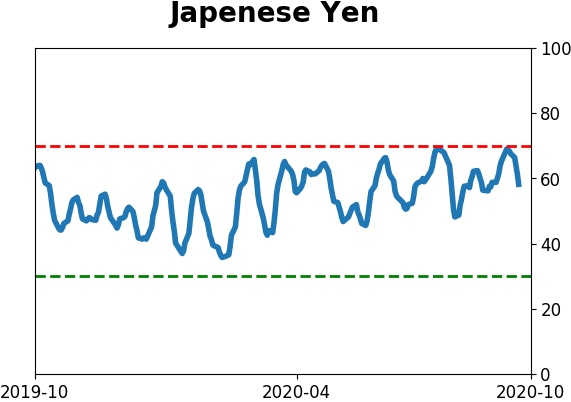
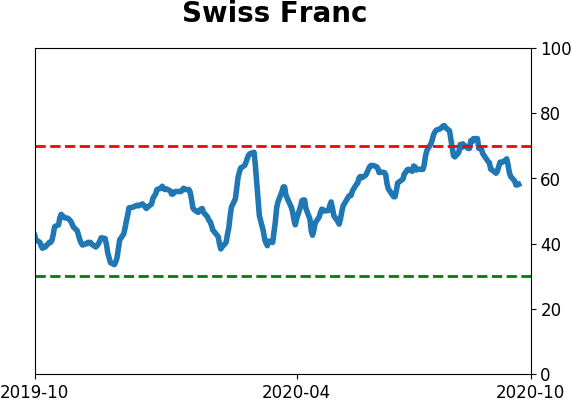
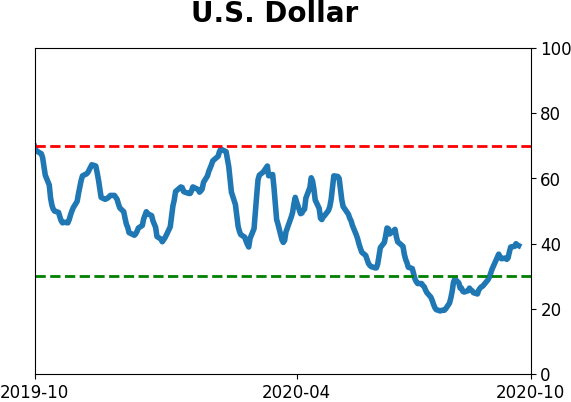
Currency ETF's - 5-Day Moving Average
|
|
|
Commodity ETF's - 5-Day Moving Average
|
|