Headlines
|
|
Consumers bought the September dip:
Even though stocks dropped in September, there was a jump in consumers who expect stocks to rise. Usually, they follow the trend. This seems like it should be a bad sign of too much confidence, but the evidence doesn't support it.
Energy bosses are cutting dividends, and workers:
Management at major energy firms have been busy cutting dividends and jobs in recent months, something they're loathed to do, both because of their responsibility to employees and investors, and the message it sends. It's gotten to the point that it rivals that other horrid period from late 2015 - early 2016.
Bottom Line:
- The weight of the evidence has turned neutral, with offsetting extremes in a mixed environment
| Market environment |
| | 1. Price pattern - Neutral | 4. McClellan Summation - Negative | | 2. Moving averages - Positive | 5. Net New Highs / Lows - Positive | | 3. % of Stocks > 200-Day - Slight positive | 6. % of Stocks in Correction - Negative |
| Other Sectors and Assets |
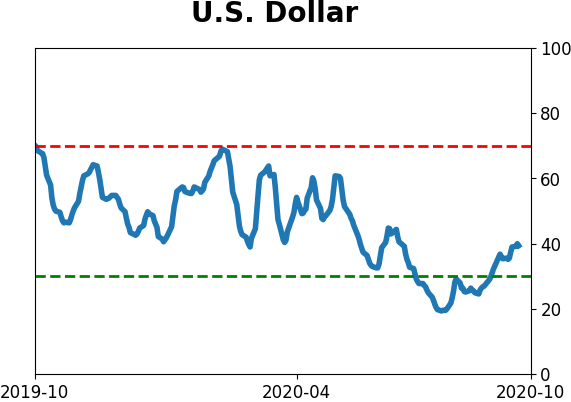
| | * Skewed preference for tech stocks neared exhaustion by late June relative to industrials and financials (here and here) | * U.S. Dollar neared the point that other medium-term rallies have stalled | | * Energy stocks are showing long-term near-capitulatory behavior (here and here) |
|
|
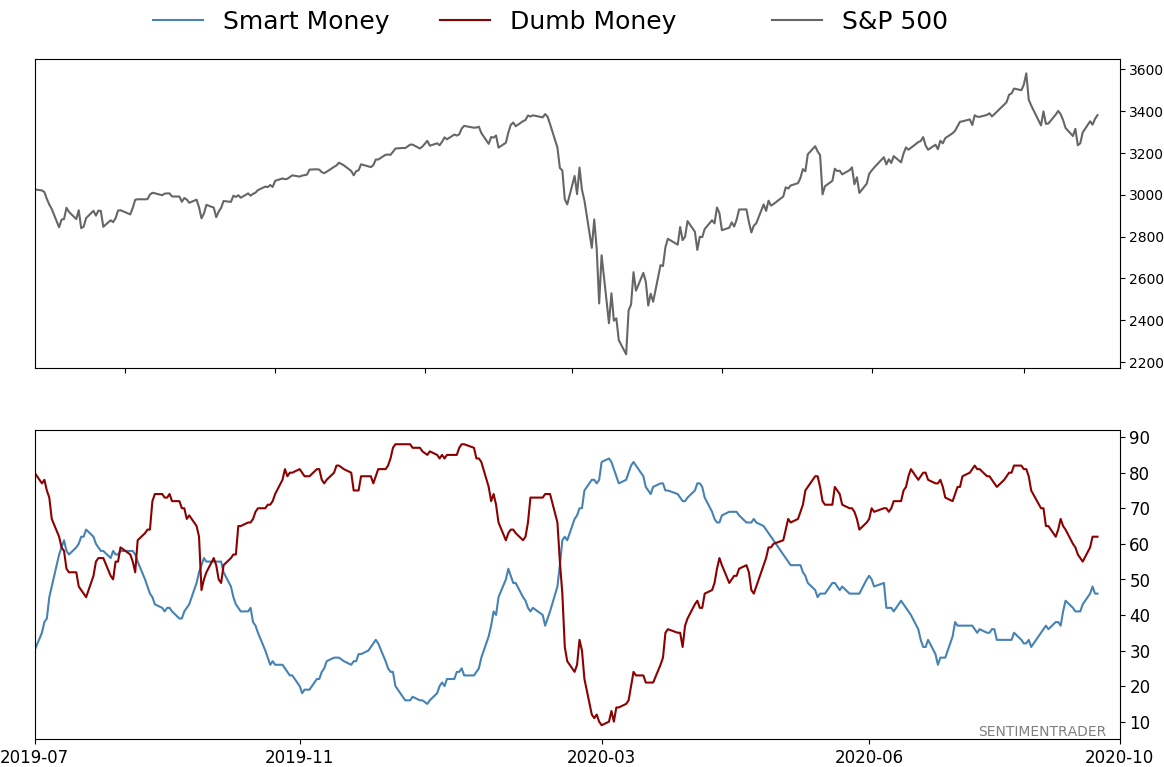
Smart / Dumb Money Confidence
|
Smart Money Confidence: 46%
Dumb Money Confidence: 62%
|
|
Risk Levels
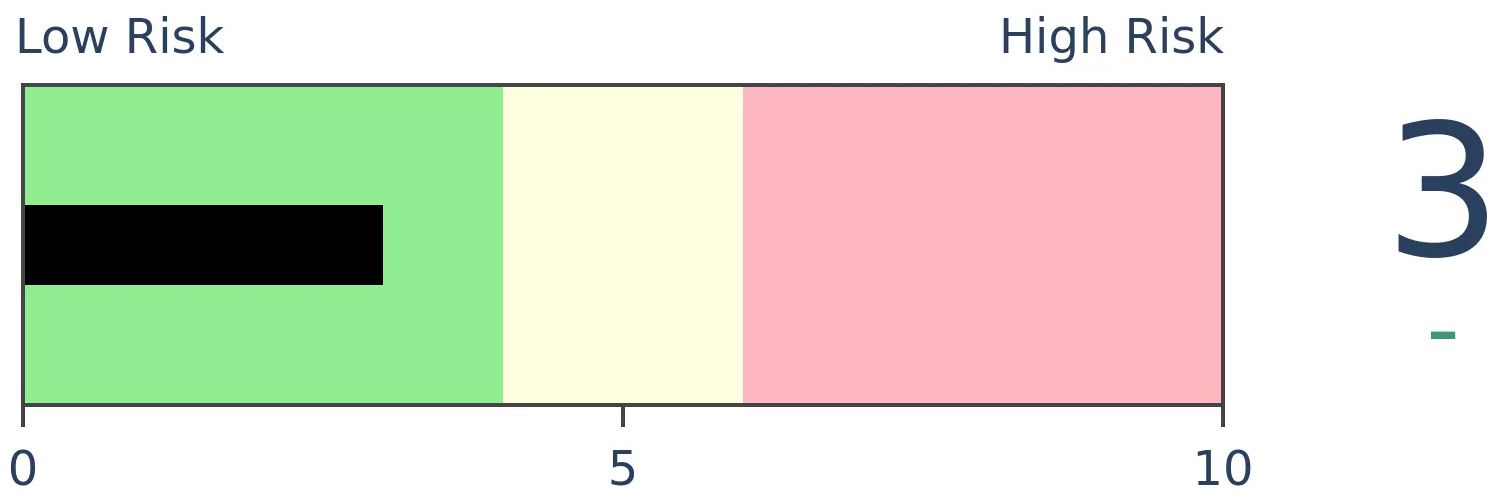
Stocks Short-Term
|
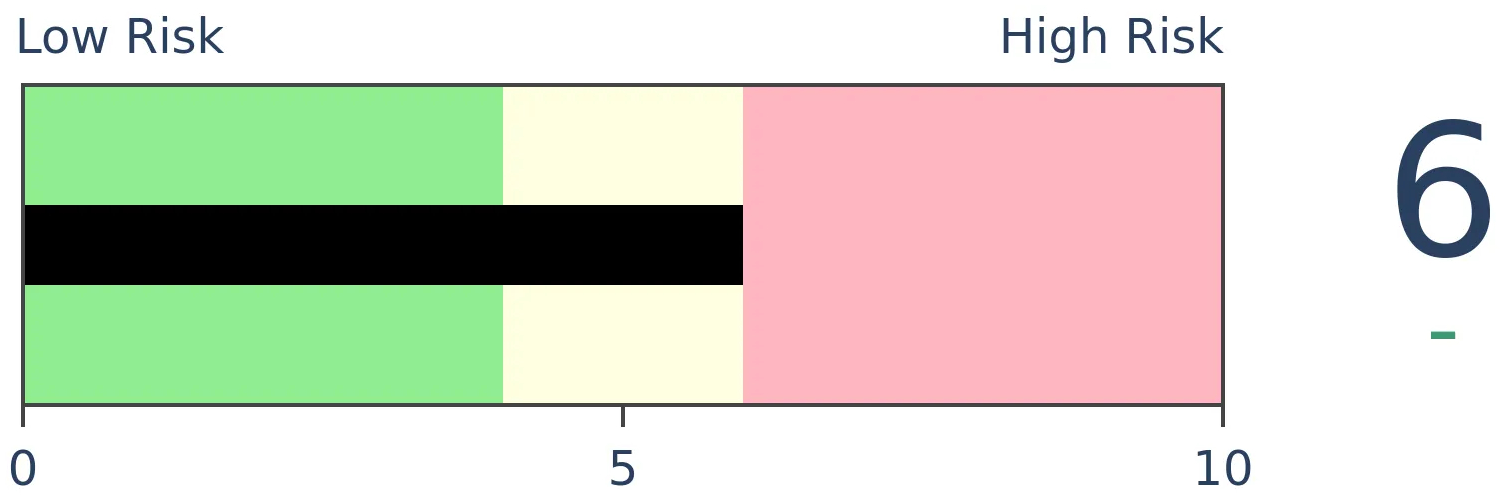
Stocks Medium-Term
|
|
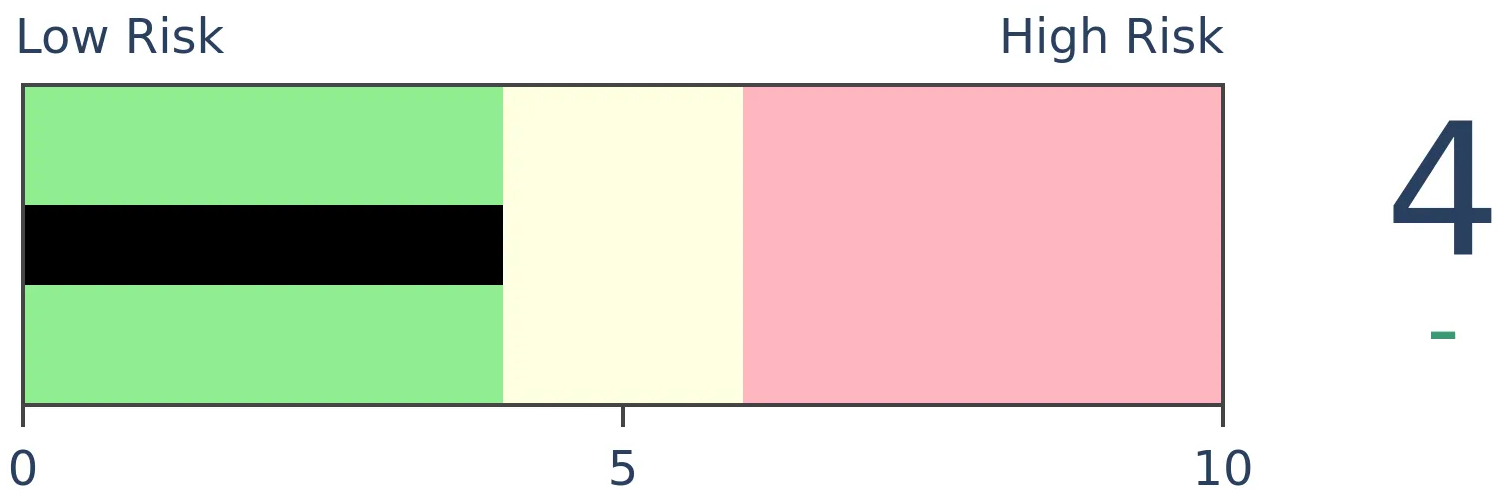
Bonds
|
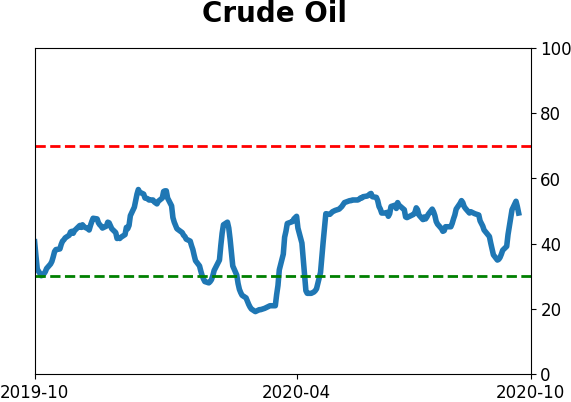
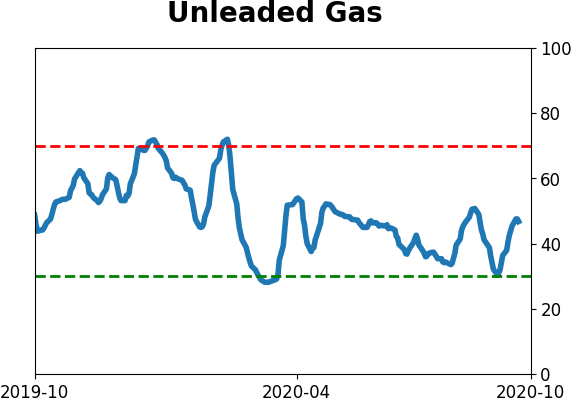
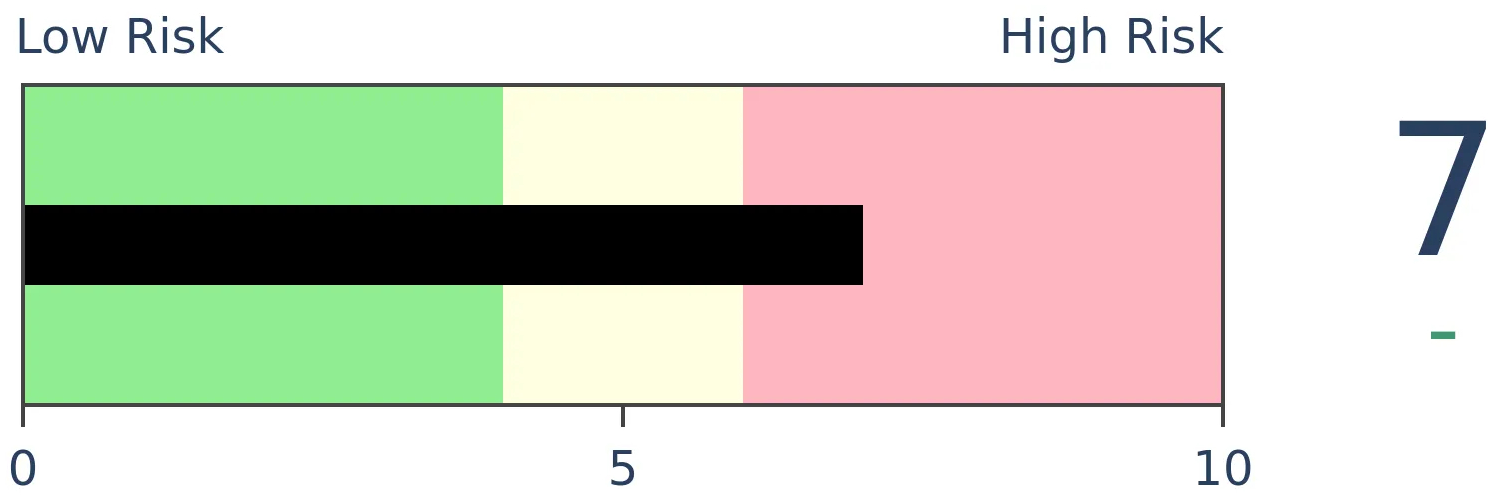
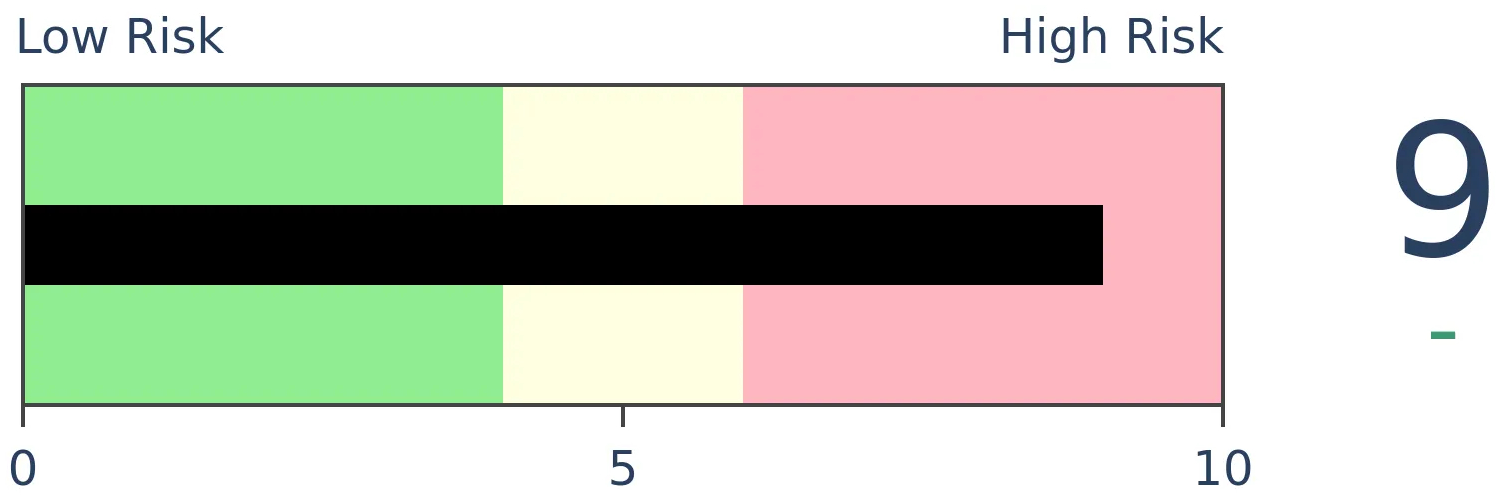
Crude Oil
|
|
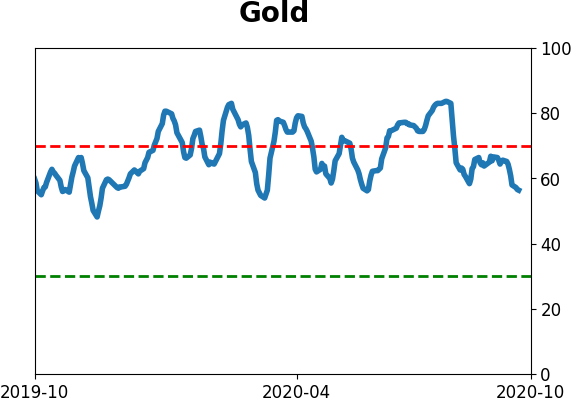
Gold
|
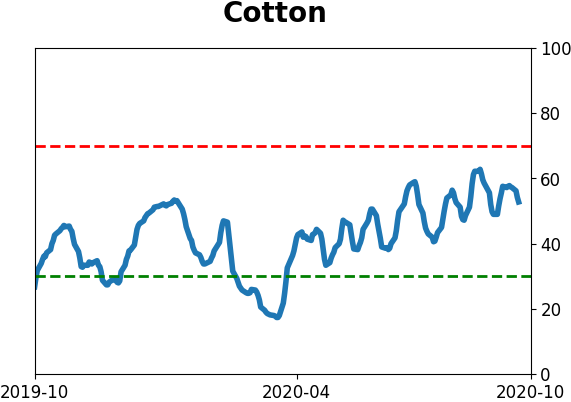
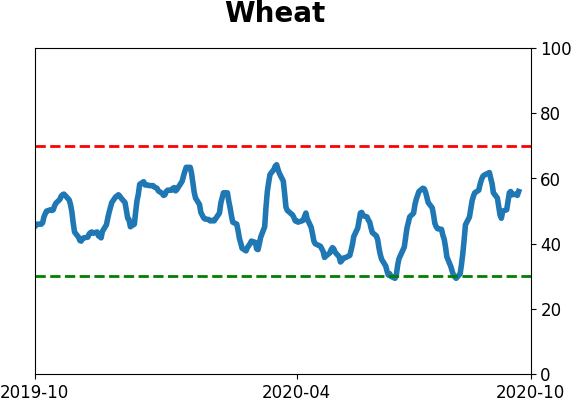
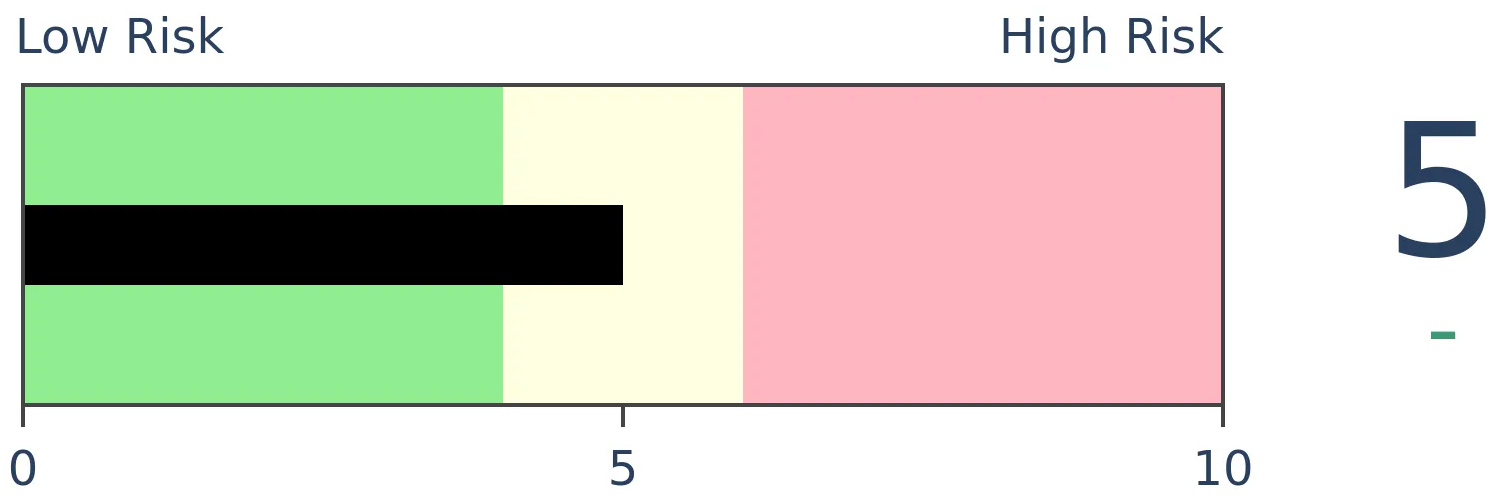
Agriculture
|
|
Research
BOTTOM LINE
Even though stocks dropped in September, there was a jump in consumers who expect stocks to rise. Usually, they follow the trend. This seems like it should be a bad sign of too much confidence, but the evidence doesn't support it.
FORECAST / TIMEFRAME
None
|
The worst performance in months didn't deter consumers. Even though the S&P 500 lost several percent in September, there was an increase in the net percentage of consumers who expect stocks to rise according to the monthly Conference Board survey.
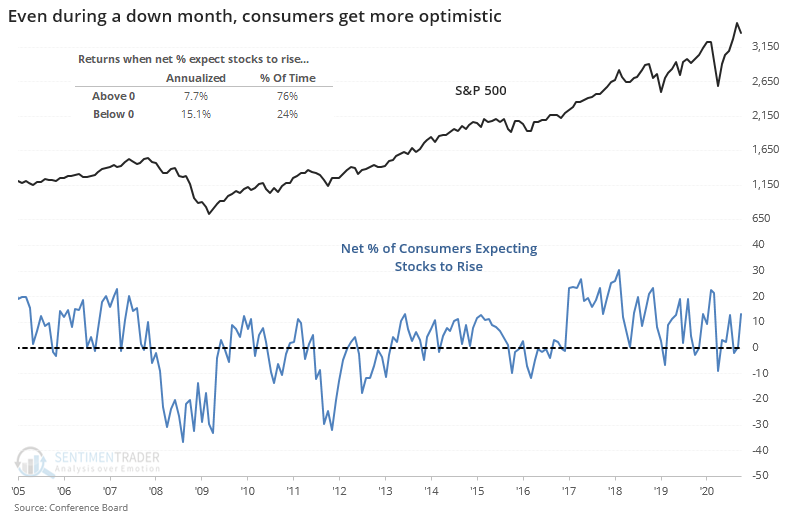
There is a modest contrary bias to this data. When more consumers expect stocks to rise than fall, the S&P 500 has returned an annualized +7.7%. When more expect stocks to fall than rise, that return more than doubles to +15.1%.
So, it seems like this increase in confidence despite lower prices should be a bad thing. To check, let's go back as far as we can and look for any month when the S&P lost 3% or more, and yet there was at least a 10% increase in the net percentage of consumers looking for stocks to rise vs. decline.
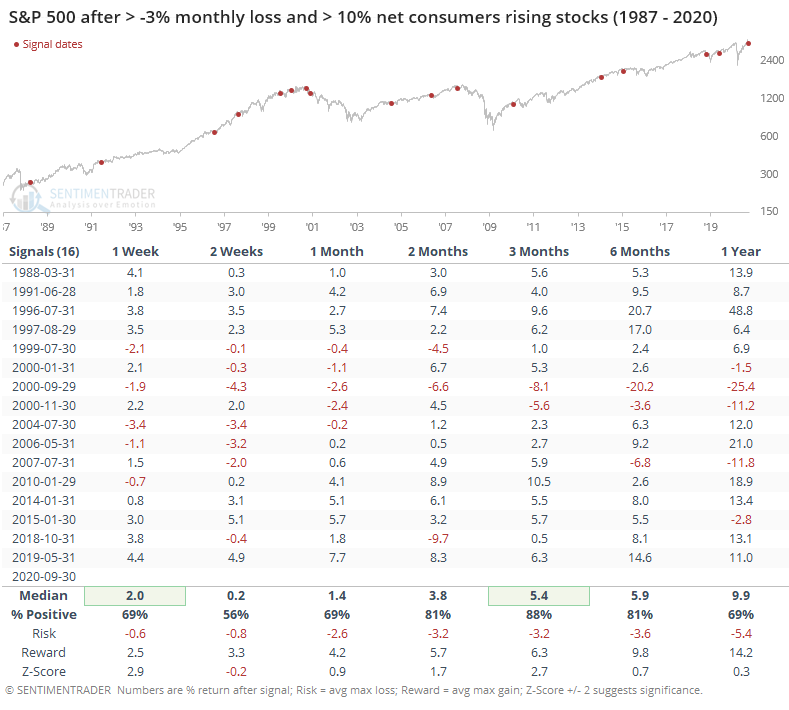
It wasn't such a bad sign after all. Over the next 3 months, the S&P rose 14 out of 16 times, with an excellent median return and decent (but not great) risk/reward skew. Over the next year, several of those rallies saw gains peter out, but still, there was an overall positive bias.
The only times when stocks lost this much and there was more than a 10% jump in consumers expecting stocks to rise were during/after the crashes in 1987 and 2008.
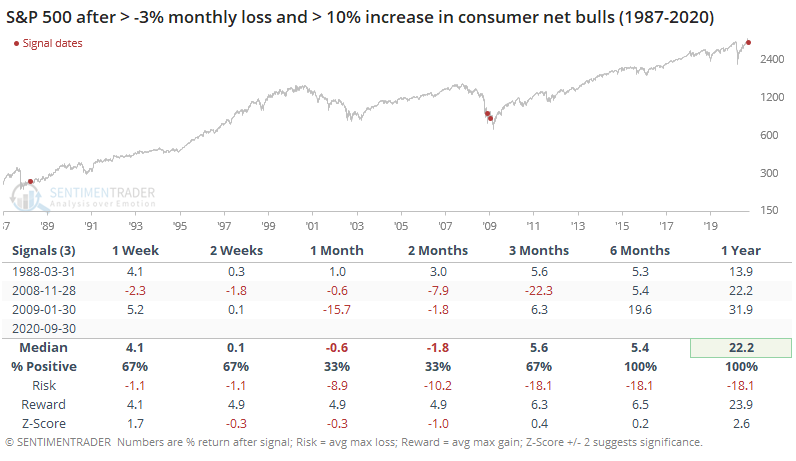
The sample size is essentially two, so we have to take the results with a grain of salt, but the S&P whipsawed in the months ahead, ultimately leading to substantially higher prices over the next 6-12 months.
There is a tendency to think everything is a contrary indicator, especially when it comes to surveys of laypersons. That's not always the case, however, and knee-jerk contrarianism can be a deleterious habit. This seems to be one of those cases. While on the surface we may want to become more defensive because consumers are buying the dip, historically there isn't a strong case to do so.
BOTTOM LINE
Management at major energy firms have been busy cutting dividends and jobs in recent months, something they're loathed to do, both because of their responsibility to employees and investors, and the message it sends. It's gotten to the point that it rivals that other horrid period from late 2015 - early 2016.
FORECAST / TIMEFRAME
XLE -- Up, Long-Term
|
Earlier this week, we looked at how poorly energy stocks have performed and how depressed investors in the sector have become as a result.
We got some questions about dividend cuts, referencing mining and resource companies back in 2015 because headlines surrounding the sectors are similar. In December 2015, we saw that when it gets so bad that the companies decide to cut their dividends, much of the negativity had already been priced in.
Consider the headlines around when Freeport-McMoRan (FCX) suspended its dividend near the end of 2015.
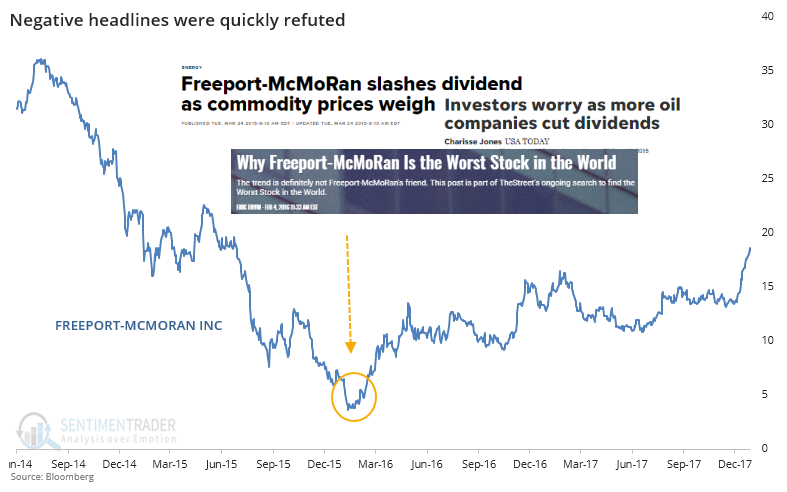
When you see headlines like "worst company in the world" and "worst sector of the year", you know that a lot of news has already been announced, considered, and acted upon. After those headlines hit, FCX promptly enjoyed a two-year, 430% face-ripper of a rally.
Due to circumstances both within and outside of their control, energy companies have taken the drastic step of reducing or suspending dividends, much like resource companies 5 years ago. Dividends are a point of pride for many of these firms, and they take their dependability seriously. Reducing the payout is a last-ditch measure that signals things are really, really bad and management is taking it very, very seriously.
The chart below shows a rolling sum of companies currently in the XLE fund that are showing a reduced dividend payout.
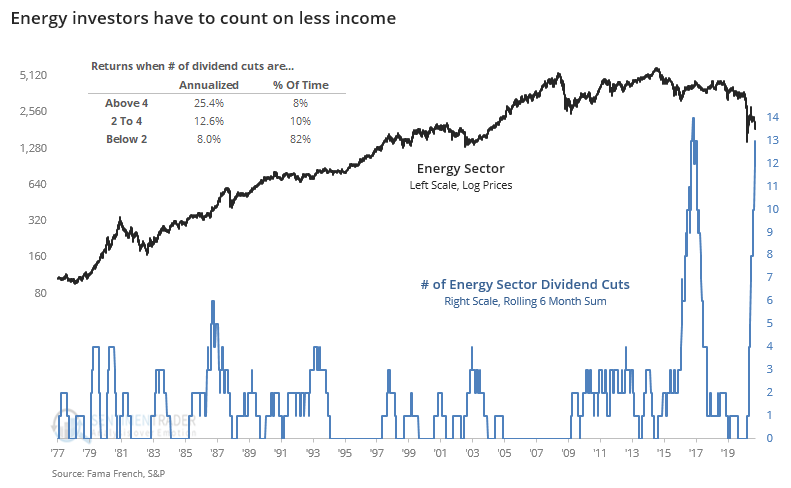
These firms started cutting dividends in earnest in late 2015 and the first couple of months of 2016. Even though the sector bottomed then, reduced payouts continued into the late fall of that year. From early 2016 to the peak over the next 3 years, XLE gained more than 60% and XOP more than 90%.
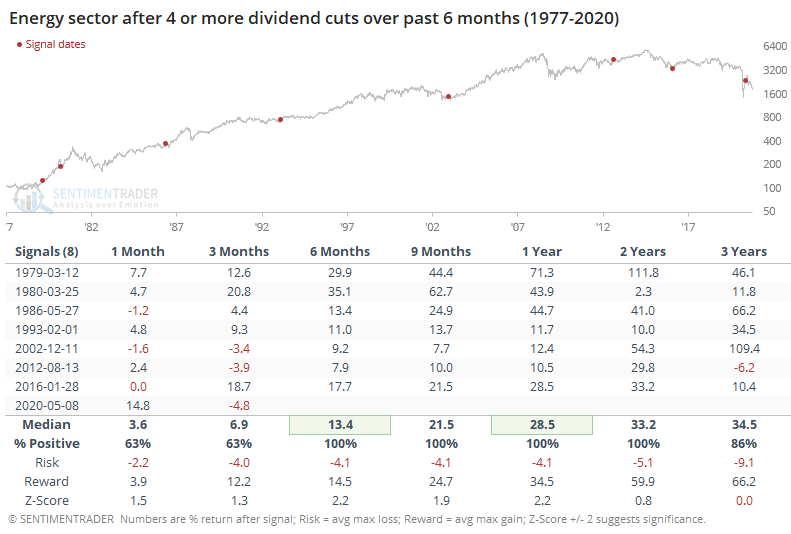
If we look at returns once at least 4 of these firms cut their dividends within the past 6 months, future long-term returns were excellent.
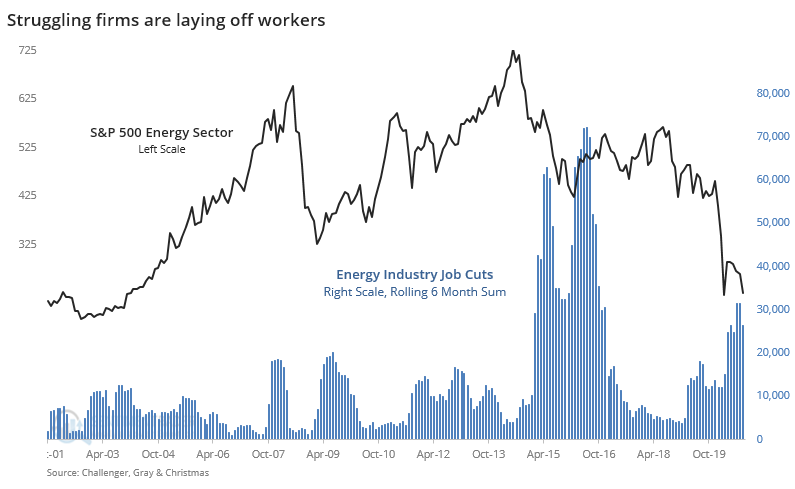
Despite their reputation as being greedy corporate overlords concerned only with profits, management teams at these firms are still human. They feel a responsibility not only toward investors but (hopefully) even more toward employees. They do not take layoff announcements lightly.
According to Challenger, Gray & Christmas, the pace of job cuts in the energy sector tailed off in September but the 6-month sum is the highest in 20 years outside of the 2015-16 period.
There is no question that the sector acts horribly, both on an absolute and relative basis. About the only question left is whether the bad news is bad enough, and sentiment poor enough, that buyers are about to step in on "less bad" news. There is no sign of that yet, but we'll be watching some of the signs noted earlier to see if it changes.
Active Studies
| Time Frame | Bullish | Bearish | | Short-Term | 0 | 1 | | Medium-Term | 1 | 12 | | Long-Term | 47 | 2 |
|
Indicators at Extremes
Portfolio
| Position | Description | Weight % | Added / Reduced | Date | | Stocks | RSP | 15.2 | Reduced 4.2% | 2020-09-03 | | Bonds | 10% TLT, 10% BND, 10% SCHP | 30.0 | Added 30% | 2020-09-09 | | Commodities | GCC | 2.4 | Reduced 2.1%
| 2020-09-04 | | Precious Metals | GDX | 5.0 | Added 5% | 2020-09-09 | | Special Situations | XLE | 4.9 | Added 5.1% | 2020-09-03 | | Cash | | 42.5 | | |
|
Updates (Changes made today are underlined)
After stocks bottomed on March 23rd, they enjoyed a historic buying thrust and retraced a larger amount of the decline than "just a bear market rally" tends to. Through June, there were signs of breadth thrusts, recoveries, and trend changes that have an almost unblemished record at preceding higher prices over a 6-12 month time frame. On a shorter-term basis, our indicators have been showing high optimism, with Dumb Money Confidence recently above 80%, along with signs of reckless speculation during what appears to be an unhealthy market environment, historically a bad combination. While there are certainly some outlier indicators that are showing apathy or even outright pessimism, a weight-of-the-evidence approach suggests high risk over a multi-week to multi-month time frame. That has been the case since July, even arguably June and yet the major indexes hit continual new highs through late August. With the indicators and studies failing to precede any weakness, I've been hesitant to lower my already-low exposure. I am getting increasingly anxious about the oddities we're seeing, though, and lowered it again. This account is mostly about comfort with risk for me, and right now I'm not at all comfortable with any of it. In more than 25 years of experience, this is the oddest market I've ever seen. I lowered exposure again - likely the lowest I'm willing to go at this point given longer-term positives - and decided to switch to an equal-weight version of the S&P 500 index. I've become intensely uncomfortable with the concentration in the cap-weighted index. Our studies have been mixed with regard to the potential for the equal-weight version to outperform the cap version going forward, so historical support isn't overwhelming. I'm also increasingly interested again in energy stocks, starting with a small allocation. I got burned in March with the unprecedented geopolitical spat that hammered those stocks then but the longer-term setup is decent. In this account, I’ve roughly followed what has become known as the All Weather portfolio popularized by Ray Dalio. It allocates across four broad assets, designed to hold up no matter the market environment. The goal is modest positive returns while limiting large, sustained losses. I typically use popular ETFs, with low costs. At times, I will swap out for a fund I believe has better prospects, or simply lower fees if not. At other times, I will diverge quite a bit from baseline allocations, largely depending on the indicators and studies we discuss on the site. I've gotten away from this in the past, using "cash" as a substitute for "bonds" and with rates stuck at 0%, that has become less appetizing. I'm trying to get back more toward the baselines with less dramatic swings in either direction. The base allocation I use is the following: Stocks: 35%
Bonds: 45%
Precious Metals: 7.5%
Commodities: 7.5%
Cash / Special Opportunities: 5%
RETURN YTD: -1.7% 2019: 12.6%, 2018: 0.6%, 2017: 3.8%, 2016: 17.1%, 2015: 9.2%, 2014: 14.5%, 2013: 2.2%, 2012: 10.8%, 2011: 16.5%, 2010: 15.3%, 2009: 23.9%, 2008: 16.2%, 2007: 7.8%
|
|
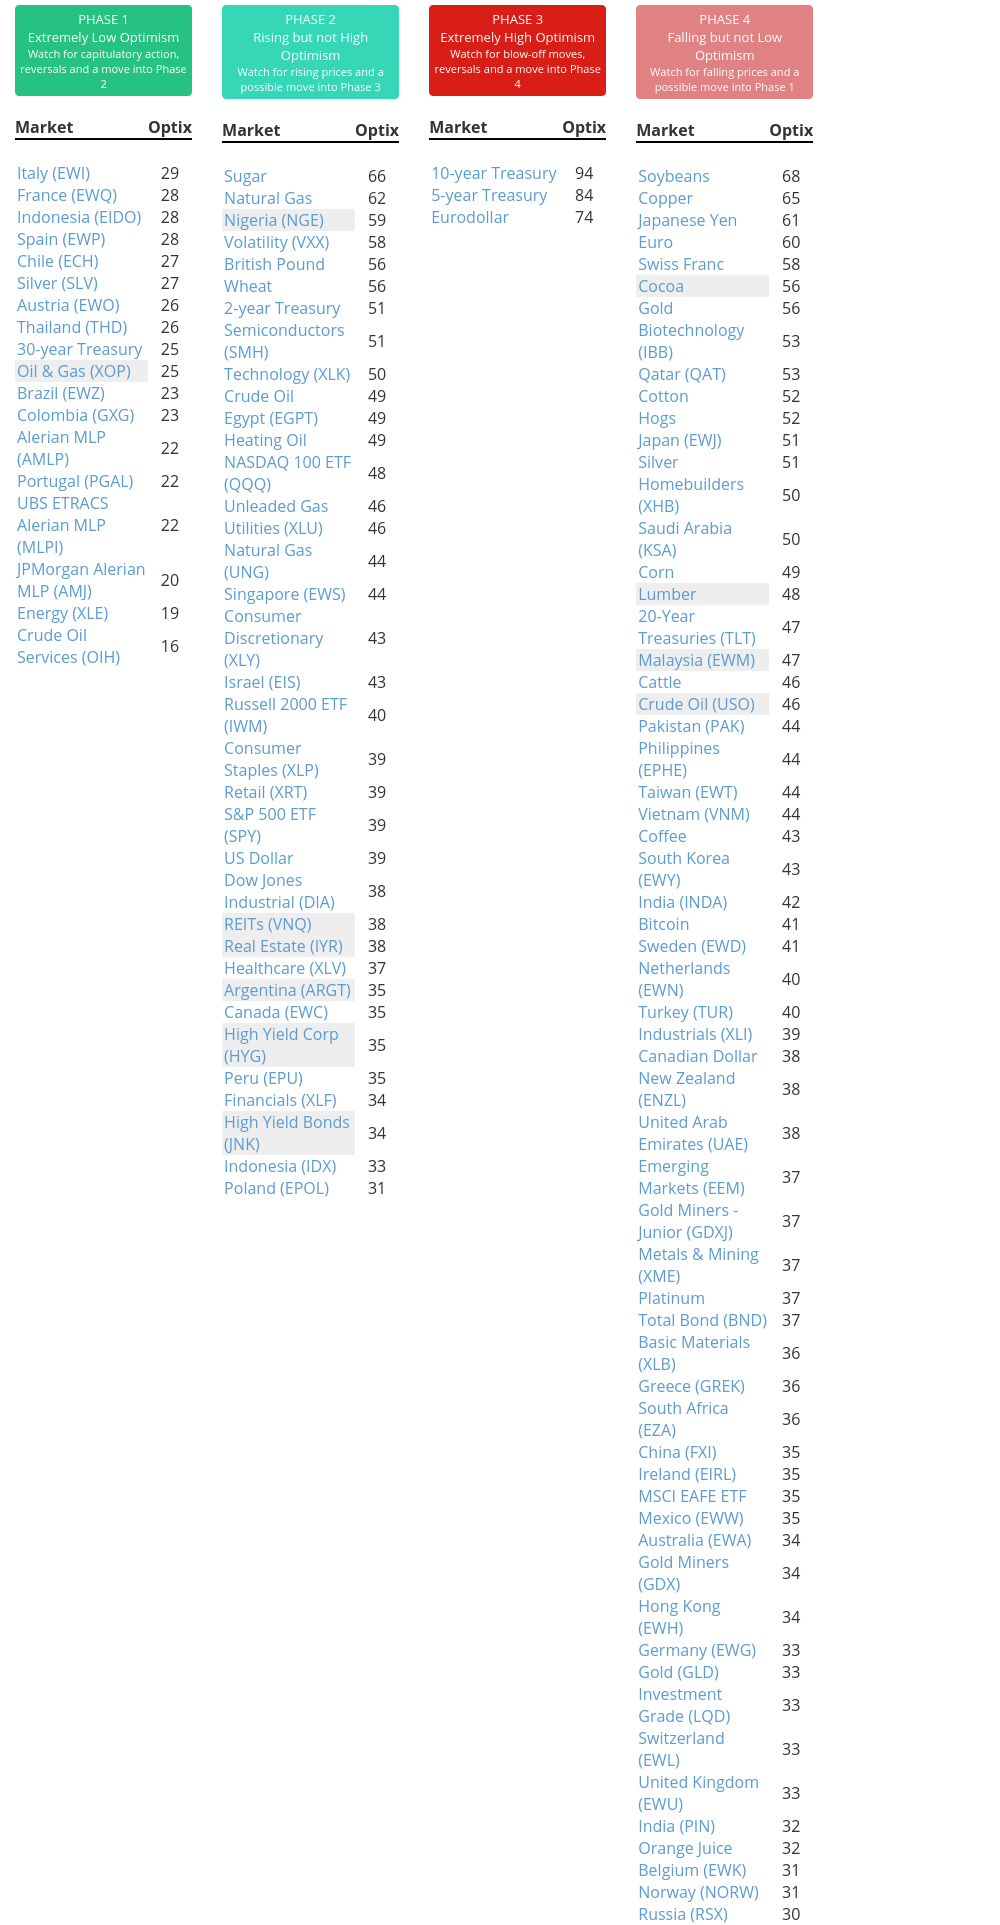
Phase Table
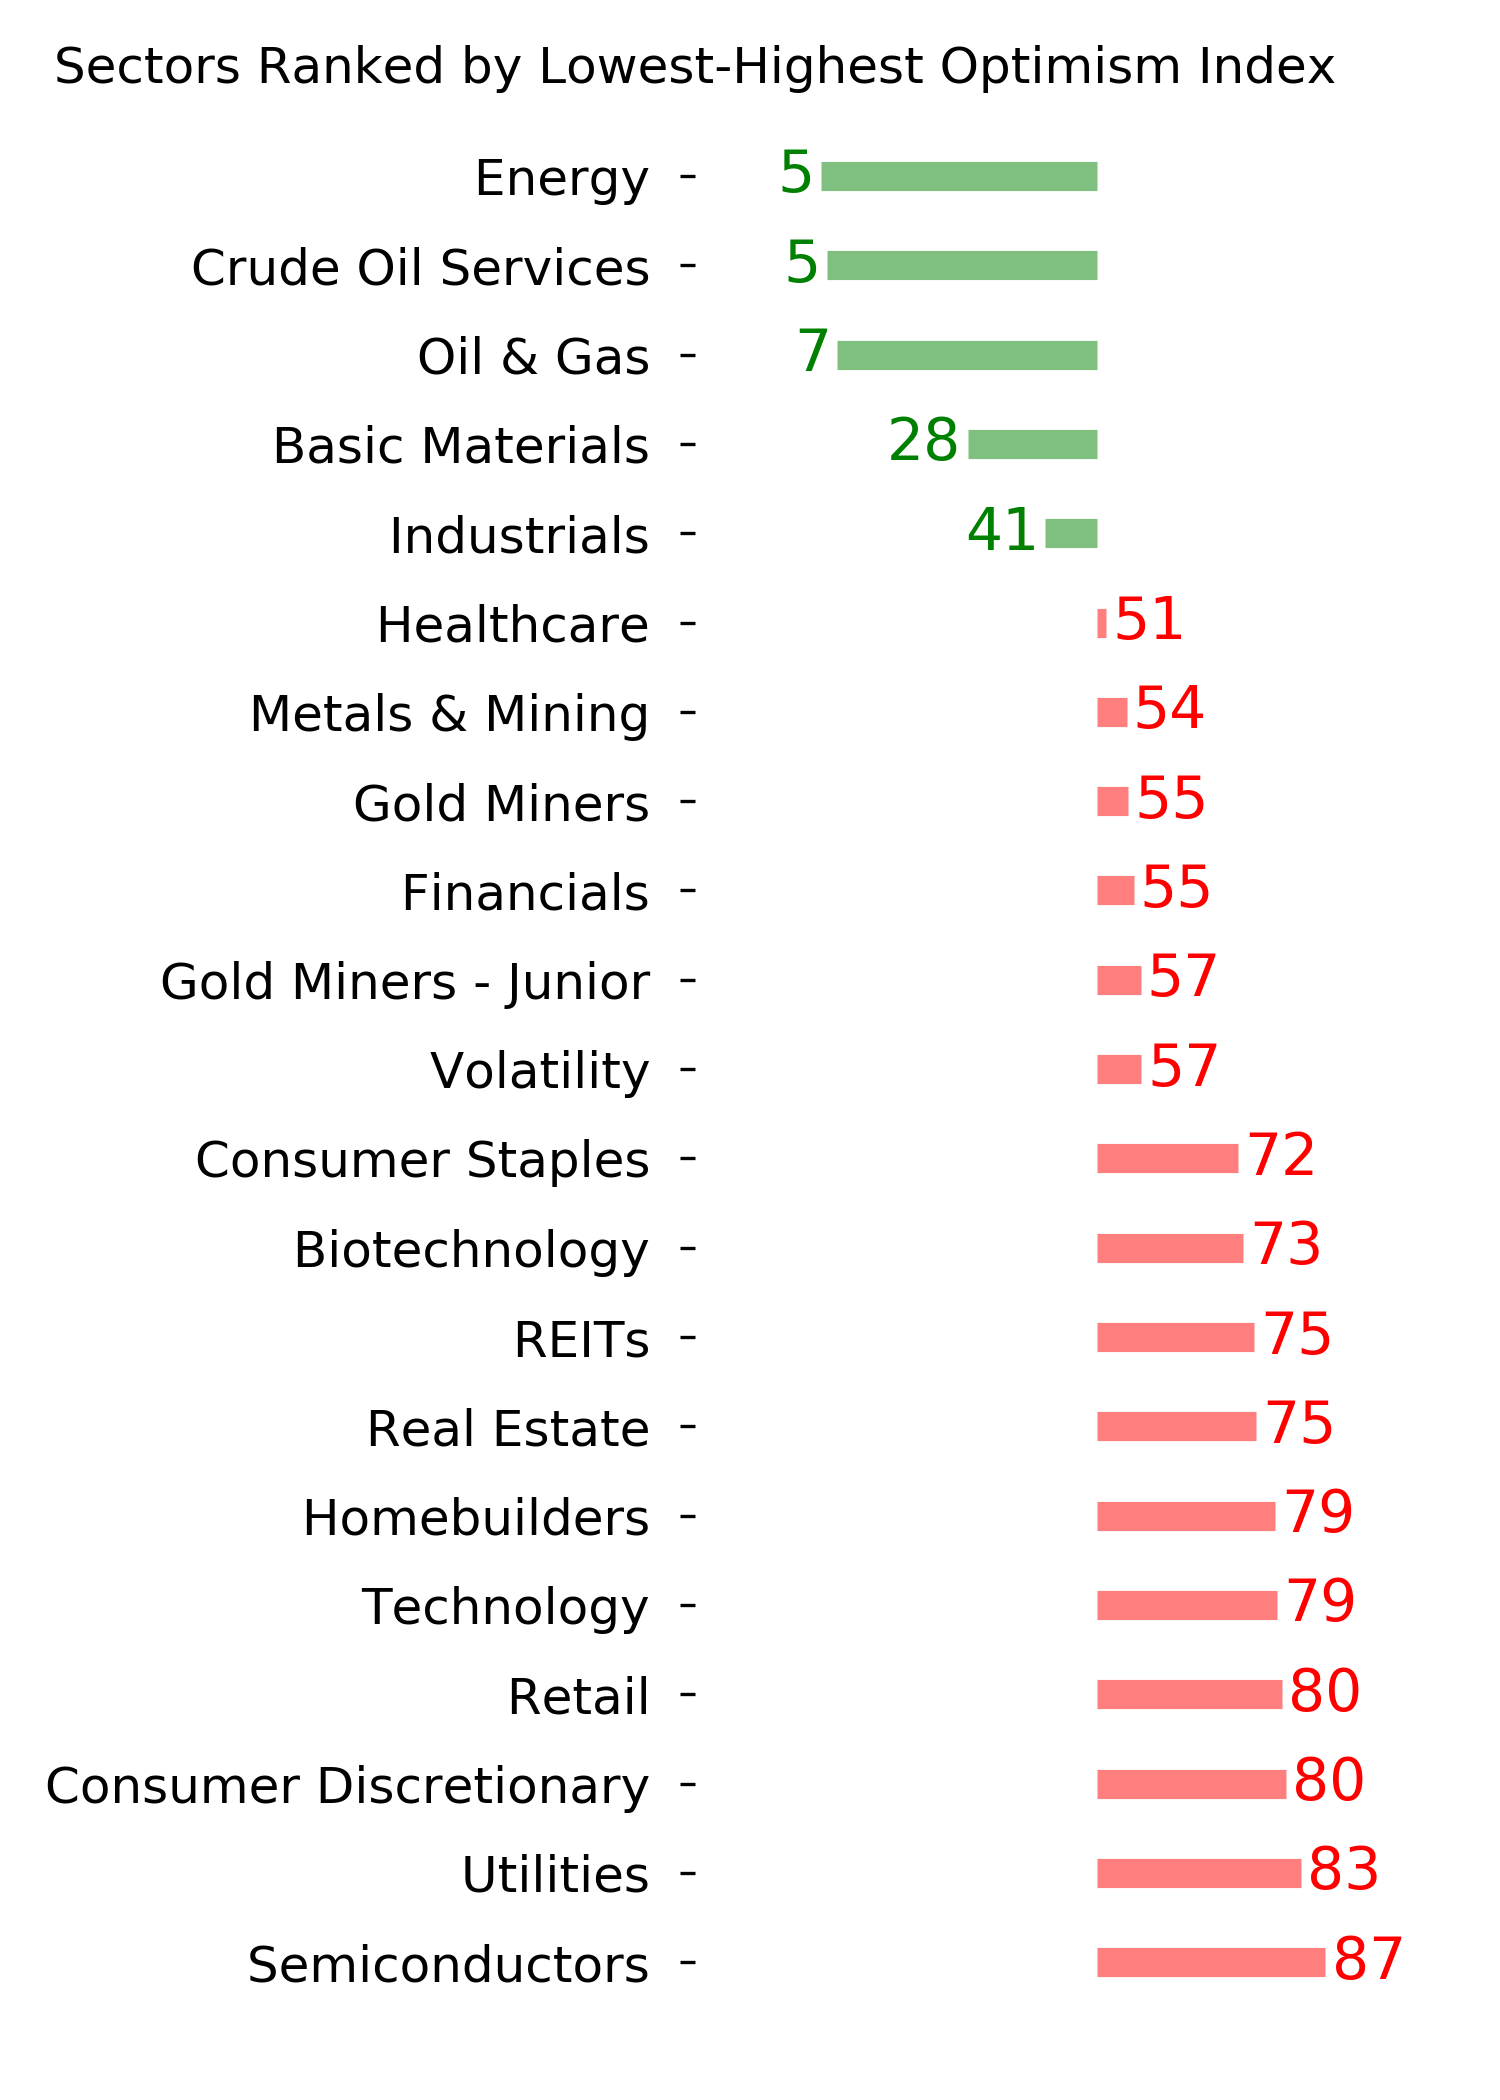
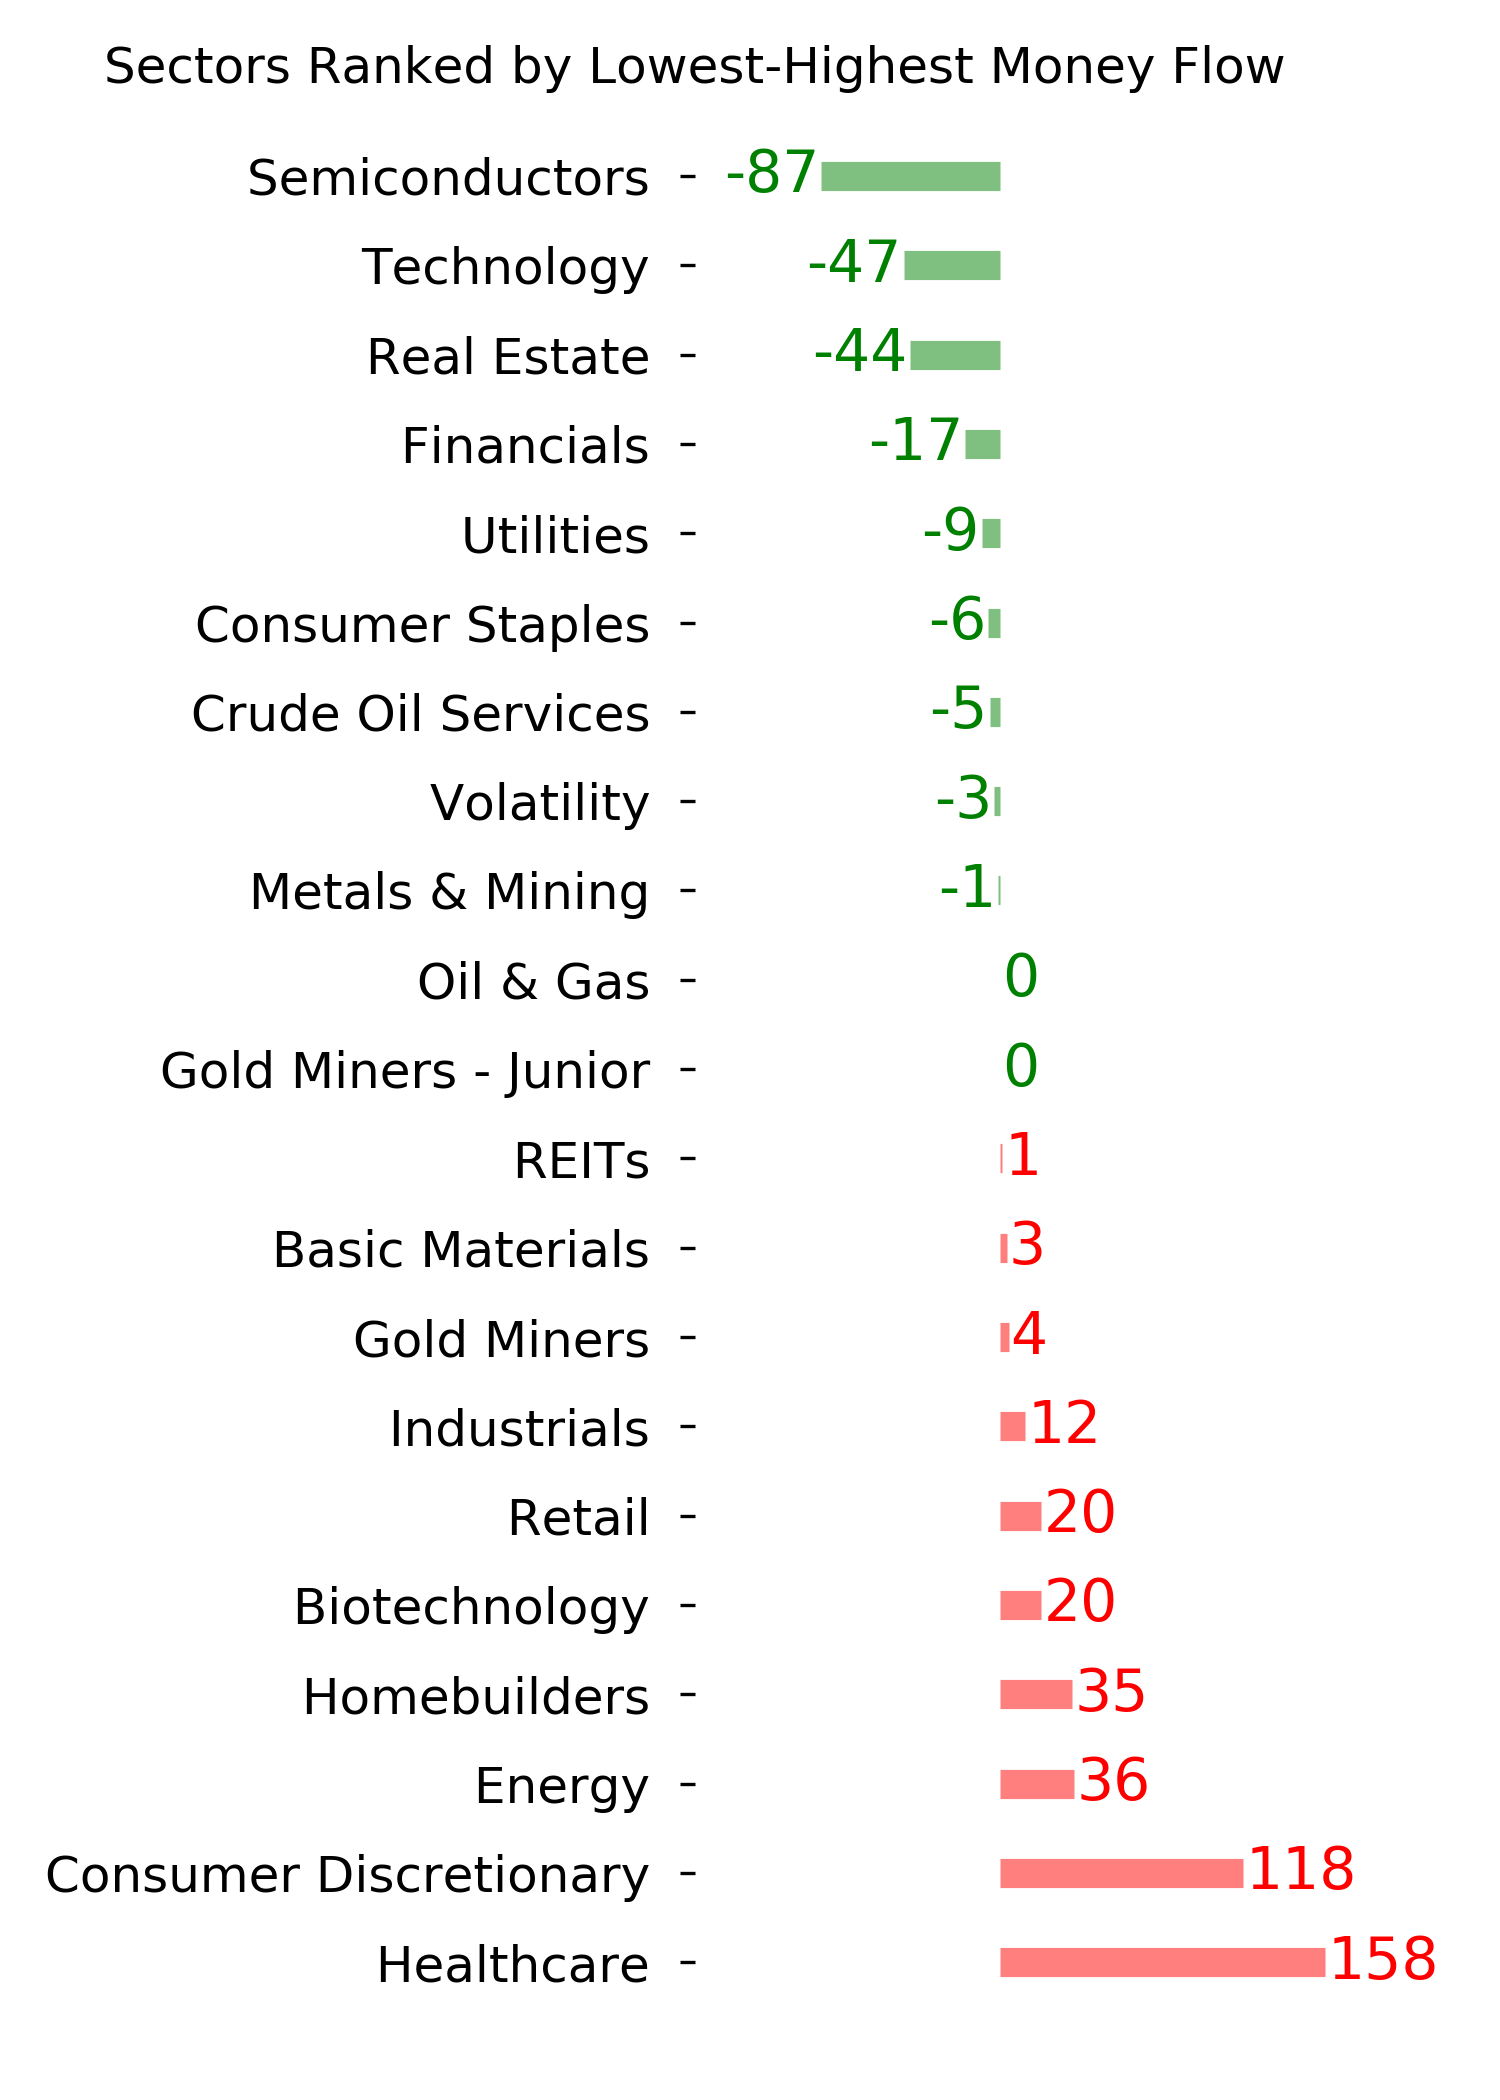
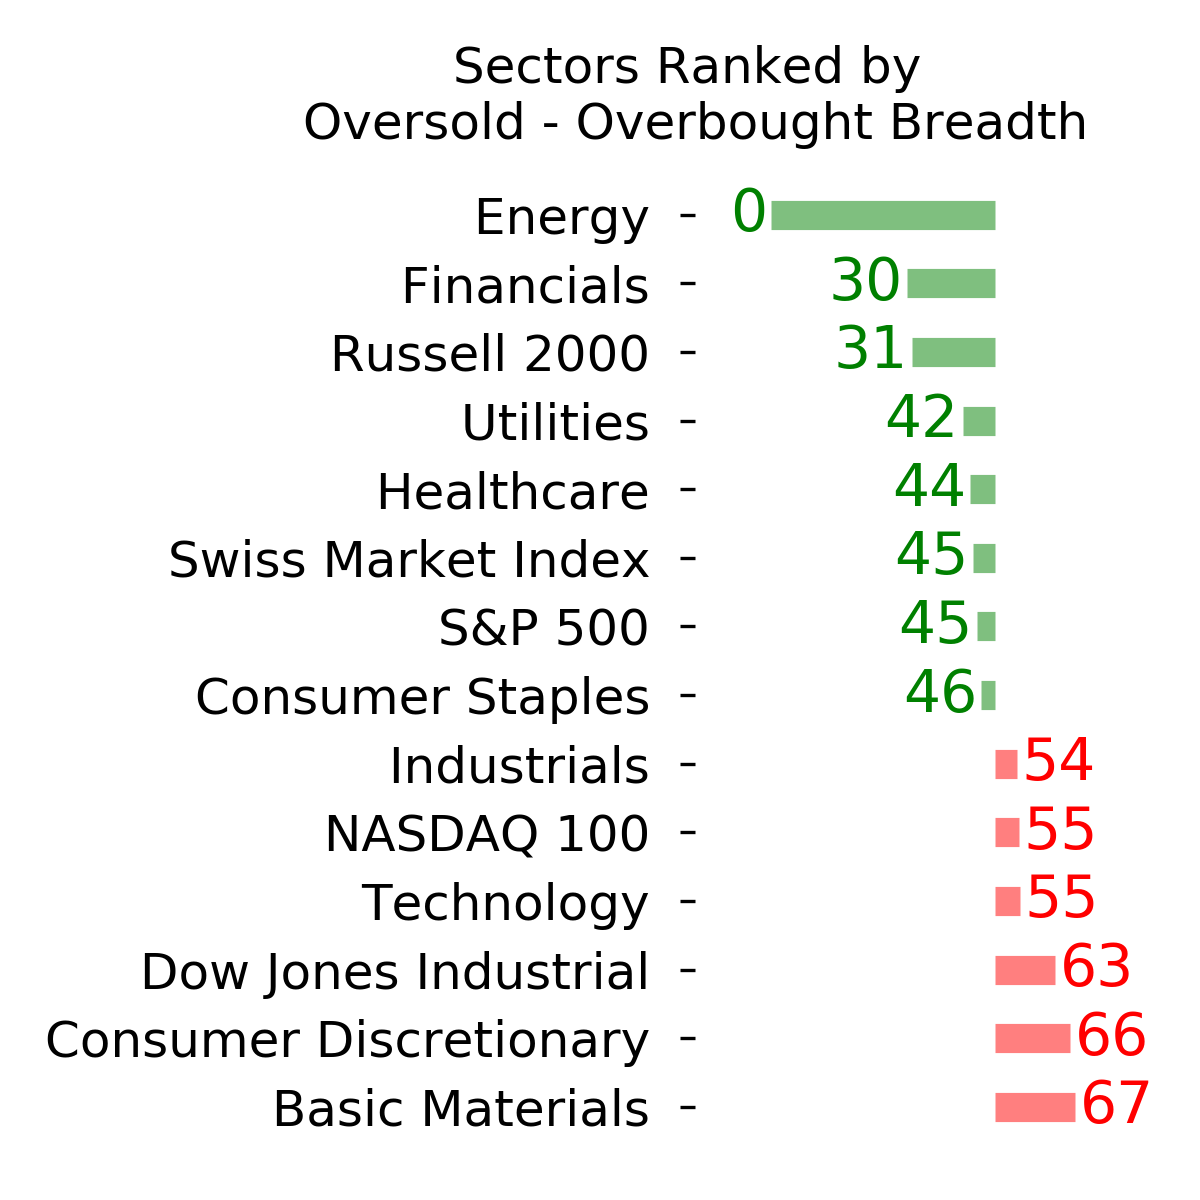
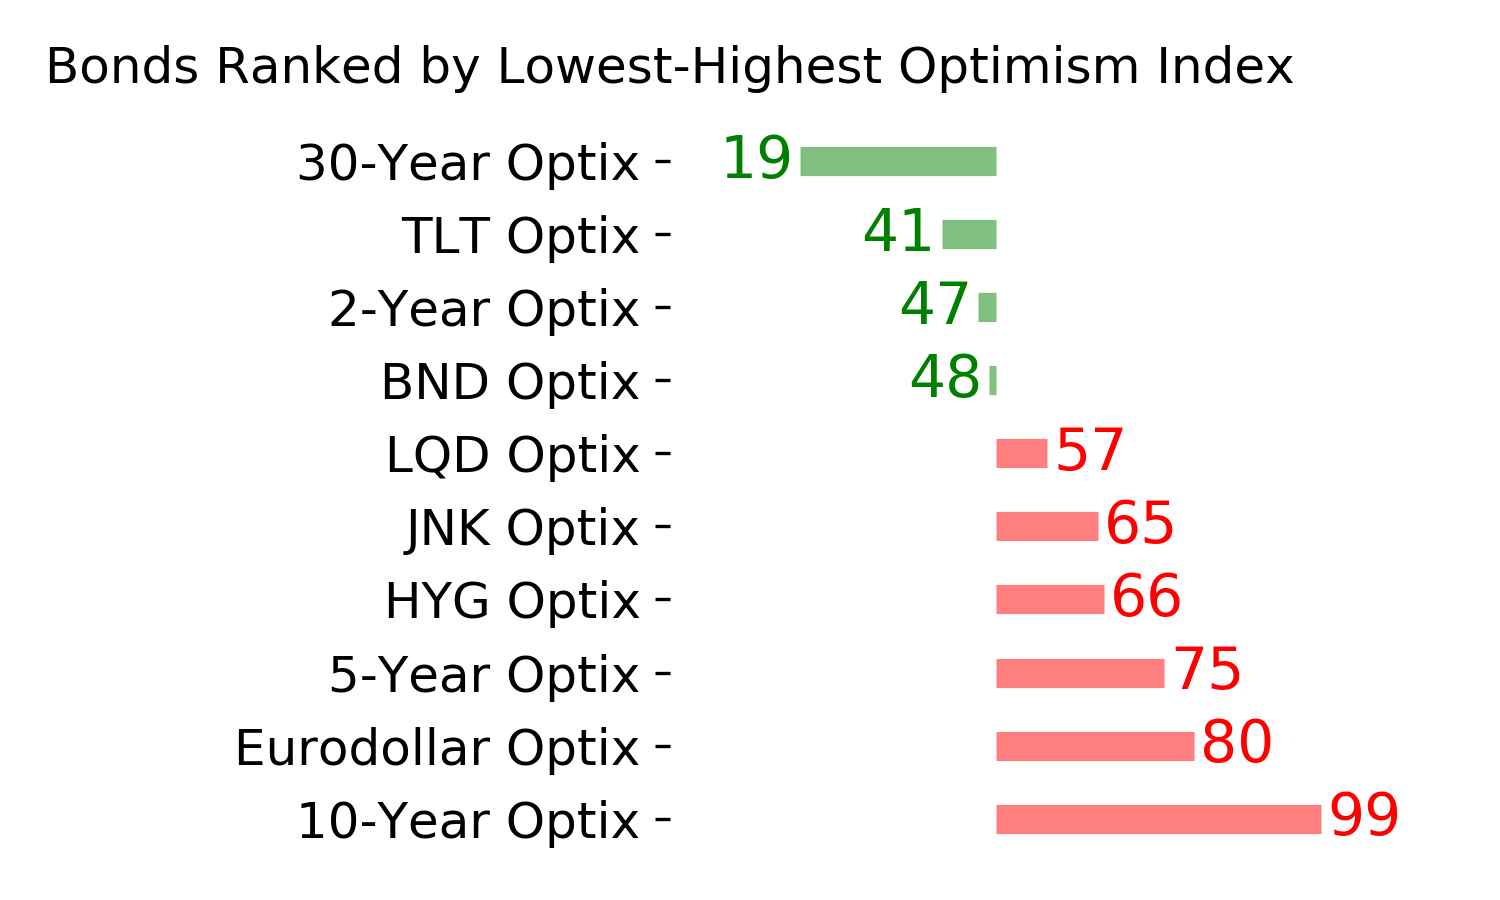
Ranks
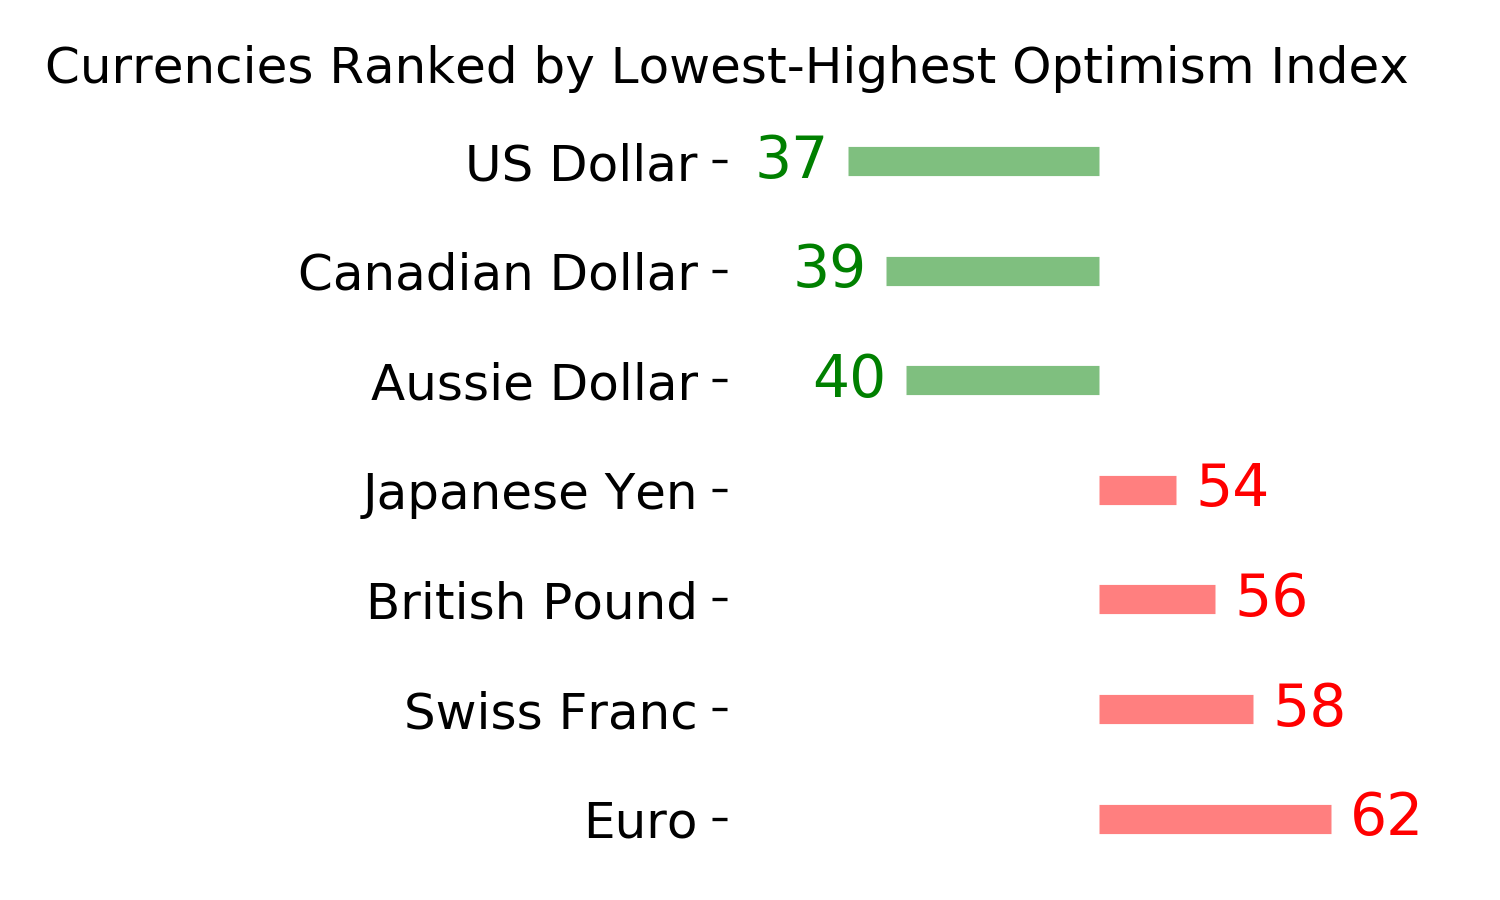
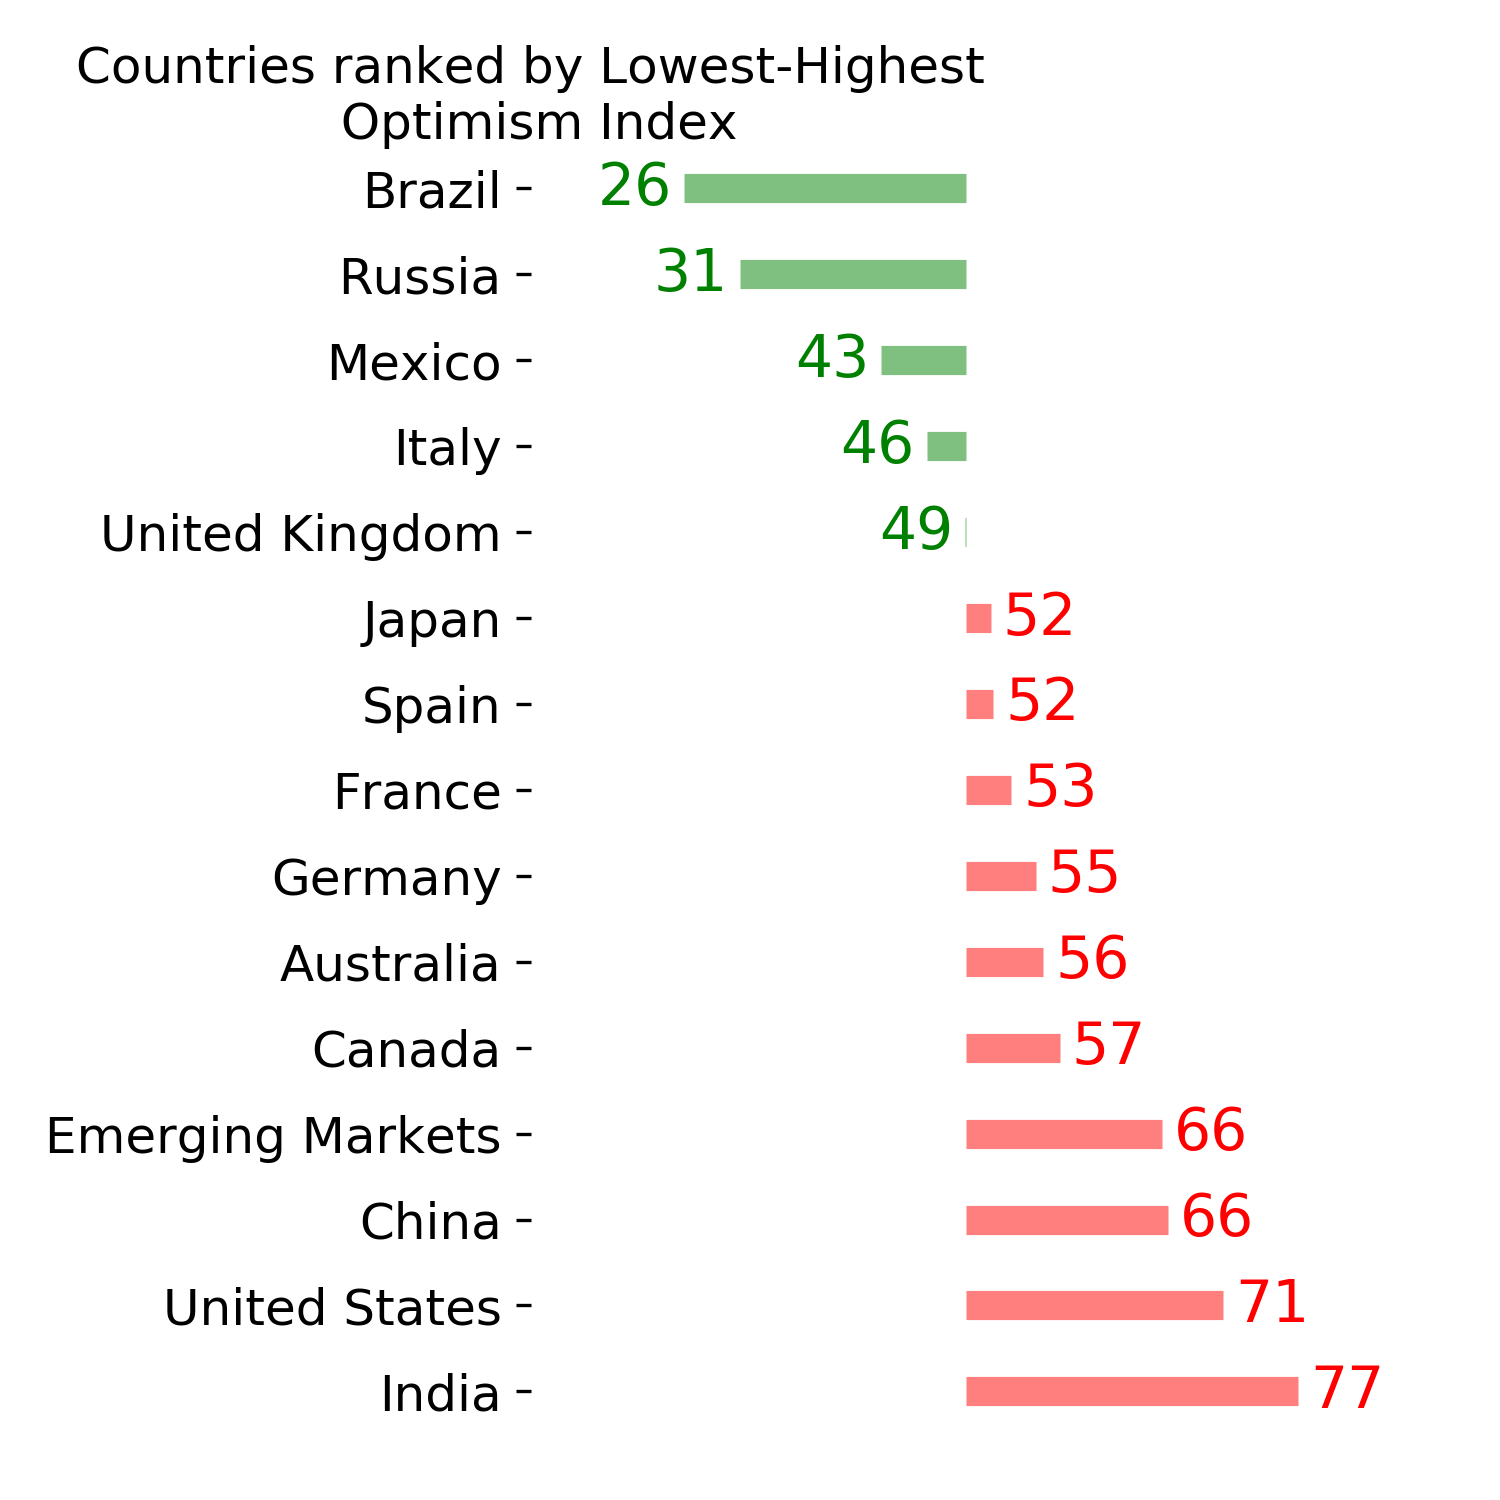
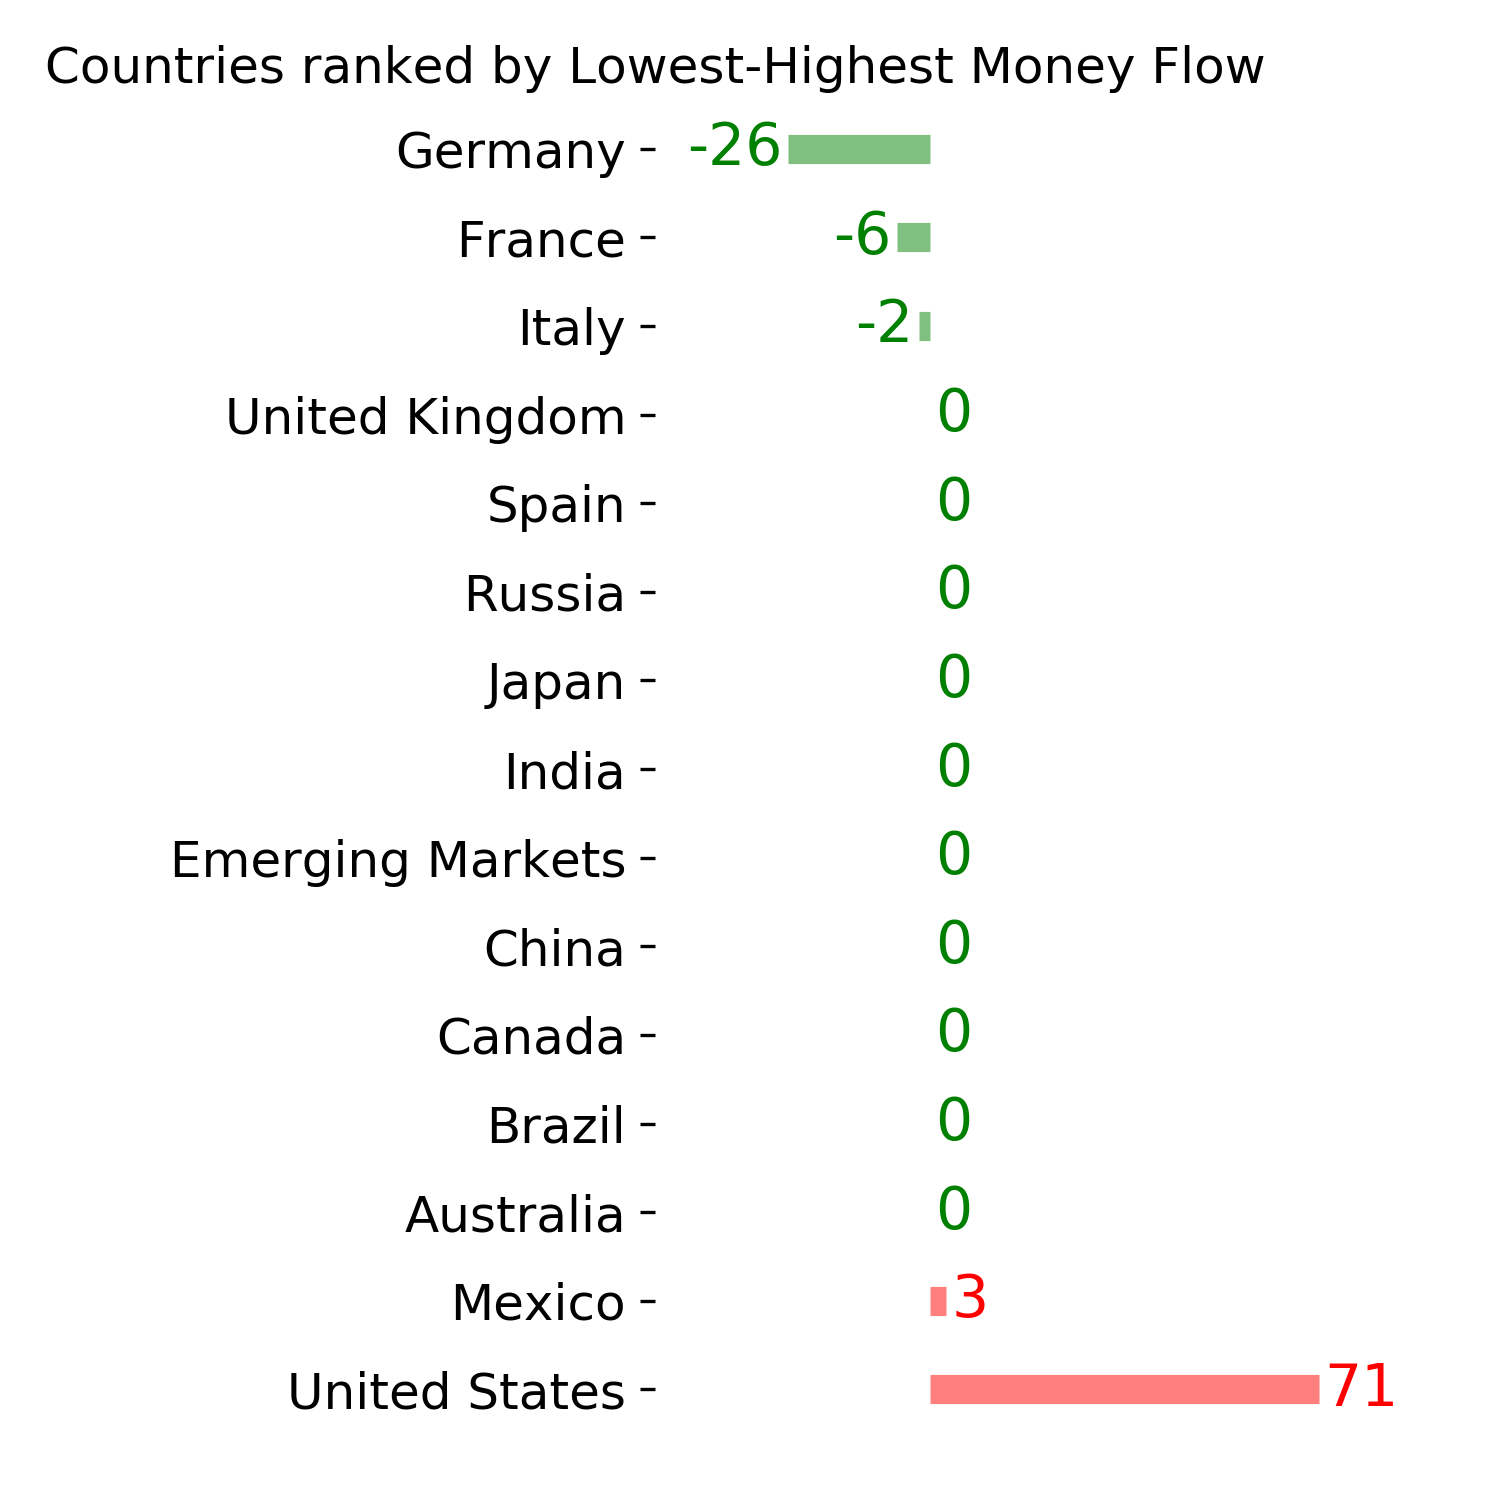
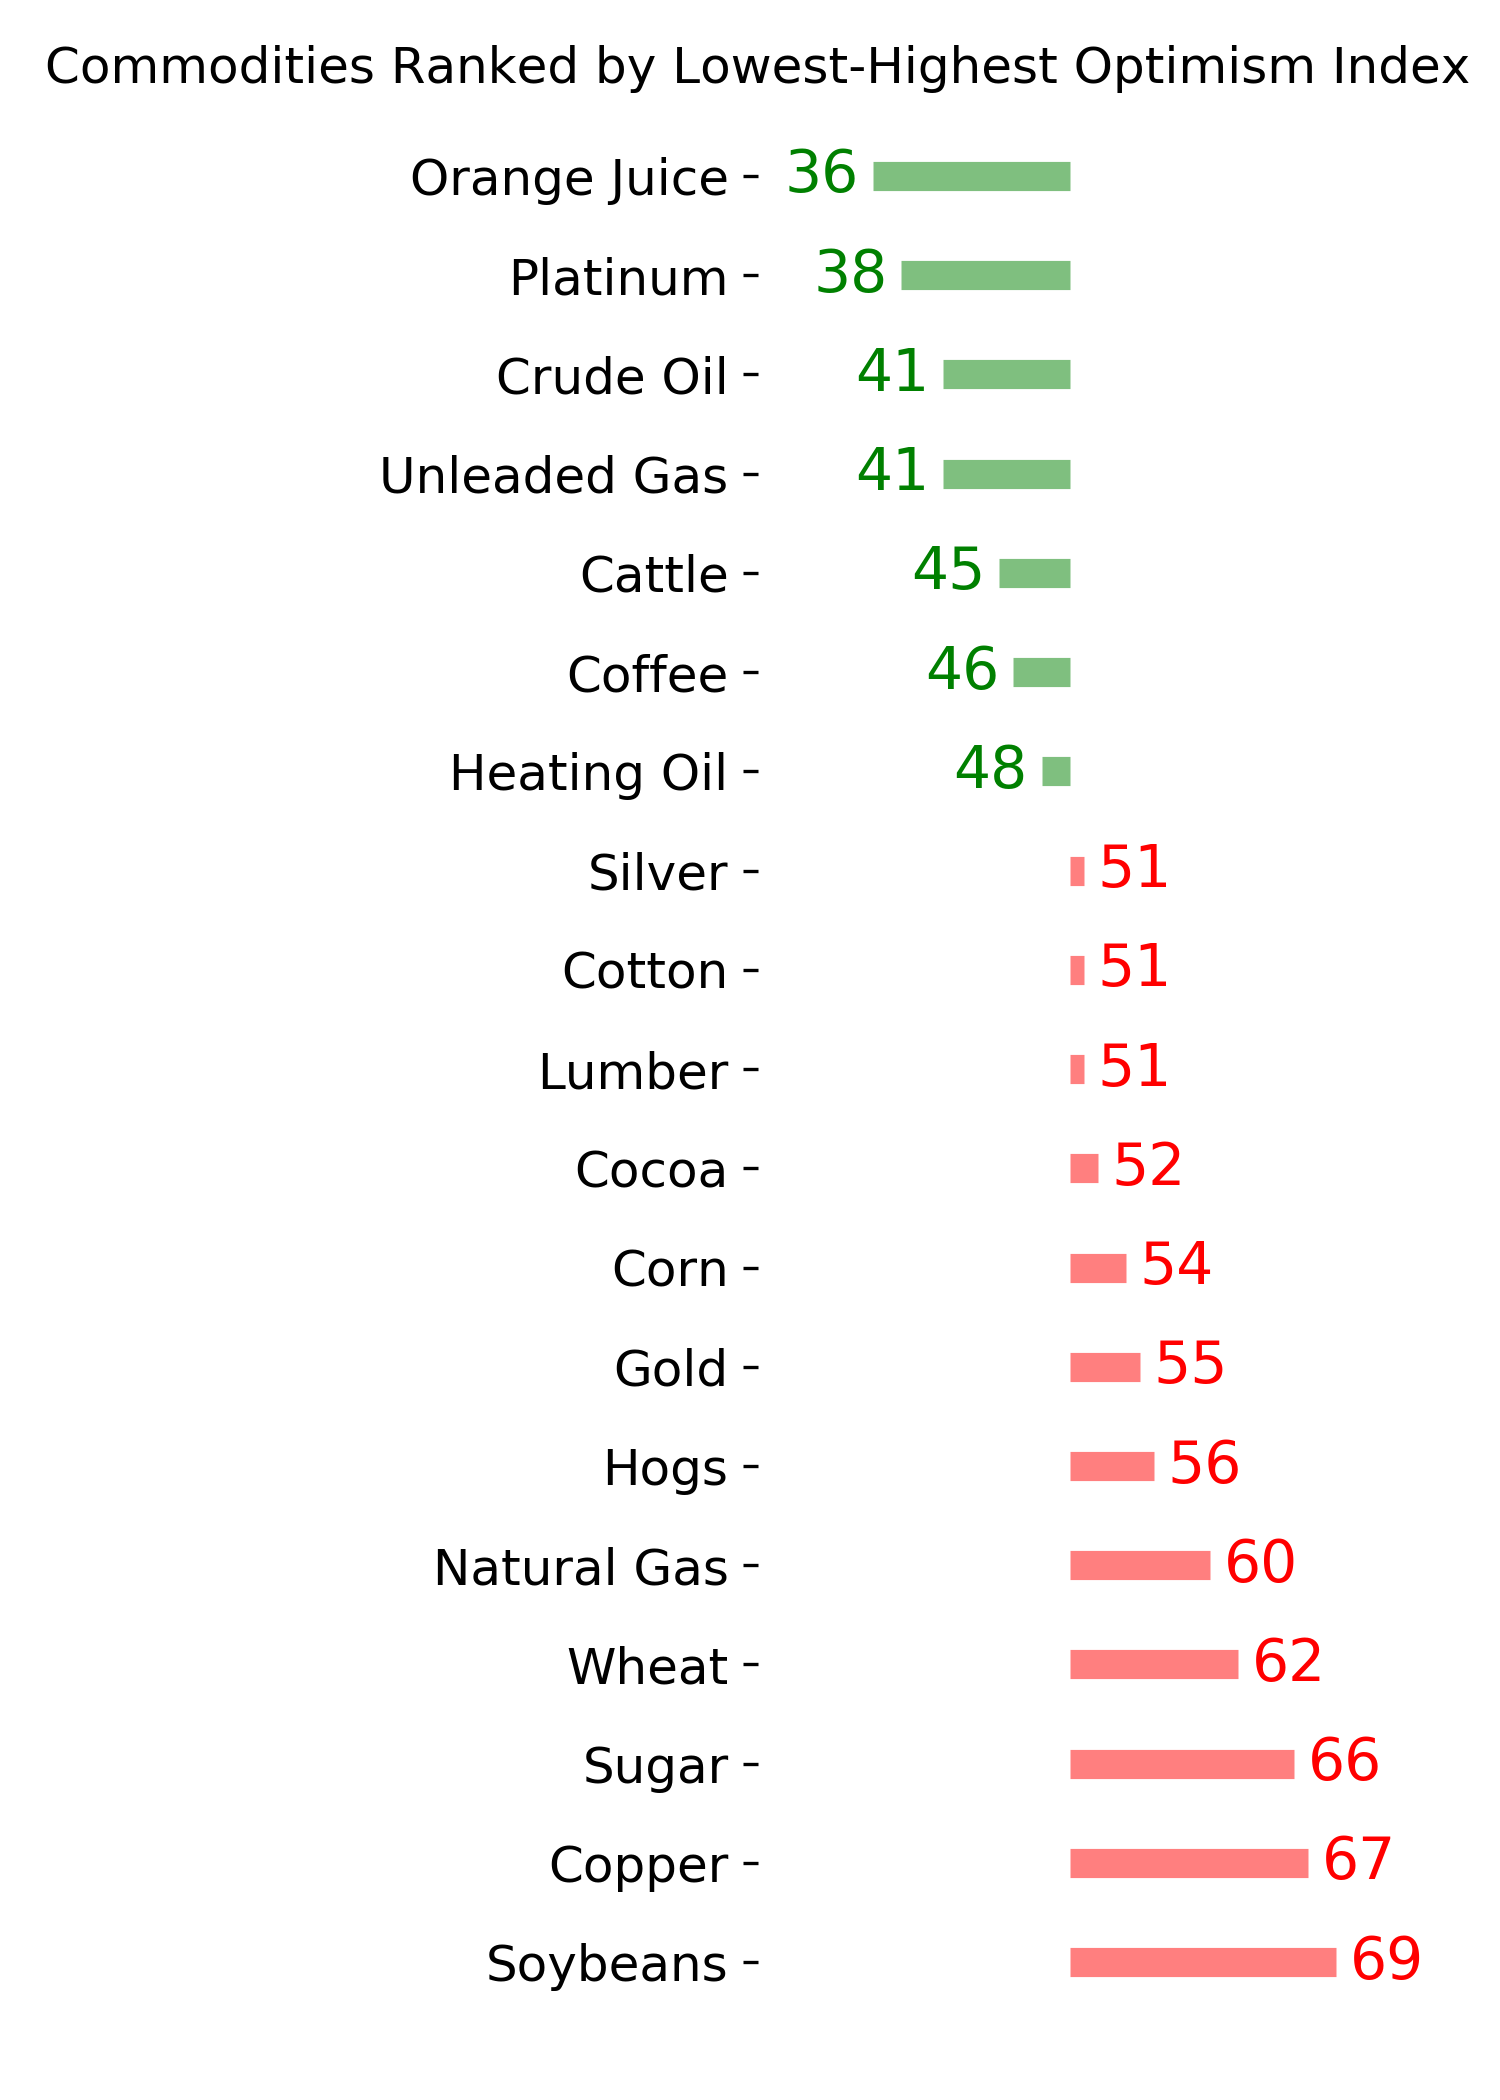
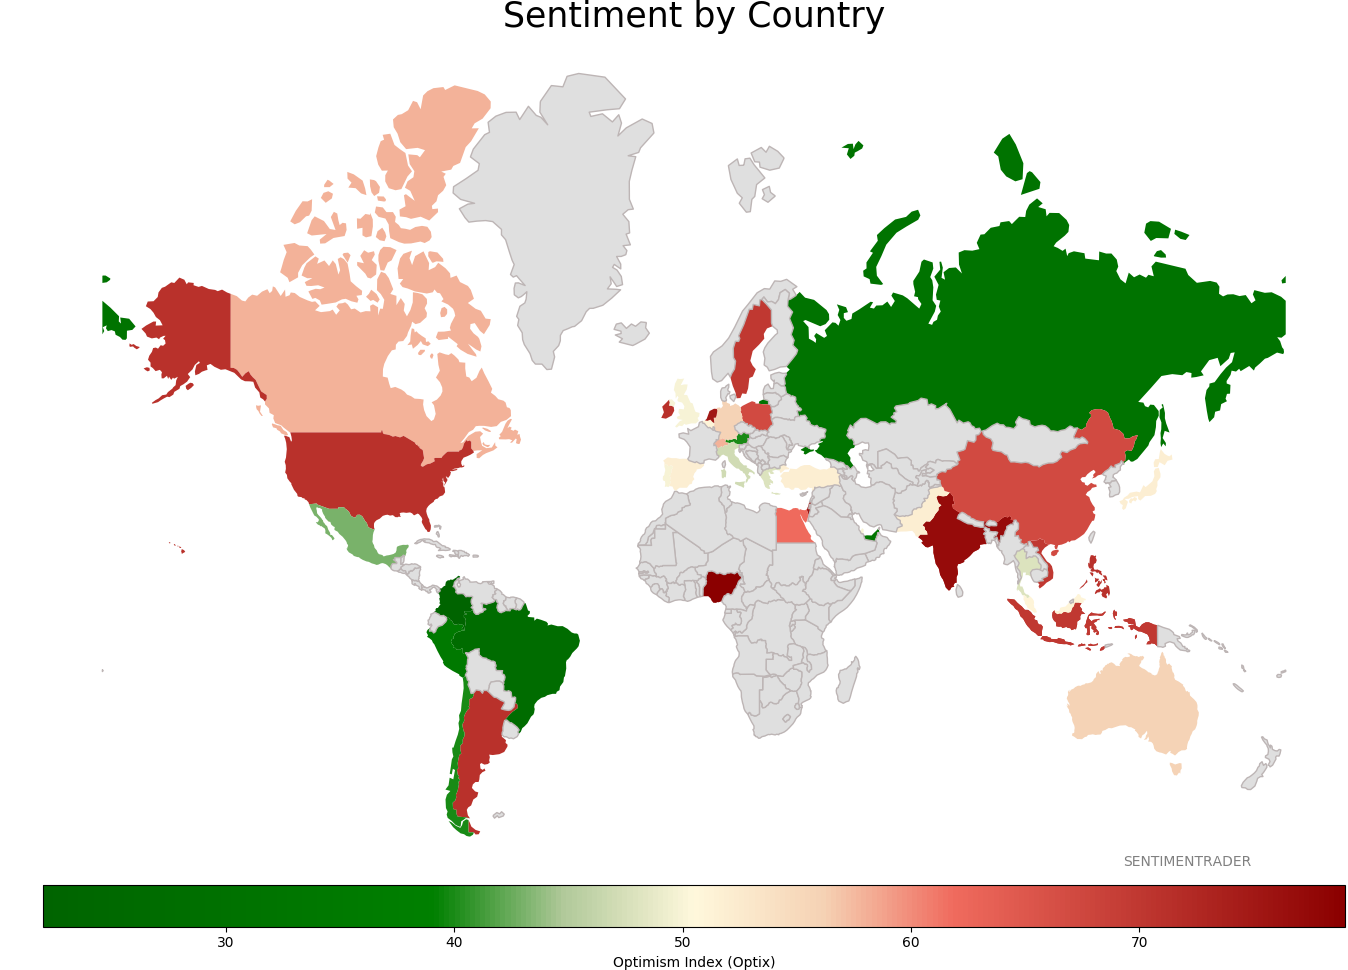
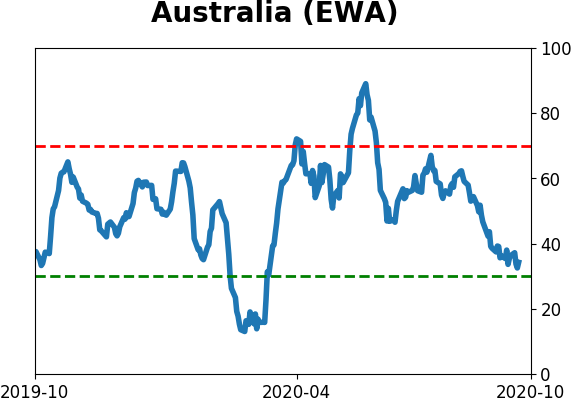
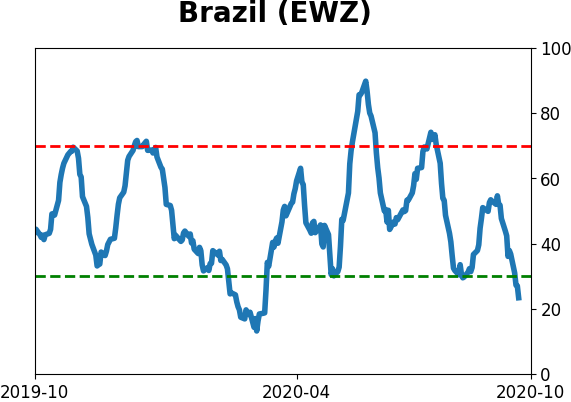
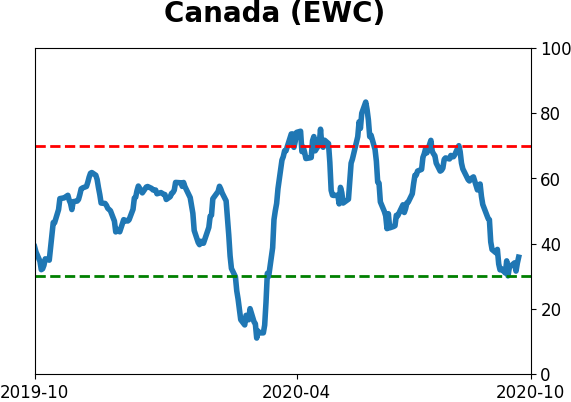
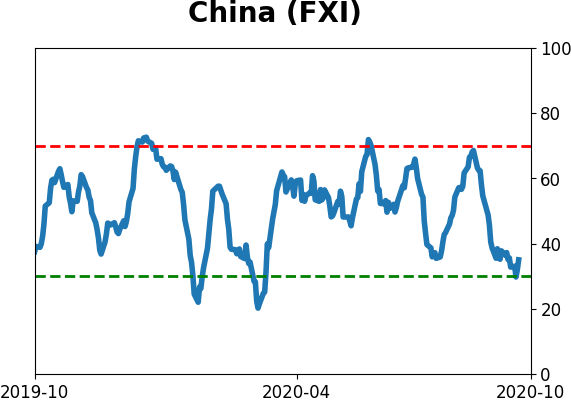
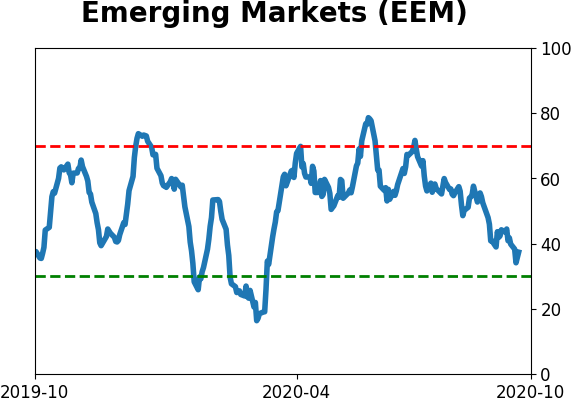
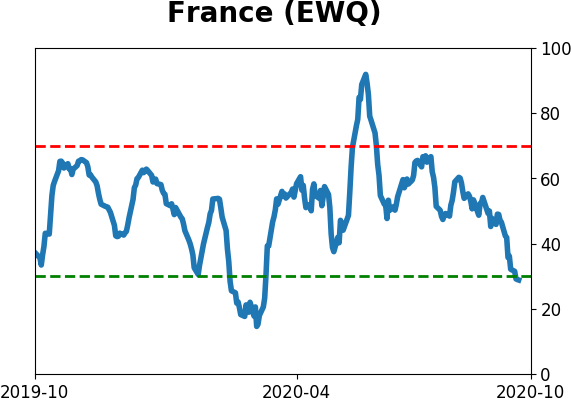
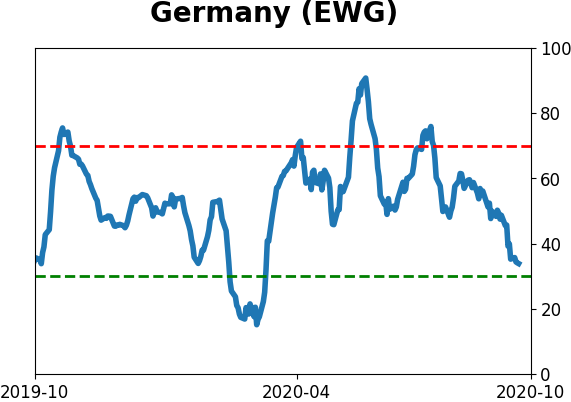
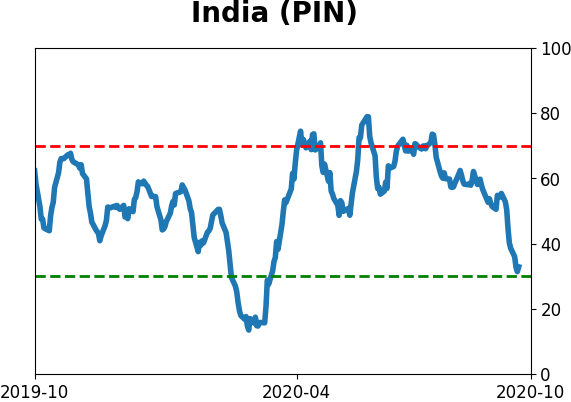
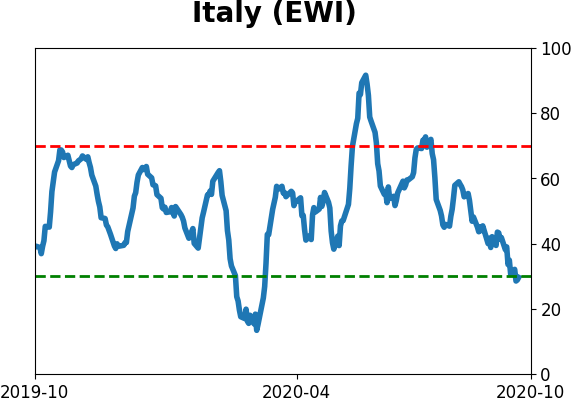
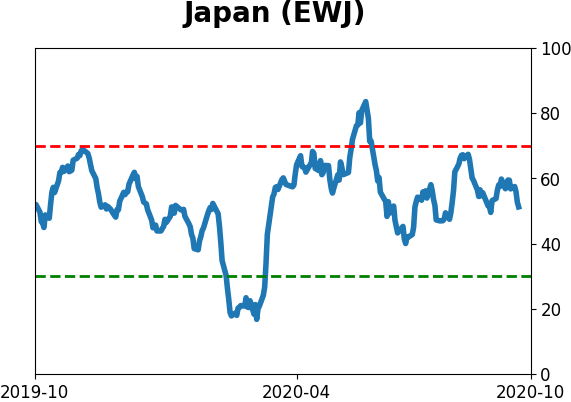
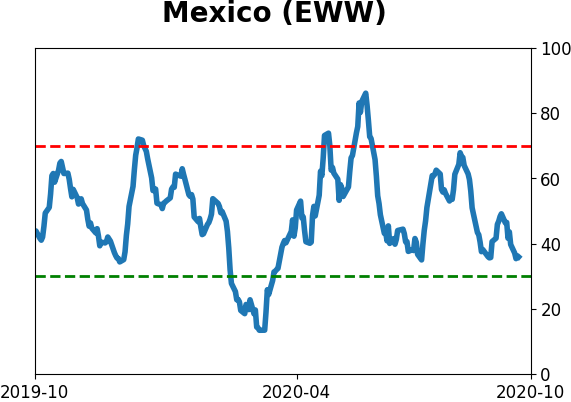
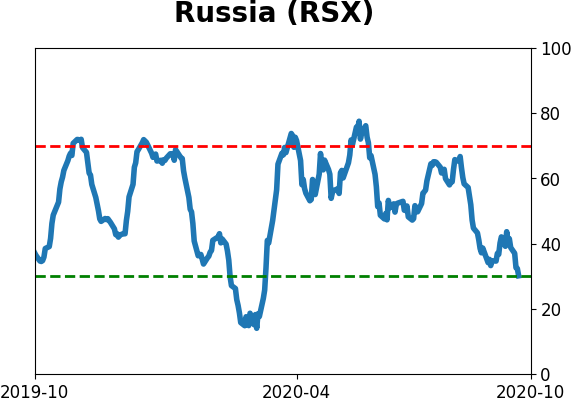
Sentiment Around The World
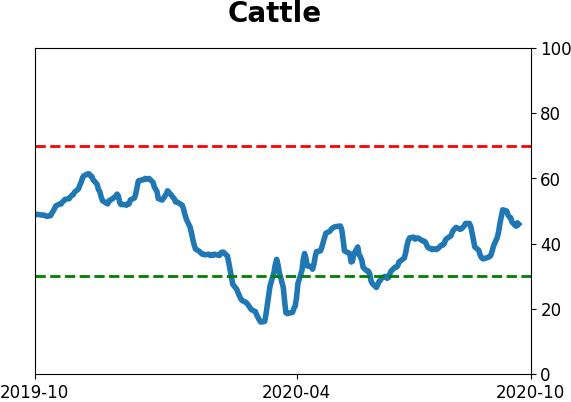
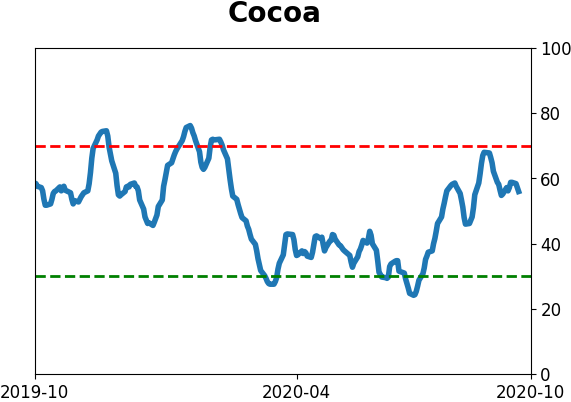
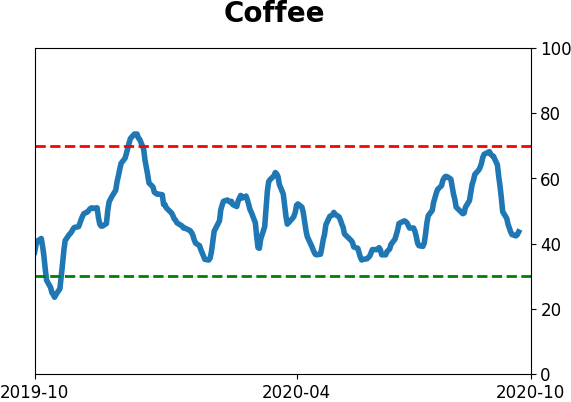
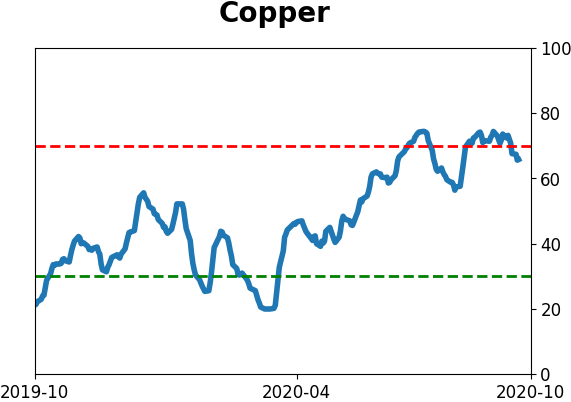
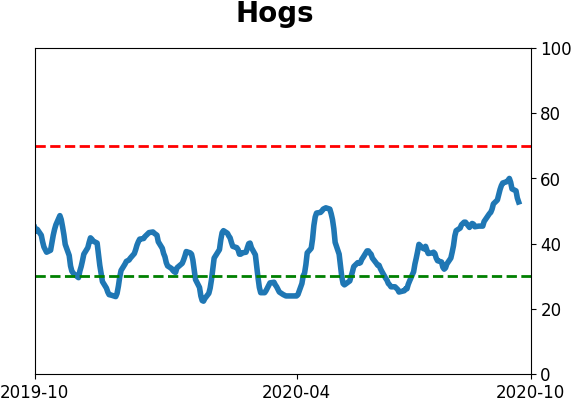
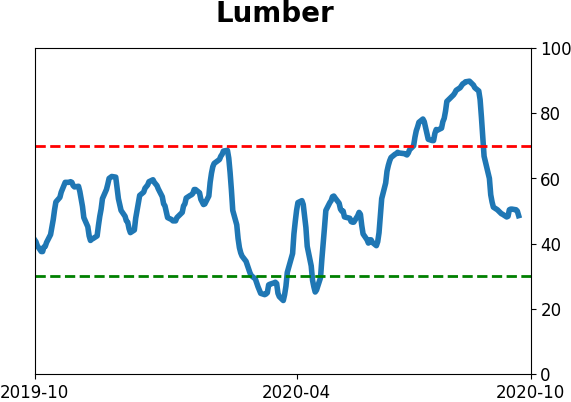
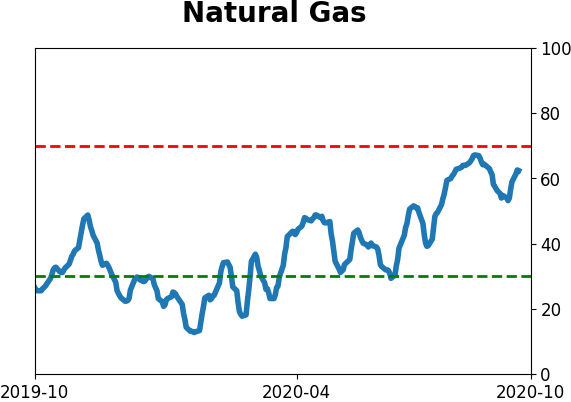
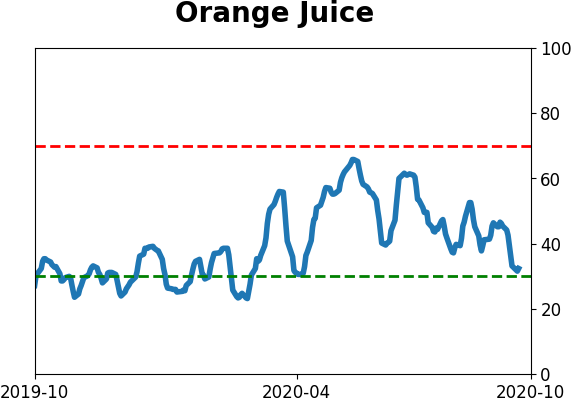
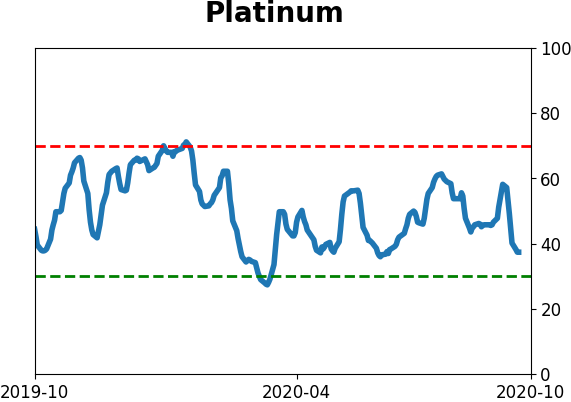
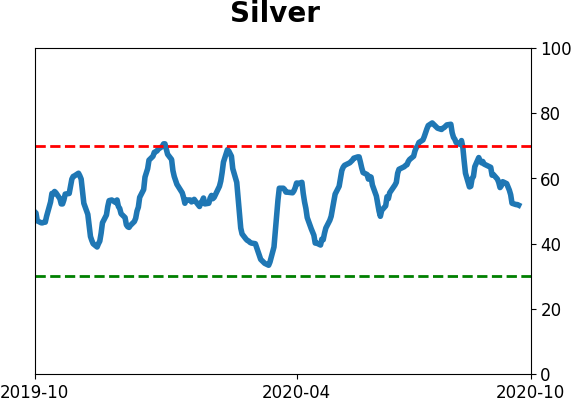
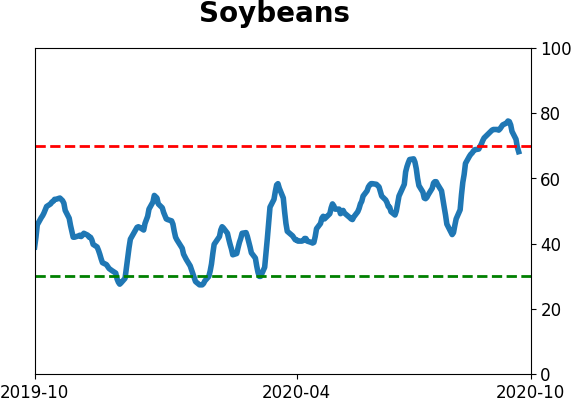
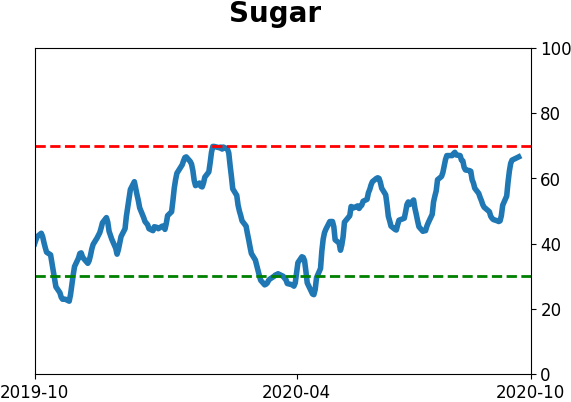
Optimism Index Thumbnails
|
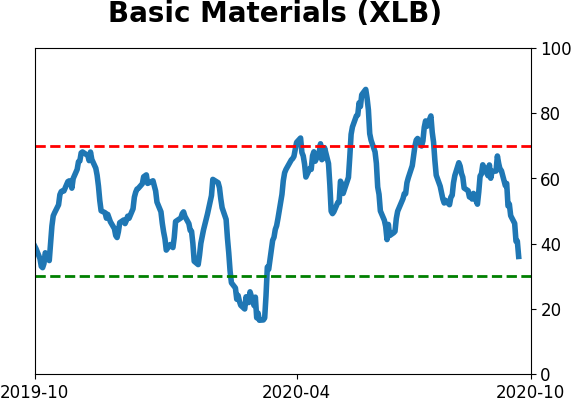
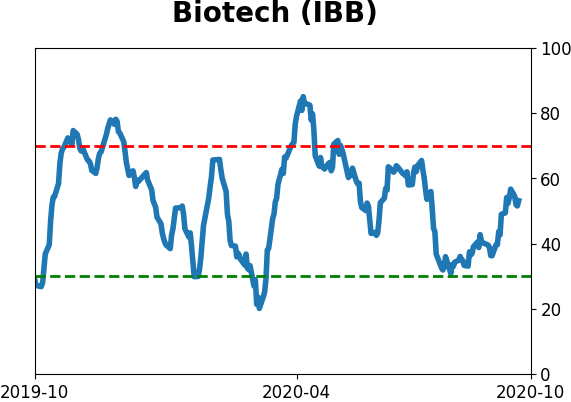
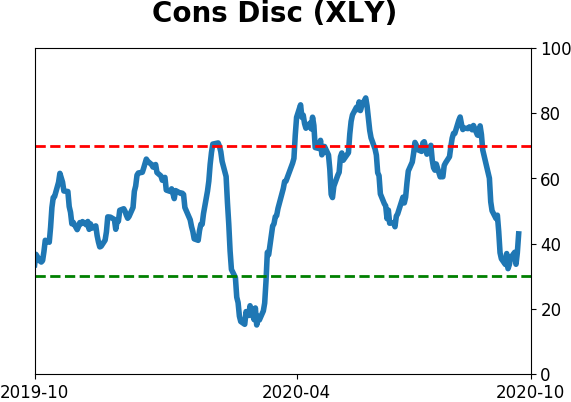
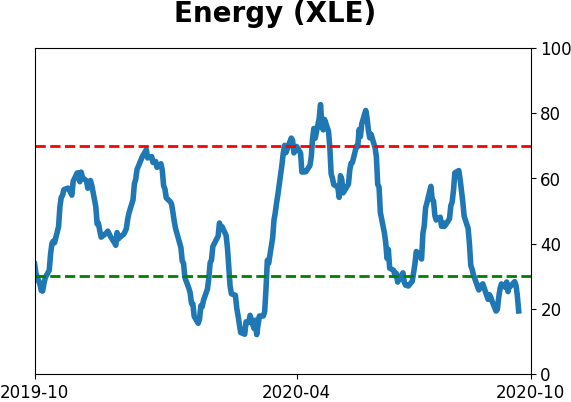
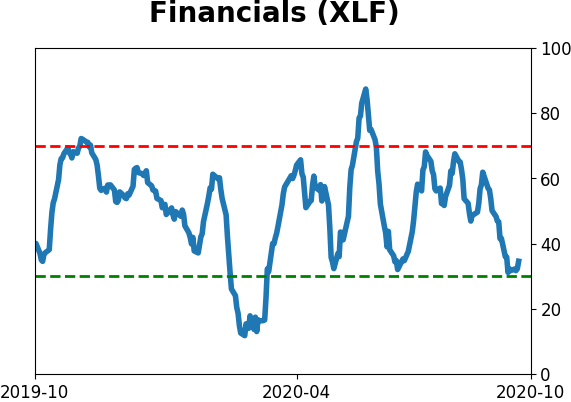
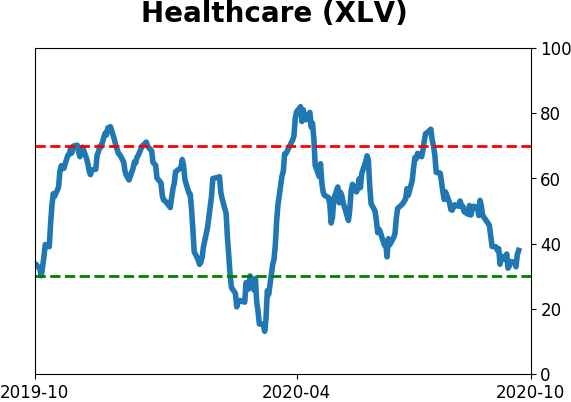
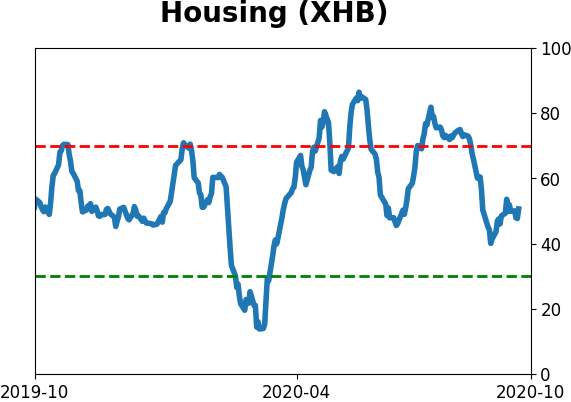
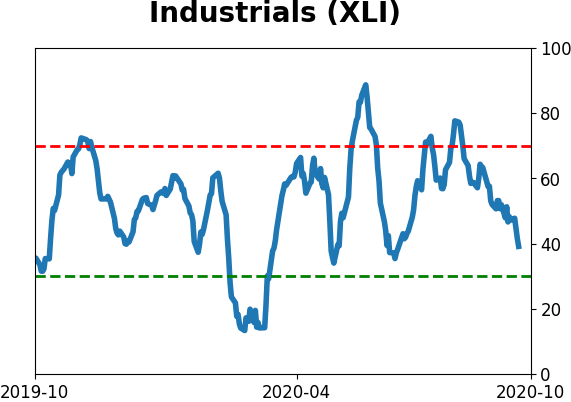
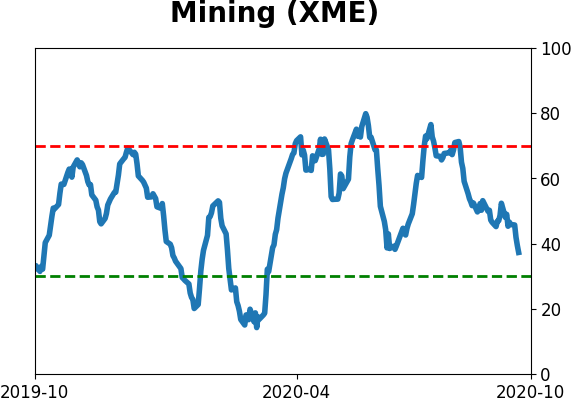
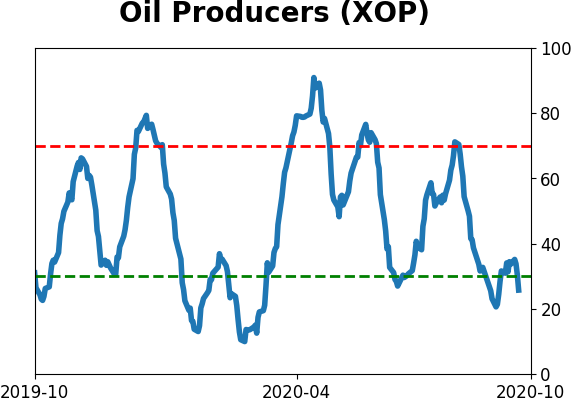
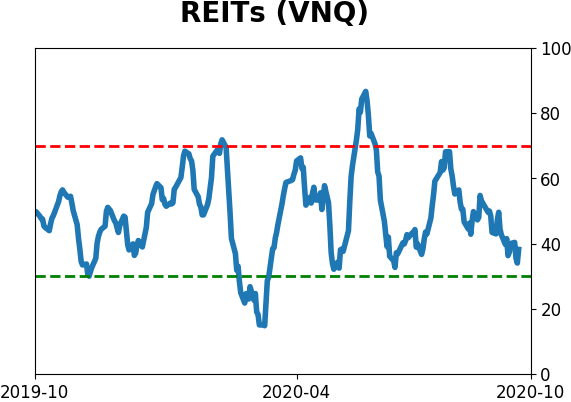
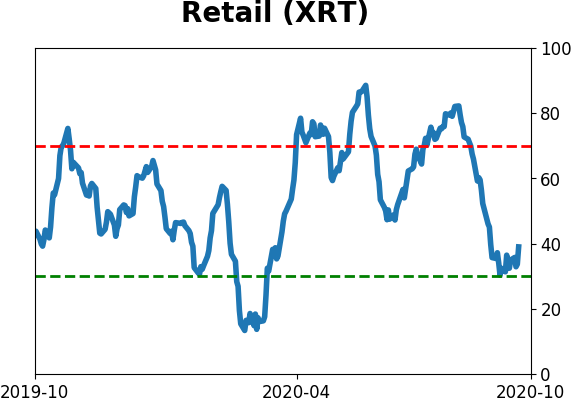
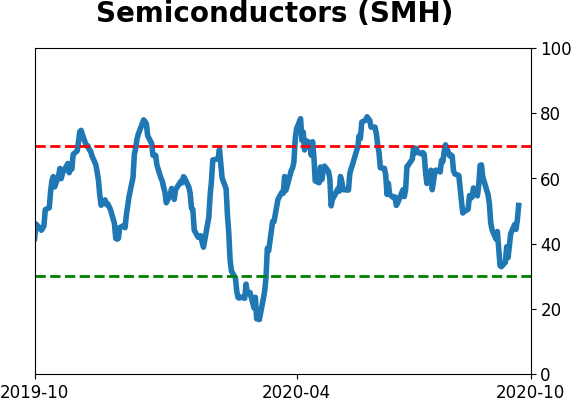
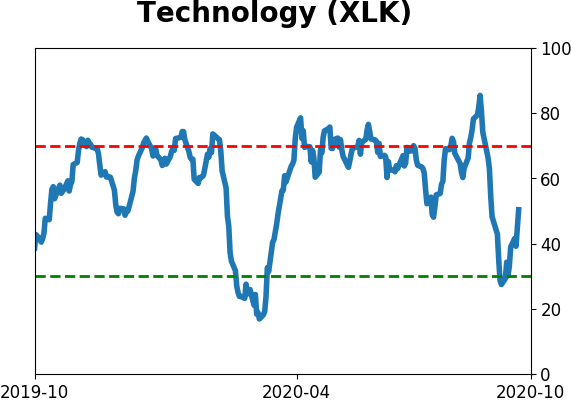
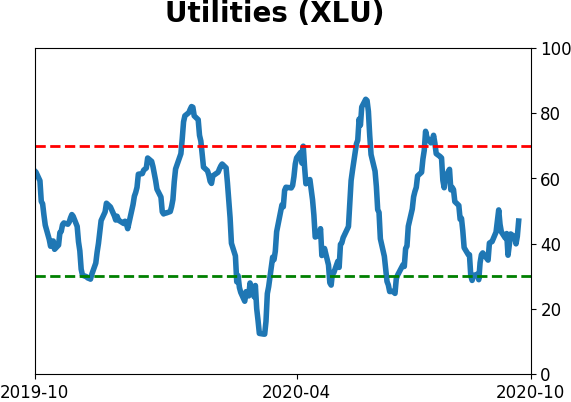
Sector ETF's - 10-Day Moving Average
|
|
|
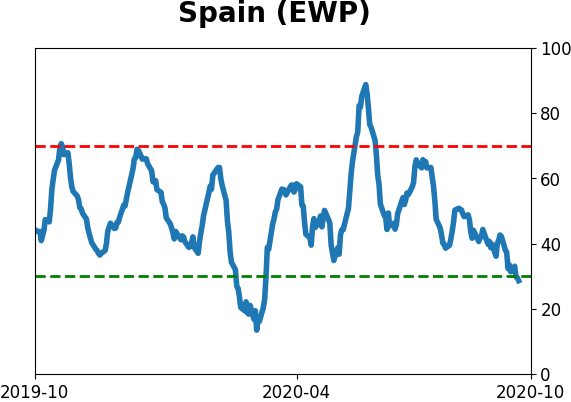
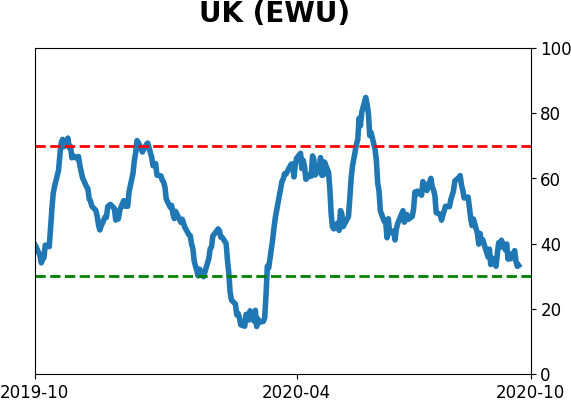
Country ETF's - 10-Day Moving Average
|
|
|
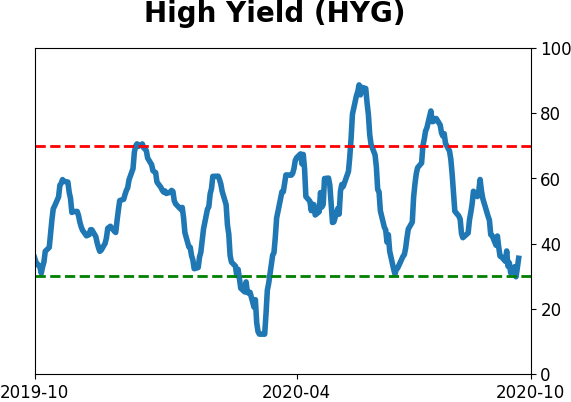
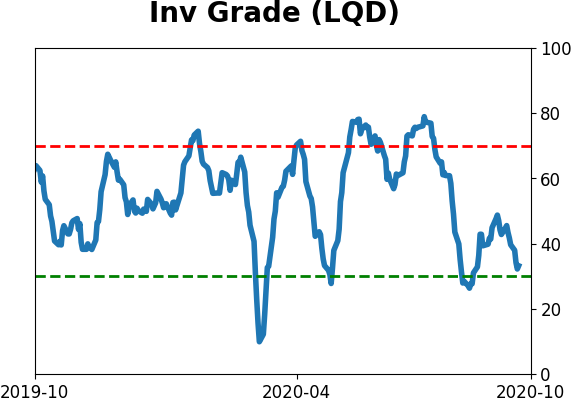
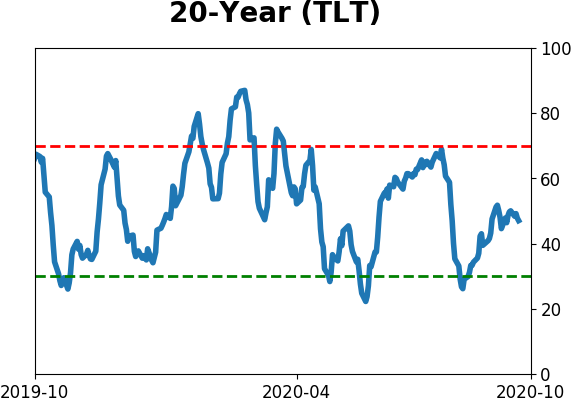
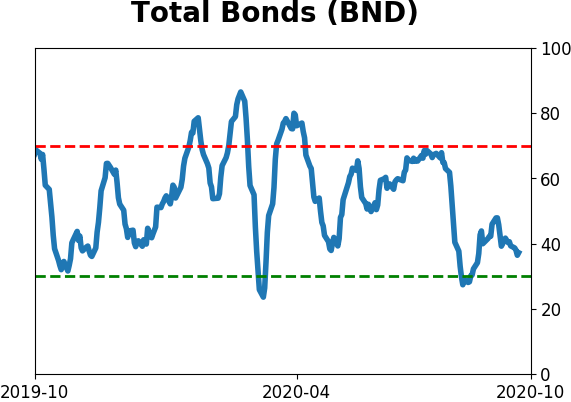
Bond ETF's - 10-Day Moving Average
|
|
|
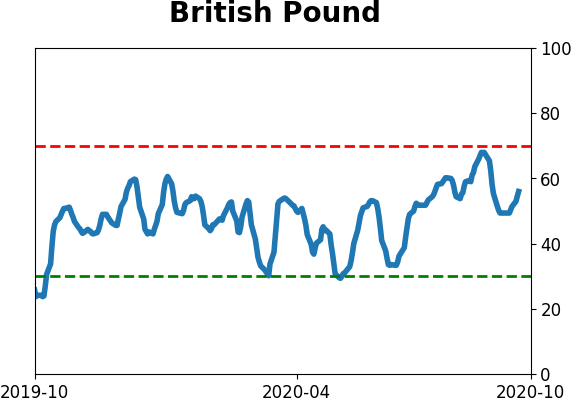
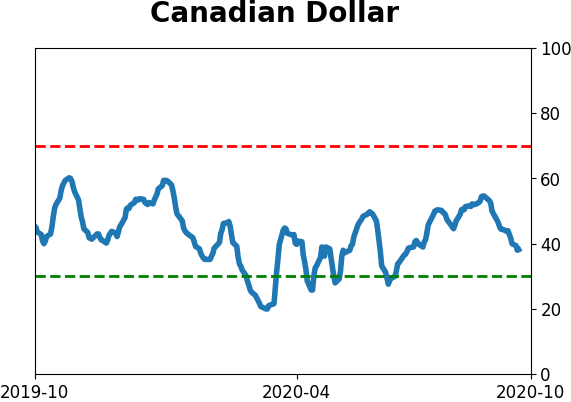
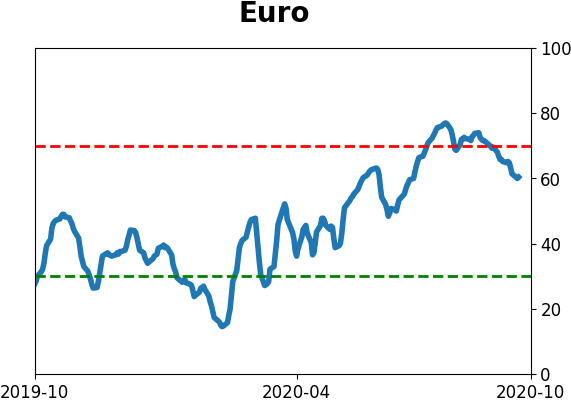
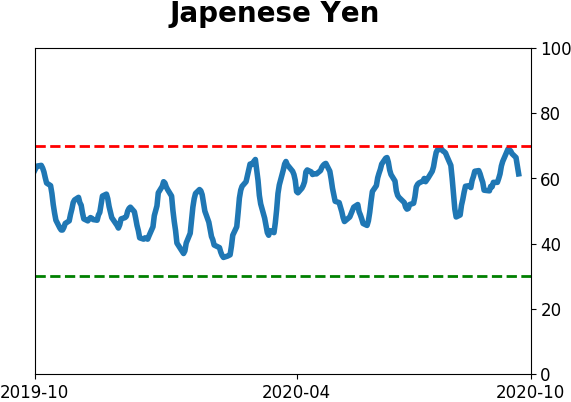
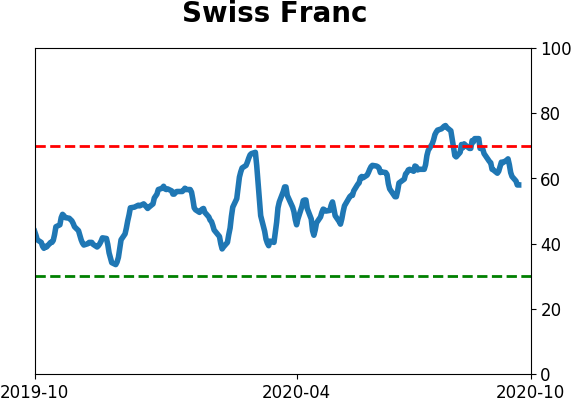
Currency ETF's - 5-Day Moving Average
|
|
|
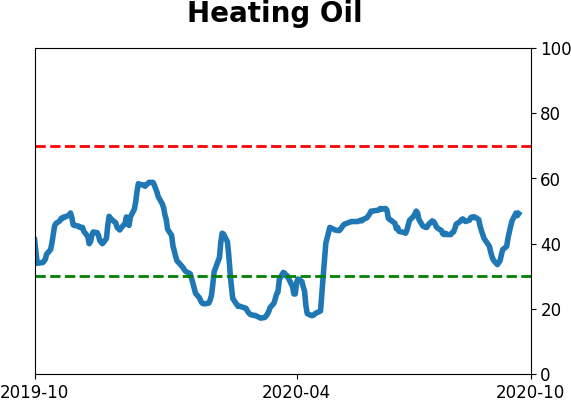
Commodity ETF's - 5-Day Moving Average
|
|