Headlines
|
|
The Sentiment Cycle has moved out of the Discouragement phase:
When we take a more rigorous look at the typical Sentiment Cycle, we can see that stocks never really endured the Discouragement phase, rather investors moved right into Returning Confidence. That has positive implications for the medium-term, but the long-term is questionable.
Bottom Line:
- Weight of the evidence has turned mostly neutral, with offsetting extremes in some measures along with a neutral market environment
- Dumb Money Confidence has come down to neutral territory though unrivaled options speculation is still a big worry
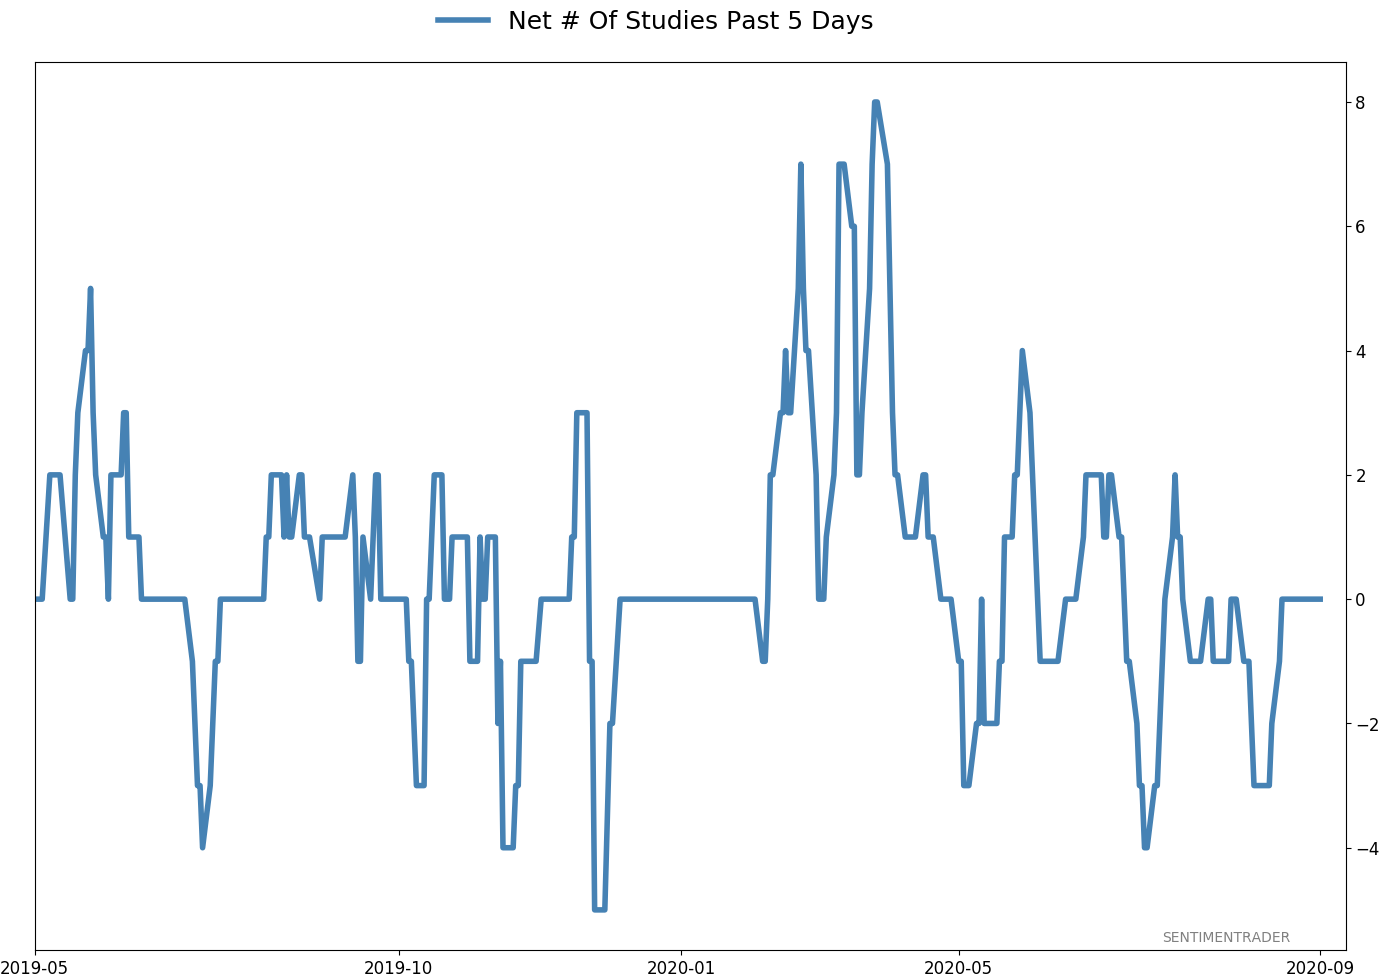
- Active Studies show a heavy positive skew over the longer-term mostly thanks to the March - May breadth thrusts, recoveries, and trend changes
- Signs of extremely skewed preference for tech stocks neared exhaustion by late June, especially relative to industrials and financials (here and here)
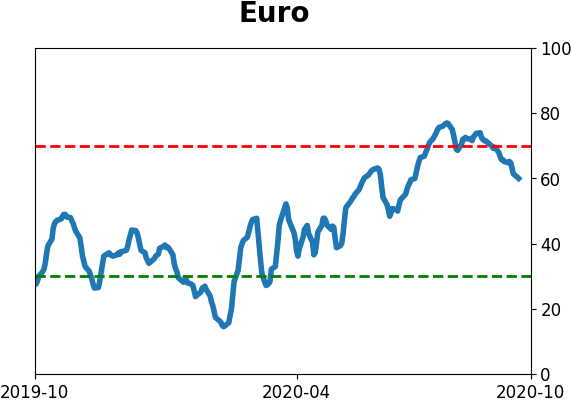
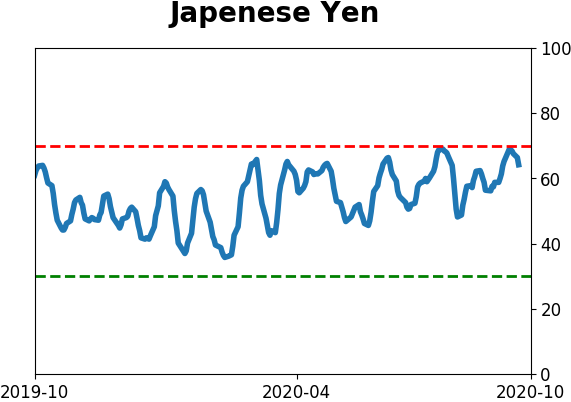
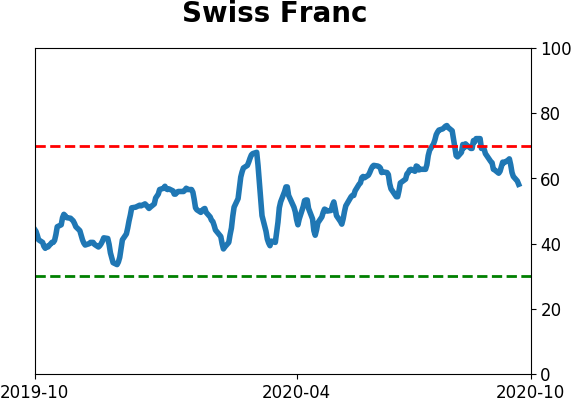
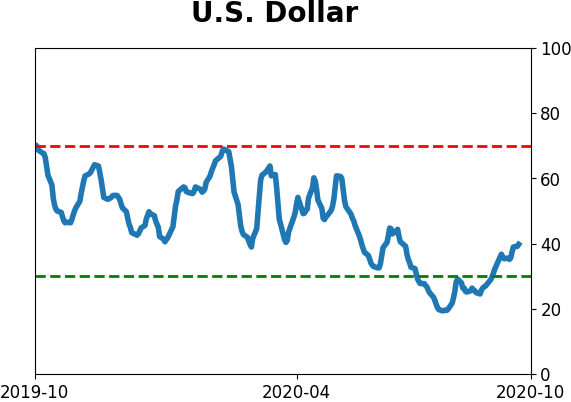
- Other markets seem driven in large part toward sentiment in the dollar, which is nearing the point that other medium-term rallies have stalled
|
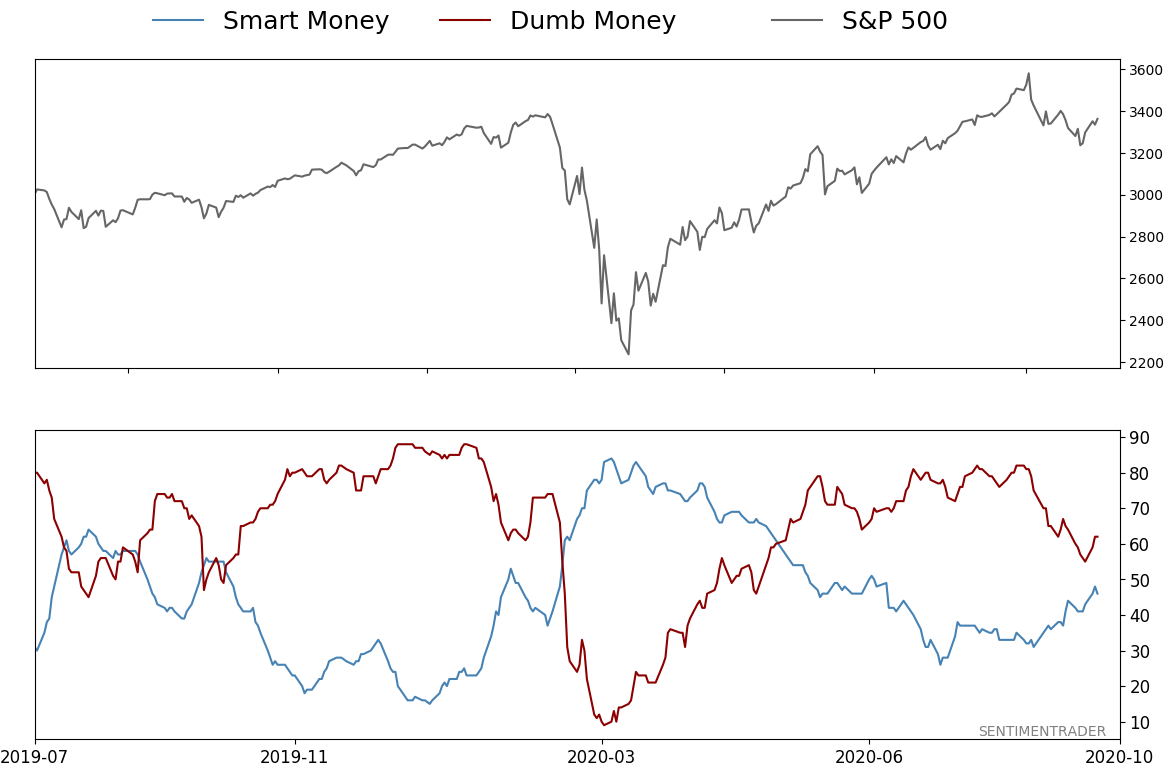
Smart / Dumb Money Confidence
|
Smart Money Confidence: 46%
Dumb Money Confidence: 62%
|
|
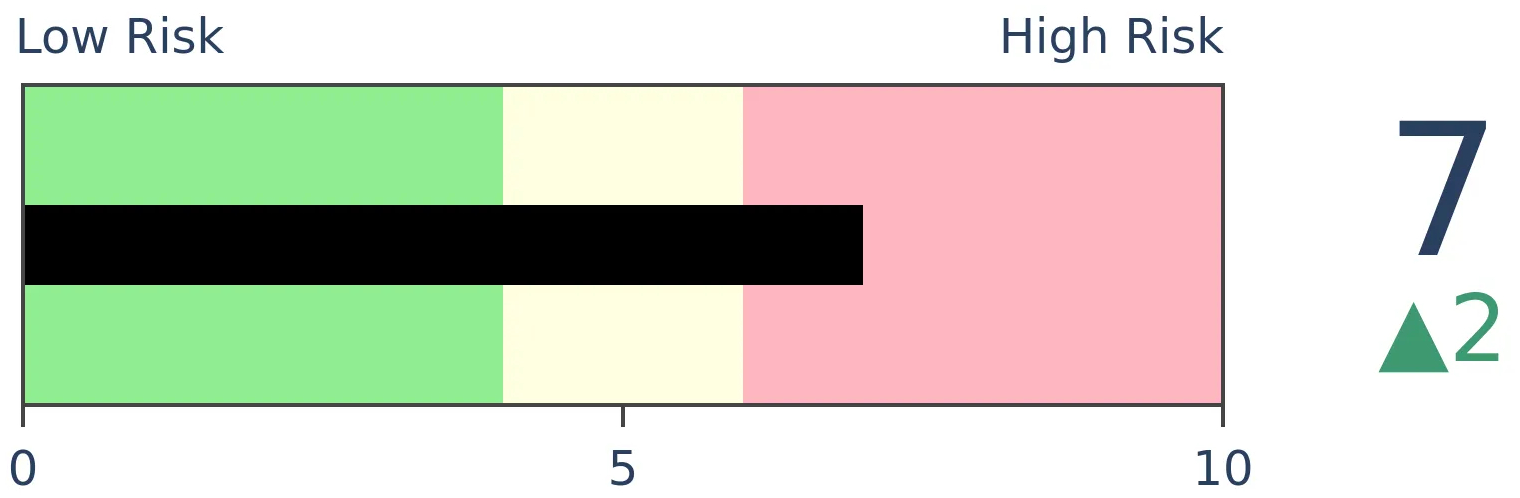
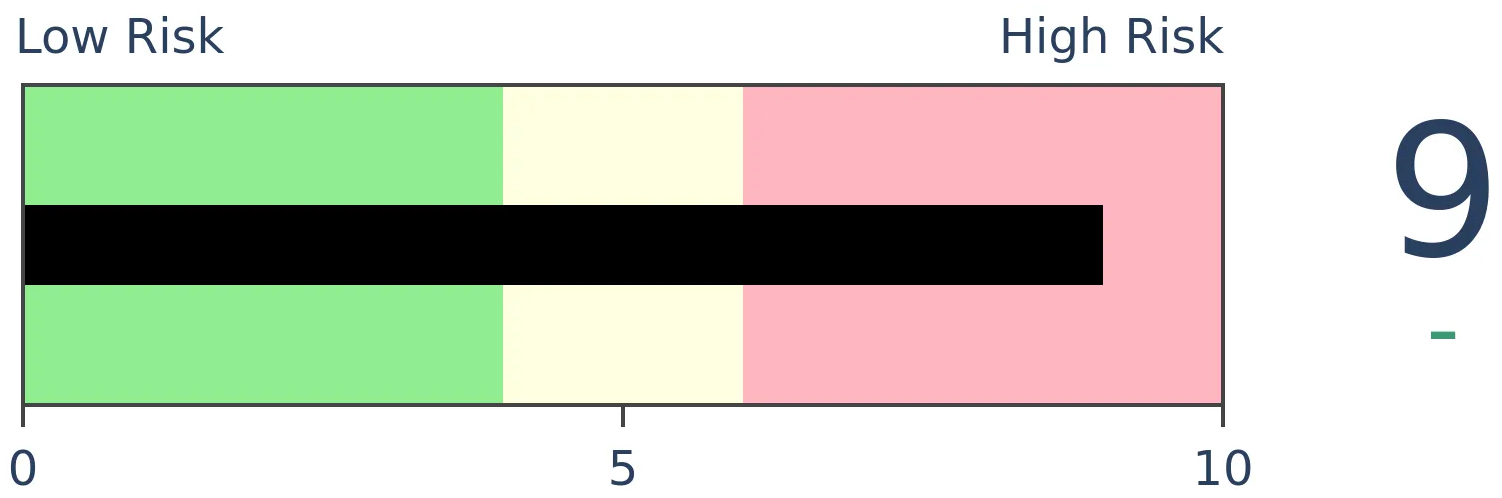
Risk Levels
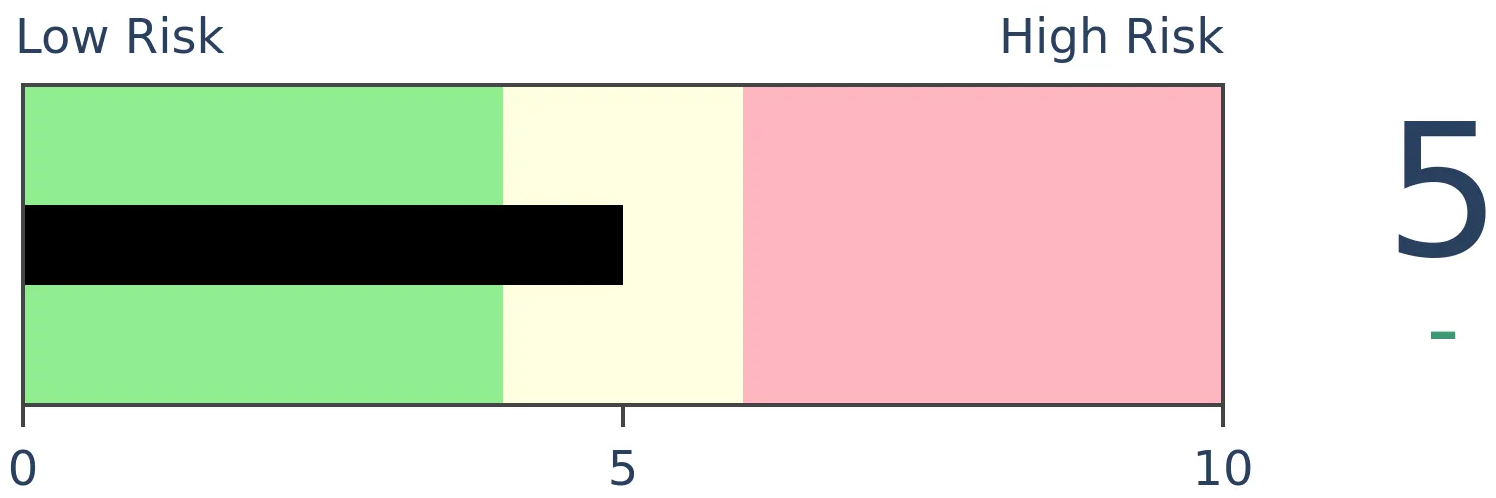
Stocks Short-Term
|
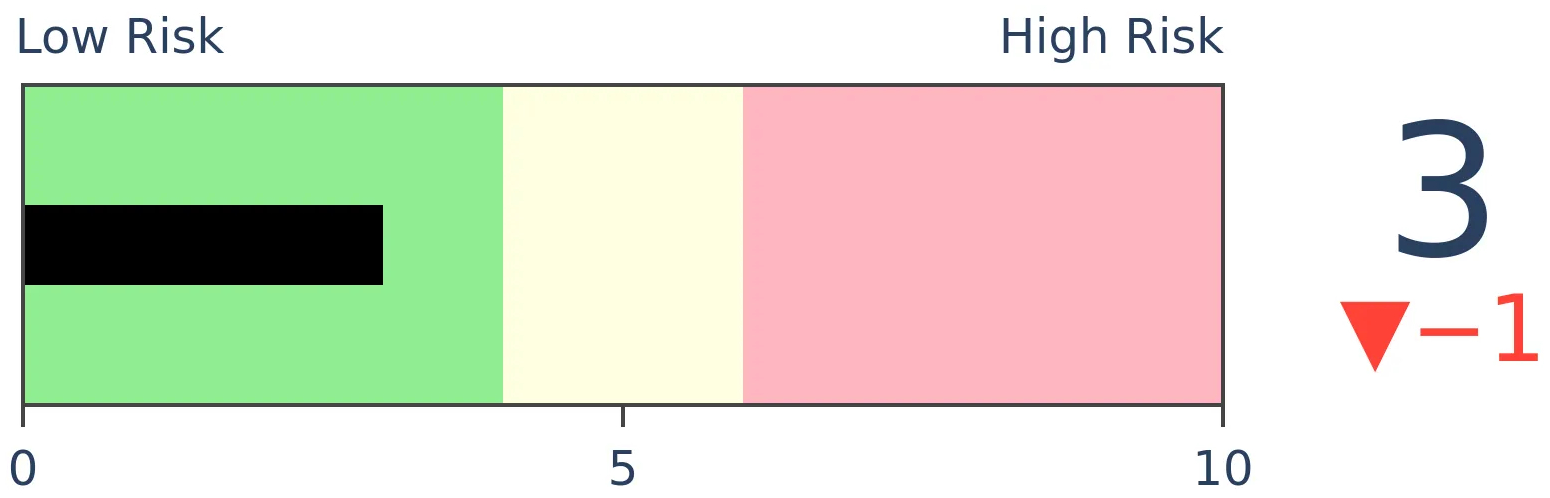
Stocks Medium-Term
|
|
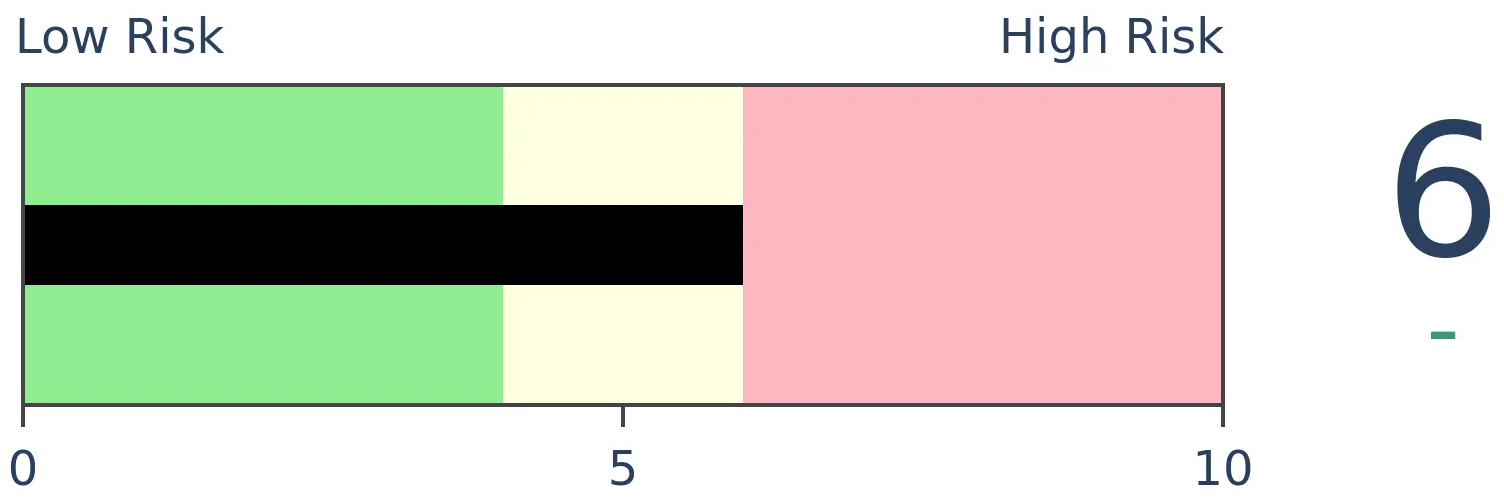
Bonds
|
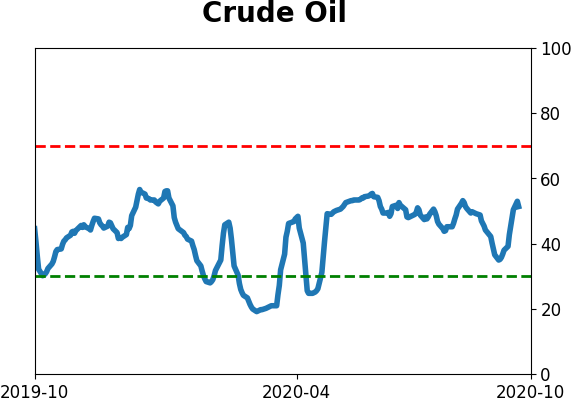
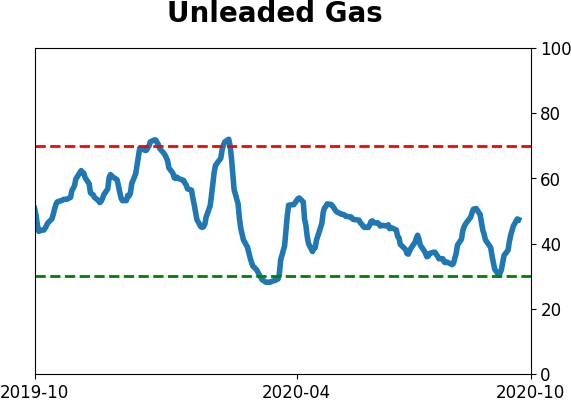
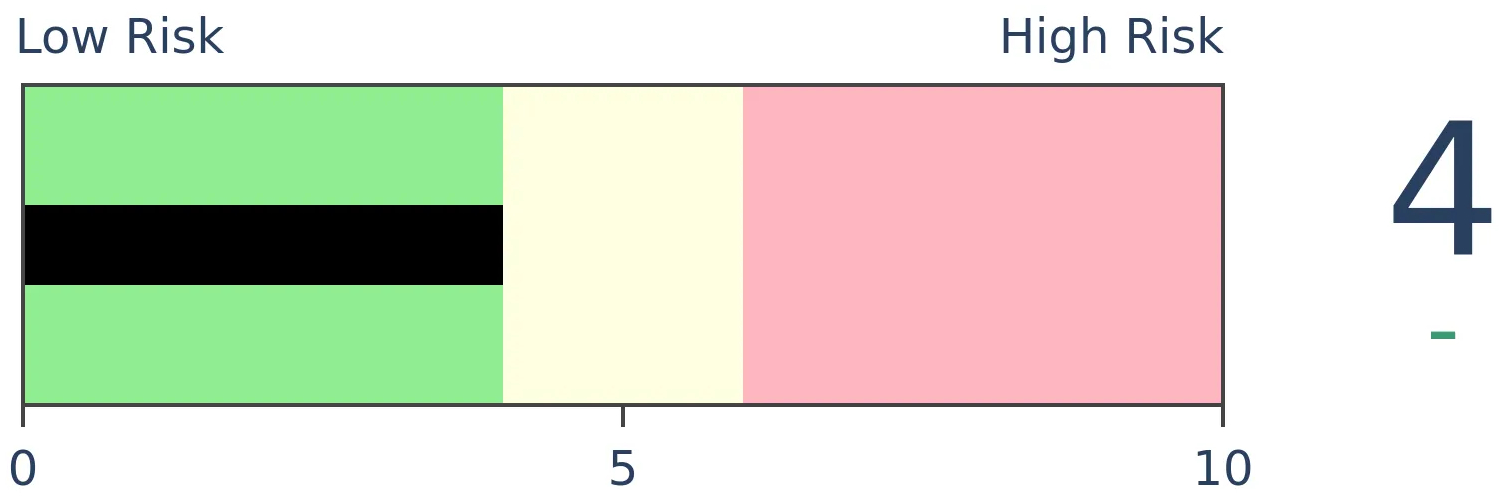
Crude Oil
|
|
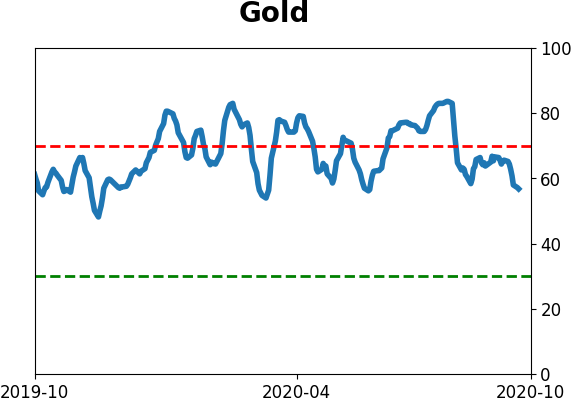
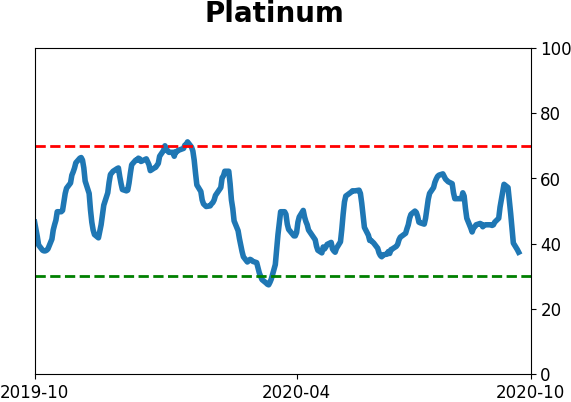
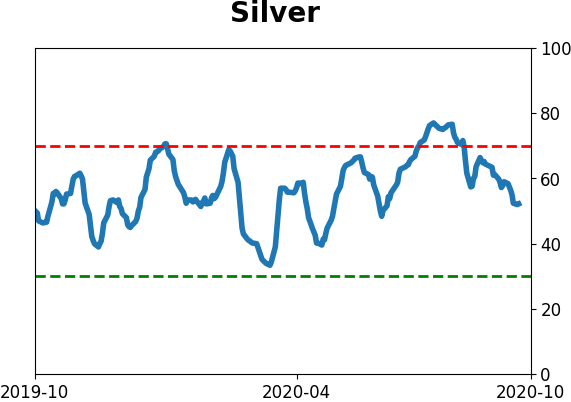
Gold
|
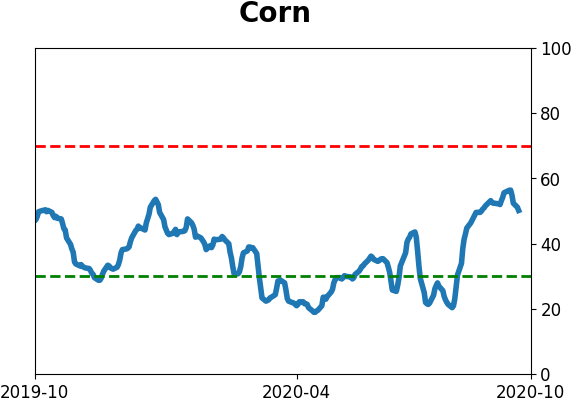
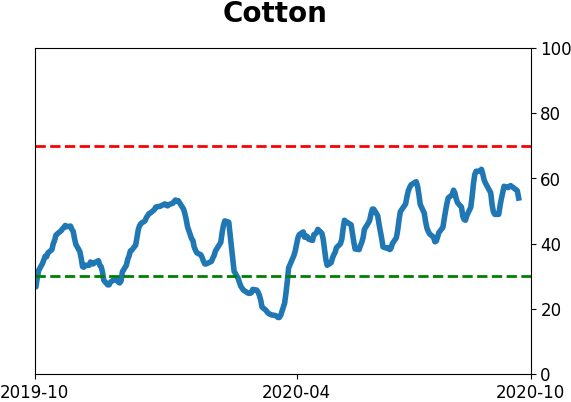
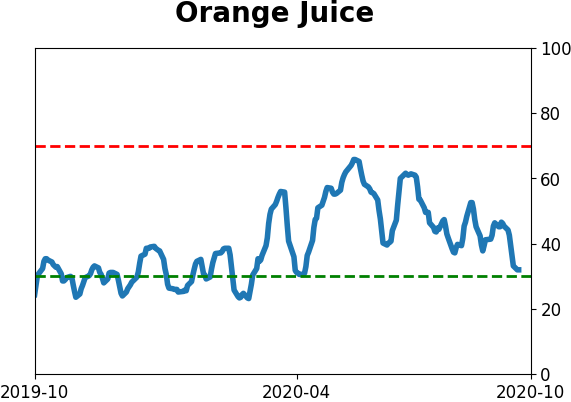
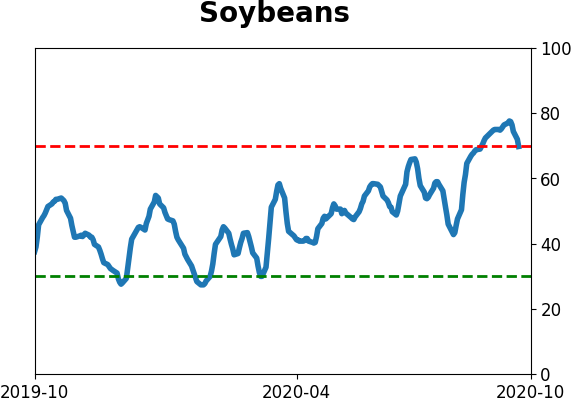
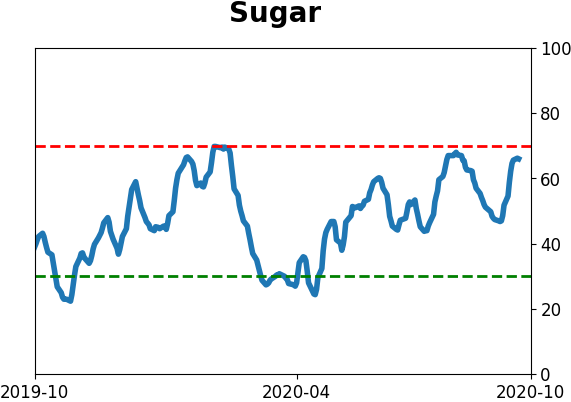
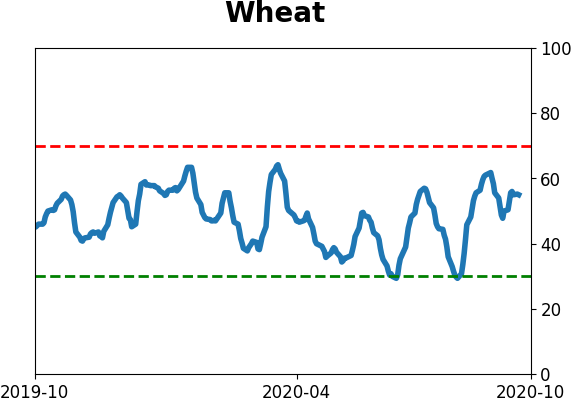
Agriculture
|
|
Research
BOTTOM LINE
When we take a more rigorous look at the typical Sentiment Cycle, we can see that stocks never really endured the Discouragement phase, rather investors moved right into Returning Confidence. That has positive implications for the medium-term, but the long-term is questionable.
FORECAST / TIMEFRAME
None
|
Where are we in the typical Sentiment Cycle?
It's an important question, and one of the most-asked ones. The biggest problem with answering is that it's entirely subjective. Scroll through a recent poll by respected technician Helene Meisler and the responses are all over the place.
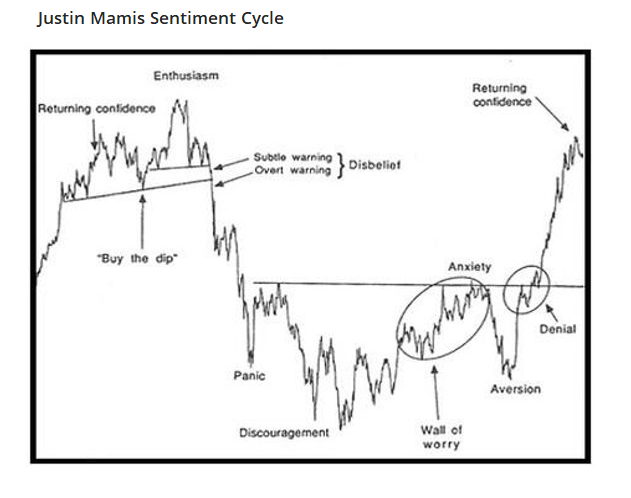
A popular heuristic is to use some version of the Cycle popularized by Justin Mamis in his 1999 book, The Nature of Risk.
There are essentially 4 major parts to the cycle:
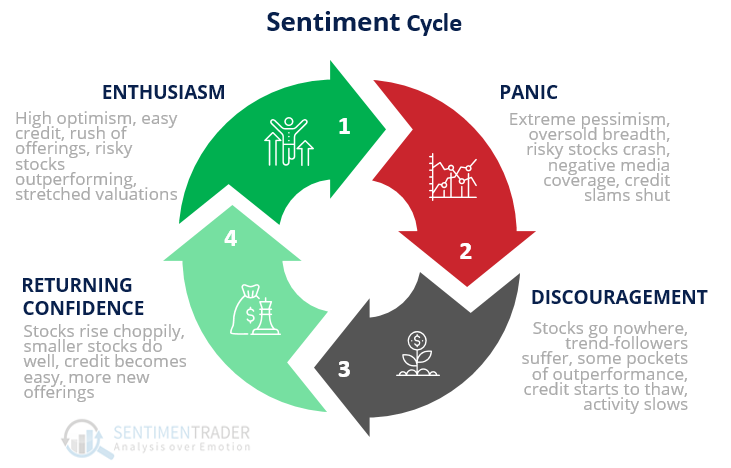
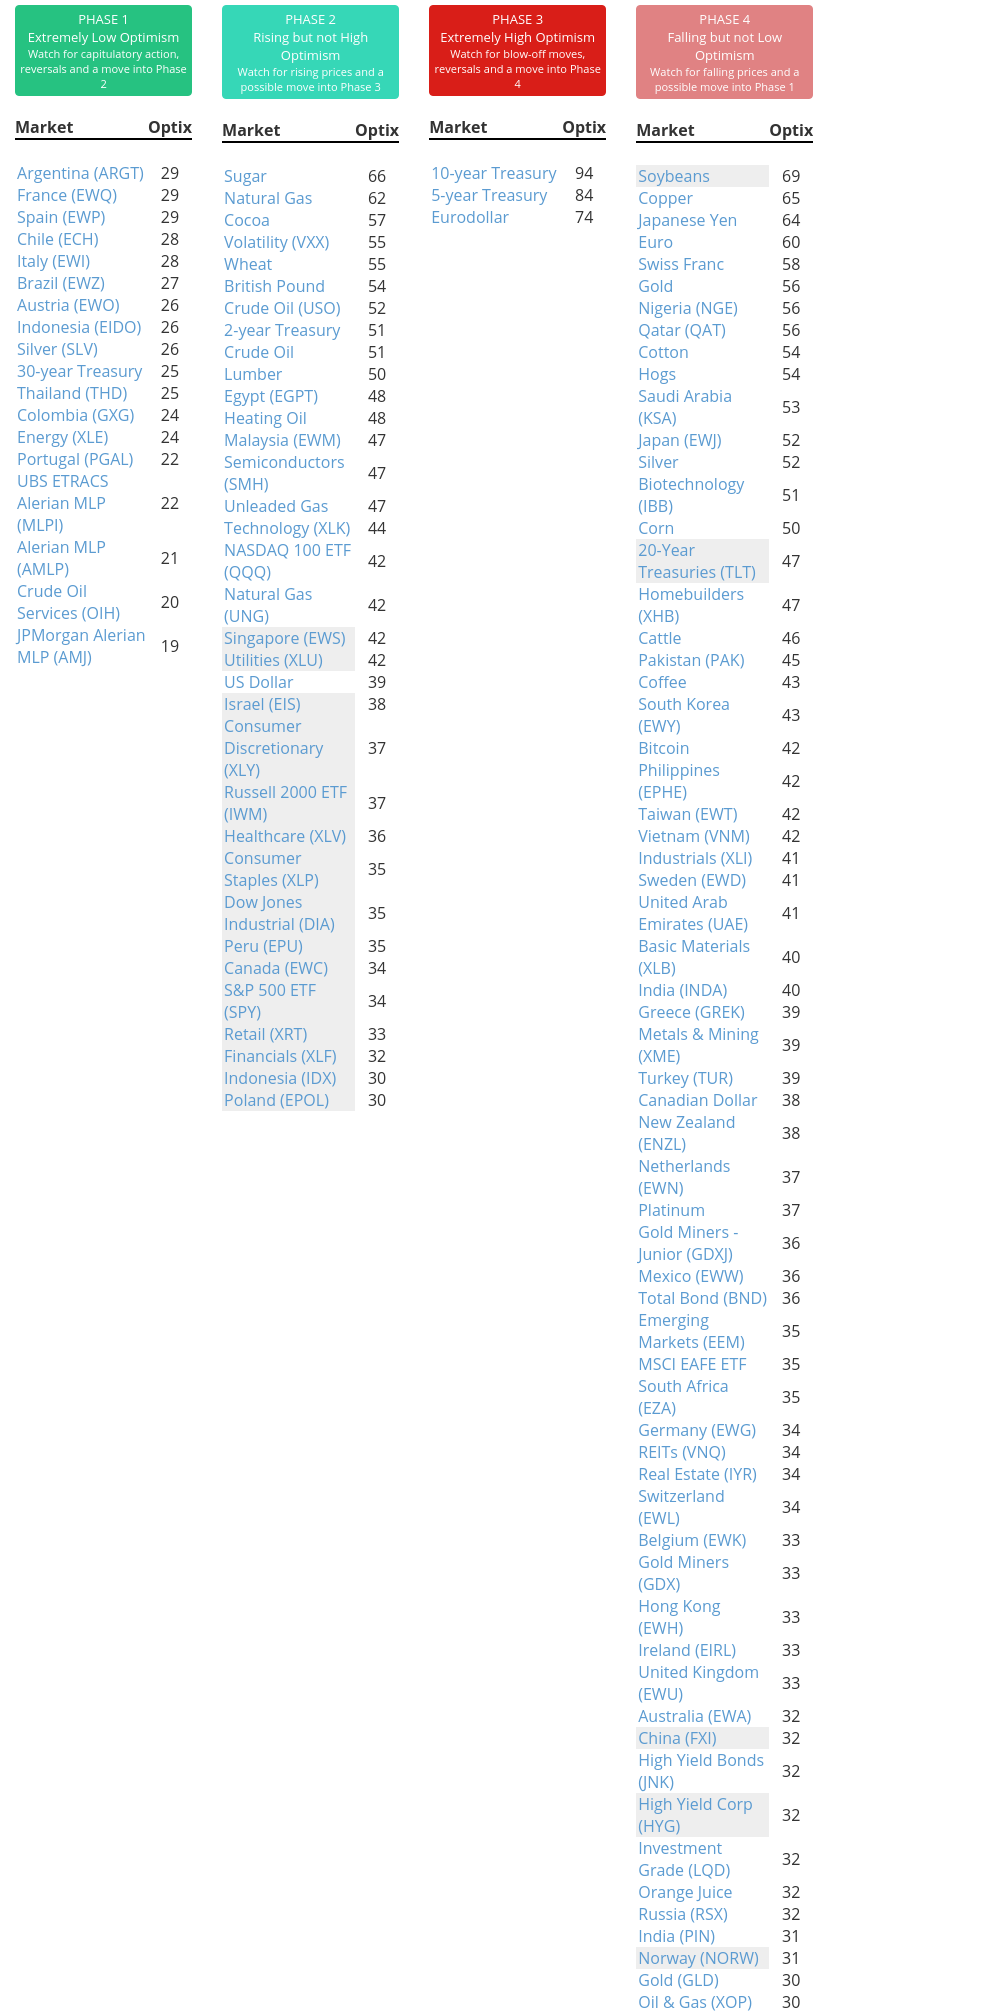
1. Enthusiasm - High optimism, easy credit, rush of offerings, risky stocks outperforming, stretched valuations
2. Panic - Extreme pessimism, oversold breadth, risky stocks crash, negative media coverage, credit slams shut
3. Discouragement - Stocks go nowhere, trend-followers suffer, some pockets of outperformance, credit starts to thaw, activity slows
4. Returning Confidence - Stocks rise choppily, smaller stocks do well, credit becomes easy, more new offerings
The Mamis chart encompasses the price path of U.S. stocks from roughly May 1990 through March 1991. When we overlay that against the past 200 days, we can get a rough sense of where we might be now.
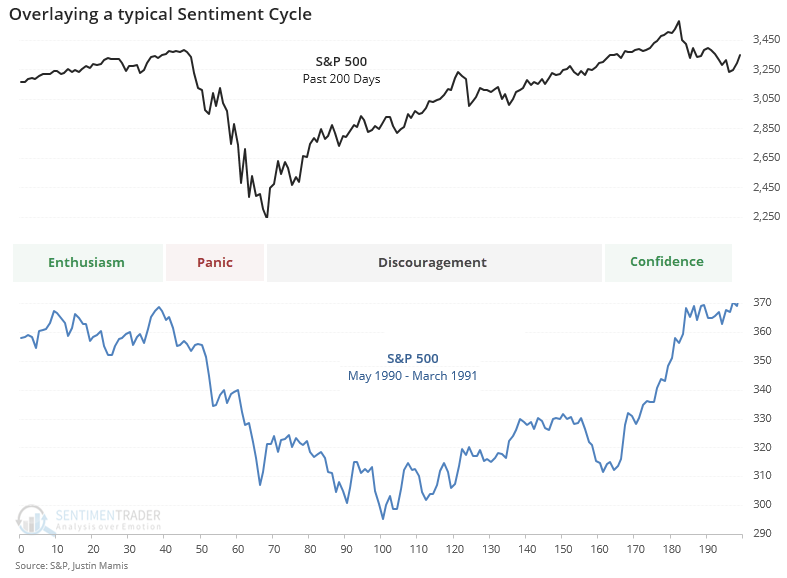
Based on eyeballing the chart, it looks like we're in the Returning Confidence part of the Cycle. There are some problems with this, like the fact that there are absolutely no rules when it comes to how long each of these phases can last. When we looked at this in April, a compelling case could be made that we were in the Discouragement phase, but investors pretty much went from Panic to Returning Confidence.
If we go back to 1928 and compare all periods to that 1990-1991 cycle, then we can see what kind of correlation we have to each part of the cycle. When we do that, we get the following estimates for where we are in the Cycle through early September:
1. Enthusiasm: -0.05
2. Panic: +0.08
3. Discouragement: +0.11
4. Returning Confidence: +0.69
The correlations range from -1.0 (perfect opposite) to +1.0 (perfect symmetry). So, clearly, there is a strong probability that Returning Confidence is where we are.
If we assume that's where we are, then let's see what happens next (if only it were that easy). Below, we can see every date when the Returning Confidence correlation peaked above +0.69, which it did a few weeks ago.
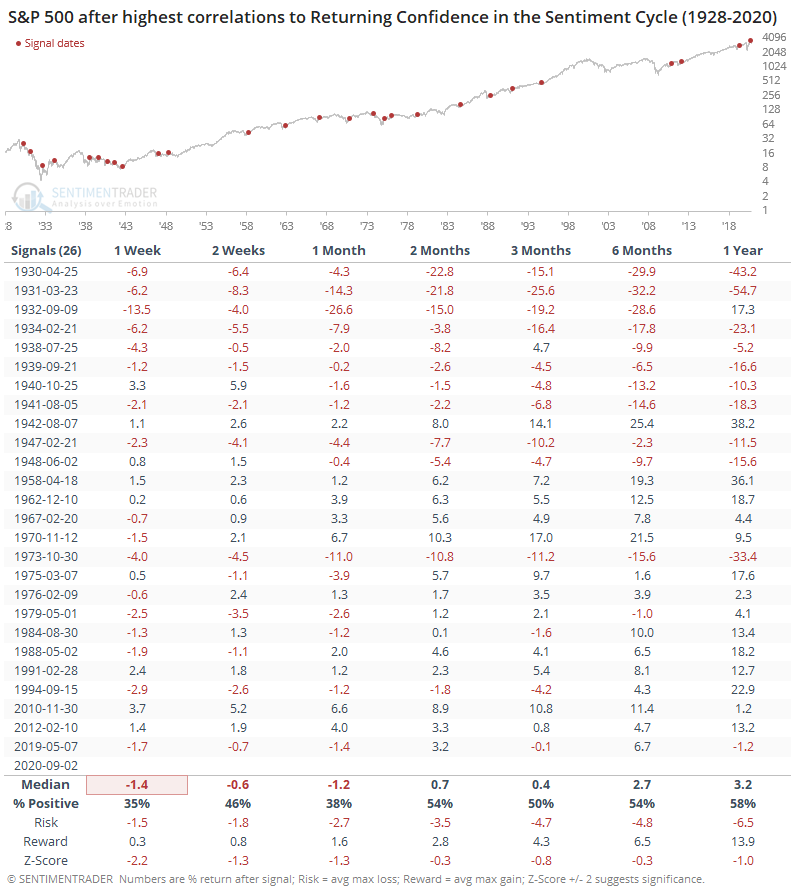
Returns were not great, but that's mostly due to pre-1950. If we focus on more recent markets, then it shows a drastic difference.
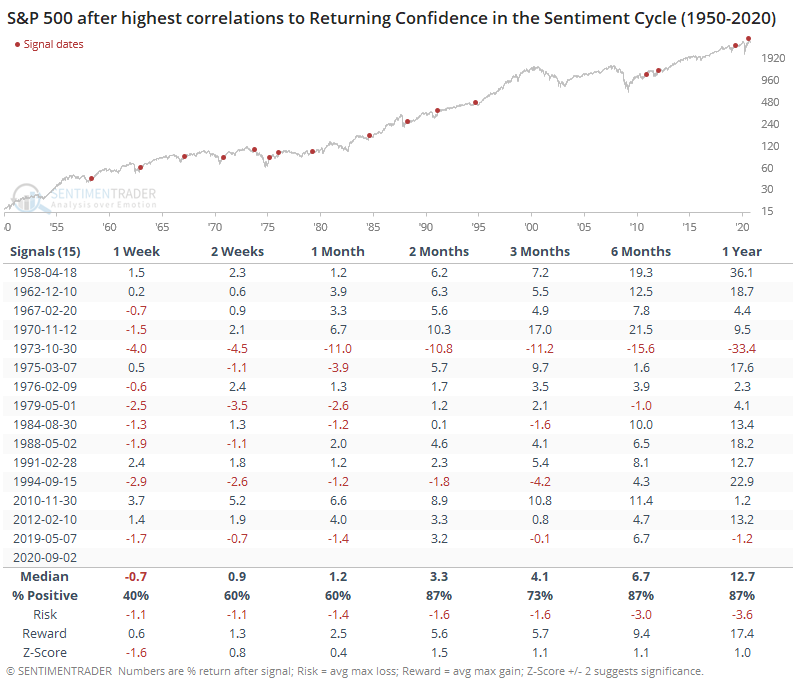
There wasn't much notable about the shorter-term, but from 2 months and beyond, returns were well above random, with good risk/reward ratios. The only major failure out of the 15 signals was in October 1973, and it was a big one.
This is an imprecise look at a subjective concept, but we've used the Sentiment Cycle a lot over the years and found it to be a good guide, as long as it's not taken as gospel. On a medium-term time frame, this should be a good sign. It helps to include other factors besides just a price analog, though, and from a longer-term point of view (1 year+), there is a strong case to be made that we're still enjoying the Enthusiasm part of the Cycle.
Active Studies
| Time Frame | Bullish | Bearish | | Short-Term | 0 | 1 | | Medium-Term | 1 | 12 | | Long-Term | 47 | 2 |
|
Indicators at Extremes
Portfolio
| Position | Description | Weight % | Added / Reduced | Date | | Stocks | RSP | 15.2 | Reduced 4.2% | 2020-09-03 | | Bonds | 10% TLT, 10% BND, 10% SCHP | 30.0 | Added 30% | 2020-09-09 | | Commodities | GCC | 2.4 | Reduced 2.1%
| 2020-09-04 | | Precious Metals | GDX | 5.0 | Added 5% | 2020-09-09 | | Special Situations | XLE | 4.9 | Added 5.1% | 2020-09-03 | | Cash | | 42.5 | | |
|
Updates (Changes made today are underlined)
After stocks bottomed on March 23rd, they enjoyed a historic buying thrust and retraced a larger amount of the decline than "just a bear market rally" tends to. Through June, there were signs of breadth thrusts, recoveries, and trend changes that have an almost unblemished record at preceding higher prices over a 6-12 month time frame. On a shorter-term basis, our indicators have been showing high optimism, with Dumb Money Confidence recently above 80%, along with signs of reckless speculation during what appears to be an unhealthy market environment, historically a bad combination. While there are certainly some outlier indicators that are showing apathy or even outright pessimism, a weight-of-the-evidence approach suggests high risk over a multi-week to multi-month time frame. That has been the case since July, even arguably June and yet the major indexes hit continual new highs through late August. With the indicators and studies failing to precede any weakness, I've been hesitant to lower my already-low exposure. I am getting increasingly anxious about the oddities we're seeing, though, and lowered it again. This account is mostly about comfort with risk for me, and right now I'm not at all comfortable with any of it. In more than 25 years of experience, this is the oddest market I've ever seen. I lowered exposure again - likely the lowest I'm willing to go at this point given longer-term positives - and decided to switch to an equal-weight version of the S&P 500 index. I've become intensely uncomfortable with the concentration in the cap-weighted index. Our studies have been mixed with regard to the potential for the equal-weight version to outperform the cap version going forward, so historical support isn't overwhelming. I'm also increasingly interested again in energy stocks, starting with a small allocation. I got burned in March with the unprecedented geopolitical spat that hammered those stocks then but the longer-term setup is decent. In this account, I’ve roughly followed what has become known as the All Weather portfolio popularized by Ray Dalio. It allocates across four broad assets, designed to hold up no matter the market environment. The goal is modest positive returns while limiting large, sustained losses. I typically use popular ETFs, with low costs. At times, I will swap out for a fund I believe has better prospects, or simply lower fees if not. At other times, I will diverge quite a bit from baseline allocations, largely depending on the indicators and studies we discuss on the site. I've gotten away from this in the past, using "cash" as a substitute for "bonds" and with rates stuck at 0%, that has become less appetizing. I'm trying to get back more toward the baselines with less dramatic swings in either direction. The base allocation I use is the following: Stocks: 35%
Bonds: 45%
Precious Metals: 7.5%
Commodities: 7.5%
Cash / Special Opportunities: 5%
RETURN YTD: -1.7% 2019: 12.6%, 2018: 0.6%, 2017: 3.8%, 2016: 17.1%, 2015: 9.2%, 2014: 14.5%, 2013: 2.2%, 2012: 10.8%, 2011: 16.5%, 2010: 15.3%, 2009: 23.9%, 2008: 16.2%, 2007: 7.8%
|
|
Phase Table
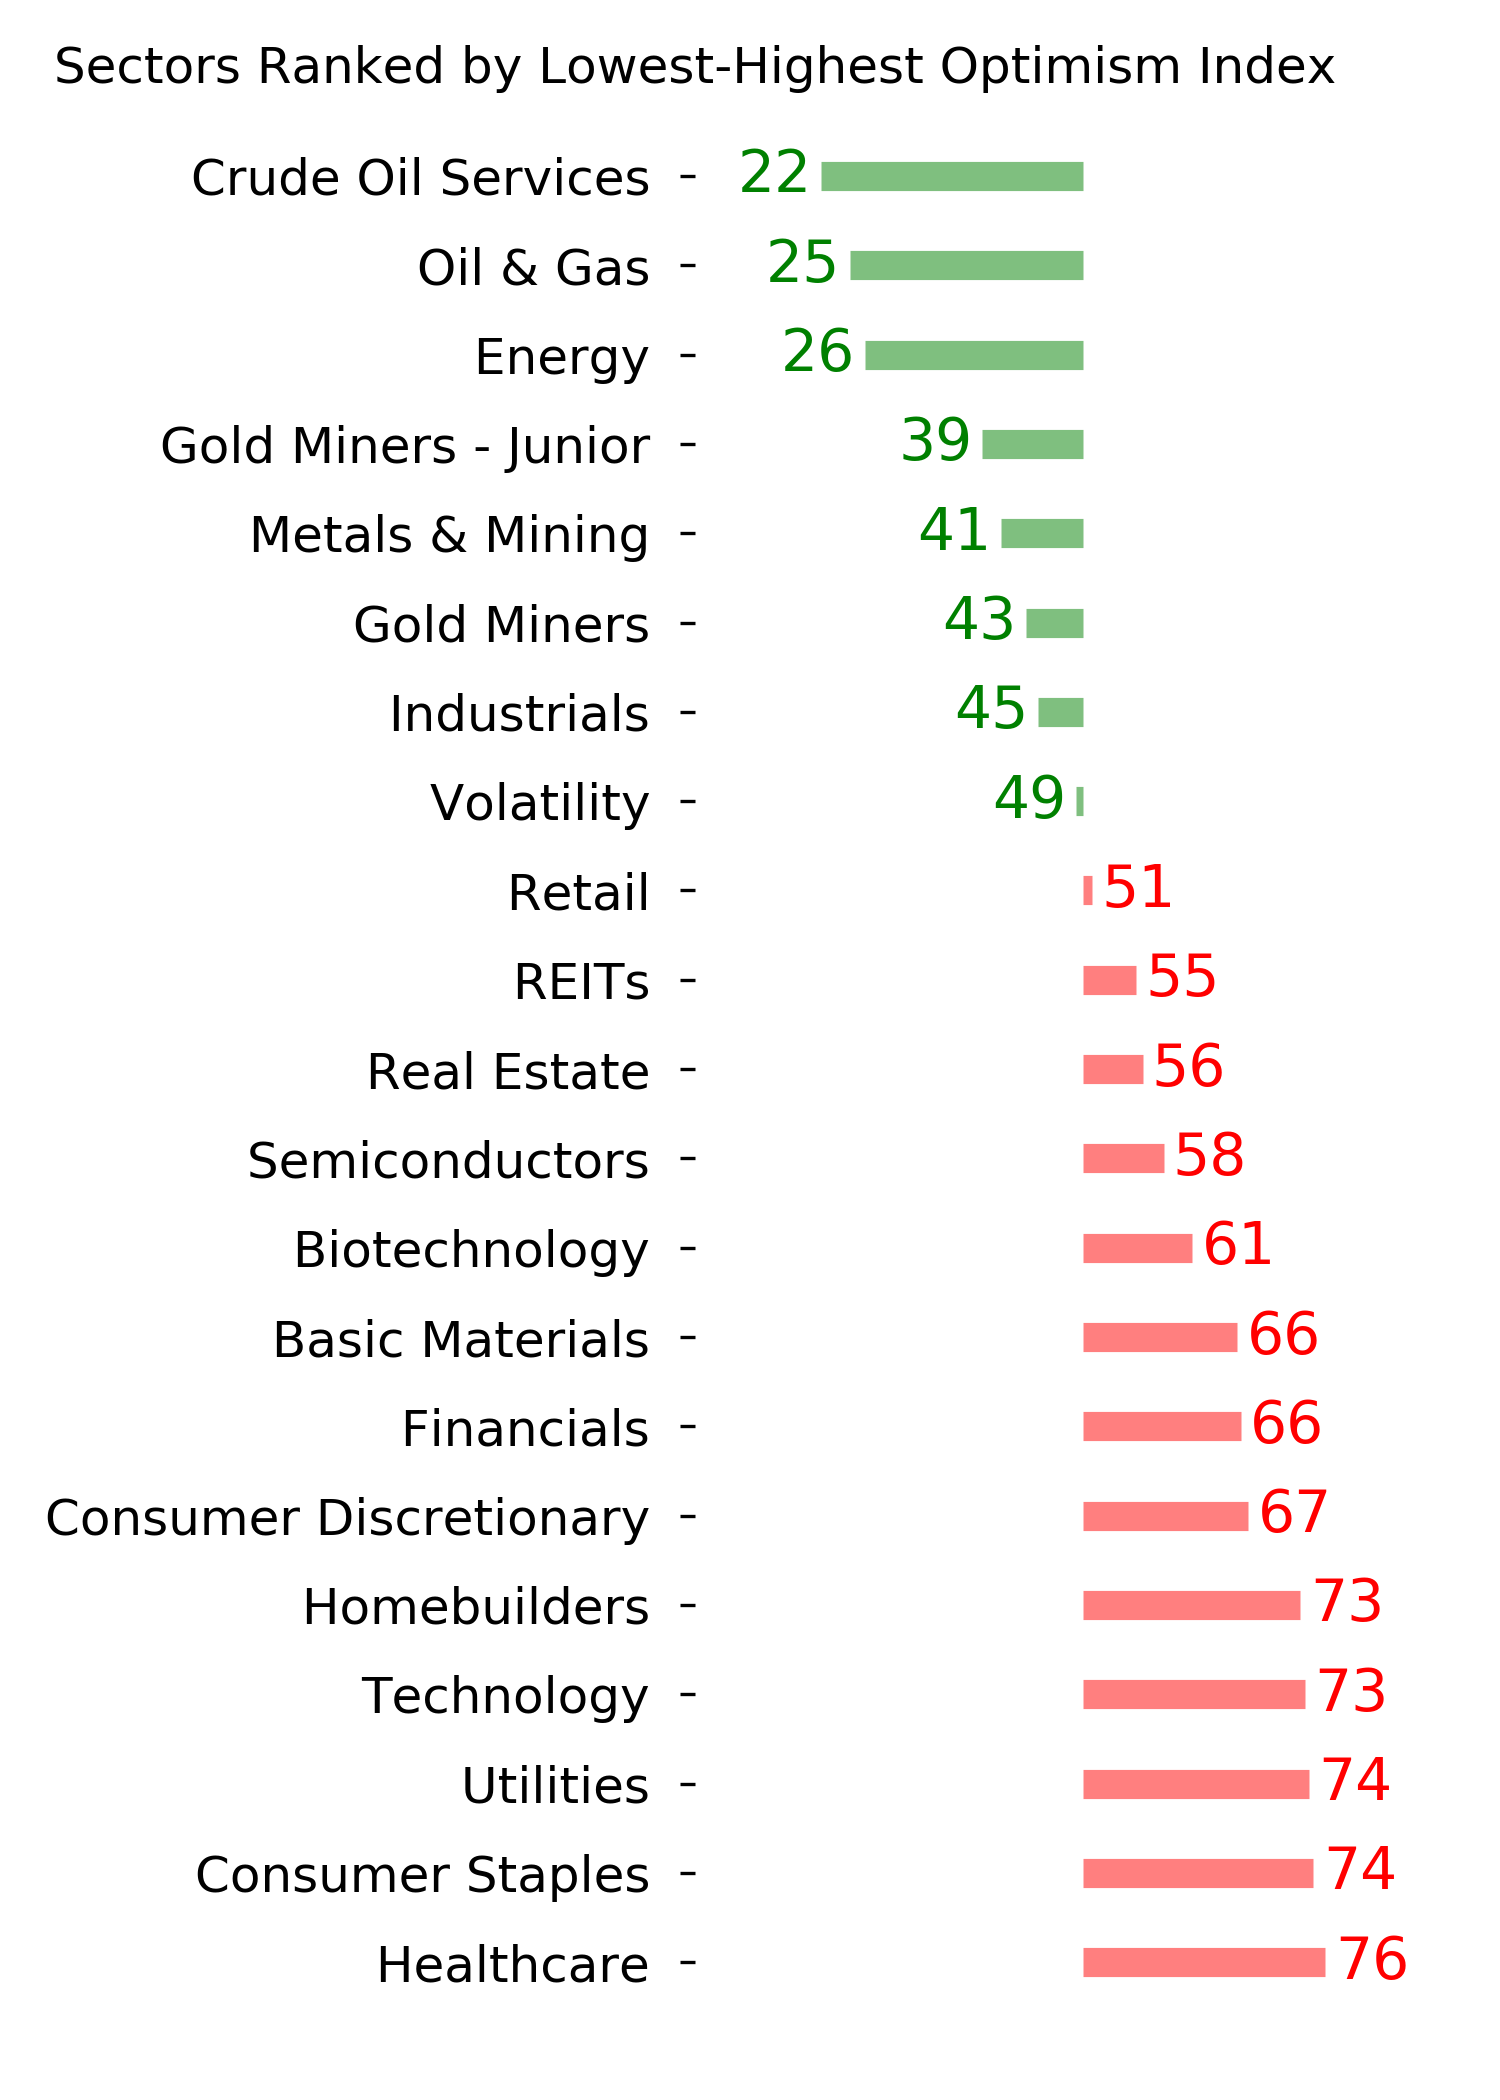
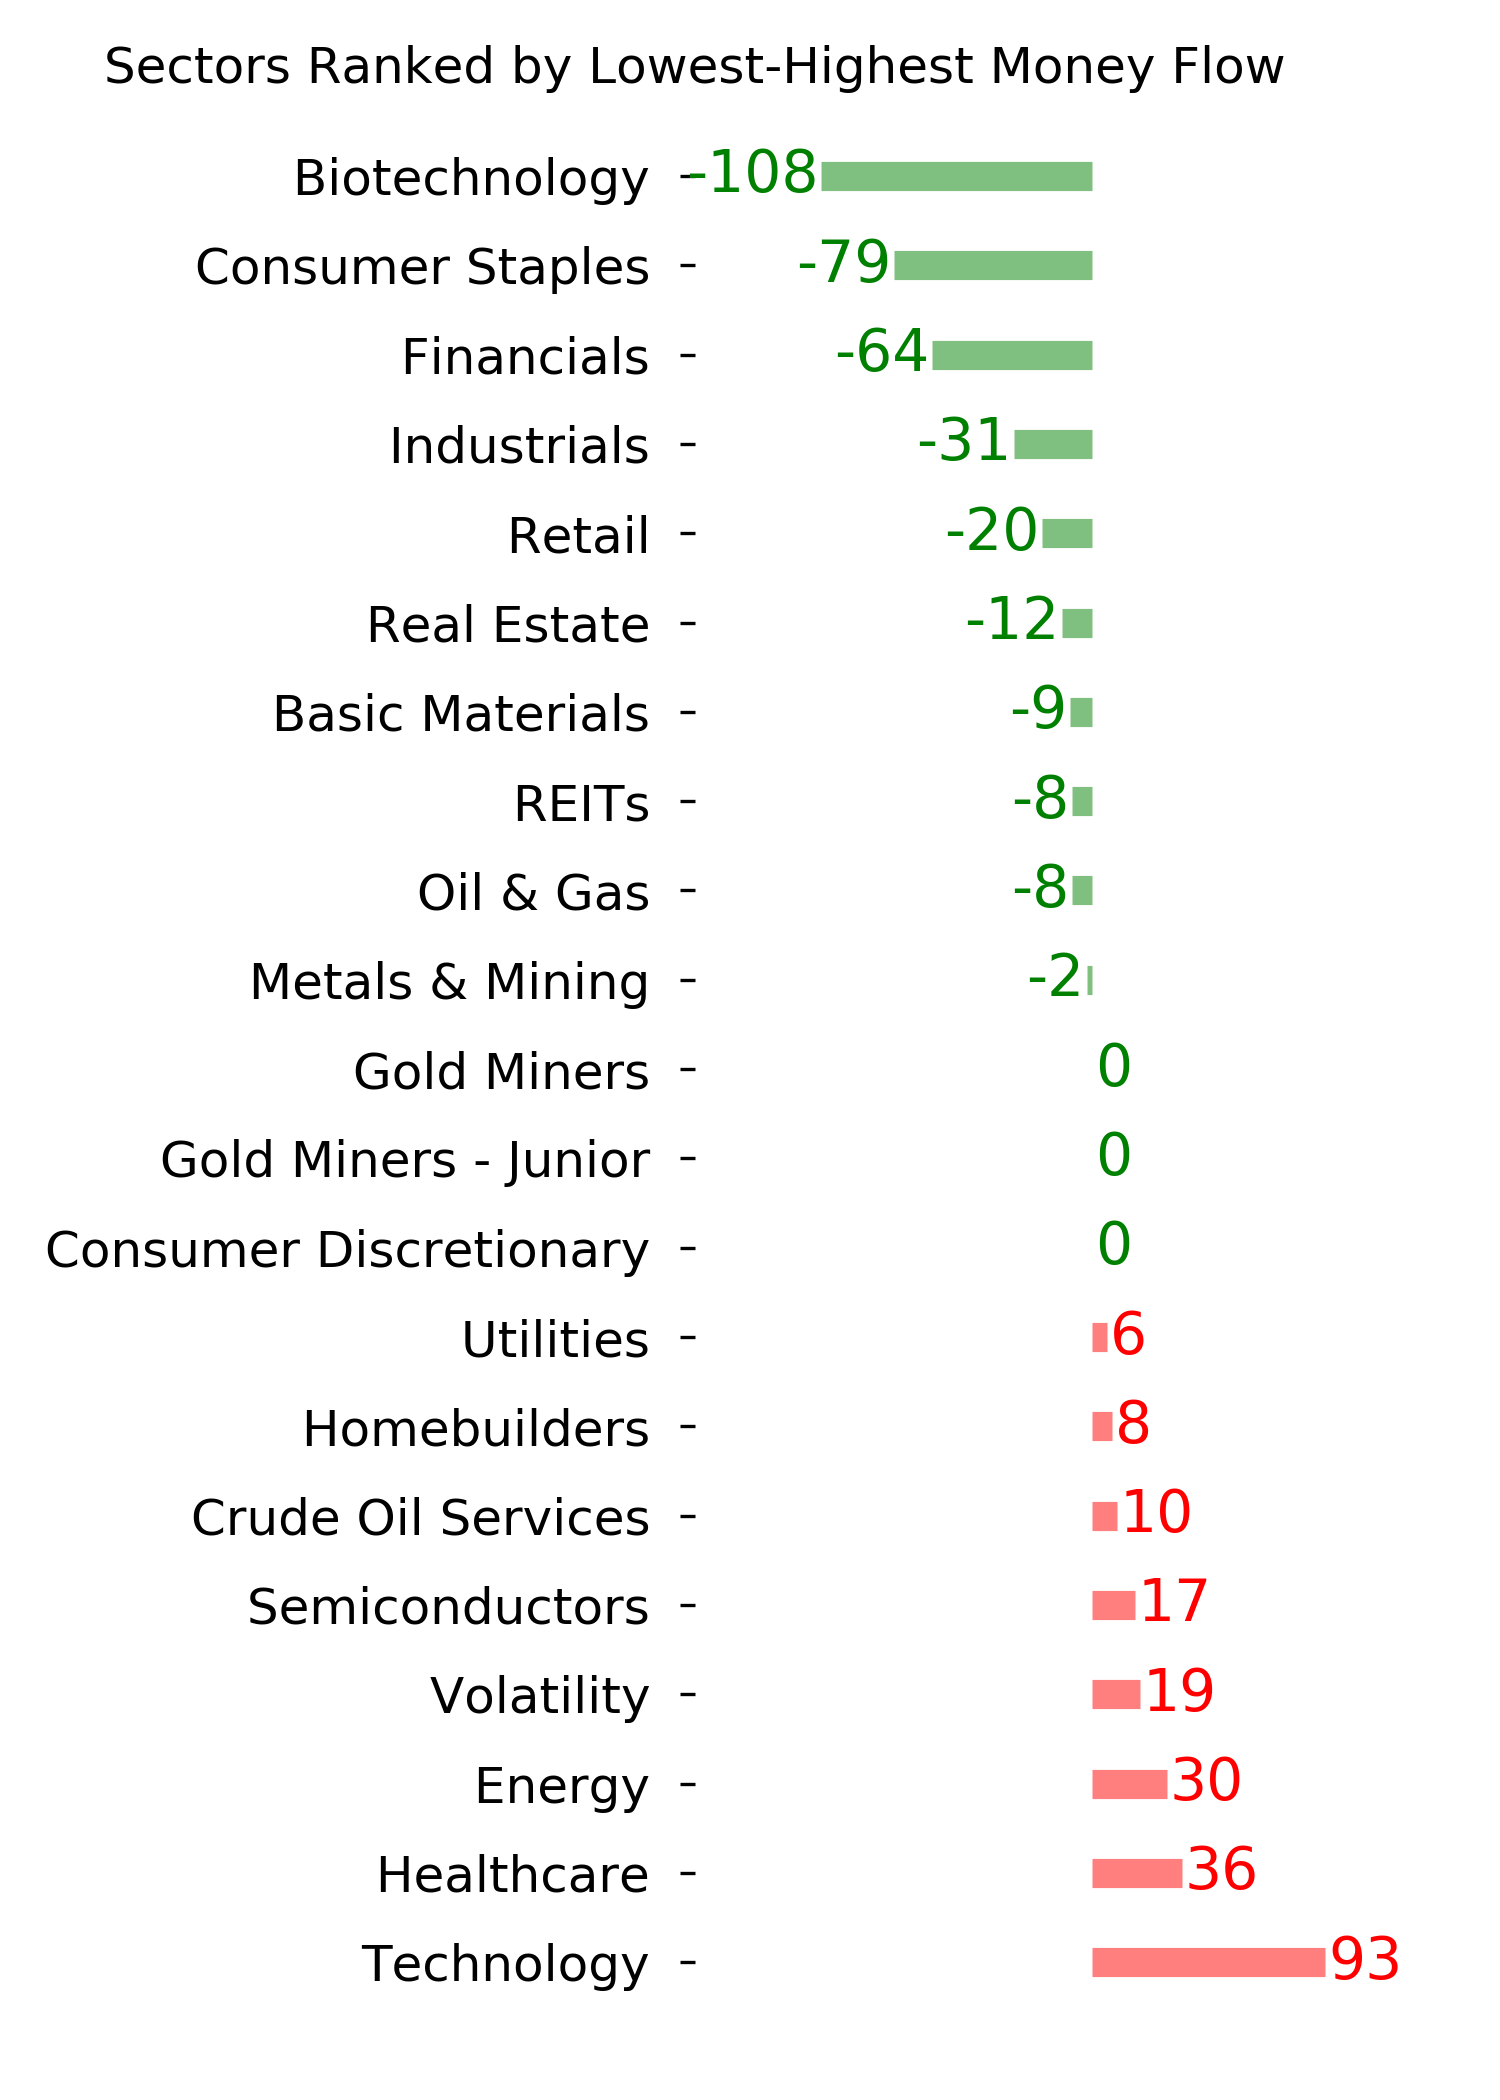
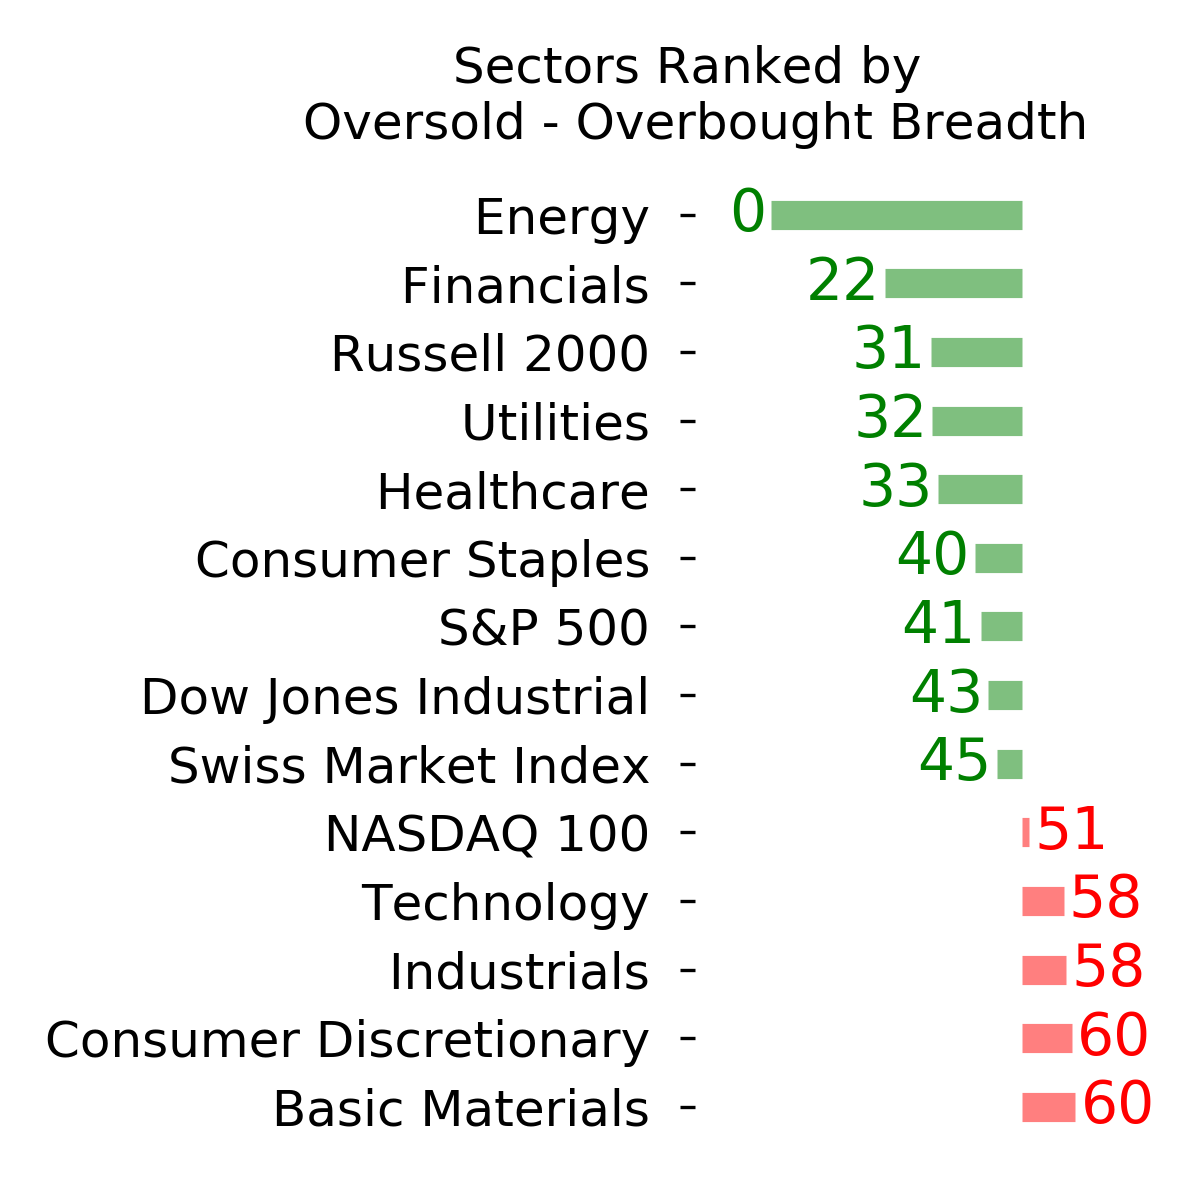
Ranks
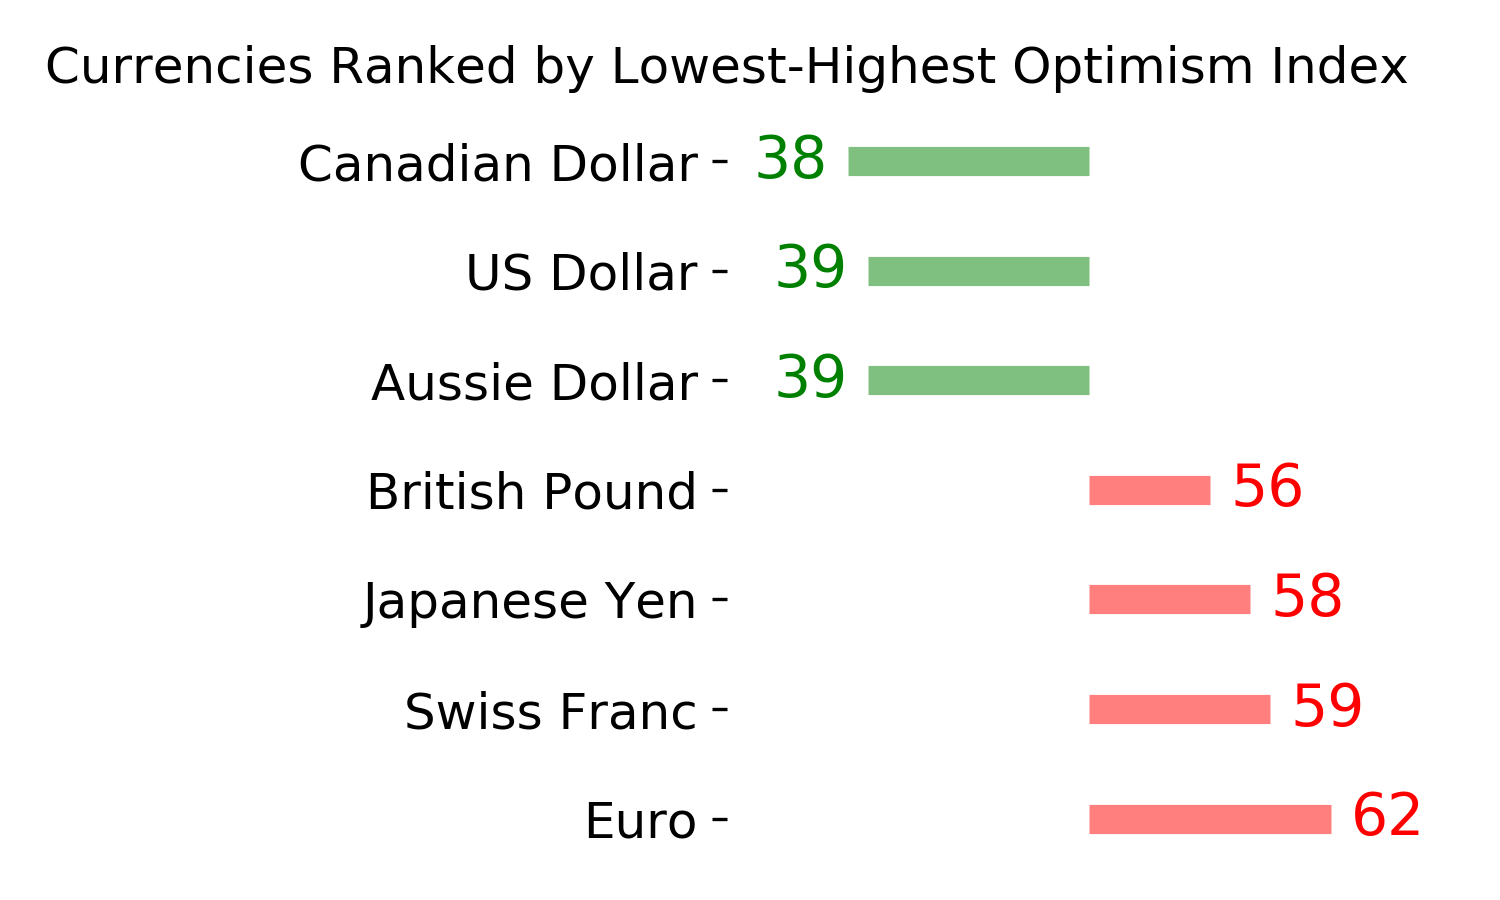
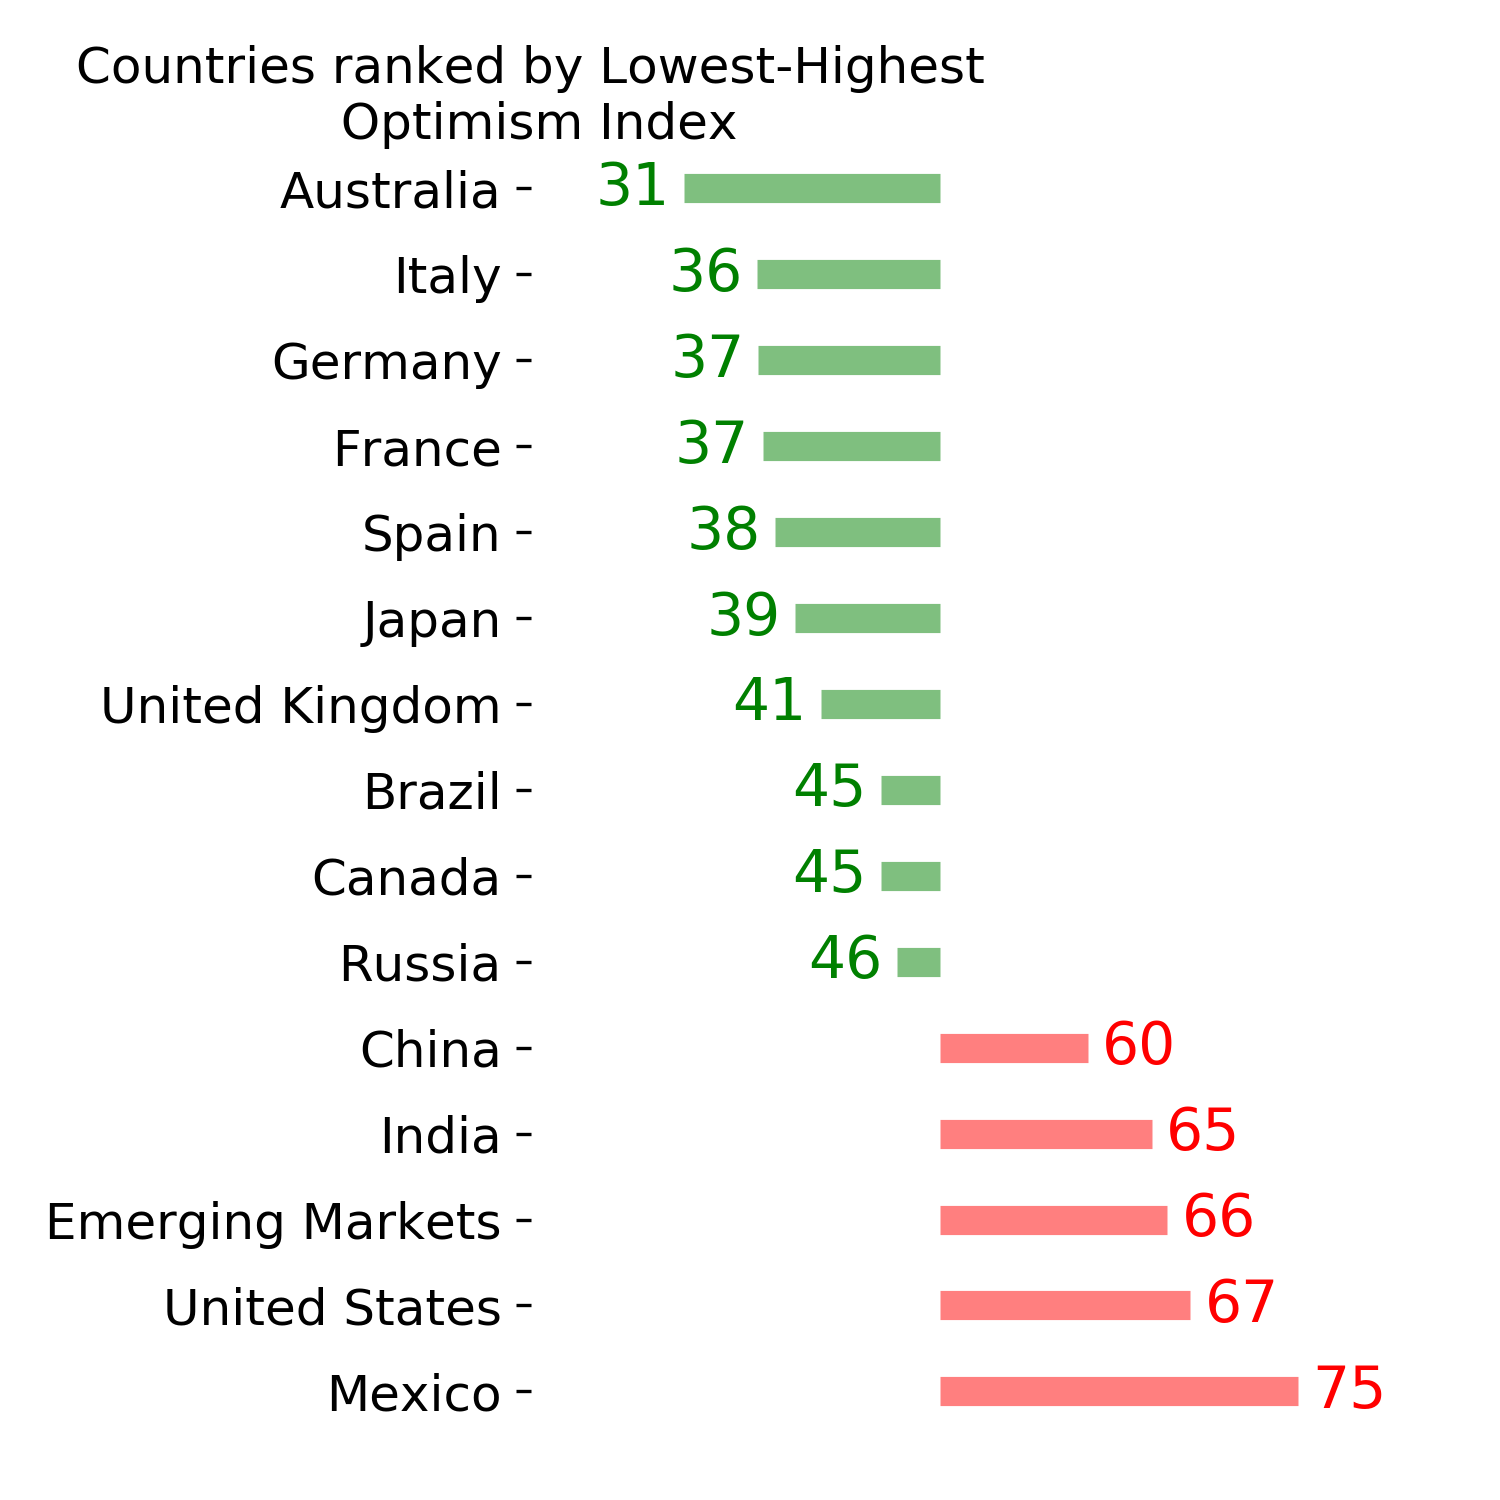
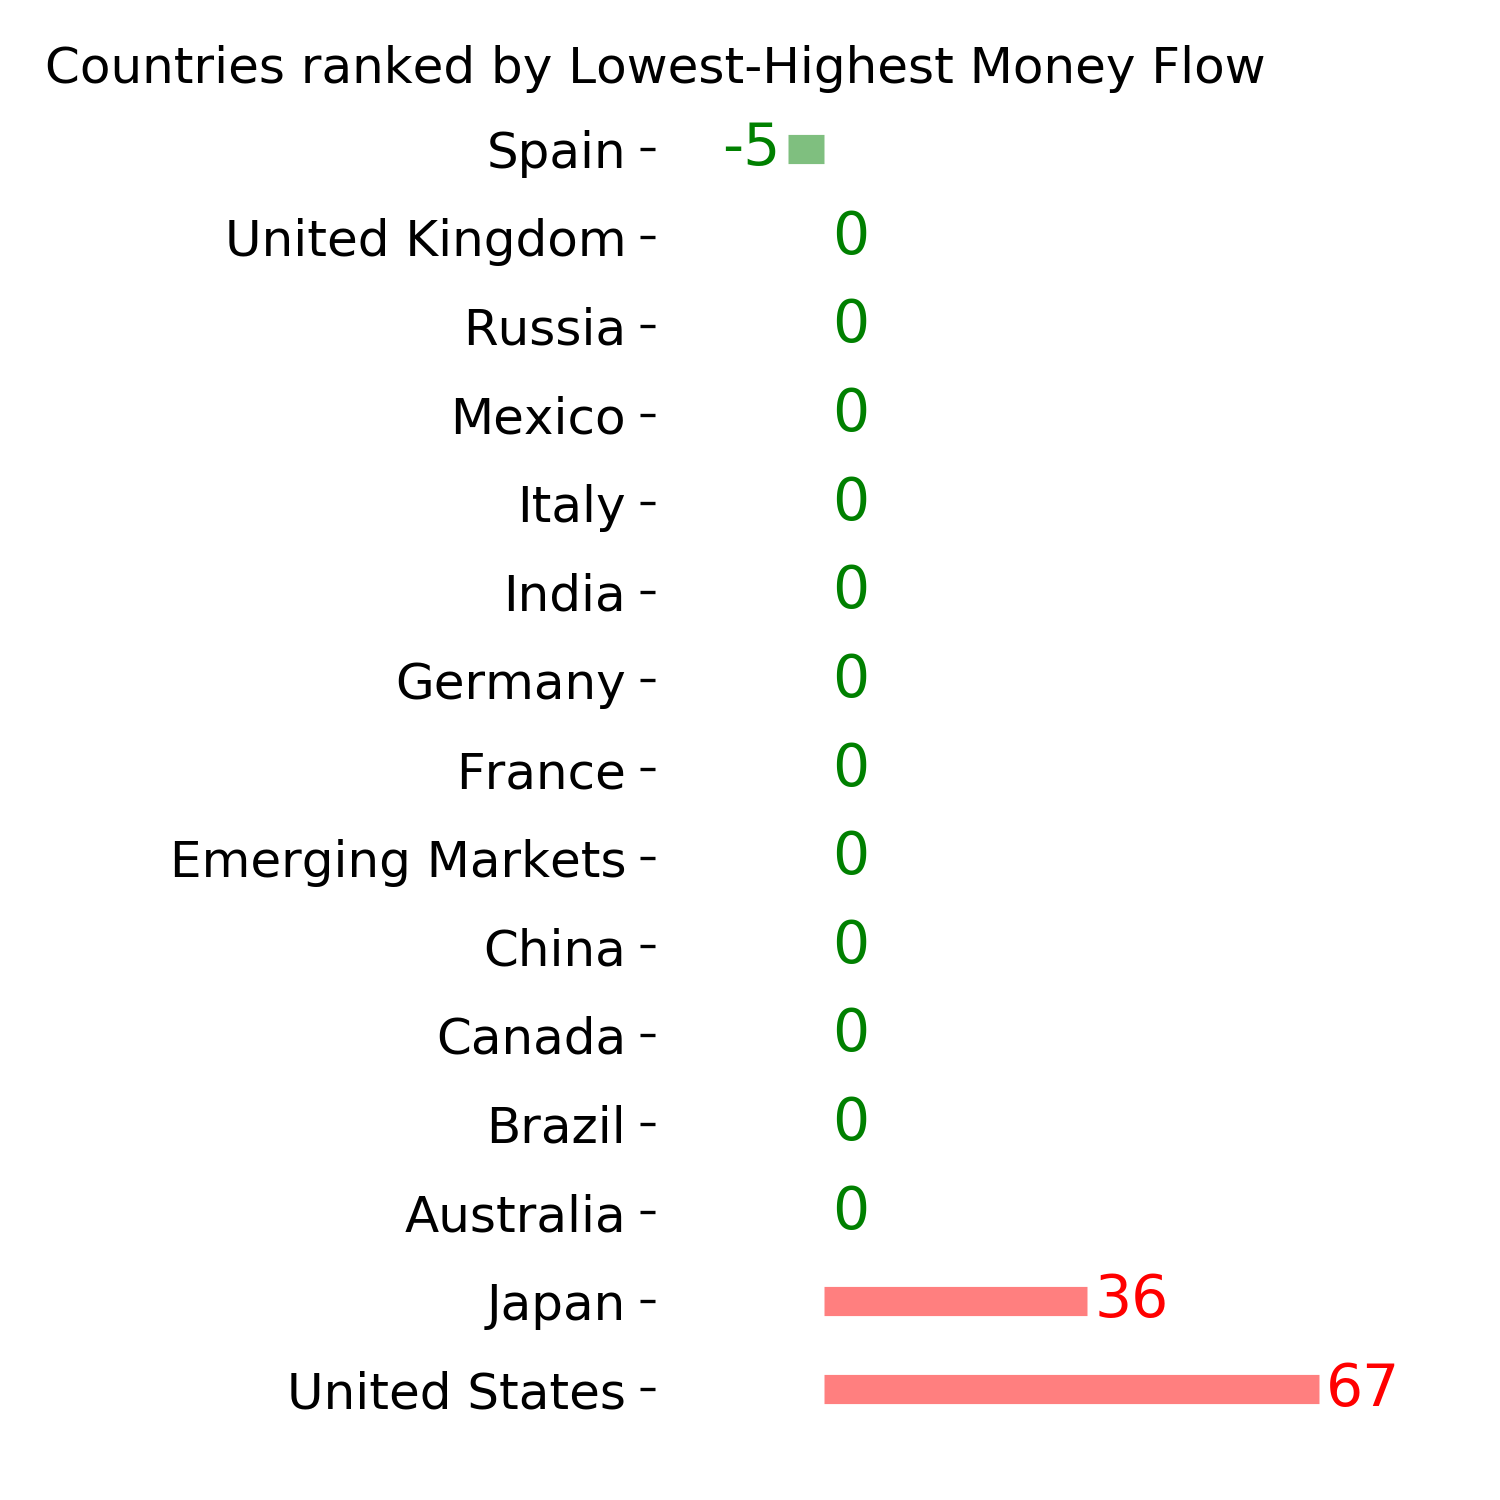
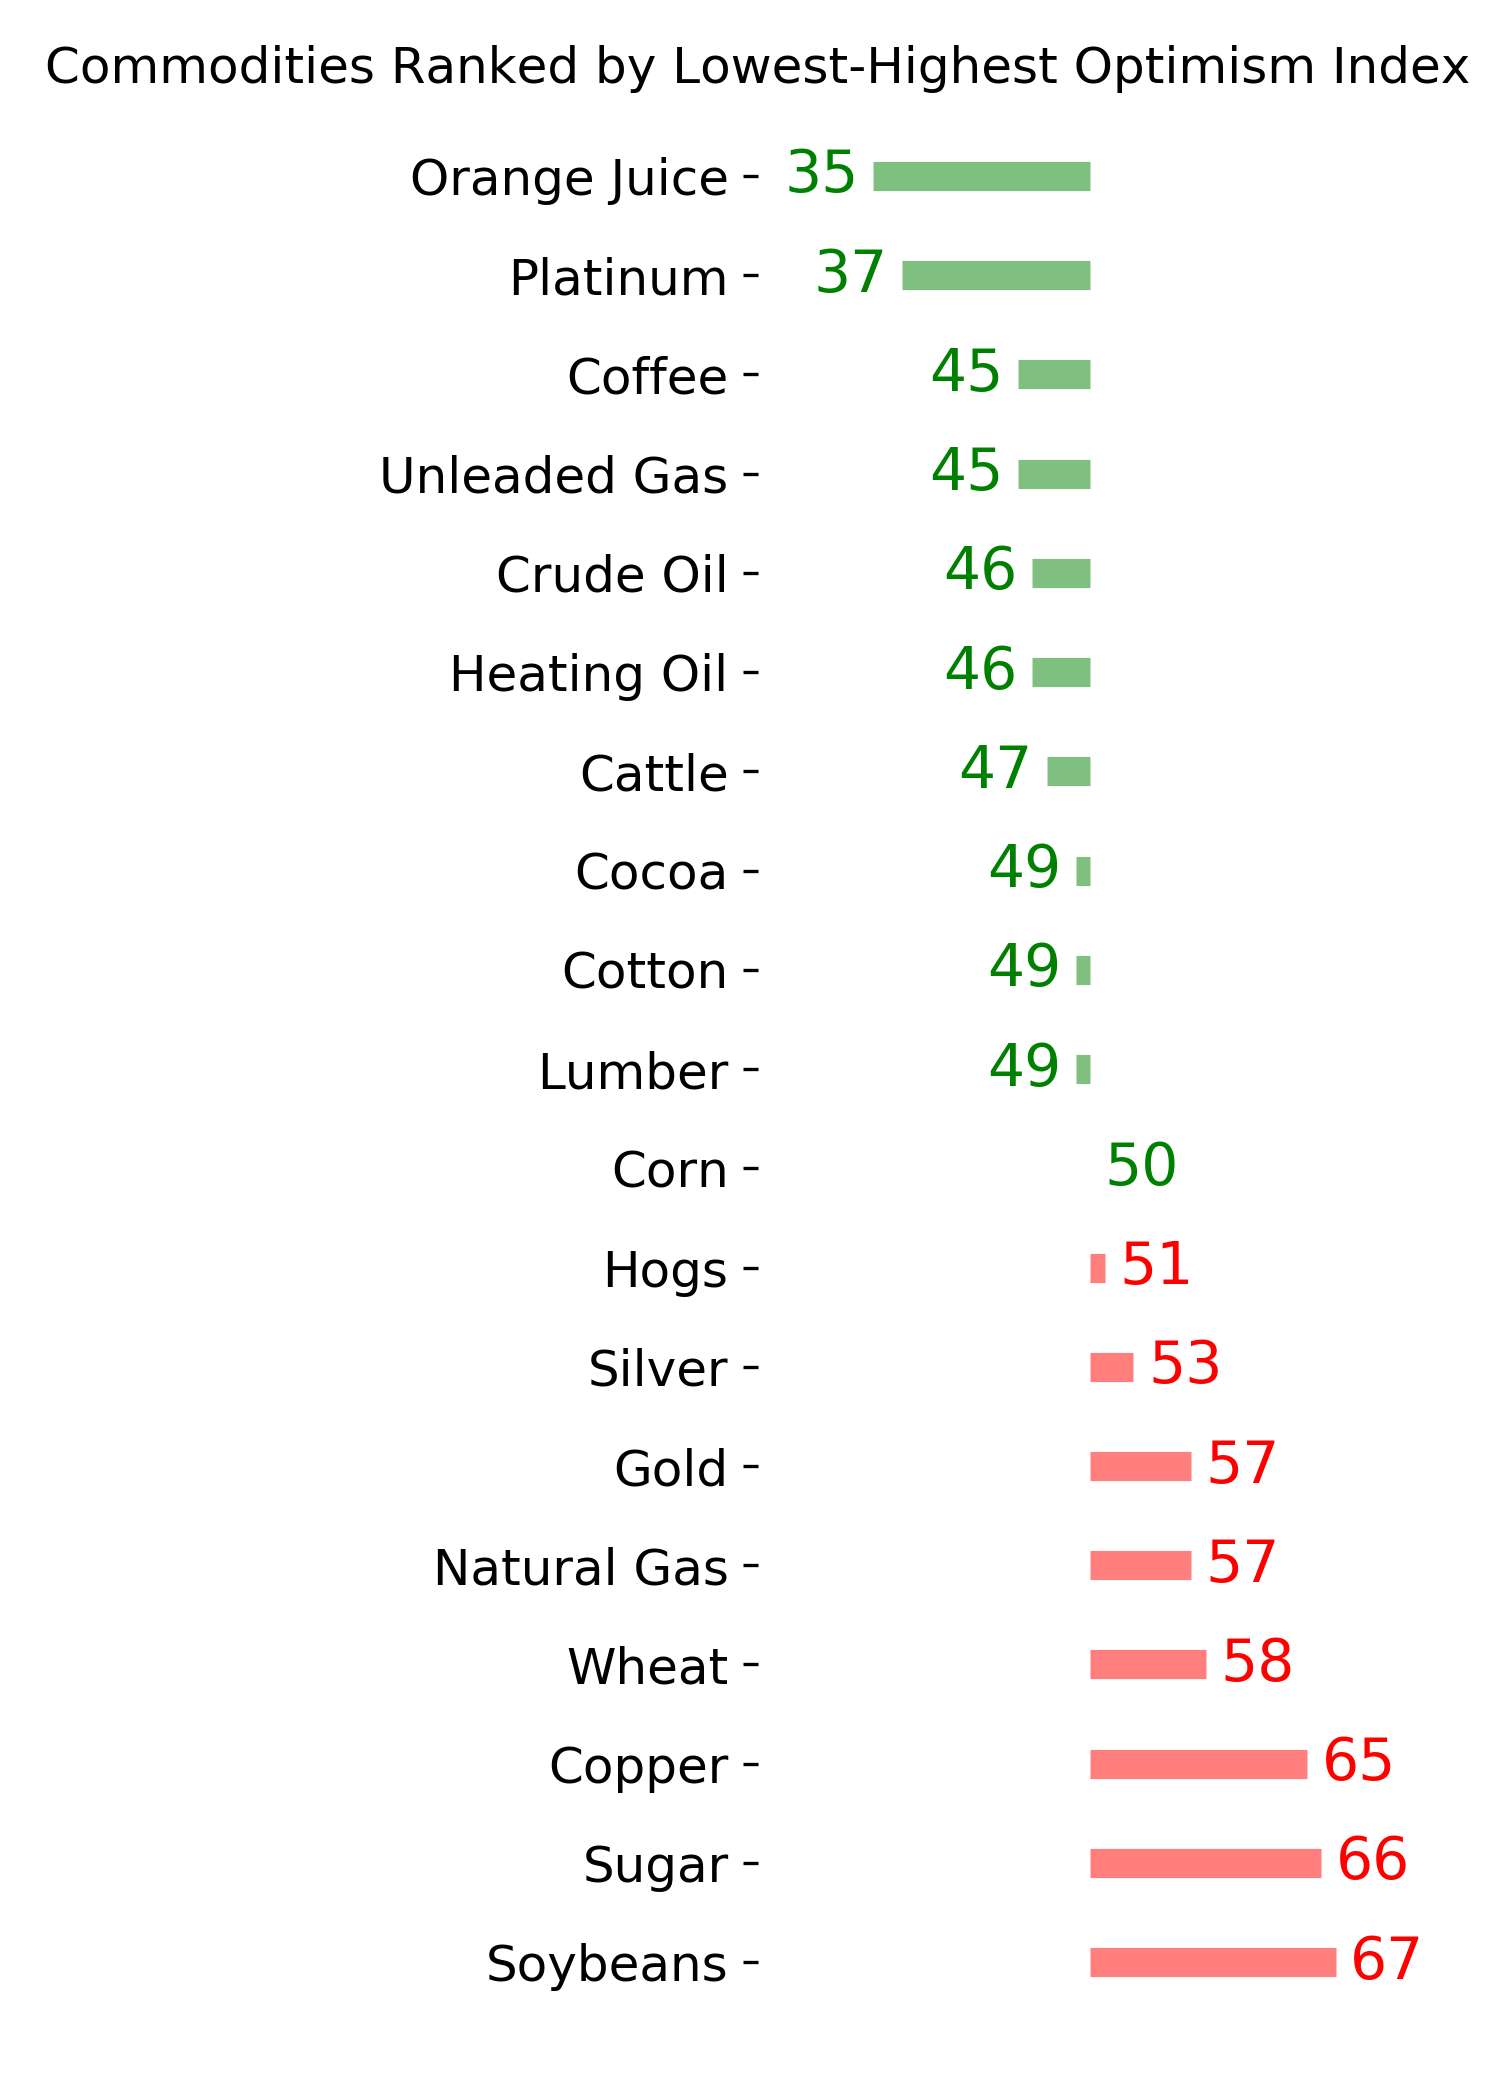
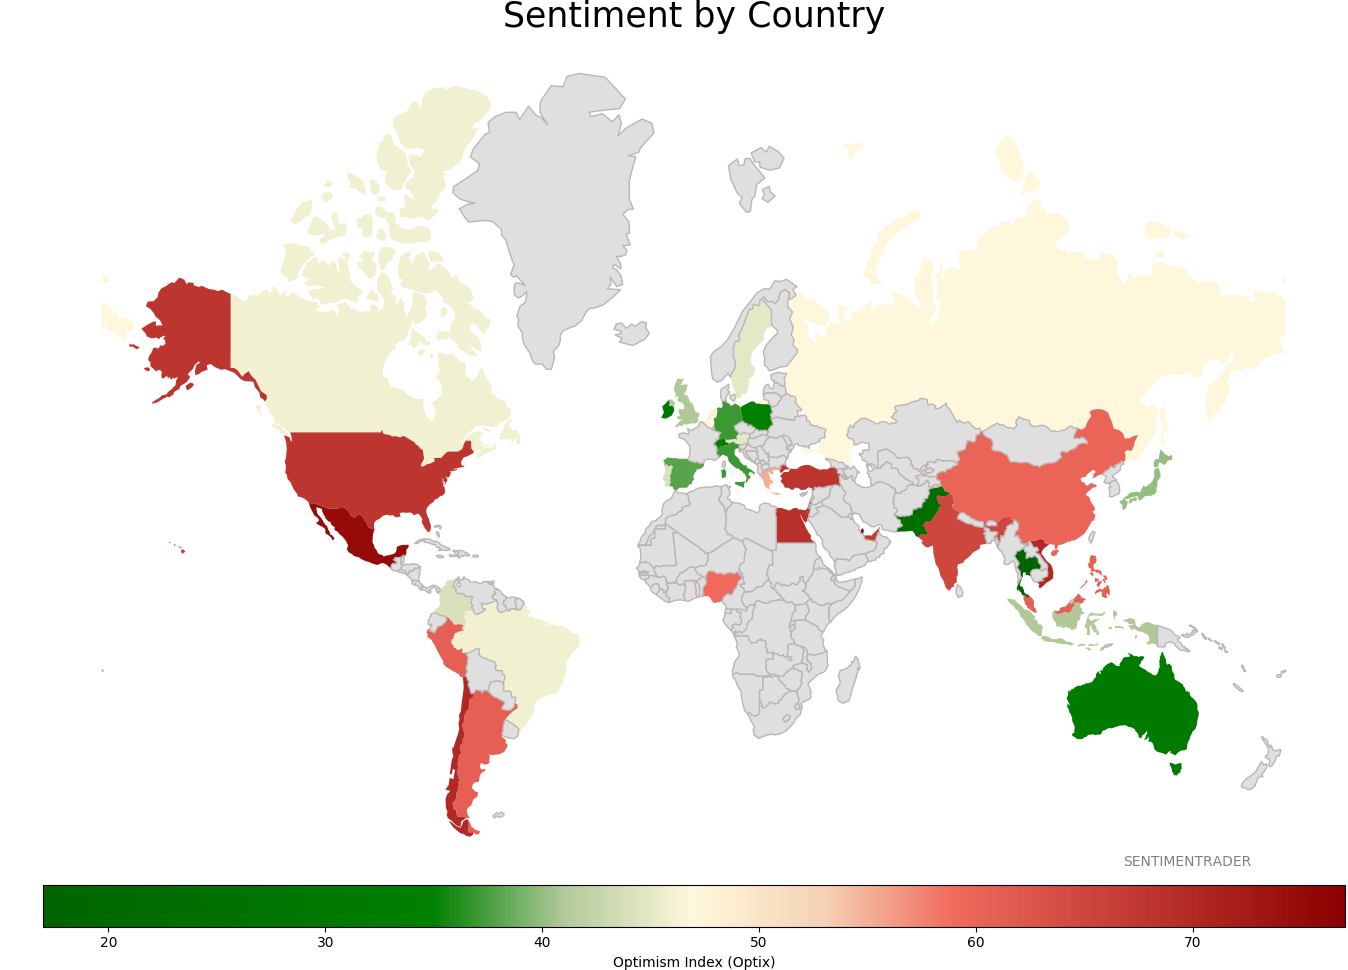
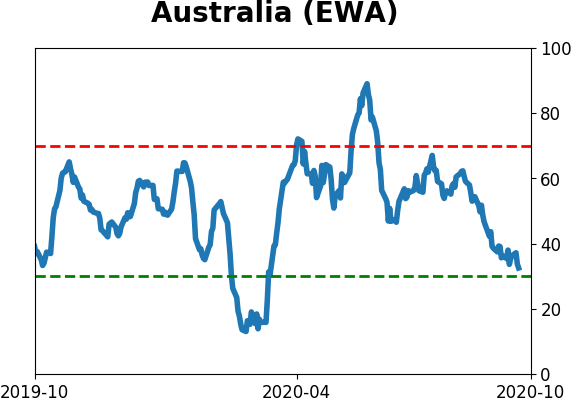
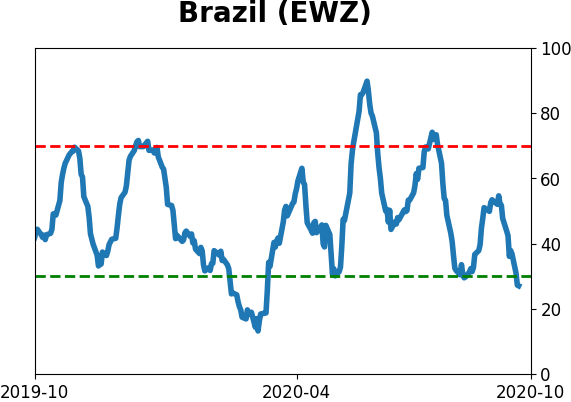
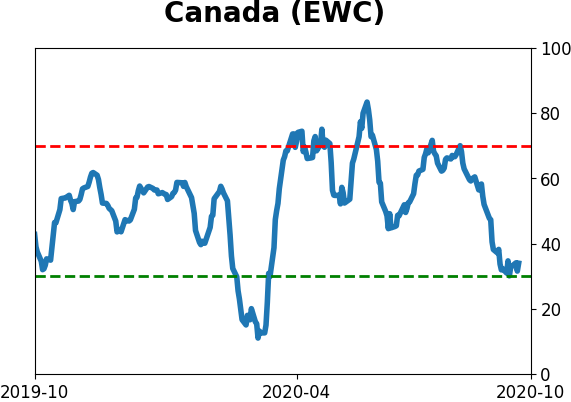
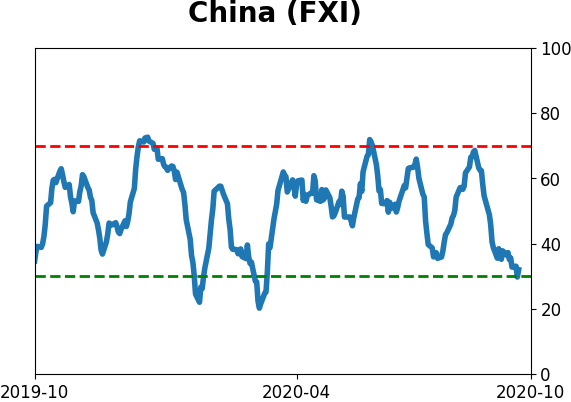
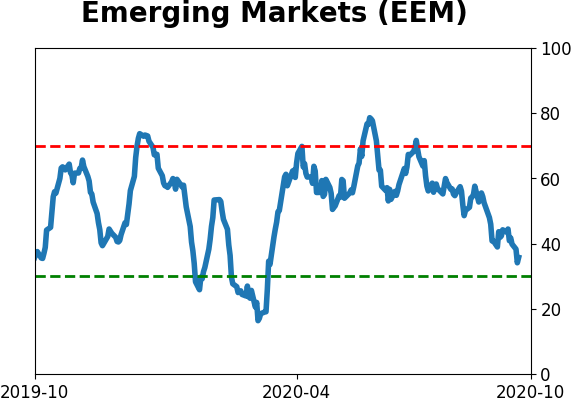
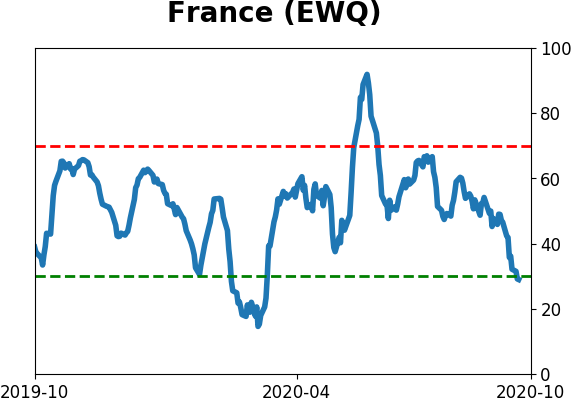
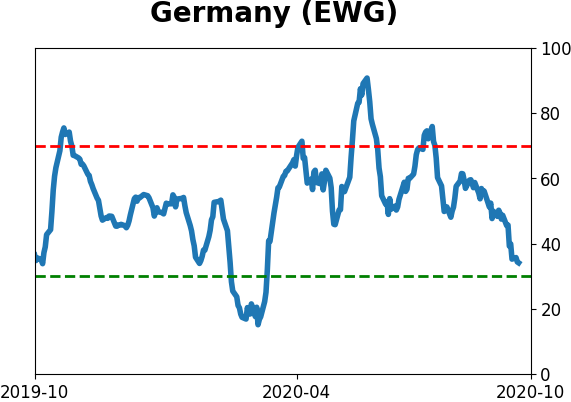
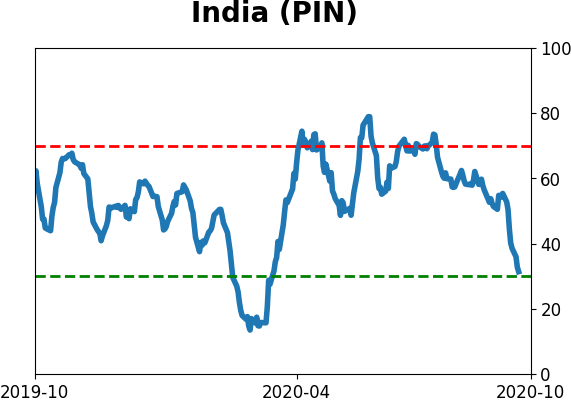
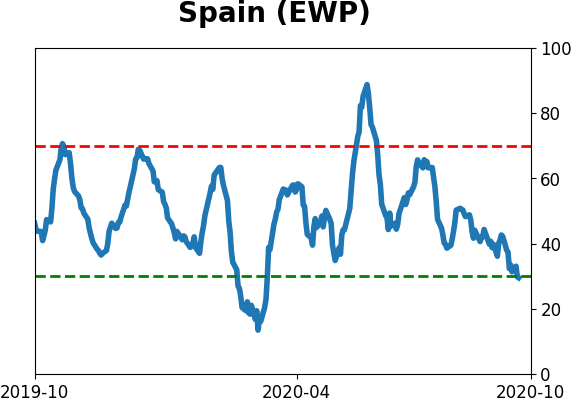
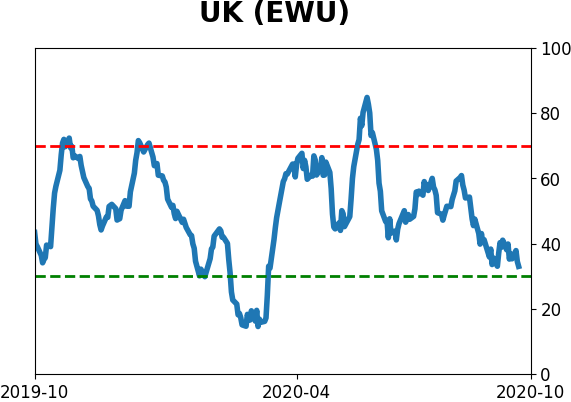
Sentiment Around The World
Optimism Index Thumbnails
|
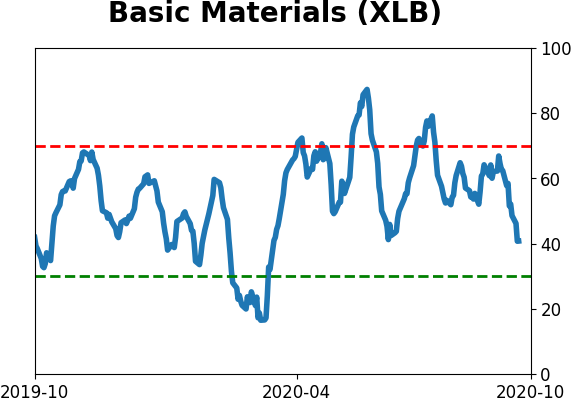
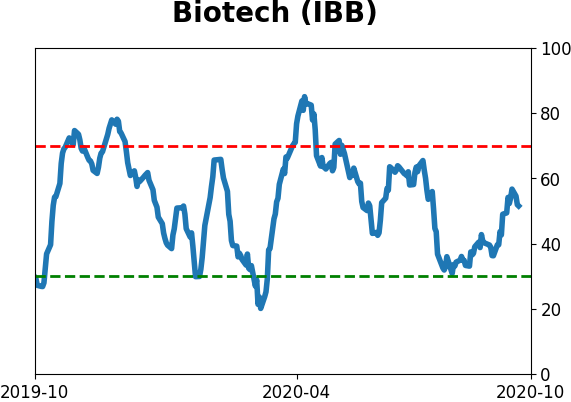
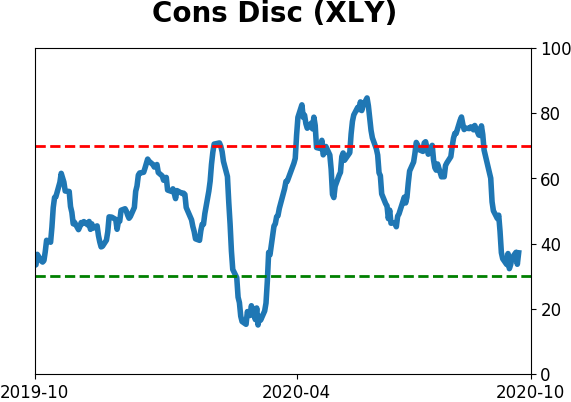
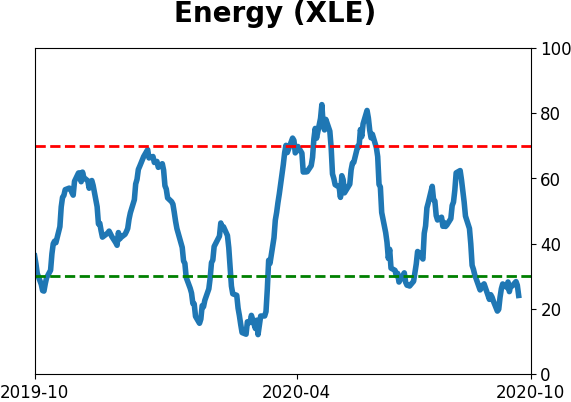
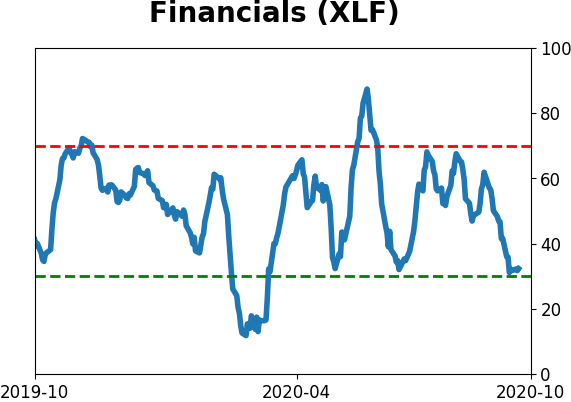
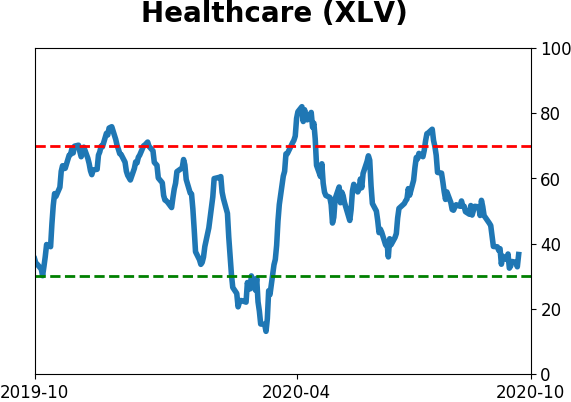
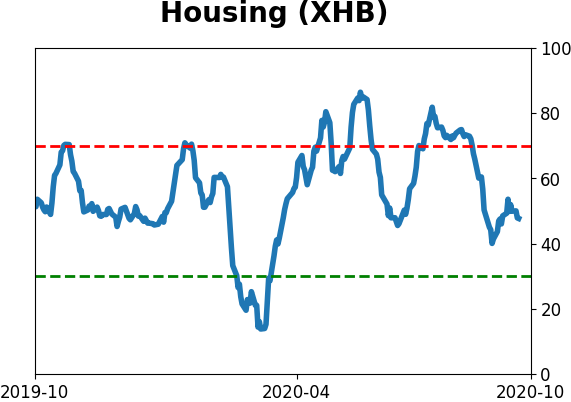
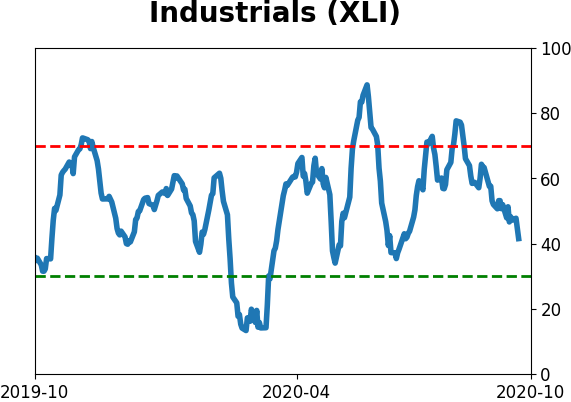
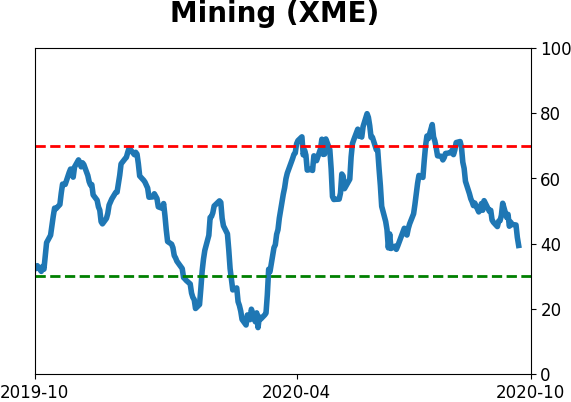
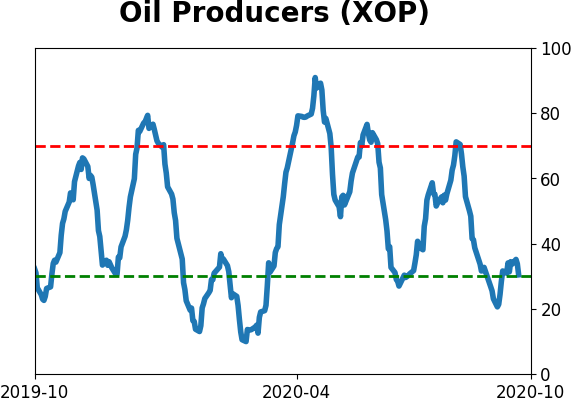
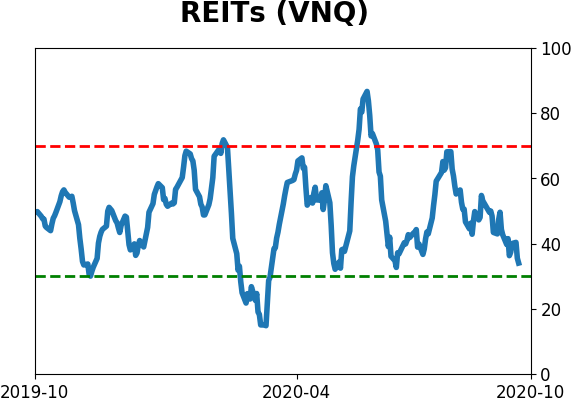
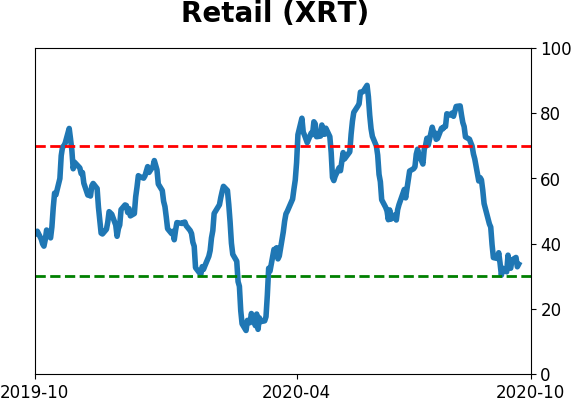
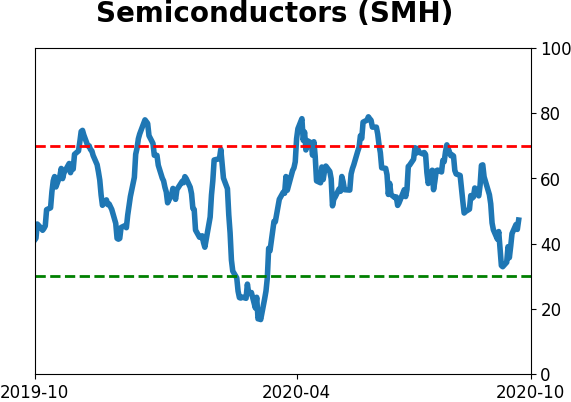
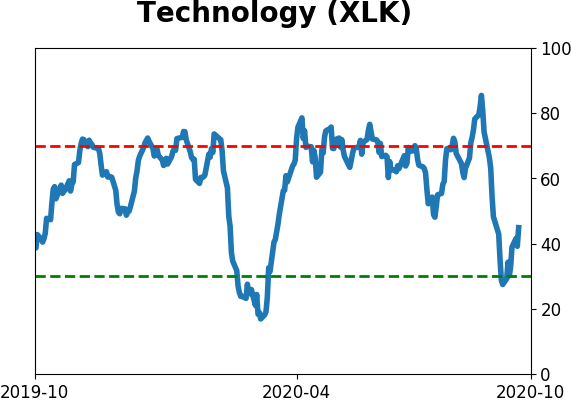
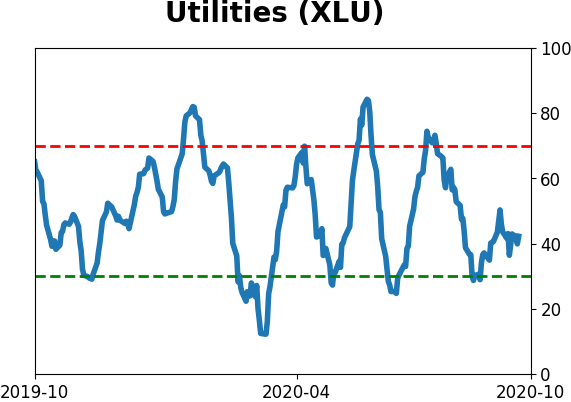
Sector ETF's - 10-Day Moving Average
|
|
|
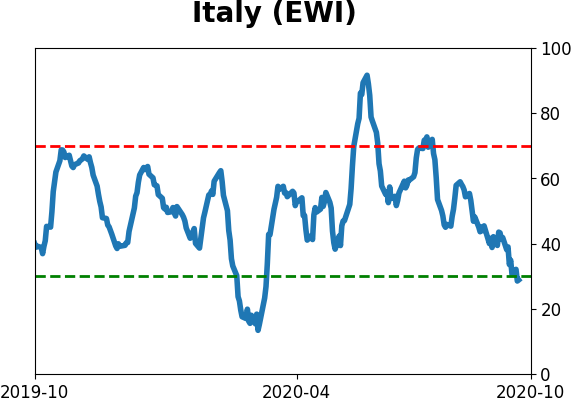
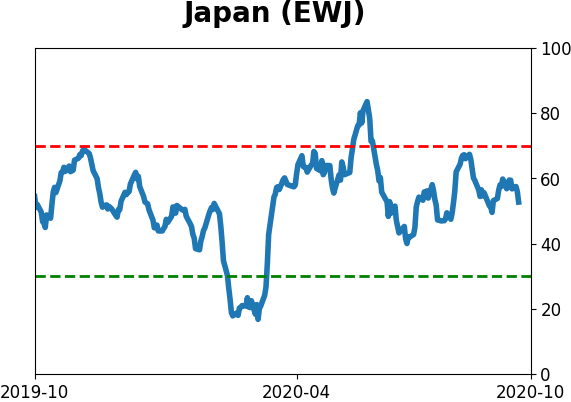
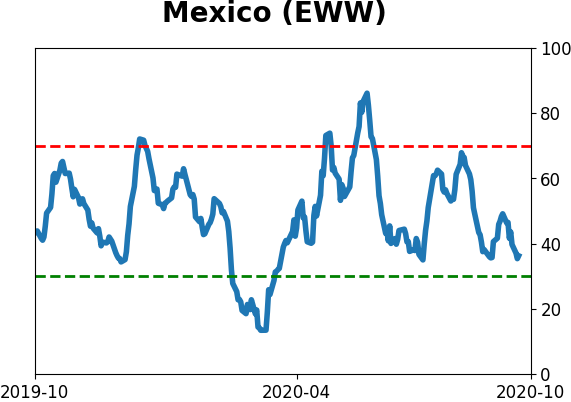
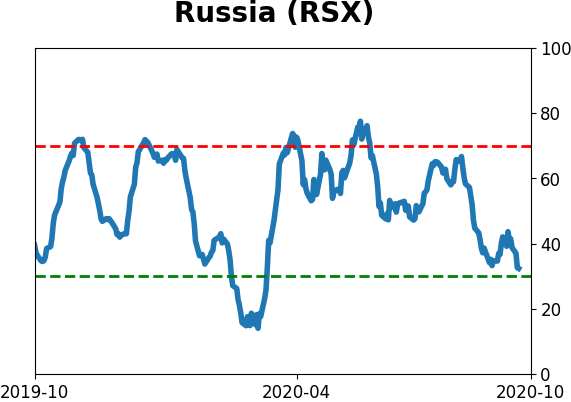
Country ETF's - 10-Day Moving Average
|
|
|
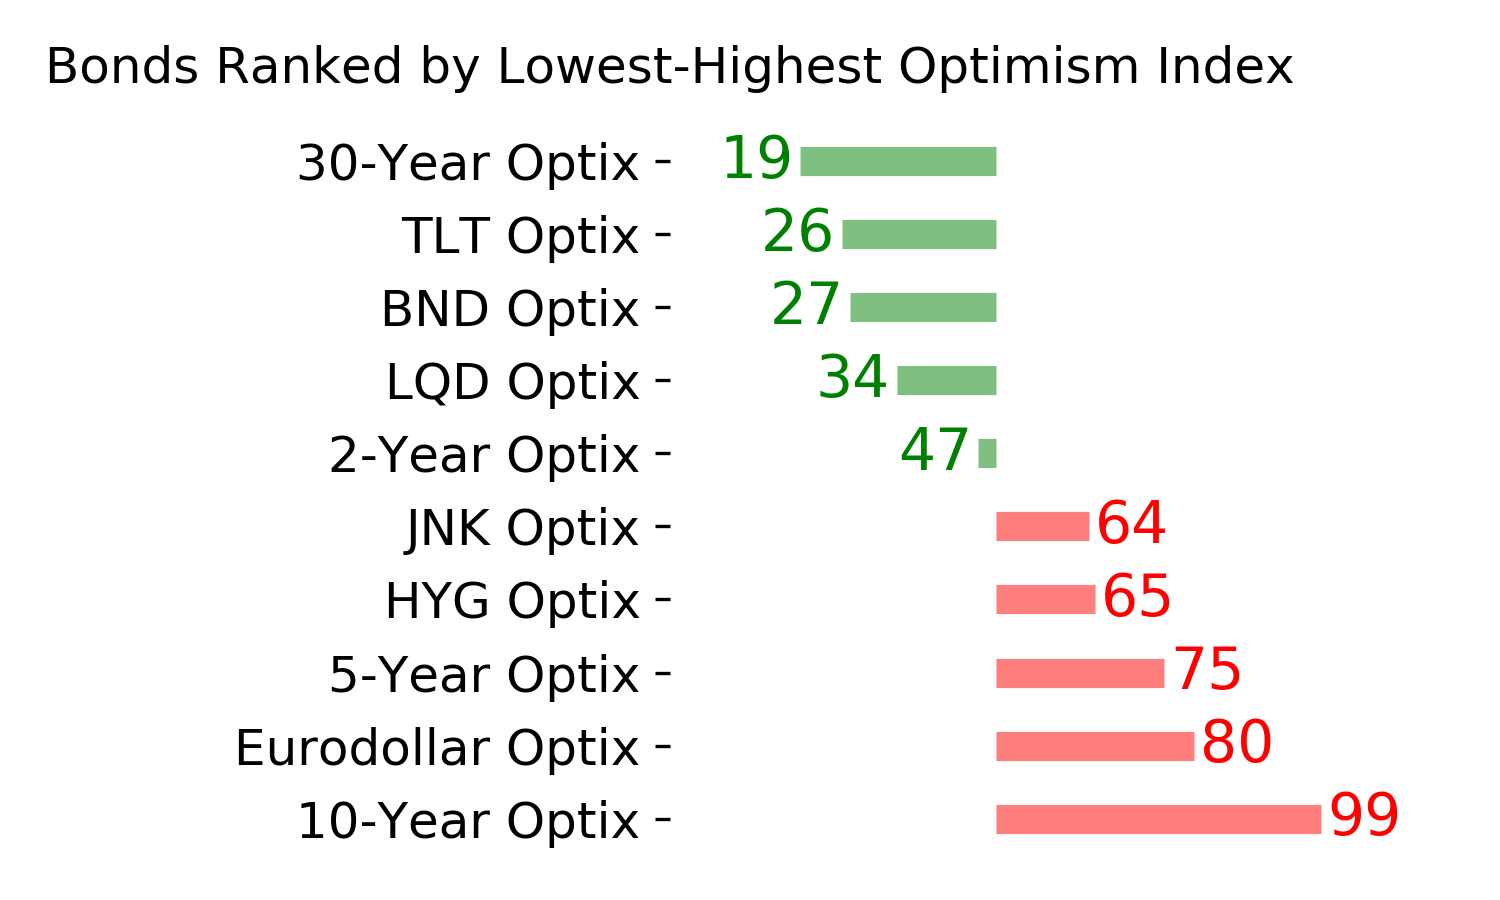
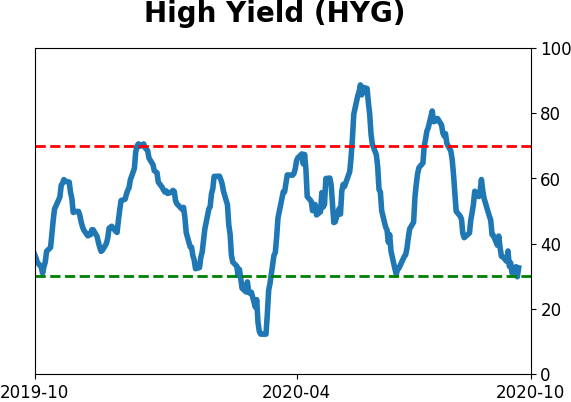
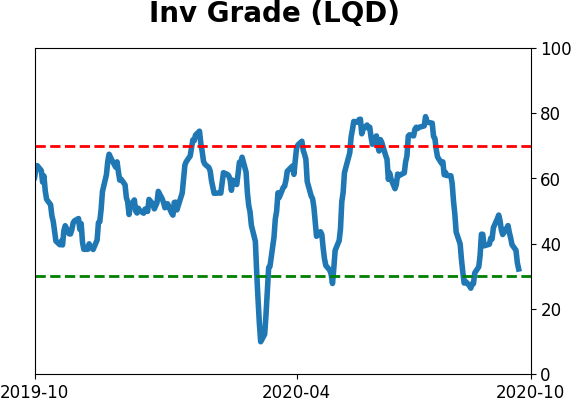
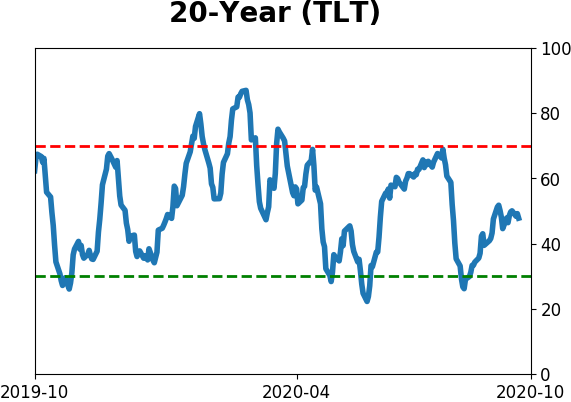
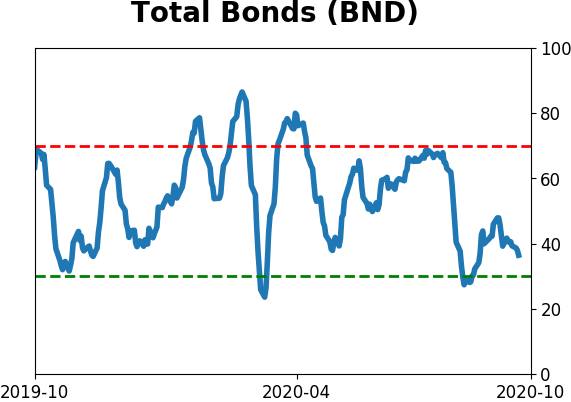
Bond ETF's - 10-Day Moving Average
|
|
|
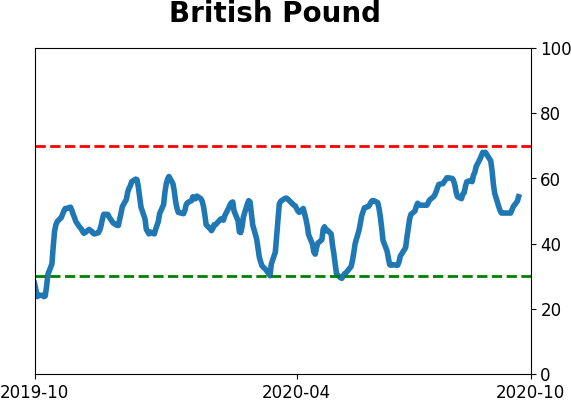
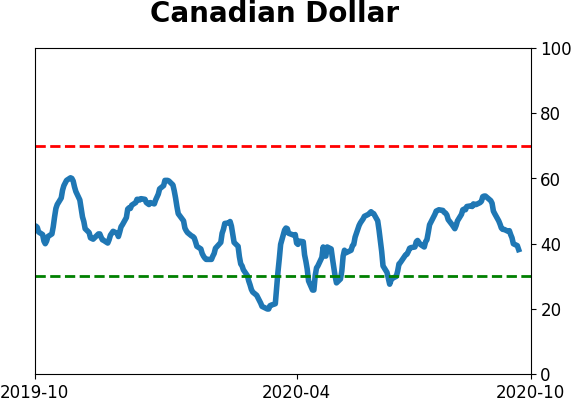
Currency ETF's - 5-Day Moving Average
|
|
|
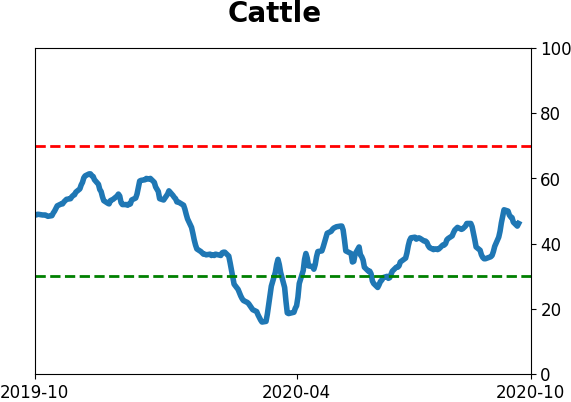
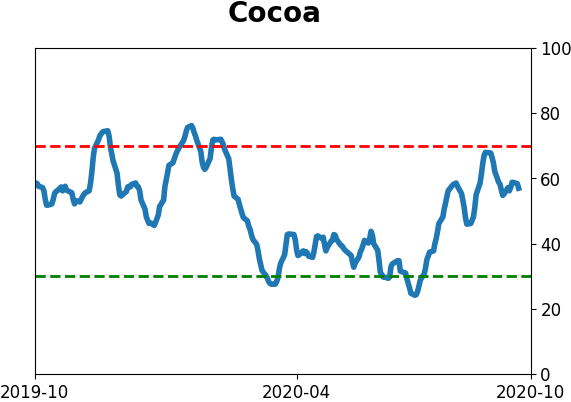
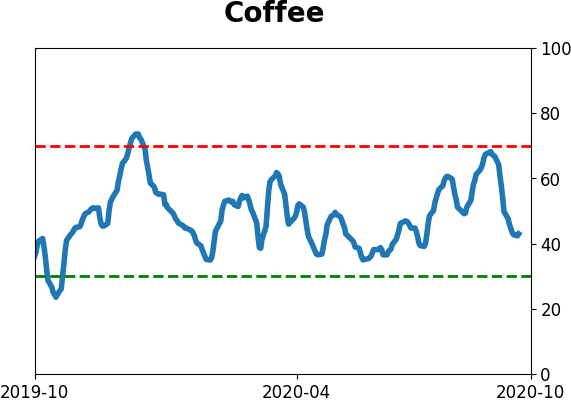
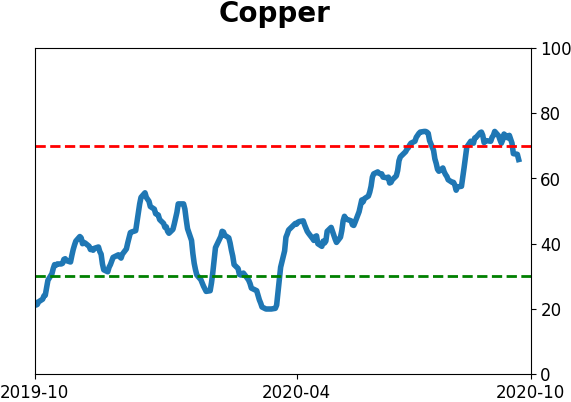
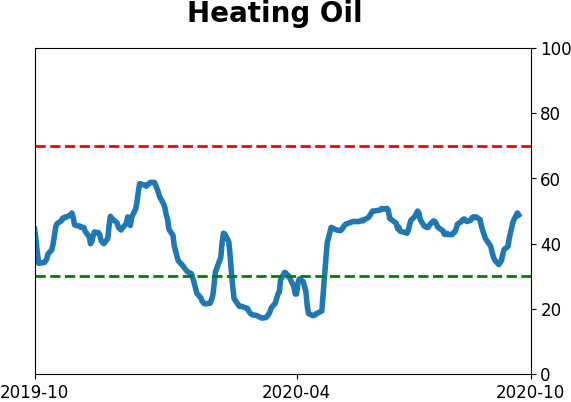
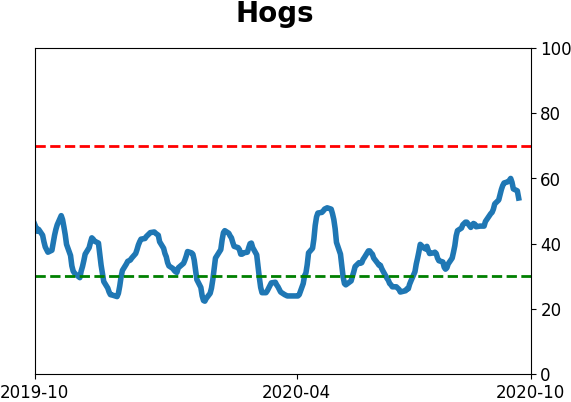
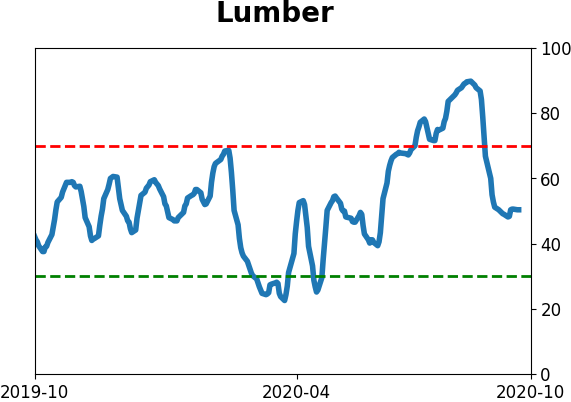
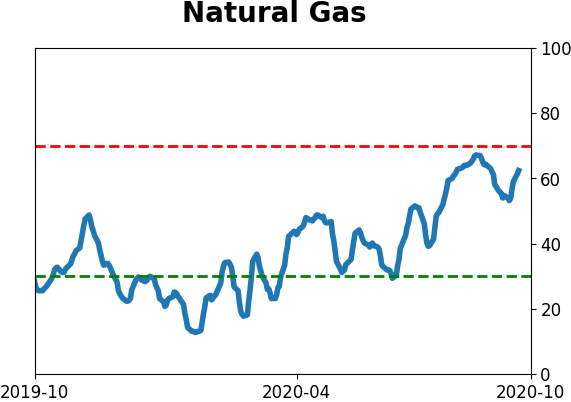
Commodity ETF's - 5-Day Moving Average
|
|