Headlines
|
|
Breath thrust as long-term momentum reaches inflection point:
Stocks enjoyed a broad thrust on Monday as an overwhelming percentage of securities advanced. Coming off of a pullback within an uptrend, that has been a good sign. The long-term McClellan Summation Index fell below zero, though, which bears watching as momentum ebbs.
Emerging market surprises gain momentum:
Economic surprises among emerging markets have continued to rises even as those in other markets like the U.S. have tapered off. This comes as internal momentum in emerging markets, via the McClellan Summation Index, reaches a deeply oversold threshold.
Bottom Line:
- Weight of the evidence has turned mostly neutral, with offsetting extremes in some measures along with a neutral market environment
- Dumb Money Confidence has come down to neutral territory though unrivaled options speculation is still a big worry
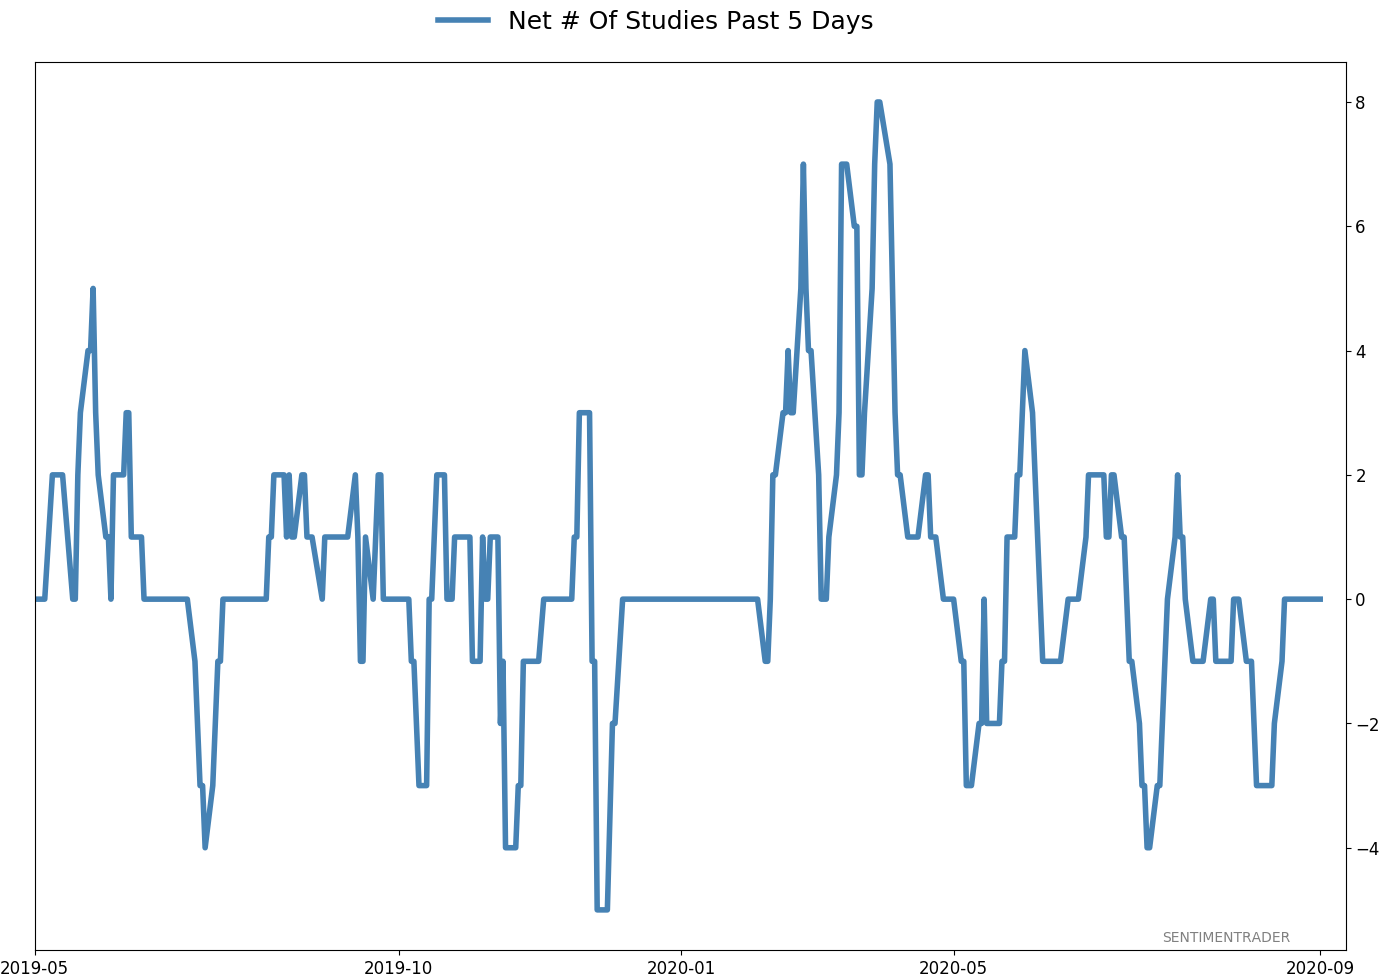
- Active Studies show a heavy positive skew over the longer-term mostly thanks to the March - May breadth thrusts, recoveries, and trend changes
- Signs of extremely skewed preference for tech stocks neared exhaustion by late June, especially relative to industrials and financials (here and here)
- Other markets seem driven in large part toward sentiment in the dollar, which is nearing the point that other medium-term rallies have stalled
|
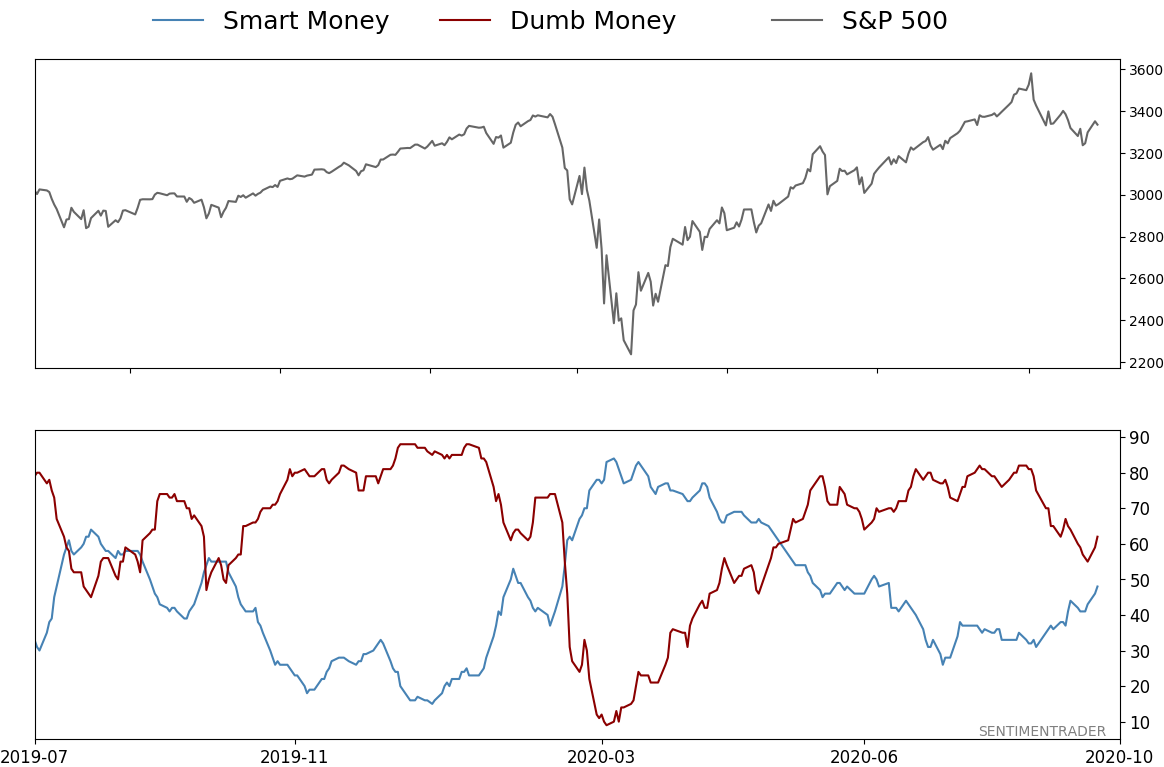
Smart / Dumb Money Confidence
|
Smart Money Confidence: 48%
Dumb Money Confidence: 62%
|
|
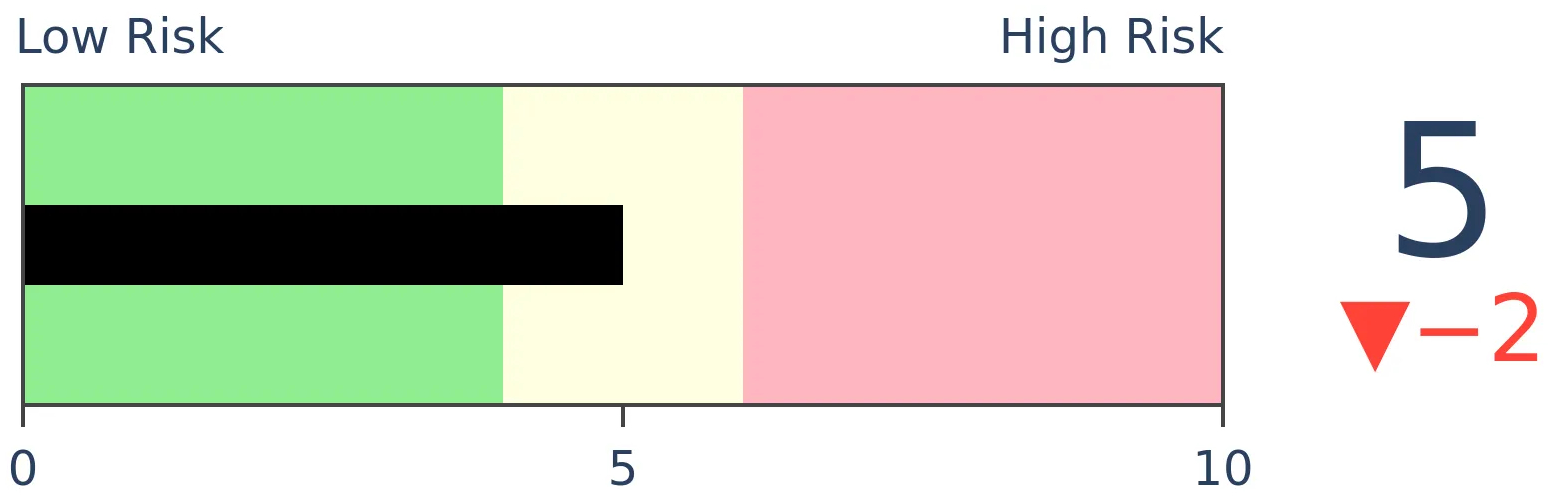
Risk Levels
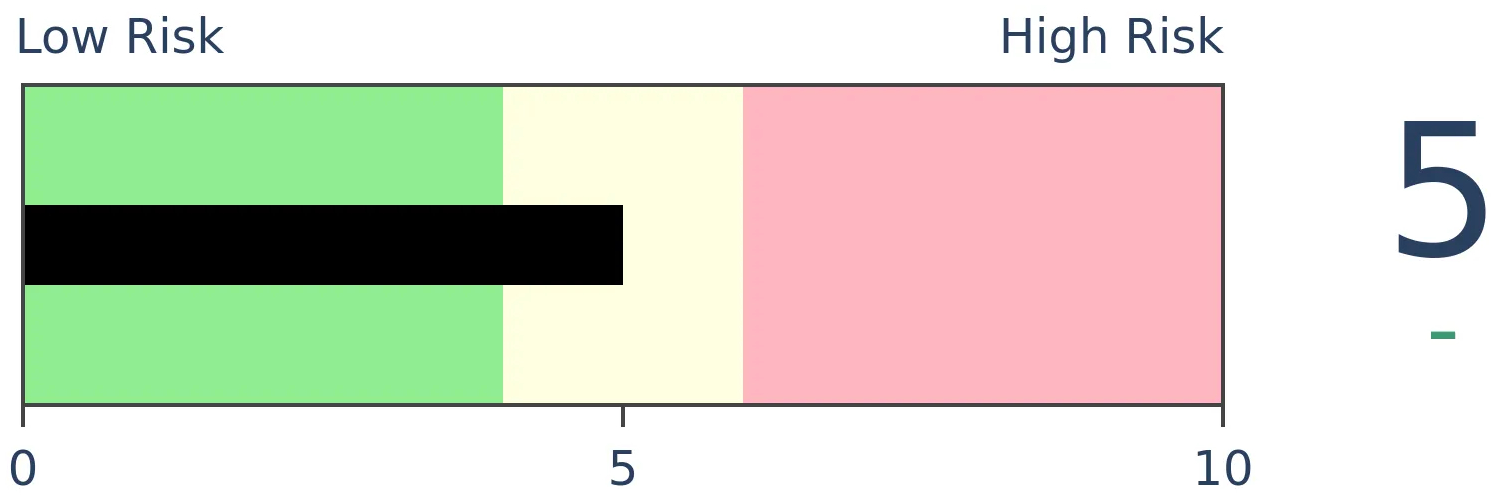
Stocks Short-Term
|
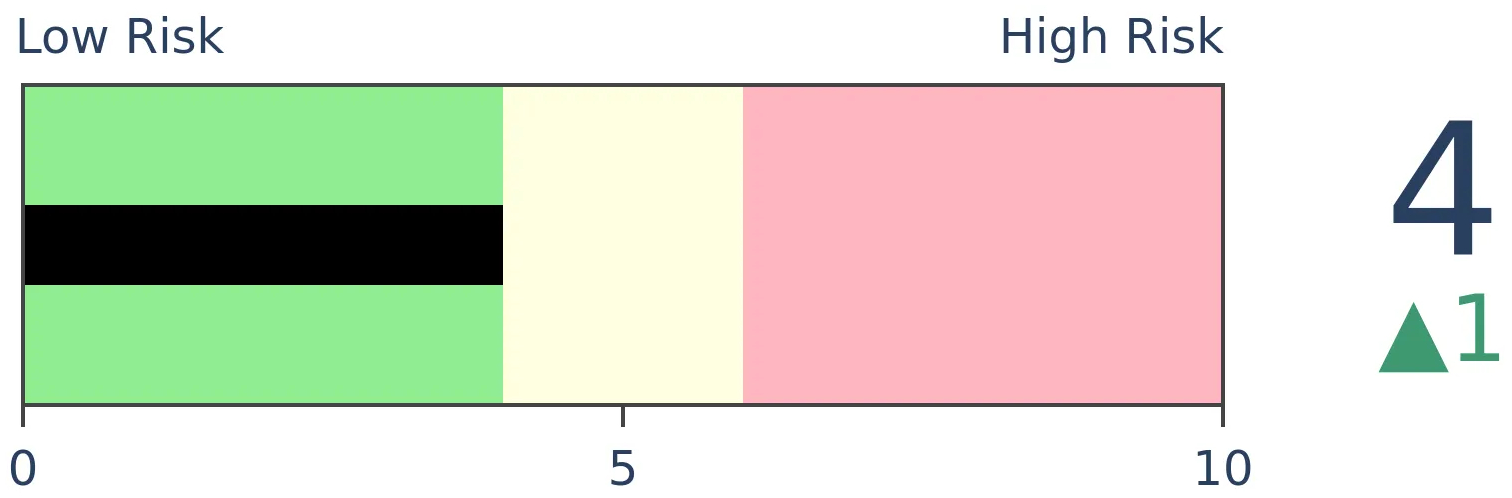
Stocks Medium-Term
|
|
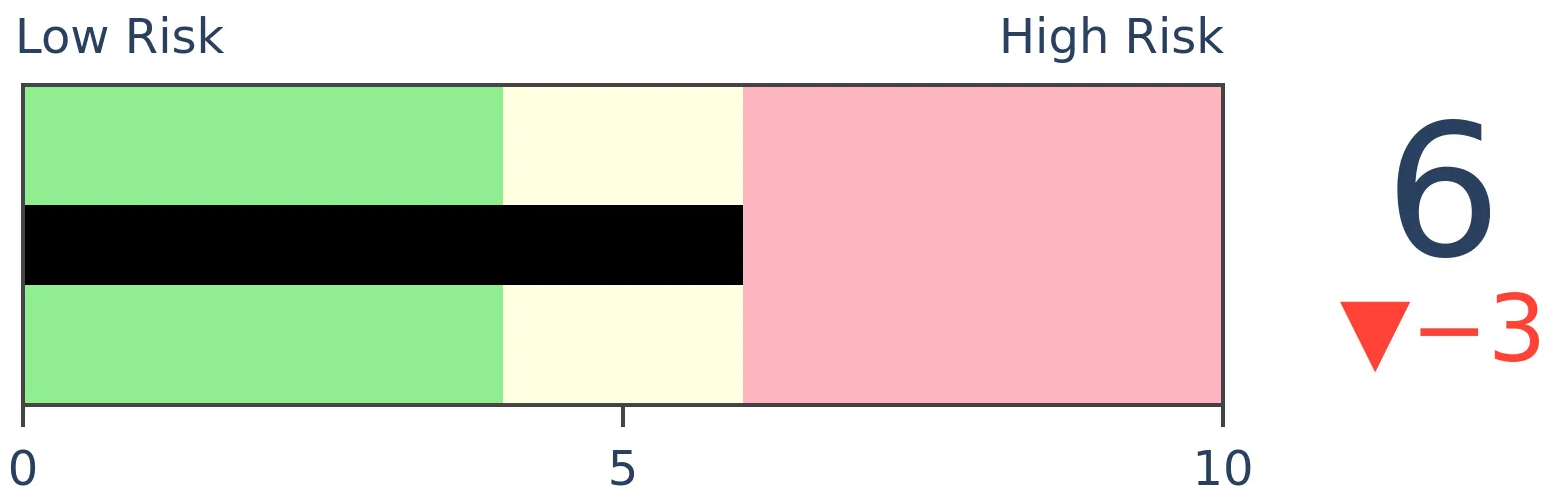
Bonds
|
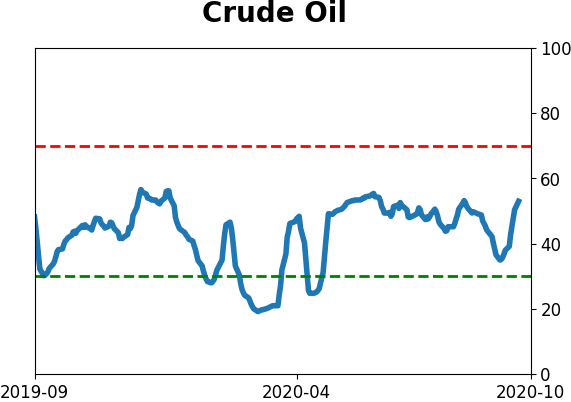
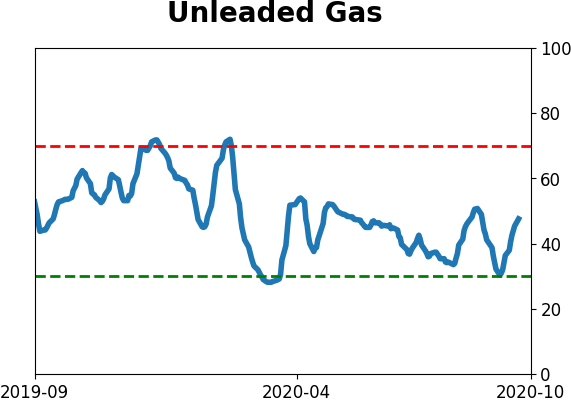
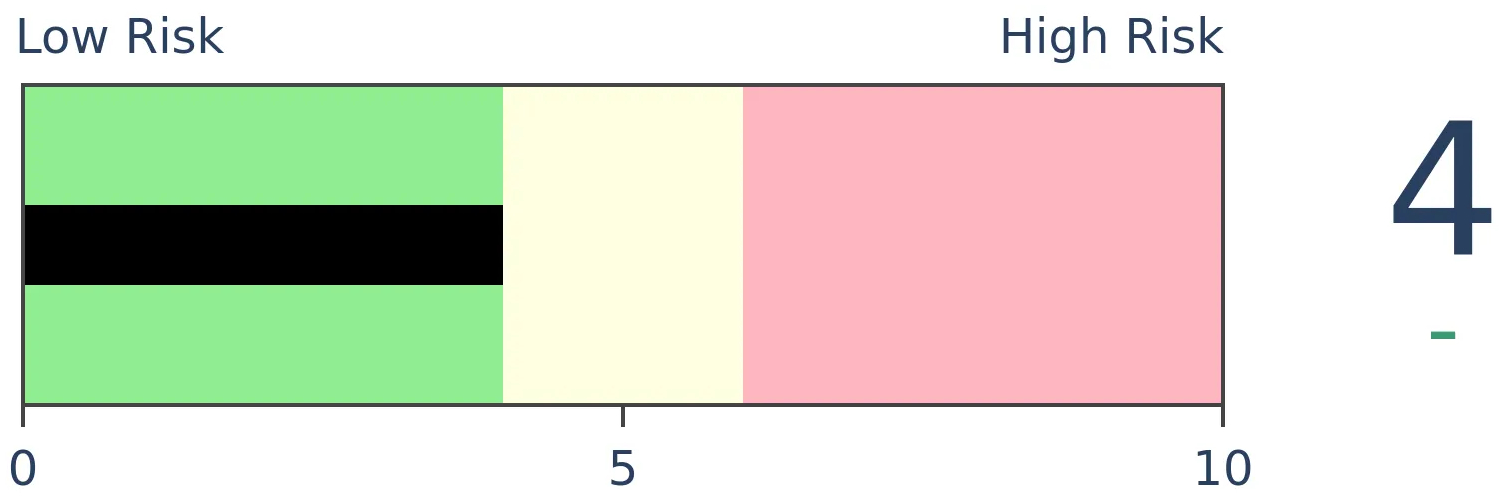
Crude Oil
|
|
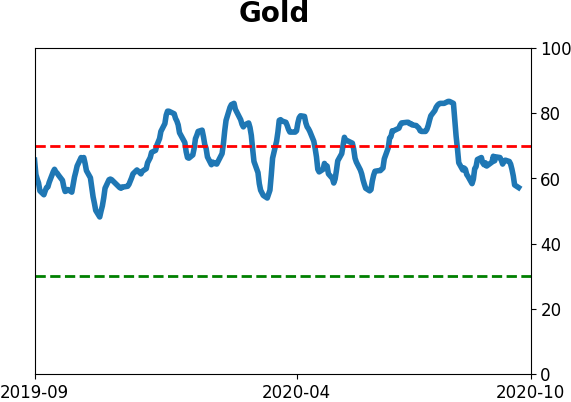
Gold
|
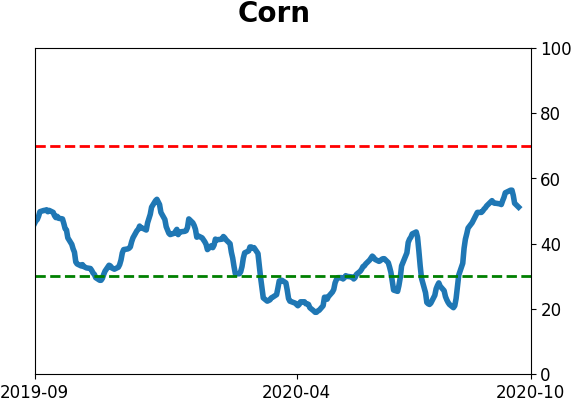
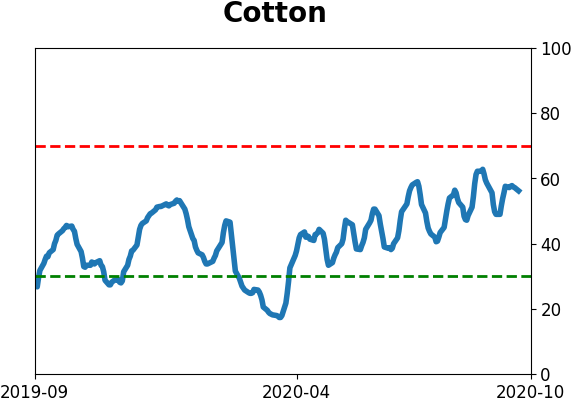
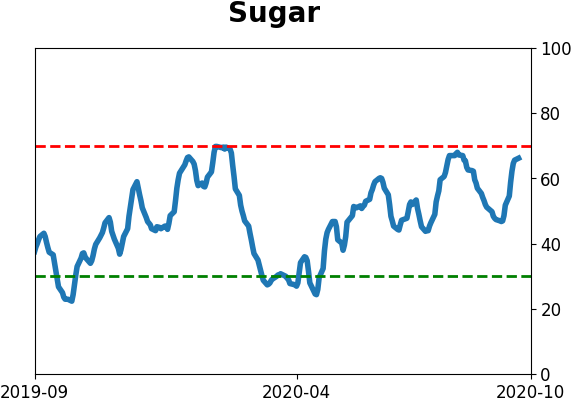
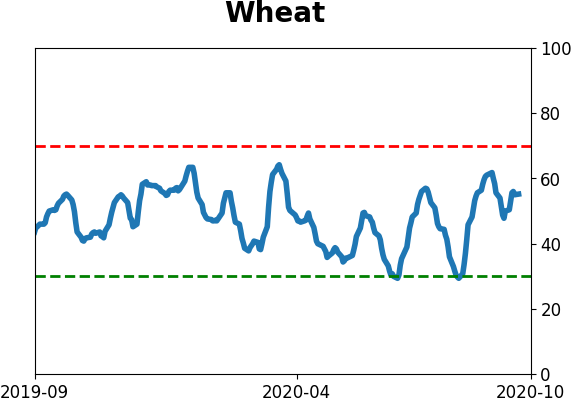
Agriculture
|
|
Research
BOTTOM LINE
Stocks enjoyed a broad thrust on Monday as an overwhelming percentage of securities advanced. Coming off of a pullback within an uptrend, that has been a good sign. The long-term McClellan Summation Index fell below zero, though, which bears watching as momentum ebbs.
FORECAST / TIMEFRAME
None
|
On Monday, stocks enjoyed a broad surge. We noted that the Up Issues Ratio jumped above 85%, which is relatively rare in an uptrending market. There are all kinds of securities that trade on the NYSE, and getting an overwhelming percentage of them to point the same way is like herding cats.
Using a lesser extreme for the test, we can see that forward returns were still very positive.
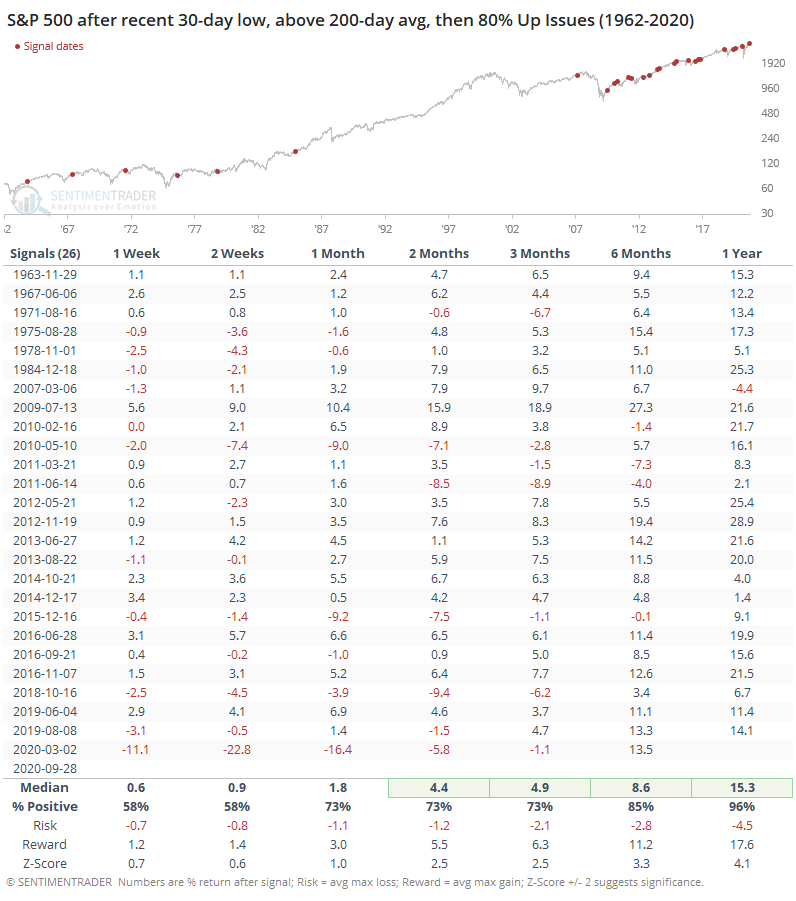
Thanks in part to decimalization, breadth metrics have become more volatile, and so we've seen most of these extremes in just the past decade. Because it was dominated by a persistent bull market, after these signals there were only 4 losses over the next 6 months, and 2 of those were tiny. The risk/reward was heavily skewed to the "reward" side. A year later, there was only 1 small loss out of 26 signals.
The thrust came just as the long-term McClellan Summation Index dropped into negative territory.
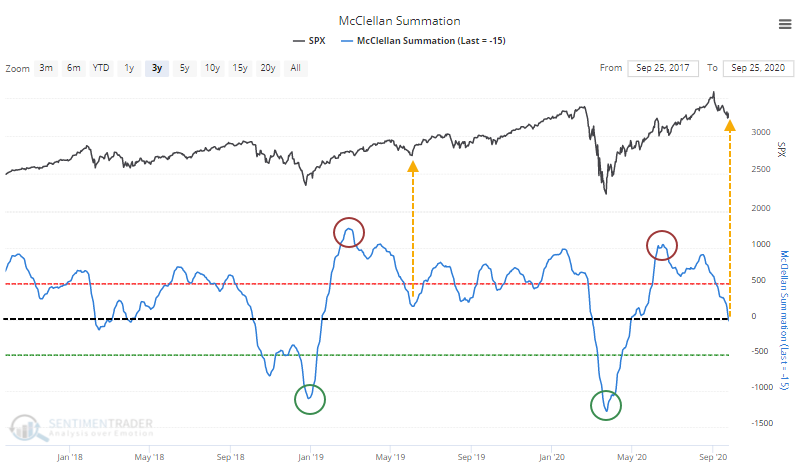
The last time the Summation Index cycled from extreme oversold to extreme overbought within a year, then drifted down toward zero was in May 2019. Buying pressure can in soon and the Summation Index never quite made it down to zero. When it did, forward returns were mostly positive and risk was small.
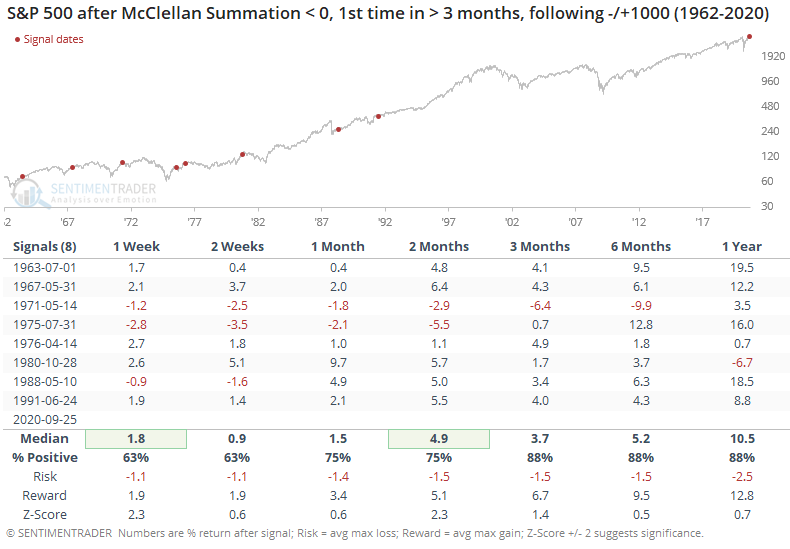
If we ignore the oversold reading and just look for the first dip below zero for the first time in months, following a big overbought reading, then returns were still good.
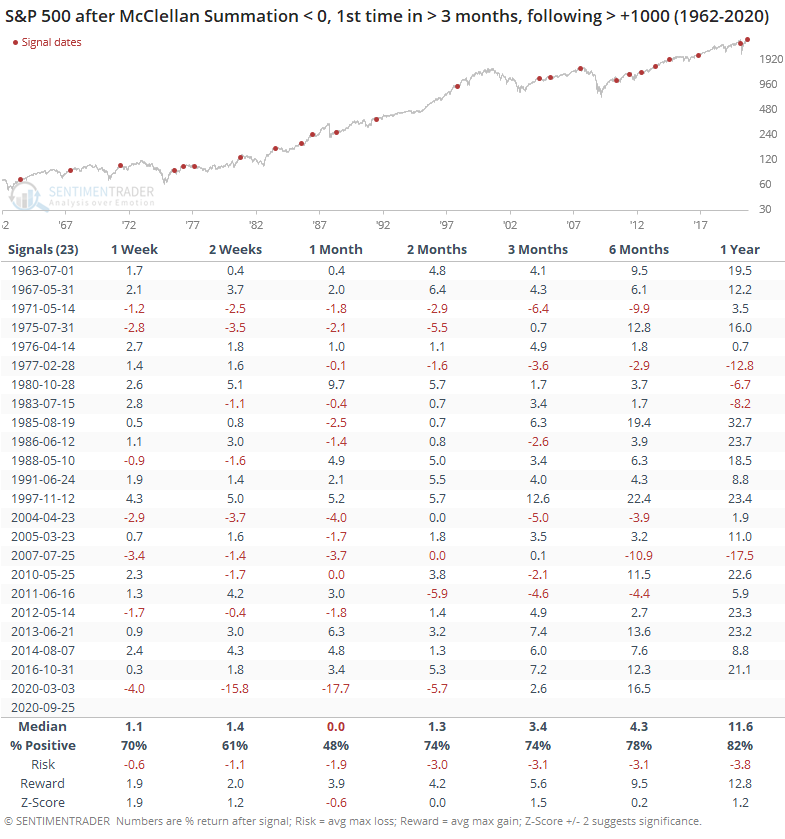
The Summation Index is one of the indicators we monitor to determine the overall market environment. When it's below zero and declining but not yet oversold, it's the worst possible combination. The only caveat here is that it's been above zero for a long time and coming off a very high reading, showing notable positive momentum. That suggests any dip here could be smaller than usual, and a curl up in the Summation Index would help confirm that.
BOTTOM LINE
Economic surprises among emerging markets have continued to rises even as those in other markets like the U.S. have tapered off. This comes as internal momentum in emerging markets, via the McClellan Summation Index, reaches a deeply oversold threshold.
FORECAST / TIMEFRAME
None
|
Economic surprises in emerging economies are picking up. Like most everyone else, when times are bad, economists tend to think they're going to get even worse; when times are good, they extrapolate that to mean even better times ahead.
Almost everything related to markets, where humans are involved, cycle from good to less good to bad to less bad, and back again. In emerging markets, economists had predicted horrendous economic numbers, and while they indeed were, they weren't as bad as forecast. That means that economic surprises have been very positive.
They're positive pretty much everywhere else, too. The difference is that surprises in emerging economies continue to get more and more positive, while surprises in places like the U.S. have been easing after a surge earlier in the summer.
Over the past month, surprises in emerging markets have shown much better relative strength versus surprises in the U.S.
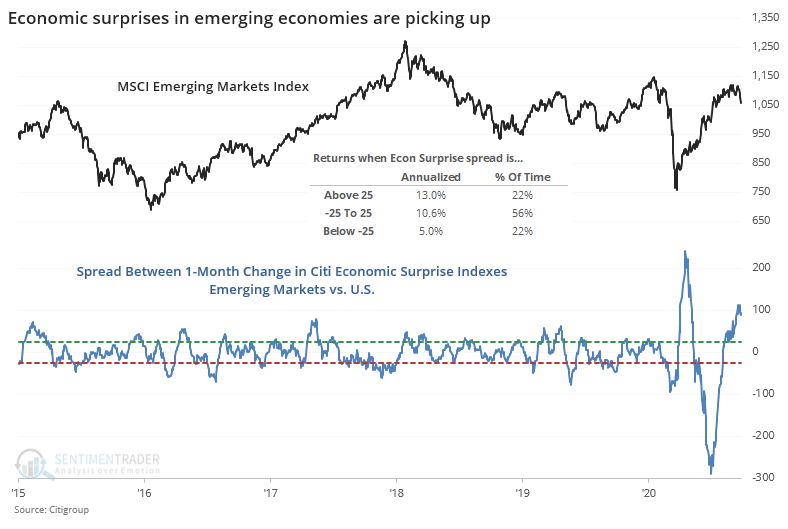
This year has seen unprecedented volatility in economic numbers because of uncertainty surrounding the pandemic, so surprises have swung wildly from one extreme to the next. Historically, we can see above that when emerging economy surprises were at least 25 points higher than surprises in the U.S., which happened on about 22% of days since 2003, emerging market indexes did quite well. Almost 3 times better than when surprises were -25.
Looking at the markets relative to each other, the same pattern was clear.
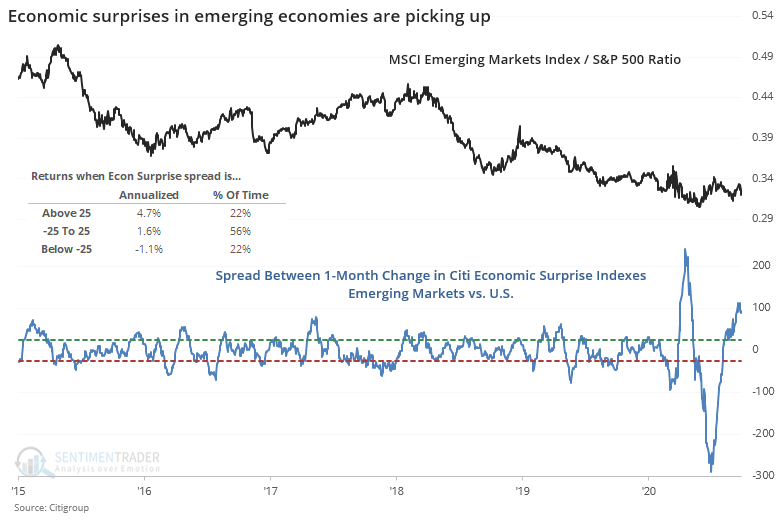
Emerging markets have underperformed the U.S. for a decade, but even so, when their surprises were trending well ahead of those in the U.S., the Emerging Markets / S&P 500 ratio tended to do quite well.
Longer-term internal momentum in these stocks has been horrid. While emerging market indexes haven't fared that badly in recent weeks, the McClellan Summation Index shows heavy internal weakness, falling below zero and declining - not a great combination. But at least it has gone far enough to be considered extremely oversold. The Backtest Engine shows that when it goes this far then starts to reverse, emerging markets mostly saw gains ahead.
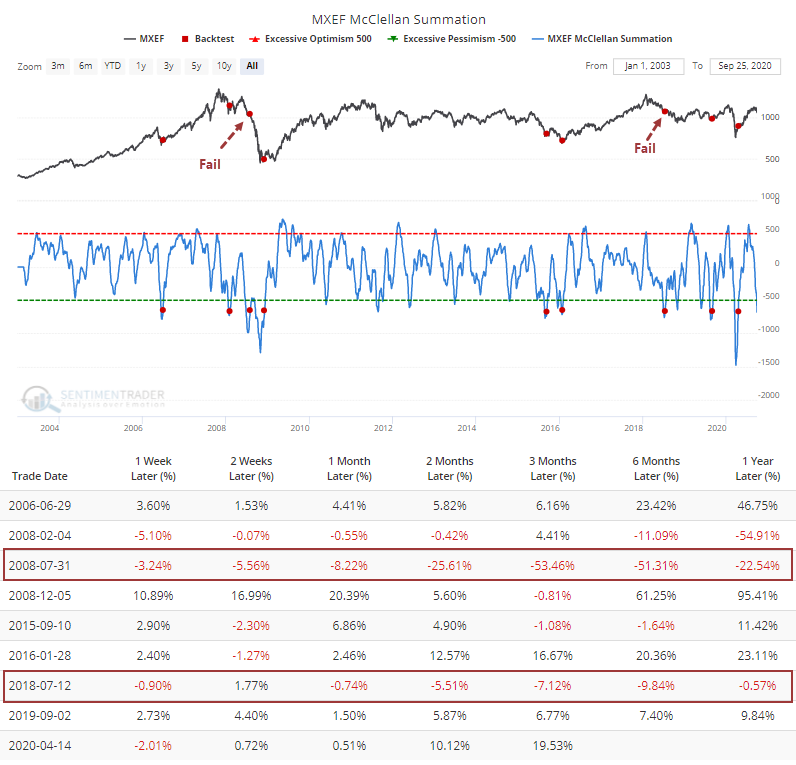
The biggest exceptions were in Julys 2008 and 2018. A big warning sign triggered when the Summation Index started to recover from its extreme, yet prices didn't respond well. That's something to watch for here, too.
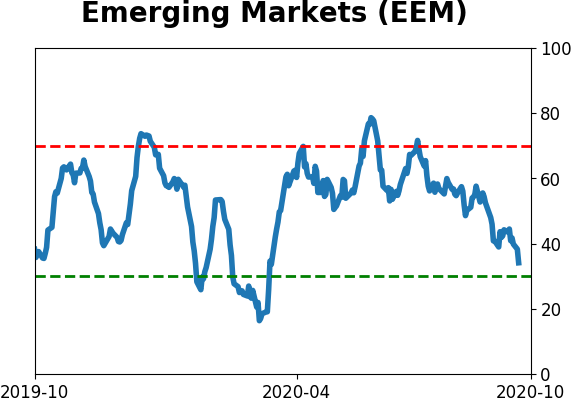
The relatively poor reception to these stocks has caused investors to leave formerly-popular funds like EEM. Shares outstanding there have shrunk to the fewest since 2008.
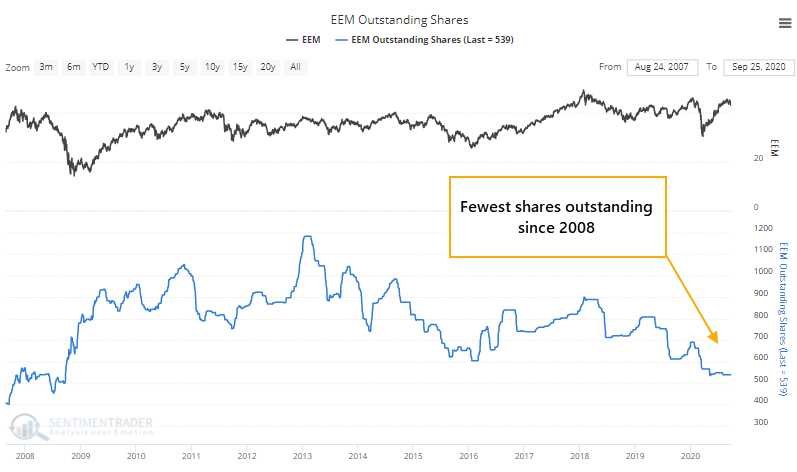
In some ETFs, watching shares outstanding is misleading because share issuance can either come from buying demand (like we usually see in funds like EEM) or selling demand from short-sellers (like we're probably seeing in XLE right now). When shares outstanding decline in most funds, it's a fairly reliable signal that investor enthusiasm has waned. In EEM, it's been a decent contrary signal, even though some of that demand is likely just leaking to other emerging market ETFs.
There has been more and more interest in non-U.S. markets in recent weeks, as signs of speculative excess, virus issues, and election uncertainty have added to low rates and nosebleed valuations. Those betting on emerging markets to finally assert more of an influence have been wanting for a decade and there is little sign that things are changing yet. The relative momentum in economic surprises is a minor positive, and it would be a better sign if internal momentum finally starts to shift to a more positive stance.
Active Studies
| Time Frame | Bullish | Bearish | | Short-Term | 0 | 1 | | Medium-Term | 1 | 12 | | Long-Term | 47 | 2 |
|
Indicators at Extremes
Portfolio
| Position | Description | Weight % | Added / Reduced | Date | | Stocks | RSP | 15.2 | Reduced 4.2% | 2020-09-03 | | Bonds | 10% TLT, 10% BND, 10% SCHP | 30.0 | Added 30% | 2020-09-09 | | Commodities | GCC | 2.4 | Reduced 2.1%
| 2020-09-04 | | Precious Metals | GDX | 5.0 | Added 5% | 2020-09-09 | | Special Situations | XLE | 4.9 | Added 5.1% | 2020-09-03 | | Cash | | 42.5 | | |
|
Updates (Changes made today are underlined)
After stocks bottomed on March 23rd, they enjoyed a historic buying thrust and retraced a larger amount of the decline than "just a bear market rally" tends to. Through June, there were signs of breadth thrusts, recoveries, and trend changes that have an almost unblemished record at preceding higher prices over a 6-12 month time frame. On a shorter-term basis, our indicators have been showing high optimism, with Dumb Money Confidence recently above 80%, along with signs of reckless speculation during what appears to be an unhealthy market environment, historically a bad combination. While there are certainly some outlier indicators that are showing apathy or even outright pessimism, a weight-of-the-evidence approach suggests high risk over a multi-week to multi-month time frame. That has been the case since July, even arguably June and yet the major indexes hit continual new highs through late August. With the indicators and studies failing to precede any weakness, I've been hesitant to lower my already-low exposure. I am getting increasingly anxious about the oddities we're seeing, though, and lowered it again. This account is mostly about comfort with risk for me, and right now I'm not at all comfortable with any of it. In more than 25 years of experience, this is the oddest market I've ever seen. I lowered exposure again - likely the lowest I'm willing to go at this point given longer-term positives - and decided to switch to an equal-weight version of the S&P 500 index. I've become intensely uncomfortable with the concentration in the cap-weighted index. Our studies have been mixed with regard to the potential for the equal-weight version to outperform the cap version going forward, so historical support isn't overwhelming. I'm also increasingly interested again in energy stocks, starting with a small allocation. I got burned in March with the unprecedented geopolitical spat that hammered those stocks then but the longer-term setup is decent. In this account, I’ve roughly followed what has become known as the All Weather portfolio popularized by Ray Dalio. It allocates across four broad assets, designed to hold up no matter the market environment. The goal is modest positive returns while limiting large, sustained losses. I typically use popular ETFs, with low costs. At times, I will swap out for a fund I believe has better prospects, or simply lower fees if not. At other times, I will diverge quite a bit from baseline allocations, largely depending on the indicators and studies we discuss on the site. I've gotten away from this in the past, using "cash" as a substitute for "bonds" and with rates stuck at 0%, that has become less appetizing. I'm trying to get back more toward the baselines with less dramatic swings in either direction. The base allocation I use is the following: Stocks: 35%
Bonds: 45%
Precious Metals: 7.5%
Commodities: 7.5%
Cash / Special Opportunities: 5%
RETURN YTD: -1.7% 2019: 12.6%, 2018: 0.6%, 2017: 3.8%, 2016: 17.1%, 2015: 9.2%, 2014: 14.5%, 2013: 2.2%, 2012: 10.8%, 2011: 16.5%, 2010: 15.3%, 2009: 23.9%, 2008: 16.2%, 2007: 7.8%
|
|
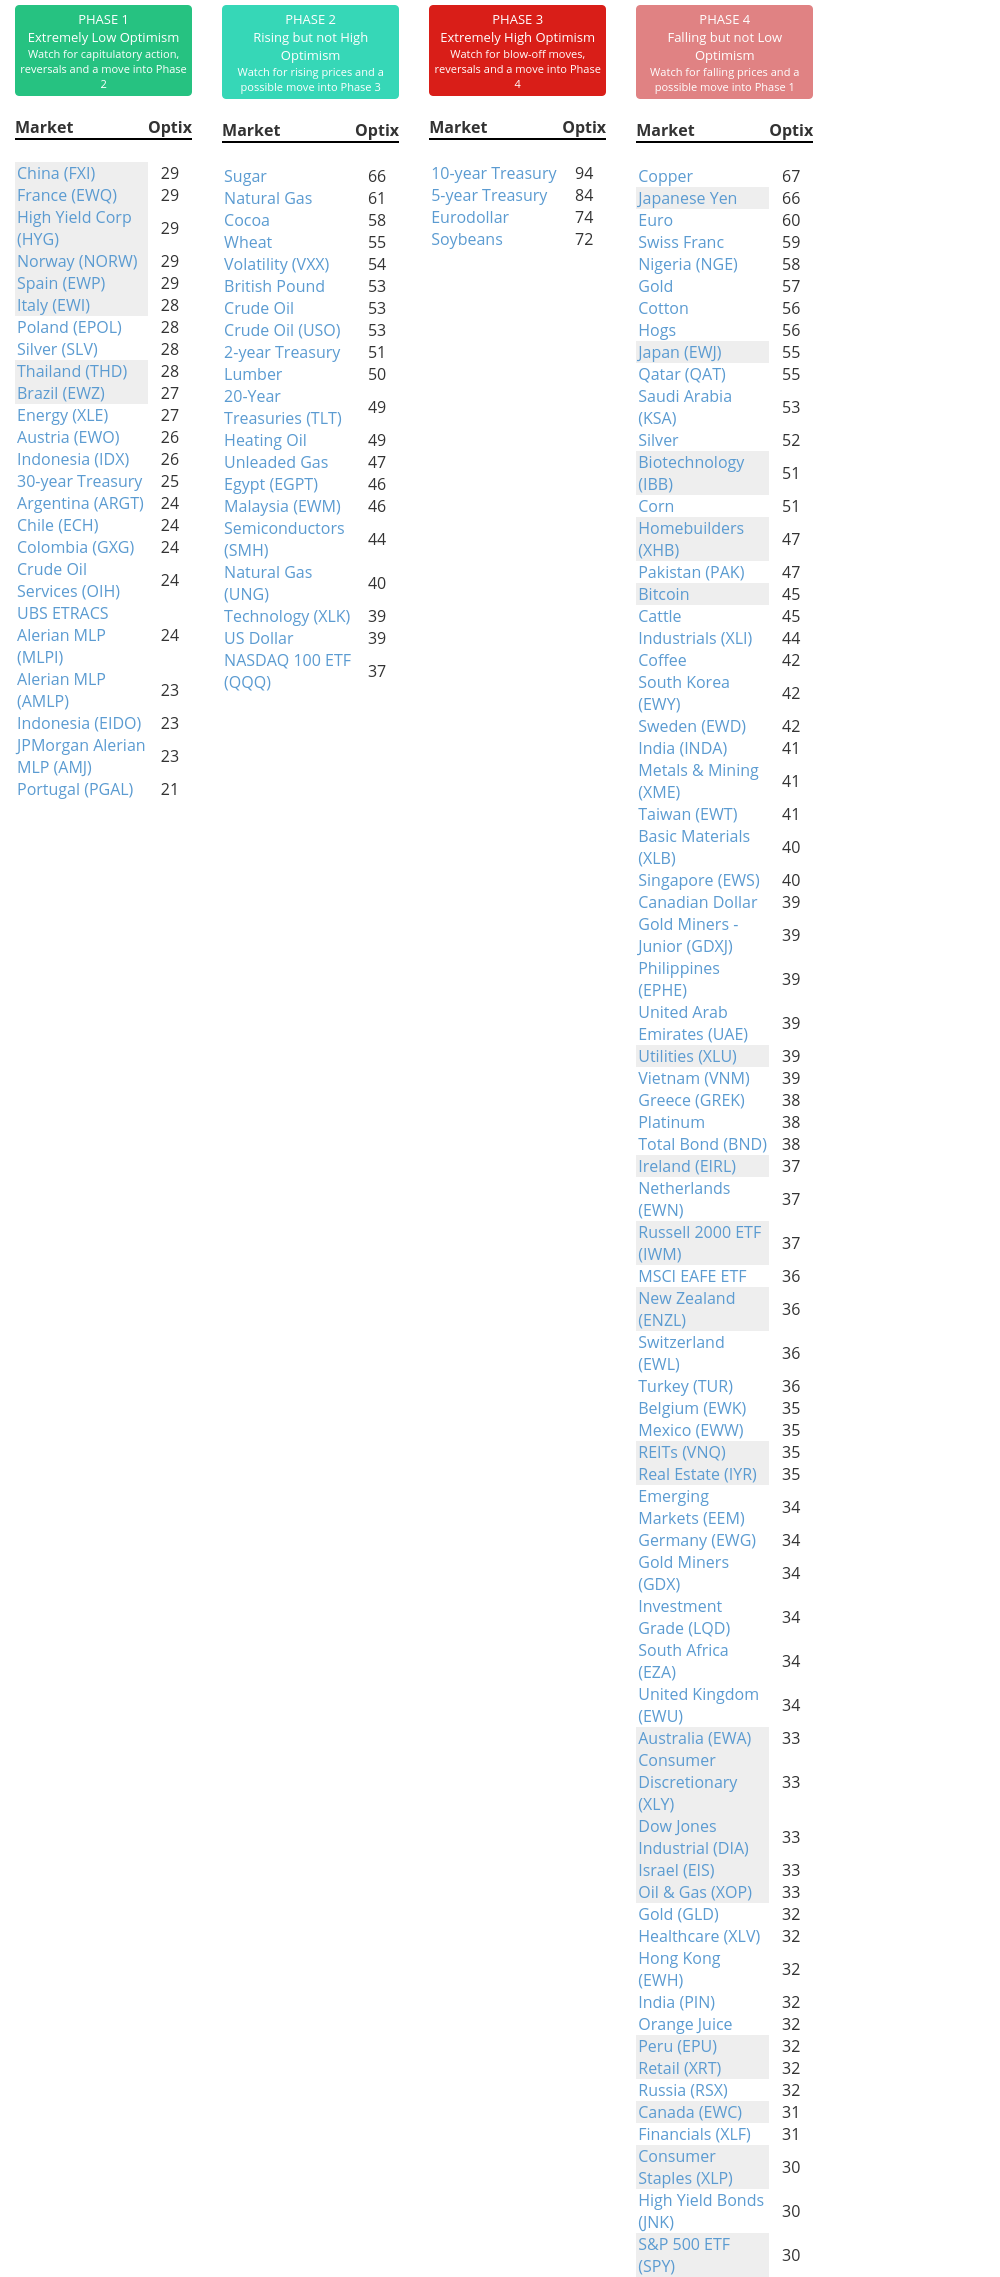
Phase Table
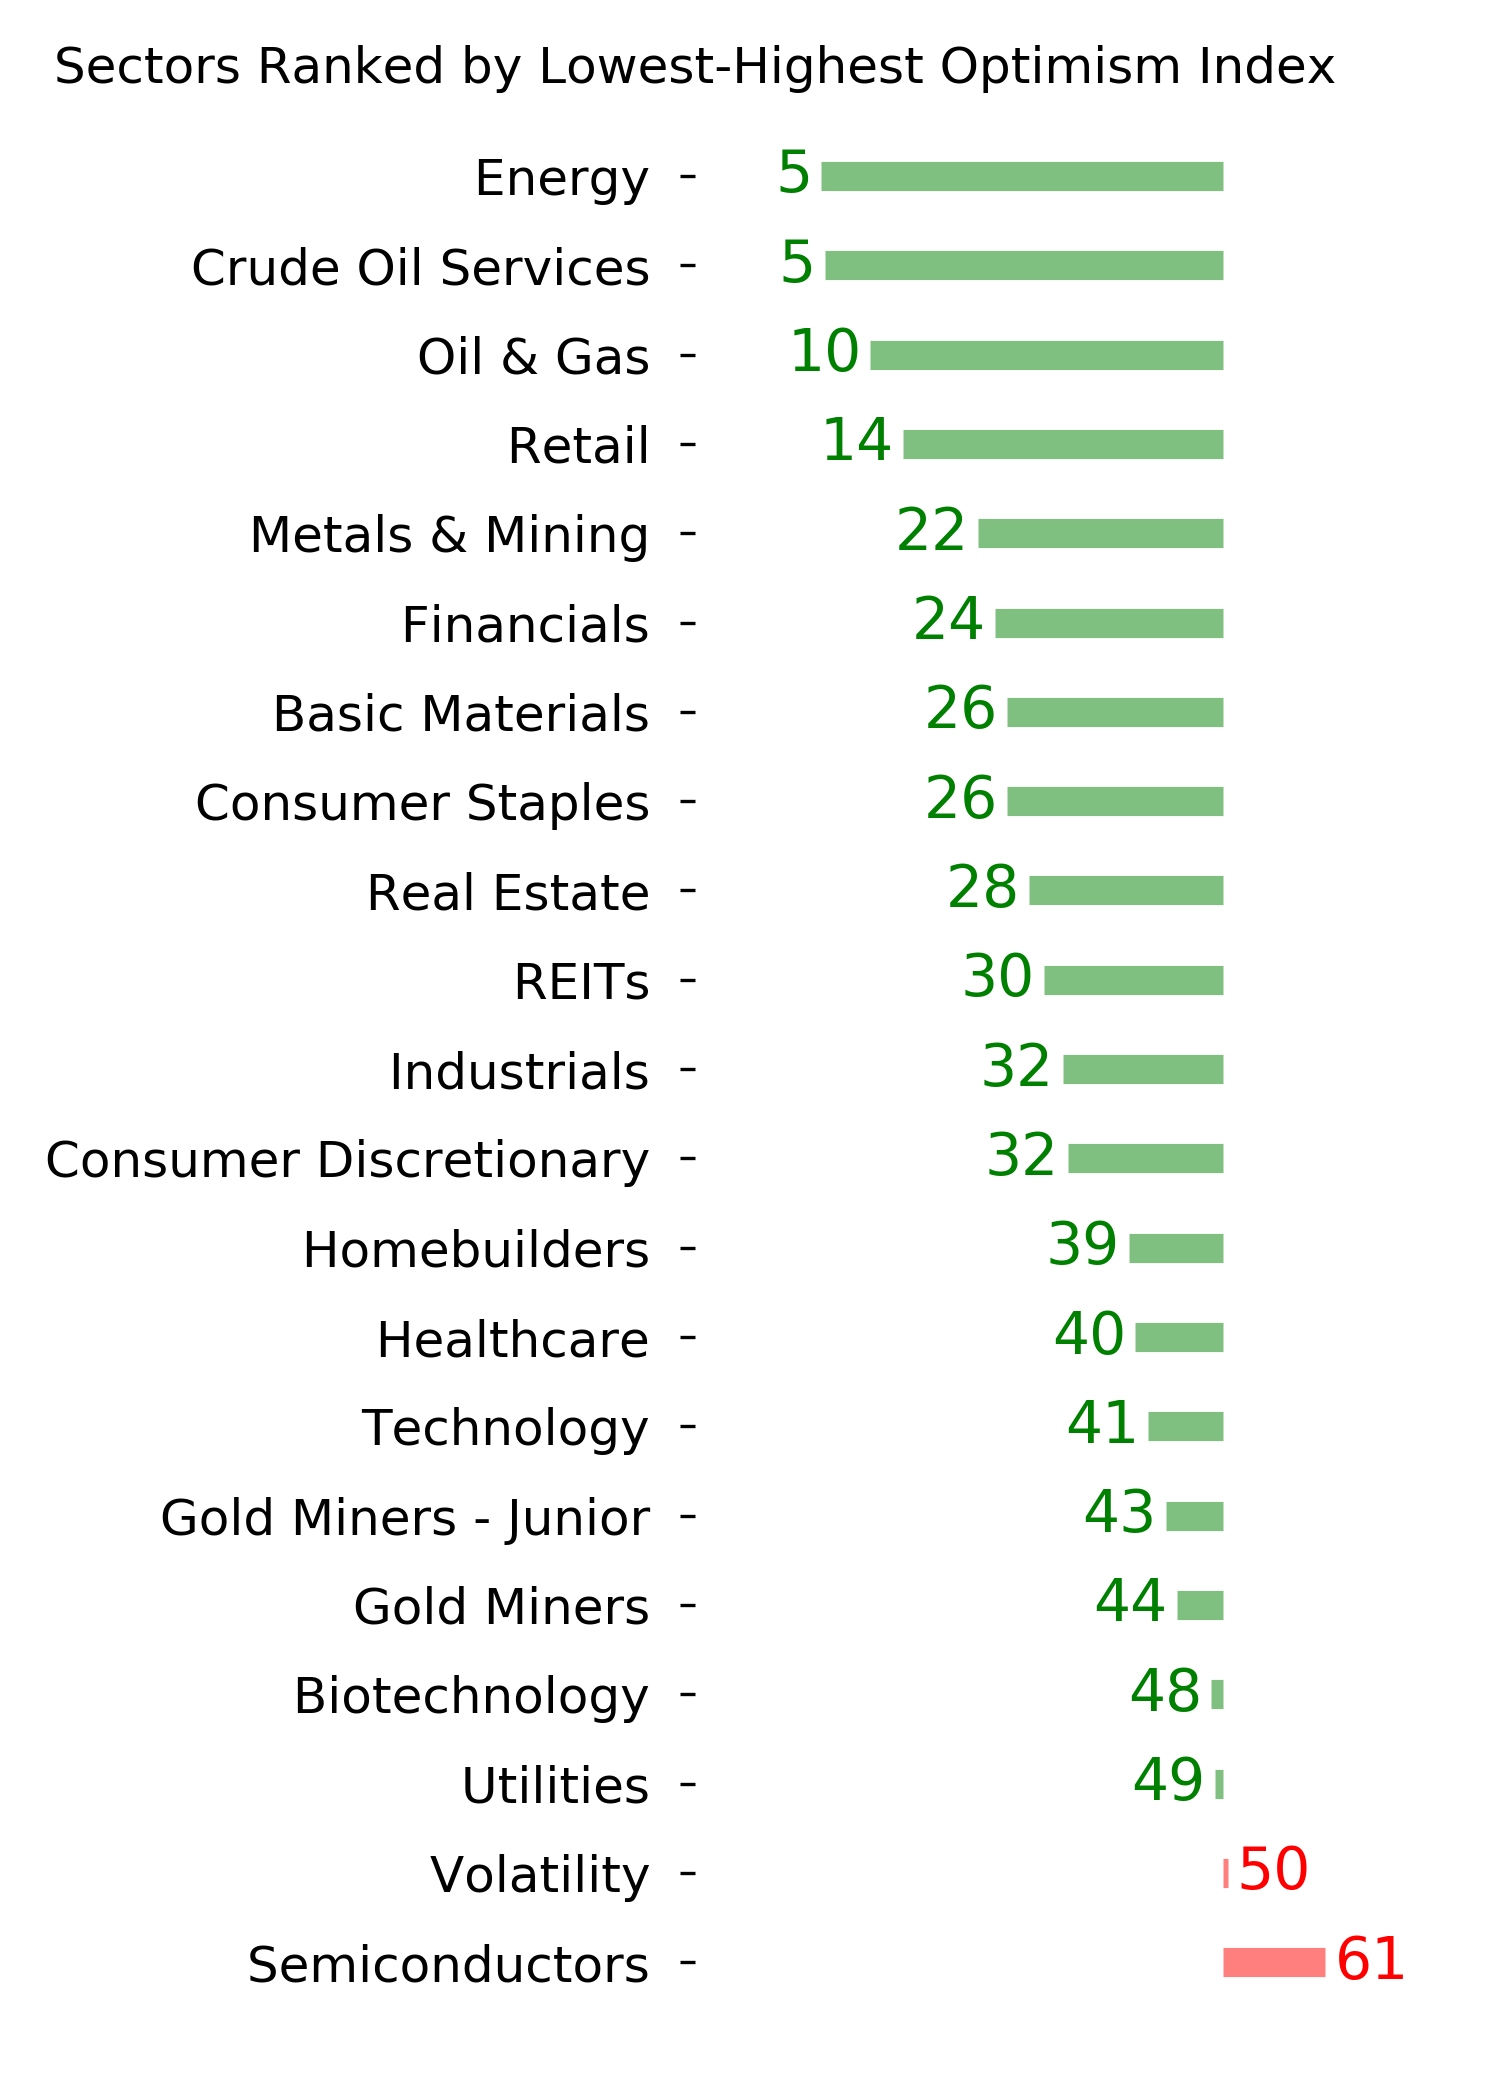
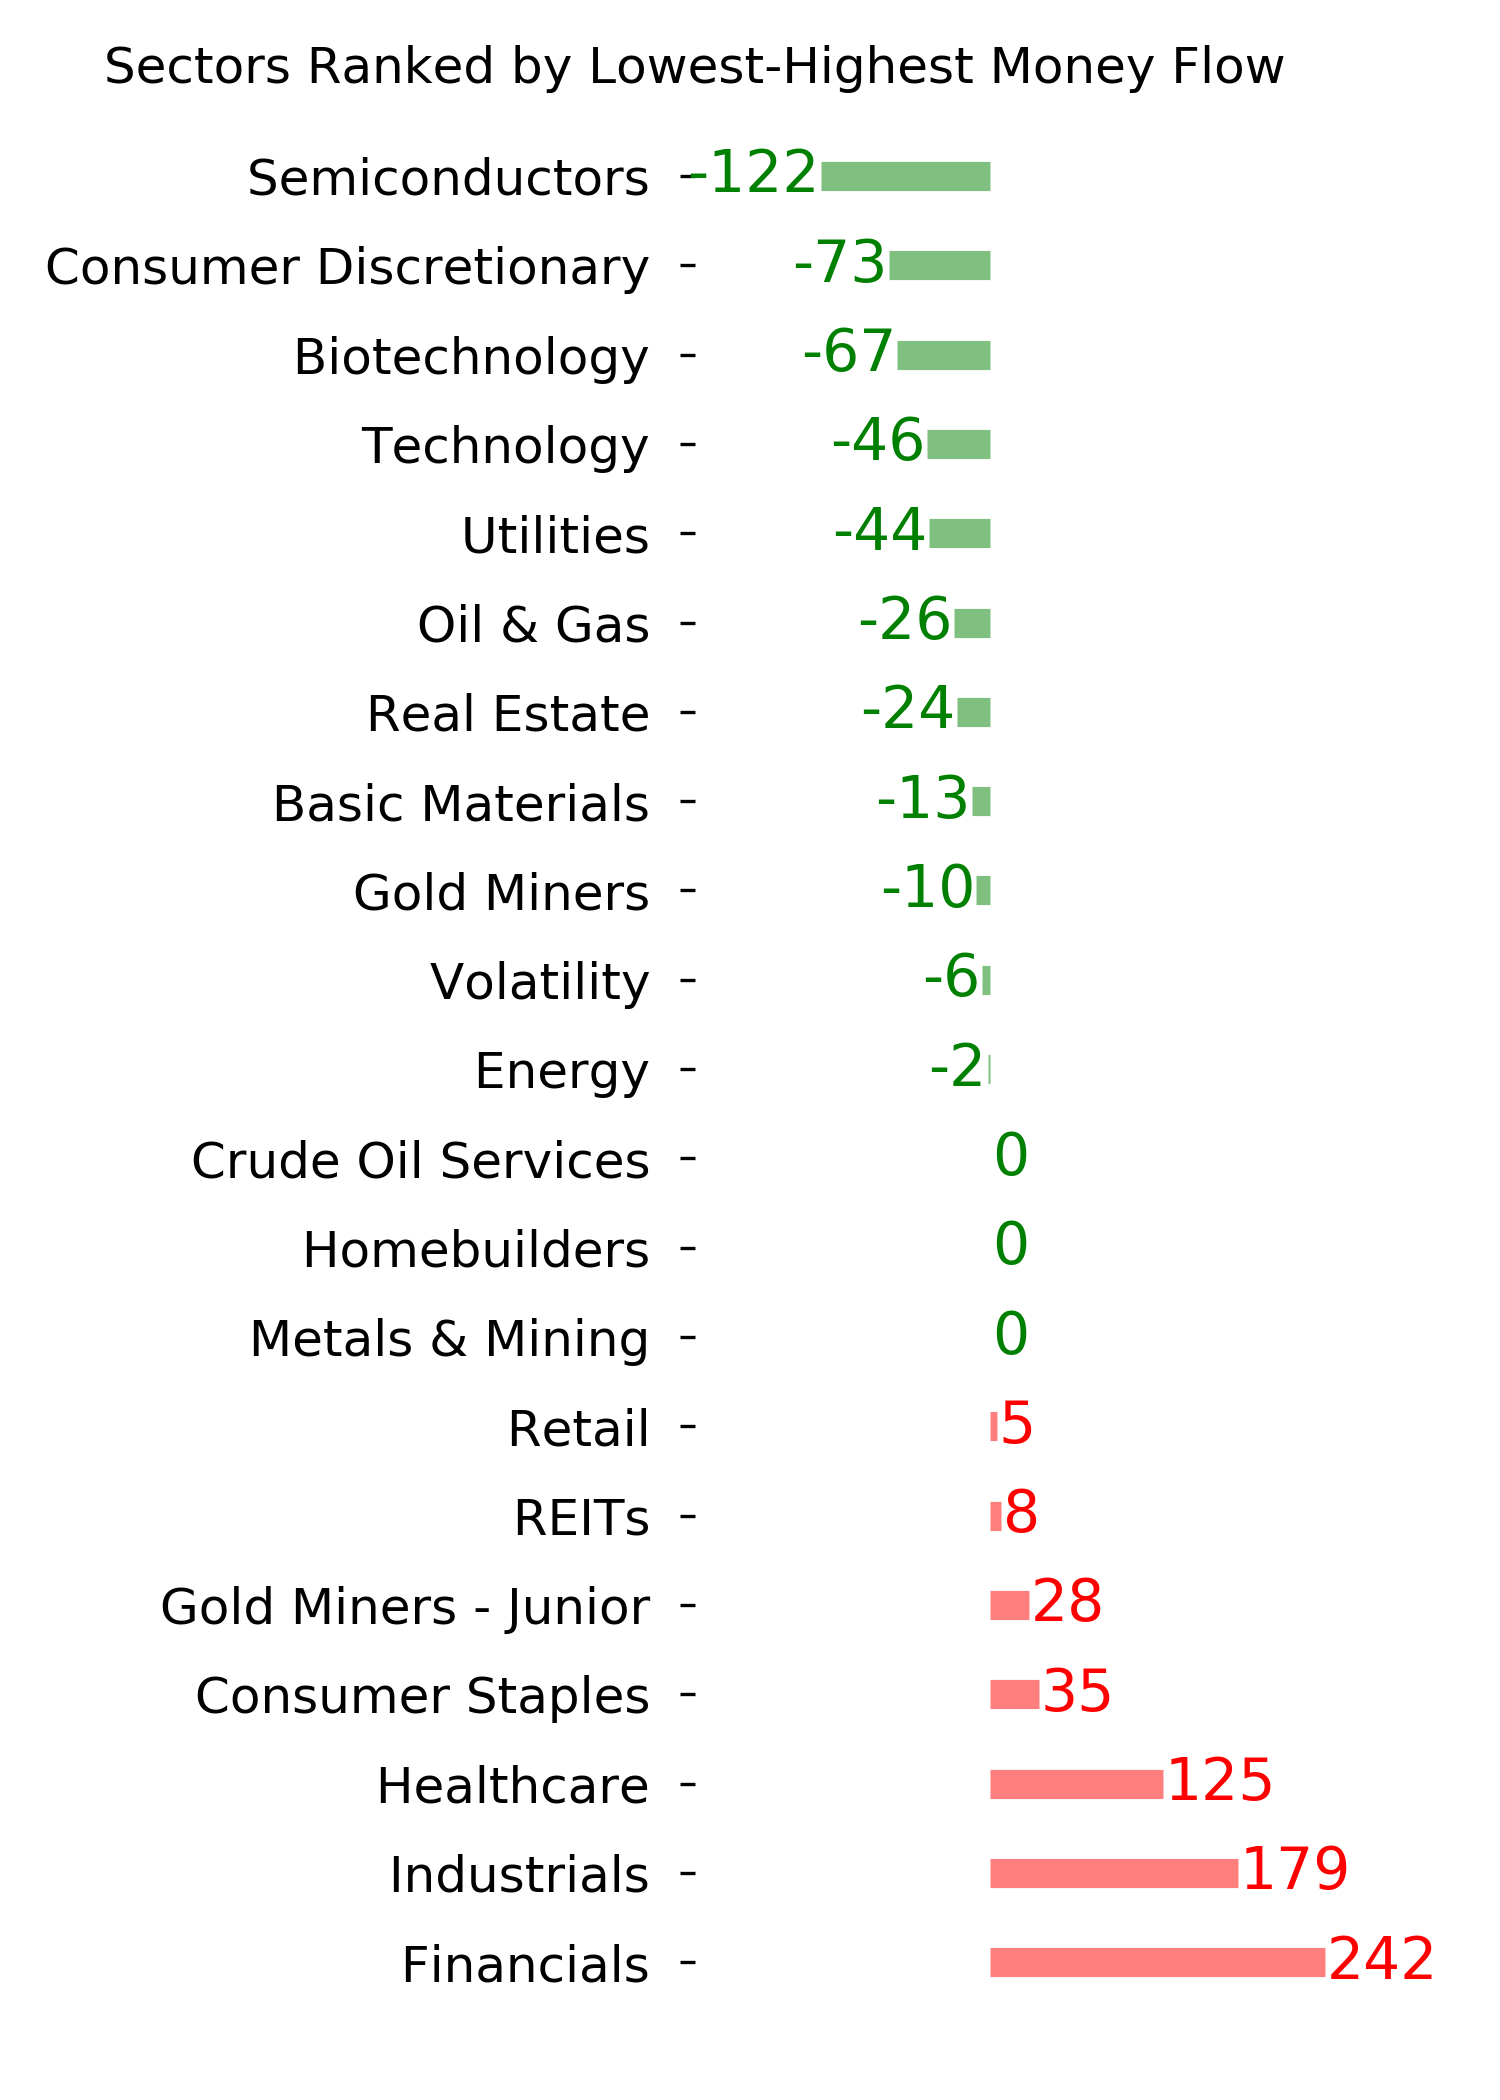
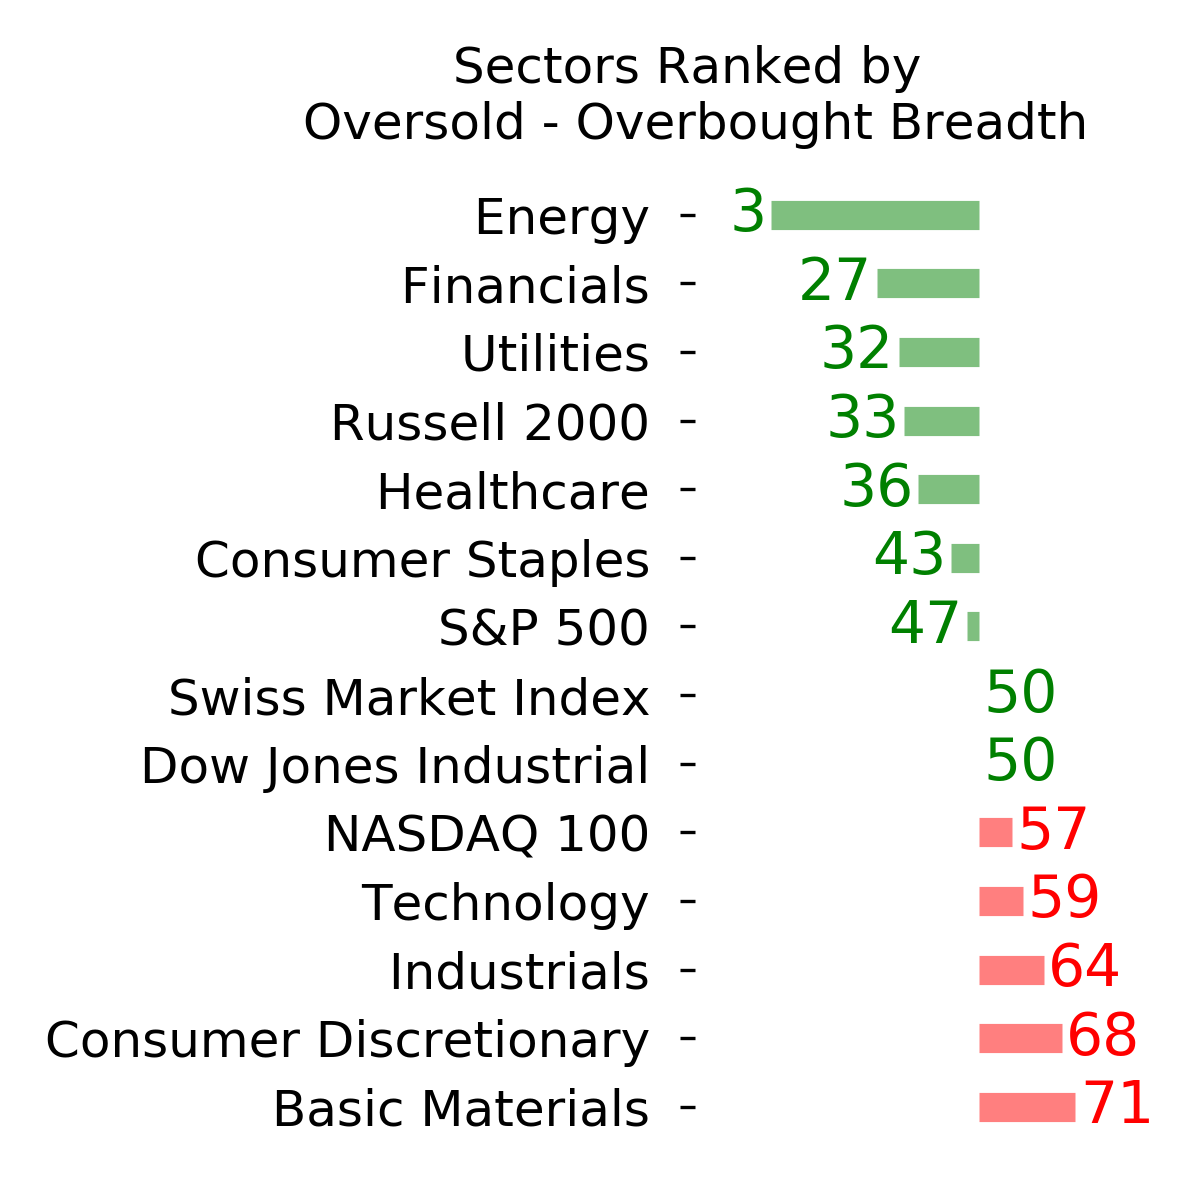
Ranks
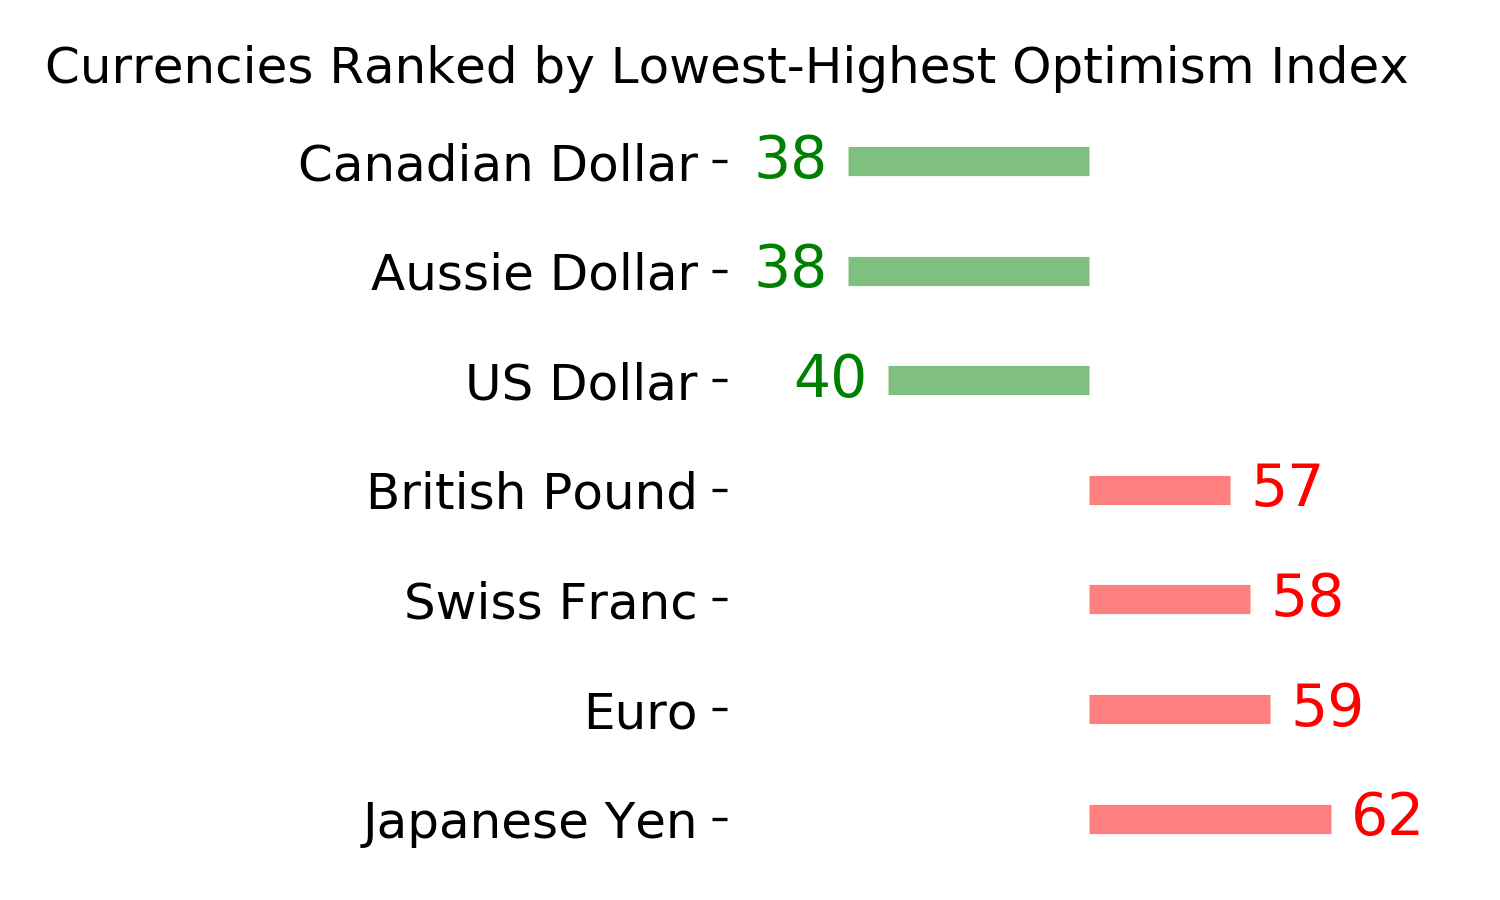
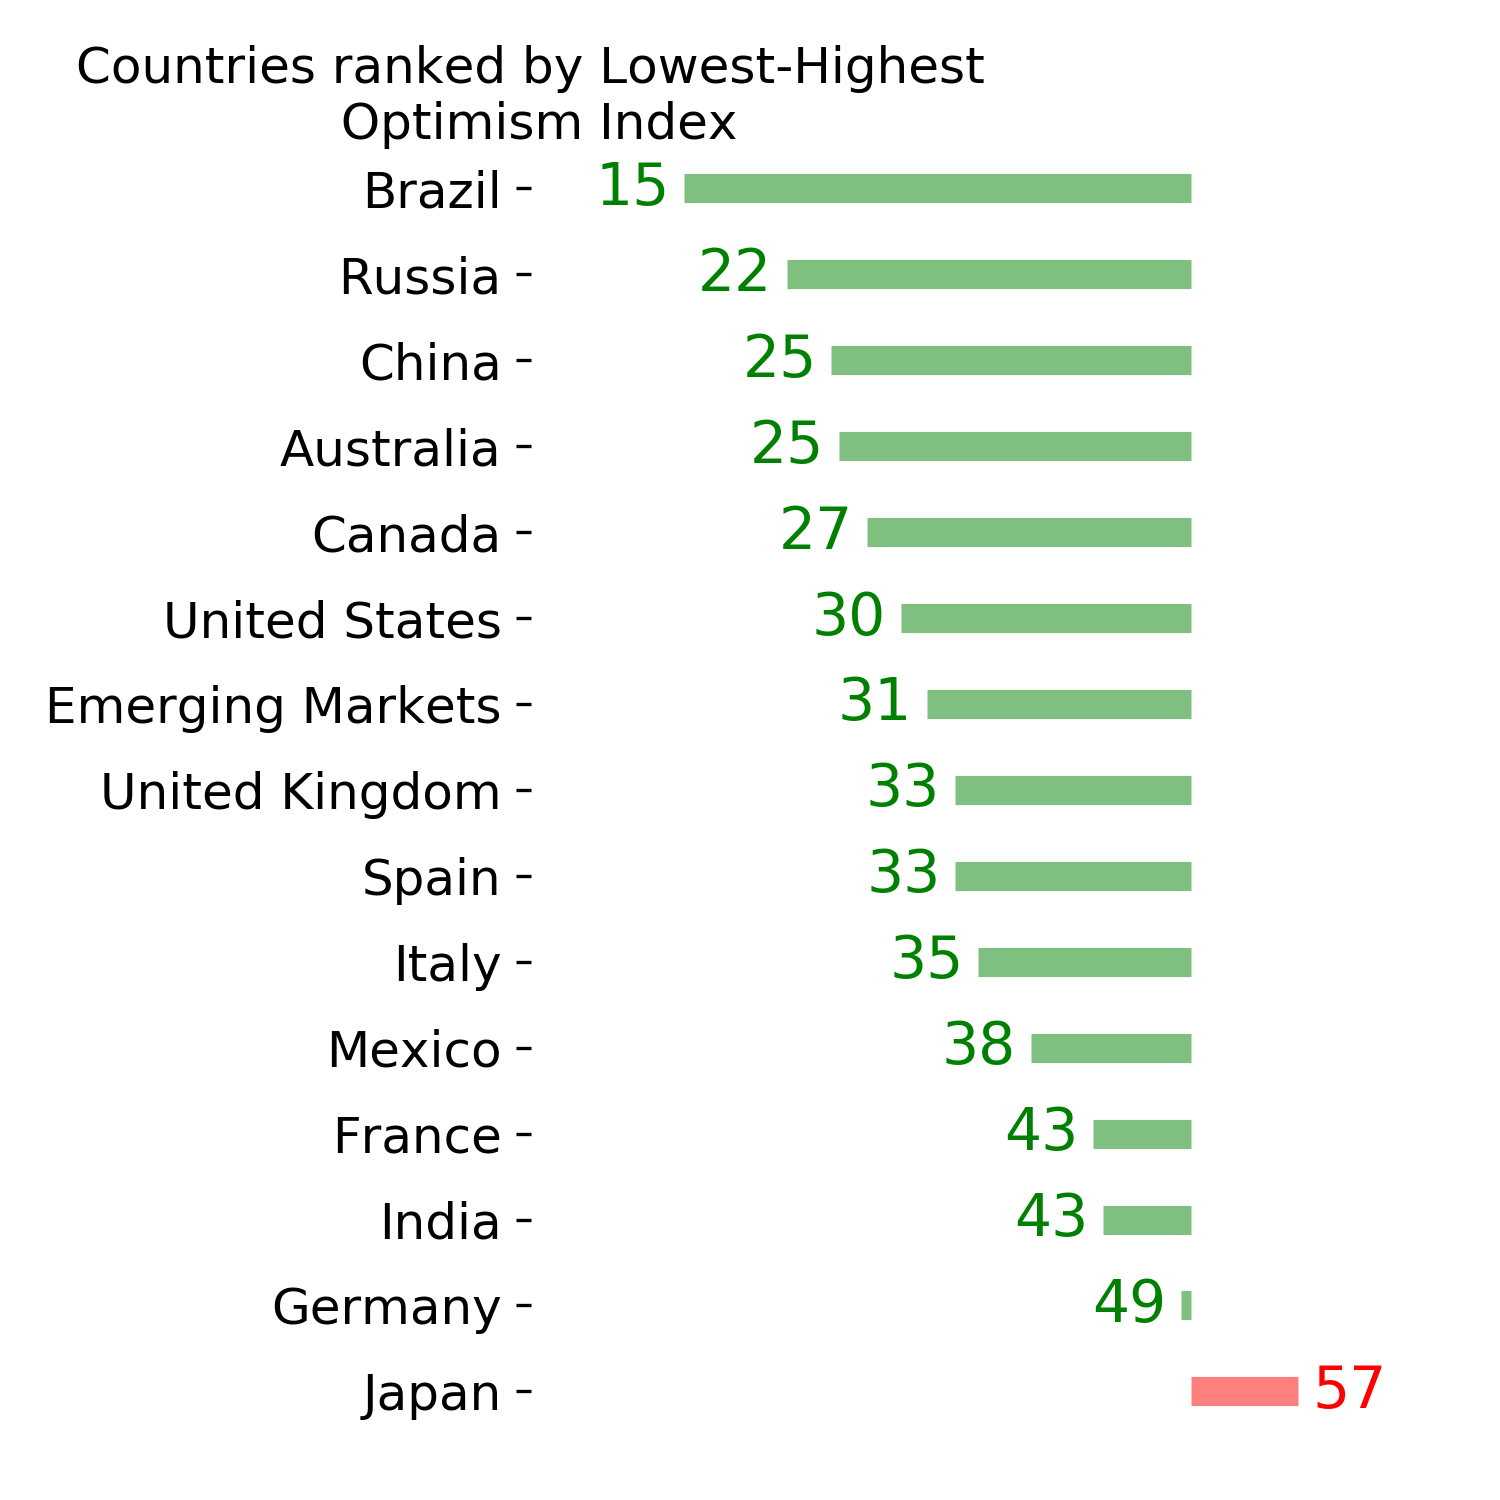
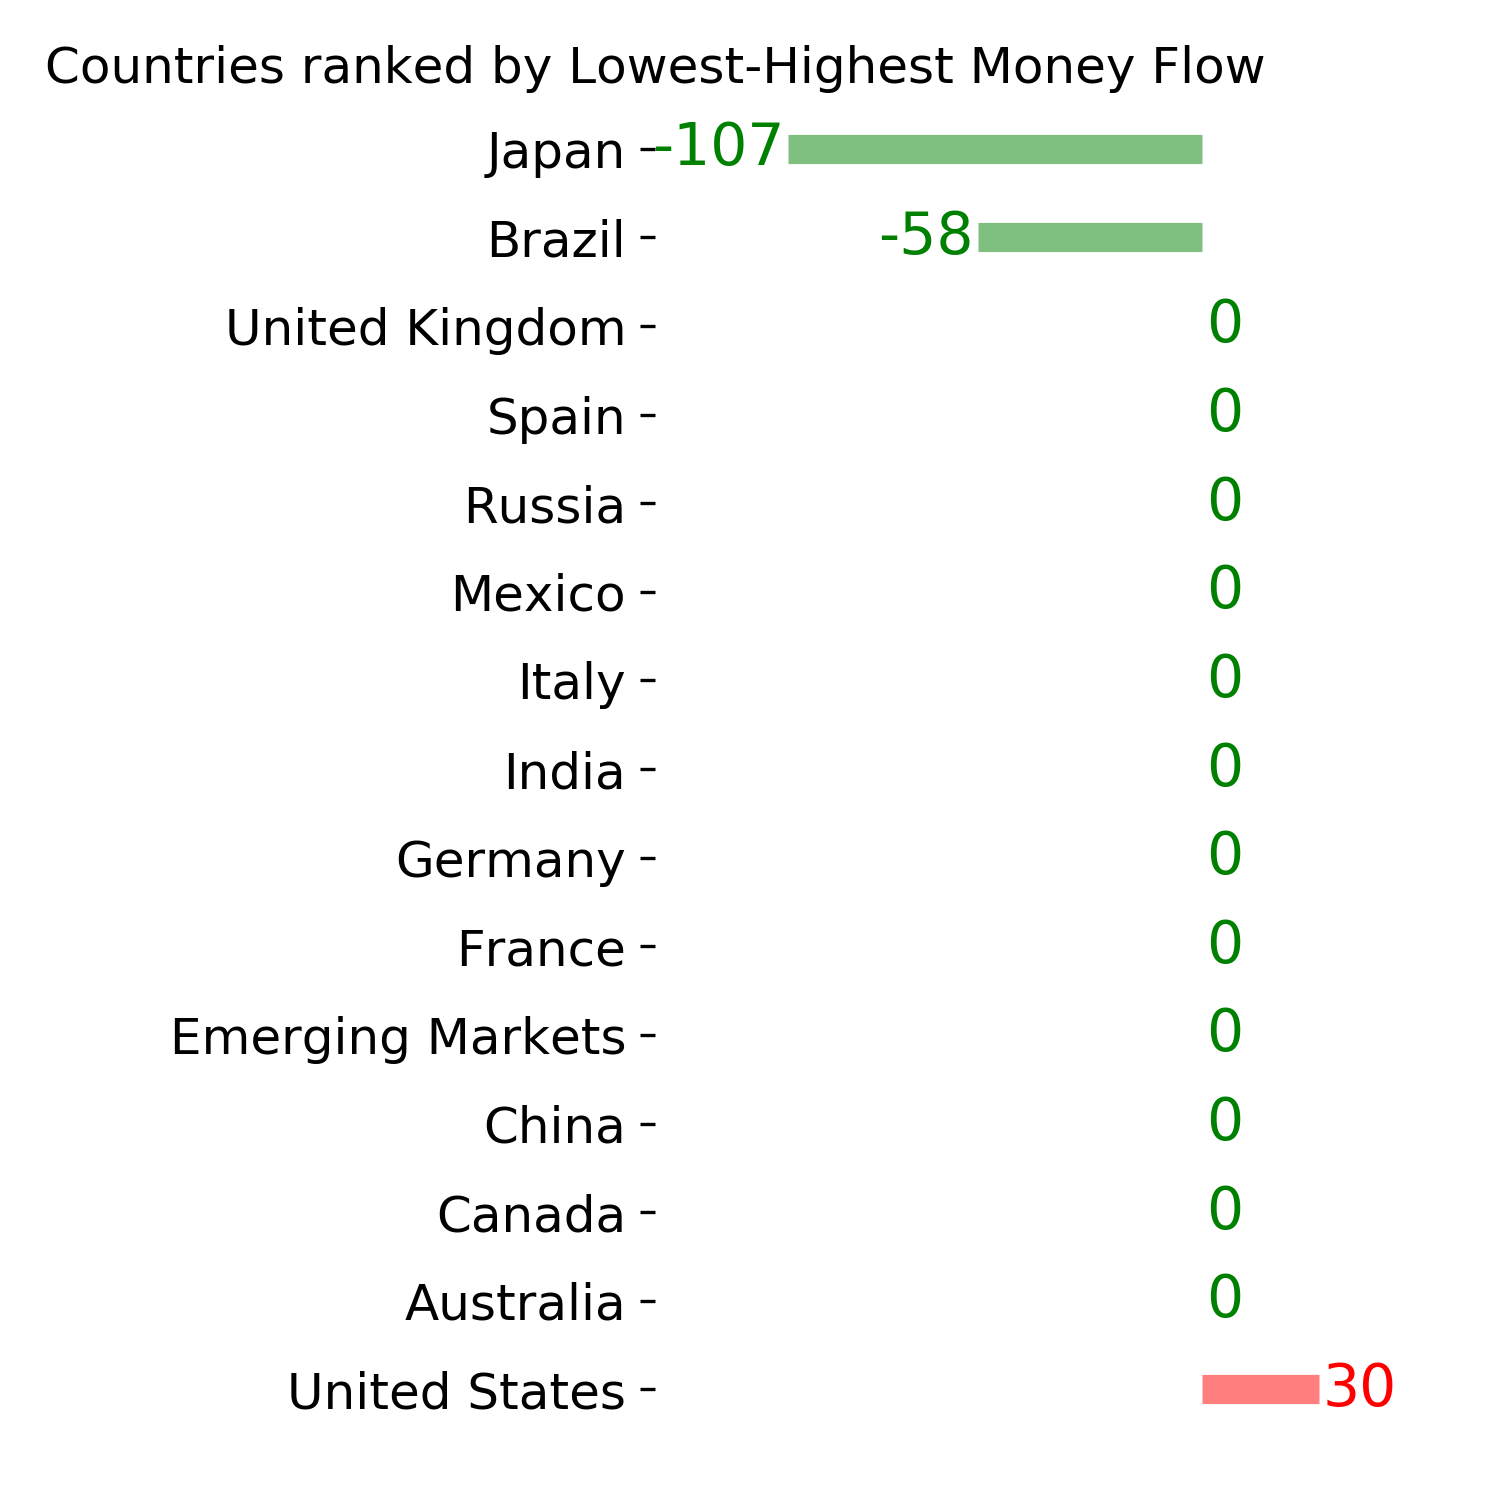
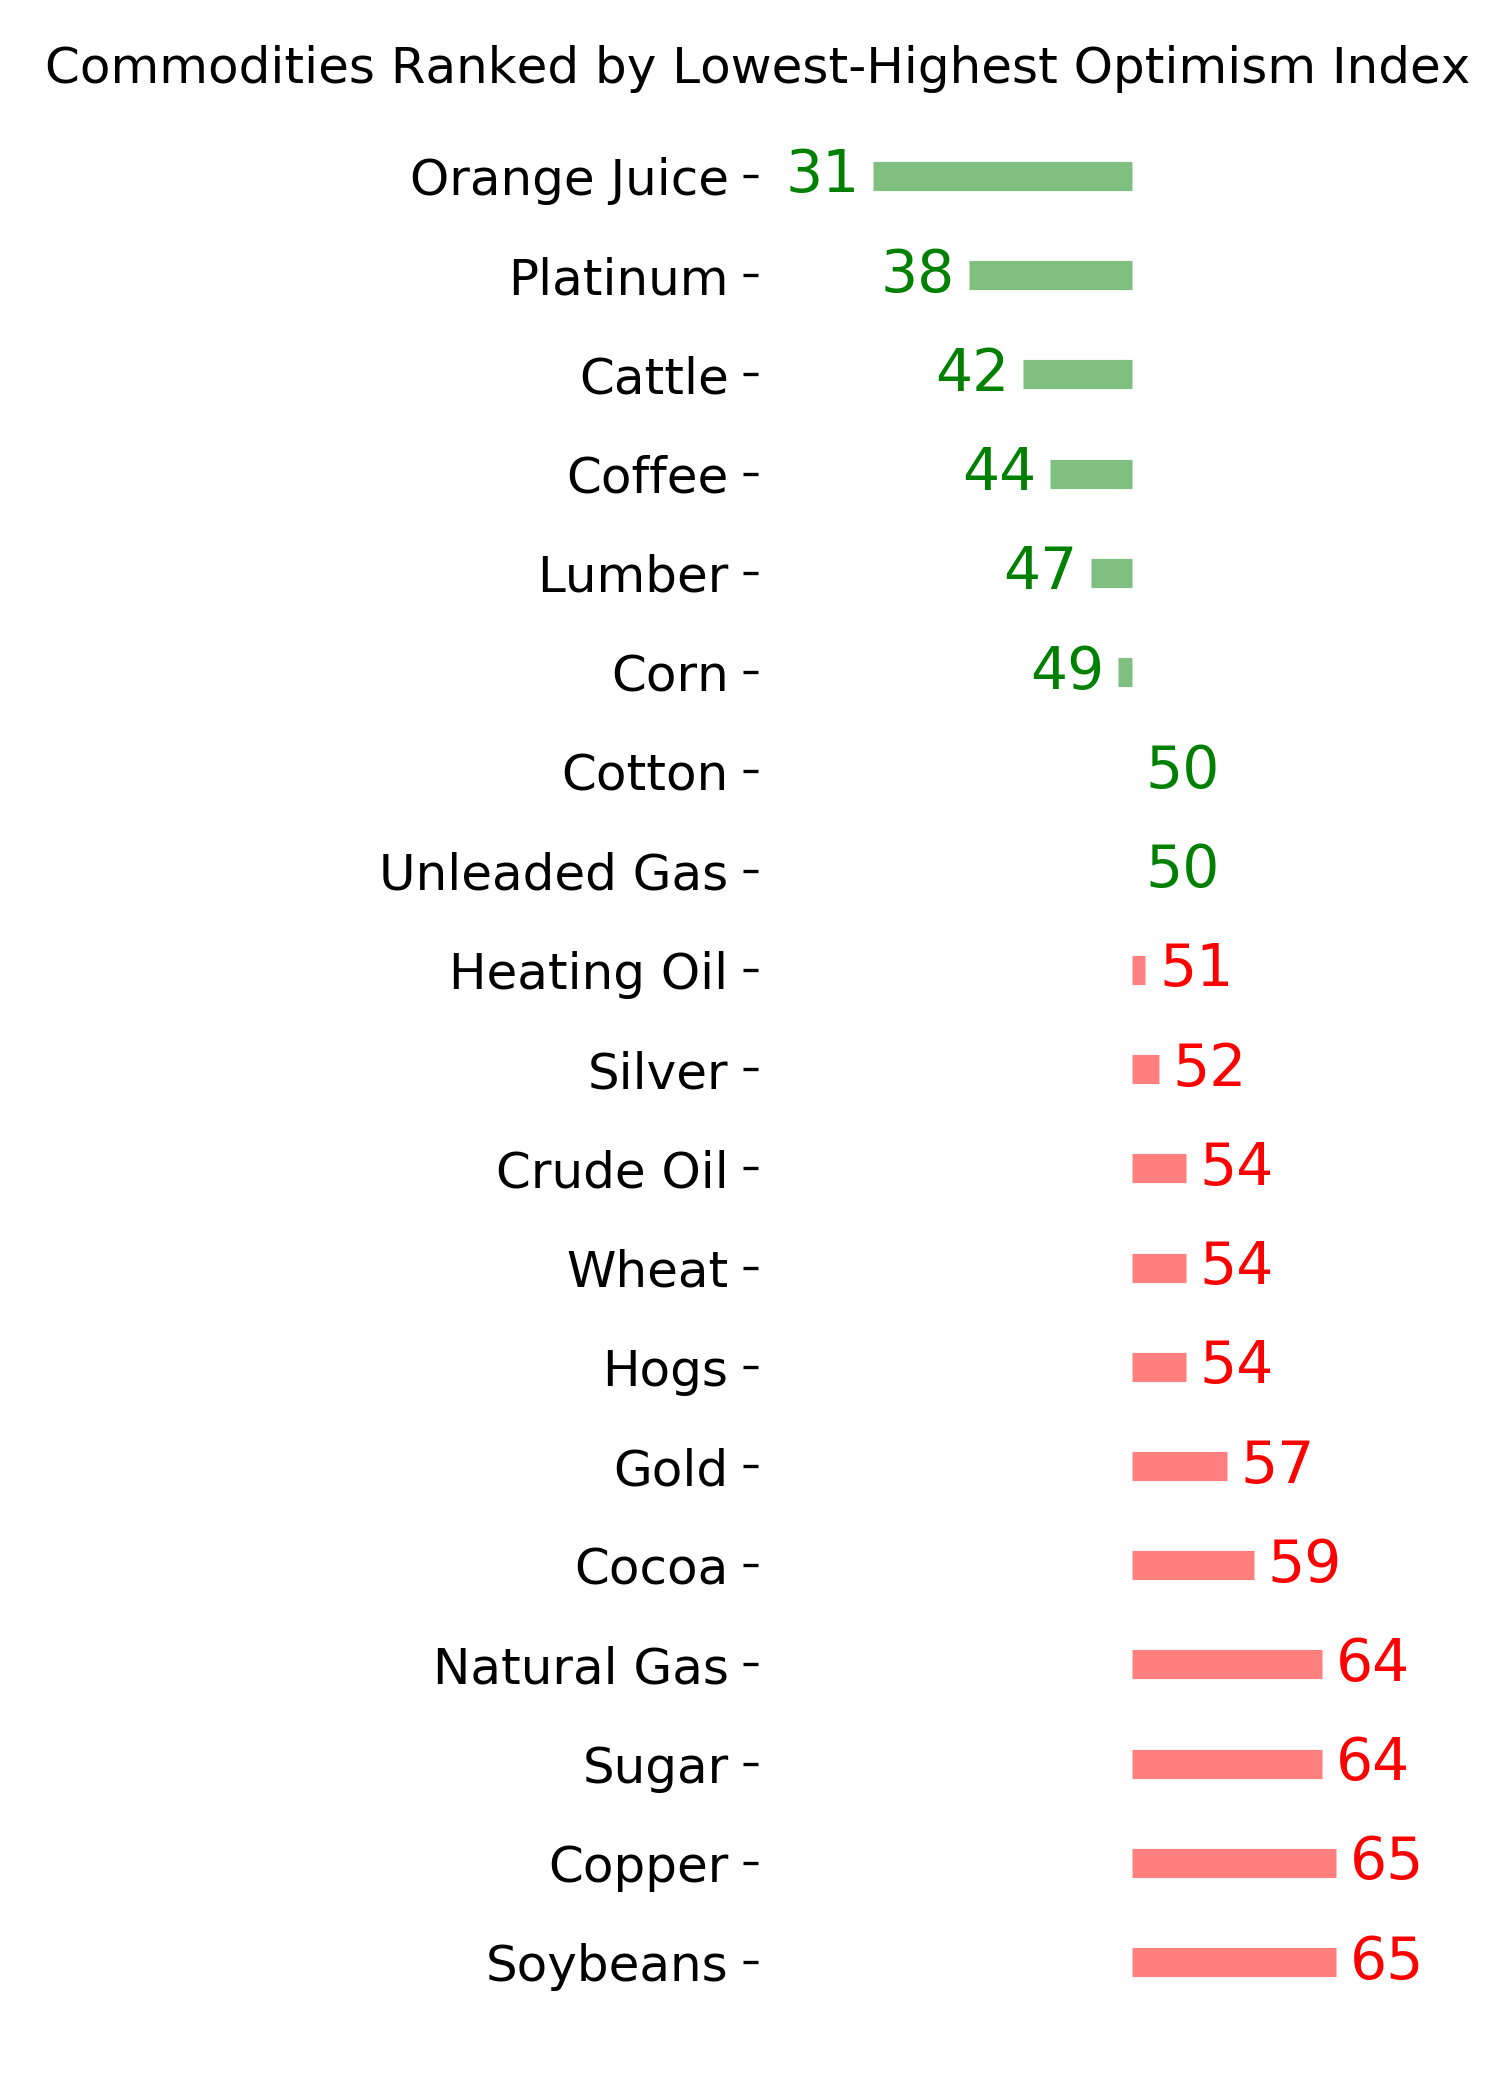
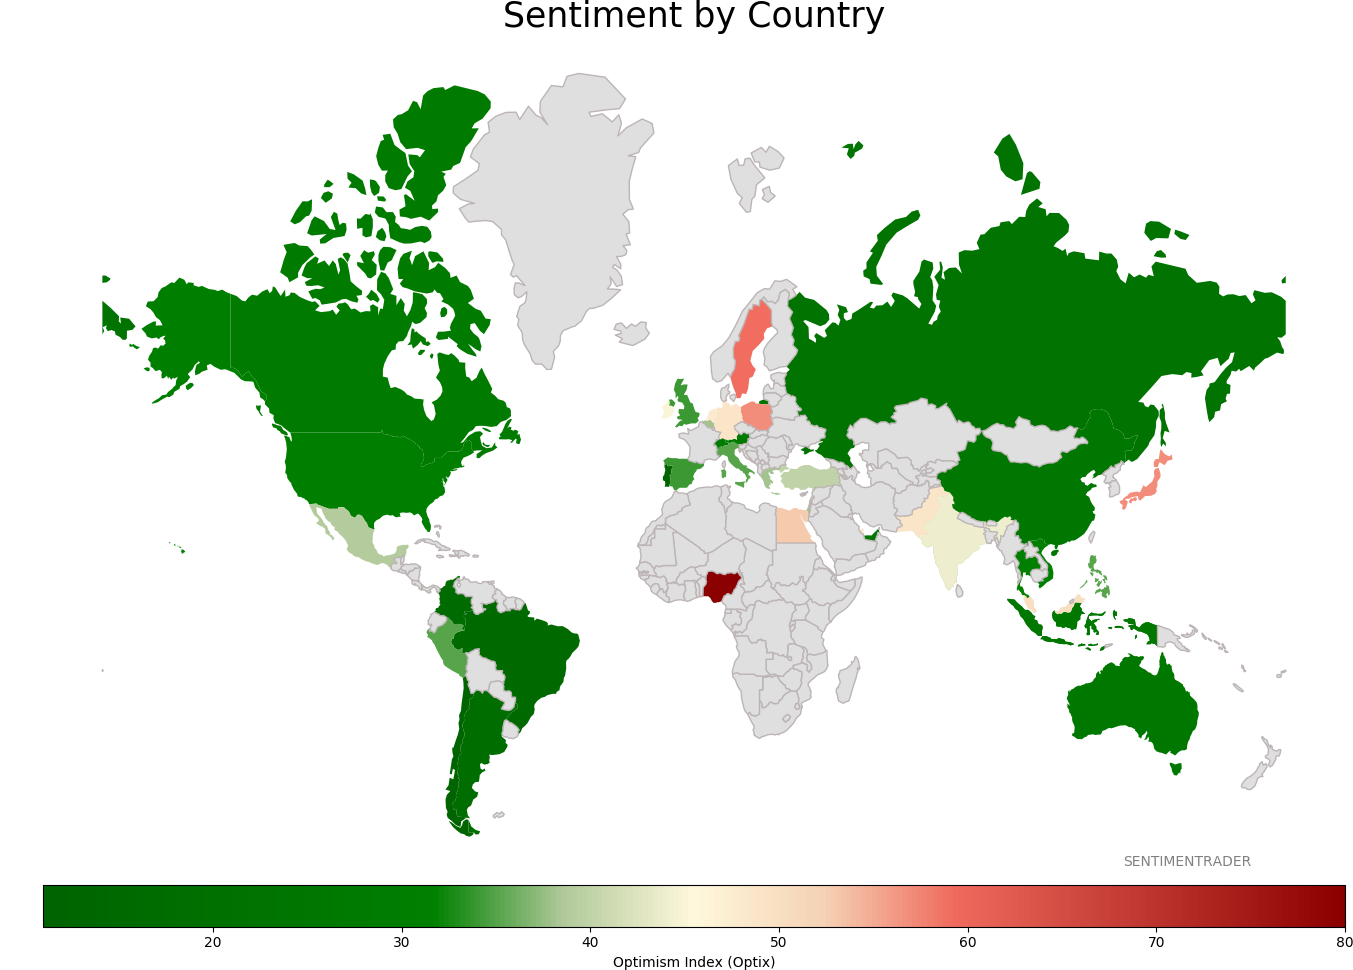
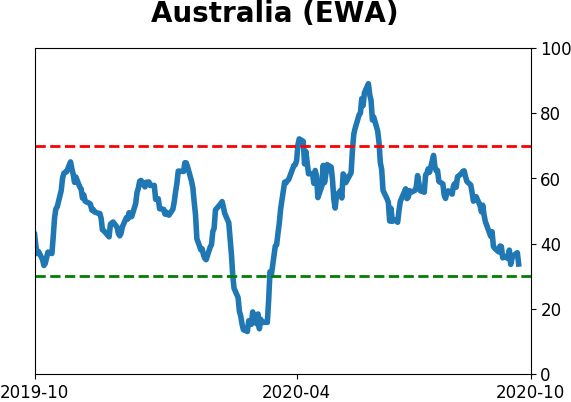
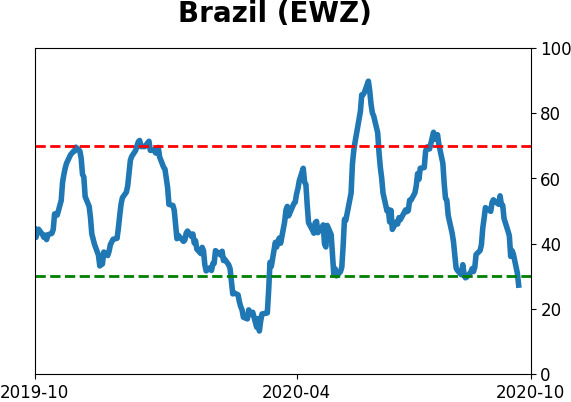
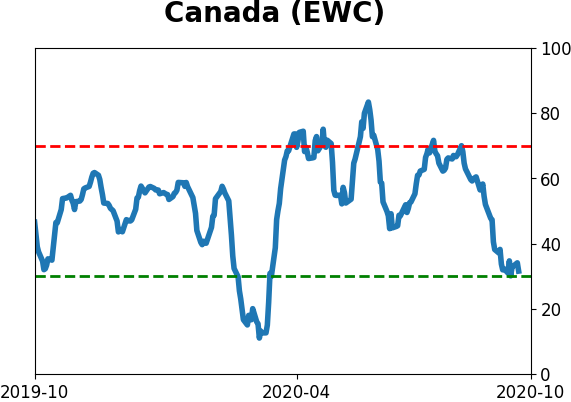
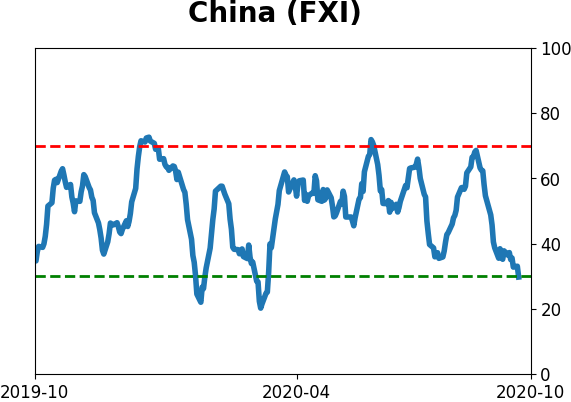
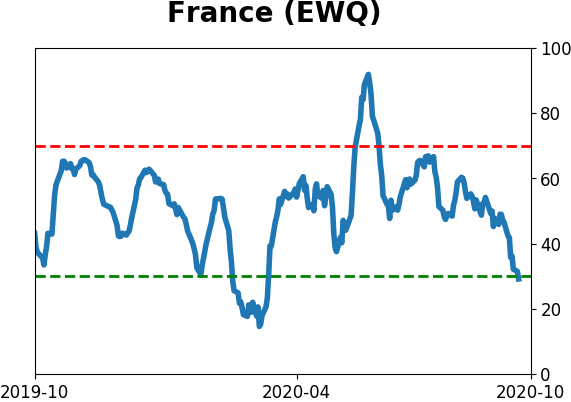
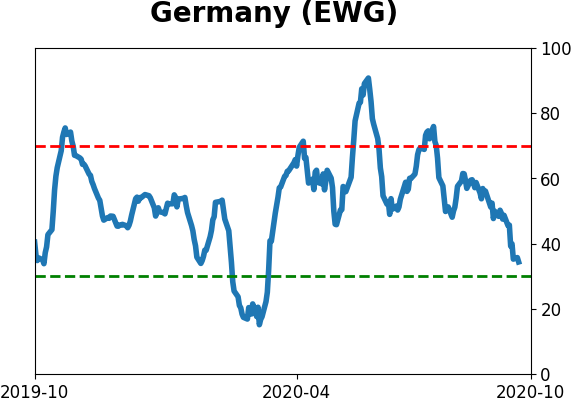
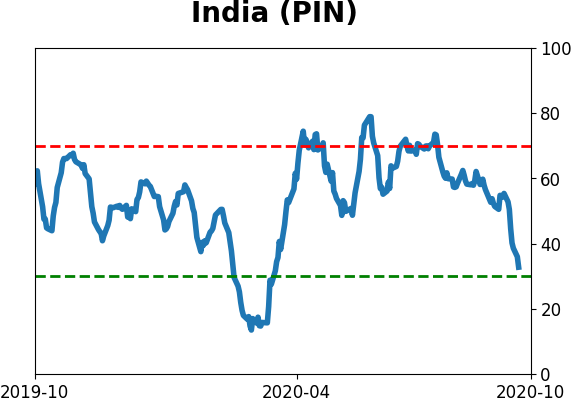
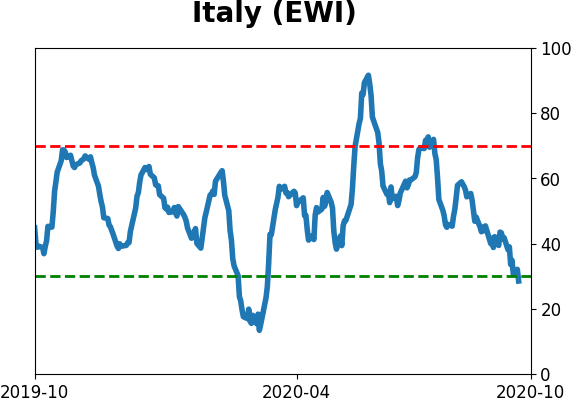
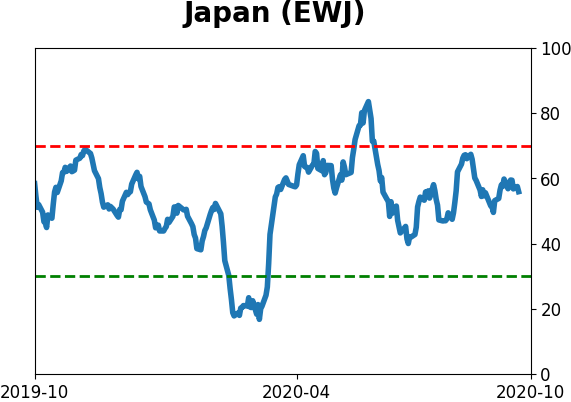
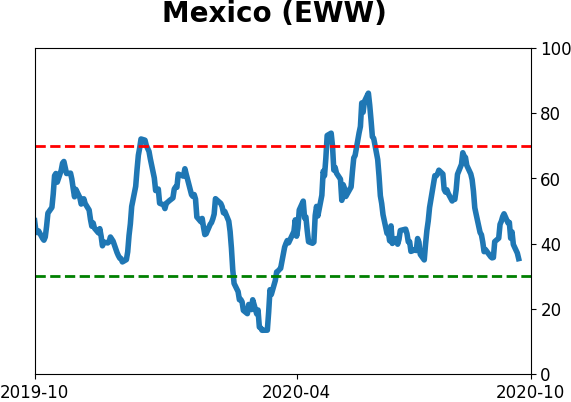
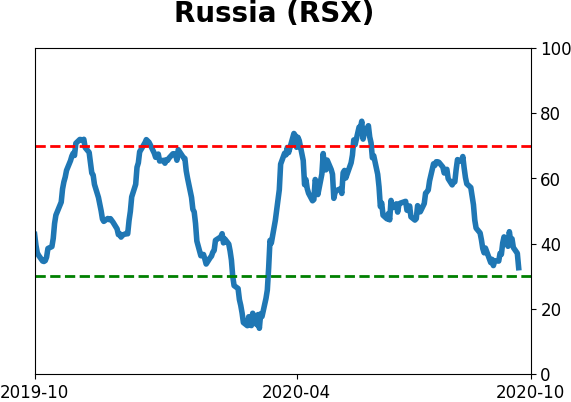
Sentiment Around The World
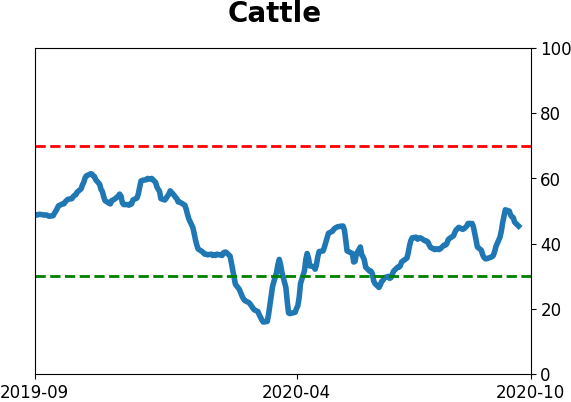
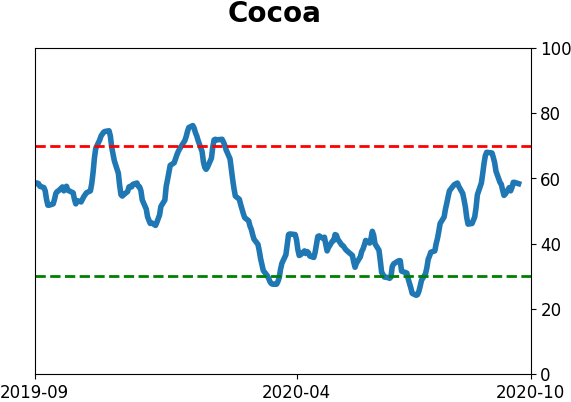
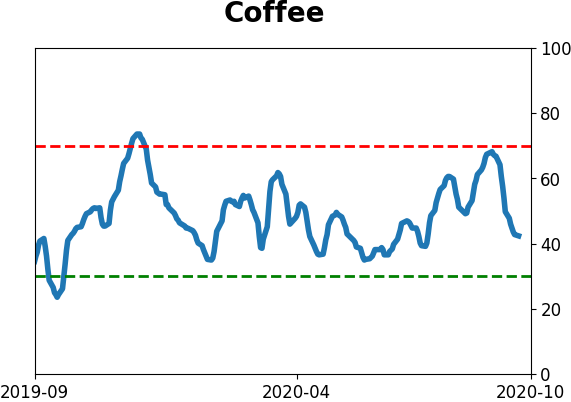
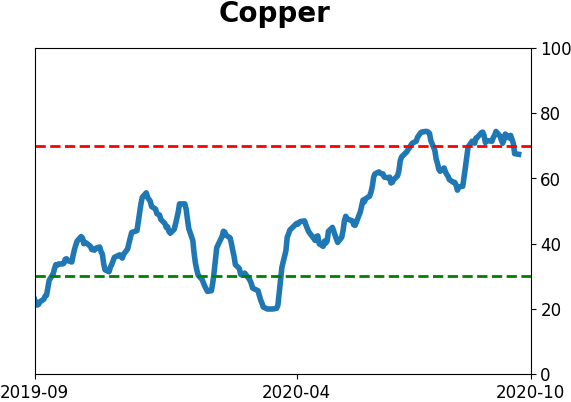
Optimism Index Thumbnails
|
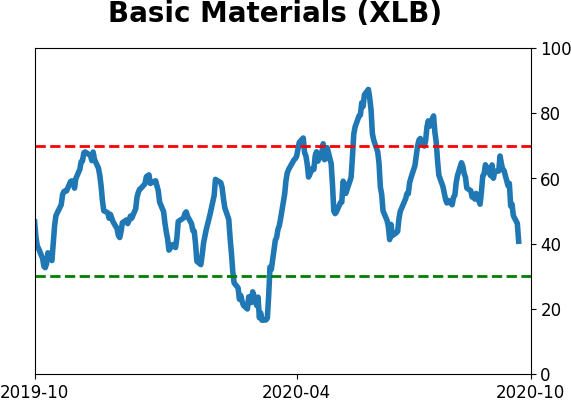
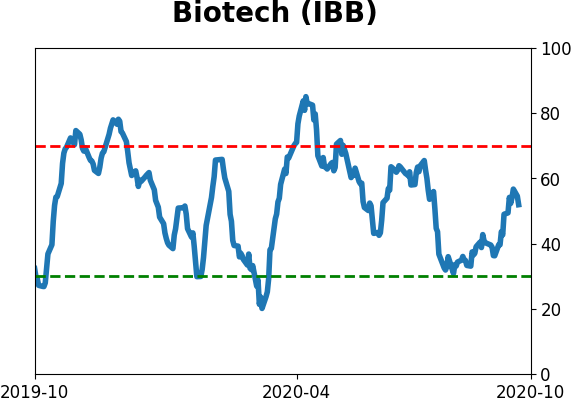
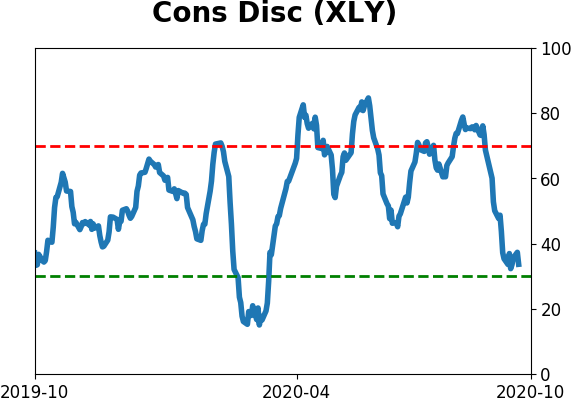
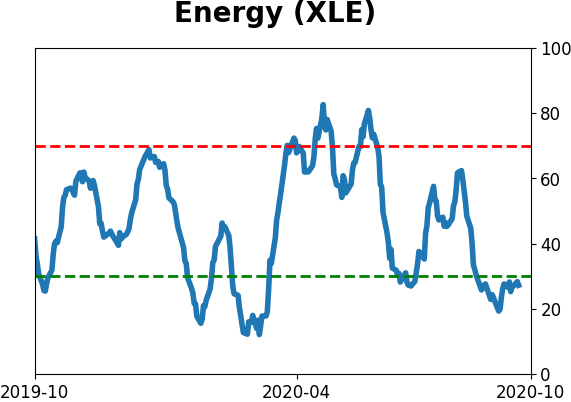
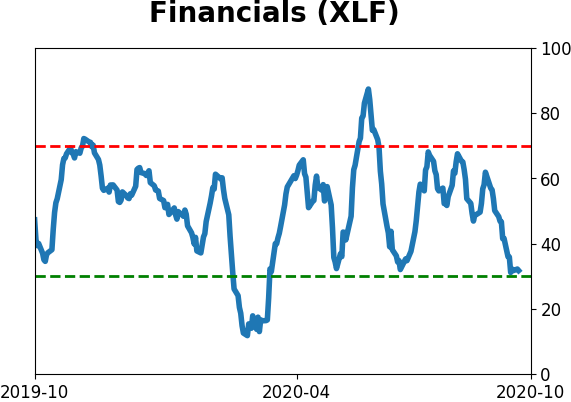
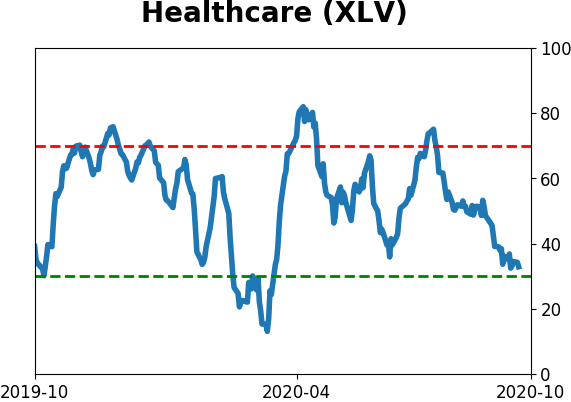
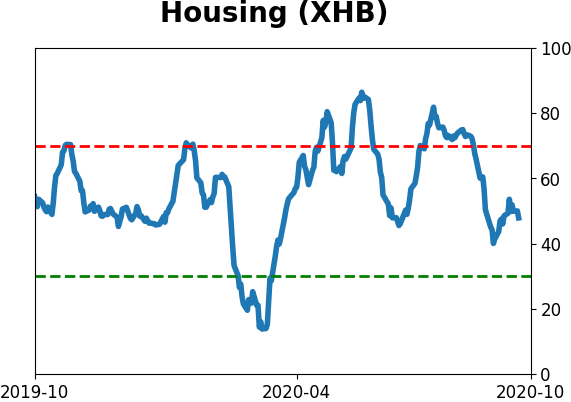
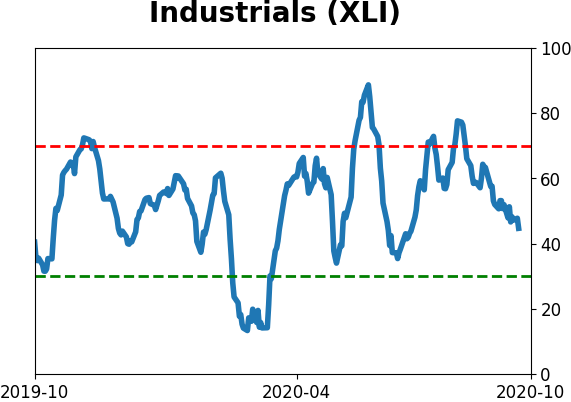
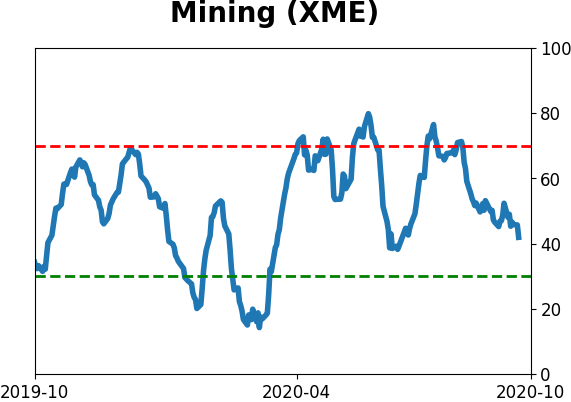
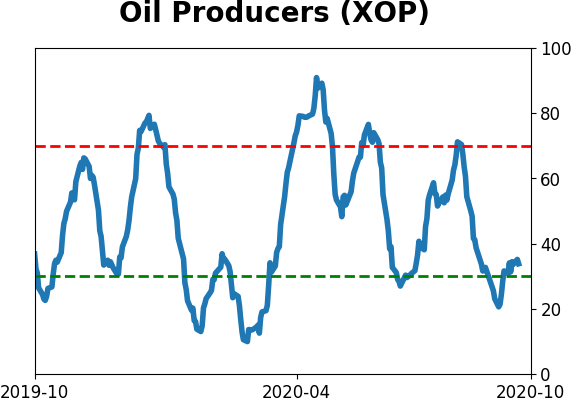
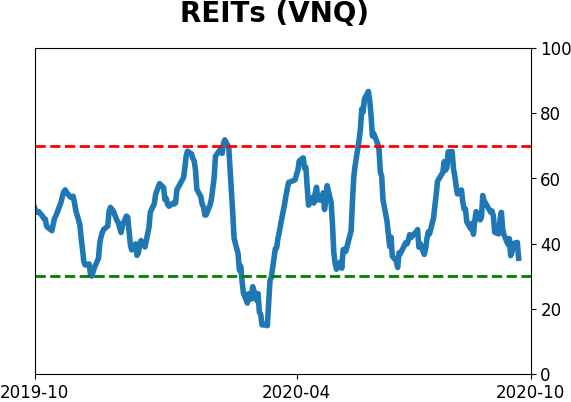
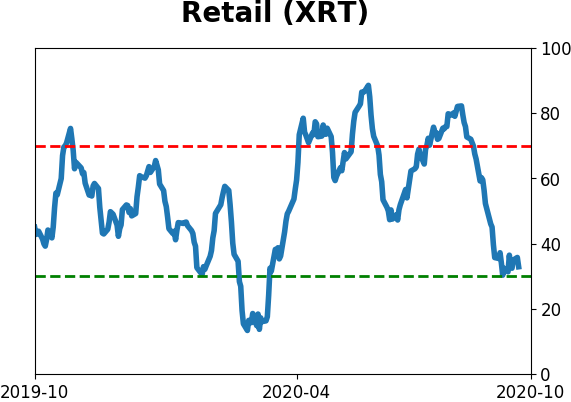
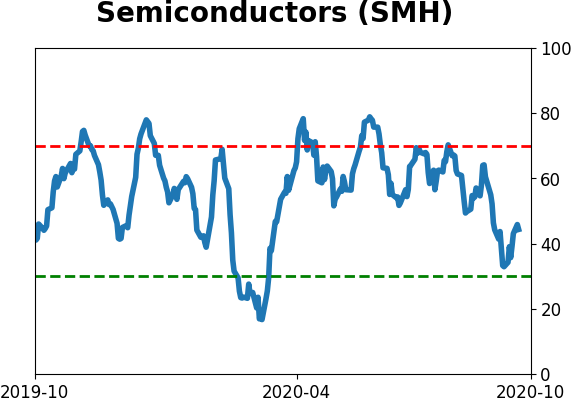
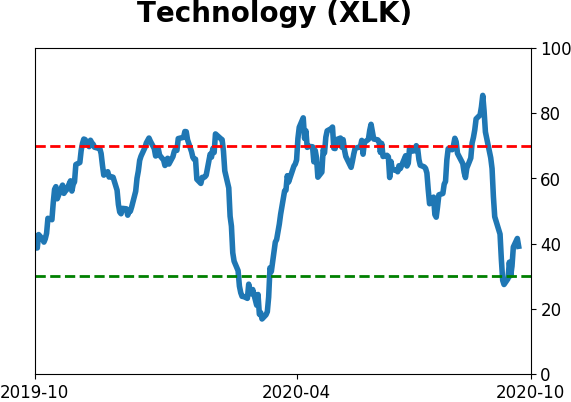
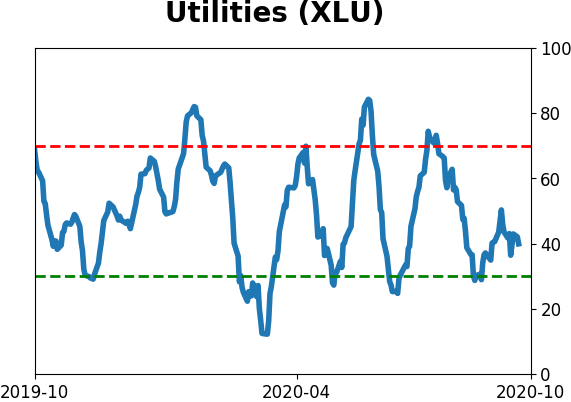
Sector ETF's - 10-Day Moving Average
|
|
|
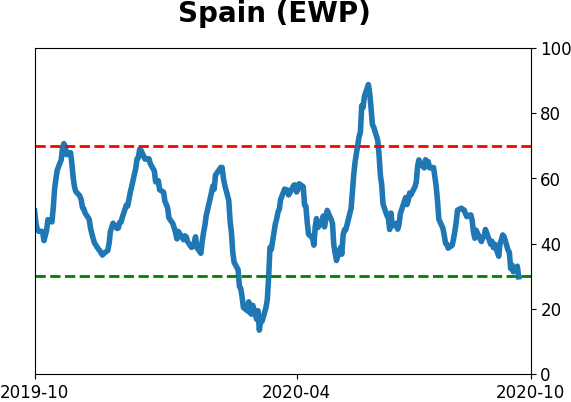
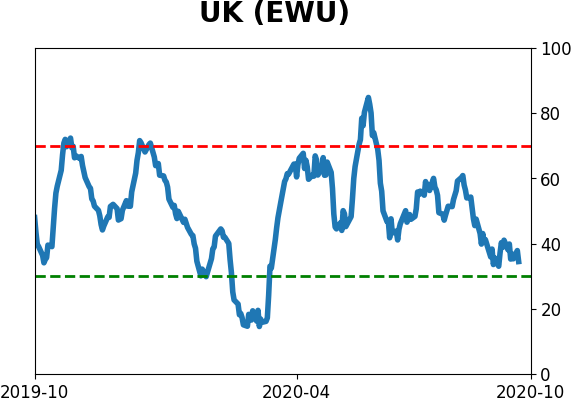
Country ETF's - 10-Day Moving Average
|
|
|
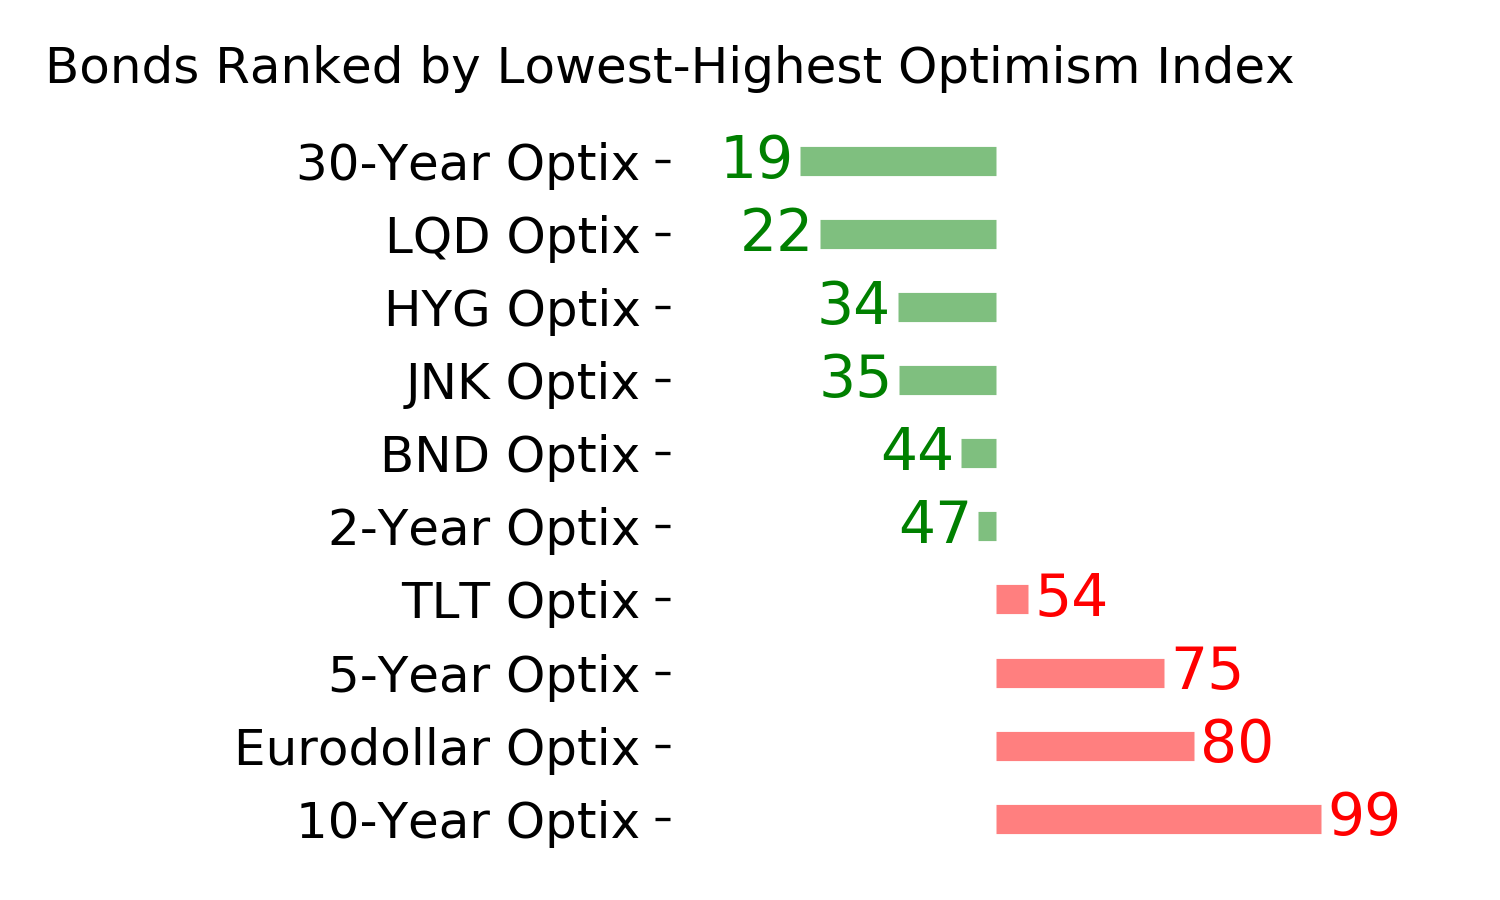
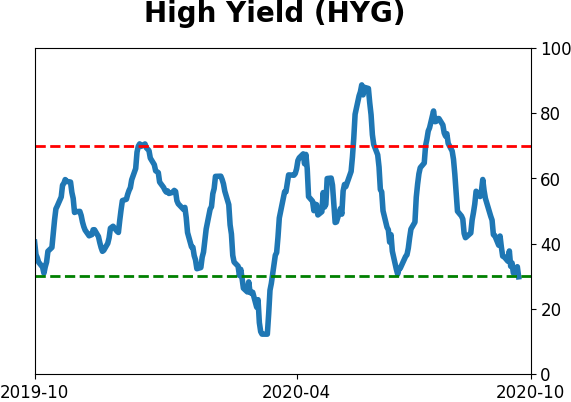
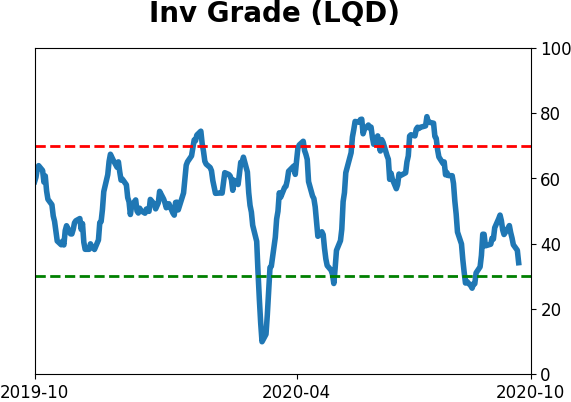
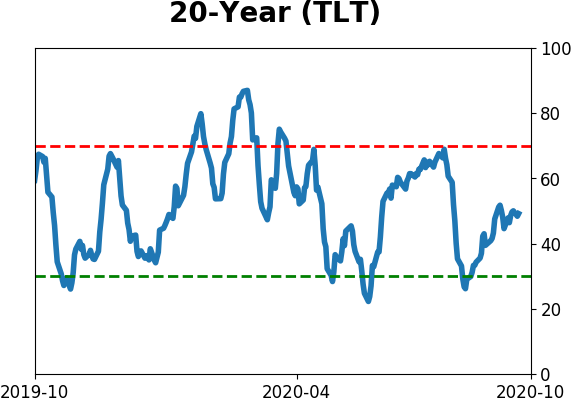
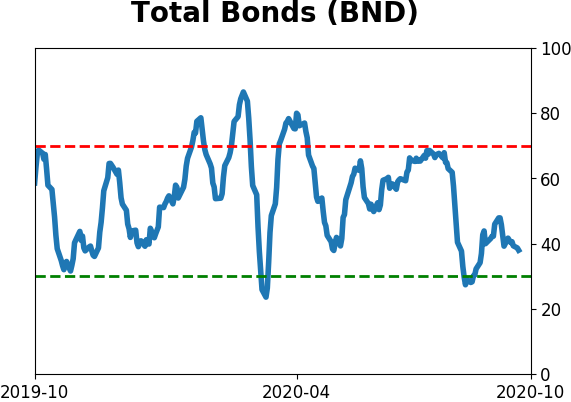
Bond ETF's - 10-Day Moving Average
|
|
|
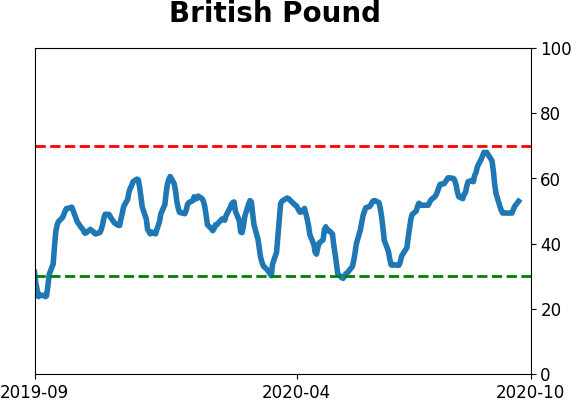
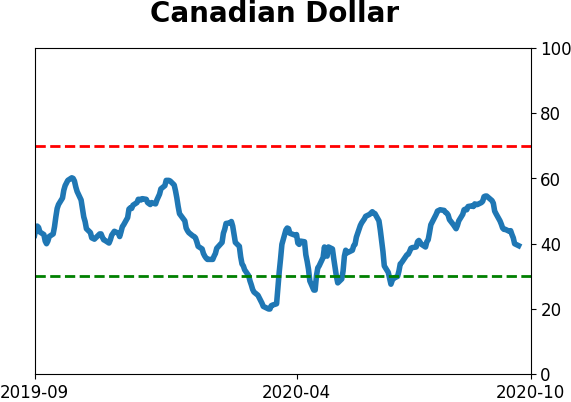
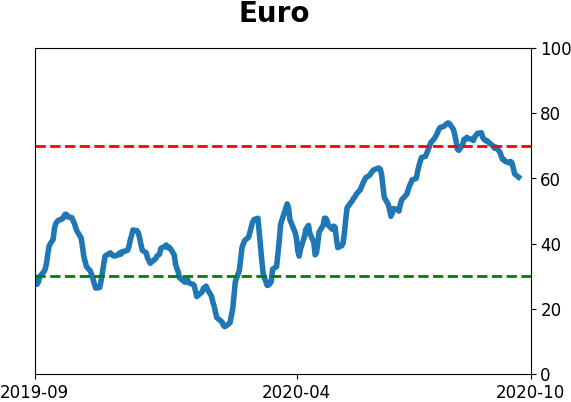
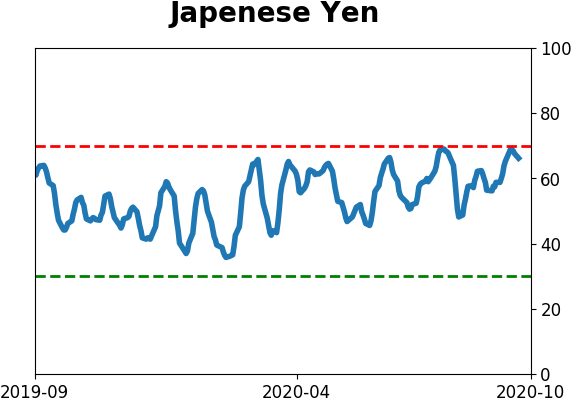
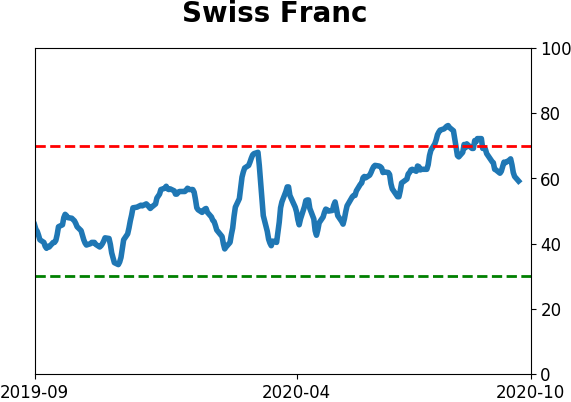
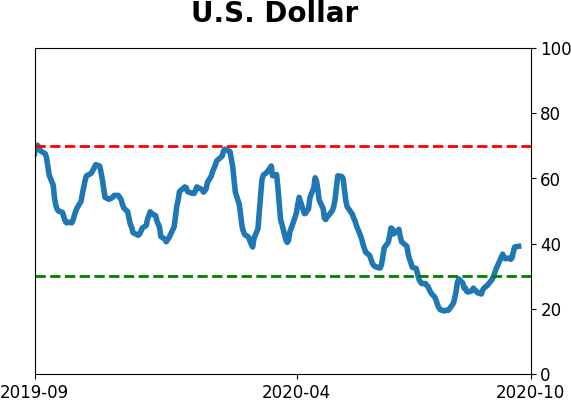
Currency ETF's - 5-Day Moving Average
|
|
|
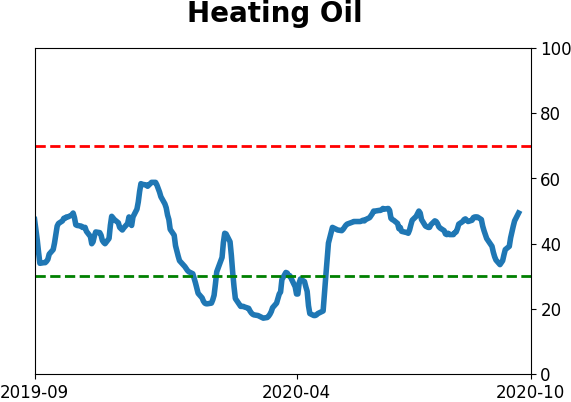
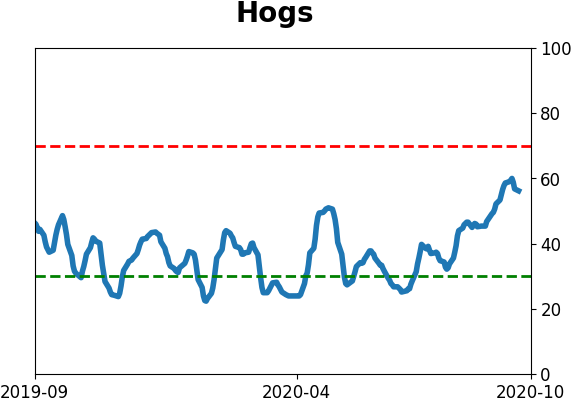
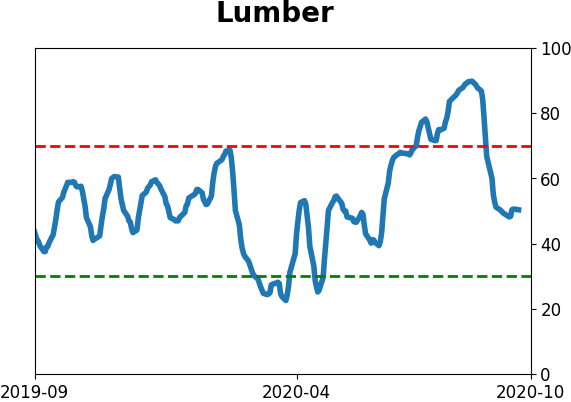
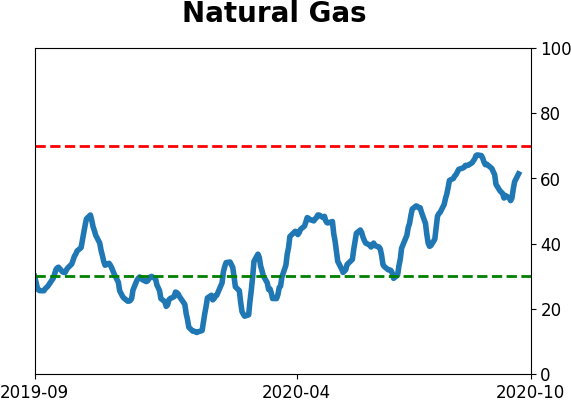
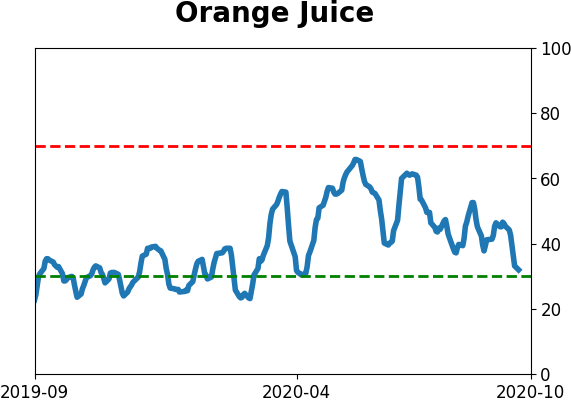
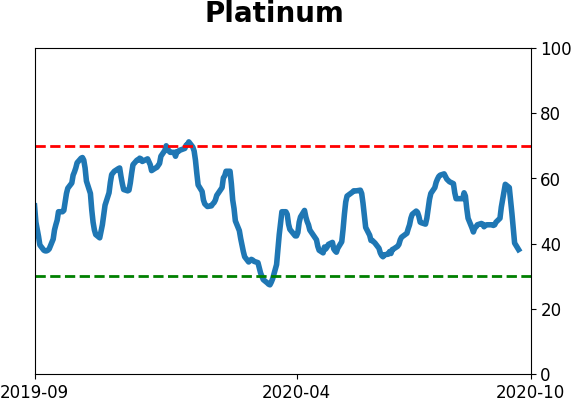
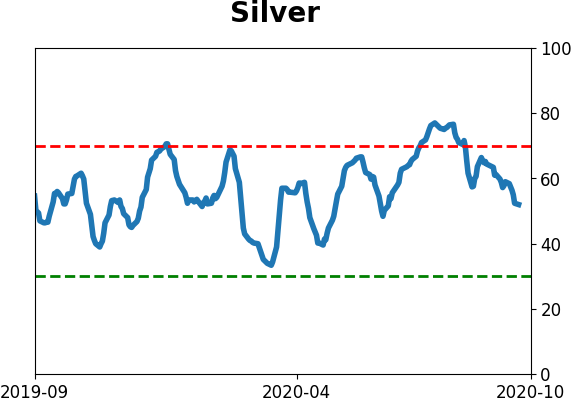
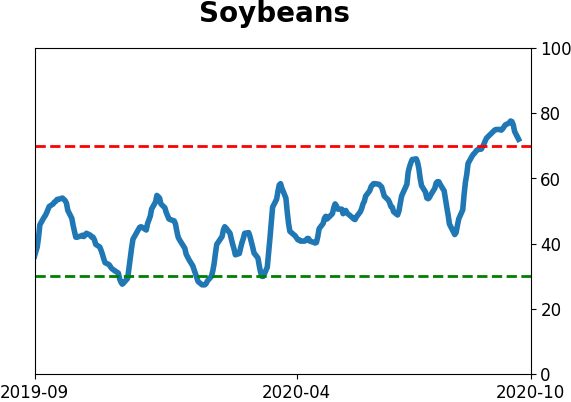
Commodity ETF's - 5-Day Moving Average
|
|